Article

Renewable Energy Decision Criteria on Green Consumer Values Comparing Poland and India Aligned with Environment Policy for Sustainable Development

by
Uma Shankar Singh
1,
Małgorzata Rutkowska
2,* and
Paweł Bartoszczuk
3,*
1
Institute of Management, University of Szczecin, 71-004 Szczecin, Poland
2
Faculty of Management, Wroclaw University of Science and Technology, 50-370 Wroclaw, Poland
3
Collegium of Business Administration, SGH Warsaw School of Economics, 02-554 Warsaw, Poland
*
Authors to whom correspondence should be addressed.
Energies 2022, 15(14), 5046; https://doi.org/10.3390/en15145046
Submission received: 22 June 2022 / Revised: 6 July 2022 / Accepted: 6 July 2022 / Published: 11 July 2022
(This article belongs to the Special Issue Energy Market Participants - Economic and Legal Aspects)

Abstract

:
Renewable energy consumption is the call by United Nation Sustainable Development Goals, and sustainable consumption is the only solution for the future. This study found that the solution to the framed problem has a requirement to categorize the green consumer value parameters in hierarchy of importance for five specific RESs and their alignment with environment policy based on a comparison of Poland and India. The study revealed the importance of each criterion for renewable energy sources providing, a comparative table of Poland and India. The methodological approach used secondary data for selecting countries, and primary data are used for statistical analysis of Automatic Linear Modelling. The research concludes that the CRITERIA4 is one of the most important that emerged with all five RESs for Poland and three RESs for India. Both countries are aligned with the UN sustainable development goals and are switching over to all means of sustainability. Poland scores a higher value of importance compared to India, which justifies the awareness of consumers.

1. Introduction

Since the existence of life, energy has been the most important requirement for the survival and continuation of life. Science says that energy can neither be created nor be destroyed, but only its forms can be changed. Early life was dependent upon natural energy sources such as solar, water, and wind for all their energy needs [1]. With the changing time and the development of human life, fossil fuels were explored. The developing human life kept exploring different sources and means of energy generation. The 21st century is witnessing many transformations across industries. Energy demand for fuel is increasing, and to keep up the production, maintain quality, and satisfy consumers, it needs to be produced on a sustainable philosophy [2]. However, philosophical changes alone are not enough; only real implementations can bring a difference.
The energy sector is also in transition from nonrenewable to renewable energy sources (RESs). One way is that we are increasing our dependency on energy requirements, and another way is looking for environmentally sustainable energy sources [3]. Now, more emphasis is on the concept related to renewable energy production and promoting green consumption. However, the concept of renewable energy consumption is not new, as the beginning of the human life was purely dependent upon RESs for fulfilling their requirements [4]. The changing time is the indicator of our dependence and continuous effort to find different ways for RES utility. Somehow, there are some successful milestones created, which is a motivator for continuation in the effort for growth with renewable energy sources at the industrial level, where there is mass consumption and major contribution to the energy consumption [1].
In reality, a complete switchover from nonrenewable energy sources to renewable energy sources is challenging because of several reasons. However, the push from the government to promote the RESs is contributing significantly to the green energy adoption. The global voice and steps offering benefits to aligning with world environment policies are also making a lucrative proposition for producers and consumers [5]. RESs are accepted because of continuous generation or the possibility to convert them back to nature. Fossil fuels are non-reversible and produce a higher level of pollution. Not only this, but the fossil fuels are nonrenewable and once they are gone, it will be difficult for the world to fulfill their energy requirements [6]. There is an urgent call for alternative solutions, where RESs are good substitutes and a sustainable step towards the energy sector.
An awareness towards the environment for the sustainable development is reaching implementation at various levels through channels with government promotions [7]. RESs are accepted on a global scale, with common consensus being the requirement for future generations. The current generation is more aware and equipped with technological advancements, which can reach the vision of sustainability [8]. The development in the implementation of green energy production and consumption is in the process of implementation, which requires speed in the implementation movement. Global awareness and activities aligned with the United Nation’s (UN) sustainable development goals [9] are also a supportive move to practical implementation of the green vision for a sustainable future, which is receiving considerate support from all nations around the globe.
The main sources of renewable energy are solar, wind, hydro, geothermal and biomass [10]. The main reason of promotion of these energy sources is comparatively lesser harm to the environment and they are reversible [5]. Though the industrial requirements of energy are difficult to meet with the RESs, the domestic demands can be served. There are different schemes implemented on industrial levels as well as to the individual consumers for energy generation. Though the current situation shows the increase in contribution in most countries, some are on a straight line, while some countries have lost their path and have shown a decreased production of renewable energy over the years [11]. The natural phenomena and changes in environmental condition cannot be ignored, which may be an uncontrollable reason for an increase or decrease in production (Figure 1).
The target to increase the production capacity has become more important in 2022, because of the crisis in Ukraine creating a situation of uncertainty for the energy sector [12]. The demand is increasing with the increasing population. Most countries are implementing self-reliant energy generation, where renewable energy generation can be a support engine [5]. The sustainability of the world needs everybody’s contribution with a determined approach based on their capacity being either on the production side or the consumption side [13]. The fact is that the destruction of the environment and the greed to reach success has lad life to be in danger. The sustainable development goals are in the process of being reached, where countries are actively participating to be successful [14]. The UN sustainable development goal 7 is ensuring access to affordable, reliable, sustainable and modern energy to each and every individual all around the world [9,15]. The share of renewable energy in the total final energy trend (Figure 1) year on year is showing a clear map [11], which can be a criteria to measure the requirement for structural changes to support the renewable energy production and consumption.
Consumer acceptance or rejection of any product or service is the determinant of the future of that specific offering [16]. It is very important to understand the consumer views on the green offerings. The consumption process is a complex situation where an individual thinks of other alternatives and compares offerings in various categories. Nevertheless, consumers of the 21st century are more aware and concerned about the environment and a sustainable future for coming generations [17]. However, the consumption decision for green energy offerings is not only the subject of awareness for sustainability, rather many other factors based on their consumption values [18]. Green consumer values are the shaped behavior of an individual based on their understanding about environmentally friendly offerings [19]. In the case of RES, the green consumer values are one of the deciding factors for consumers’ preference to choose a specific renewable energy based on their perception and preferences.
The green consumer values are driven by six parameters measuring an individual view on the consumption of energy from RESs [16,19]. The six parameters are: CRITERIA 1—It is important to me that the energy I use does not harm the environment; CRITERIA 2—I consider the potential environmental impact of my actions when making energy usage decisions; CRITERIA 3—My energy consumption habits are affected by my concern for our environment; CRITERIA 4—I am concerned about wasting the resources of our planet when I use energy; CRITERIA 5—I would describe myself as environmentally responsible using energy; CRITERIA 6—I am willing to be inconvenienced in order to accept energy that is more environmentally friendly. Mostly, these are the decision criteria for an individual for the selection of any specific RES for their energy consumption [16,19]. The options of RESs are solar, wind, hydro, geothermal and biomass, considerable in the majority of cases, though there may also be some other sources that are not as big contributors as the presented six sources.
To date, many studies have been conducted on RESs for sustainable life, and researchers are continually exploring different aspects of such energy contributions [10,20]. The research is based on the core concept of sustainability and the requirements of solar, wind, hydro, geothermal and biomass as RESs. However, another component of green consumer values must be considered to justify the demand- or consumer-side opinions [21,22]. However, another study in the same area was conducted to understand the green consumer values concept with respect to RESs. Here, the research is differentiated by observing the research problem that there is a requirement to categorize the green consumer value parameters in a hierarchy of importance for selection by consumers for these specific five RESs and their alignment with environment policy based on a comparison of Poland and India as strategic countries of Europe and Asia, respectively, which is necessary to support the UN sustainable development goal.
Green consumer value conceptualization is very rational to understand the consumer acceptance of an environmentally friendly product, though there are chances of rejection because of a consumer’s own personal reasons [23]. So, question 1 may framed as: Why is the green consumer value important in the consumption of renewable energy? Though there are limited sources of renewable energy and their acceptance depends mostly on the government offerings and promotions [24], still consumers should have their own preferences and acceptance if offers are available, which leads to question 2: Do different decision criteria of green consumer values act differently in their importance for consumers? Countries are known for their different cultures and value systems. Poland is representative of Europe [25], while India is representing Asia [22]. There may be many differences and similarities in their geographic and demographic structures, but the green consumer values [18,23] are the subject of assessment, which makes question 3: Is there any difference between Poland and India on their green consumer values for different RESs? Environment is the buzz word of the era [2,26], but consumer’s green values can bridge the gap following environmental policy, which may be possible with question 4: Is there alignment of green consumer values with environmental policy? Countries may be in a better shape or growing by measuring agencies [6,27], but the real assessment is required by answering question 5: Do Poland and India commit to following the path of sustainable development? Justification of the study is possible with answering these specific research questions regarding the problem stated.
This study frames the main objective as to analyze the comparative understanding of consumers in Poland and India with respect to renewable energy sources based on their green consumer values. However, the research is bound to reach some preset objectives divided into small segments, which are:
-
To know the importance of green consumer values comparatively between Poland and India.
-
To measure the importance level of each decision criteria from green consumer values on different RESs.
-
To obtain a comparison of Poland and India on their green consumer values of RESs.
Further, some hypotheses framed to test statistically for the justification of the framed thoughts are:
Hypothesis 1.
Consumer understanding about the green consumer values in Poland and India is poor.
Hypothesis 2.
Green consumer values are similar for all RESs in Poland and India.
Hypothesis 3.
All RESs are the same in the perception of consumers for their energy consumption.
The research is presented in six sections, where each section has its own importance for the presentation of thoughts. The Section 1 is the Introduction, with a detailed and elaborate discussion of the subject chosen with the research problem, questions, objectives, and hypotheses. The Section 2 is the Theoretical Background, which shows many subsections relevant to present the concept selected for study with all their dimensions. Section 3 is Materials and Methods, which is basically the methodology section, where subsections present theoretical, factual and statistical justification of the concept. Section 4 is Discussion and Results on the findings, and the results are majorly based on the outcome of the study from the statistical analysis. Section 5 is the last section, which provides the Conclusion and Future Research. The last presentation is References on the literature cited in the study.

2. Theoretical Background

The conceptualization of the research paper and the rationale behind these chosen concepts are presented in this section. The theoretical background is majorly based on the discussion about environment policy specific to its adoption in Europe and Poland, compared to the adoption in Asia and India [1,28,29]. As the study is a comparison of these two countries, the main concern is always surrounded by the environmental issues and occurrences in both countries. The sustainable development concept is also chosen to measure both countries’ initiatives and activities [28], if the countries are aligned with environmental policy for sustainable development. The green consumer values concept is the core of the study, which is measured over renewable energy sources by the survey questionnaire from the respondents of both countries. The comparison of these data provides the difference in their values for green energy sources, keeping in mind the environment policy and sustainable development. The context of India and Poland is chosen to justify the assumption that consumers from both countries possess similar green consumer values [16].

2.1. Environmental Policy

Environmental policy means any measure taken by a public or private organization or by a government concerning the impact of human activities on the environment. Primarily, these are measures aimed at preventing or reducing the harmful effects of human activities on ecosystems [2]. Thus, “environmental policy may include regulations and rules on water and air pollution, chemical and oil spills, smog, drinking water quality, land conservation and management, and wildlife protection such as the protection of endangered species”. Environmental management systems, preservation, and natural resource management were formerly the responsibility of the national sector officials. Recently, climate awareness and management have been framed as a larger enterprise that necessitates the active participation of communities, people, non-governmental groups, and the business sector [29]. As a result, there is a growing trend with regard to environmental conservation and preservation in the interest of the public to be delegated widely [30].
Furthermore, as customers, private landowners, and policy debate members, people and democratic institutions have a larger influence on the ecosystem. Developments in the government’s involvement in environmental policy have occurred in reaction to social, economic, and technical changes that countries have experienced during the last several decades [7]. This movement comprises a transition from a vision of governance defined by the nation-state to one that acknowledges the contributions of many levels of authority (global, multinational), as well as the responsibilities of the private industry, nonprofit actors, and society organizations [31]. The complexities, ambiguity, and urgency of many global and local environmental challenges have prompted numerous questions about the validity of the classic model of development and the interaction between society, commerce, and ecosystem [32]. It has also generated concerns about the local governmental model’s capacity to satisfy the needs of economic management in a responsible way.
As a result, attention for sustainable development has shifted upwards to international institutions and multinational corporations, and downwards to local authorities, enterprises, and resources users [33]. PEP2030 is a justification and successful implementation of the SRD provisions within a strategic documentation system. As a result, the core purpose of PEP2030, namely the development of the environment’s potential for the benefit of residents and enterprises, was directly transferred from the SOR. Specific aims of PEP2030 have been defined in response towards the most important environmental trends highlighted in the diagnostic, in such a way that it allows for the harmonization of environmental regulation with economic and social demands [34].

2.1.1. Europe Adaptation of Environment Policy

EU nations have established objectives that will guide European environmental policy until 2020, as well as a roadmap for continued growth until 2050. Furthermore, funding has been identified for specific research programs, regulations, and investment to safeguard, maintain, and enhance the EU’s ecological integrity, and reshape the EU into a source of green energy, being a competitive and affordable economy as well as a safeguard to EU members from negative impacts on the environment [29]. Despite the fact that several environmental organizations are making efforts to promote green projects, they are disorganized and divided, and political parties have paid minimal attention to environmental difficulties, while the public consciousness has switched to the core economic matters of everyday living.
Up to this point, achievements have been impressive, but only partially, as a result of government decisions, industry slowdown and restructuring having all had a significant influence on reducing pollution [25]. Unsatisfactory outcomes in Poland as a minimally environmentally committed EU member country influenced Polish preferences for revised EU green initiatives. Existing EU policies, their alignment with Poland’s energy objectives, and a shift in expectation of future EU policies account for a large portion of the fluctuation in opinions. Second, Poland’s policy response had a considerable impact on the EU 2030 climate action agenda [29].
Responding to the anticipated limitations in the Polish electricity industry, decision makers did not support European climate change policy [25]. Climate change policy in Poland following the change in the 1990s may be described as centrally managed and technologically implemented [35]. Gas imports from Russia, as well as their dispersion owing to the political environment, have long overshadowed Polish energy security concerns. This may seem remarkable, given that gas contributed only 13 percent of total primary energy supply in 2009, with a third generated internally. More than 80% of gas was imported from Russia, which many analysts and politicians saw as the main danger to Polish energy security as a result of political actions [36].

2.1.2. Poland—A View towards Environmental Policy

It is sometimes stated that over the previous two decades, Polish environmental policy has moved in the opposite direction of the major advancements in EU nations. Whilst the reduction in greenhouse gas emissions and enhancement of renewable energy were significant in the outline of Polish protection of the environment, by the end of the twentieth century and the beginning of the twenty-first, the government began to perceive European climate policy as a threat to the Polish economy [29]. Following the launch of the ‘Energy and Climate Package’ in 2008, the Polish authorities implemented a “pre-emptive veto” policy that stymied future progress. Polish energy is dominated by coal, the majority of which comes from domestic sources. In 2013, it accounted for 54% of the energy industry and 88% of the power sector [35].
To differentiate the power mix, the government plans to build a nuclear power plant. Meanwhile, closures of unprofitable mines meet stark sectorial resistance. The government of Poland in 2019 adopted the National Environmental Policy 2030 (PEP2030). Since then, PEP2030 has become the most important strategic document in the sphere of environment and water management in Poland [25]. This document was, in the system of strategic documents, a specification of the medium-term Strategy for Responsible Development until 2020 with an outlook until 2030. The task of PEP2030 is to ensure Poland’s ecological security and high quality of life for all inhabitants. Furthermore, PEP2030 supports the worldwide execution of Poland’s objectives and obligations, along with the EU and the UN, particularly in the framework of the EU’s energy and climate change policy objectives till 2030 and the 2030 Agenda For Sustainable Development (SDGs) included in Agenda 2030 [1].
In 2019, the Council of Ministers in Poland adopted an important strategic document: the 2030 National Environmental Policy (PEP2030). The role of PEP2030 is to ensure Poland’s ecological safety and high quality of life for all residents. State National Policy until 2030 (PEP2030) is a strategy in accordance with the act on the principles of development policy (SOR). In the strategic model, it specifies and operationalizes the “Strategy for Sustainable Development until 2020” with a perspective until 2030, which is valid for the years 2023-2027. Supporting the achievement of the 2030 goals [37], PEP2030 repeals the Strategy “Energy Security and Environment—a perspective until 2020” in the part concerning Objective 1: Sustainable management of environmental resources and Objective 3: Improvement of the environment.

2.1.3. Asia Adaptation of Environment Policy

Climate change has been a major challenge for countries in Asia. There is considerable talk around the rebuilding of the climate and to be resilient to disasters. Tackling climate change and enhancing the environmental sustainability is the major concern [37]. The Asian Development Bank has set its strategy until 2030. The main theme of the strategy is to keep committed and ensure the support for climate change mitigation and adoption activities by 2030, though there were challenges during the COVID-19 pandemic that were hurdles for the global development. Still, countries have the most possible initiatives for the adoption of environment policy. The Asia climate change adaptation forum met in 2021 under the theme of enabling resilience for all with scaling up the action programs and sharing their learning for the climate resilient developments [38].
The main agenda of this meeting established addressing resilience by inclusivity of all, resilience for nature by each individual, being resilient towards the economic sector, and resilience for local areas and communities. Asia is witnessing environmental change, which is impacting living organisms [30]. The growth-led countries in Asia are polluting their air and water bodies, which is a serious concern that needs to be addressed without delay. Asia is committed to the adoption of environmental policy for sustainable development. Asia is constituted of a mix of developed and developing economies, which has brought the continent to the crossroads of environmental sustainability. These countries have a large variation in their economic, political, and social developments.
The countries Japan and Singapore are more focused on efficient energy production and consumption, as well as the protection of ecosystems. However, at the same time, the countries China and India are more focused on policy making for sustainable growth. However, in all cases, the concern is energy security for each and every individual all around the world [26]. There is a requirement of close observation for the framing of environmental policy because a varied participation brings a deviated approach among stakeholders to tackle ecological challenges. However, the emergence of India and China as leading economies in Asia has made the world assume that the current century is the century of Asia, though it is evident that the environment footprint generated by the economic developments are essential to policy framing. At the same time there is a question: Is this development of Asia environmentally sustainable?

2.1.4. India—A View towards Environmental Policy

Environmental policy is the core of India for its vision to exceed on the path of a sustainable economy. India took pledges in 2021 for keeping climate change at the center of environmental policy structure under the commitments of the Paris Agreement. The pledge to have zero carbon emissions by 2070 and the production of 500 gigawatts of renewable energy capacity by 2030 is leading India in its environment policy [39]. There are several steps taken by the government of India for sustainable development following environmental policy. The evolution of environmental policy in India began with its independence in 1947 and is positively moving forward every year [38].
The first in this series is ‘Paris Agreement Ratification’, providing a framework for the immediate action all around the world on the issue of climate change. The second is the ‘Clean Development Mechanism’, aiming to optimize Indian industries on the factors of efficiency, energy, fuel transition, solid waste management, etc., to reduce the pressure on the environment. The third is the ‘State Lead Action Plans on Climate Change’ to create organizations that can be capable of promoting activities and addressing issues in climate change. The fourth is the ‘National Clean Energy Fund’, which is the initiative of the government of India of imposing carbon tax over coal and promoting clean energy. The fifth and last is the ‘National Adaptation Fund for Climate Change’ means of financial support at the state and national level to support the solution to tackle climate change.
The policy-making activities in India are controlled by government authorities. The environmental policy framing has been conducted through a multilateral approach based on historic incidents at the national and international levels. Since gaining independence, the environmental issues were also incorporated into economic development. Later, during the 1980s, the policy framework pushed to align with international standards, which transformed the structure and vision for environment policy (Figure 2) [38]. In the later years, during the 1990s, the approaches shifted to participative and collaborative tools to solve the environmental issues among global communities. The current decade is the era of global uniformity to be univocal for the activism including the judiciary and civil society implementing scientific approaches to cater to environment issues [39].

2.2. Sustainable Development

There are a great many definitions of sustainable development (SD) in the literature. The idea of sustainable development originated in the early 1960s. It was a report presented to the session of the General Assembly on 26 May 1969 by U Thant, Secretary-General of the United Nations, entitled the problems of human environment expressed in resolution 2398, which stated that “for the first time in the history of mankind there was a worldwide crisis caused by the destruction of the natural environment, he documented this thesis with alarming statistical data and called for a planned international action to save the environment” [40].
The idea seems to have achieved wide interest-based attention that other development concepts lack, and emerges prepared to remain the ubiquitous development paradigm for the future [41,42,43]. Despite its ubiquity and acceptance, disillusionment with the phrase is common, as scholars continue to pose concerns regarding its meaning or description, as well as what it includes and suggests for developing principles and application, with no clear solutions appearing [26,42,44,45,46].
As a result, SD risks becoming a truism, similar to suitable technology—a trendy and rhetorical word to which everyone pays tribute but no one appears to be able to explain precisely [26,39]. The environmental economist Jack Pezzey identified, in the late 1980s, more than 60 definitions of SD (Pezzey 1989) [27], while Michael Jacobs in the following decade established as many as 386 definitions (Jacobs 1995), and already in the 21st century Barbara Carroll has pointed to the operation of more than 500 (Carroll 2002). Lithuanian researchers, on the other hand, found that there are about 100 definitions in the economic literature alone (Ciegis et al. 2009). However, those without undertaking a deeper analysis are presented as the most important ones.
The Club of Rome, 1972, and then the Brundtland Report, 1987, by Gro Harlem Brundtland (WCED) (UN) (1987) says “Development that meets the needs of the present without compromising the ability of future generations to meet their own needs”. Conway, 1987: 96 says “The net productivity of biomass (positive mass balance per unit area per unit time) maintained over decades to centuries”. Turner, 1988: 12 says “In principle, such an optimal (sustainable growth) policy would seek to maintain an “acceptable” rate of growth in per-capita real incomes without depleting the national capital asset stock or the natural environmental asset stock”. Rio Declaration, 1992 said “The rearrangement of technological, scientific, environmental, economic and social resources in such a way that the resulting heterogeneous system can be maintained in a state of temporal and spatial equilibrium”.
Sustainable development is defined as the type of human development that fulfills the necessities of the actual generation without impairing the possibilities for the next generations to meet their necessities [47]. According to Sen, 1999, a sustainable society is one in which the individual ability to do what they have good reason to value is continually enhanced. Another study by Johannesburg, 2002 says that sustainable development means the integration of social, economic and environmental factors into planning, implementation and decision making so as to ensure that development serves present and future generations. Stappen, 2006 defines sustainable development as a development that meets the basic needs of all human beings, which conserves, protects and restores the health and integrity of the ecosystem, without compromising the future generations’ ability to meet their own needs.
As can be understood based on the literature explained above, the concept of SD is ambiguous. All definitions indicate that SD is a process related to economic activity. Various definitions of ecological policy exist in the literature to date. For the purpose of this article, it has been agreed that the ecological policy is a conscious and purposeful activity of the state, local self-governments and economic entities in the field of environmental management, i.e., protection of ecosystems or selected elements of the biosphere, shaping of ecosystems or selected elements of the biosphere, and management of the environment, i.e., the use of its resources and values [48]. The subject of the ecological policy is therefore the natural environment and its condition assessed from the point of view of human biological, social and economic needs. One of the principles of ecological policy is the principle of sustainable development [49]. It should be noted that the essence of the sustainable development is equal treatment of social, economic and ecological reasons, which means the necessity of integrating the environmental protection issues with the general state policy [50].

2.3. Green Consumer Values

The concept of green consumer values is the main focus of production companies. They know if the consumer will not accept the product and service offerings, then the viability of the business will be in question. The sustainable offerings are the requirement for the current time. Consumers are looking for products and brands advocating the sustainability in their offerings. The demands are so much higher that many brands have claimed the growth in their offerings of green values twice as high compared to traditional offerings by their competitors [23]. However, at the same time many counter problems are a hurdle for the green offerings, such as the price for the offering. The consumer awareness about the sustainable consumption to save the planet is the major enforcement to transform consumers for their consumption values. There are initiatives by government and non-government organizations everywhere to support the green consumption by awareness creation and providing factors of sustainable production. Manufacturing companies are also motivated to be participative in these activities with their commitment to the environment and a sustainable planet [51].
Collaborative activity by all stakeholders can make green consumption for a sustainable future. Research all around the world has been promoting sustainable consumption for many years. There is sufficient experimental research in economics, marketing, and psychology, measuring the consumer behavior towards green offerings [22]. The result of this research has given learning to academicians about consumer preferences on green consumption. Policy has come up as the intervention in many studies where the findings are mostly focused on consumer behavior towards sustainable purchasing [23]. Companies are advised to apply activities to use social influence following actions of using social media, shaping habits for green consumption, leveraging sustainable consumption, thinking over the decision from the heart or the brain, and the favoring experiences. Sustainable business has the sufficient momentum to go ahead, but still brands are required to create a relevance that may be justifiable to the green consumer values [19].
Behavioral science may help companies to realize their value among consumers and to understand consumer and target market demand for offerings. There are many drivers pushing green consumption shaping consumers’ green values, including behavioral factors, product- and producer-related factors, personal capabilities, context, socio-demographic variables, interpersonal environment values, and intrapersonal non-environment values [52]. The environmental protection and the concern of sustainable consumption depends upon human behavior and the consumer’s lifestyle [21]. Studies have witnessed that consumers concerned about the environment prefer to consume green products. However, consumer preferences keep swinging and switching from ecofriendly green products to traditional products and vice versa. The reason behind these swings and switching over is the lack in consistent appeal from green products to keep hold of customers with emotions. The consumer reluctance to switch over is called the green gap [53]. This gap is the reflection of customer denial on green consumption, though they are favoring the environment and are concerned about the planet sustainability.
Further, this may lead to the problem that demand for green products will drag companies to instability [48]. The green gap has been seen from different perspectives, such as social desirability bias, limited availability of green products, lack of marketing messages, higher price perception, lack of quality, and high effort in purchasing. Above everything, the most important factor in the green consumption is observed to be the consumer’s consumption values [22]. Consumers have been attracted to adopting environmentally sustainable lifestyles, which has been increasing over the last few years. Modern consumers are not ready to compromise with the future and they are very conscious with their consumption habits. This is leading to buzzwords such as green consumers and green products [21]. So, the companies are unfolding the new realms of production by understanding the green consumer values and buyer behavior for green products and services. Though the importance of consumer values is known to companies, still the challenge in the consumer behavior is implicit criteria of fluctuating evaluations. Green marketing activities can be a tool for companies to respond consumers’ green values [54].

3. Materials and Methods

The research is based on the continuation of the study regarding the green consumer value assessment for India [19] and Poland [16]. For this purpose, the study revolves around the understanding of environmental policy and sustainable development. The conceptualization of the concept of green consumer values is developed, backed by the thought of consumption being the key for the success or failure of any product or brand. It is very important to know consumers and their opinion on the acceptance of green offerings. The research conducted in India titled “Management of GREEN Consumer Values in Renewable Energy Sources and Eco Innovation in India” [19] was mostly intended to obtain insight into the situation of green acceptance in India. The other study in the series, “An Empirical Analysis of Renewable Energy Contributions Considering GREEN Consumer Values—A Case Study of Poland” [16], was also meant to know the green energy acceptance among consumers in Poland. The current research statistically compares the green consumer values from both countries with respect to six renewable energy sources.
Moreover, the current study is centered on finding a solution to the research problem to establish a hierarchy among green consumer value parameters on importance for selection by consumers on six RESs and their alignment with the environment. This is the most basic requirement for any study to discuss the materials and methods adopted. The current section of the study is combined with six sub sections that are presenting statistical justification of the concepts and concerns raised as the research problem. The sub sections are methodological approach, EU environmental policy implementation statistics, Poland’s environmental policy implementation statistics, Asian environmental policy implementation statistics, Indian environmental policy implementation statistics, and green consumer values for renewable energy comparative data of Poland and India. There has been usage of secondary data to fulfill some requirements for statistical support showing the situation of environmental policy implementation in the EU, Asia, Poland, and India. However, primary data are used for drawing the main outcomes of the study on the comparison of green consumer values for renewable energy between Poland and India and the hierarchical presentation of green consumer values parameters.

3.1. Methodological Approach

A methodological approach is the backbone of this research. The study incorporates two countries: India as representative of Asia, and Poland as representative of Europe. The reason behind choosing these two countries is the systematic development of a series of research (Figure 3). Another reason is the main theme of the study being based upon RESs, which is well presented by the Renewable Energy Country Attractiveness Index (RECAI) 2022 [55]. India is one of the strong contenders and is ranked 7th currently, falling from 3rd because of falling wind energy generation, but it still stands as 2nd in Asia. Poland is moving ahead faster, scoring 19th, up from an earlier rank of 22nd, and is ranked 10th in Europe. Nonetheless, countries are striving hard to get ahead, which can be understood with their growing ranking. India and Poland are committed towards the contribution of sustainable development.
Further, this study is presenting statistical analysis based on secondary data of the current state of development for the implementation of environmental policies for reaching the commitment of sustainable development goals. The primary data have been collected for 5 RESs with respect to six parameters, which are [19] considered as criteria and presented as CRITERIA 1, CRITERIA 2, CRITERIA 3, CRITERIA 4, CRITERIA 5, and CRITERIA 6 with respective items: It is important to me that the energy I use does not harm the environment; I consider the potential environmental impact of my actions when making energy usage decisions; my energy consumption habits are affected by my concern for our environment; I am concerned about wasting the resources of our planet when I use energy; I would describe myself as environmentally responsible using energy; I am willing to be inconvenienced in order to accept energy that is more environmentally friendly. A sample size of 624 respondents [56,57,58,59,60] was chosen from both India and Poland for the comparative analysis of their green consumer values, applying the statistical test on paired set for Poland and India of Green Consumer Values [36,60,61]. Another test is the Automatic Linear Modelling Automatic Linear Modeling (ALM) of regression analysis used to rank predictors based on their importance of parameters for both countries [59,60,61,62].

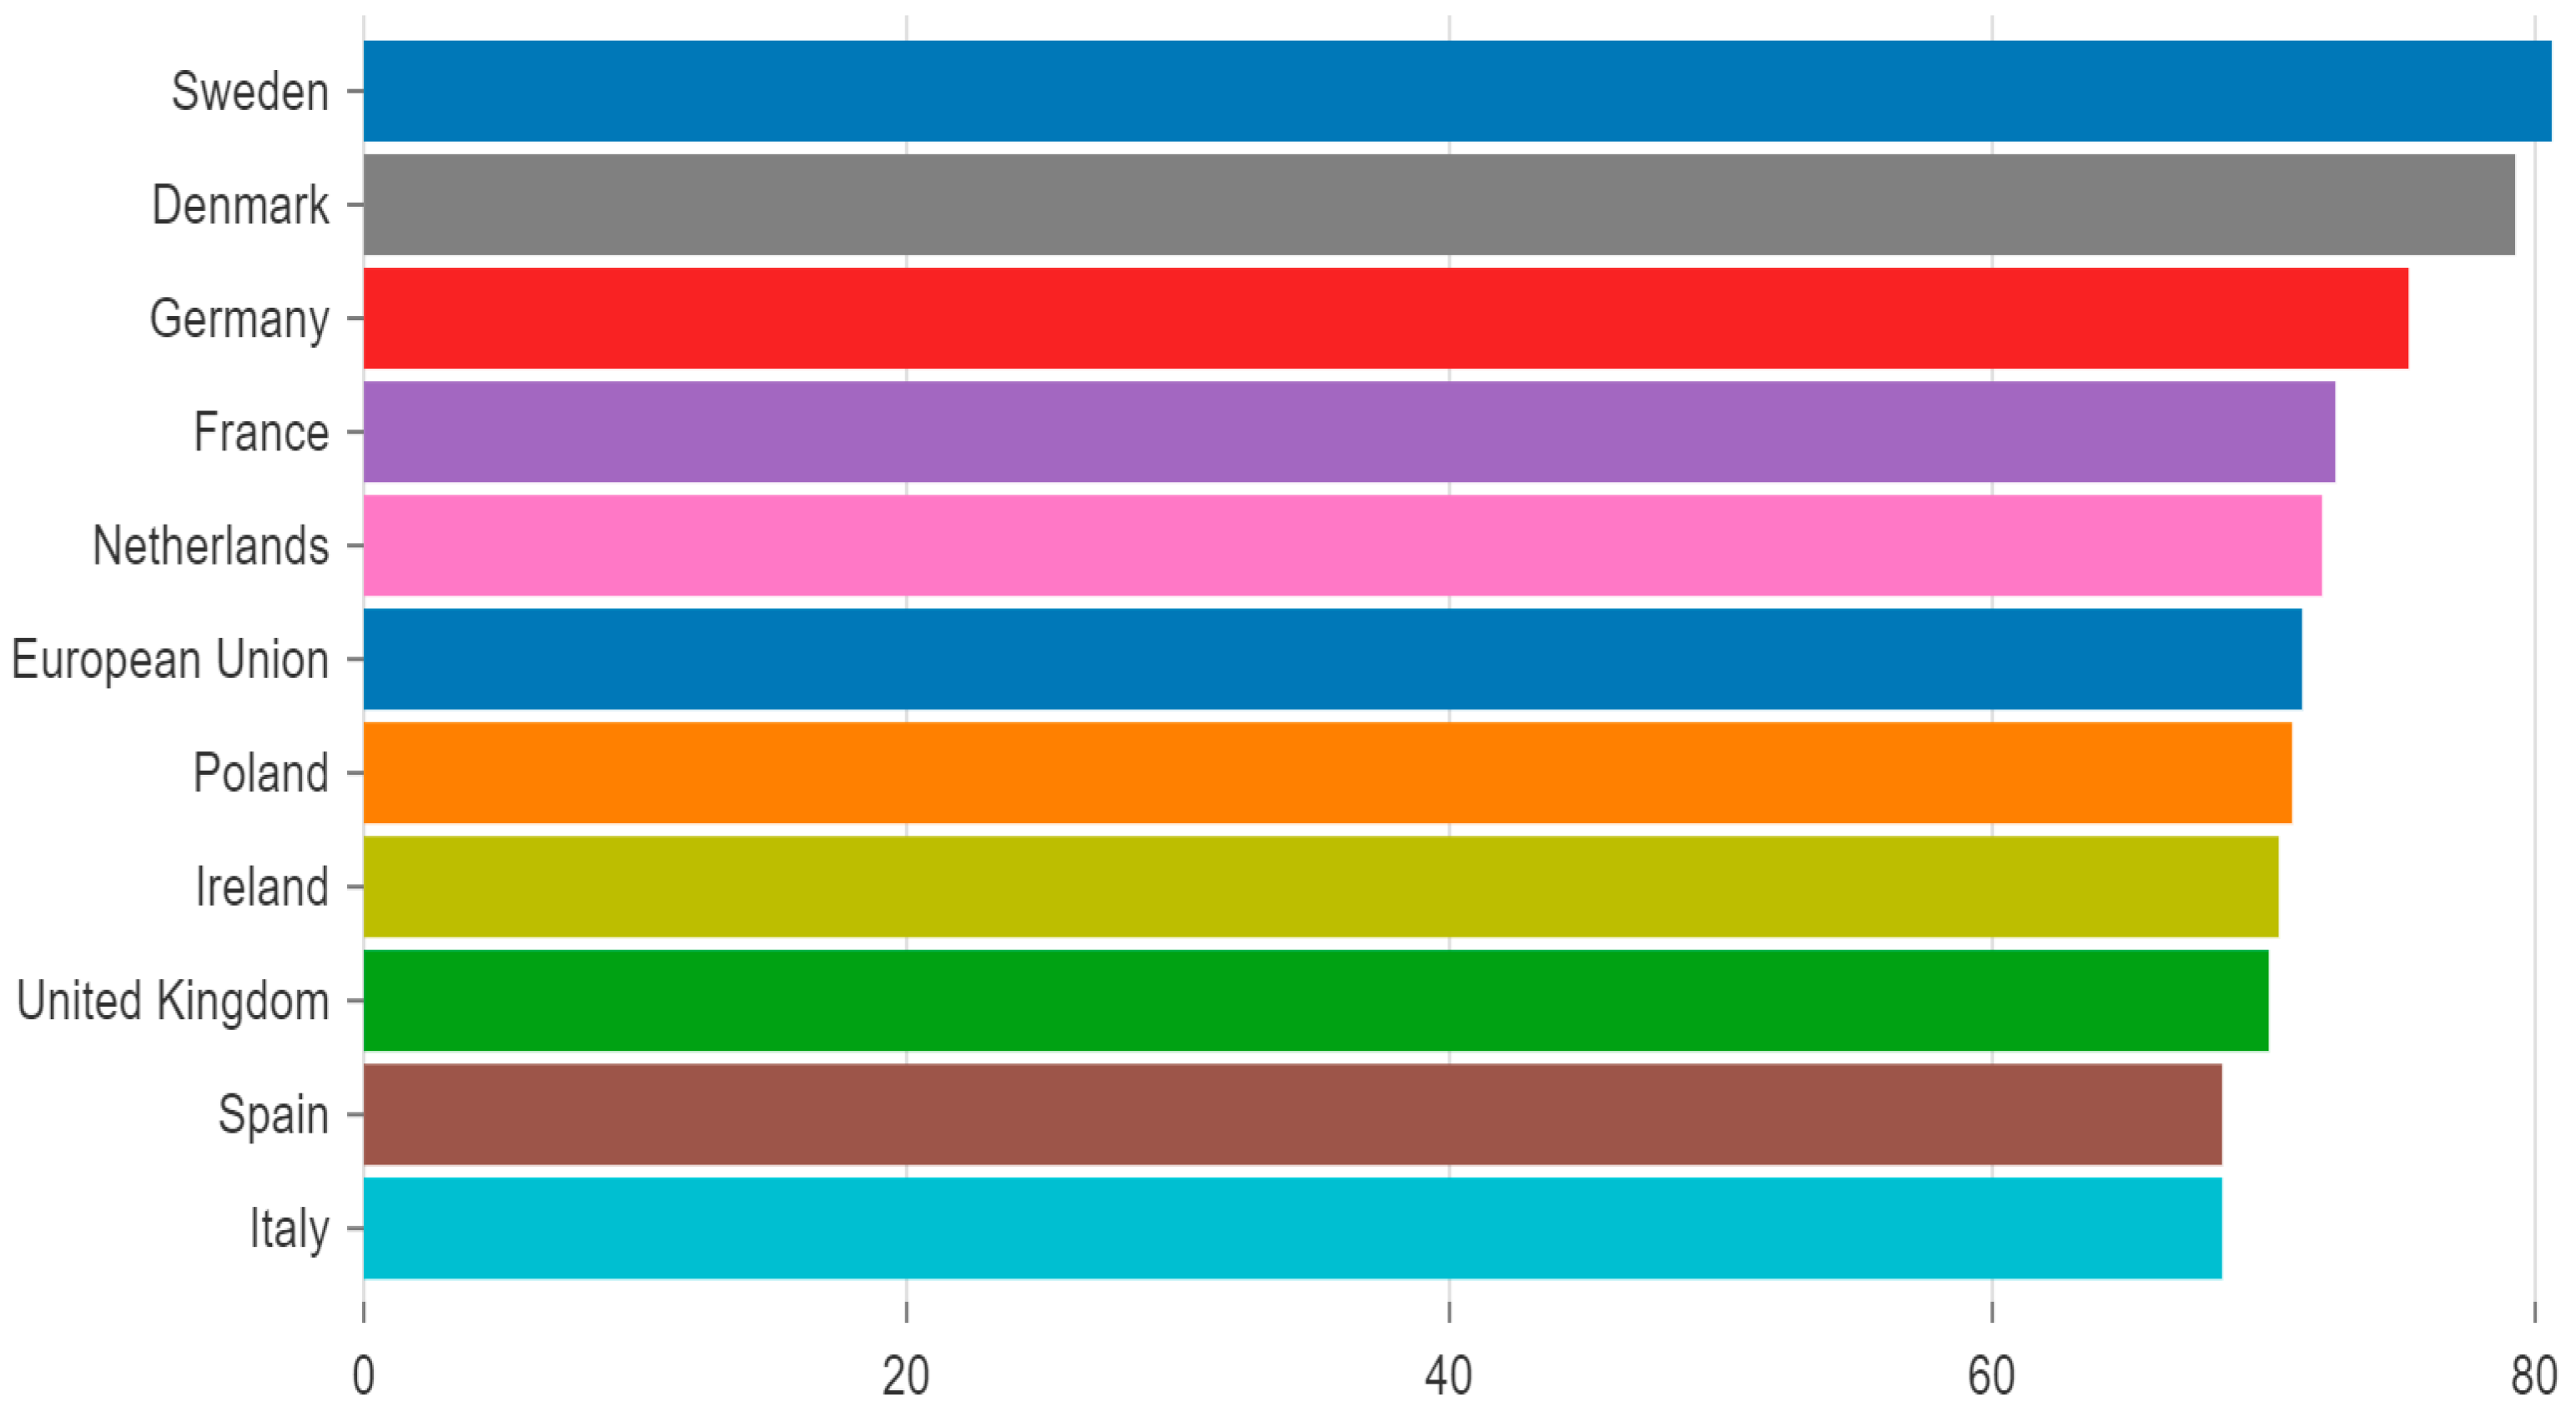
3.2. EU Environmental Policy Implementation for Sustainability Statistics

The EU has displayed a recommendable contribution in reaching sustainable development goals. As per the statistical information provided by the European Sustainable Development Report 2021 [63], the average contribution of the European Union is scoring 71.39 points. At the same time, there are many countries exceeding the average, such as Sweden—80.57, Denmark—79.32, Germany—75.33, France—72.71, and the Netherlands—72.12 consecutive points. Other countries, such as Poland—71.03, Ireland—70.59, the United Kingdom—70.15, Spain—68.52, and Italy—68.5 scored points consecutively in a decreasing order among the other countries of Europe [63]. The presented bar chart (Figure 4) clearly shows the status of Poland, which is very close to the EU’s average points.
There are many indicators to assess the development and implementation of environmental policy in Europe. The bar chart (Figure 4) presented shows the overall results rather than specific goals, though comparatively, individual performance and score measurement also shows a better performance. Countries are showing higher or lower scores, but all countries of Europe are pushing themselves to reach the maximum possibility with sustainability [63]. The pace of development by the EU countries is evidence of their contribution for a sustainable future aligned with the world’s commitment for to reach the sustainable development goals.

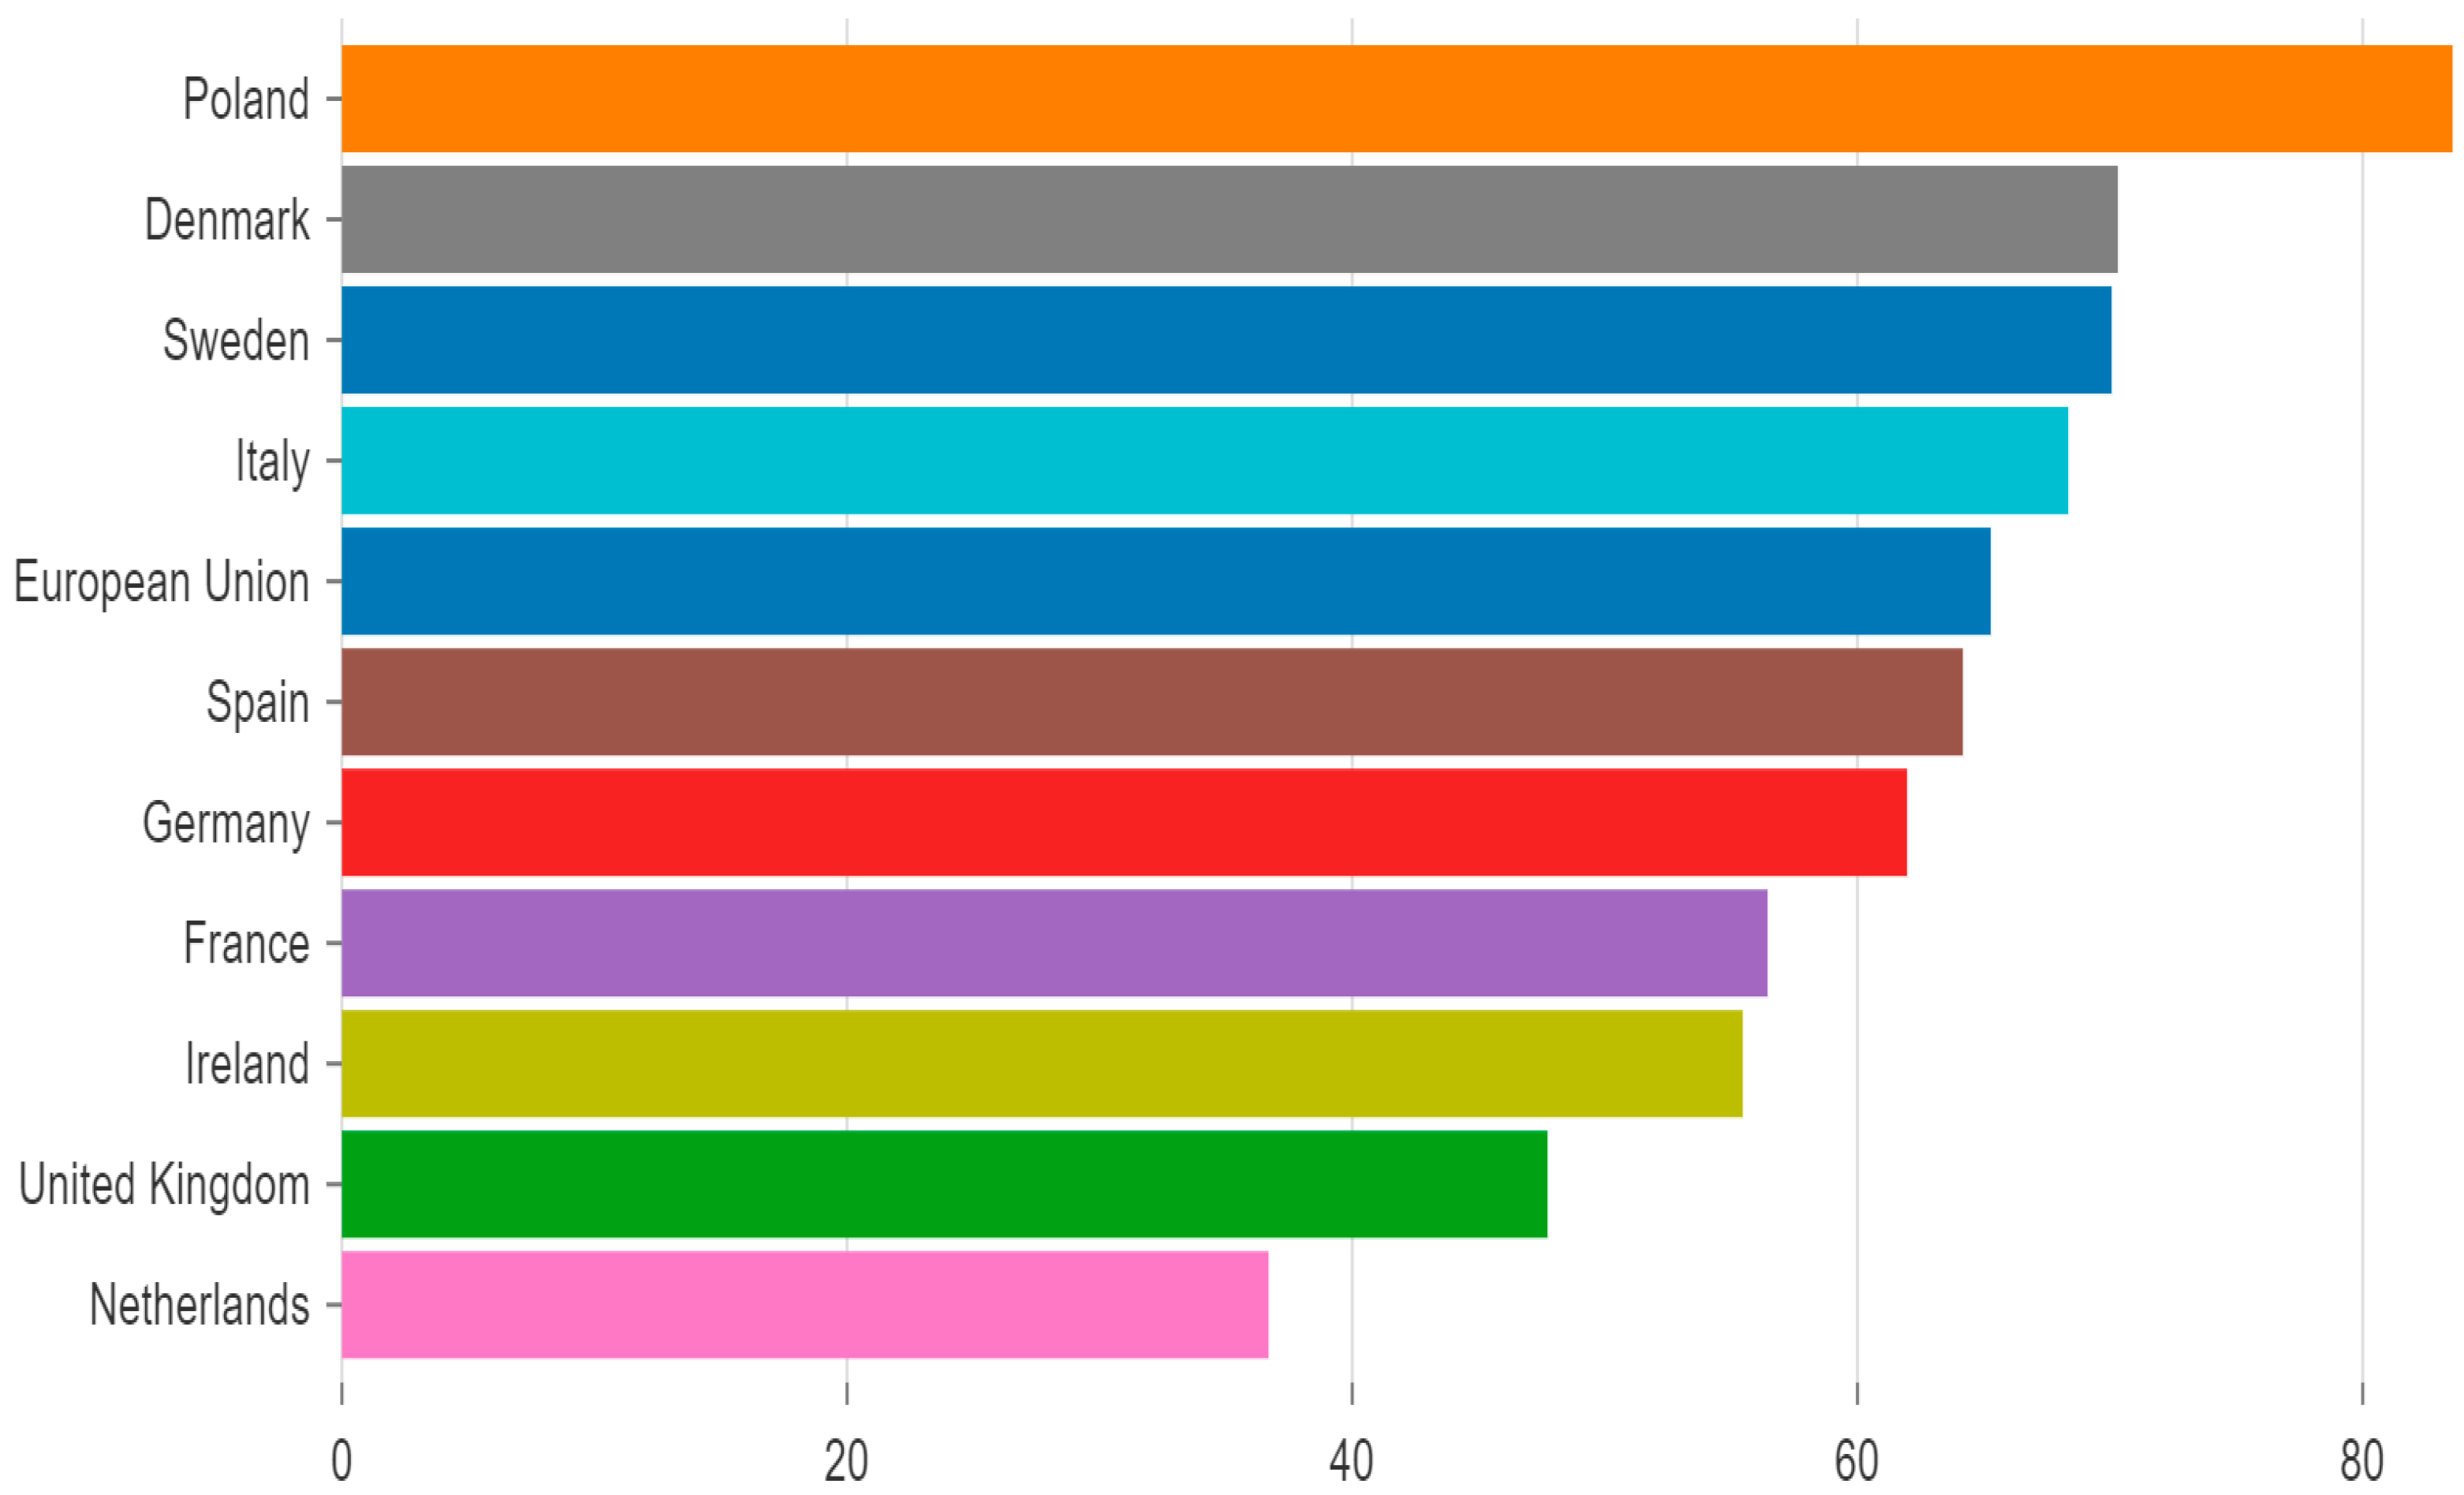
3.3. Poland Environmental Policy Implementation for Sustainability Statistics

Poland is a country showing transformation and growth in all sectors. The move towards sustainable development goals is crucial for the country to keep a strong presence in the EU and protect their future. This study presents the statistical report presented by the European Sustainable Development Report 2021 [63] on the spillover score among the European countries. Poland has shown the highest score, though the European Union average score is 65.31, which is justification for the move of Poland towards sustainable development goals.
The spillover scores of Poland—83.54, Denmark—70.35, Sweden—70.09, and Italy—68.34 are more than the average score of the EU. The countries Spain—64.23, Germany—61.96, France—56.44, Ireland—55.48, the United Kingdom—47.76, and the Netherlands—36.69 are showing a lower spillover score compared with the EU average. A higher spillover score shows the positive impact and a lower negative impact, as shown in the bar chart (Figure 5).
The spillover assessment score is a good criterion to measure the reach exceeding their commitments for the positive impact on environment. The measurement involves some specific criteria: environmental and social impacts, economy–finance and trade for sustainability. The bar chart (Figure 5) presents a clear status of Poland, which has performed the best in Europe on the spillover score [63]. The transformation and switching over towards sustainability of Poland is commendable and it is surely predicting the strength of the country in Europe as the strongest contender to lead the way towards the sustainable development goals.

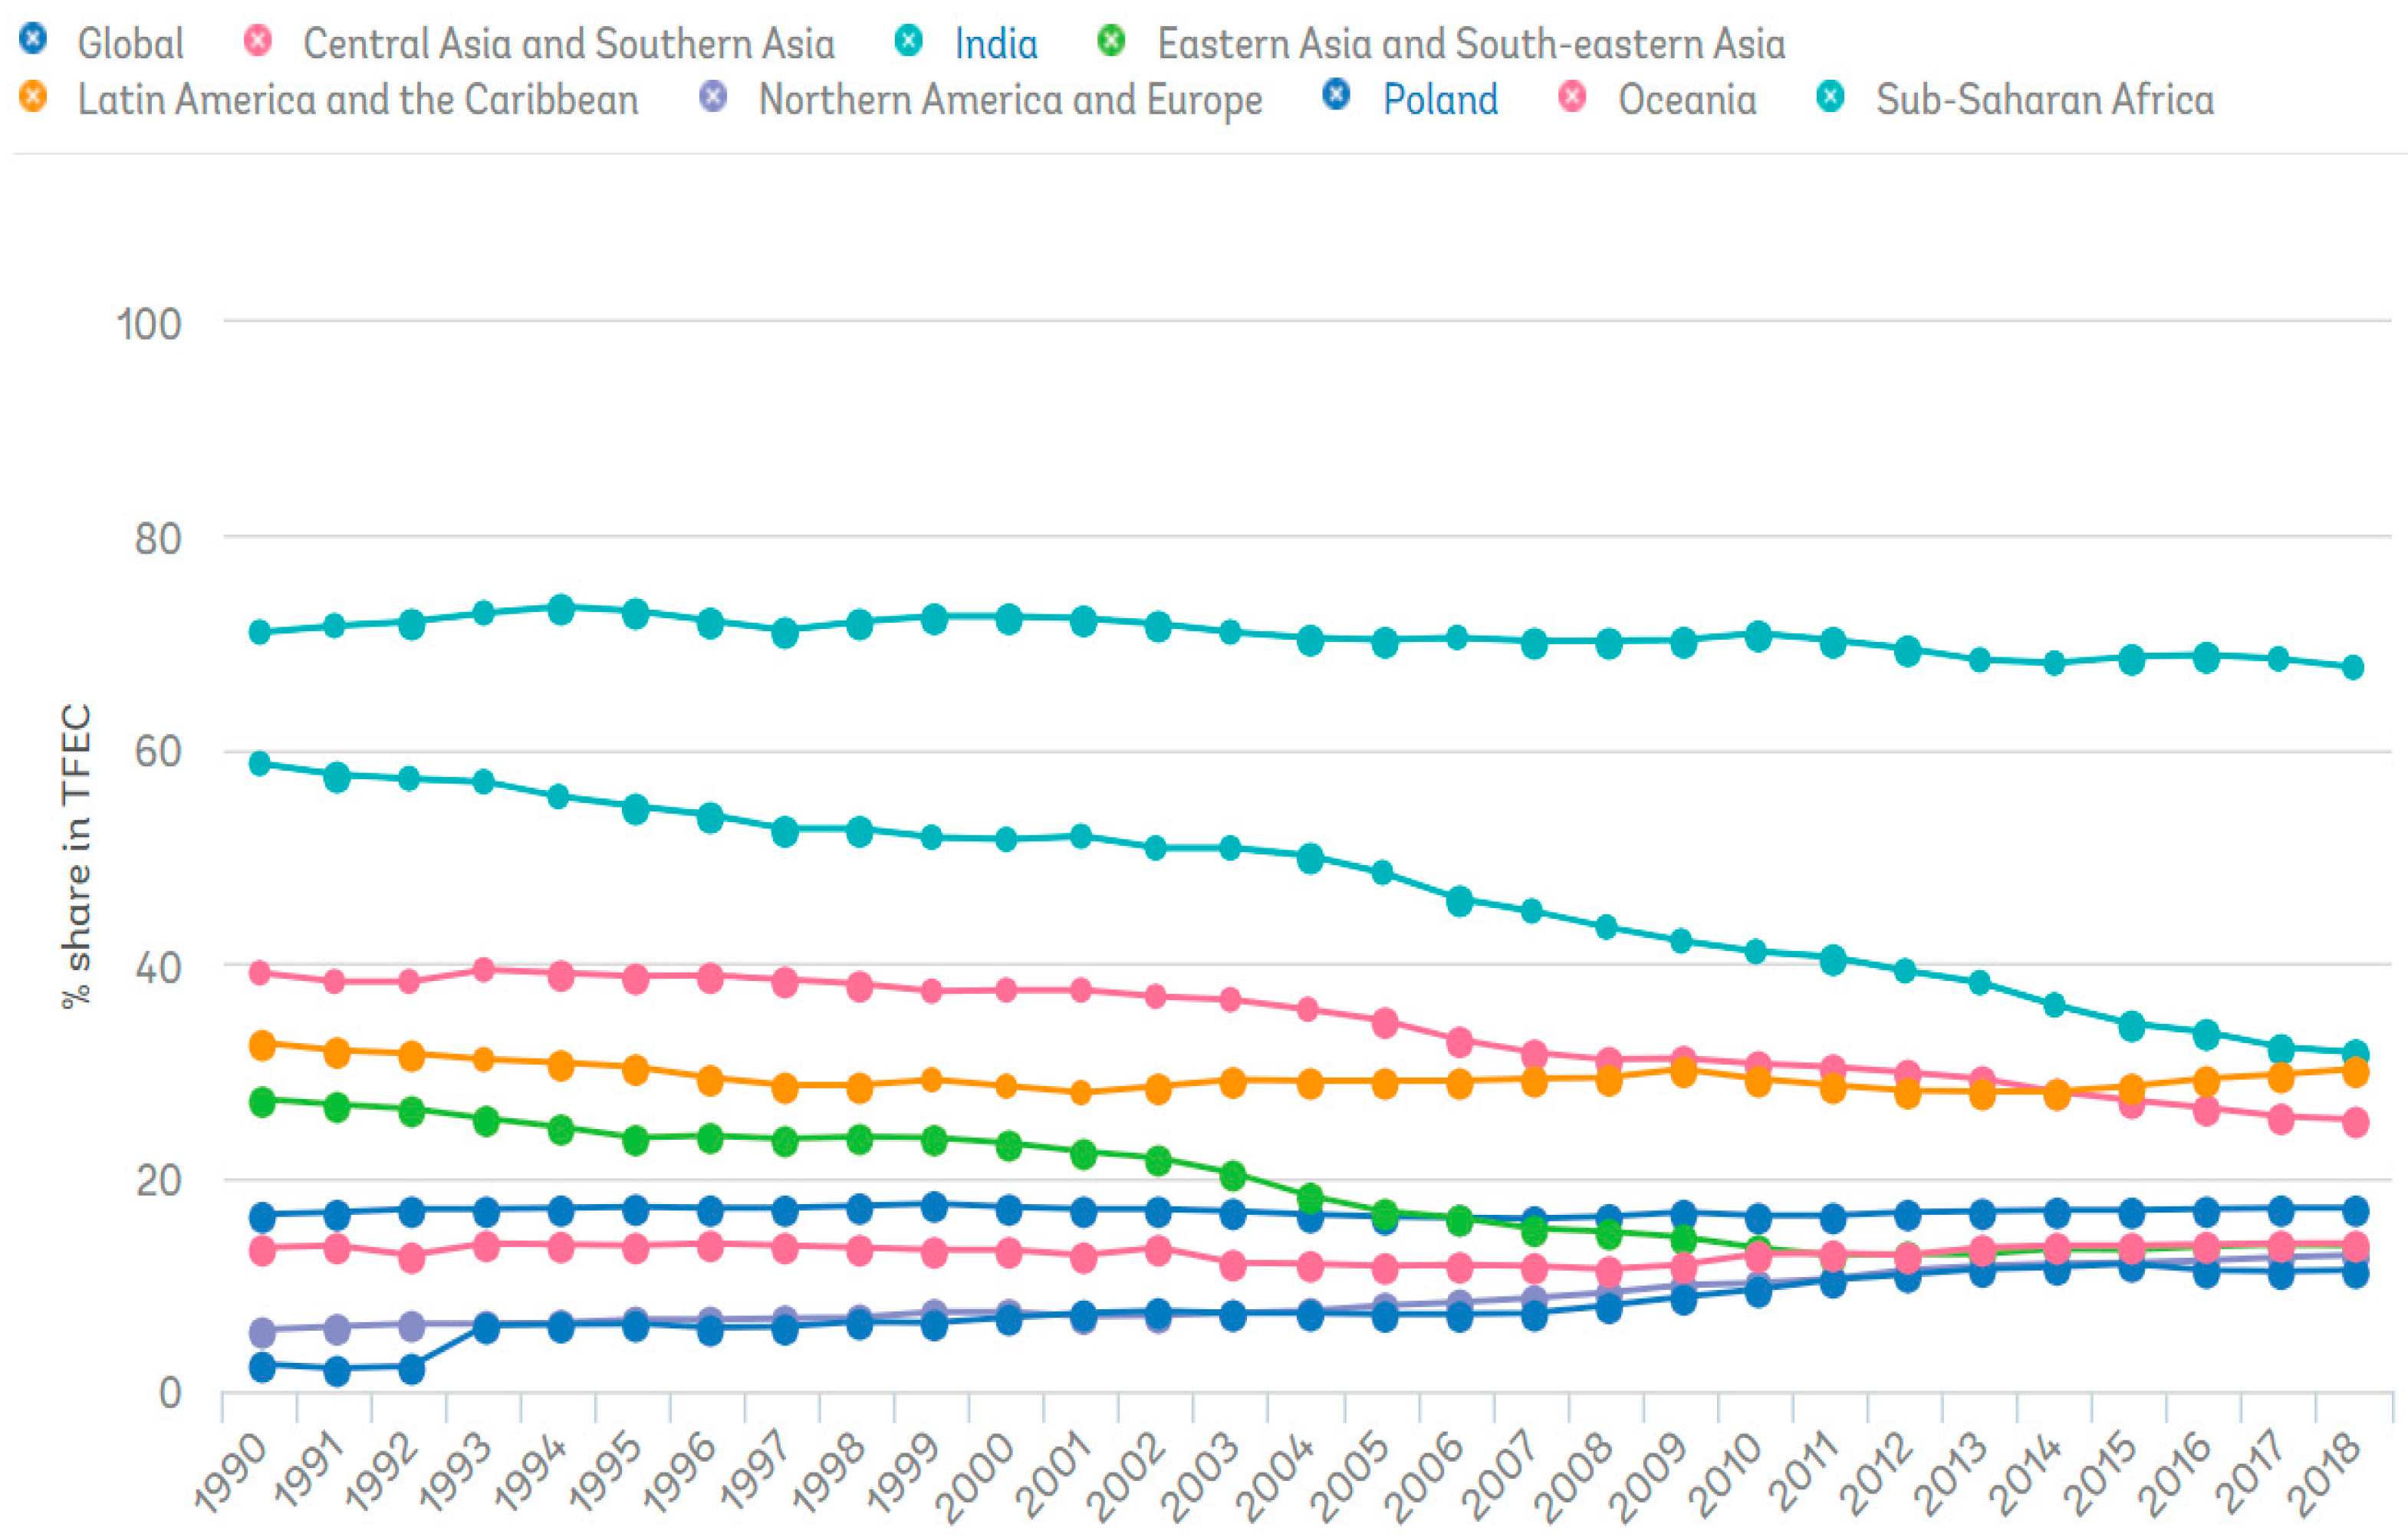
3.4. Asia Environmental Policy Implementation for Sustainability Statistics

Asia’s overall performance presents countries with performance based on the score for their development and contribution to the sustainable development goals. There are nineteen countries ranked from Asian countries, which are here presented as Country—Score (Rank): Thailand—74.13 (44), Vietnam—72.76 (55), China—72.38 (56), Singapore—71.72 (60), Maldives—71.03 (67), Bhutan—70.49 (70), Malaysia—70.38 (72), Sri Lanka—70.03 (76), Indonesia—69.16 (82), Brunei Darussalam—67.10 (93), Philippines—66.64 (95), Nepal—66.18 (98), Myanmar—64.27 (103), Bangladesh—64.22 (104), Cambodia—63.75 (107), Mongolia—63.51(109), Lao PDR—63.39 (111), India—60.32 (121), and Pakistan—59.34 (125), as presented (Table 1) [64]. Scores are country-specific, and the rank is provided comparing the performance among the countries all around the world.
Asian countries are showing their contribution, but they have a long way to go. There must be some proactive steps from each and every country in Asia to enhance their score, as the first country in Asia ranks 44th in the world. China, the highest power-consuming country ranks 56th. India is much lower, ranked 121st, which makes the picture clear regarding their performances. Asian countries require a stronger commitment to keep up in the reach for the sustainable development goals competing with all countries of the world to visualize their presence for future generations, though this ranking is not the only criterion for the assessment of performance and determinant of a country’s performance towards sustainability. So, the further statistical information will provide better clarification on the current move of Asian countries, specific to India.

3.5. India Environmental Policy Implementation for Sustainability Statistics

India is one of the top contenders for contribution to world sustainability. All countries throughout the world are looking at India with expectation. The reason behind this is the geographical expansion, population expansion and the fast industrial expansion. India’s performance can be understood by the ‘Spillover Score for Reaching Sustainable Development Goal’ presented (Table 2) with the comparative rank and score [64]. India holds the 13th rank worldwide and the 2nd rank in Asia with a score of 99.29, which shows that the country is ahead than many other countries. The list of countries (Figure 5) showing a better spillover performance with a higher rank among the world countries are Asian countries. Higher consideration is always given to China among the Asian countries. The overall performance (Table 1) and the spillover performance (Table 2) are showing very divergent information about China. Among Asian countries, for overall performance, China is holding the 3rd rank, with a world ranking of 56th, but for spillover performance, it is 10th among Asian countries and 76th among the world countries [65,66], whereas India ranked 123rd worldwide and 18th in Asia for overall performance. At the same time, for spillover performance, it holds a worldwide 13th rank, and 2nd in Asia. This spillover performance is the major indicator for India’s leading role in world sustainable development, which will surely be achieved by India by reforming the energy sector.

3.6. Green Consumer Values for Renewable Energy Comparative Data Poland and India

Poland and India are the chosen countries for the comparison of their green consumer values with respect to five renewable energy sources: solar, wind, hydro, geothermal, and biomass. All figures presented below are Figure 6, Figure 7, Figure 8, Figure 9, Figure 10, Figure 11, Figure 12, Figure 13, Figure 14 and Figure 15 for Poland, and India alternatively for each country representing solar, wind, hydro, geothermal, and biomass, respectively. The coding for the CRITERIA are followed by their respective numbers from the questionnaire on the SEP for Solar Energy Poland, and SEI for Solar Energy India, evaluated on six parameters of green consumer values [21].
The figures present the RESs as nodes, showing the responses with bar charts connected with all criteria and intercepts. All these connections are either positive or negative. Intercept is the constant value that is the outcome of analysis. The intercept makes sense when we consider that criteria are depending on intercepts, which is not the condition here. All figures are showing negative intercept and positive values for criteria, except with Figure 9 and Figure 12, where the intercept is positive, but some criteria are negative. The negative line shows the weaker value, and the positive lines are showing the stronger value.
The coding is a continuation in a similar way: WE for wind energy, HE for hydro energy, GE for geothermal energy, and BE for biomass energy, respectively. Each analysis is presented in a set of both countries for specific energy sources to show their comparison. The Solar Energy Poland Green Consumer Value (SE Poland GCV) Criteria are presented (Figure 6), which show six criteria with effect and importance ranking (Table 3). The presentation for the Solar Energy India Green Consumer Value (SE India GCV) Criteria are presented (Figure 7) with six criteria and an effect and importance ranking (Table 3) as a comparative analysis following the similar coding pattern.
The wind energy, WE, is presented for Poland (Figure 8) and for India (Figure 9). The six criteria are the same for comparison but both countries display a different ranking of importance (Table 3). India is showing negative strengths in the lack of implementation of wind energy. Detailed analysis is presented as a result in a further section (Table 3), providing the current situation of the selection criteria for each renewable energy source. Hydro energy is the third kind of renewable energy source, coded as HE, and presented with criteria comparison between Poland (Figure 10) and India (Figure 11). The ranking of criteria is different for both countries, though the same criteria are evaluated for both [67].
The fourth kind for the comparison of green consumer values criteria is geothermal energy, coded as GE, with criteria comparison between Poland (Figure 12) and India (Figure 13). The same ranking criteria are used based on a structured survey questionnaire from 624 respondents from each country. The outcomes of the rankings are different for both countries in the representation of consumer view over the specific criteria to choose the green energy source. However, for this specific set, a much-differentiated outcome is the reason for a lack of information about this energy source in Poland, which is showing negative strengths with some of the criteria.
The last and fifth comparison set of a renewable energy source is biomass energy, coded as BE and presented with the outcome for Poland (Figure 14) and India (Figure 15), respectively. Here, also both countries are showing a differentiated ranking for each country on green consumer value criteria for ranking evaluation. The overall comparison is evaluated and presented (Table 3) for the understanding of reality, comparing each energy source for both countries on each of the six criteria of green consumer values.

4. Discussion and Results

Decision criteria analysis with discussion is leading to the results that are presented in this section and subsections [68]. RESs are the focused area of energy generation expected to grow much faster in the coming future. The research is providing a critical evaluation on the green consumer value criteria for the selection of a specific RES. There are five RESs included in the study, namely solar energy, wind energy, hydro energy, geothermal energy, and biomass energy with the same six criteria of green consumer values for each [16,19]. The six criteria are represented as CRITERIA 1, CRITERIA 2, CRITERIA 3, CRITERIA 4, CRITERIA 5, and CRITERIA 6, respectively, coded for related items. These criteria are evaluated statistically to provide the structured understanding of the conclusion and one-shot (Table 3) understanding of ranking criteria.

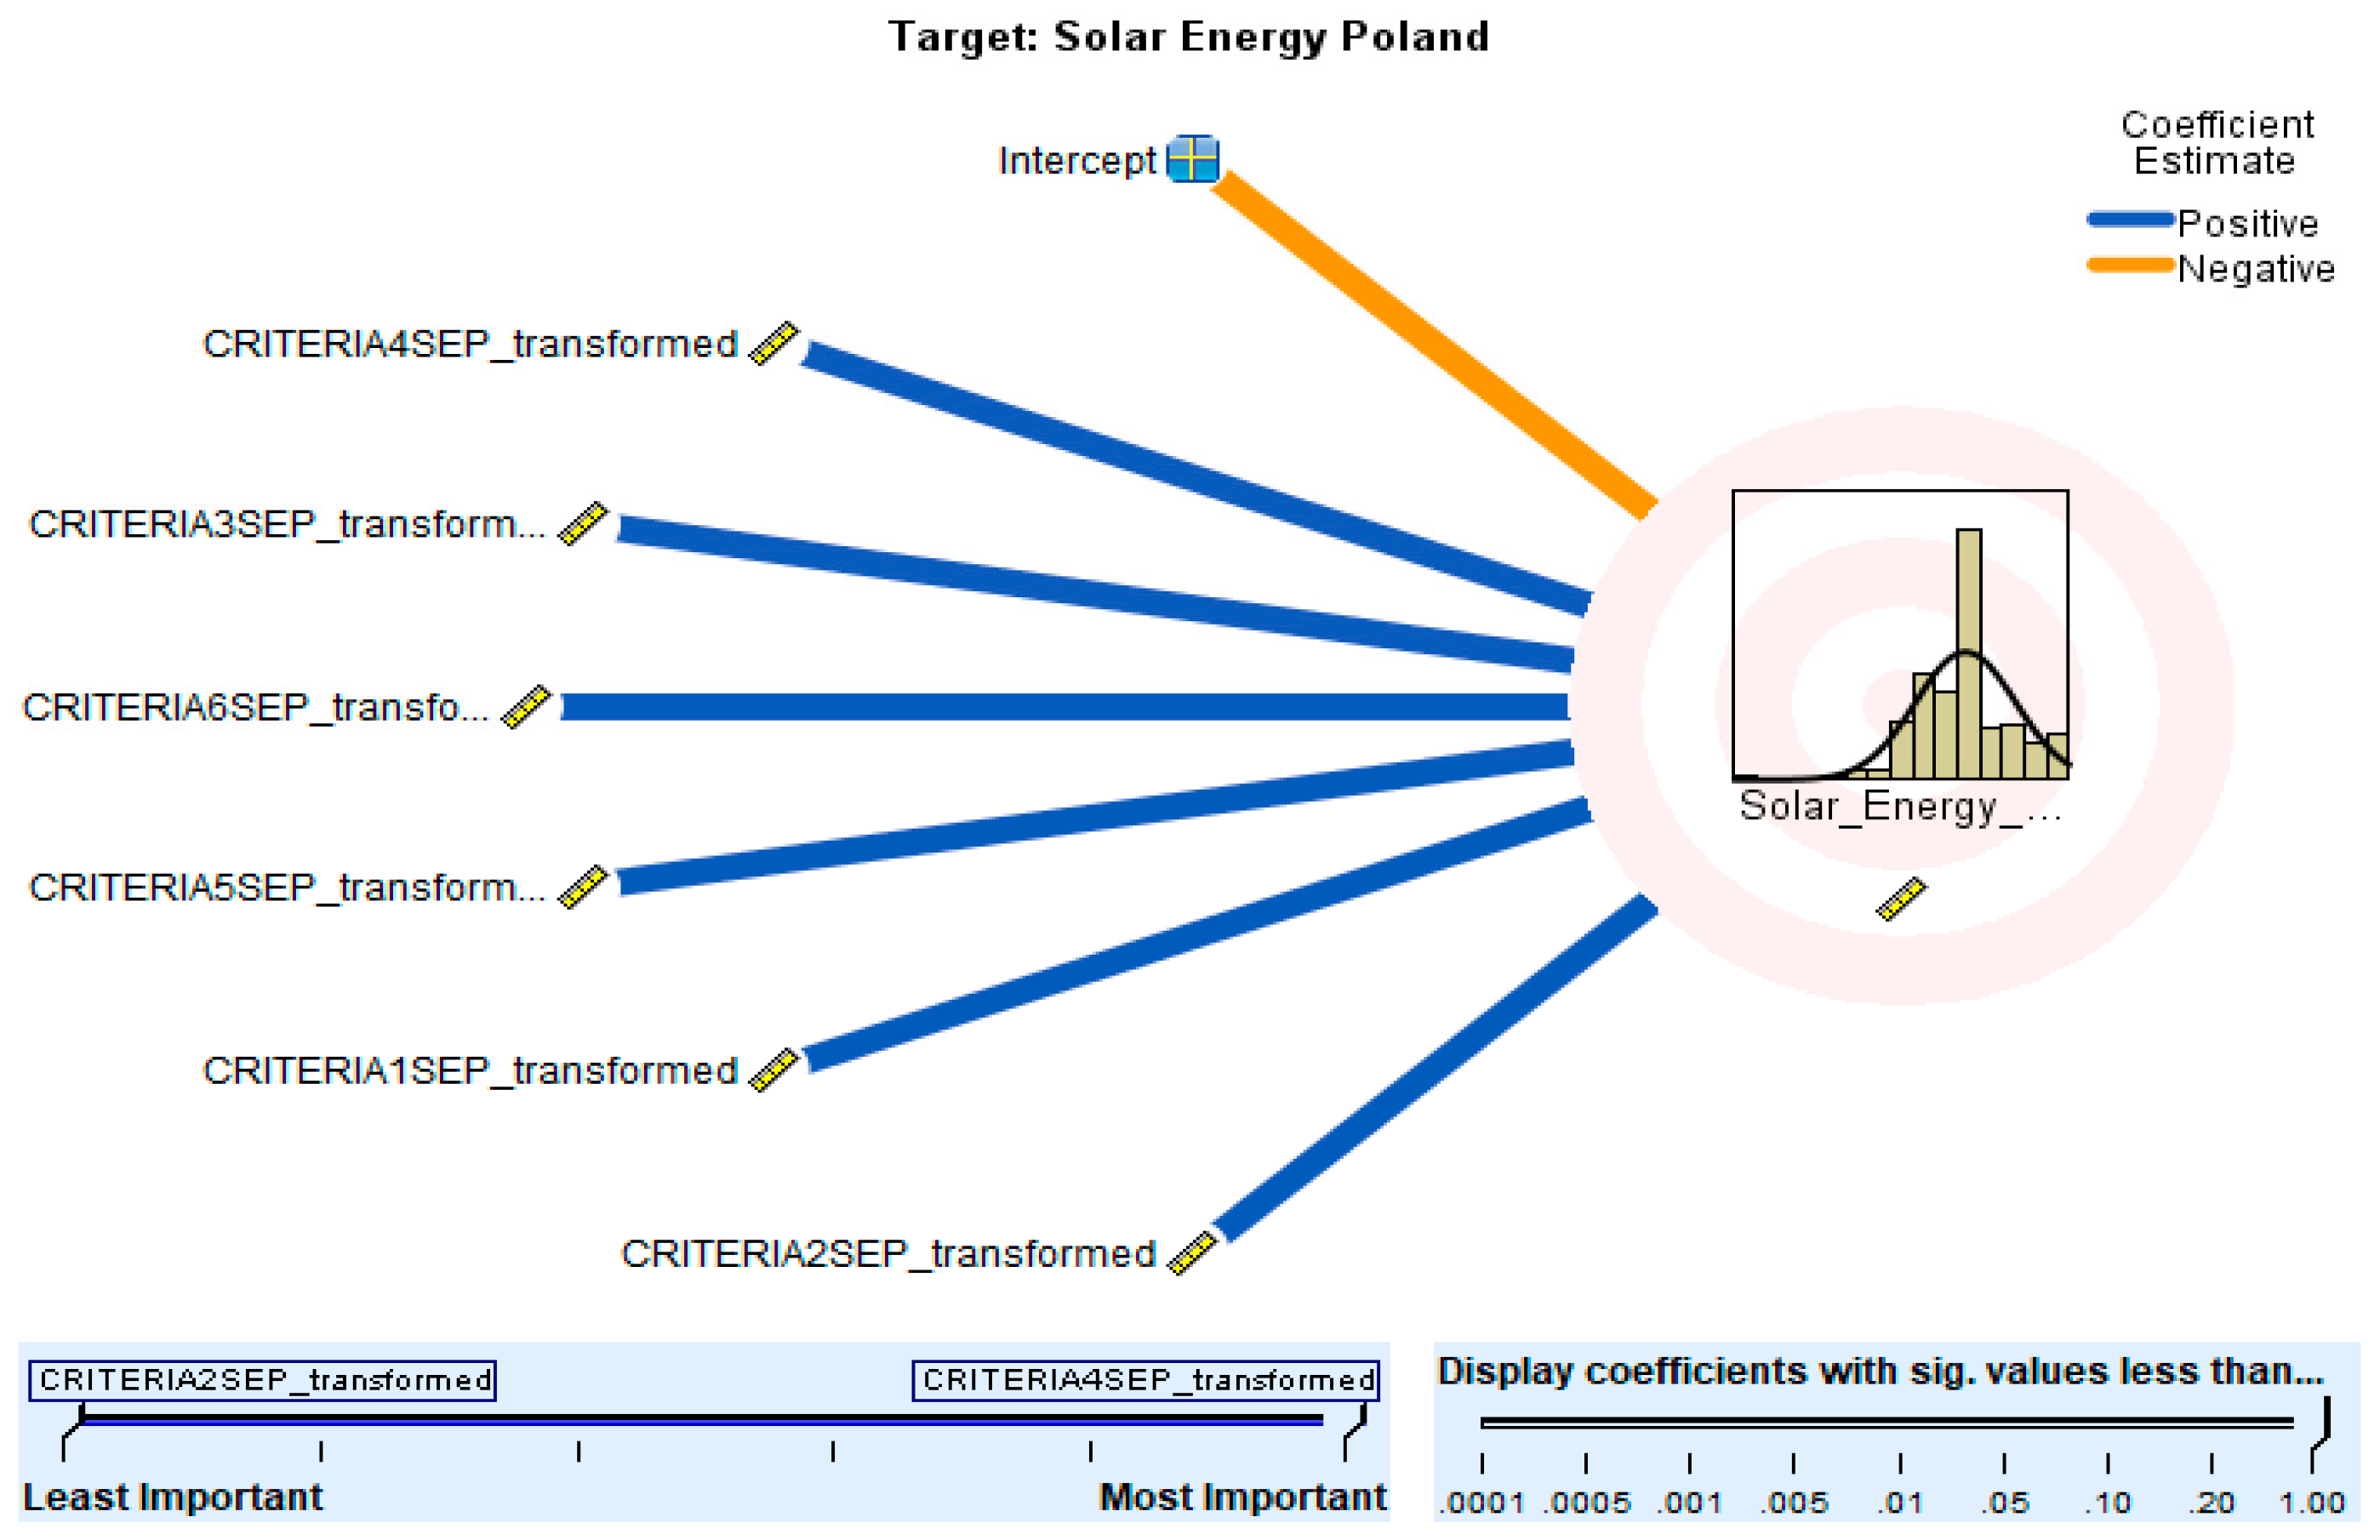
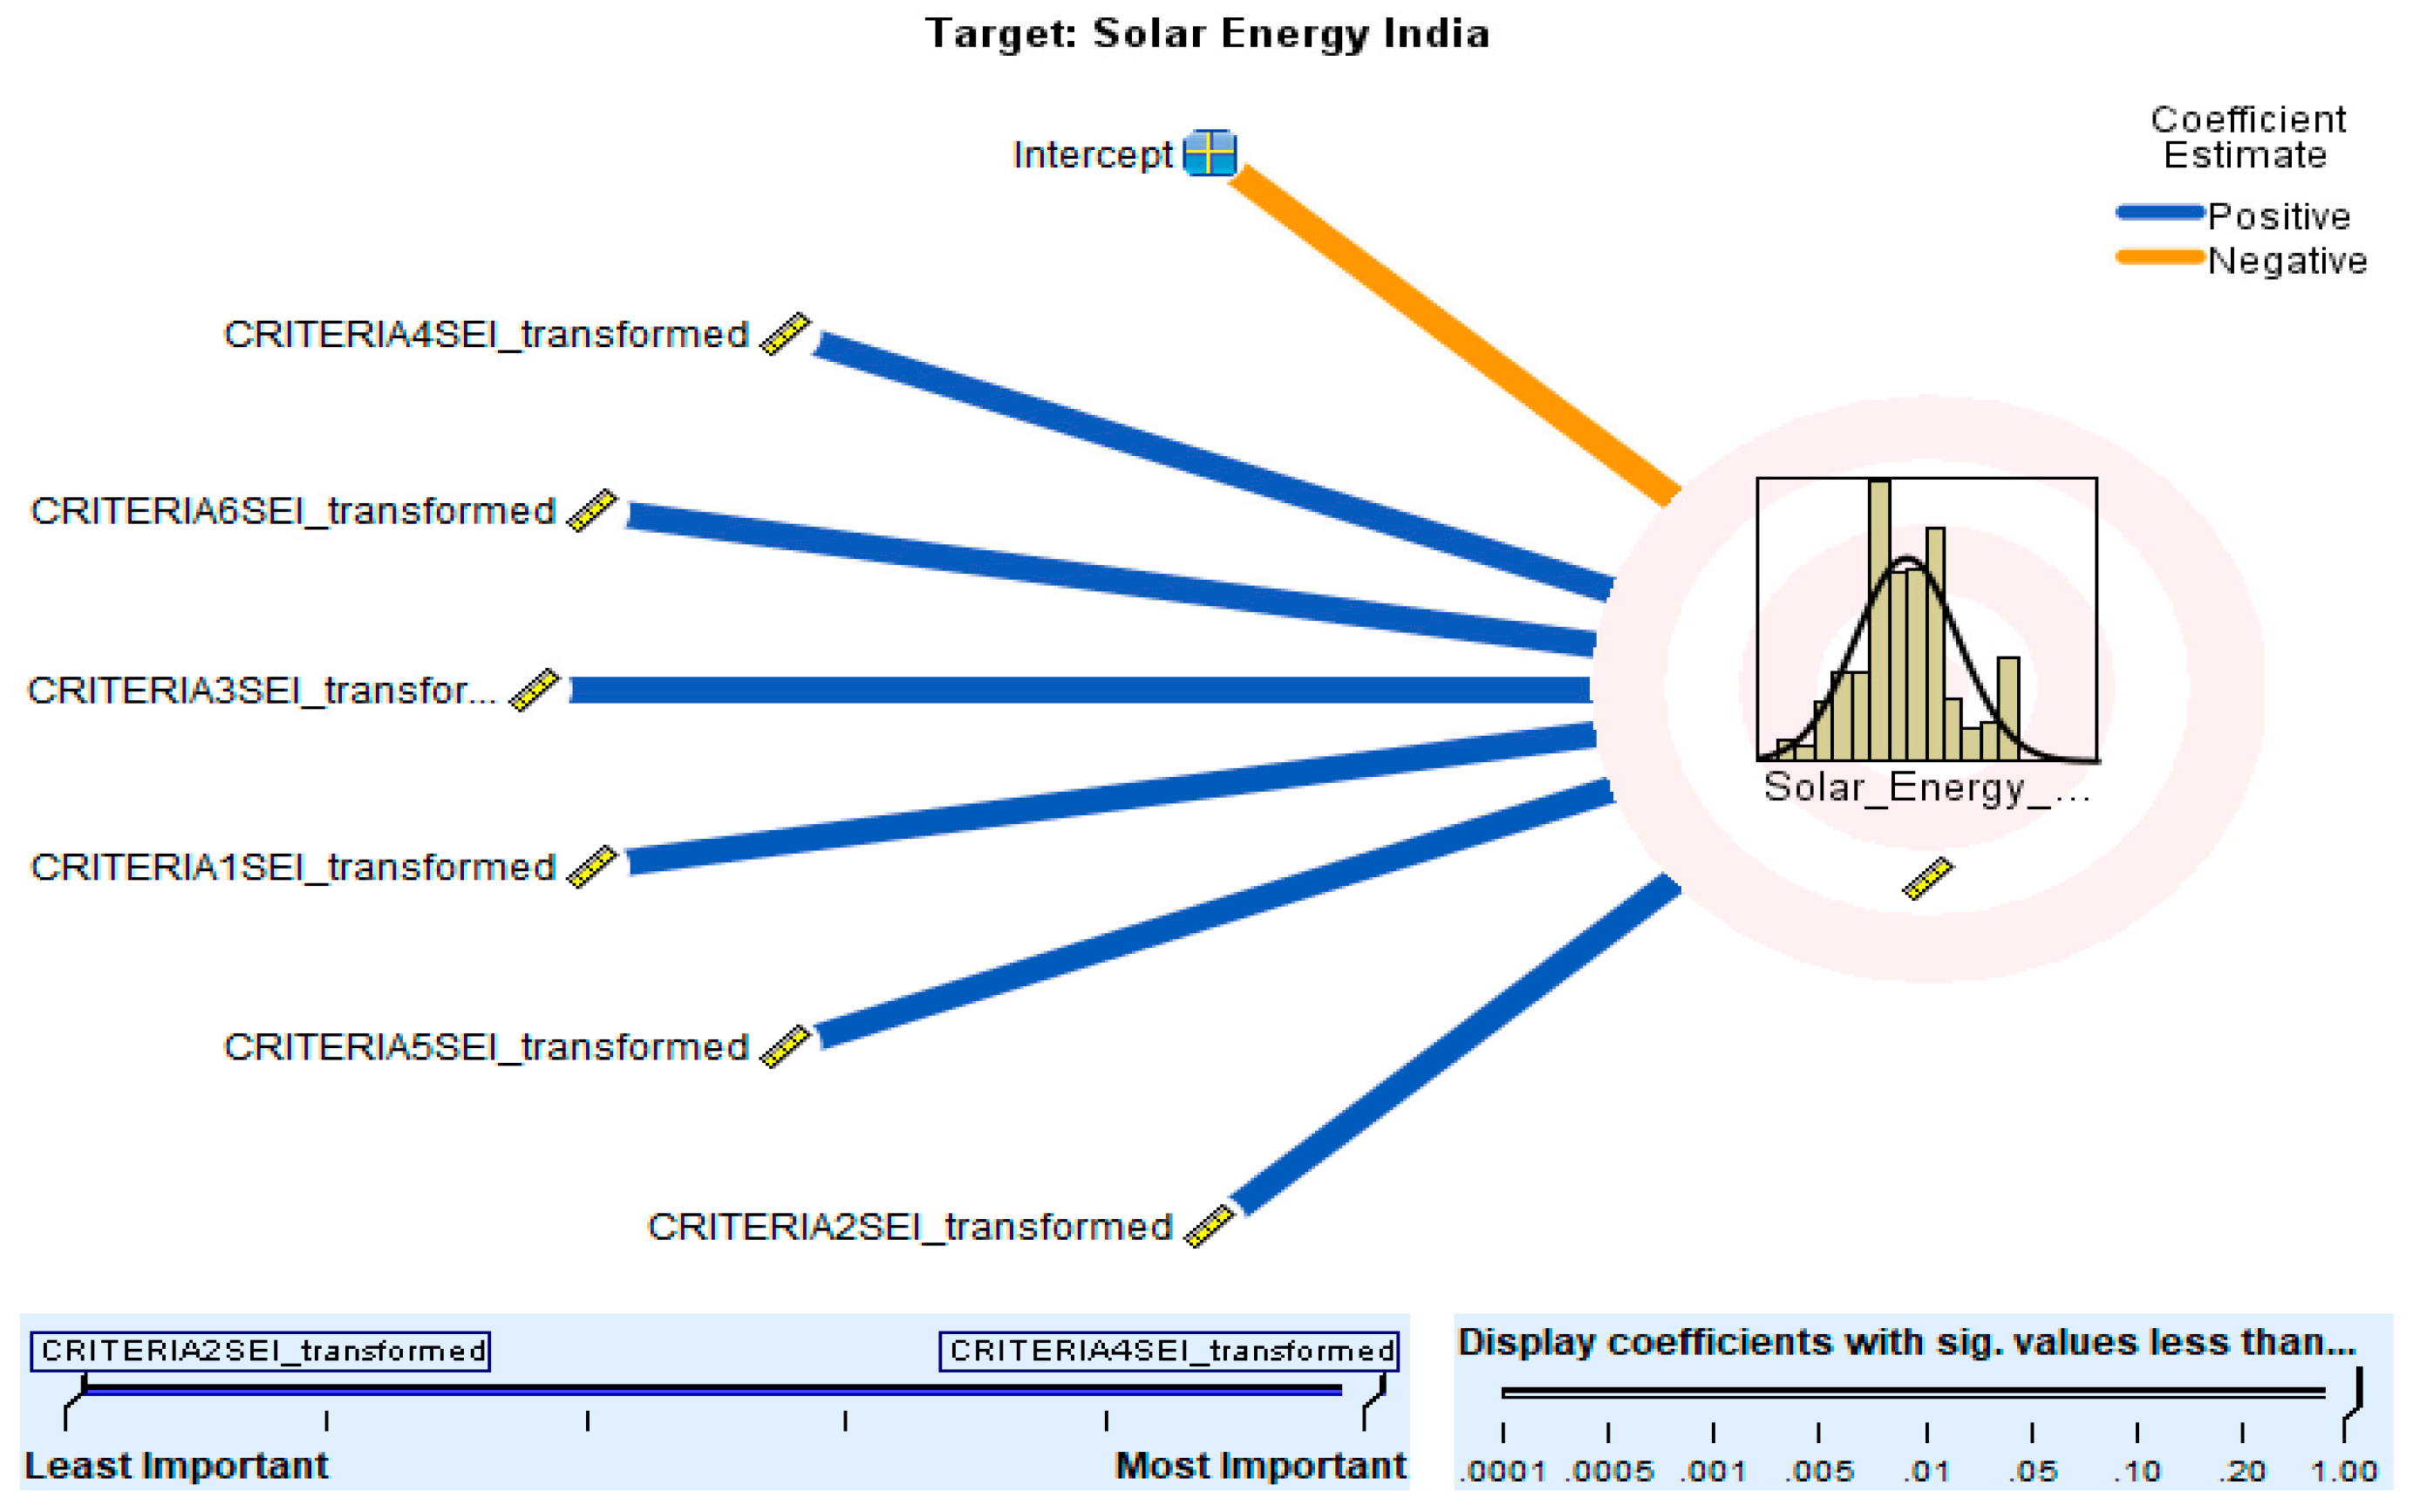
4.1. Solar Energy—Green Consumer Value Criteria Ranking and Comparison

The decision criteria ranking for green consumer values of solar energy is evaluated for Poland and India based on primary data collected [60]. As per the analysis, CRITERIA 4 is the most important with the importance value 0.278, whereas CRITERIA 2 is the least important with a 0.108 importance value (Table 3). Other rankings are CRITERIA 3 (0.185), CRITERIA 6 (0.159), CRITERIA 5 (0.152), and CRITERIA 1 (0.119) in order of importance (Figure 6). At the same time the analysis for India is showing the same results, as CRITERIA 4 is the most important with the importance value 0.228, whereas CRITERIA 2 is the least important with 0.101 importance value (Table 3). Other rankings are CRITERIA 6 (0.207), CRITERIA 3 (0.192), CRITERIA 1 (0.154), and CRITERIA 5 (0.117) with their respective importance values (Figure 7).

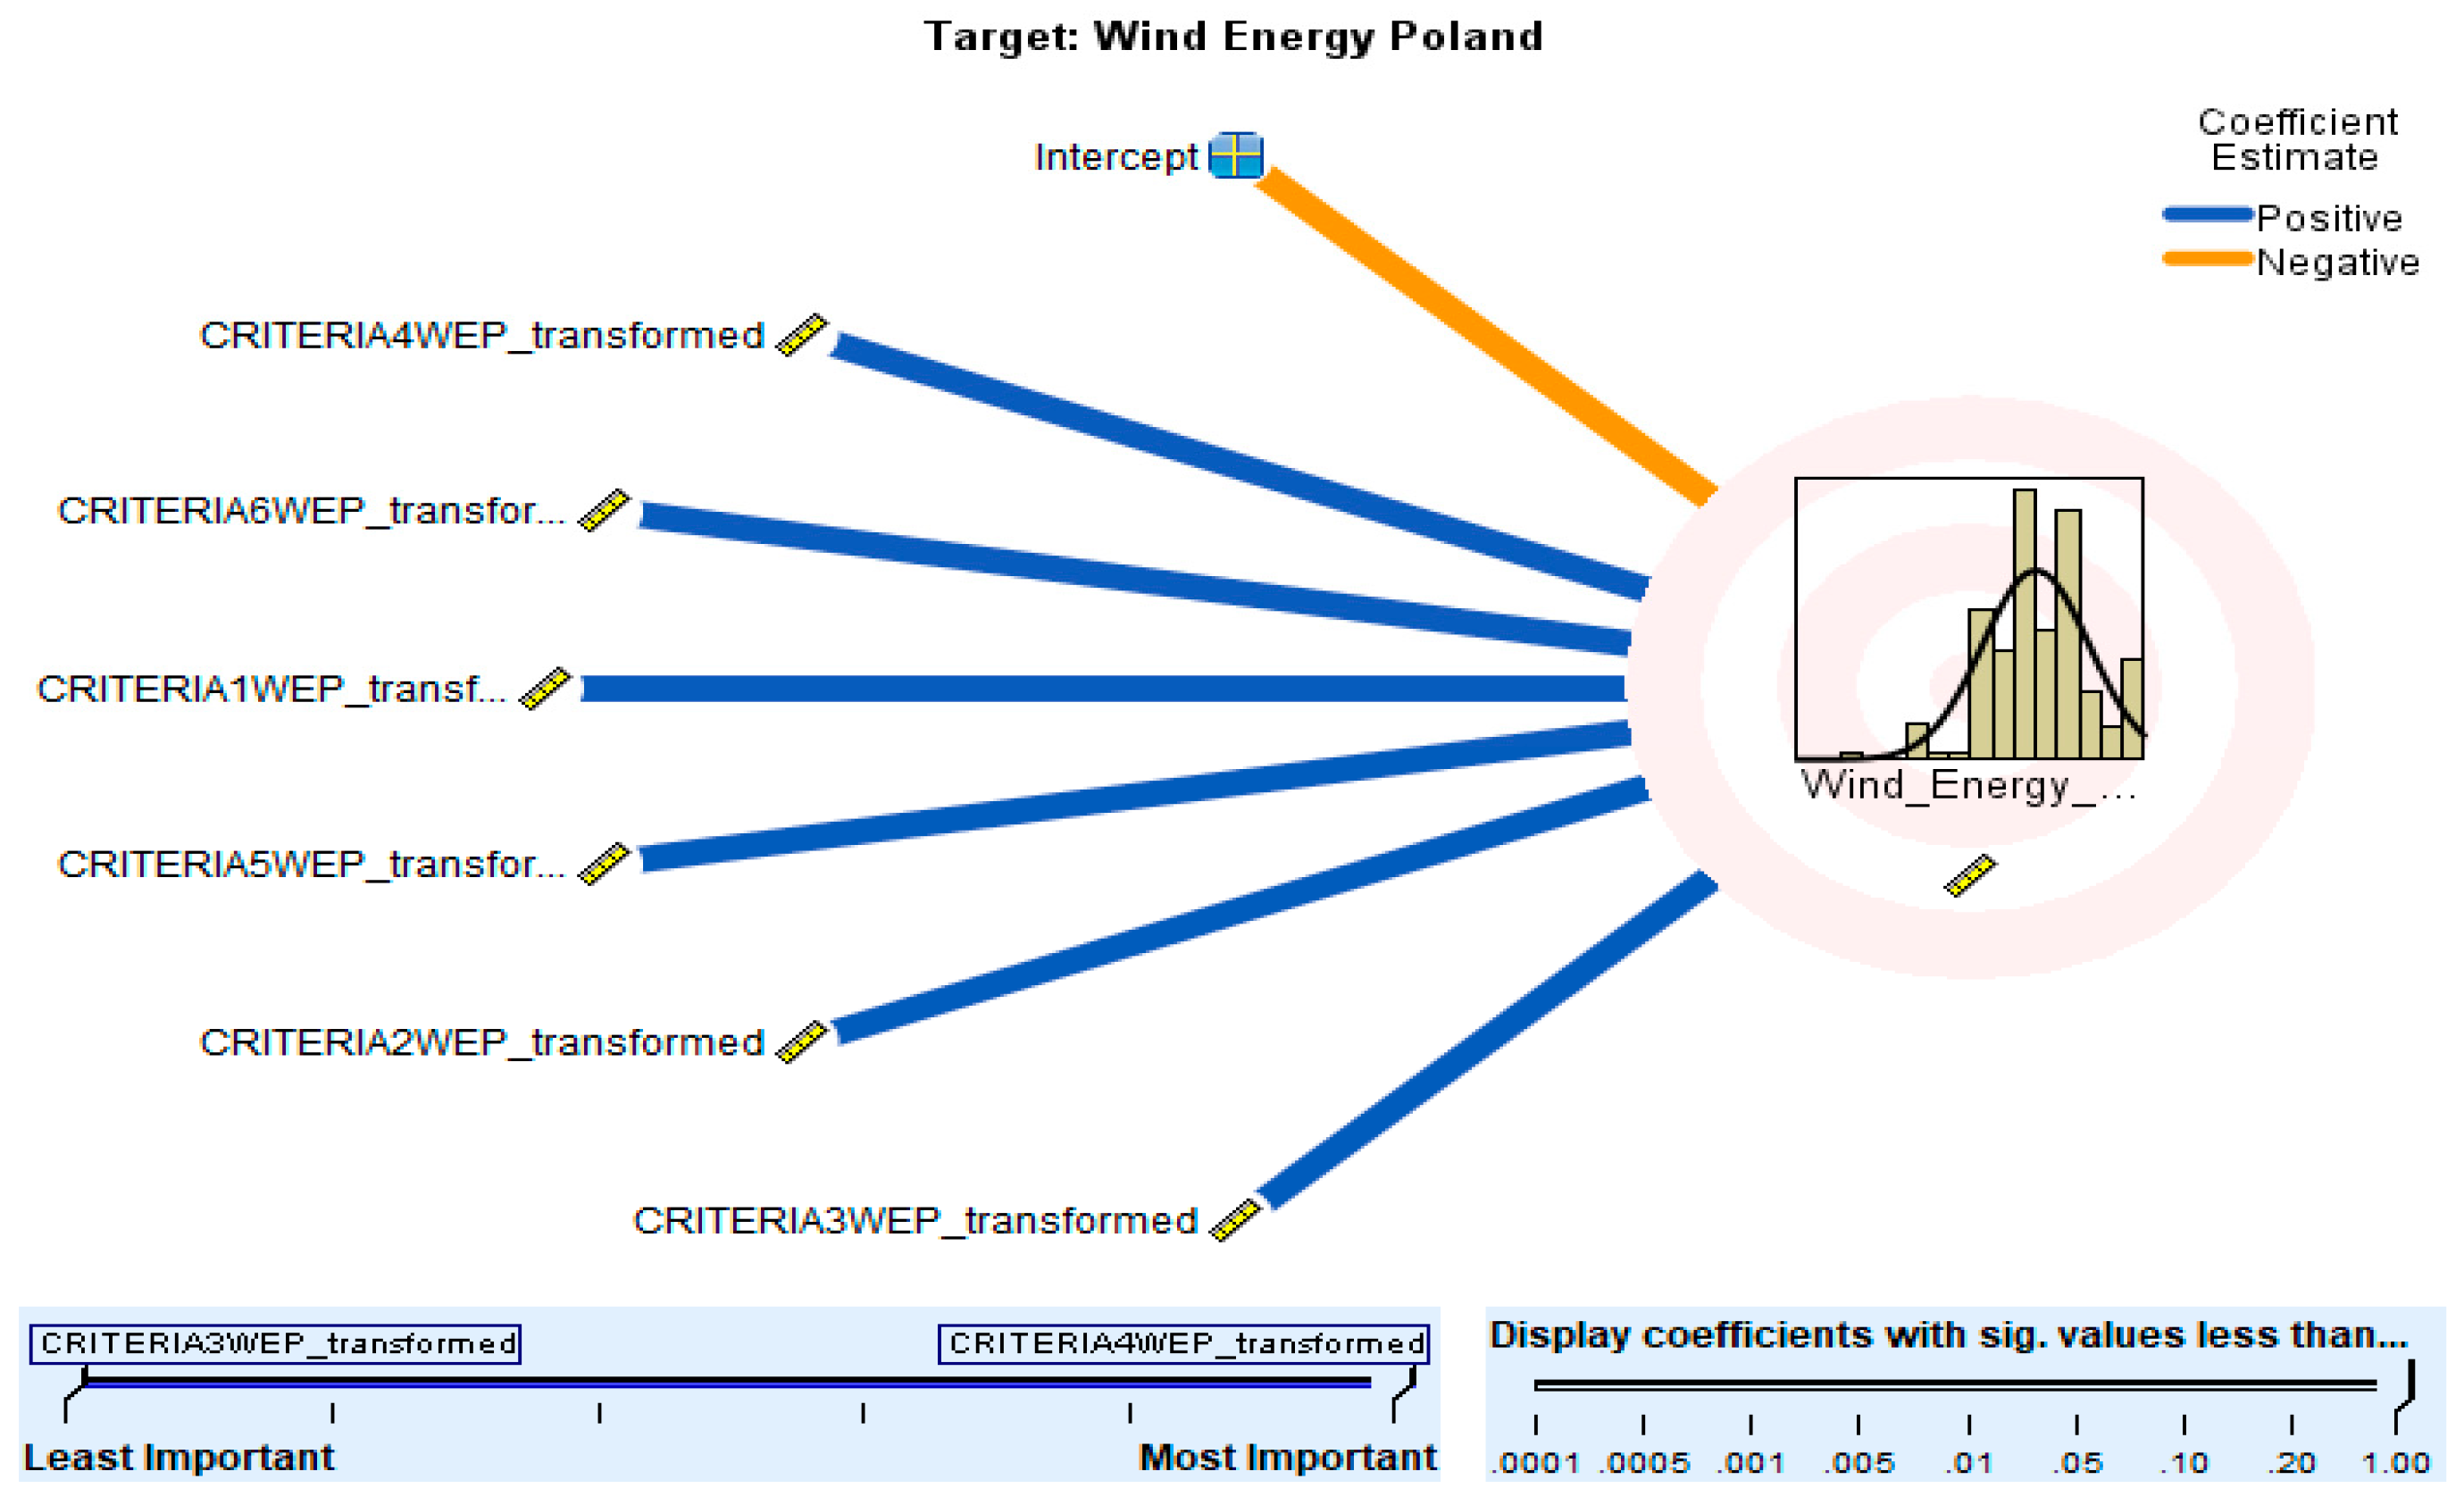
4.2. Wind Energy—Green Consumer Value Criteria Ranking and Comparison

Wind energy decision criteria for green consumer values shows that Poland looks at CRITERIA 4 again as the most important criteria with the importance value of 0.327, though the least important is CRITERIA 3 with a 0.100 importance value. Others are CRITERIA 6 (0.174), CRITERIA 1 (0.145), CRITERIA 5 (0.144), and CRITERIA 2 (0.110), presented (Figure 8) in decreasing order (Table 3), whereas India also shows the most important CRITERIA 4, with a 0.207 importance value, and the least is CRITERIA 5, with a 0.141 importance value. Others in the ranking are CRITERIA 3 (0.198), CRITERIA 1 (0.158), CRITERIA 2 (0.155), and CRITERIA 6 (0.142), shown (Table 3) with their importance values (Figure 9). The other subsections will provide insight on other RESs to obtain a reality check of criteria importance [67,68,69].

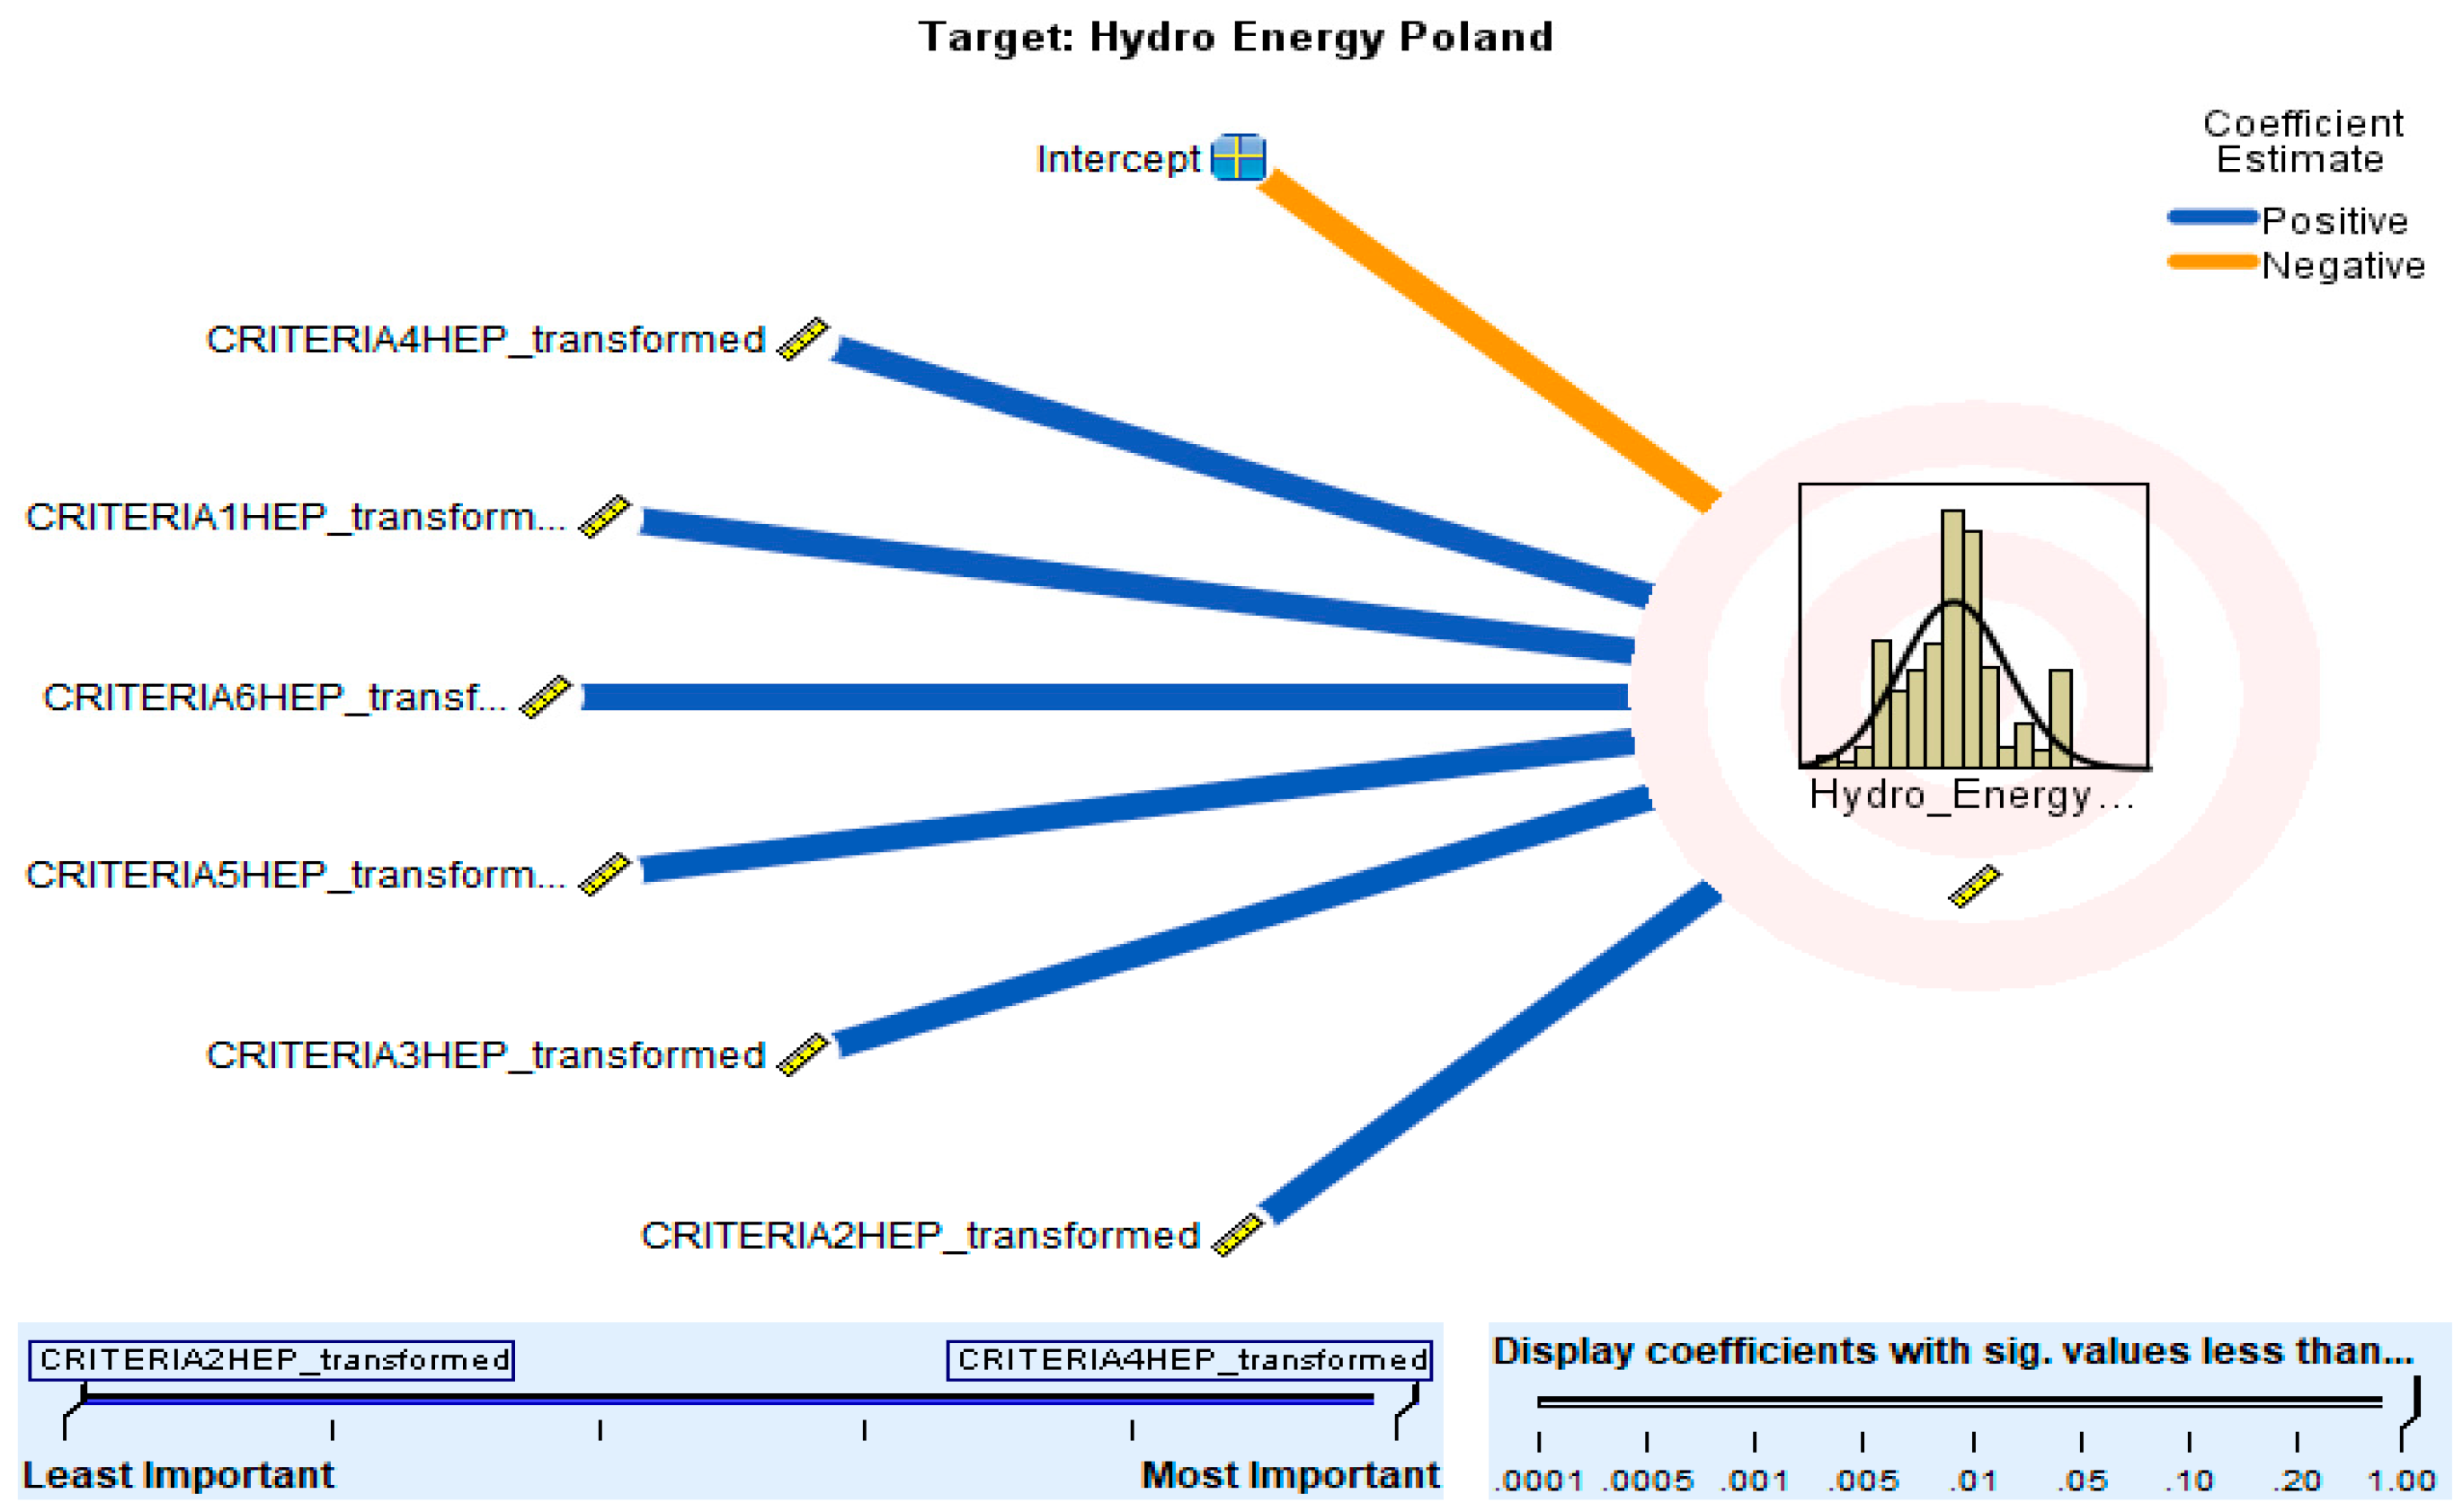
4.3. Hydro Energy—Green Consumer Value Criteria Ranking and Comparison

Decision criteria analysis for hydro energy in the context of Poland shows CRITERIA 4 is the most important with the importance value of 0.257, whereas the CRITERIA 2 is the least important with a 0.116 importance value (Table 3). Other ranking are CRITERIA 1 (0.192), CRITERIA 6 (0.168), CRITERIA 5 (0.152), and CRITERIA 3 (0.116), respectively, showing the preference rank by respondents in Poland (Figure 10). Further, India shows (Figure 11) CRITERIA 3 as the most important with the value 0.249 of importance, whereas CRITERIA 5 is the least important with a 0.099 importance value. Others are CRITERIA 4 (0.224), CRITERIA 1 (0.157), CRITERIA 6 (0.149), and CRITERIA 2 (0.121) with their respective importance values (Table 3) [19].

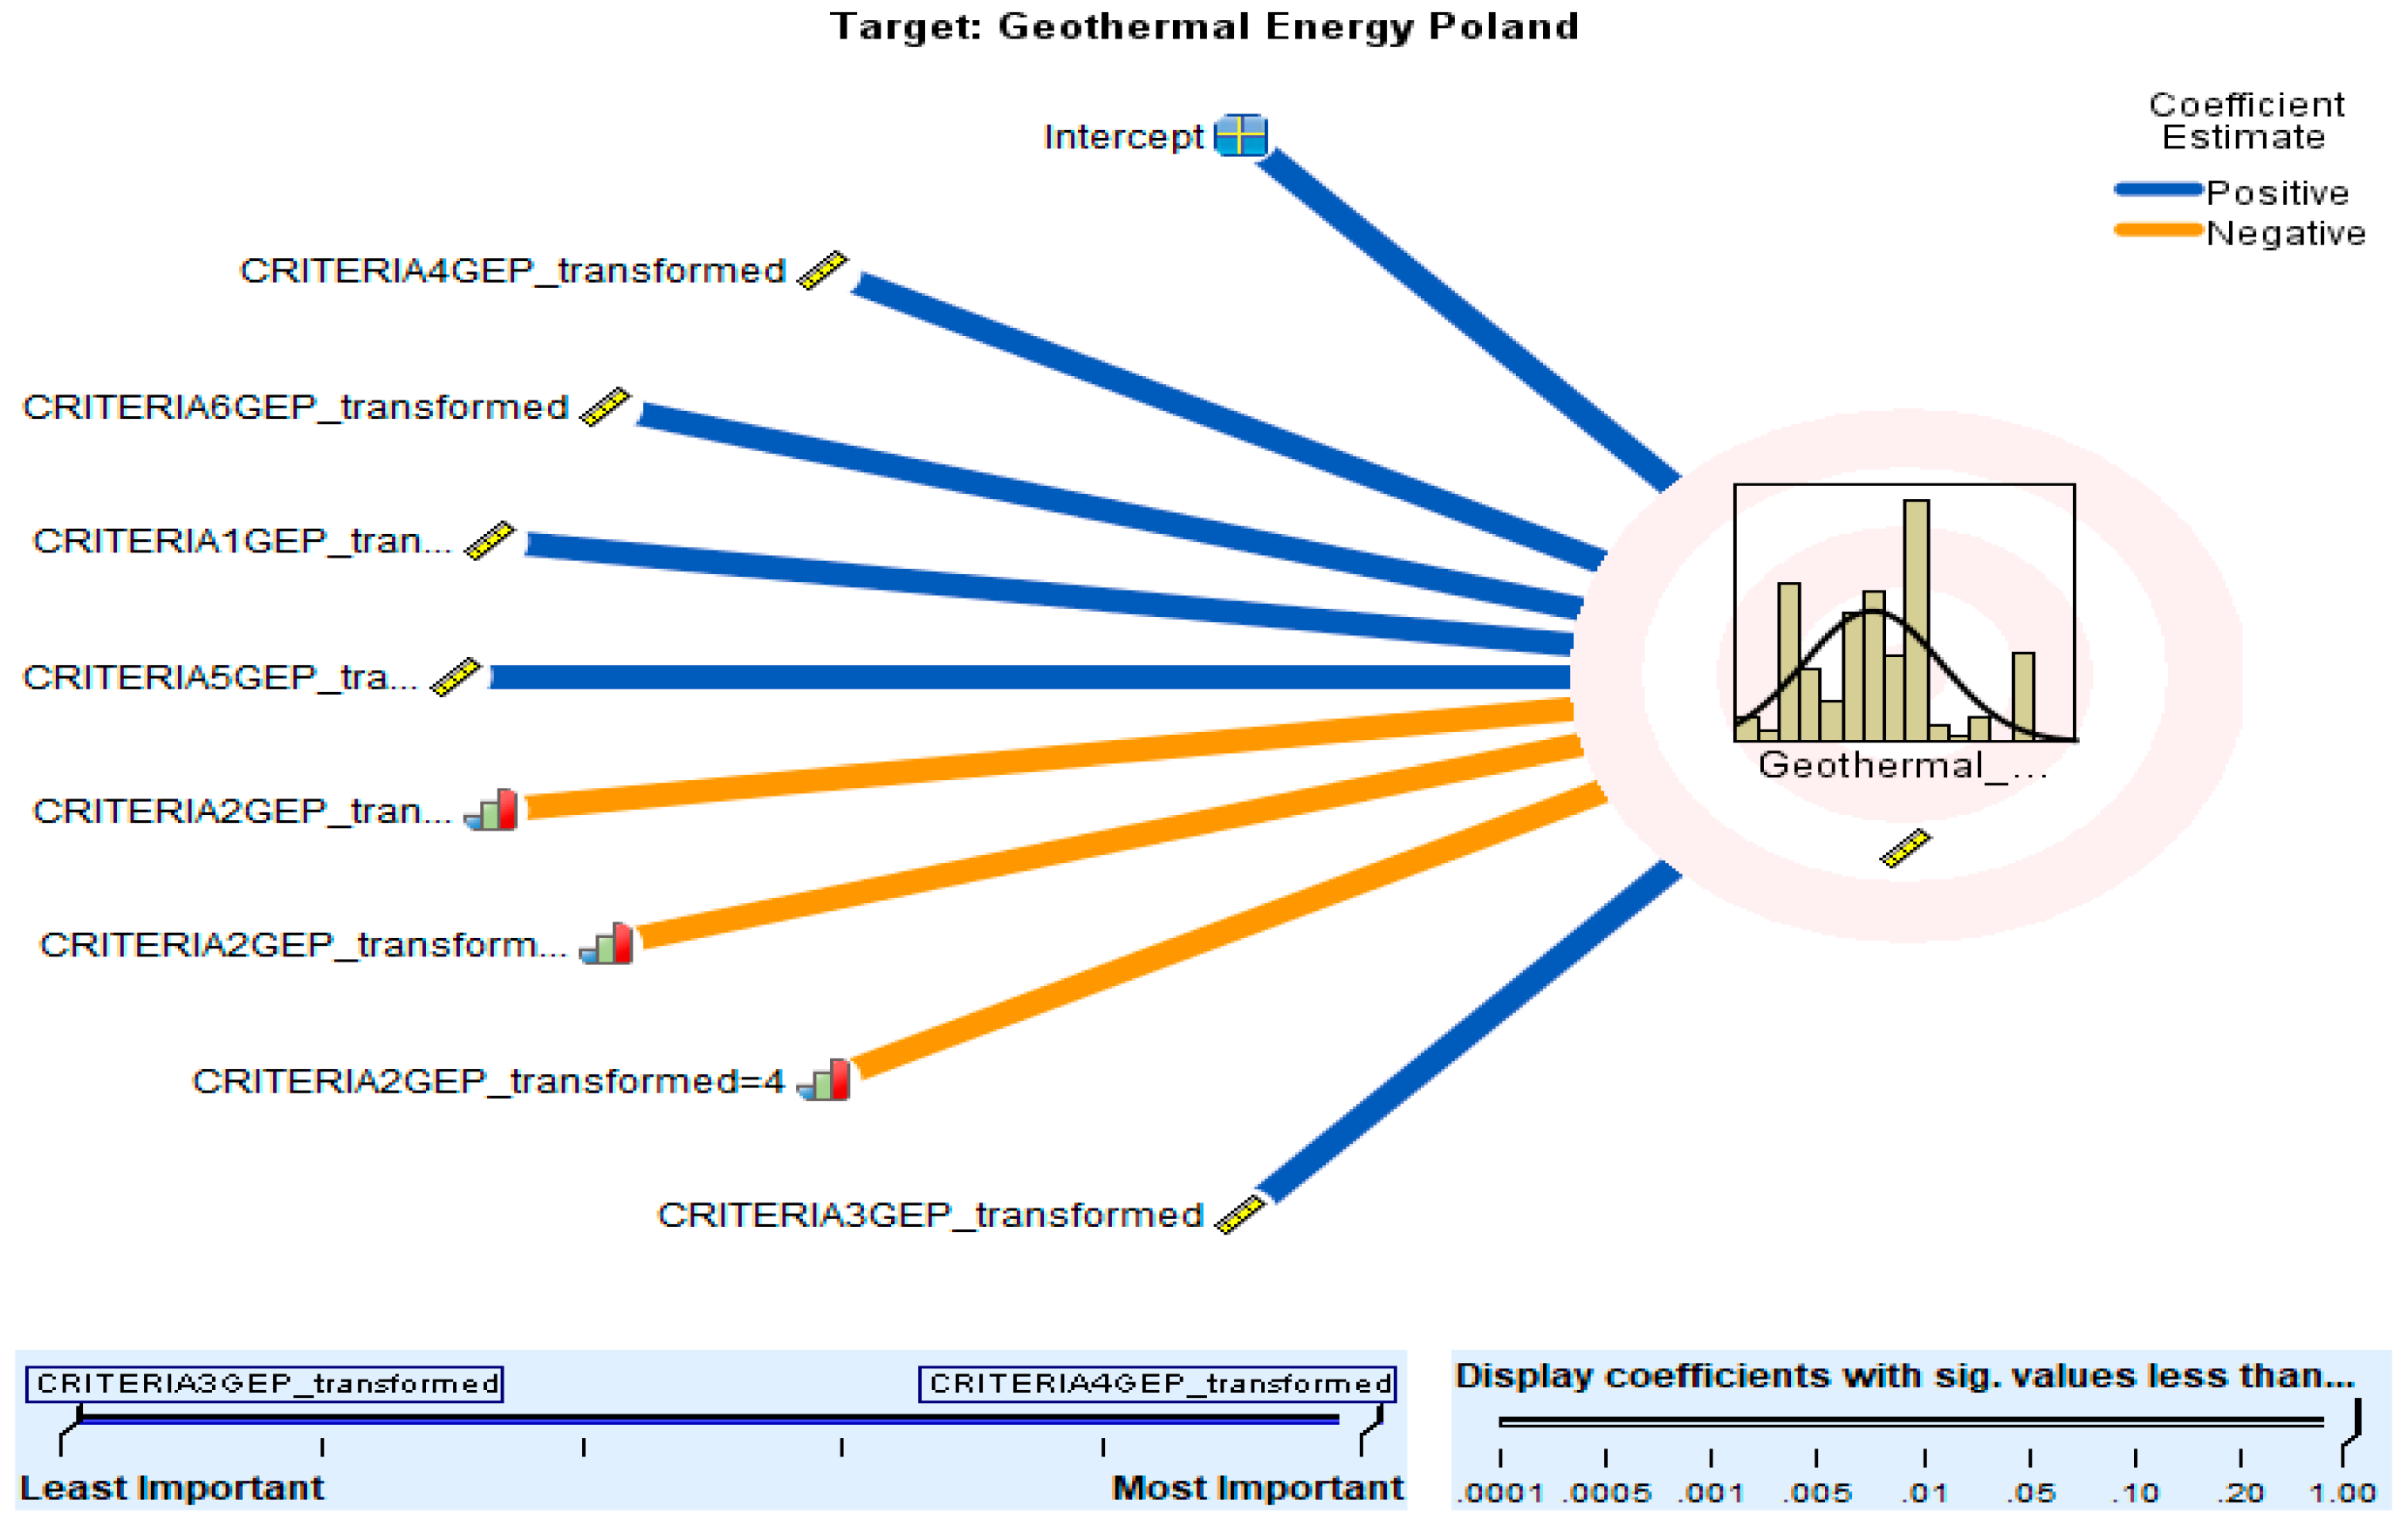
4.4. Geothermal Energy—Green Consumer Value Criteria Ranking and Comparison

The selection of specific criteria in the case of geothermal energy again shows that CRITERIA 4 is the most important with a value of 0.273 for importance (Table 3), and CRITERIA 3 with an importance value of 0.106 is valued as the least important for Poland (Figure 12). The reducing importance series is CRITERIA 6 (0.203), CRITERIA 1 (0.173), CRITERIA 5 (0.136), and CRITERIA 2 (0.110) with their respective importance values for Poland [69]. India shows that the most important is CRITERIA 6 with a 0.261 importance value, and the least important is CRITERIA 1 with a 0.108 value of importance (Figure 13). Others are CRITERIA 3 (0.180), CRITERIA 5 (0.155), CRITERIA 4 (0.153), and CRITERIA 2 (0.142) in the order of decreasing importance (Table 3).

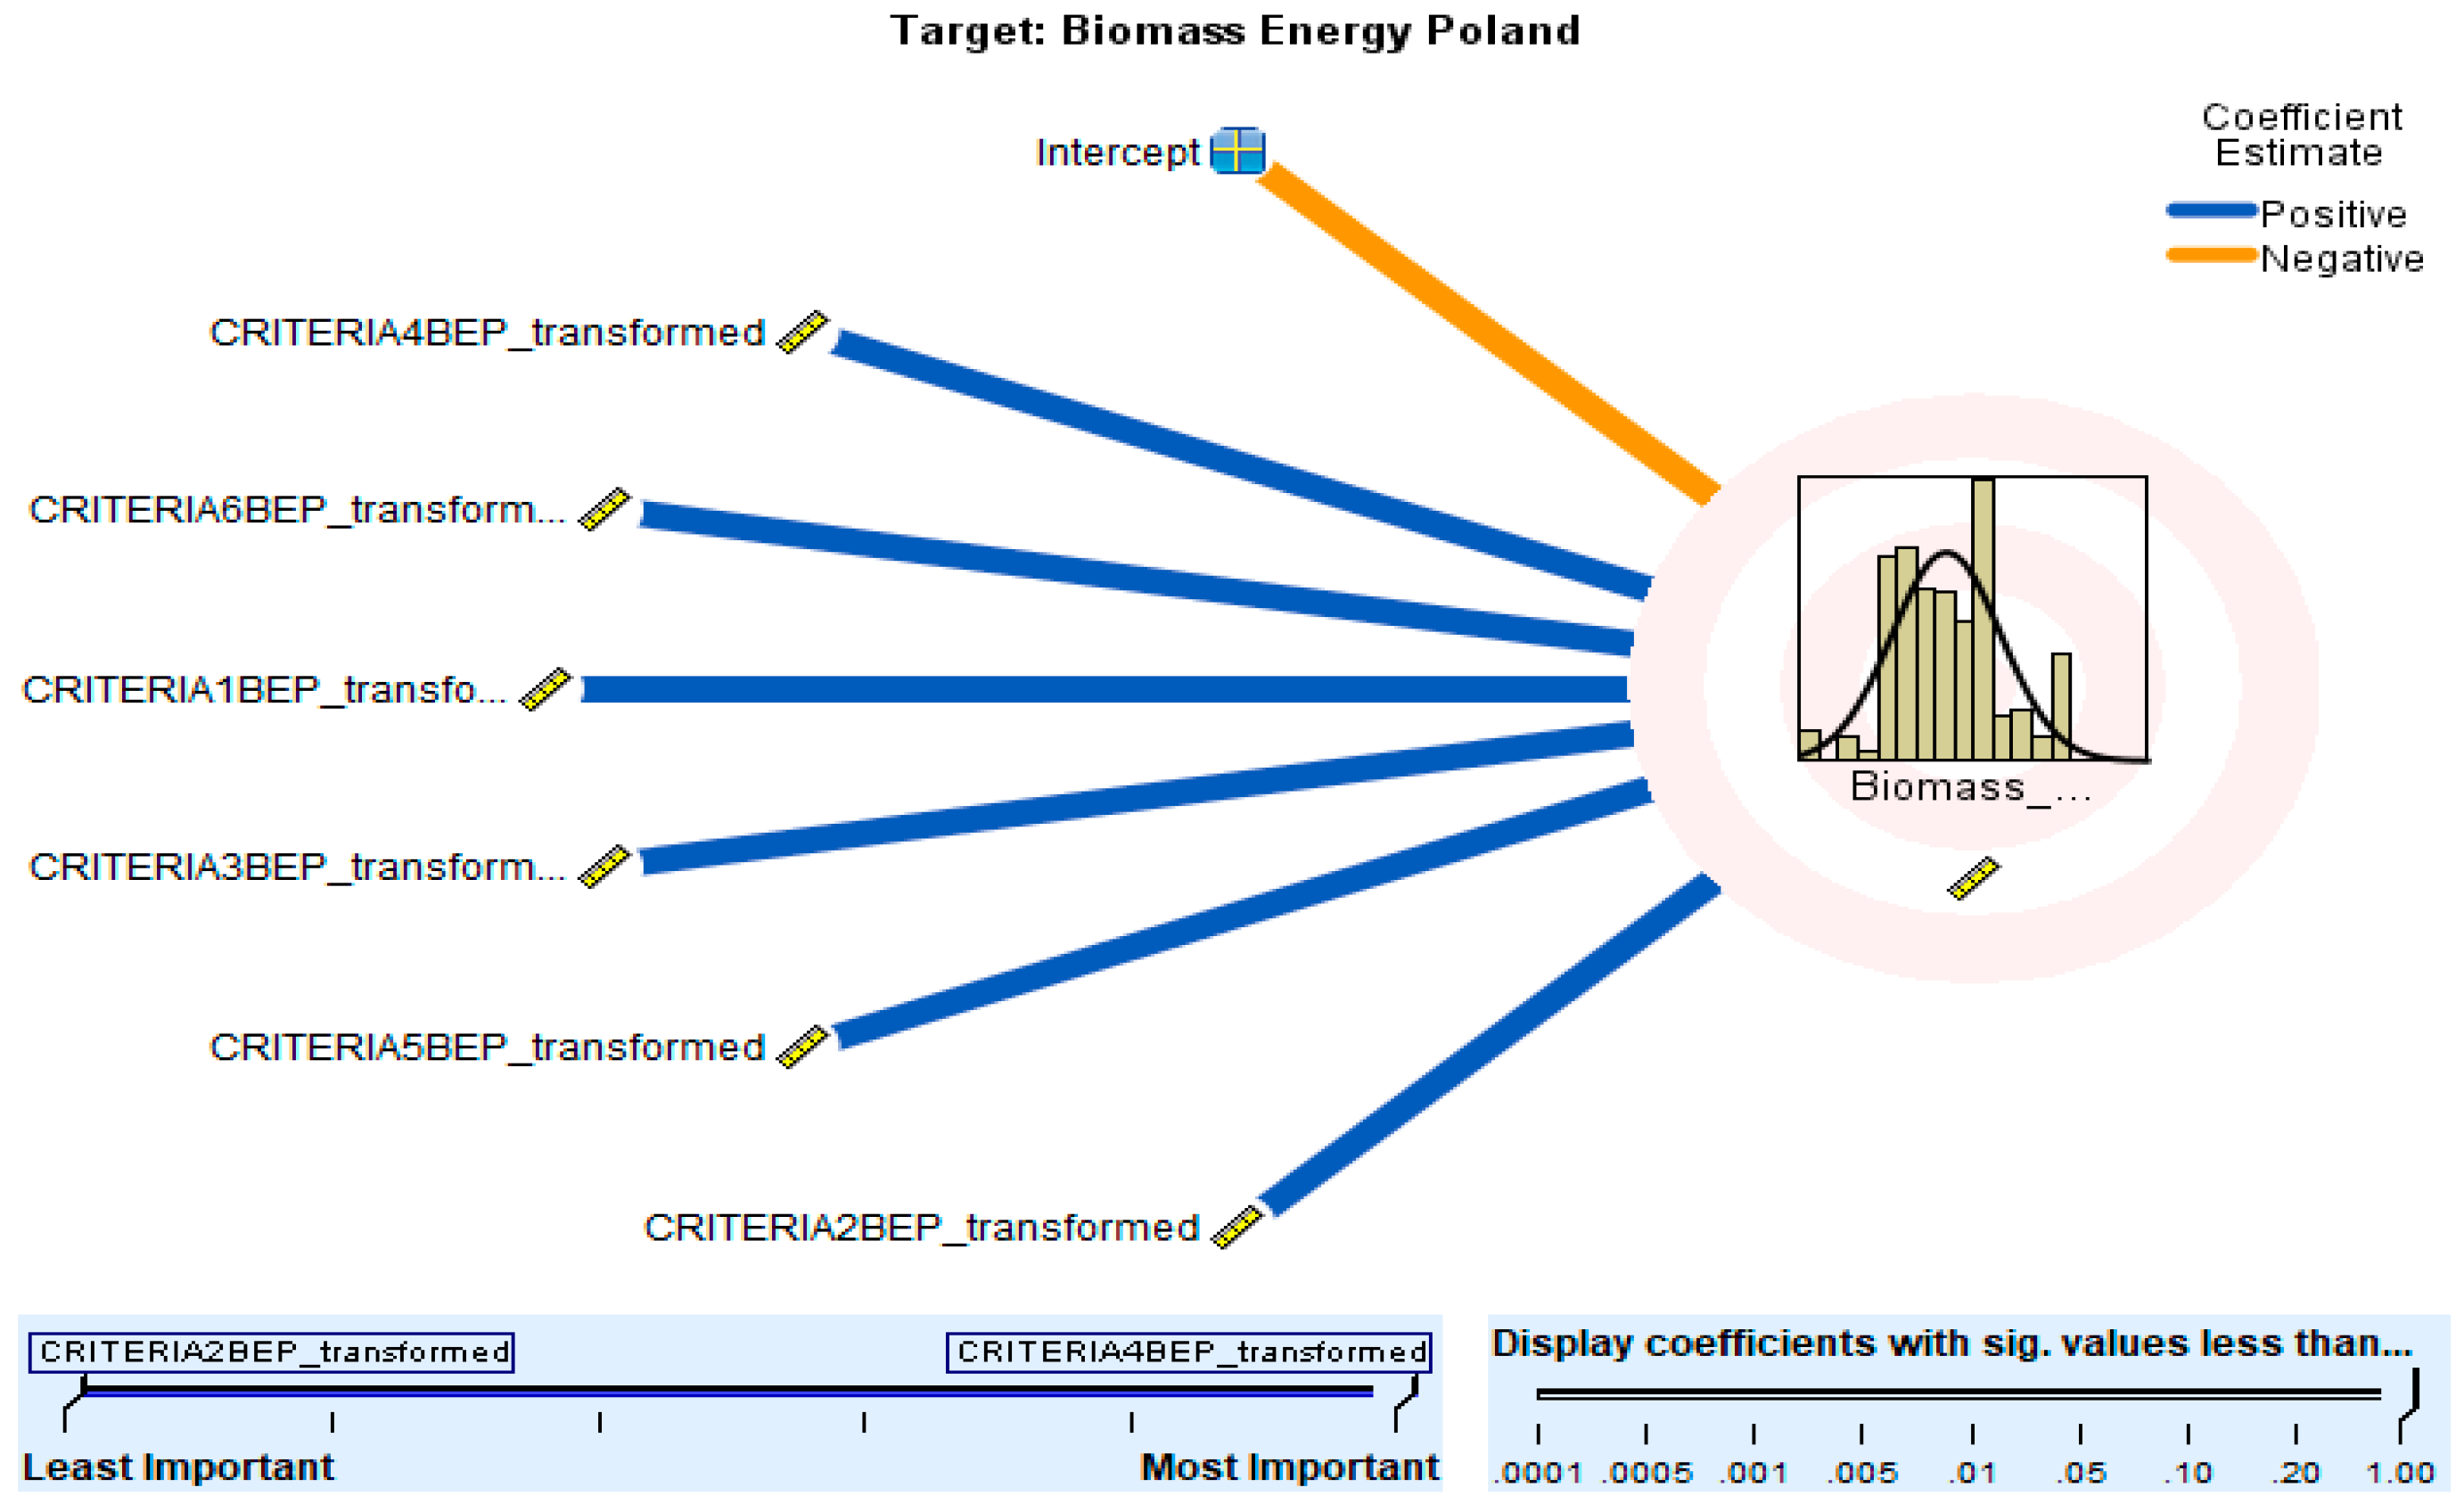
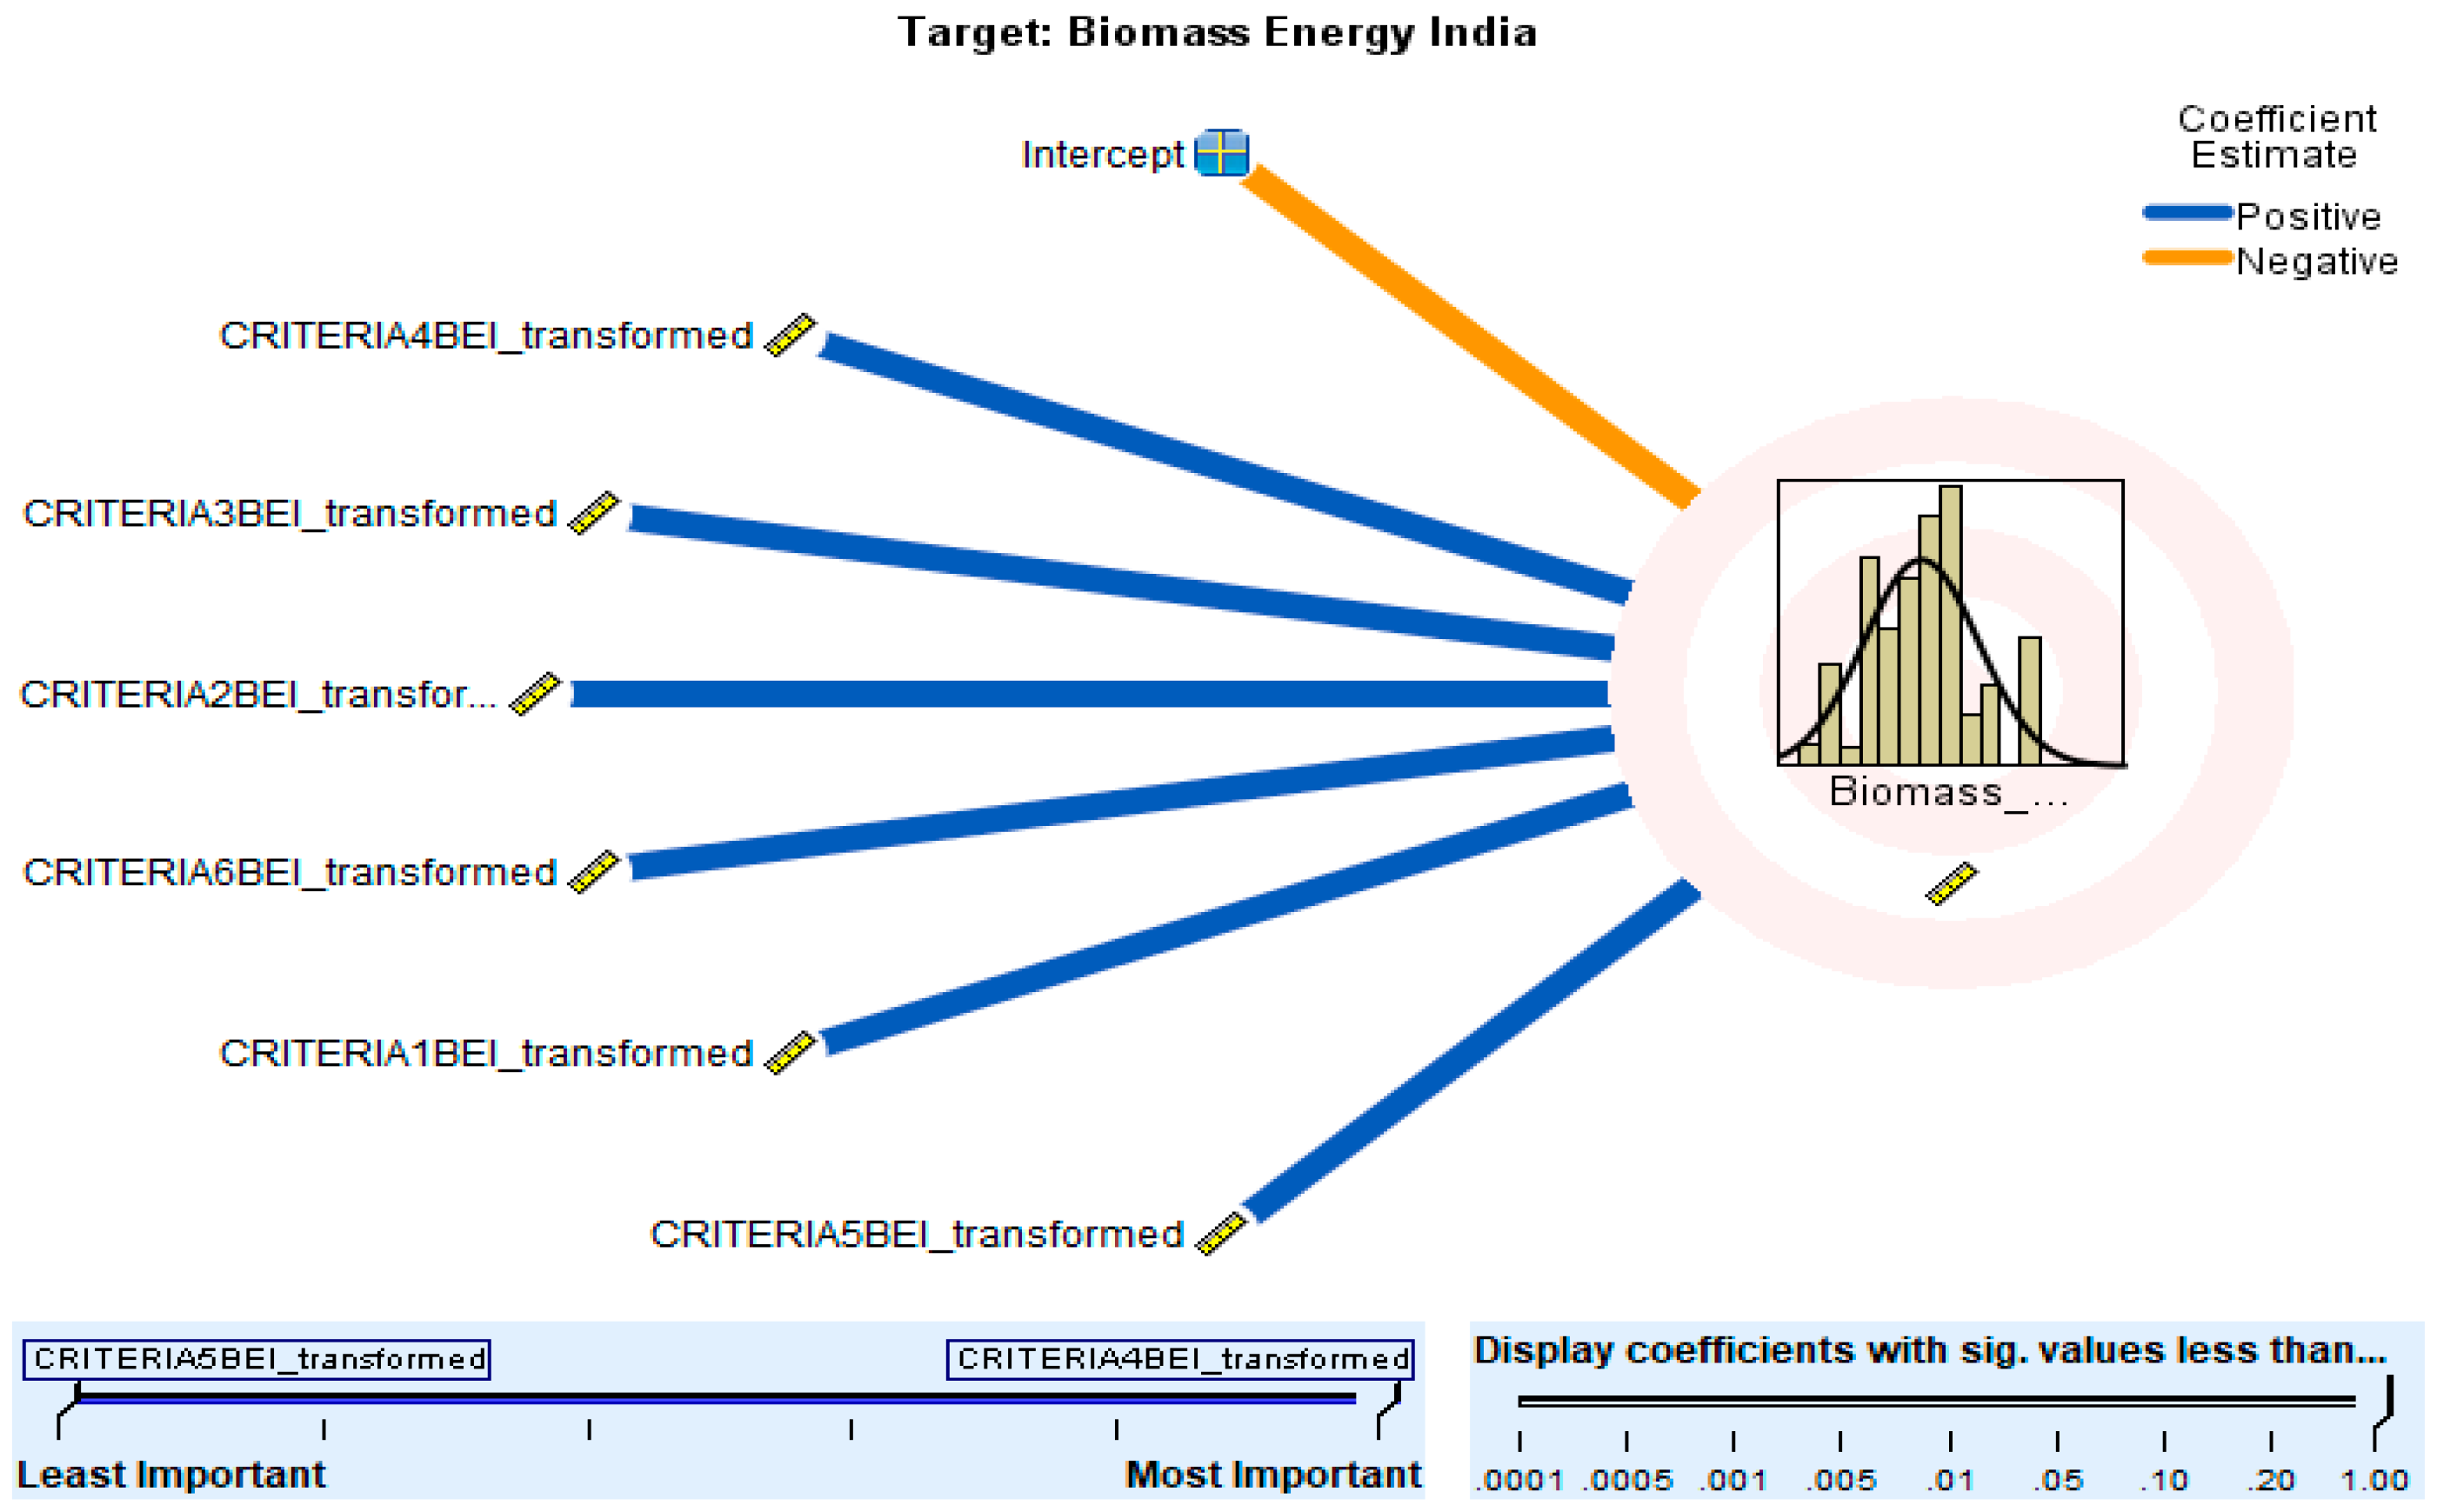
4.5. Biomass Energy—Green Consumer Value Criteria Ranking and Comparison

The fifth category of RESs is biomass energy analysis for decision criteria, which shows that CRITERIA 4 is the most important with the importance value of 0.233, whereas CRITERIA 2 is the least important with a 0.095 importance value (Table 3). The others are ranked as CRITERIA 6 (0.233), CRITERIA 1 (0.174), CRITERIA 3 (0.150), and CRITERIA 5 (0.125) in decreasing order of importance with their respective importance values (Figure 14). In the context of India, again, CRITERIA 4 is the most important with the importance value of 0.209 (Table 3), and CRITERIA 5 is the least important, with a 0.124 importance value (Figure 15). Further rankings are presented as CRITERIA 3 (0.207), CRITERIA 2 (0.172), CRITERIA 6 (0.155), and CRITERIA 1 (0.134) in the order of decreasing importance in India. The outcome is further summarized for better understanding [60].

4.6. Renewable Energy Green Consumer Value Criteria Assessment

This subsection provides the snapshot of the above-discussed results [70]. Solar energy has CRITERIA 4 as the most important and CRITERIA 2 as the least important for both countries, though Poland a higher importance value than India. Wind energy displays CRITERIA 4 as the most important for both countries, and the least important is CRITERIA 3 for Poland and CRITERIA 5 for India, though Poland has a higher importance value than India. For hydro energy, CRITERIA 4 is the most important for Poland, and CRITERIA 3 is for India, whereas the least is CRITERIA 2 and CRITERIA 5 for Poland and India, respectively, with a higher importance value for Poland in mostly cases. Geothermal energy has CRITERIA 4 as the most important and CRITERIA 3 as the least important for Poland. India shows that the most important is CRITERIA 6, and the least important is CRITERIA 1. Here, the opinion is very scattered due to a lack of proper information. Biomass energy analysis for decision criteria shows that CRITERIA 4 is the most important and CRITERIA 2 is the least important for Poland. India shows CRITERIA 4 as the most important and CRITERIA 5 as the least important [60].

5. Conclusions and Future Research

The study has conducted a detailed discussion to answer questions raised in the first section of the research. Question 1 ‘Why is the Green Consumer Value important in the consumption of renewable energy?’ was answered with the analysis (Table 3), stating that the green consumer value is different for different offerings of products and services. The answer for the question 2 ‘Does different decision criteria of green consumer value act differently on their importance for consumers?’ is very clear, with the importance values in decreasing order (Table 3) for each energy category for Poland (Figure 6, Figure 8, Figure 10, Figure 12 and Figure 14) and India (Figure 7, Figure 9, Figure 11, Figure 13 and Figure 15). The next is question 3—‘Is there any difference in Poland and India on their green consumer values for different RESs?’—and it can be seen that, yes, the green consumer values for Poland and India are different as they present (Table 3) different importance values. Question 4—‘Is there alignment of green consumer values with environment policy?’—is answered with yes, because the green consumer values are the SDG 12—Responsible Consumption and Production, which is essential to implement. RESs consumption will decide the future of energy consumption. The last question 5—‘Does Poland and India commit to follow the path of sustainable development?’—can be seen for Poland (Figure 8) and India (Table 2), showing an aggressive move towards keeping themselves committed to sustainable development.
The research problem found a solution in the process of answering questions that the hierarchy ranking (Table 3) developed on a comparison base of the six criteria of green consumer values of five RESs for Poland and India. The categorization is based on the importance value in decreasing order from top to bottom in the set of six criteria. The solution to the problem is agreeing with the justification for Poland (Figure 5) and India (Table 2) as strategic countries of Europe and Asia, respectively. Both countries are committed to sustainability, aligning themselves with the UN’s sustainable development goal. Nonetheless, the objectives are reached as framed in Section 1 of the study, knowing the importance of green consumer values comparatively between Poland and India (Table 3). Measuring the importance level of each decision criteria from green consumer values on different RESs is available, with importance values (Table 3). The last to obtain was a comparison of Poland (Figure 6, Figure 8, Figure 10, Figure 12 and Figure 14), and India (Figure 7, Figure 9, Figure 11, Figure 13 and Figure 15) on their green consumer values of RESs reached (Table 3).
The final phase was to test the hypothesis based on empirical analysis. ‘Hypothesis 1: Consumers understanding about the Green Consumer Values in Poland and India are poor’ is rejected because respondents have shown their preference for different criteria of green consumer values differently in each country (Table 3). ‘Hypothesis 2: Green Consumer Values are similar for all RESs in Poland and India’ is also rejected with a different importance value for each of the six criteria of RESs in Poland and India based on the responses from consumers from both countries. ‘Hypothesis 3: All RESs are same in the perception of consumers for their energy consumptions’ is also rejected, as for energy consumption, different sources are valued differently and each criterion for each RES has a different understanding and importance for consumers in both countries. The main objective of the study is to analyze the comparative understanding of consumers in Poland and India with respect to renewable energy sources based on their green consumer values. The objective reached on a combined effort of analysis and tested hypotheses (Table 3), which justifies the comparison of Poland and India on their green consumer values for renewable energy sources.
Finally, the research concludes that the green consumer values are some of the deciding factors for consumers’ preference to choose a specific renewable energy, which depends on the psychological state of perception of an individual. The SDG 12 also concentrates on sustainable consumption, because only sensible consumption can bring the change. Poland and India are aligned with the UN’s sustainable development goals and are switching over to all means of sustainability. The energy sector is one of the most lucrative sectors in the sense of its fastest transition at different levels of implementation. The RESs are substituted for the traditional energy sources to move toward the usage for sustainable life. CRITERIA 4—I am concerned about wasting the resources of our planet when I use energy—is one of the most important criteria that emerged with all five RESs for Poland and three RESs for India. The importance value as well scored much higher for CRITERIA 4 in all RESs for both countries. Other criteria change their ranking with each RES and their importance values also fluctuate to the lower side based on their ranking, which is much lower too somewhere. Poland scores a higher value of importance compared to India for all RESs, which justifies that the awareness and understanding of consumers in Poland are higher than consumers in India. India can look to the implementation strategy of Poland for RESs, though India must concentrate on their own accepted RESs based on their own rankings.
The research can contribute to academicians in providing energy implementation situational analysis to their students and for discussion among peers. Researchers can also benefit from this by building their literature base and obtaining understanding of the country situations as well as the analytical process adopted in the current research. Policy makers and bureaucrats can look for this analysis to support or reframe their beliefs, which can motivate them to reach their goals. The research will lead the future research to measure the criteria importance for green consumer values with RESs, applying many other techniques of multi-criteria decision making, such as DEMATEL [71], Topsis [72], and Cognitive [73,74], which can be more supportive methods justifying the results. Furthermore, the research can be a roadmap for academic researchers to continue participating in the same line of study, providing their outcomes with a critical comparison.

Author Contributions

Conceptualization, M.R.; methodology, P.B. and U.S.S.; validation, M.R. and P.B.; formal analysis, P.B.; investigation, U.S.S.; resources, M.R.; data curation, P.B.; writing—original draft preparation, U.S.S.; writing—review and editing, P.B., M.R. and U.S.S.; visualization, P.B.; project administration, M.R.; funding acquisition, M.R. All authors have read and agreed to the published version of the manuscript.

Funding

The APC was funded by the Wroclaw University of Science and Technology, Wroclaw, Poland.

Institutional Review Board Statement

The study was conducted according to the guidelines of the Declaration of Helsinki. Ethical review and approval were not applicable for this study, due to it not involving humans or animals. You might also choose to exclude this statement if the study did not involve humans or animals.

Informed Consent Statement

The research excludes the consent statement because the study did not involve humans.

Data Availability Statement

Authors chose to exclude to report data for public access, but these can be made available upon individual request for usage in future research.

Conflicts of Interest

The authors declare no conflict of interest.

References

  1. Brodny, J.; Tutak, M.; Saki, S.A. Forecasting the Structure of Energy Production from Renewable Energy Sources and Biofuels in Poland. Energies 2020, 13, 2539. [Google Scholar] [CrossRef]
  2. Carballo-Penela, A.; Castromán-Diz, J.L. Environmental Policies for Sustainable Development: An Analysis of the Drivers of Proactive Environmental Strategies in the Service Sector: Environmental Policies for Sustainable Development. Bus. Strat. Environ. 2015, 24, 802–818. [Google Scholar] [CrossRef]
  3. Jałowiec, T.; Wojtaszek, H. Analysis of the RES Potential in Accordance with the Energy Policy of the European Union. Energies 2021, 14, 6030. [Google Scholar] [CrossRef]
  4. Mamkhezri, J.; Thacher, J.A.; Chermak, J.M. Consumer Preferences for Solar Energy: A Choice Experiment Study. Energy J. 2020, 41. [Google Scholar] [CrossRef]
  5. O’Shaughnessy, E.; Heeter, J.; Shah, C.; Koebrich, S. Corporate Acceleration of the Renewable Energy Transition and Implications for Electric Grids. Renew. Sustain. Energy Rev. 2021, 146, 111160. [Google Scholar] [CrossRef]
  6. Szaruga, E.; Kłos-Adamkiewicz, Z.; Gozdek, A.; Załoga, E. Linkages between Energy Delivery and Economic Growth from the Point of View of Sustainable Development and Seaports. Energies 2021, 14, 4255. [Google Scholar] [CrossRef]
  7. Kulovesi, K.; Oberthür, S. Assessing the EU’s 2030 Climate and Energy Policy Framework: Incremental Change toward Radical Transformation? RECIEL 2020, 29, 151–166. [Google Scholar] [CrossRef]
  8. Yong, J.Y.; Yusliza, M.; Ramayah, T.; Chiappetta Jabbour, C.J.; Sehnem, S.; Mani, V. Pathways towards Sustainability in Manufacturing Organizations: Empirical Evidence on the Role of Green Human Resource Management. Bus. Strat. Environ. 2020, 29, 212–228. [Google Scholar] [CrossRef]
  9. Take Action for the Sustainable Development Goals—United Nations Sustainable Development. Available online: https://www.un.org/sustainabledevelopment/sustainable-development-goals/ (accessed on 30 May 2022).
  10. Owusu, P.A.; Asumadu-Sarkodie, S. A Review of Renewable Energy Sources, Sustainability Issues and Climate Change Mitigation. Cogent Eng. 2016, 3, 1167990. [Google Scholar] [CrossRef]
  11. Trends|Tracking SDG 7. Available online: https://trackingsdg7.esmap.org/time?c=World+Central_Asia_and_Southern_Asia+Eastern_Asia_and_South-eastern_Asia+Latin_America_and_the_Caribbean+Northern_America_and_Europe+Oceania+Sub-Saharan_Africa+Western_Asia_and_Northern_Africa&p=Renewable_Energy&i=Renewable_Energy_share_in_Total_Final_Energy_Consumption_(%) (accessed on 30 May 2022).
  12. 2022—World Energy Transitions Outlook: 2022 1.5 °C Pathw.Pdf. Available online: https://www.irena.org/-/media/files/irena/agency/publication/2022/mar/irena_weto_summary_2022.pdf?la=en&hash=1da99d3c3334c84668f5caae029bd9a076c10079 (accessed on 30 May 2022).
  13. Keidel, J.; Bican, P.M.; Riar, F.J. Influential Factors of Network Changes: Dynamic Network Ties and Sustainable Startup Embeddedness. Sustainability 2021, 13, 6184. [Google Scholar] [CrossRef]
  14. 2022 Initiative Foundation—Co-Creation & Acceleration to Reach the Sustainable Development Goals. Available online: https://www.2022initiative.org/ (accessed on 30 May 2022).
  15. SDG Indicators. Available online: https://unstats.un.org/sdgs/report/2019/goal-07/ (accessed on 30 May 2022).
  16. Bartoszczuk, P.; Singh, U.S.; Rutkowska, M. An Empirical Analysis of Renewable Energy Contributions Considering GREEN Consumer Values—A Case Study of Poland. Energies 2022, 15, 1027. [Google Scholar] [CrossRef]
  17. Sachdeva, S.; Jordan, J.; Mazar, N. Green Consumerism: Moral Motivations to a Sustainable Future. Curr. Opin. Psychol. 2015, 6, 60–65. [Google Scholar] [CrossRef]
  18. Pinto, D.C.; Nique, W.M.; Añaña, E.D.S.; Herter, M.M. Green Consumer Values: How Do Personal Values Influence Environmentally Responsible Water Consumption? Int. J. Consum. Stud. 2011, 35, 122–131. [Google Scholar] [CrossRef]
  19. Rutkowska, M.; Bartoszczuk, P.; Singh, U.S. Management of GREEN Consumer Values in Renewable Energy Sources and Eco Innovation in INDIA. Energies 2021, 14, 7061. [Google Scholar] [CrossRef]
  20. Aboagye, B.; Gyamfi, S.; Ofosu, E.A.; Djordjevic, S. Status of Renewable Energy Resources for Electricity Supply in Ghana. Sci. Afr. 2021, 11, e00660. [Google Scholar] [CrossRef]
  21. Haws, K.L.; Winterich, K.P.; Naylor, R.W. Seeing the World through GREEN-Tinted Glasses: Green Consumption Values and Responses to Environmentally Friendly Products. J. Consum. Psychol. 2014, 24, 336–354. [Google Scholar] [CrossRef]
  22. Bailey, A.A.; Mishra, A.; Tiamiyu, M.F. GREEN Consumption Values and Indian Consumers’ Response to Marketing Communications. JCM 2016, 33, 562–573. [Google Scholar] [CrossRef]
  23. Zhang, X.; Dong, F. Why Do Consumers Make Green Purchase Decisions? Insights from a Systematic Review. IJERPH 2020, 17, 6607. [Google Scholar] [CrossRef]
  24. Sun, P.-C.; Wang, H.-M.; Huang, H.-L.; Ho, C.-W. Consumer Attitude and Purchase Intention toward Rooftop Photovoltaic Installation: The Roles of Personal Trait, Psychological Benefit, and Government Incentives. Energy Environ. 2020, 31, 21–39. [Google Scholar] [CrossRef]
  25. Ancygier, A. Poland and the European Climate Policy: An Uneasy Relationship. Kwart. Nauk. OAP UW E-Polit. 2013, 7, 76–93. [Google Scholar]
  26. Tolba, M.K. The Premises for Building a Sustainable Society—Address to the World Commission on Environment and Development; United Nations Environment Programme: Nairobi, Kenya, 1984; Available online: https://sustainabledevelopment.un.org/content/documents/5987our-common-future.pdf (accessed on 12 June 2022).
  27. Pezzey, J.C.V. Economic Analysis of Sustainable Growth and Sustainable Development; Environment Department Working Paper No. 15. Published as Sustainable Development Concepts: An Economic Analysis, World Bank Environment Paper No. 2; World Bank: Washington, DC, USA, 1989. [Google Scholar]
  28. Ranjan Srivastava, A.; Khan, M.; Khan, F.Y.; Bajpai, S. Role of Renewable Energy in Indian Economy. IOP Conf. Ser. Mater. Sci. Eng. 2018, 404, 012046. [Google Scholar] [CrossRef] [Green Version]
  29. Millard, F. Environmental Policy in Poland. Environ. Politics 1998, 7, 145–161. [Google Scholar] [CrossRef]
  30. Available online: https://www.local2030.org/library/421/Recommendations-to-integrate-the-SDGs-into-local-party-manifestos.pdf (accessed on 13 June 2022).
  31. Skjærseth, J.B. Implementing EU Climate and Energy Policies in Poland: Policy Feedback and Reform. Environ. Politics 2018, 27, 498–518. [Google Scholar] [CrossRef]
  32. Environmental Policy—An Overview|ScienceDirect Topics. Available online: https://www.sciencedirect.com/topics/social-sciences/environmental-policy (accessed on 23 March 2022).
  33. Singh, U. Total Productive Maintenance a Tool for Efficient Production Management. 2015. Available online: https://www.researchgate.net/publication/328841028_TOTAL_PRODUCTIVE_MAINTENANCE_A_TOOL_FOR_EFFICIENT_PRODUCTION_MANAGEMENT (accessed on 21 April 2022).
  34. Singh, U.S. Cost Estimation Using Econometric Model for Restaurant Business. QME 2019, 20, 209–216. [Google Scholar] [CrossRef]
  35. Available online: https://www.scribd.com/document/371685743/TZW-Sustainability-and-the-Waste-Hierarchy-2003 (accessed on 30 May 2022).
  36. Singh, U.S. A Conceptual Approach Correlating Behavioral Neuroscience with Vertically Coordinated Vegetable Supply Chain. Sch. J. Arts Humanit. Soc. Sci. 2018, 6, 1021–1027. [Google Scholar]
  37. Szulecki, K.; Fischer, S.; Gullberg, A.T.; Sartor, O. Shaping the ‘Energy Union’: Between National Positions and Governance Innovation in EU Energy and Climate Policy. Clim. Policy 2016, 16, 548–567. [Google Scholar] [CrossRef] [Green Version]
  38. Kryk, B.; Guzowska, M.K. Implementation of Climate/Energy Targets of the Europe 2020 Strategy by the EU Member States. Energies 2021, 14, 2711. [Google Scholar] [CrossRef]
  39. Ballal, A.; Tambe, S.; Joe, E.T. The Evolution of India’s Environmental Policy. Indian For. 2021, 147, 743. [Google Scholar] [CrossRef]
  40. Mensah, J.; Enu-Kwesi, F. Implications of Environmental Sanitation Management for Sustainable Livelihoods in the Catchment Area of Benya Lagoon in Ghana. J. Integr. Environ. Sci. 2019, 16, 23–43. [Google Scholar] [CrossRef] [Green Version]
  41. Raport U Thanta—Encyklopedia PWN—źródło wiarygodnej i rzetelnej wiedzy. Available online: https://encyklopedia.pwn.pl/haslo/Raport-U-Thanta;3966094.html (accessed on 24 March 2022).
  42. Scopelliti, M.; Molinario, E.; Bonaiuto, F.; Bonnes, M.; Cicero, L.; De Dominicis, S.; Fornara, F.; Admiraal, J.; Beringer, A.; Dedeurwaerdere, T.; et al. What Makes You a ‘Hero’ for Nature? Socio-Psychological Profiling of Leaders Committed to Nature and Biodiversity Protection across Seven EU Countries. J. Environ. Plan. Manag. 2018, 61, 970–993. [Google Scholar] [CrossRef] [Green Version]
  43. Elliott, J.A. An Introduction to Sustainable Development, 4th ed.; Routledge Perspectives on Development; Routledge: London, UK; Taylor & Francis Group: New York, NY, USA, 2013; ISBN 978-0-415-59072-3. [Google Scholar]
  44. Shepherd, E.; Milner-Gulland, E.J.; Knight, A.T.; Ling, M.A.; Darrah, S.; Soesbergen, A.; Burgess, N.D. Status and Trends in Global Ecosystem Services and Natural Capital: Assessing Progress Toward Aichi Biodiversity Target 14. Conserv. Lett. 2016, 9, 429–437. [Google Scholar] [CrossRef]
  45. Montaldo, C.R.B. Sustainable Development Approaches for Rural Development and Poverty Alleviation & Community Capacity Building for Rural Development and Poverty Alleviation. 17. Available online: https://sustainabledevelopment.un.org/content/documents/877LR%20Sustainable%20Development%20v2.pdf (accessed on 21 April 2022).
  46. Lélé, S.M. Sustainable Development: A Critical Review. World Dev. 1991, 19, 607–621. [Google Scholar] [CrossRef]
  47. Shahzalal, M.; Hassan, A. Communicating Sustainability: Using Community Media to Influence Rural People’s Intention to Adopt Sustainable Behaviour. Sustainability 2019, 11, 812. [Google Scholar] [CrossRef] [Green Version]
  48. United Nations. United Nations Office on Drugs and Crime World Drug Report 2016; United Nations: New York, NY, USA, 2016; ISBN 978-92-1-148286-7. [Google Scholar]
  49. Kasztelan, A. Green Growth, Green Economy and Sustainable Development: Terminological and Relational Discourse. Prague Econ. Pap. 2017, 26, 487–499. [Google Scholar] [CrossRef] [Green Version]
  50. Proczek, R. Pojęcie zrównoważonego rozwoju. Available online: http://urbnews.pl/pojecie-zrownowazonego-rozwoju/ (accessed on 24 March 2022).
  51. Deliana, Y.; Rum, I.A. How Does Perception on Green Environment across Generations Affect Consumer Behaviour? A Neural Network Process. Int. J. Consum. Stud. 2019, 43, 358–367. [Google Scholar] [CrossRef]
  52. Testa, F.; Pretner, G.; Iovino, R.; Bianchi, G.; Tessitore, S.; Iraldo, F. Drivers to Green Consumption: A Systematic Review. Environ. Dev. Sustain. 2021, 23, 4826–4880. [Google Scholar] [CrossRef]
  53. Gleim, M.J.; Lawson, S. Spanning the Gap: An Examination of the Factors Leading to the Green Gap. J. Consum. Mark. 2014, 31, 503–514. [Google Scholar] [CrossRef]
  54. Cheng, Z.-H.; Chang, C.-T.; Lee, Y.-K. Linking Hedonic and Utilitarian Shopping Values to Consumer Skepticism and Green Consumption: The Roles of Environmental Involvement and Locus of Control. Rev. Manag. Sci. 2020, 14, 61–85. [Google Scholar] [CrossRef]
  55. Available online: https://assets.ey.com/content/dam/ey-sites/ey-com/en_gl/topics/power-and-utilities/ey-recai-59-top-40-ranking-may-2022.pdf (accessed on 12 June 2022).
  56. Cohen, J. A Power Primer. Psychol. Bull. 1992, 112, 155–159. [Google Scholar] [CrossRef]
  57. Cohen, J. Statistical Power Analysis. Curr. Dir. Psychol. Sci. 1992, 1, 98–101. [Google Scholar] [CrossRef]
  58. Faul, F.; Erdfelder, E.; Lang, A.-G.; Buchner, A. G*Power 3: A Flexible Statistical Power Analysis Program for the Social, Behavioral, and Biomedical Sciences. Behav. Res. Methods 2007, 39, 175–191. [Google Scholar] [CrossRef] [PubMed]
  59. Singh, U.; Mishra, U. Assessment of Need for Vertical Coordination in Supply Chain of Vegetable Industry. Int. Food Res. J. 2015, 22, 1417–1423. [Google Scholar]
  60. Singh, U.S.; Bradosti, H. Acceptability of Banking Operations in Iraqi Kurdistan. Res. J. Financ. Account. 2015, 6, 276–286. [Google Scholar]
  61. Piwowarski, M.; Singh, U.S.; Nermend, K. Application of EEG Metrics in the Decision-Making Process. In Proceedings of the International Conference on Computational Methods in Experimental Economics, Warsaw, Poland, 28–29 November 2018; pp. 187–199. [Google Scholar]
  62. Piwowarski, M.; Miłaszewicz, D.; Łatuszyńska, M.; Borawski, M.; Nermend, K. Application of the Vector Measure Construction Method and Technique for Order Preference by Similarity Ideal Solution for the Analysis of the Dynamics of Changes in the Poverty Levels in the European Union Countries. Sustainability 2018, 10, 2858. [Google Scholar] [CrossRef] [Green Version]
  63. Piwowarski, M.; Borawski, M.; Nermend, K. The Problem of Non-Typical Objects in the Multidimensional Comparative Analysis of the Level of Renewable Energy Development. Energies 2021, 14, 5803. [Google Scholar] [CrossRef]
  64. Nermend, K.; Łatuszyńska, M. (Eds.) Experimental and Quantitative Methods in Contemporary Economics: Computational Methods in Experimental Economics (CMEE) 2018 Conference; Springer Proceedings in Business and Economics; Springer International Publishing: Cham, Switzerland, 2020; ISBN 978-3-030-30250-4. [Google Scholar]
  65. Europe Sustainable Development Report 2021. Available online: https://eu-dashboards.sdgindex.org/ (accessed on 19 June 2022).
  66. Sustainable Development Report 2022. Available online: https://dashboards.sdgindex.org/ (accessed on 19 June 2022).
  67. Singh, S.; Singh, G.A. Assessing the Impact of the Digital Divide on Indian Society: A Study of Social Exclusion. Res. Soc. Chang. 2021, 13, 181–190. [Google Scholar] [CrossRef]
  68. Singh, S.; Singh, G.A.; Kaur, R. Relationship between Propensity to Social Innovation and Striving for Gender Equality: Sample Study Based on the Example of India. Główny Urząd Stat. 2022, 67, 41–63. [Google Scholar] [CrossRef]
  69. Singh, S.; Singh, U.S. A Study Assessing the Brand Loyalty Creation by Promotion Mix for KOTON Brand. JXU 2020, 14, 3460–3480. [Google Scholar] [CrossRef]
  70. Alsakaa, A.A.; Borawska, A.; Borawski, M.; Łatuszyńska, M.; Piwowarski, M.; Babiloni, F.; Nermend, K. Cognitive Neuroscience Techniques in Determining the Right Time of Advertising. IOP Conf. Ser. Mater. Sci. Eng. 2020, 671, 012033. [Google Scholar] [CrossRef]
  71. Piwowarski, M.; Miłaszewicz, D.; Łatuszyńska, M.; Nermend, K. Multi-Criteria Assessment of the Company’s Location Selection: A Dynamic Approach. ERSJ 2019, XXII, 215–230. [Google Scholar] [CrossRef] [Green Version]
  72. Nermend, K.; Piwowarski, M.; Borawski, M. Decision Making Methods in Comparative Studies of Complex Economic Processes Management. EIJS 2020, 61, 652–664. [Google Scholar] [CrossRef] [Green Version]
  73. Mateusz, P.; Danuta, M.; Małgorzata, Ł.; Mariusz, B.; Kesra, N. TOPSIS and VIKOR Methods in Study of Sustainable Development in the EU Countries. Procedia Comput. Sci. 2018, 126, 1683–1692. [Google Scholar] [CrossRef]
  74. Piwowarski, M.; Singh, U.S.; Nermend, K. The Cognitive Neuroscience Methods in the Analysis of the Impact of Advertisements in Shaping People’s Health Habits. Eur. Res. Stud. J. 2019, XXI, 457–471. [Google Scholar] [CrossRef] [Green Version]
Figure 1. Renewable Energy Share in Total Final Energy Consumption 1990–2018 [11].
Energies 15 05046 g001
Figure 2. Evolution of India’s environmental policy [38].
Energies 15 05046 g002
Figure 3. Renewable Energy Country Attractive Index (RECAI), Ernst and Young, 2022 [55].
Energies 15 05046 g003
Figure 4. Overall Score for Reaching Sustainable Development Goals. Source: European Sustainable Development Report 2021 [63].
Energies 15 05046 g004
Figure 5. Spillover Score for Reaching Sustainable Development Goals. Source: European Sustainable Development Report 2021 [63].
Energies 15 05046 g005
Figure 6. SE Poland GCV Criteria. Source: ALM Analysis SPSS by Author.
Energies 15 05046 g006
Figure 7. SE India GCV Criteria. Source: ALM Analysis SPSS by Author.
Energies 15 05046 g007
Figure 8. WE Poland GCV Criteria. Source: ALM Analysis SPSS by Author.
Energies 15 05046 g008
Figure 9. WE India GCV Criteria. Source: ALM Analysis SPSS by Author.
Energies 15 05046 g009
Figure 10. HE Poland GCV Criteria Source: ALM Analysis SPSS by Author.
Energies 15 05046 g010
Figure 11. HE India GCV Criteria Source: ALM Analysis SPSS by Author.
Energies 15 05046 g011
Figure 12. GE Poland GCV Criteria. Source: ALM Analysis SPSS by Author.
Energies 15 05046 g012
Figure 13. GE India GCV Criteria. Source: ALM Analysis SPSS by Author.
Energies 15 05046 g013
Figure 14. BE Poland GCV Criteria. Source: ALM Analysis SPSS by Author.
Energies 15 05046 g014
Figure 15. BE India GCV Criteria. Source: ALM Analysis SPSS by Author.
Energies 15 05046 g015
Table 1. Overall Score for Reaching Sustainable Development Goals.
RankCountryScore
44Thailand74.13
55Vietnam72.76
56China72.38
60Singapore71.72
67Maldives71.03
70Bhutan70.49
72Malaysia70.38
76SriLanka70.03
82Indonesia69.16
93BruneiDarussalam67.10
95Philippines66.64
98Nepal66.18
103Myanmar64.27
104Bangladesh64.22
107Cambodia63.75
109Mongolia63.51
111LaoPDR63.39
121India60.32
125Pakistan59.34
Source: Sustainable Development Report 2022 [64].
Table 2. Spillover Score for Reaching Sustainable Development Goals.
RankCountryScore
8Pakistan99.42
13India99.29
19Myanmar99.18
33Nepal98.55
38Bangladesh97.91
47Cambodia97.56
48Indonesia97.56
55Philippines97.21
73Vietnam95.31
76China94.85
77Maldives94.80
81Mongolia94.02
86Sri Lanka93.65
89Bhutan93.36
101Lao PDR90.19
108Thailand86.71
118Malaysia79.19
133Brunei Darussalam67.3
163Singapore33.03
Source: Sustainable Development Report 2022 [64].
Table 3. Renewable Energy Green Consumer Values Poland and India.
Renewable
Energy
Sources
PolandIndia
CriteriaImportanceCriteriaImportance
Solar EnergyCRITERIA 40.278CRITERIA 40.228
CRITERIA 30.185CRITERIA 60.207
CRITERIA 60.159CRITERIA 30.192
CRITERIA 50.152CRITERIA 10.154
CRITERIA 10.119CRITERIA 50.117
CRITERIA 20.108CRITERIA 20.101
Wind EnergyCRITERIA 40.327CRITERIA 40.207
CRITERIA 60.174CRITERIA 30.198
CRITERIA 10.145CRITERIA 10.158
CRITERIA 50.144CRITERIA 20.155
CRITERIA 20.110CRITERIA 60.142
CRITERIA 30.100CRITERIA 50.141
Hydro EnergyCRITERIA 40.257CRITERIA 30.249
CRITERIA 10.192CRITERIA 40.224
CRITERIA 60.168CRITERIA 10.157
CRITERIA 50.152CRITERIA 60.149
CRITERIA 30.116CRITERIA 20.121
CRITERIA 20.116CRITERIA 50.099
Geothermal EnergyCRITERIA 40.273CRITERIA 60.261
CRITERIA 60.203CRITERIA 30.180
CRITERIA 10.173CRITERIA 50.155
CRITERIA 50.136CRITERIA 40.153
CRITERIA 20.110CRITERIA 20.142
CRITERIA 30.106CRITERIA 10.108
Biomass EnergyCRITERIA 40.233CRITERIA 40.209
CRITERIA 60.223CRITERIA 30.207
CRITERIA 10.174CRITERIA 20.172
CRITERIA 30.150CRITERIA 60.155
CRITERIA 50.125CRITERIA 10.134
CRITERIA 20.095CRITERIA 50.124
Source: Author’s Self Contribution.
Publisher’s Note: MDPI stays neutral with regard to jurisdictional claims in published maps and institutional affiliations.

