Abstract
The N2 adsorption experiment is one of the most important methods for characterizing the pore structure of shale, as it covers the major pore size range present in such sediments. The goal of this work is to better understand both the mechanisms and application of low-pressure nitrogen adsorption experiments in pore structure characterization. To achieve this, the N2 adsorption molecular simulation method, low-pressure N2 adsorption experiments, total organic carbon (TOC) analysis, X-ray diffraction (XRD) analysis, scanning electron microscopy (SEM), and a total of 196 shale samples from the Wufeng–Longmaxi formations in the Sichuan basin have been employed in this study. Based on the analytical data and the simulations, two parameters, the connectivity index and the large pore volume index, are proposed. These parameters are defined as the connectivity of the pore system and the volume of large nanopores (>10 nm) respectively, and they are calculated based on the N2 adsorption and desorption isotherms. The experimental results showed that TOC content and clay minerals are the key factors controlling surface area and pore volume. However, in different shale wells and different substrata (divided based on graptolite zonation), the relative influences of TOC content and clay minerals on pore structure differ. In three of the six wells, TOC content is the key factor controlling surface area and pore volume. In contrast, clay minerals in samples from the W202 well are the key factors controlling pore volume, and with an increase in the clay mineral content, the pore volume increases linearly. When the carbonate content exceeds 50%, the pore volume decreases with an increase in carbonate content, and this may be because in the diagenetic process, carbonate cement fills the pores. It is also found that with increasing TOC content the connectivity index increases and SEM images also illustrate that organic pores have better connectivity. Furthermore, the connectivity index increases as quartz content increases. The large pore volume index increases with quartz content from 0 to 40% and decreases as quartz increases from 40% to 100%. By comparing the pore structure of shale in the same substrata of different shale gas wells, it was found that tectonic location significantly affects the surface area and pore volume of shale samples. The shale samples from wells that are located in broad tectonic zones, far from large-scale faults and overpressure zones, have larger pore volumes and surface areas. On the contrary, the shale samples from shale gas wells that are located in the anticline region with strong tectonic extrusion zones or near large-scale faults have relatively low pore volumes and surface areas. By employing large numbers of shale samples and analyzing N2 adsorption mechanism in shale, this study has expanded the application of N2 adsorption experiment in shale and clarifies the effects of sedimentary factors and tectonic factors on pore structure.
1. Introduction
Shale gas in the USA and China has proven to be enormously successful, and these methane molecules of natural gas are mainly stored in pores of the shale reserve [1,2]. Pore systems in shale are important for gas storage and transport [3,4,5,6]. From the start of shale gas development and production, pore structure has been one of the key research topics [7,8], and numerous studies have been carried out on pore systems in shale [9,10]. These have shown that shale contains organic pores and inorganic pores, e.g., within clays or formed by carbonate dissolution [11,12]. The pore sizes in shale range from 0.4 nm to greater than 10,000 nm [13]. The variations in pore types and sizes make pore structure in shale difficult to characterize [14,15]. Many different methods have been applied, and these methods can be divided into quantitative, experimental and analytical methods, such as low-pressure N2 adsorption (LP-N2-GA), high-pressure mercury injection (HPMI), low-pressure CO2 adsorption (LT-CO2-GA), and nuclear magnetic resonance spectroscopy (NMR), cryoporometry, and visible, qualitative characterization methods, such as scanning electron microscopy (SEM), nano-computerized tomography (nano-CT), and atomic force microscopy (AFM) [16,17,18,19,20,21]. Each method has its own advantages and disadvantages [22]. LT-CO2-GA can measure pore sizes in the 0.4–2.0 nm range [14]. HPMI can measure pores in the 3–10,000 nm range, but the experimental pressure needed for shale samples is relatively high, and this may alter the pore system [23]. SAXS and SANS measure the total pore structure including the “accessible” pores (i.e., those pores that can be filled by gas from outside the shale sample) and “inaccessible” pores (those pores that cannot be filled by gas from outside the shale), but SAXS and SANS need further improvement to obtain accurate, accessible pore structure information as researchers usually get the total pore information (including inaccessible pore and accessible pore information) from SAXS and SANS [24]. SEM analysis permits easy identification of the pore type in shale, but the information is qualitative because it is visual, and limited by the sample size [25]. Focused ion beam-scanning electron microscope (FIB-SEM) and nano-CT can provide quantitative pore structure data, such as pore volume and pore size distribution, but these methods cannot see pores smaller than 30 nm [26]. Such pores (pore size < 30 nm) typically contribute more than half of the total pore surface area in shale [26]. LP-N2-GA provides quantitative data on pores in the 1–300 nm range, and these pores contribute the largest fraction of the total pore volume [14]. Thus, this method is considered to be the most important method to characterize the “accessible” pores in shale.
Knowledge of pore evolution over geological time and factors that influence pore evolution, such as the mineralogy and the TOC content and maturity, are essential for understanding mechanisms of shale gas storage and shale gas accumulation [27,28]. Because of the heterogeneity in shale, understanding controlling factors is problematic. If several shale samples are employed in studies of pore evolution and pore influence factors, it is difficult to distinguish the key controlling factors due to the sample heterogeneity [16]. Some studies have found that the pore surface area and pore volume increase with increasing TOC content in shale [29,30]. However, other researchers reported that there is no obvious correlation between the Brunauer–Emmett–Teller (BET) surface area and the TOC content, and that, furthermore, clay minerals have more significant effects on the BET surface area than the TOC content [31].
The N2 adsorption experiment is a general method used to characterize mesoporous (2–50 nm) materials [32]. The application of N2 adsorption experiments to shale is mainly based on the method adopted from material science [33]. Shale is different from artificial mesoporous materials, as the pore sizes of most of artificial materials cover a narrow range. In contrast, the pore system of shale contains not only micropores (<2 nm) but also mesopores (2–50 nm) and macropores (>50 nm) [34,35]. This variability would affect pore structure results if the analytical methods used in material science were applied directly. For the N2 adsorption experiments, there are Horvath Kavazoe (HK), BET, Barrett Joyner Halenda (BJH) and density functional theory (DFT) models for analyzing the N2 adsorption experimental data to obtain pore structure data. The BET model is usually used to obtain the surface area of the pore system in shale, and the BJH model is usually used to obtain the pore size distribution and the pore volume [36]. In addition, when studying the pore system of shale, the pore connectivity and gas phase state in the pore space are also important [36]. In order to systematically analyze the pore structure of shale, molecular simulations are used to help analyze the N2 adsorption/desorption isotherms to obtain the pore structure in shale [37,38].
There is still a need to expand and further study the application of low-pressure N2 adsorption experiments in characterizing the pore structure in shale. In addition, the key factors controlling pore characteristics in shale are still unclear. To further understand pore systems in shale, 196 organic shale samples from the Wufeng–Longmaxi formations in the Sichuan basin were collected, and N2 adsorption experiments, XRD experiments, SEM experiments, and TOC tests were performed in this study. Longmaxi shale in the Sichuan Basin is the most successful gas shale in China. Most of the commercial shale gas production of China is provided by the Longmaxi shale [39]. In addition, the molecular simulation method was also employed to investigate the N2 adsorption mechanism in shale.
2. Materials and Methods
2.1. Samples
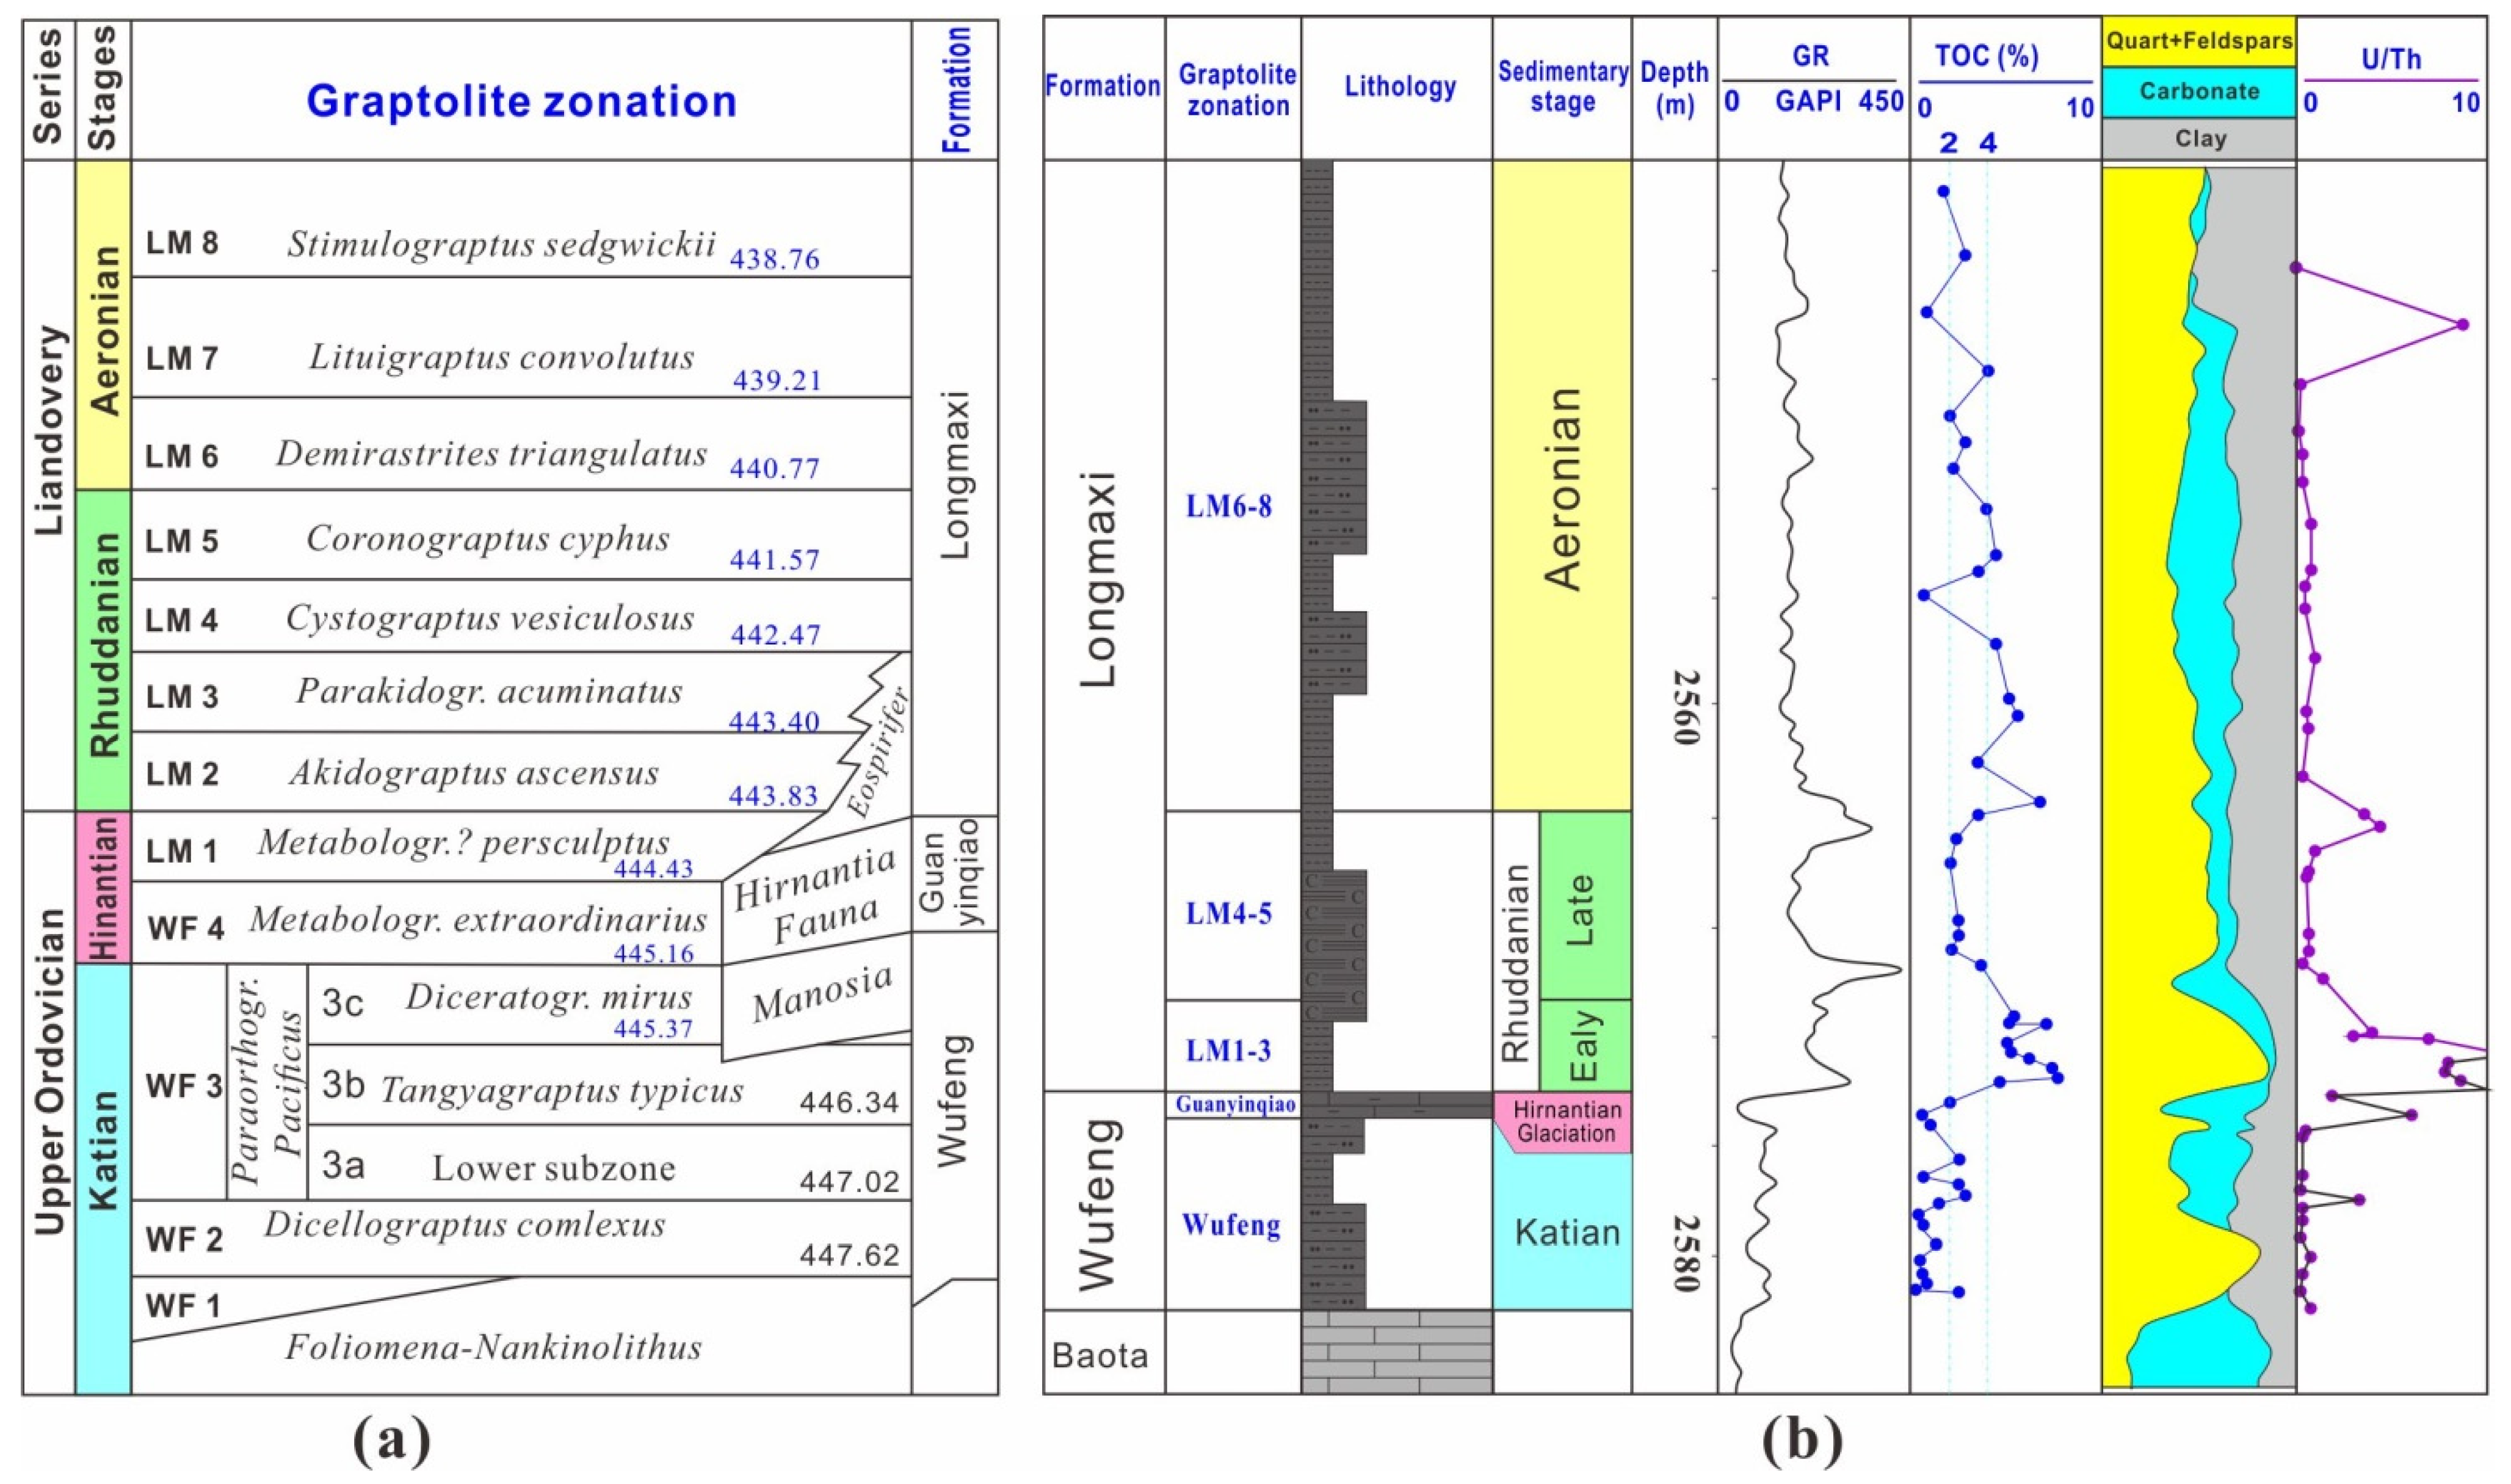
A total of 196 shale samples from the Wufeng–Longmaxi formations were collected from six shale gas wells in the Sichuan basin. The units in the formations are subdivided by using graptolites, which are abundant in the Wufeng–Longmaxi. The formations can thus be divided into 13 zonations, and among these, there are 12 zonations in Katian, Hinantian, Rhuddanian, and Aeronian as shown in Figure 1a [40]. Based on the graptolite zonation, lithofacies, sedimentary environment, and natural gamma log (GR), the shale samples are divided into four substrata for shale gas exploration: Wufeng, LM1-3, LM4-5, and LM6-8 (Figure 1b) [41].

Figure 1.
(a) Subdivision of the Wufeng–Longmaxi formations into units based on graptolite zonation: (Katian, Hinantian, Rhuddanian, and Aeronian: WF1-4 and LM1-8) [40]; (b) Typical stratigraphic column for the Wufeng–Longmaxi formations and its subdivisions in the Weiyuan location used in this study [41].
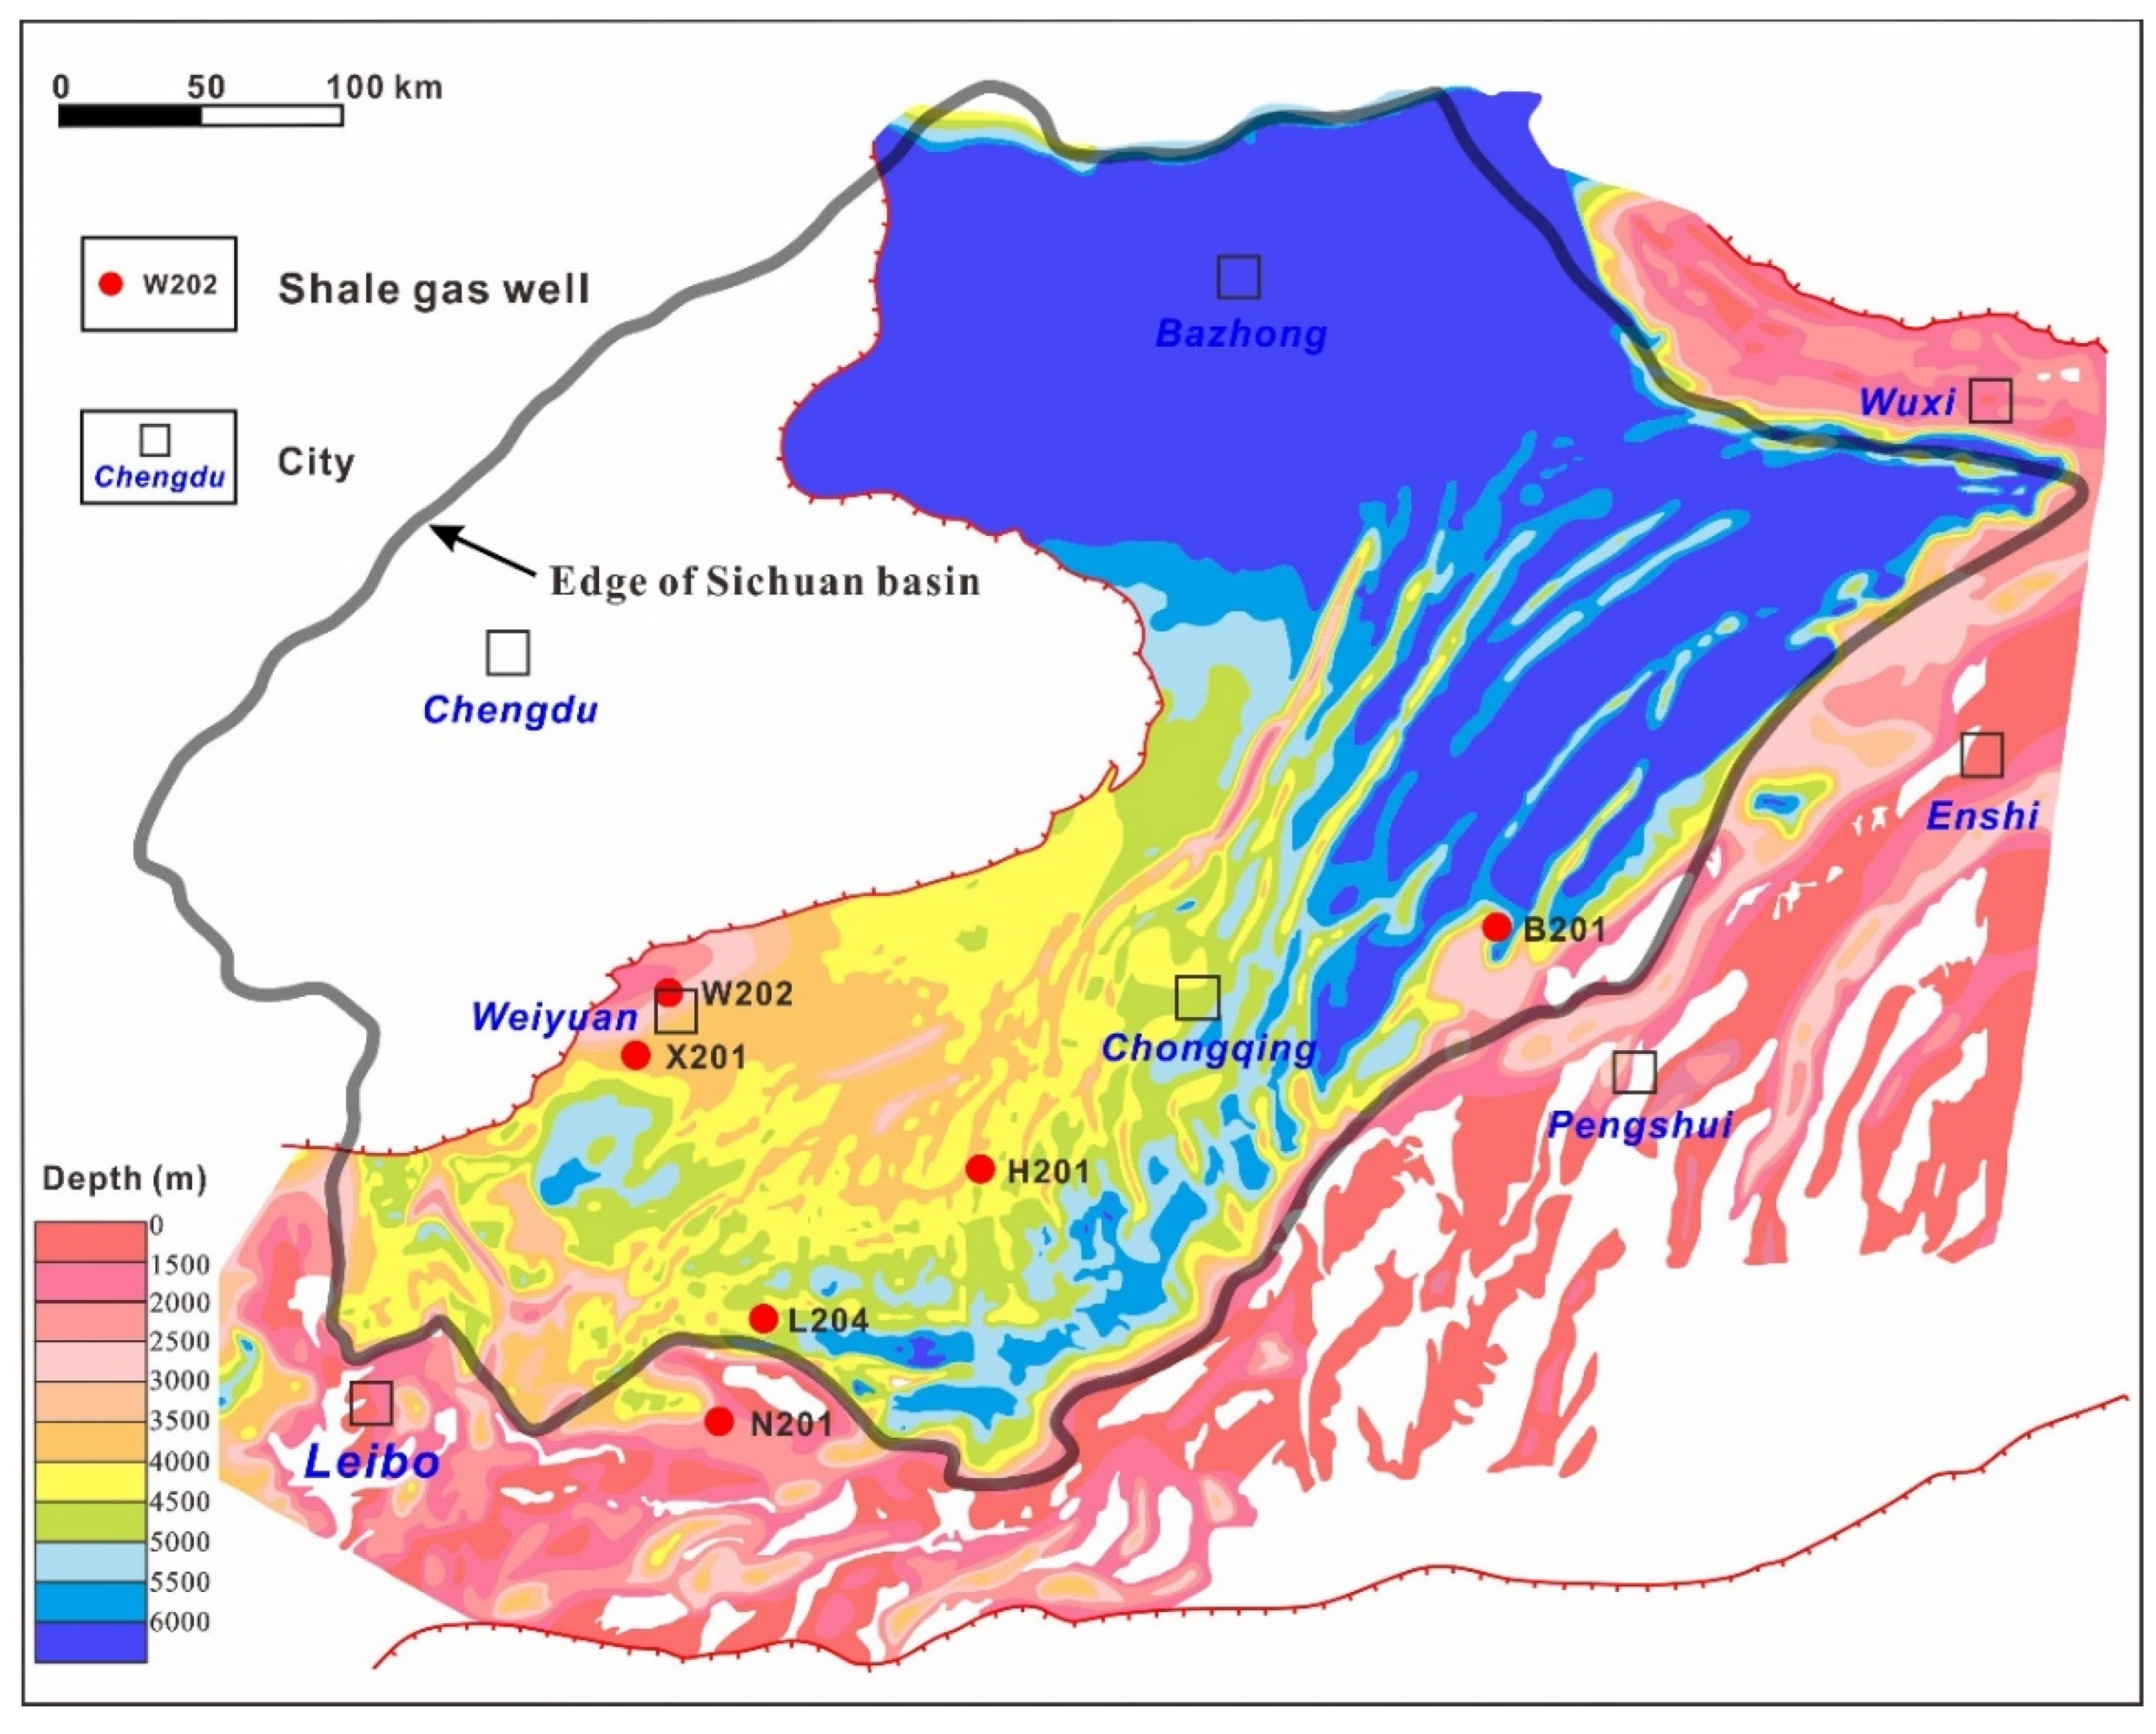
The depth of the Wufeng–Longmaxi formations generally increases from southwest to northeast (Figure 2) [3]. The six wells are mainly in the southwestern Sichuan Basin where the Wufeng–Longmaxi is shallower, with the exception of the B201 well, located more toward the center of the basin. The true vertical depths (TVD) of the Wufeng–Longmaxi shale samples analyzed range from 2500 to 4300 m.
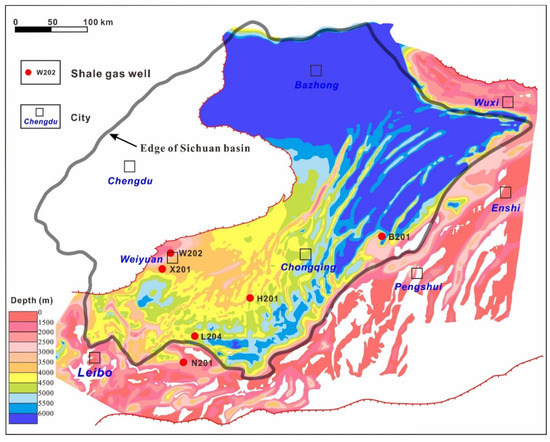
Figure 2.
The true vertical depth (TVD) of the Wufeng–Longmaxi formations in the Sichuan basin and the location of the wells [3].
2.2. Methods
2.2.1. Low-Pressure N2 Adsorption Experiment
LP-N2-GA experiments were used to characterize the properties of nanopores (1.0–300 nm) in shale samples by employing the Micromeritics ASAP 2420 instrument. First, the shale samples were pulverized to about 60–80 mesh. The 1.5–2.5 g pulverized shale samples were used in the LP-N2-GA experiment. Then, degassing was performed at an ambient temperature of 22.0 °C before testing N2 adsorption and desorption amounts. After degassing, the N2 adsorption amount was tested at a testing temperature of −195.8 °C (77.35 K) with an increase in the P/P0 from 0.01 to 0.99. The equilibration interval was set to 10 s. During the desorption process, P/P0 decreased from 0.99 to 0.14 and the N2 desorption isotherms were obtained.
2.2.2. Simulation Methods
The grand canonical Monte Carlo (GCMC) method was used to simulate the N2 adsorption in shale, and thus it was an equilibrium calculation rather than a time-dependent calculation. The simulation temperature is also 77.35 K, which is consistent with the experimental temperature. As pores in shale are heterogeneous and complex, different-sized slit pores were constructed to study the N2 adsorption behavior. As the organic matter (OM) in Longmaxi shale of the Sichuan basin was over-mature [42], the surface of the reconstructed pore was composed of carbon atoms only. In the simulation, the forcefield used was condensed-phase optimized molecular potentials for atomistic simulation studies (COMPASS) [40]. As N2 adsorption in shale is physical adsorption, the forces between the N2 molecule and pore model are mainly intermolecular forces (van de Waals force). In the COMPASS forcefield, the van de Waals force are calculated by LJ 9-6 equation (Equation (1)) [43]:
In this work, and are the van der Waals parameters between N atoms and carbon atoms; represents the distance between the two atoms. More details about the LJ9-6 Equation can found in [43].
2.2.3. TOC Content
The TOC content was measured by using the LECO carbon and sulphur analyzer following the Chinese standard GB/T 19145-2003 (determination of total organic carbon in sedimentary rock). Before the experiment, the shale samples were pulverized to less than 60 mesh. Then, a hydrochloric acid solution was added to a known mass of the powdered samples for 2 h to remove the carbonate minerals. After washing and drying, the residues were weighed and analyzed for their TOC content.
2.2.4. XRD
The XRD analyses were performed by using the RINT-TTR3 X-ray diffractometer following the Chinese petroleum industry standard SY/T 5163-2018 (analytical method for clay minerals and ordinary non-clay minerals in sedimentary rocks by X-ray diffraction). Before the experiment, the shale samples were pulverized to 40 μm. During the analysis, the scan range was 2θ = 5–45 °, and the scan speed was 2 °/min.
3. Results
3.1. TOC Data
Figure 3 illustrates the average TOC contents of shale samples from each substratum in the six shale gas wells. It can be seen that the average TOC contents of the Wufeng substrata in the six shale gas wells vary greatly, ranging from 1.1% to 7.3%. In contrast, the average TOC contents of LM1-3 substrata are all very high, ranging from 4.6% to 6.0%. The average TOC contents of LM4-5 and LM6-8 substrata are much lower than those of LM1-3 substrata. The average TOC contents of LM4-5 and LM6-8 substrata range from 2.3% to 3.4% and 2.6% to 3.4%, respectively.
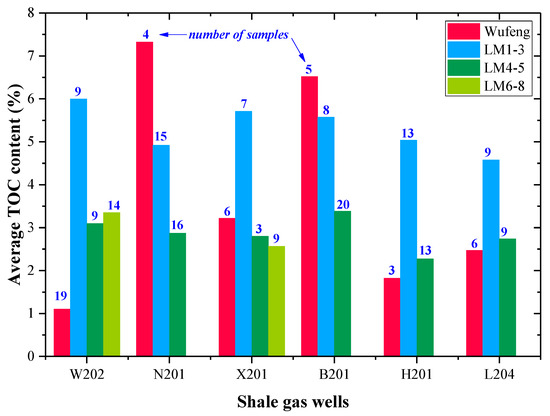
Figure 3.
The average TOC contents of shale samples from each substratum in the six shale gas wells.
3.2. Mineralogy
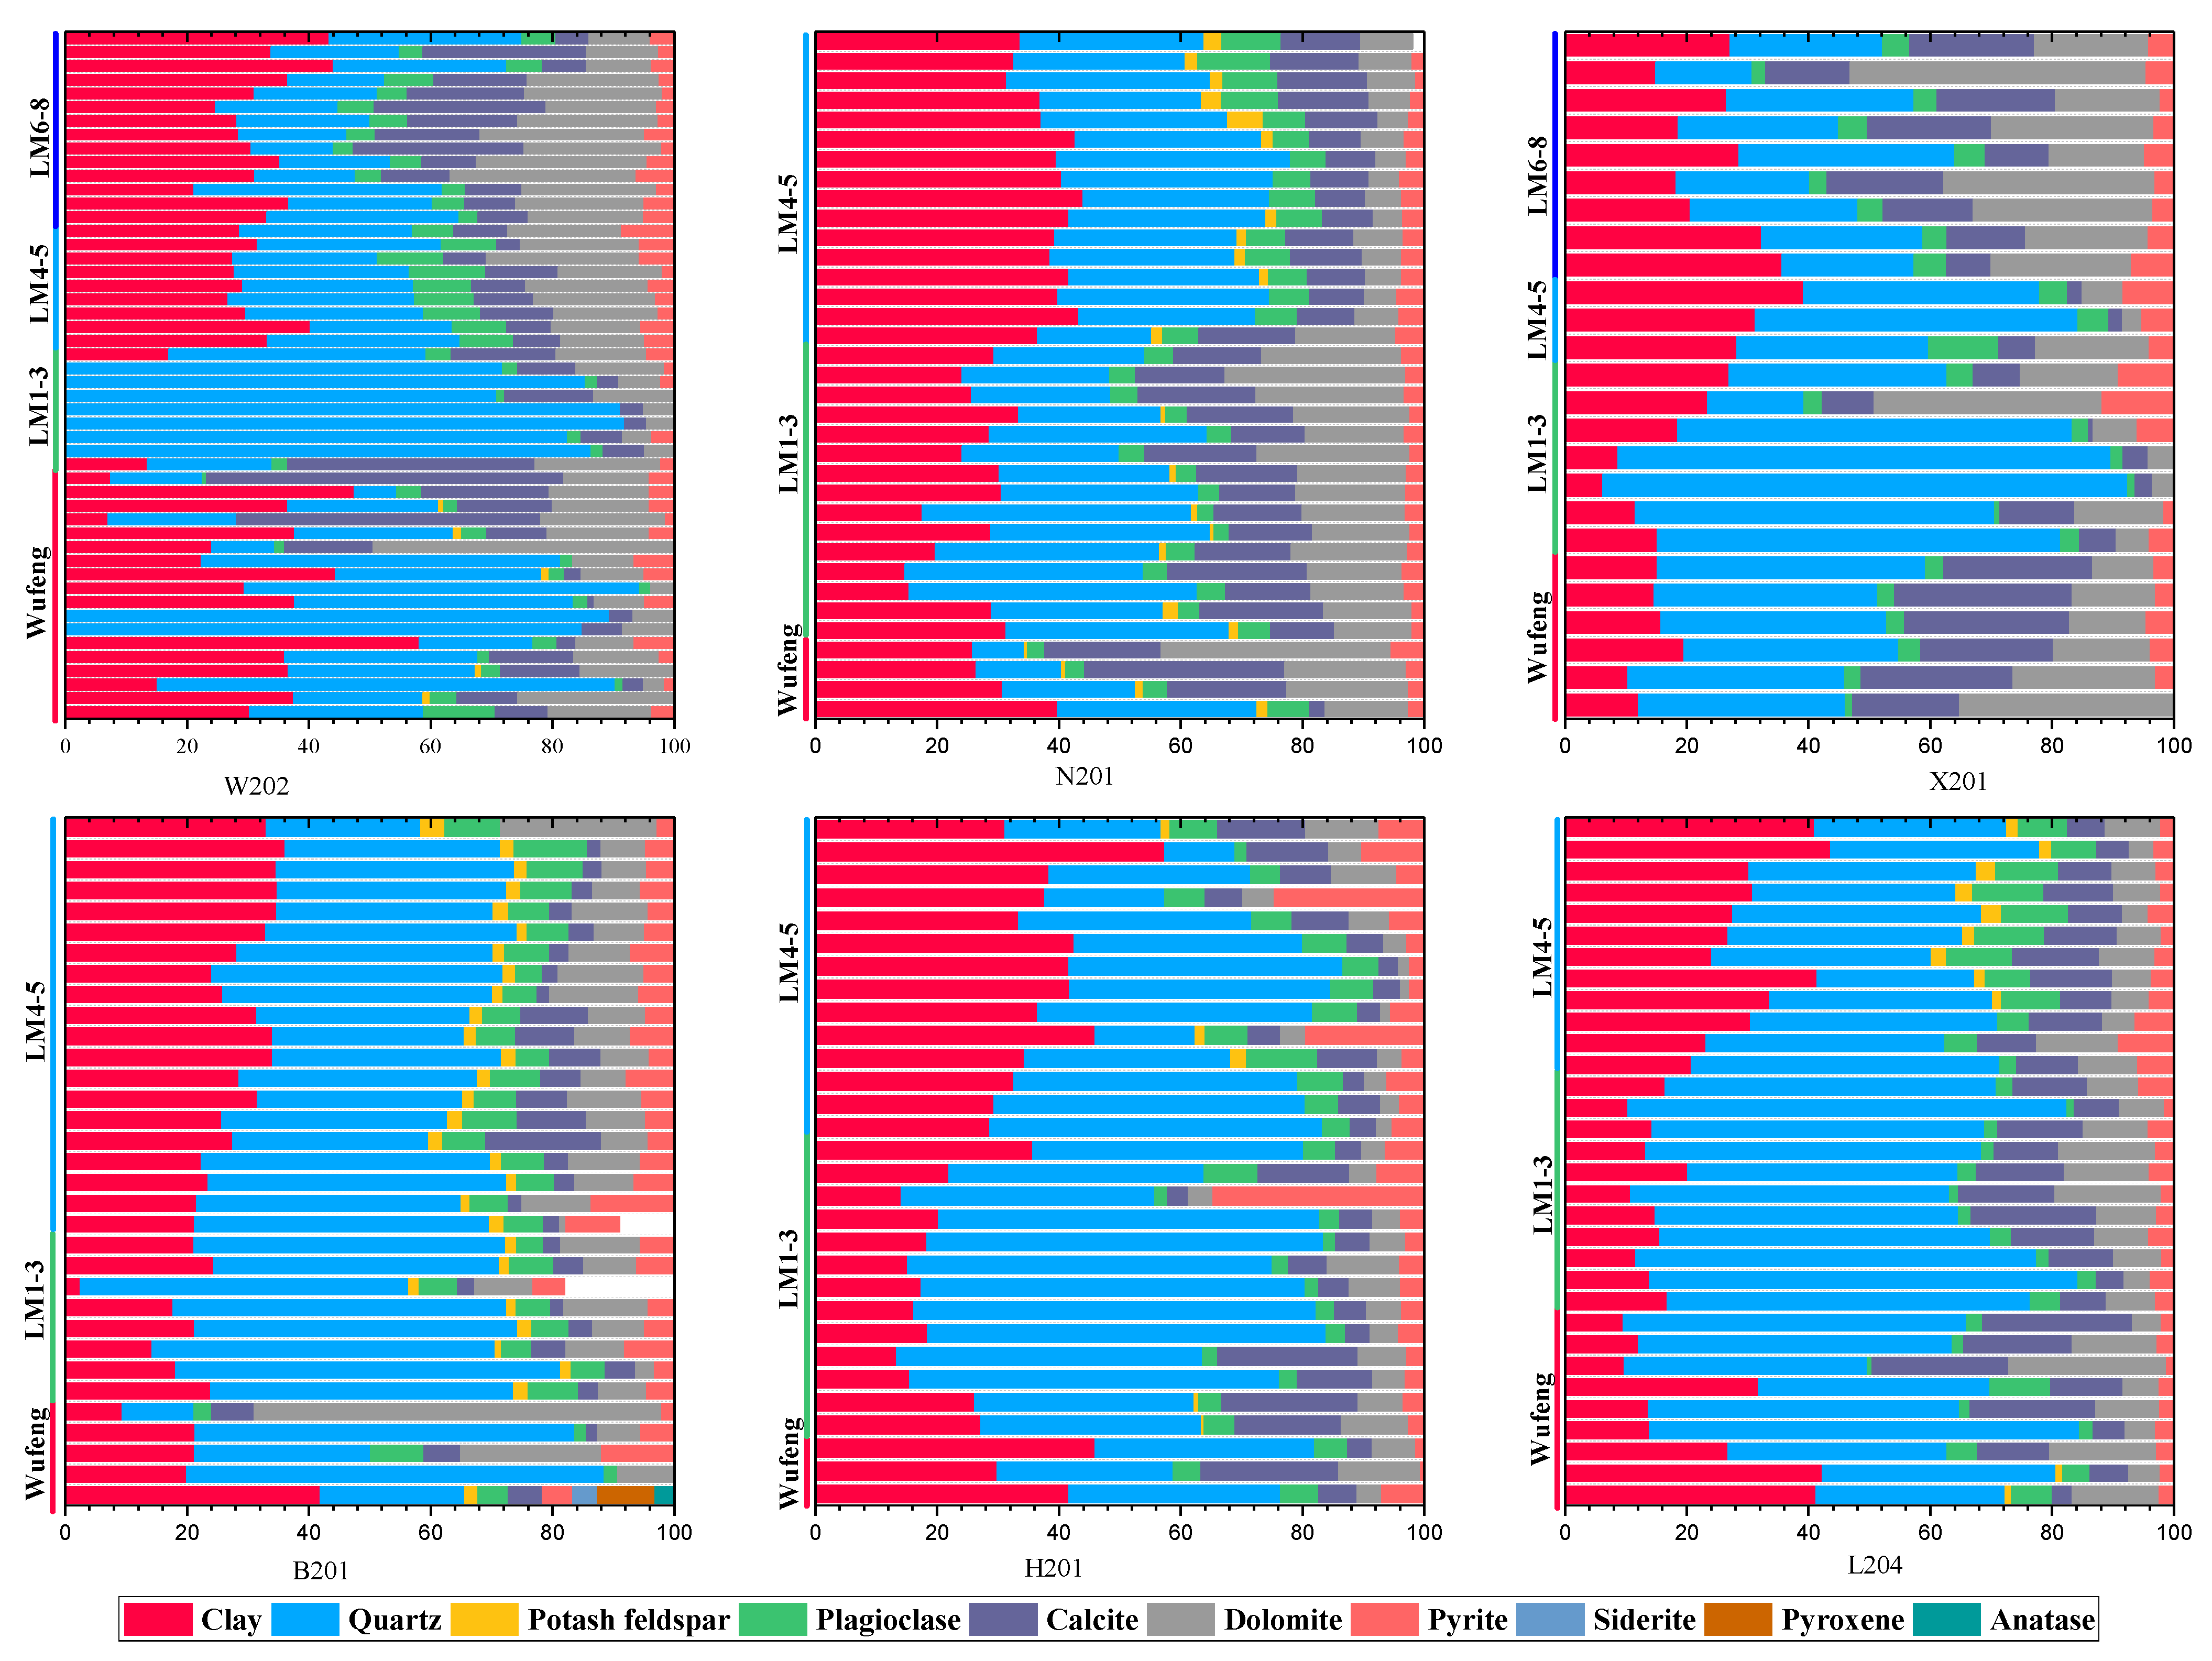
The mineral components of shale samples are determined by the XRD results (Figure 4). The shale samples from different substrata and different wells are mainly composed by clay, quartz, potash feldspar, plagioclase, calcite, dolomite, pyrite, and other minerals (Figure 4). Among these mineral types, the contents of clays, quartz, and carbonates (calcite and dolomite) are usually larger by 20% each. Comparably, the content of other minerals such as pyrite is mainly less than 5%. By comparing the mineral composition of different shale samples from different shale wells and different substrata, it can be found that the mineral composition of different substrata differ significantly. However, the shale samples with the same substrata in different shale gas wells often have a similar mineral composition. The shale samples of LM1-3 substrata usually have the lowest clay mineral and highest quartz contents of all substrata in each well (Figure 4). This is mainly because the mineral composition is mainly determined by the sedimentary environment.
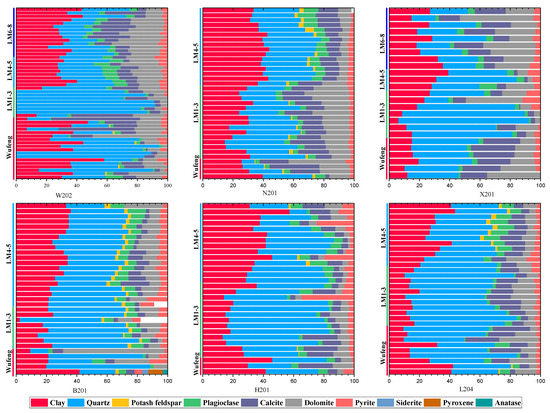
Figure 4.
The mineral composition of the shale samples from the six wells.
3.3. Simulation Results and the Mechanism of N2 Adsorption in Shale
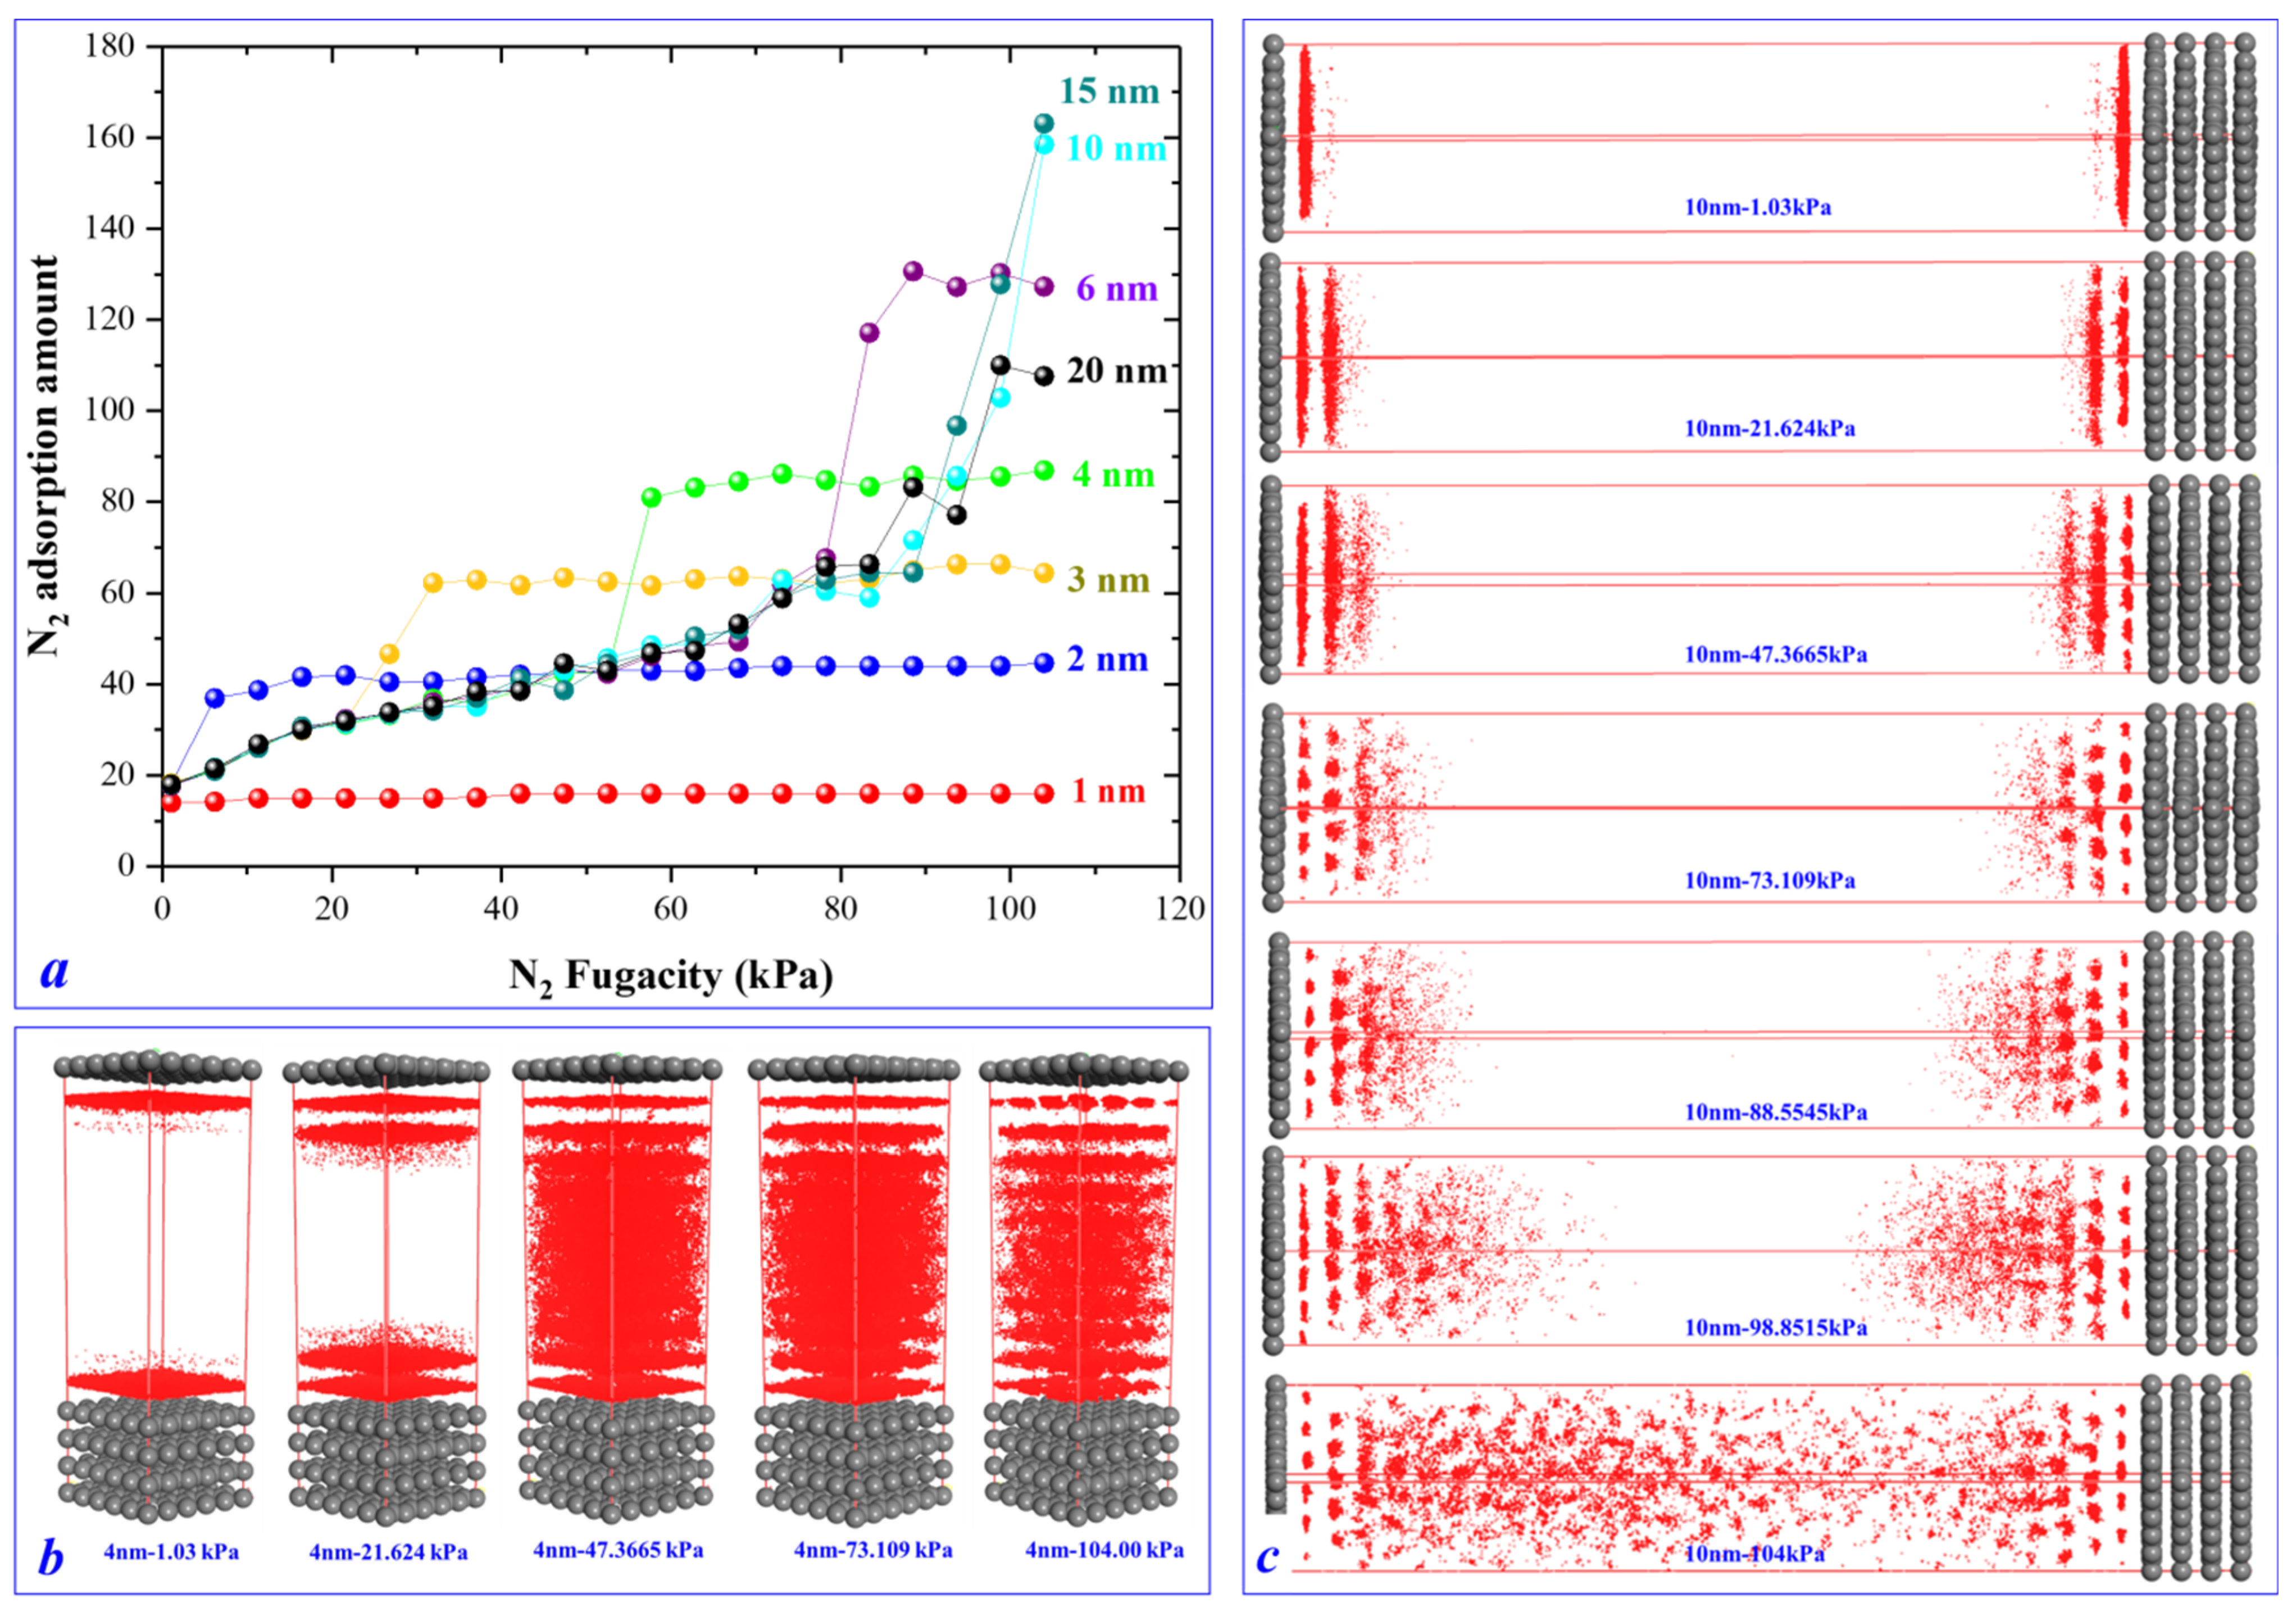
Shales have a pore size that ranges from <1 nm to >1000 nm. Thus, different-sized slit-shaped pores were used in the model. Figure 5a shows the N2 adsorption isotherms for different-sized slit pores at 77.35 K. It can be seen that the N2 adsorption behavior differs significantly in different pore sizes. In 1-nm pores, the N2 adsorption volume reaches the largest value at low pressure and then remains flat with increasing pressure. In 2-nm slit pores, the N2 adsorption amount reaches the maximum value at 8 kPa, and then remains stable with an increase in pressure (Figure 5a). It should be noted that in small nanoscale pores, the N2 molecule fills up the pore space at the low-pressure stage. In these small pores, there is little space for N2 storage, and thus, with increasing pressure, the volume of N2 does not increase. In larger pores, the pressure at which the maximum volume of N2 fills the pore space is greater as shown in Figure 5a. For example, in 2-nm pores, the pressure at which the pore space is filled is about 8 kPa. Comparably, in 3-nm, 4-nm and 6-nm slit pores, the corresponding pressure (the pressure at which the pore space is filled) is 33 kPa, 57 kPa, and 96 kPa, respectively (Figure 5a).
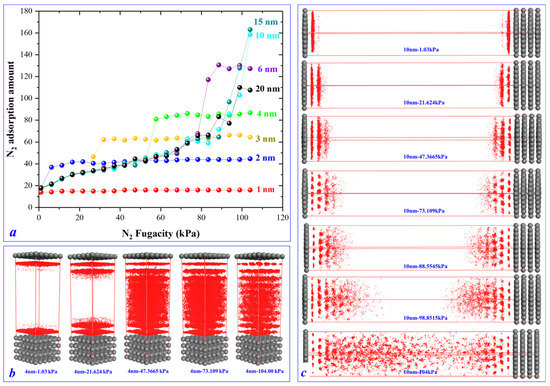
Figure 5.
(a) N2 adsorption isotherms in different-sized slit pores; (b) N2 density distribution in the 4 nm slit pore; (c) N2 density distribution in 10 nm slit pore.
From Figure 5a, it can also be seen that small nanoscale pores have their own dominant pressure stages. At 8 kPa–20 kPa, the 2-nm pores contain the largest volume of N2. At 35 kPa–50 kPa, the 3-nm pores contain the largest volume of N2 and at 60 kPa–80 kPa, the largest volume of N2 is in the 4-nm pores. These dominant pressure stages for each size of slit pores can be used to identify the pore structure based on low-pressure N2 adsorption experiments. Figure 5b shows the N2 density distribution in 4-nm pores at different pressures. By increasing the pressure, N2 adsorption is performed layer by layer. At 1.03 kPa, there is a main adsorption layer in 4-nm slit pores. At 21.6 kPa and 47.3 kPa, there are two and three main adsorption layers, respectively. At 73.1 kPa, N2 would fill up the whole pore space.
Figure 5c shows the N2 volume density distribution in 10nm pores at different pressures. When the pressure is less than 47.3 kPa, N2 adsorption in 10-nm pores is similar to that in 4-nm pores. However, when the pressure is greater than 73.1 kPa, the N2 adsorption behavior in 10-nm pores is quite different. In 10-nm pores, there is more space, and more layers of N2 can be formed at relatively high pressures, as shown in Figure 5. By analyzing Figure 5a–c, it can be also seen that, in different-sized slit pores, the N2 saturation pressures are different. This makes the experimental N2 adsorption and desorption isotherms difficult to analyze.
3.4. Experimental Adsorption and Desorption Isotherms
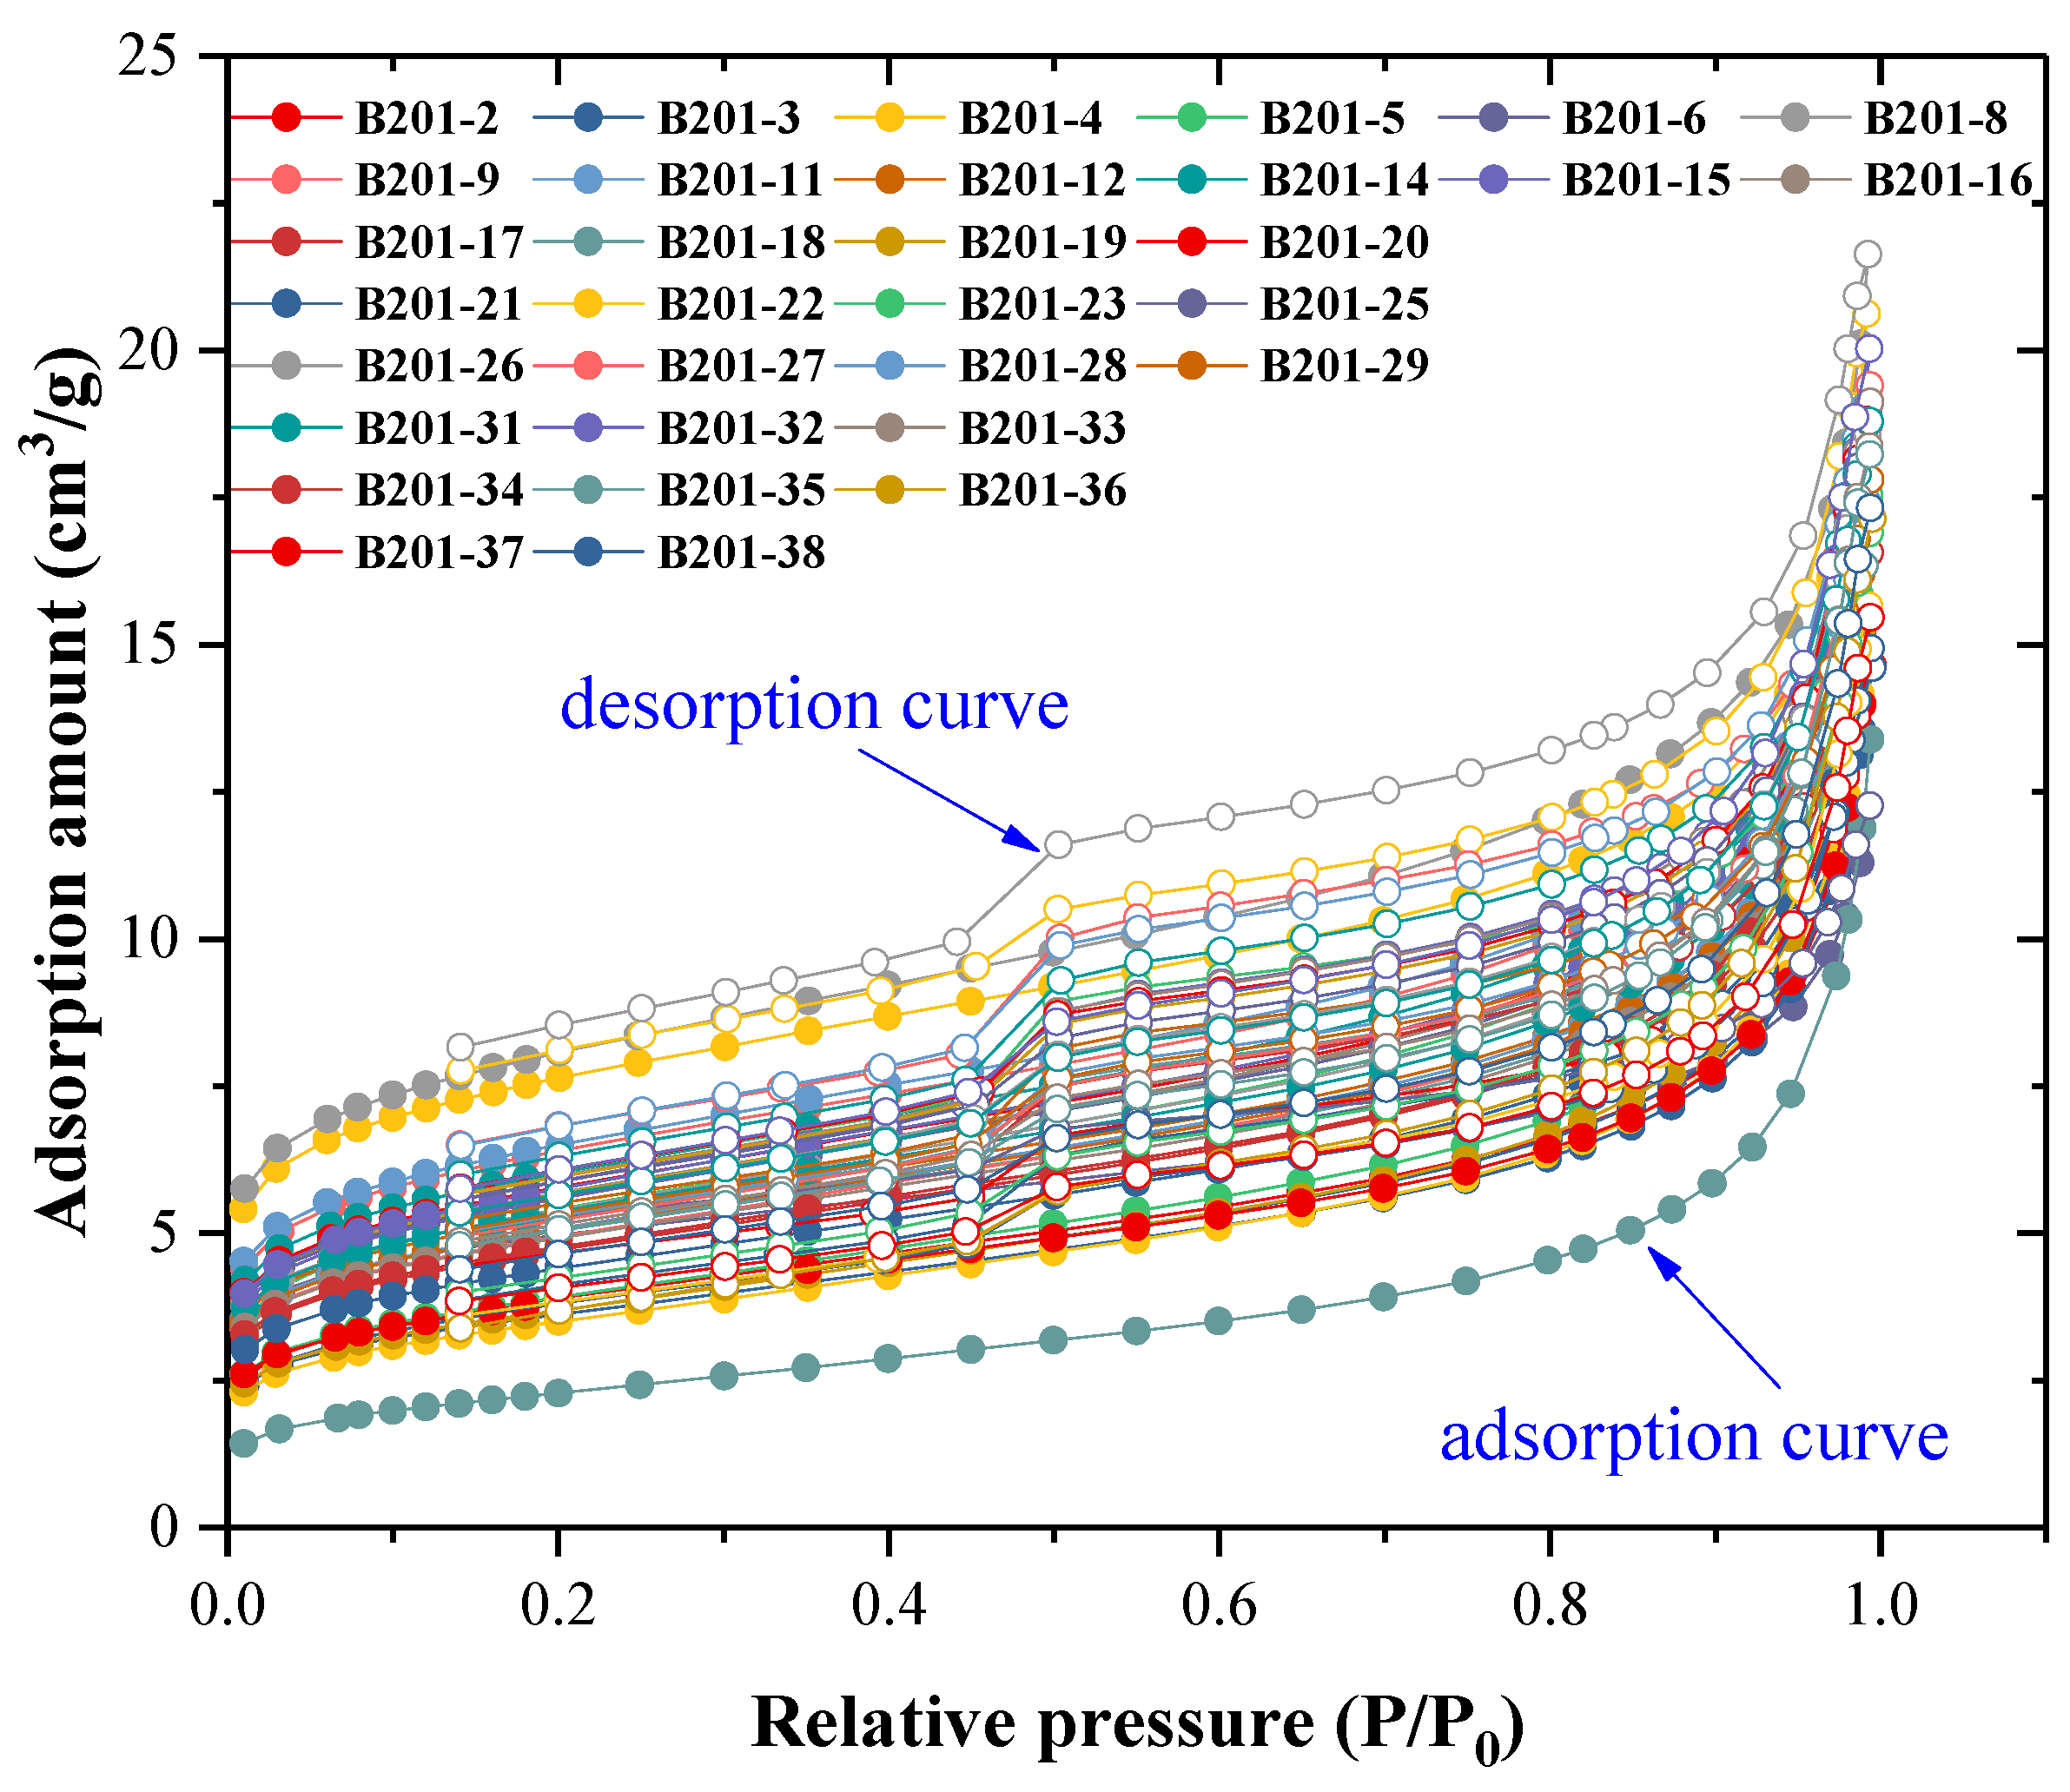
Considering that there are too many experimental data to put all the N2 adsorption and desorption data of 196 samples in one or two figures, the adsorption and desorption isotherms of the shale samples from well B201 were chosen to represent the adsorption and desorption characteristics as shown in Figure 6. It can be seen that when the relative pressure (P/P0) = 0.01, the initial mass of N2 adsorbed by the shale samples is greater than 4 cm3/g, indicating that some shale samples have relatively large surface area or micropore volume (Figure 6). When P/P0 increases from 0.1 to 0.8, the volume of N2 adsorbed by all the shale samples increases slowly.

Figure 6.
The experimental N2 adsorption and desorption curves of shale samples from B201 well.
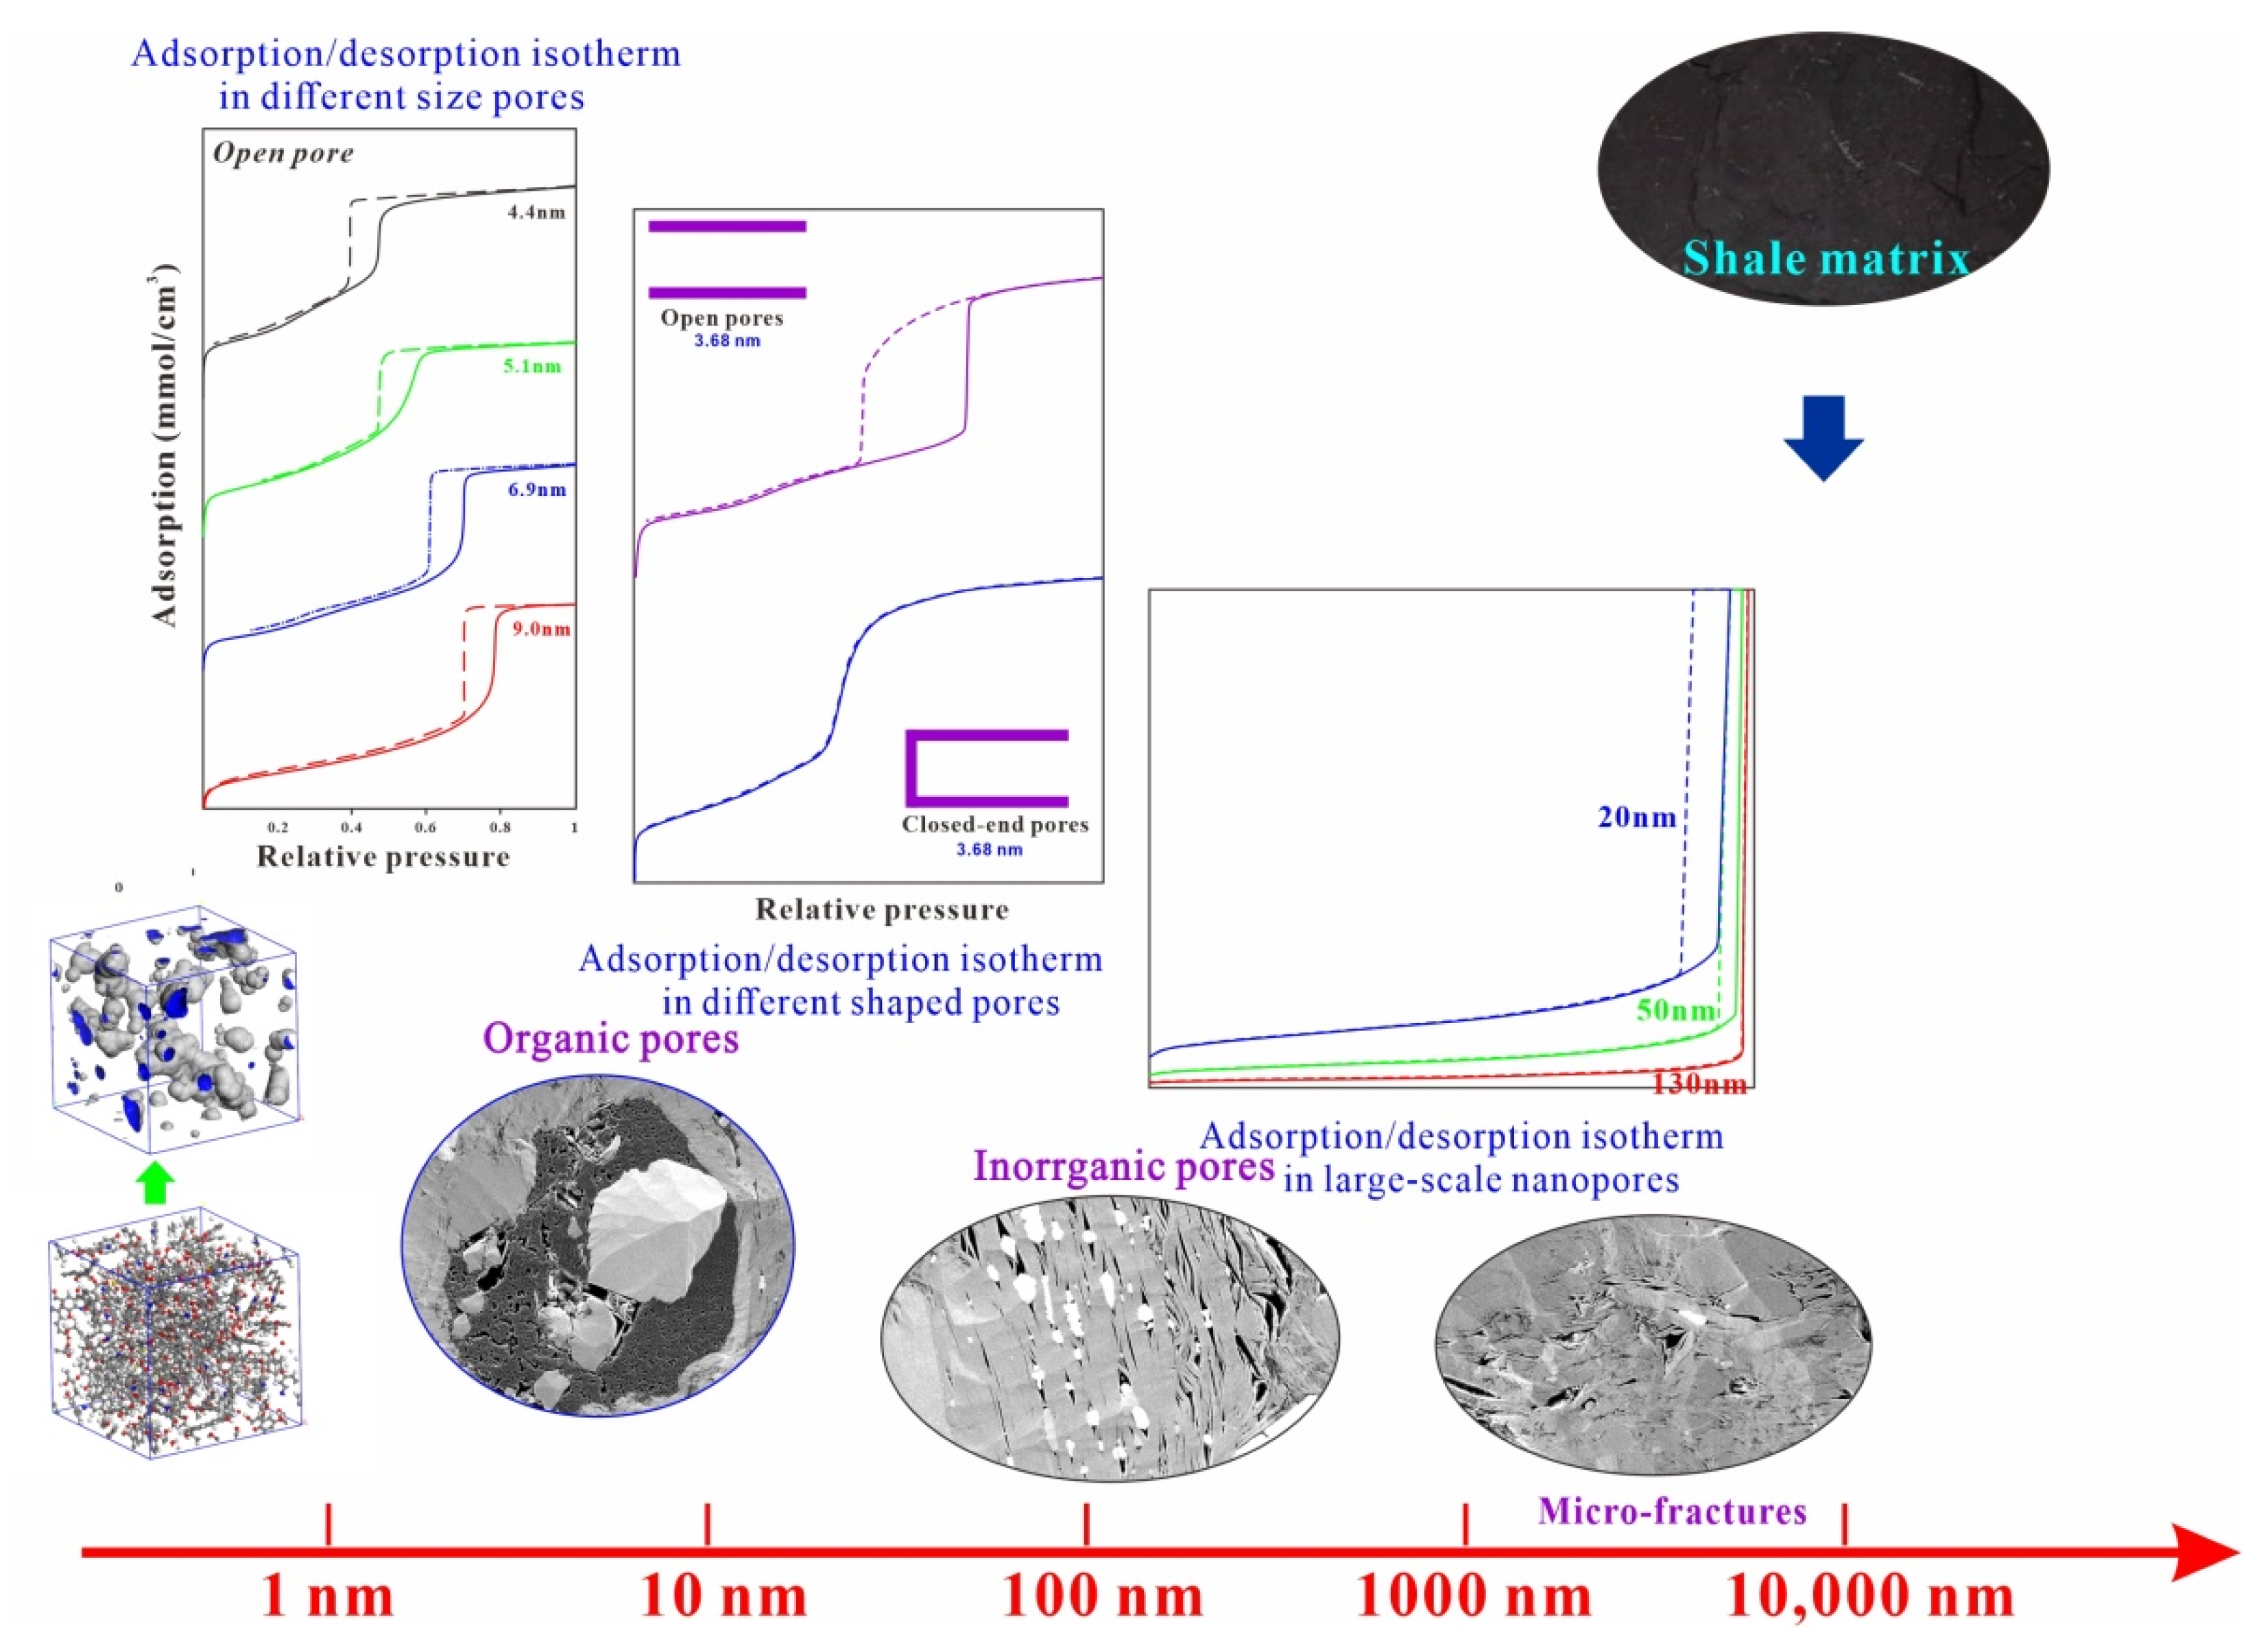
The adsorption isotherms, desorption isotherms and hysteresis loops of the gas adsorption reflect the pore structure of the porous material [44,45]. Based on molecular simulation, the adsorption and desorption isotherms of individual pores can be obtained [44] (Figure 7). As the shale contains different-sized and different-shaped pores, by analyzing the adsorption and desorption isotherms of different pores, the experimental adsorption and desorption isotherms can be better understood (Figure 7). Based on the simulation results in the work of Neimark et al. [45], with increasing pore size, the hysteresis loops shift to greater pressure (condensation and evaporation pressure both increase) (Figure 7). However, when we analyze desorption isotherms of all the shale samples, it can be found that the evaporation pressures are all around 0.5 (P/P0). It indicates that there are pores around 6 nm that provide significant pore volume.

Figure 7.
Adsorption and desorption loops in different sized and different shaped ideal pores [37,38,45]. Adapted with permission from Ref. [37]. Copyright 2016 Elsevier Ltd. Adapted with permission from Ref. [38]. Copyright 2015 Elsevier Inc. Adapted with permission from Ref. [45]. Copyright 2000 American Physical Society.
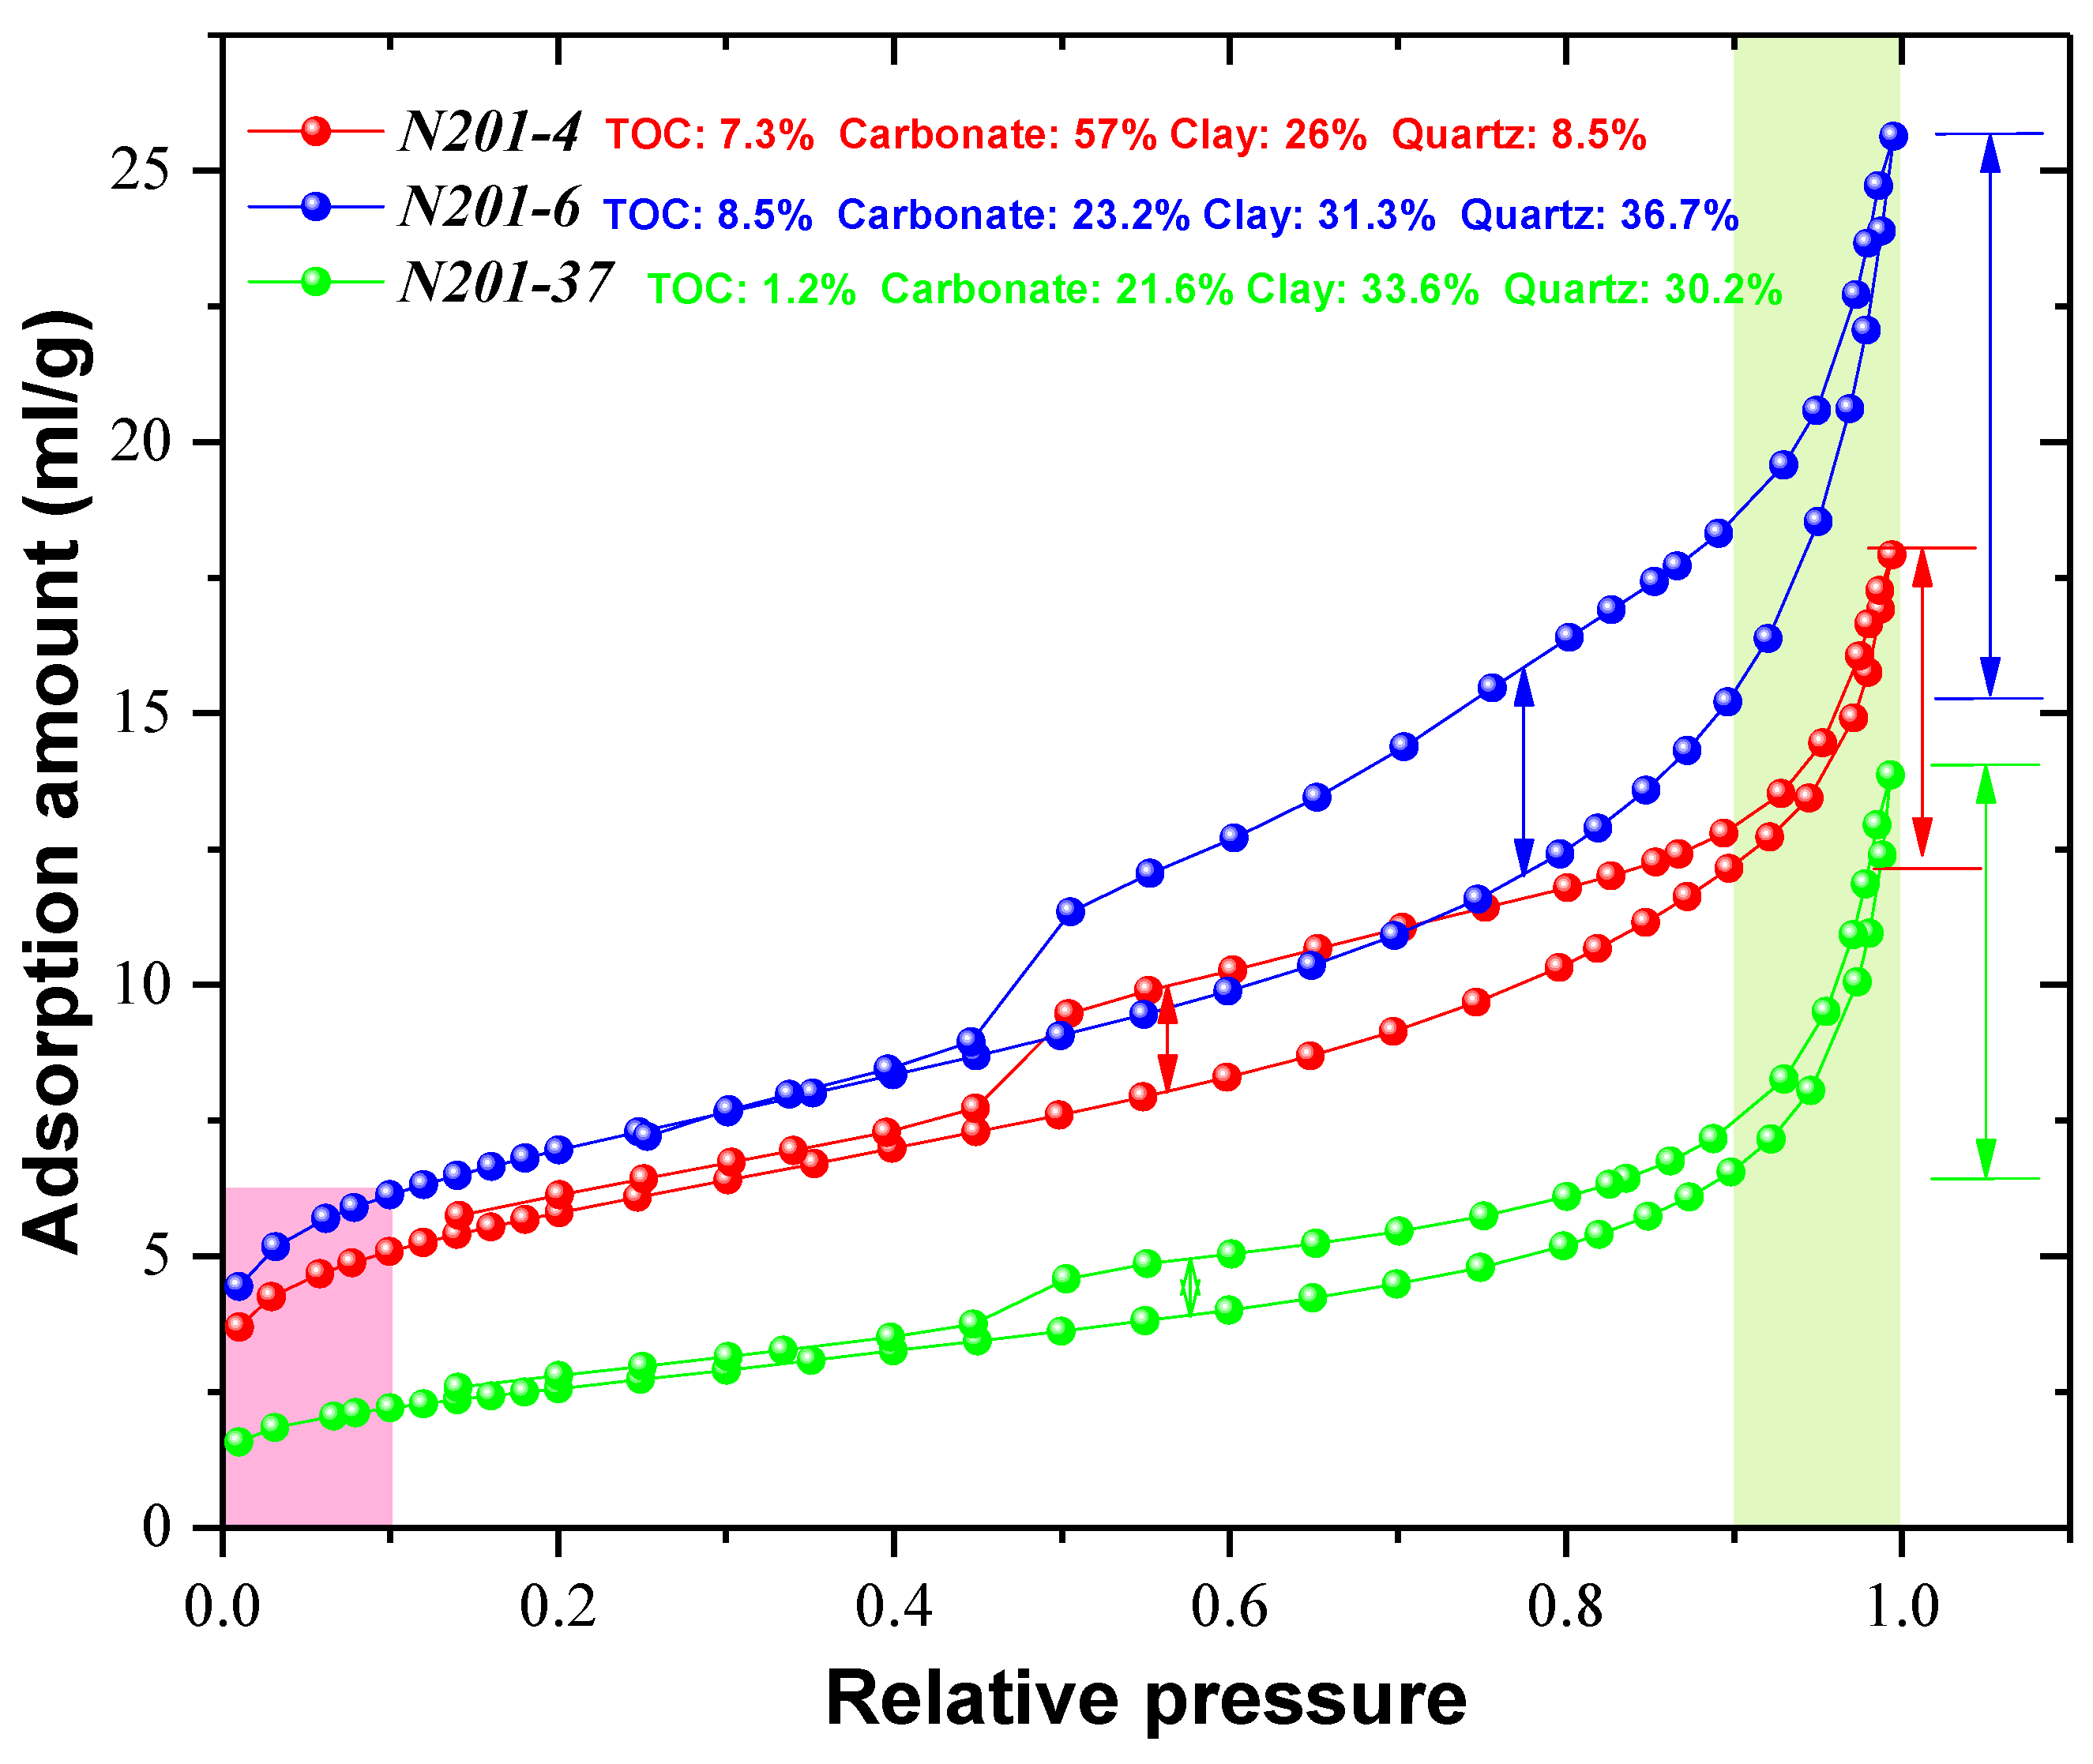
By analyzing the N2 adsorption and desorption isotherms of 196 shale samples, there are three types of N2 adsorption desorption isotherms. We chose a representative curve for each type as shown in Figure 8. Among the three N2 adsorption and desorption isotherms, N201-4 has the largest adsorption volume at each pressure. The difference between the adsorption and desorption loop of shale sample N201-4 is also the largest. In contrast, the adsorption and desorption loop of shale sample N201-37 is quite narrow and the N2 adsorption amount is less than the other two. As shown in Figure 8, when the relative pressure is greater than 0.9, the adsorption amounts increase sharply for all shale samples. Based on Figure 5 and Figure 7, with increasing pressure from 0.9 to 1.0, N2 condensation occurs in all large pores (>10 nm). Before that, smaller pores are fully filled with molecular N2. And the surface of the large pores has been covered by the N2 molecules. Thus, the incremental adsorption amounts are from the inner space of the large pores. These spaces are the storing places for free gas.
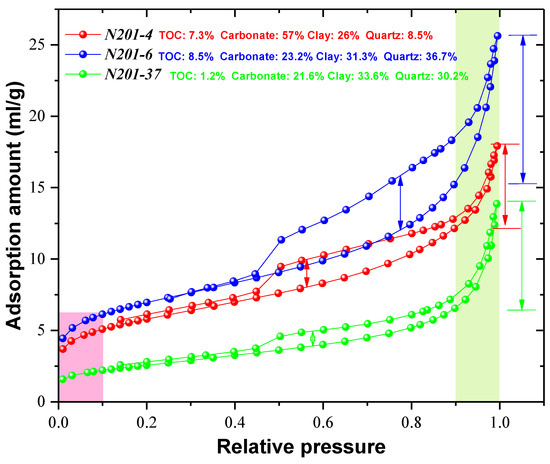
Figure 8.
Representative adsorption and desorption isotherms among all the experimental N2 adsorption data.
For shale gas studies, the connectivity of pore system and the volume of large nanopores (>10 nm, having large storage capacity and gas circulation) is of significant interest. From Figure 7, it can be seen that the adsorption and desorption curves of the open pores which have good connection in the pore system have wide hysteresis loops, whereas those of closed-end pores have quite narrow hysteresis loops. Thus, the hysteresis loops could reflect the connectivity of the pore system. When the P/P0 is smaller than 0.5, the adsorption curve overlaps the desorption curve. When the P/P0 is larger than 0.8, the differences between the adsorption amounts on the adsorption curve and desorption curve decrease rapidly. The differences between the adsorption amounts on the adsorption curve and desorption curve at P/P0 = 0.8 and P/P0 = 0.5 could represent the N2 hysteresis loops. In addition, if there are many large-sized pores (>6 nm), the adsorption amount would significantly increase when the P/P0 > 0.9 (Figure 5 and Figure 7). At this pressure stage, N2 condensation begins and the adsorption amount is controlled by the volume of shale pore. These pores are very significant for the free gas storage. Based on the mechanism of N2 adsorption in nanopores and the experimental N2 adsorption and desorption isotherms of the shale samples (Figure 5 and Figure 7), we propose two parameters to reflect (i) the connectivity of the pore volume and (ii) the volume of large nanopores in shale, namely the connectivity index and large-pore volume index. The calculation methods are listed in Equations (2) and (3). The larger connectivity index means a larger hysteresis loop and better connectivity, whereas the larger pore volume index means there is more volume in large pores for N2 condensation, which also means more free gas can be stored in these shales:
where: Dep/p0 = 0.8 is the adsorption amount at P/P0=0.8 during the desorption process, ADp/p0 = 0.8 is the adsorption amount at P/P0=0.8 during the adsorption process, Dep/p0 = 0.5 is the adsorption amount at P/P0 = 0.5 during the desorption process, ADp/p0 = 0.5 is the adsorption amount at P/P0 = 0.5 during the adsorption process, ADp/p0 = 1.0 is the adsorption amount at P/P0 = 1.0 during the adsorption process, and ADp/p0 = 0.9 is the adsorption amount at P/P0 = 0.9 during the adsorption process.
Connectivity Index = Dep/p0 = 0.8 − ADp/p0 = 0.8 + Dep/p0 = 0.5 − ADp/p0 = 0.5
Large-pore volume index = ADp/p0 = 1.0 − ADp/p0 = 0.9,
4. Discussion
4.1. Overall Analysis of Factors That Influence Pore Structure
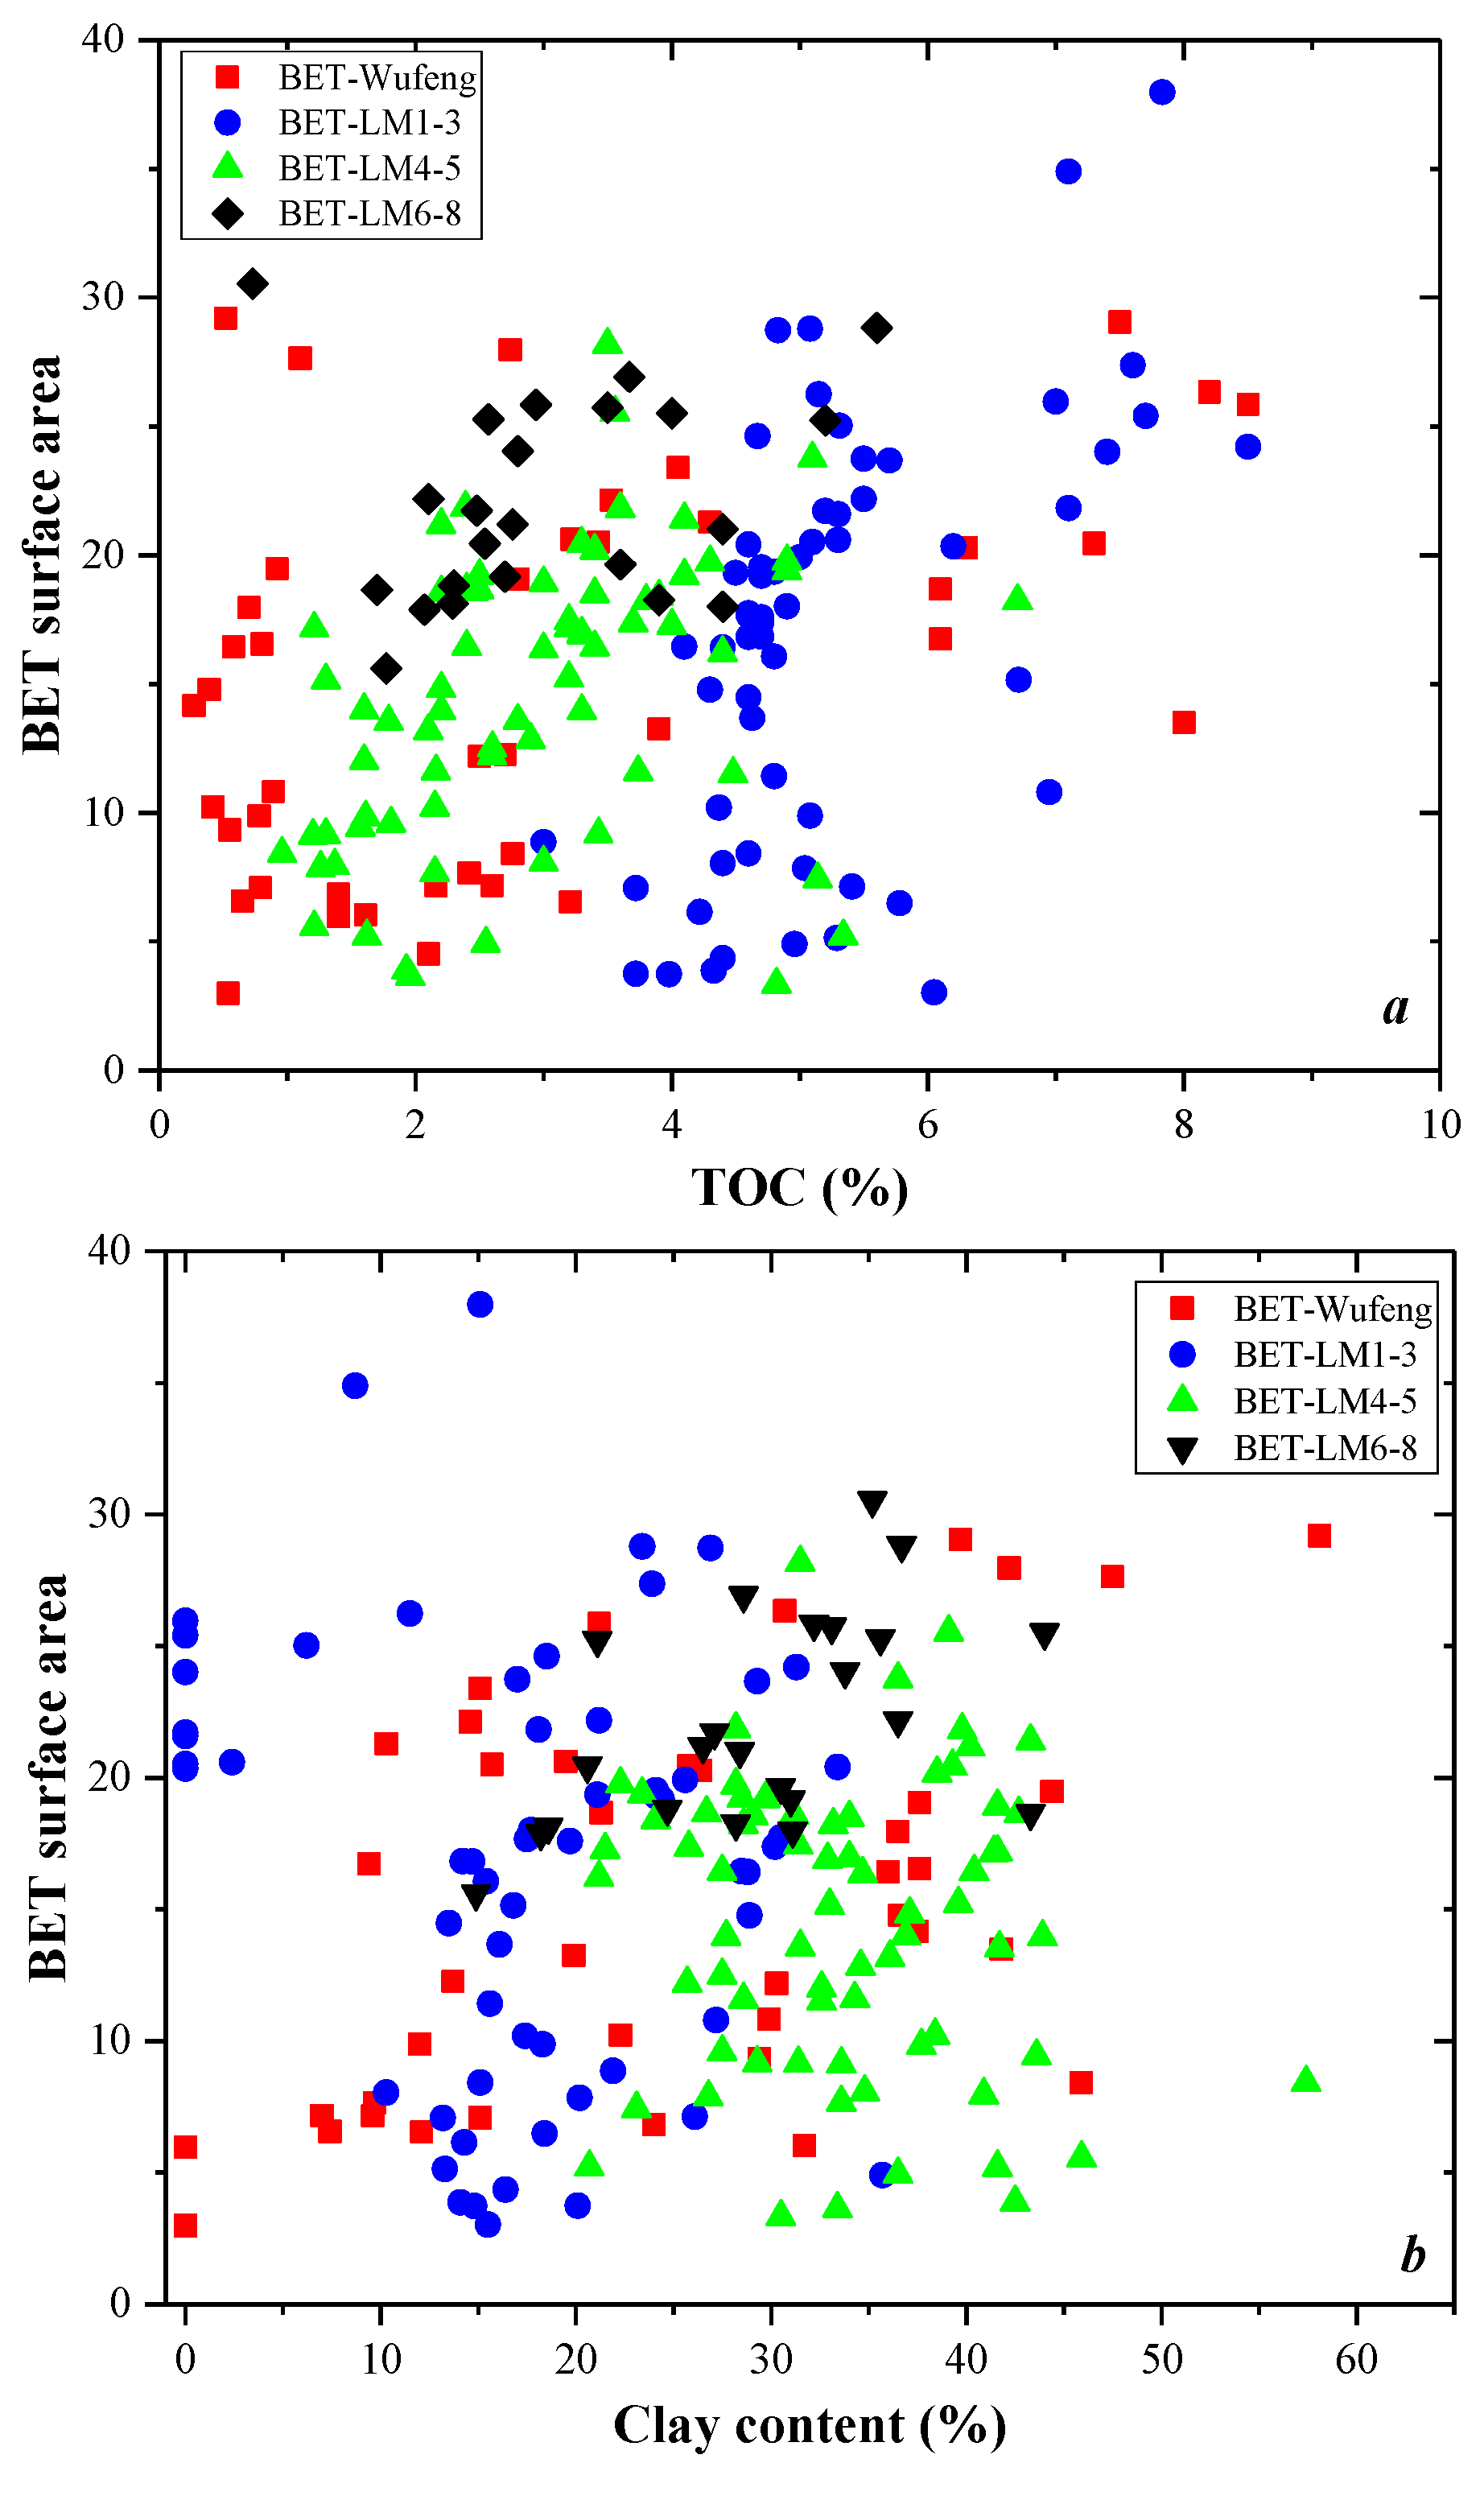
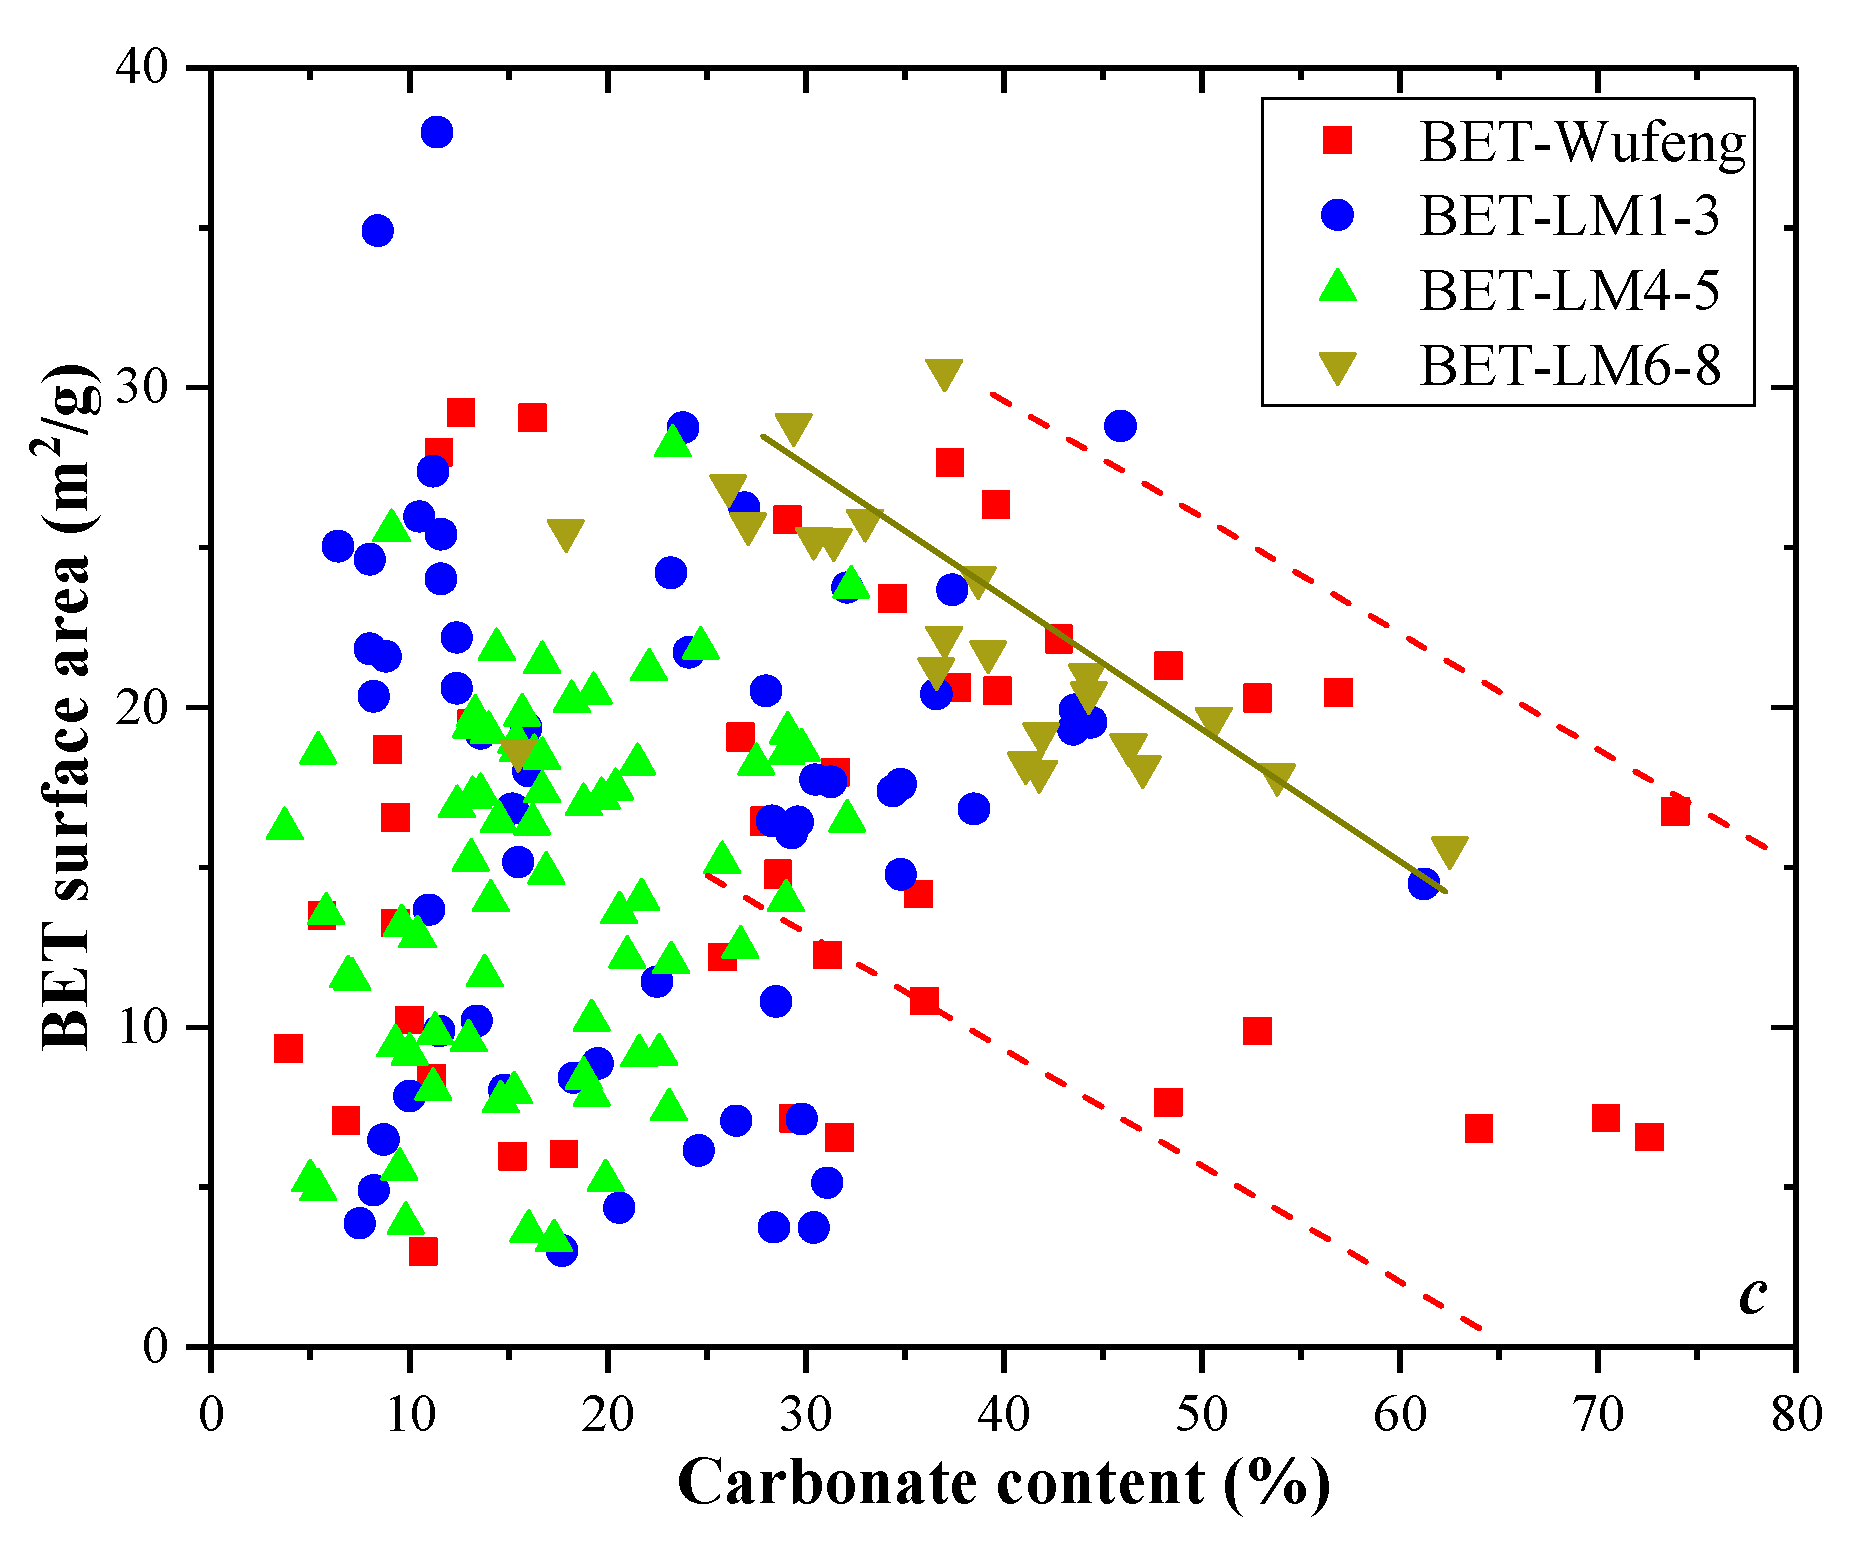
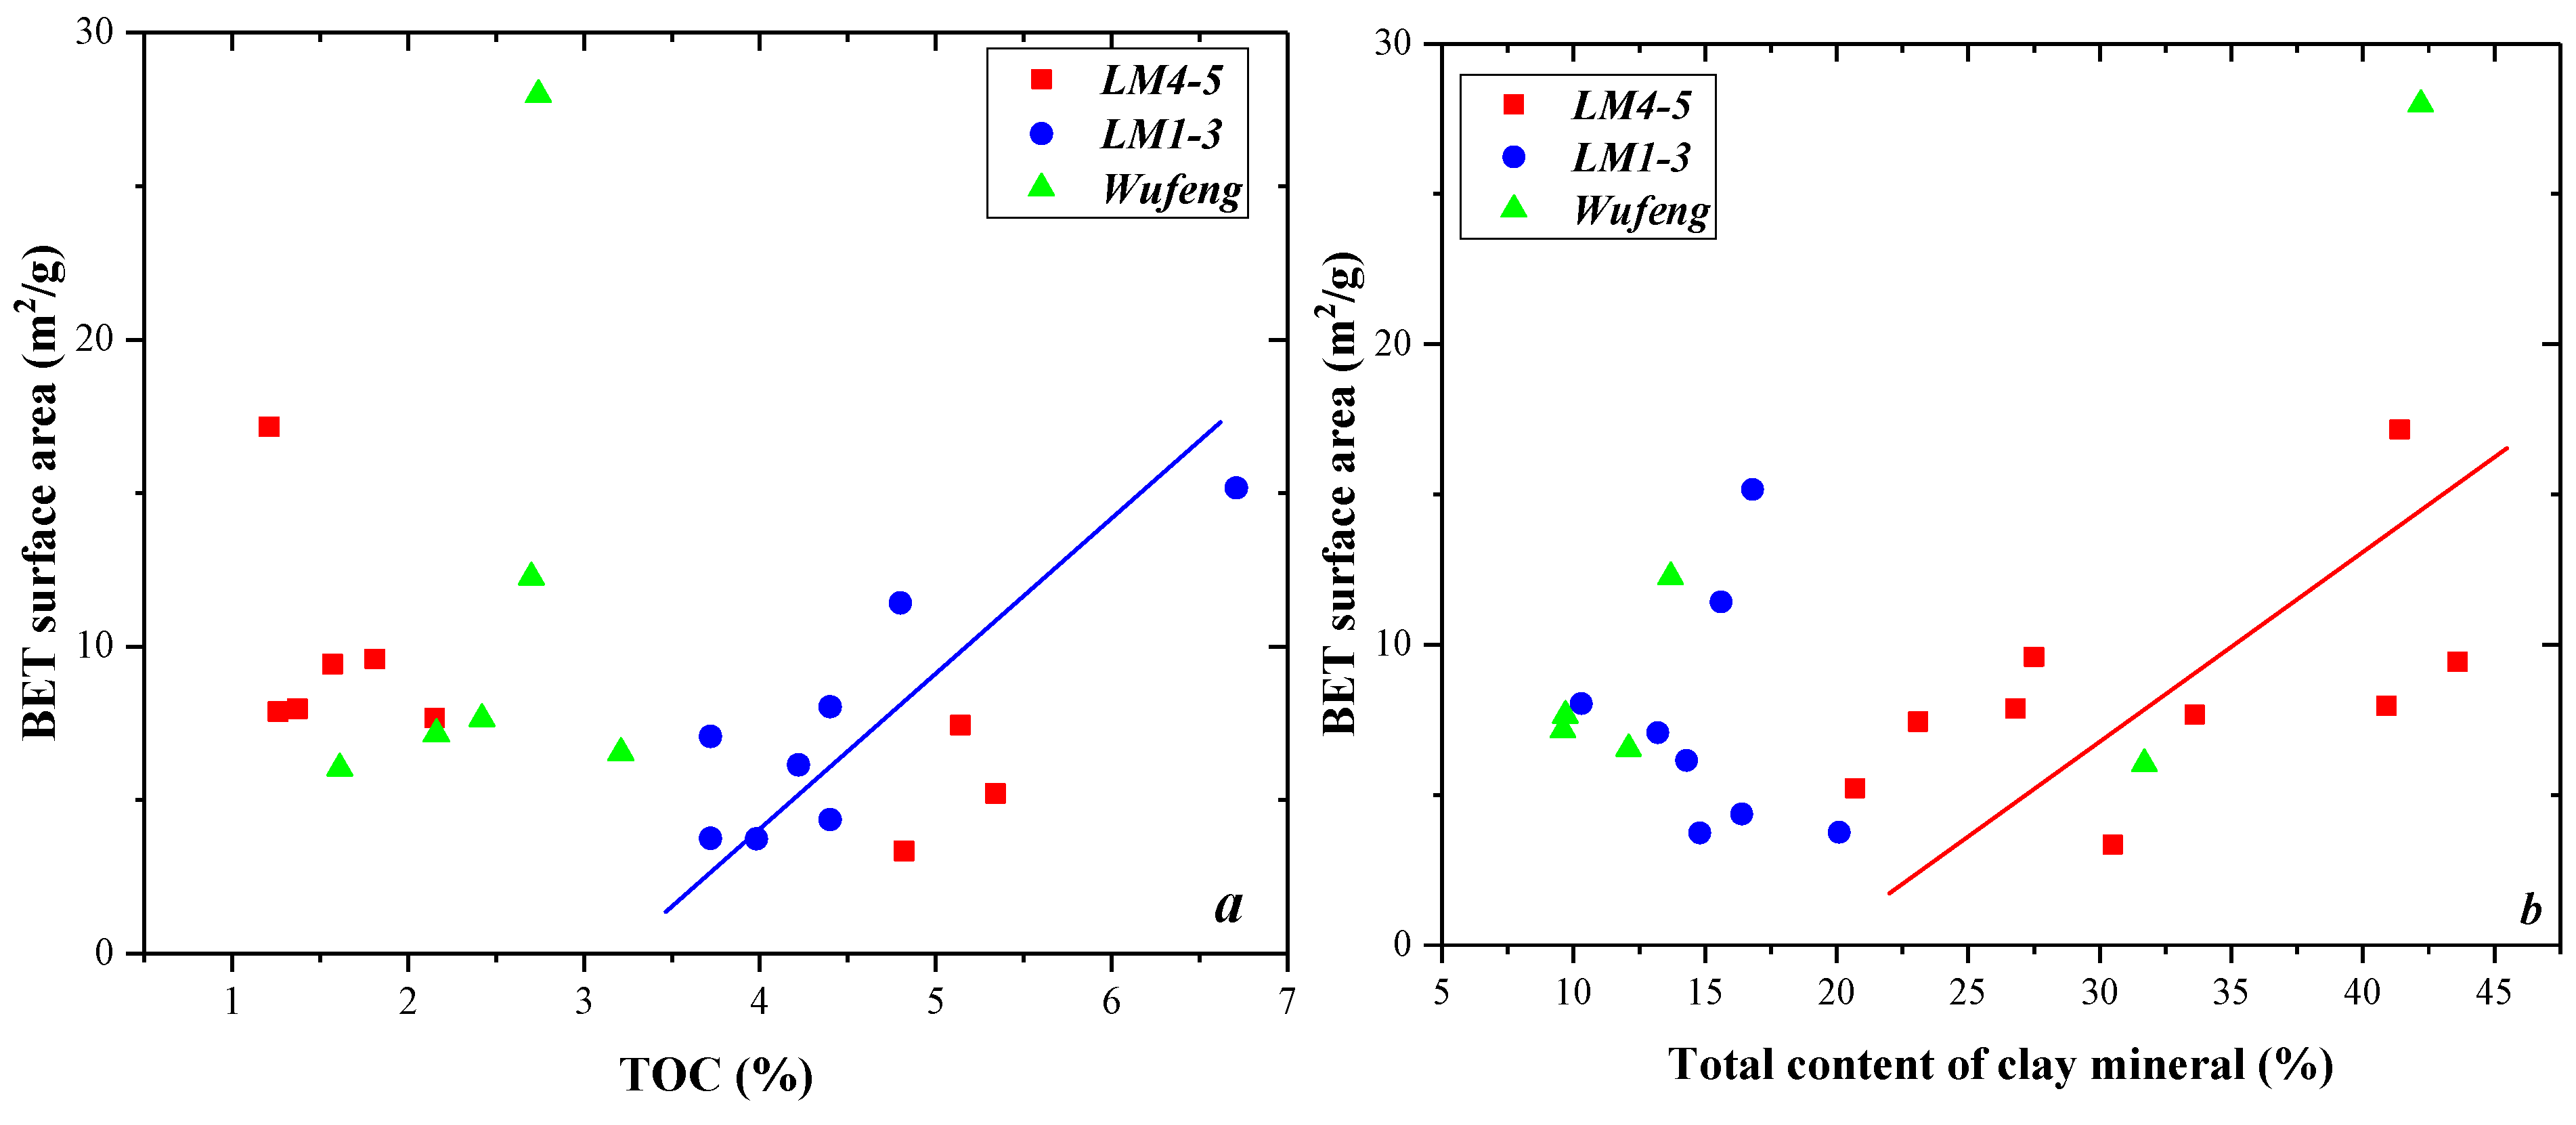
To better analyze the controlling factors of pore structure in organic shale, the BET surface area data of all 196 shale samples are presented in Figure 9a–c. Previous studies suggest that OM pores are the most important components of pore systems in organic rich shale; hence TOC content usually has a good positive correlation with BET surface area [7,46,47,48]. However, there is no correlation between the BET surface area and TOC content in this study (Figure 9a). In fact, this relationship is very complicated and is caused by several factors, such as tectonic compaction, filling and blocking of primary kerogen pores, and limited thermal conversion into liquid hydrocarbons [49,50]. Therefore, the effect of organic matter on the pore structure of shale samples from different wells may be quite different.
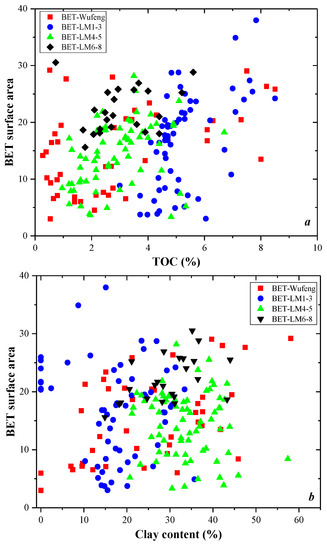
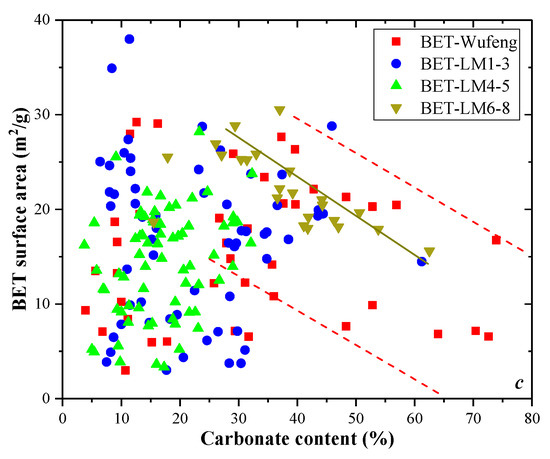
Figure 9.
The correlations between BET surface area and TOC content (a), clay content (b), and carbonate content (c) of all 196 shale samples (sample L204-4 has an extremely large BET value, and is not presented in these figures. Data for sample L204-5: TOC-5.25%, quartz content: 65.8%; clay content-11.6%; BET-56.87 m2/g, BJH volume-0.0534 cm3/g).
The absence of significant correlations between BET surface area and the clay content of 196 shale samples can be seen in Figure 9b. Yang and Aplin [51] also observed that no apparent correlation between the clay content and specific surface area in the Horn River Group shale in Canada. Some studies have even documented that a slightly negative correlation between the specific surface area and total clay mineral content of some marine shale [52,53]. Chalmers and Bustin [54] attributed these insignificant or negative relationships to the fact that the clay-associated pores are usually mesopores and macropores, which only contribute very limited pore volume and specific surface area. In addition, due to the ductility of clay minerals and the lack of shelter from rigid matrix minerals, tectonic compaction can easily destroy the internal porosity in the shale reservoir with high clay mineral content, leading to a sharp reduction of the pore volume within the shale matrix.
The positive correlation between porosity and quartz content has been reported in studies of major marine shale in south China [55] and Devonian gas shale in northern Canada [56]. Many studies attribute this correlation to rigid matrix minerals with high compressive strength, a high Young’s modulus, and a low Poisson’s ratio, which can create stress shadows that shield adjacent nanopores, especially the pores related to non-load-bearing minerals from compaction [48,57]. However, this relationship is not significant in this study, even when the carbonate content exceeds 40% and the pore surface area decreases with increasing carbonate content. In fact, carbonate minerals could shelter the pores from compaction, but the excessive carbonate may lead to the decrease of macropores due to precipitation within pore spaces [58].
4.2. Geological Controls on Pore Structure in Shale Samples from Each Well
For shale gas reservoirs from different structural locations, different diagenesis and tectonism can not only directly affect the pore structure, but also indirectly affect the pore structure by affecting other factors that can control the pore structure [30,59,60]. In addition, for the different sedimentary substrata in the Wufeng–Longmaxi formation, the sources of OM and sedimentary microfacies are different, and this results in differences in TOC content and mineral composition (Figure 3 and Figure 4). To help elucidate the factors that influence pore structure in Wufeng–Longmaxi shale, data for samples from different shale gas wells have been analyzed in detail in the following sections. As a result, the six shale gas wells can be divided into three types according to the key factors controlling the pore properties. For each type of shale gas well, the controlling factors of pore structure in organic shale are different (Type I: pore properties are mainly controlled by the TOC content; Type II: pore properties of shales in different substrata are controlled by different factors; Type III: pore properties are not obviously controlled by either TOC content or mineral content.).
4.2.1. Type I: Pore Properties Are Mainly Controlled by the TOC Content
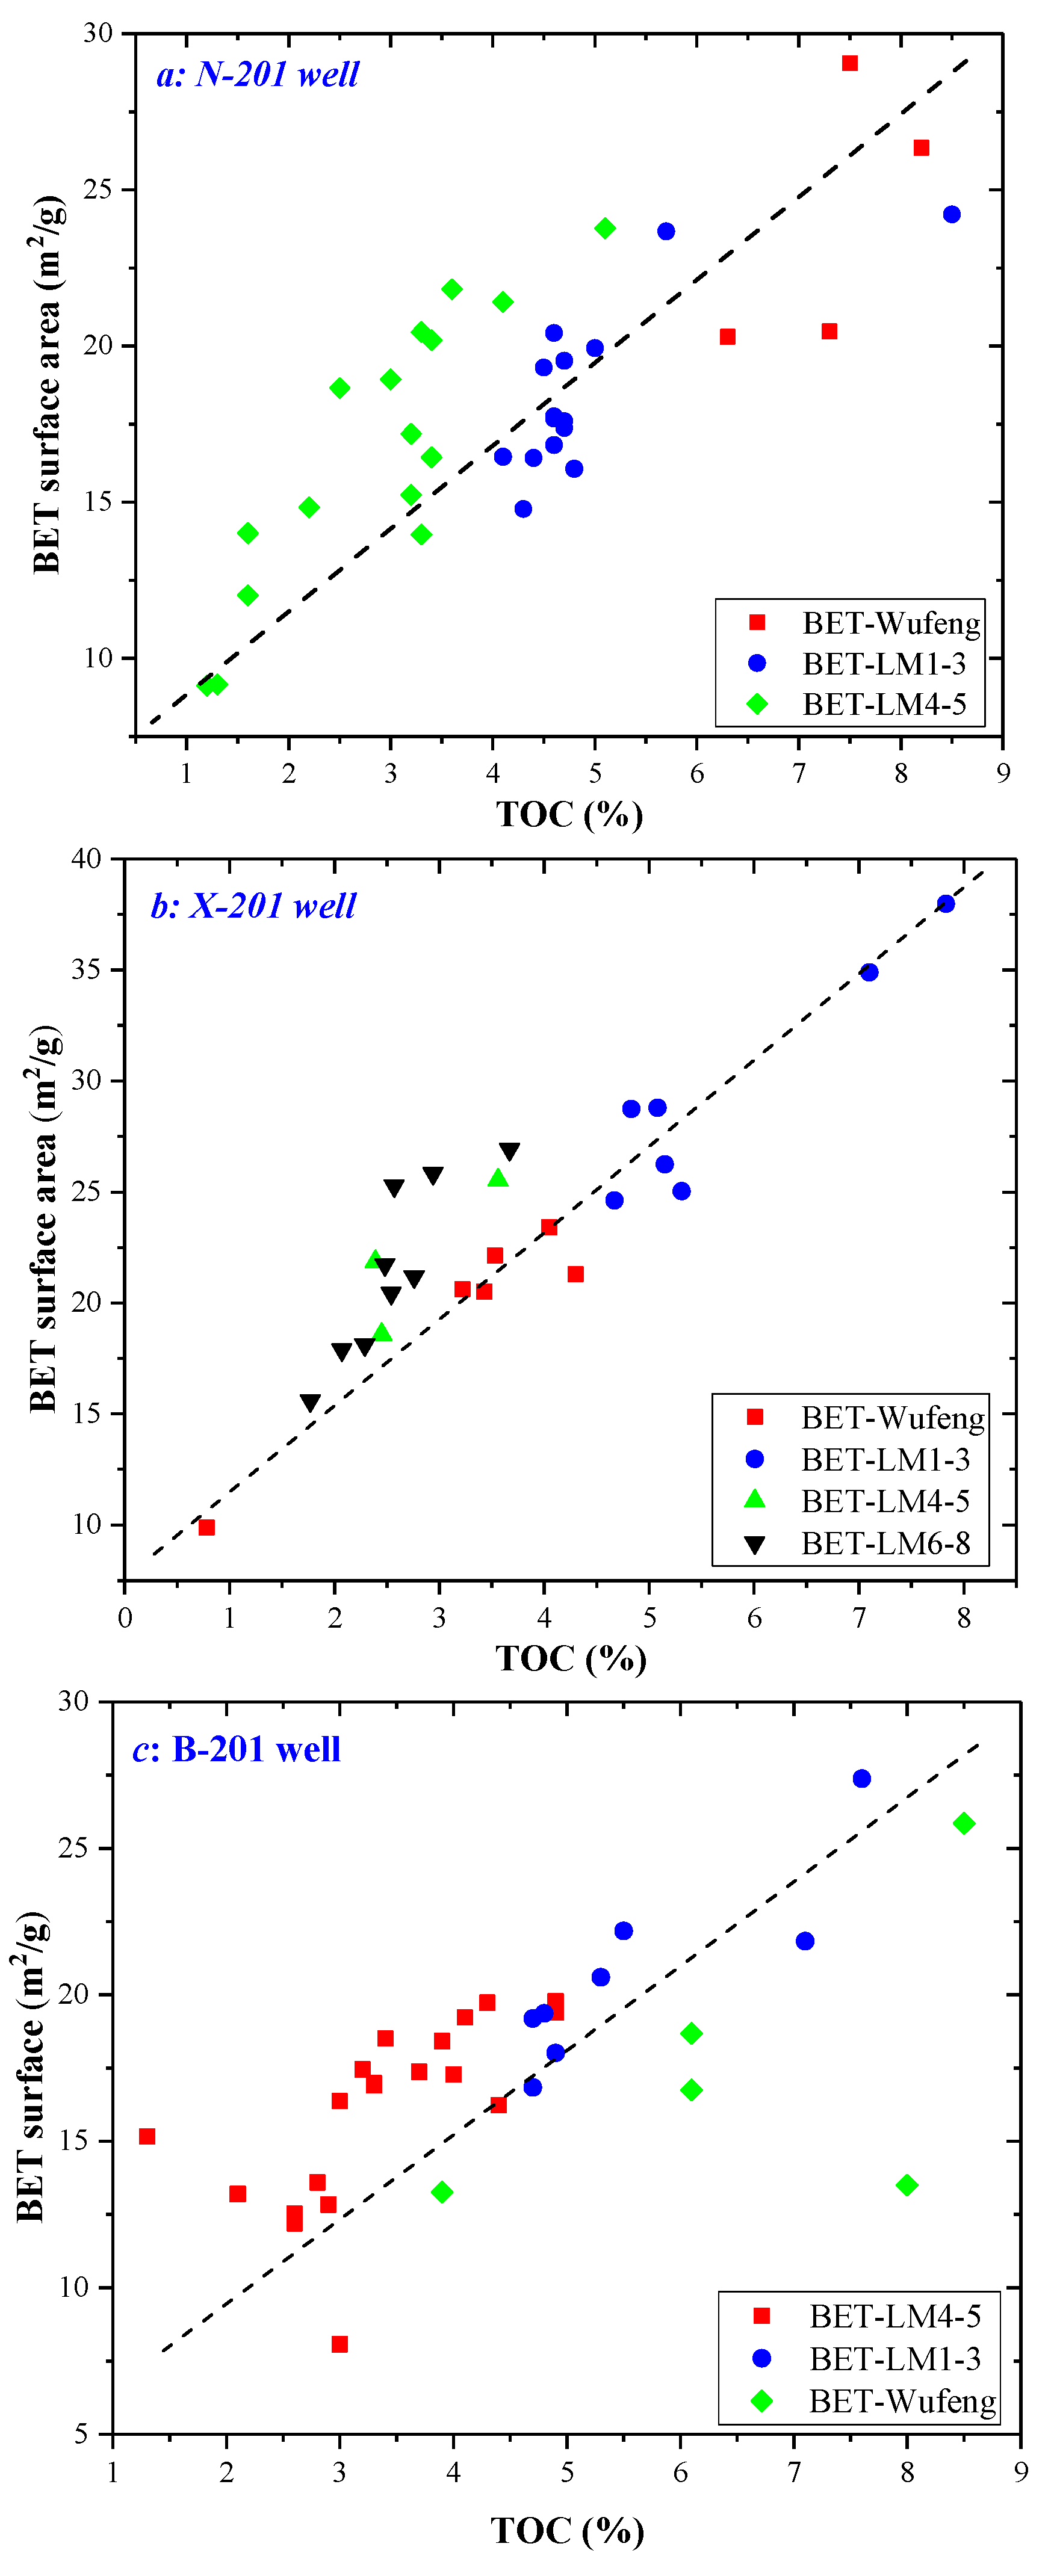
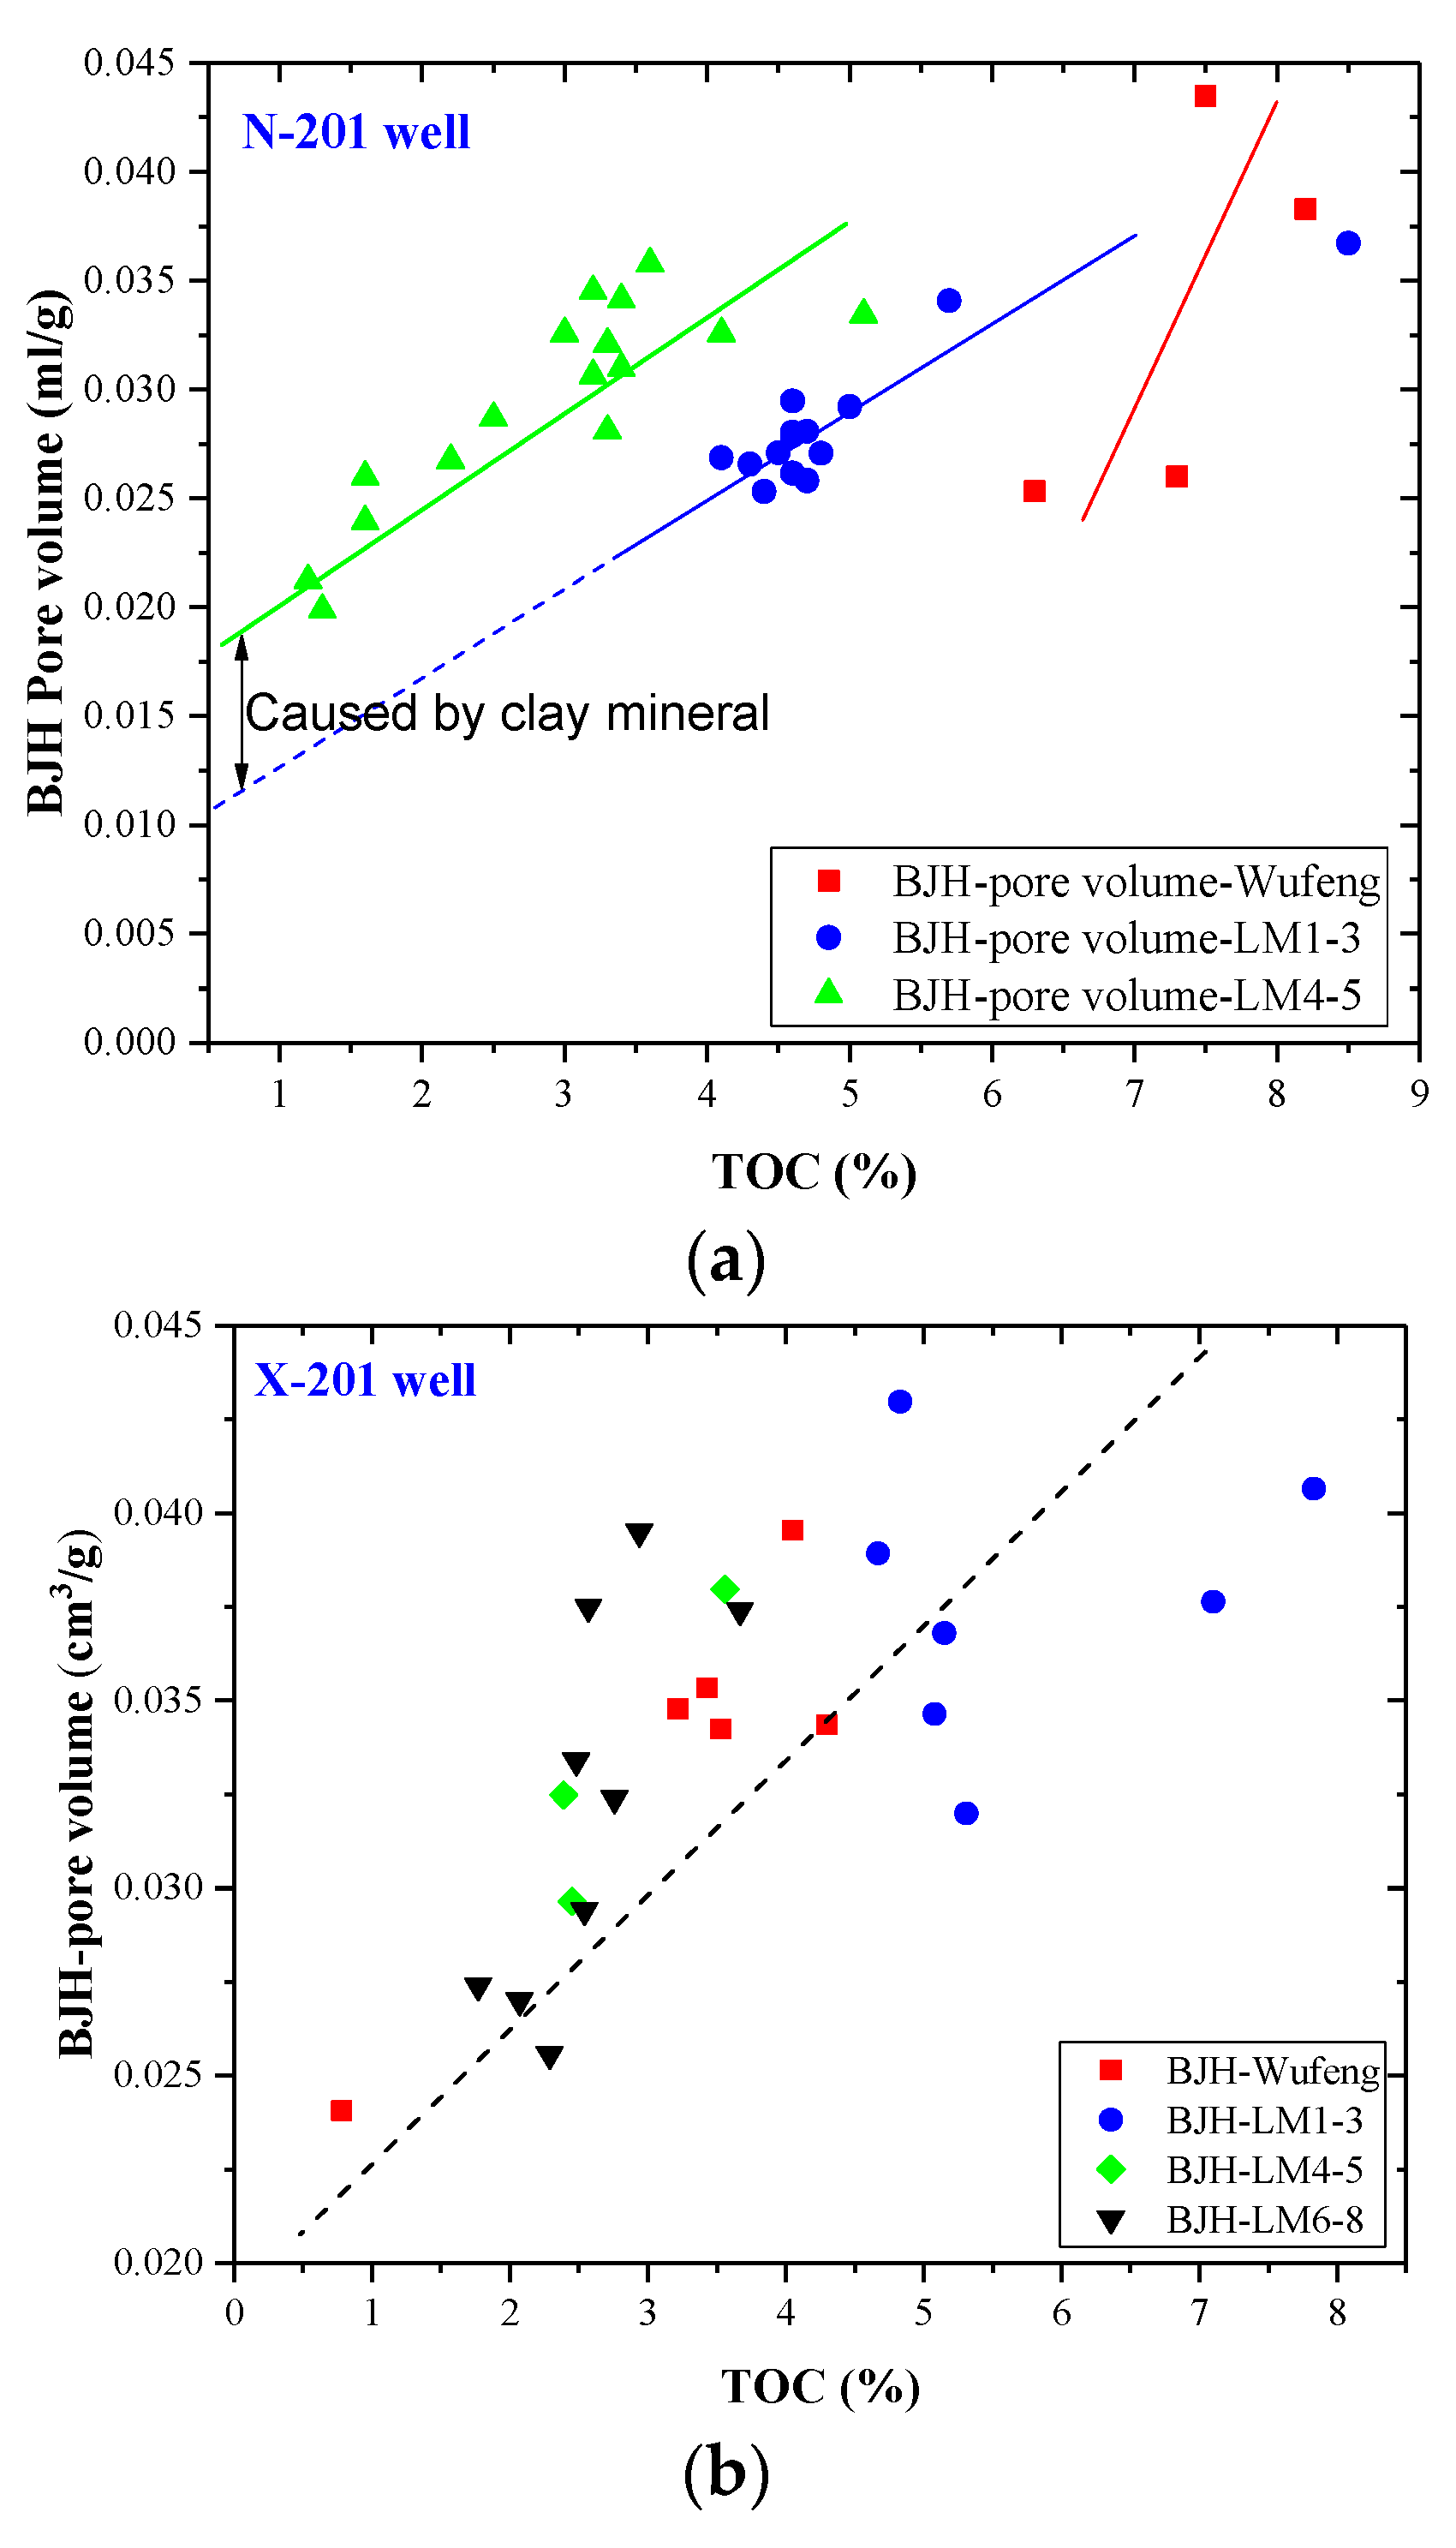
For the shale samples from the N-201 well, the X-201 well, and the B-201 well, there is a strong correlation between the BET surface area and the TOC content as shown in Figure 10a–c. It should be also noted that the strong correlation occurs at whole well scale, which means that for different shale substrata, the correlation is similar. It means the pore BET surface area provided by the organic matter in different shale substrata is nearly the same. The correlation between BJH pore volume and TOC content shows different behaviors as shown in Figure 11a–c. Figure 11a illustrates the relationship between BJH pore volume and TOC content for well N201. For the samples from a given substratum, the BJH pore volume increases with increasing TOC content. However, when comparing the BJH pore volume of shale samples from different substrata, the trends are offset for each substratum. For any given TOC content, the BJH pore volume in samples from LM4-5 substrata is larger than that in shales from LM1-3 and the Wufeng formation. However, the correlation line of LM4-5 substrata is parallel to that of LM1-3 substrata, indicating the increase of organic matter per unit mass in LM4-5 shale provides similar porosities with that in LM1-3 shale. The differences of BJH pore volume between LM1-3 shale and LM4-5 shale are caused by other factors. By comparing the mineral composition of LM1-3 shale and LM4-5 shale in N201 well, it can be seen that the clay mineral of LM4-5 shale is obviously larger than that of LM1-3 shale (Figure 4), indicating clay minerals provide initial pore volume. Based on the initial pores provided by clay, the pore volume of shale increases with the increase of organic matter content, and in different substrata, the difference in clay minerals brings the difference in the initial pore volume (Figure 11b).
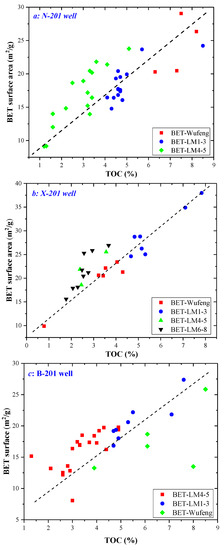
Figure 10.
The effect of TOC content on BET surface area the shale samples from (a) the N201 well, (b) the X201 well, and (c) the B-201 well.
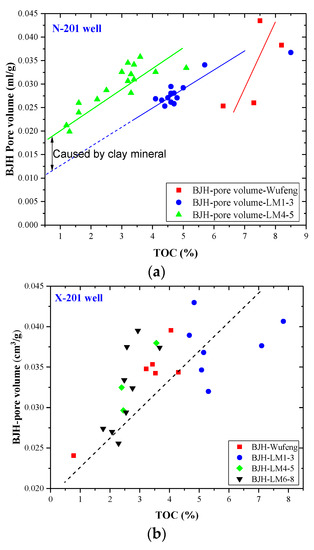
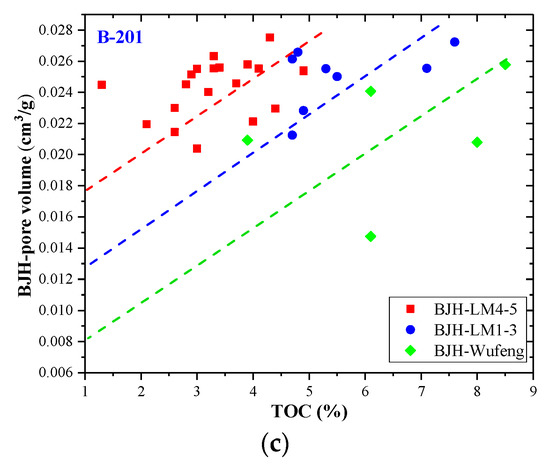
Figure 11.
The correlations between BJH pore volume and TOC content of the shale samples from (a) the N201 well, (b) the X201 well, and (c) the B-201 well.
By comparing Figure 10b and Figure 11b, it can be seen that in all the samples for the X201 well, the BET surface area and the BJH pore volume both increase with increasing TOC content. The shales of different substrata in X201 well have similar pore size distributions. This is different from the N201 well. The relationship between BJH pore volume and TOC content in well B201 is more complex (Figure 11c). Although the BET surface increases with increasing TOC content, the overall correlation between BJH pore volume and TOC is quite weak. By analyzing the different substrata separately, the BJH pore volume also increases with increasing TOC content. That means small nanopores were provided by OM and there are many large inorganic pores in shale from the B201 well.
It is important to understand why the BJH pore volume of LM4-5 shale is greater than that of LM1-3 shale with the same TOC content in N201 and B201 well. By comparing the nanopore structures of shales in different substrata in the same well, the effects of sedimentary environment, mineral composition and OM type can be established, as the shales in different substrata in the same well have similar maturity and have experienced a similar tectonic history. LM1-3 substrata have higher TOC values (Figure 3), lower clay content, and higher carbonate content (Figure 4) compared to other substrata. The sedimentary environment determines the OM type, TOC content, quartz, clay, and other mineral contents. The fact that BET surface area increases with increasing TOC for all the Wufeng–Longmaxi formation also indicates that small nanopores characterized by N2 adsorption are similar in different substrata. However, the larger nanopores characterized by N2 adsorption are quite different in different substrata. In addition, the clay content of shale samples in LM1-3 substrata is lower than that of LM4-5 substrata shale samples in (Figure 4). This may result in a lower pore volume in LM1-3 shale than that of LM4-5 shale with the same TOC content. Considering that the content of organic matter is much lower than that of clay, in the N201 and B201 wells, organic matter is the main controlling factor, but clay provides some initial pore volume.
4.2.2. Type II: Pore Properties of Shales in Different Substrata Are Controlled by Different Factors
Figure 12a,b illustrate the correction between BET surface area and TOC content and clay content in shale from the W202 well. A significant correlation between the BET surface area and TOC content appears in LM1-3, but not in the Wufeng Formation and LM6-8 (Figure 12a). Milliken et al. [30,59,60] also observed that there is not always a positive correlation between BET surface area and TOC content, because high TOC content could reduce the brittleness of shale and lead to the collapse of some OM pores. In addition, a good positive correlation between BET surface area and clay content appears in the Wufeng Formation shale samples, which is closely related to the high clay mineral content of these samples (Figure 4). It also implies the pore surface area is mainly controlled by clay minerals rather than organic matter (Figure 12b). Ji et al. [61] has previously confirmed that clay-related micro-mesopores can provide a large specific surface area, but the contribution of different clay minerals to a specific surface area varies. In addition, the BET surface area of LM4-5 and LM6-8 substrata do not correlate with individual parameters such as TOC content, clay minerals, and other major mineral contents. In fact, the pore structure of shale reservoir is affected not only by material composition, but also by external conditions [60,62]. Therefore, we suggested that this insignificant correlation of LM4-5 and LM6-8 substrata is related to external factors.
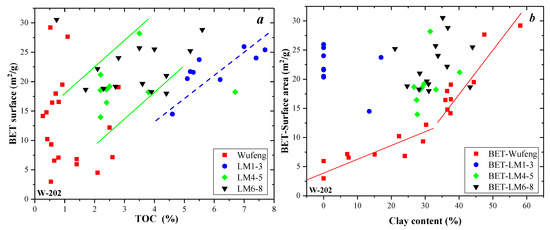
Figure 12.
The correlation between the BET surface area and TOC content (a), clay mineral content (b) in the W202 well.
Interestingly, the geological controls of BJH pore volume are a little different from those of BET surface area (Figure 12 and Figure 13). The correlation between pore volume and clay in most samples from the W202 well is stronger than that between pore volume and TOC content, which implies that clay content is the most important factor for BJH pore volume (Figure 13). Significantly, the above relationship does not appear in the LM1-3 substrata. This is mainly because the clay content in LM1-3 shales are quite low, and the TOC content in LM1-3 substrata is also greater than that in other substrata (Figure 3). Organic matter is still one of the main controllers of pore properties (Figure 13b).
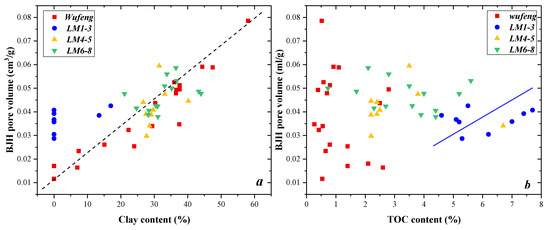
Figure 13.
The correlation between BJH pore volume and clay content (a), TOC content (b) in the W202 well.
Figure 14a,b illustrates the correlation between the BET surface area and the TOC content, clay mineral content, respectively, for well L204. In different substrata, the major control factors are different. For the shale samples in LM1-3 substrata, the BET surface area increases with increasing TOC content. In contrast, for the shale samples in LM4-5 substrata, the BET surface area increases with increasing clay mineral content. In other words, the surface area of LM1-3 shale is mainly controlled by TOC content and that of LM4-5 shale is mainly controlled by clay mineral content. The different controlling factors for LM4-5 shale, LM1-3 shale, and Wufeng formation shale can both be caused by sedimentary environment and tectonic compaction reactions. The differences in sedimentary environment will accompany the difference in mineral composition. In addition, as the contents of brittle mineral, such as quartz, in different substrata are different, the tectonic compaction reactions of the pore system are different, which has been proven by previous studies [62,63].
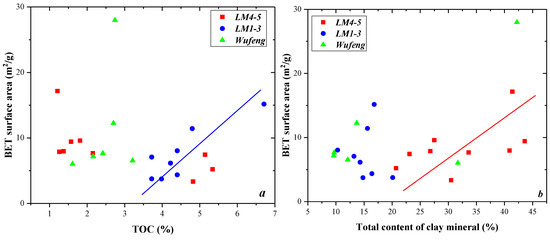
Figure 14.
The correlation between BET surface area and the TOC content (a), clay mineral content (b) in well L204 (sample L204-4 has extremely large BET value, and was not included in the two figures). Information of sample L204-5: TOC-5.25%; quartz content: 65.8%; clay content: 11.6%; BET: 56.87 m2/g; BJH volume: 0.0534 cm3/g.
4.2.3. Type III: Pore Properties Are Not Obviously Controlled by either TOC Content or Mineral Content
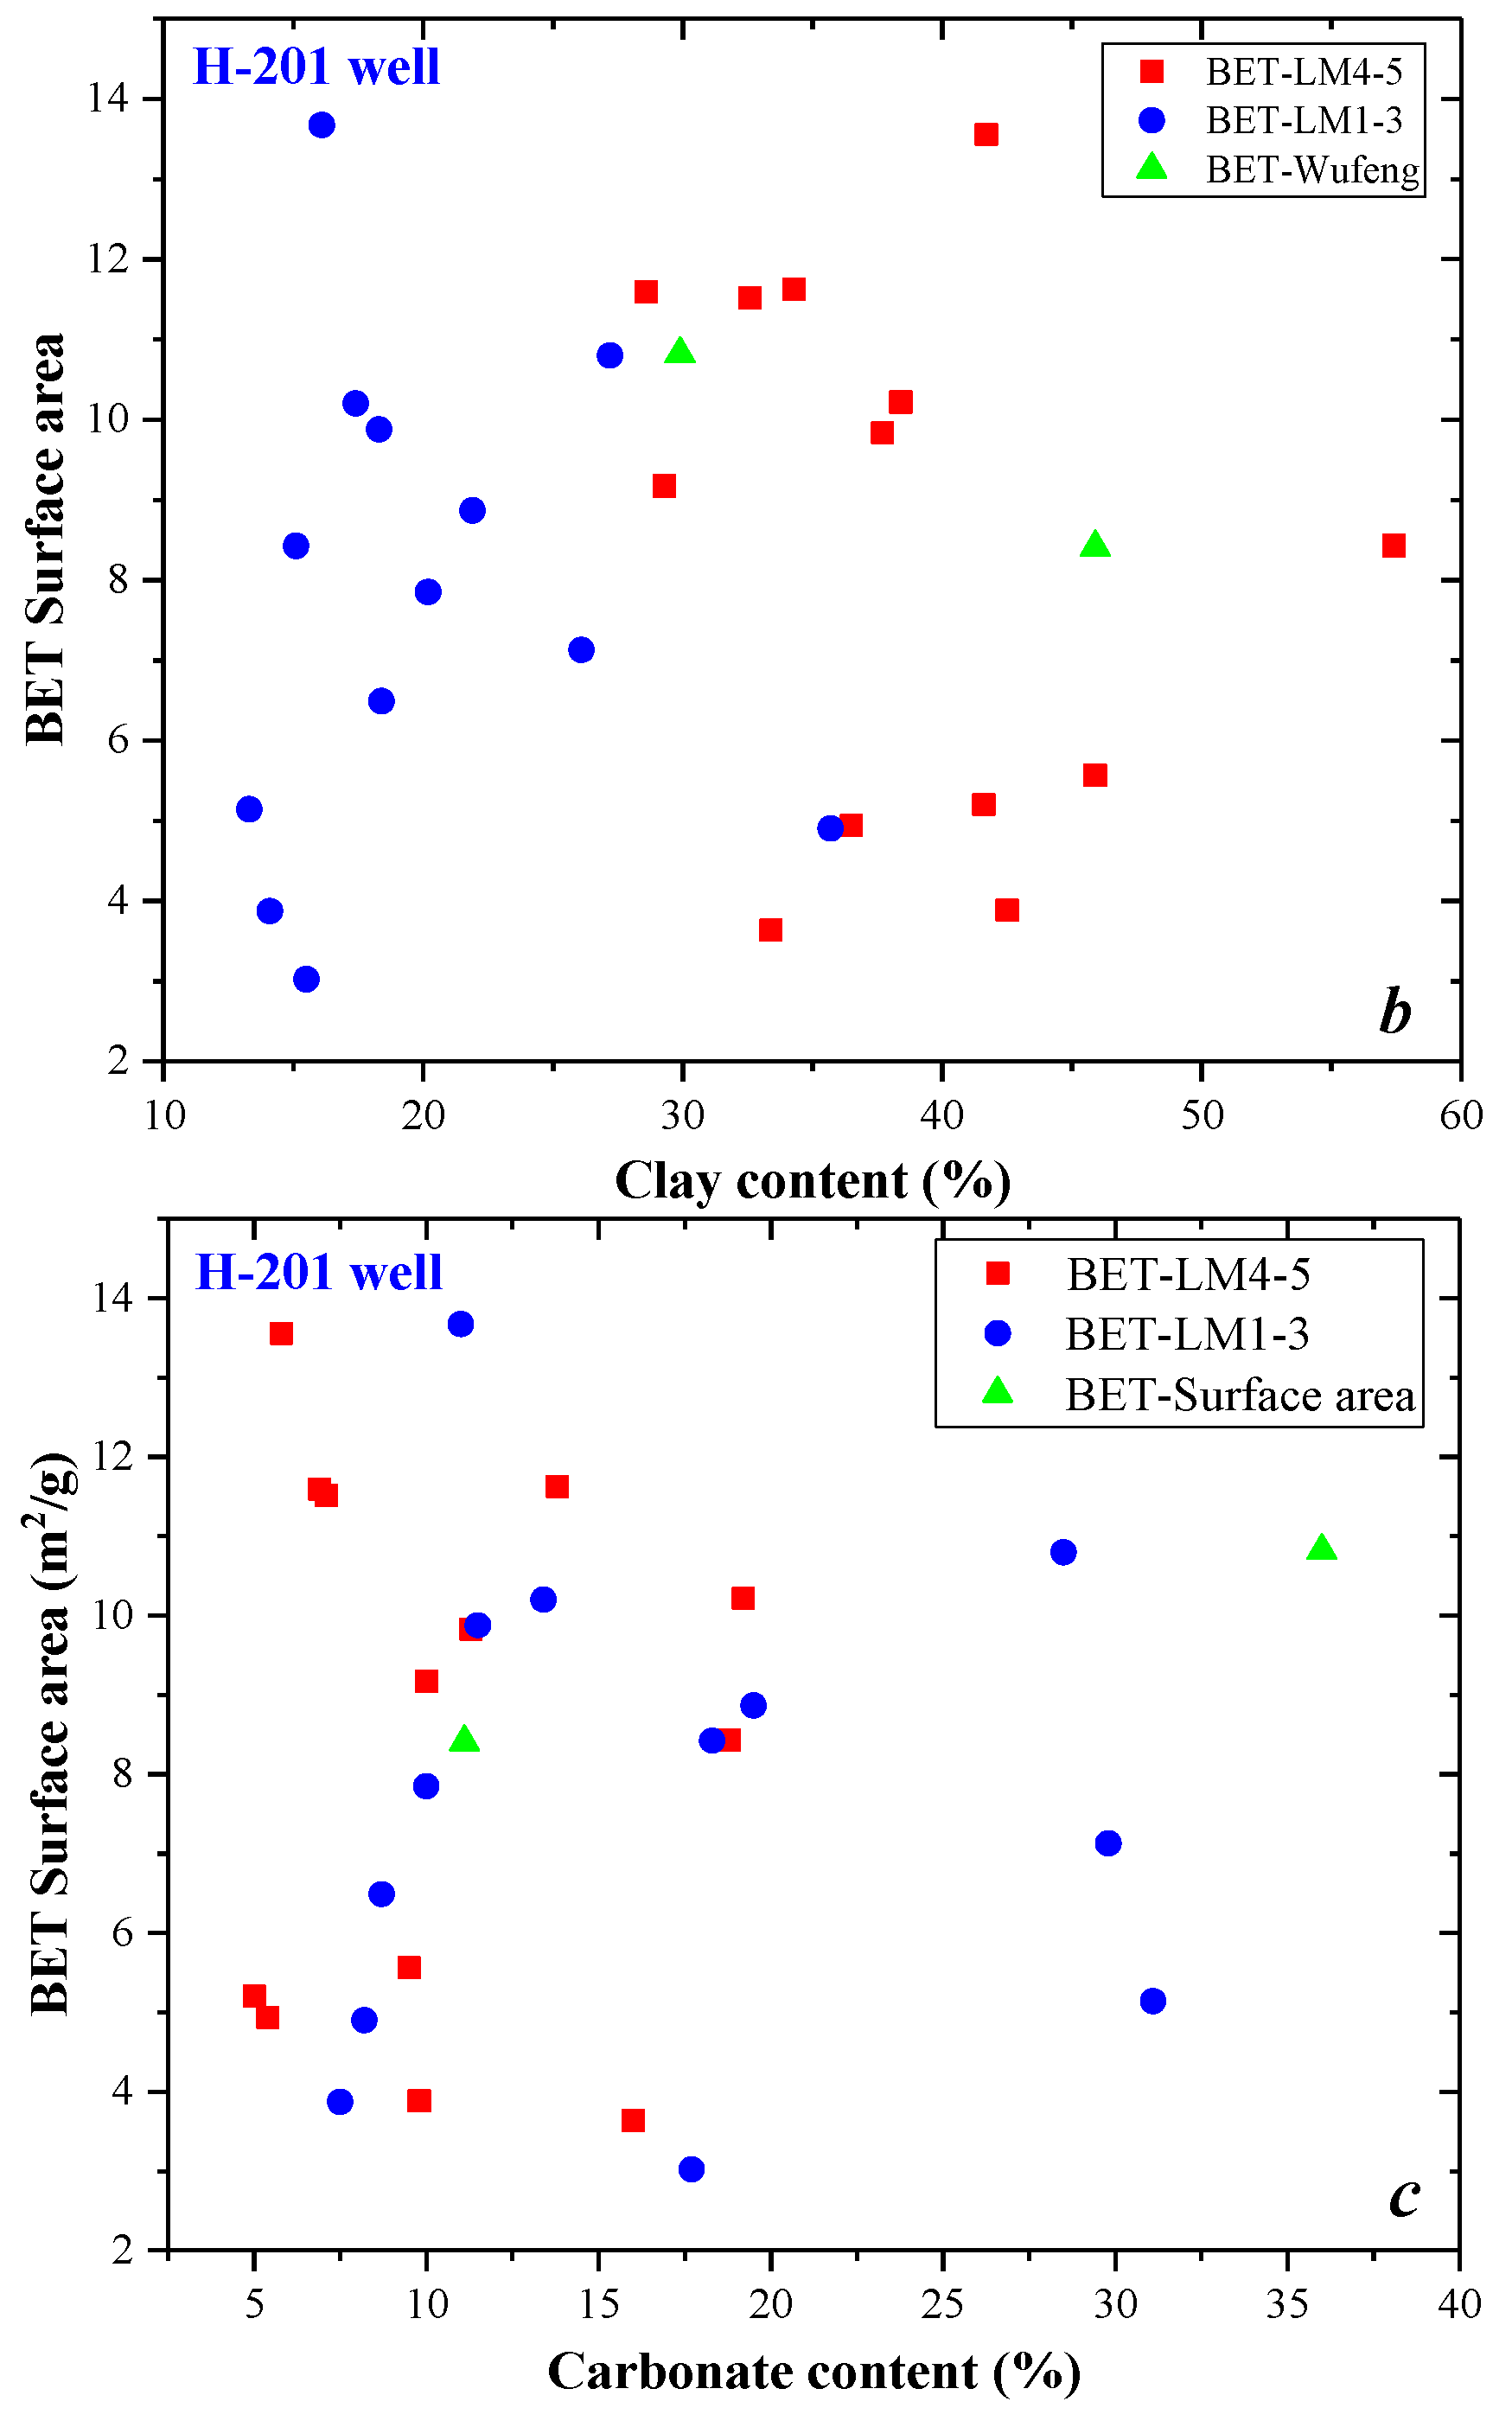
The pore properties of shale in the H201 well are not obviously controlled by TOC or mineral contents. Figure 15 shows that the BET surface area has no correlation with TOC content, clay content, and carbonate content in different substrata. Although the TOC content of shale samples from LM1-3 substrata is much greater than that of shale samples from LM4-5 substrata, the BET surface area is similar in both cases. In fact, many factors may complicate the relationship between the BET specific surface area and TOC content. For example, violent tectonic compaction in this deformation belt also enhances the robust complexity and heterogeneity of the pore system, resulting in the weakening of the correlation between TOC and parameters [63]. Similarly, although the clay content of shale samples of LM4-5 substrata is much greater than that of shale samples of LM1-3 substrata, the BET surface area is similar in both cases. Some previous studies suggested that due to the ductility of clay minerals and the lack of shelter from rigid matrix minerals, tectonic compaction can easily destroy the internal porosity in the shale reservoir with high clay mineral content, which also leads to the complex relationship between pore structure and clay minerals [54].
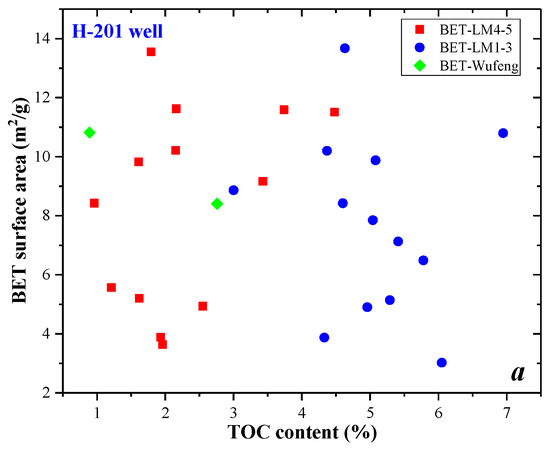
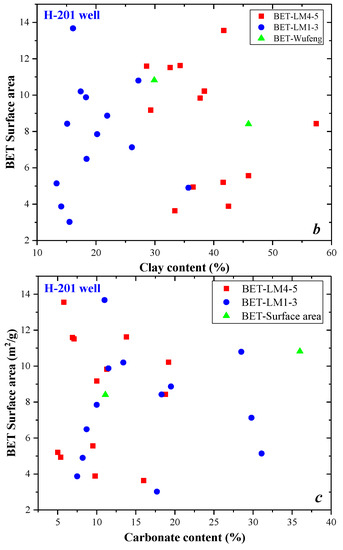
Figure 15.
The correlation between BET surface area and TOC content (a), clay mineral content (b), and carbonate content (c) in the H201 well.
4.3. Connectivity of Pores in Shale
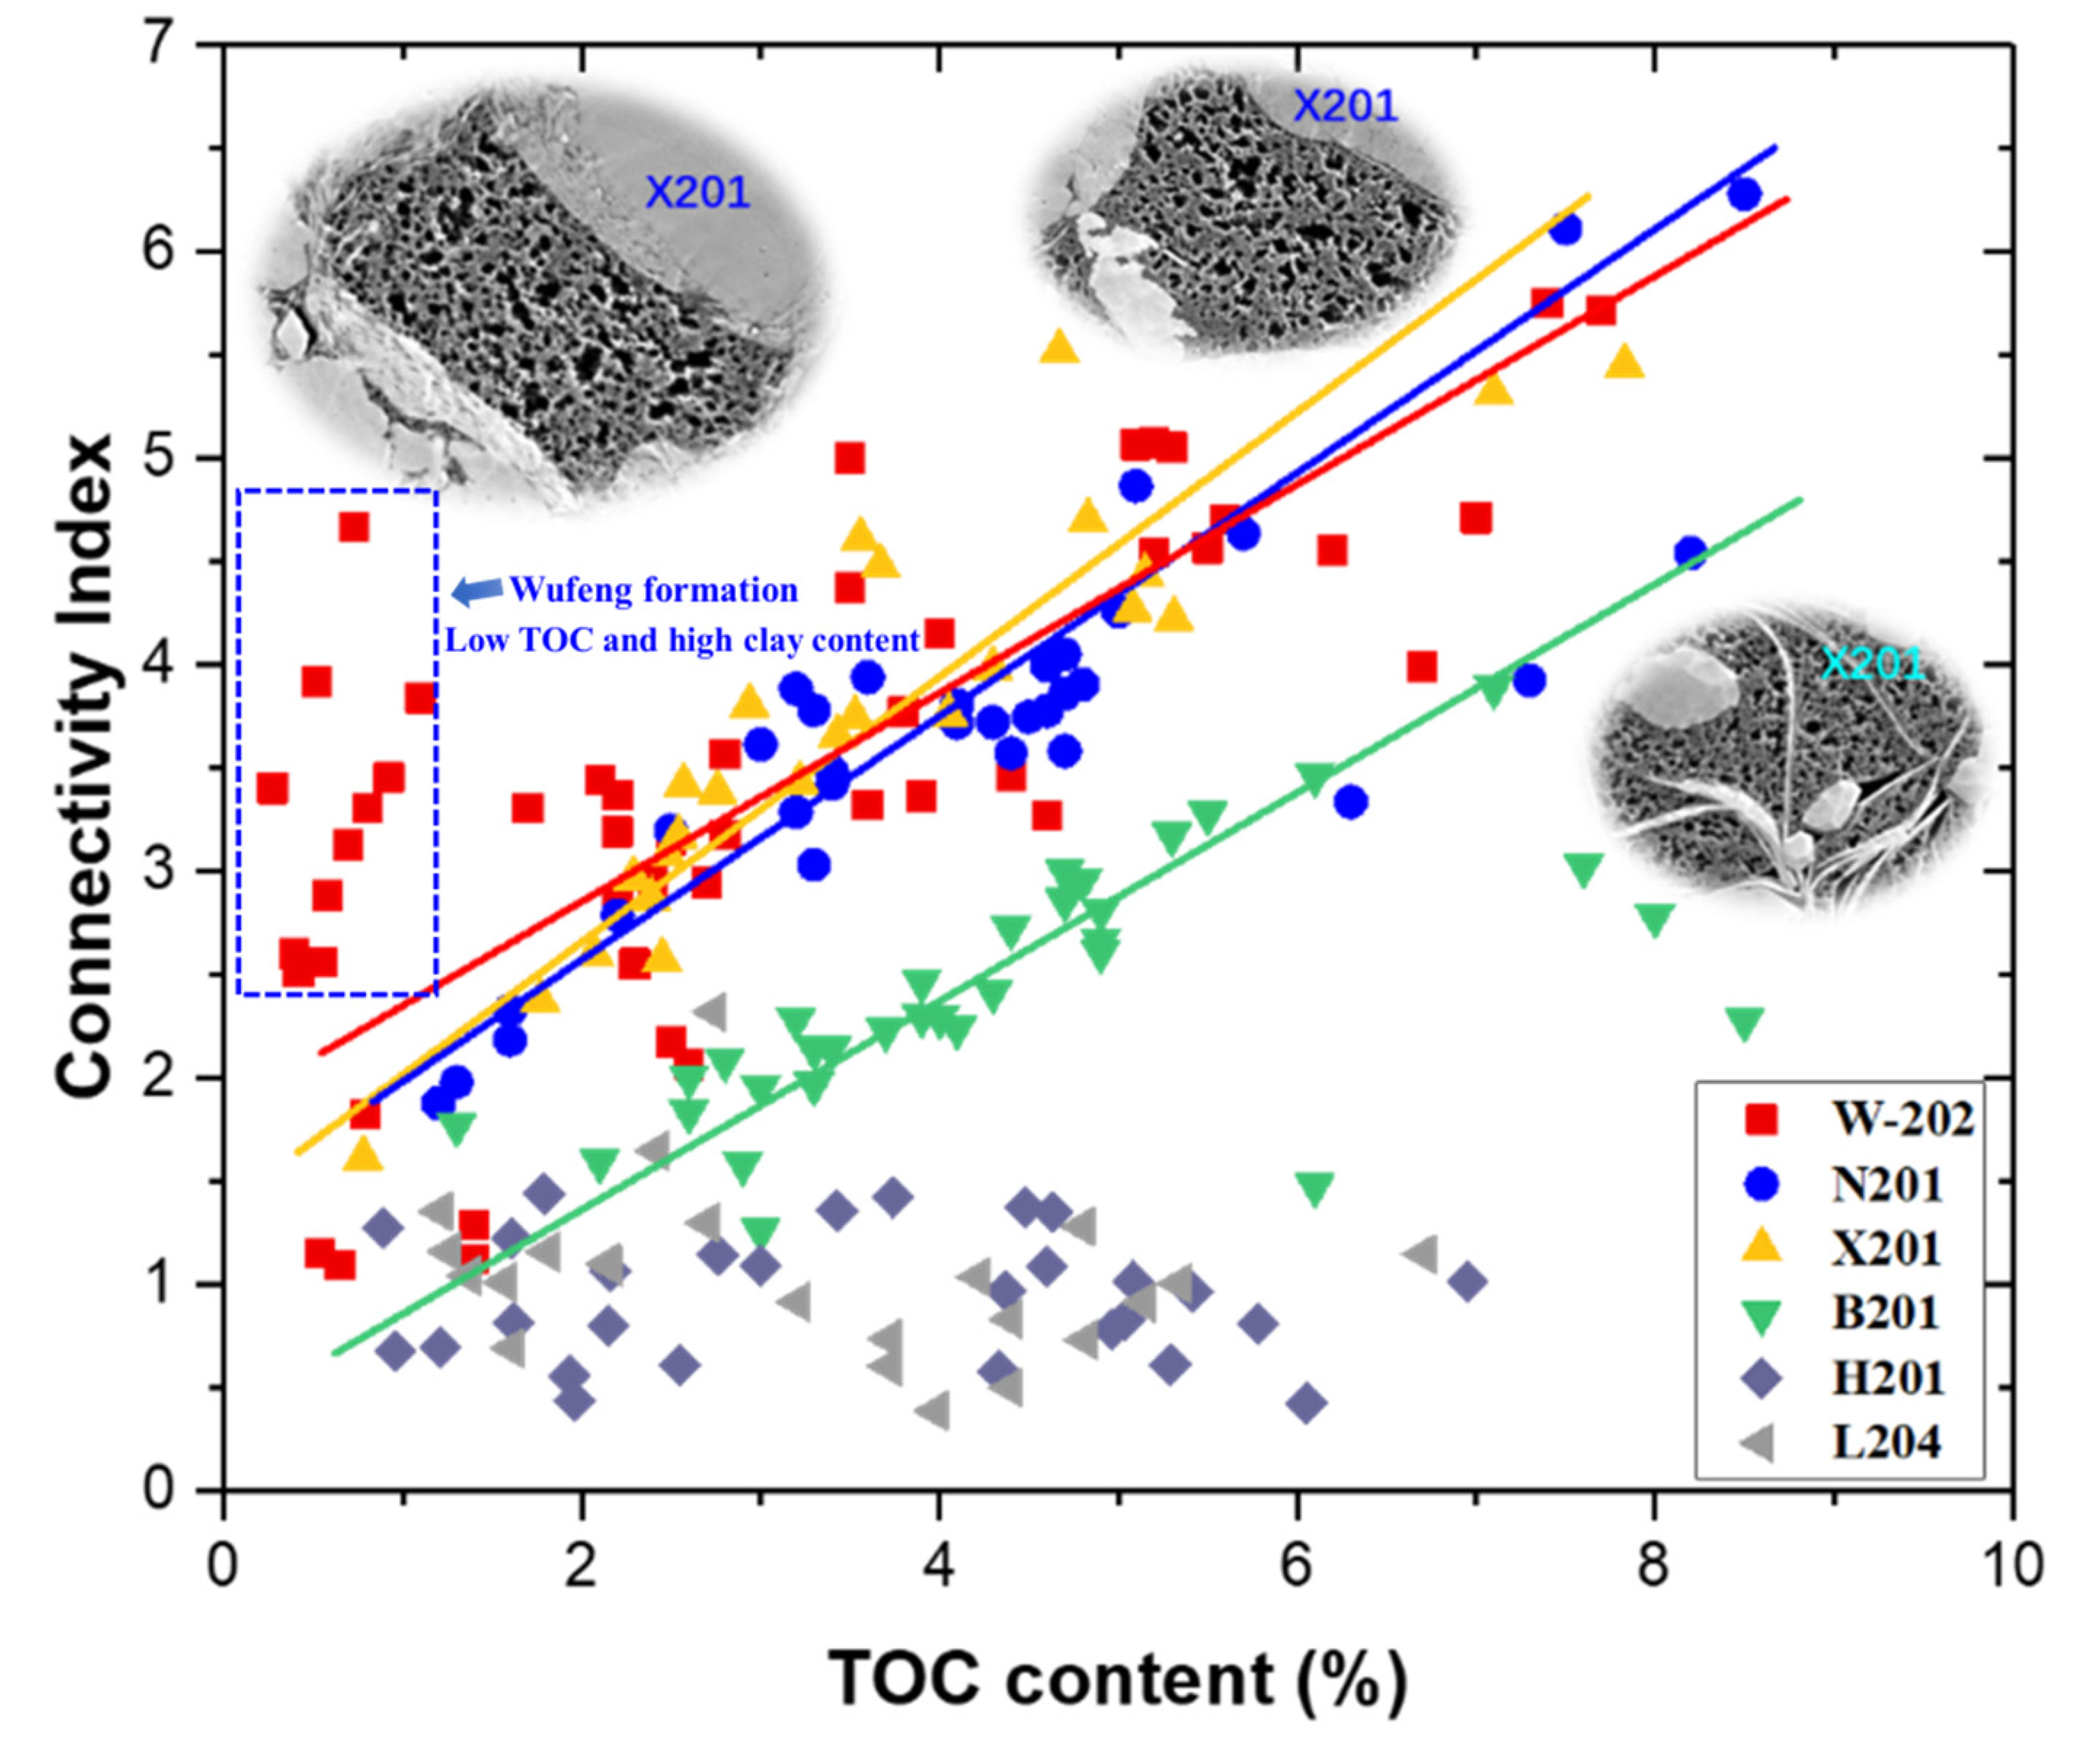
Shale pore connectivity is of great significance for hydrocarbons’ migration, enrichment, and production behavior [64]. Figure 16 shows the correlation between the connectivity index and the TOC content. A significant correlation between TOC content and connectivity index appears in shale from the W202, N201, X201, and B201 wells, which implies that organic pores have a very significant effect on pore connectivity. In addition, there is no correlation between the TOC content and pore connectivity index of samples in wells H201 and L204, and the connectivity index is quite small. Therefore, we speculated that the pore connectivity of these samples is affected by other factors, such as clay minerals. Higher TOC content means more organic pores, and thus from Figure 16 it can be concluded that organic pores have larger hysteresis loops and better connectivity.

Figure 16.
The influence on TOC content on the connectivity index.
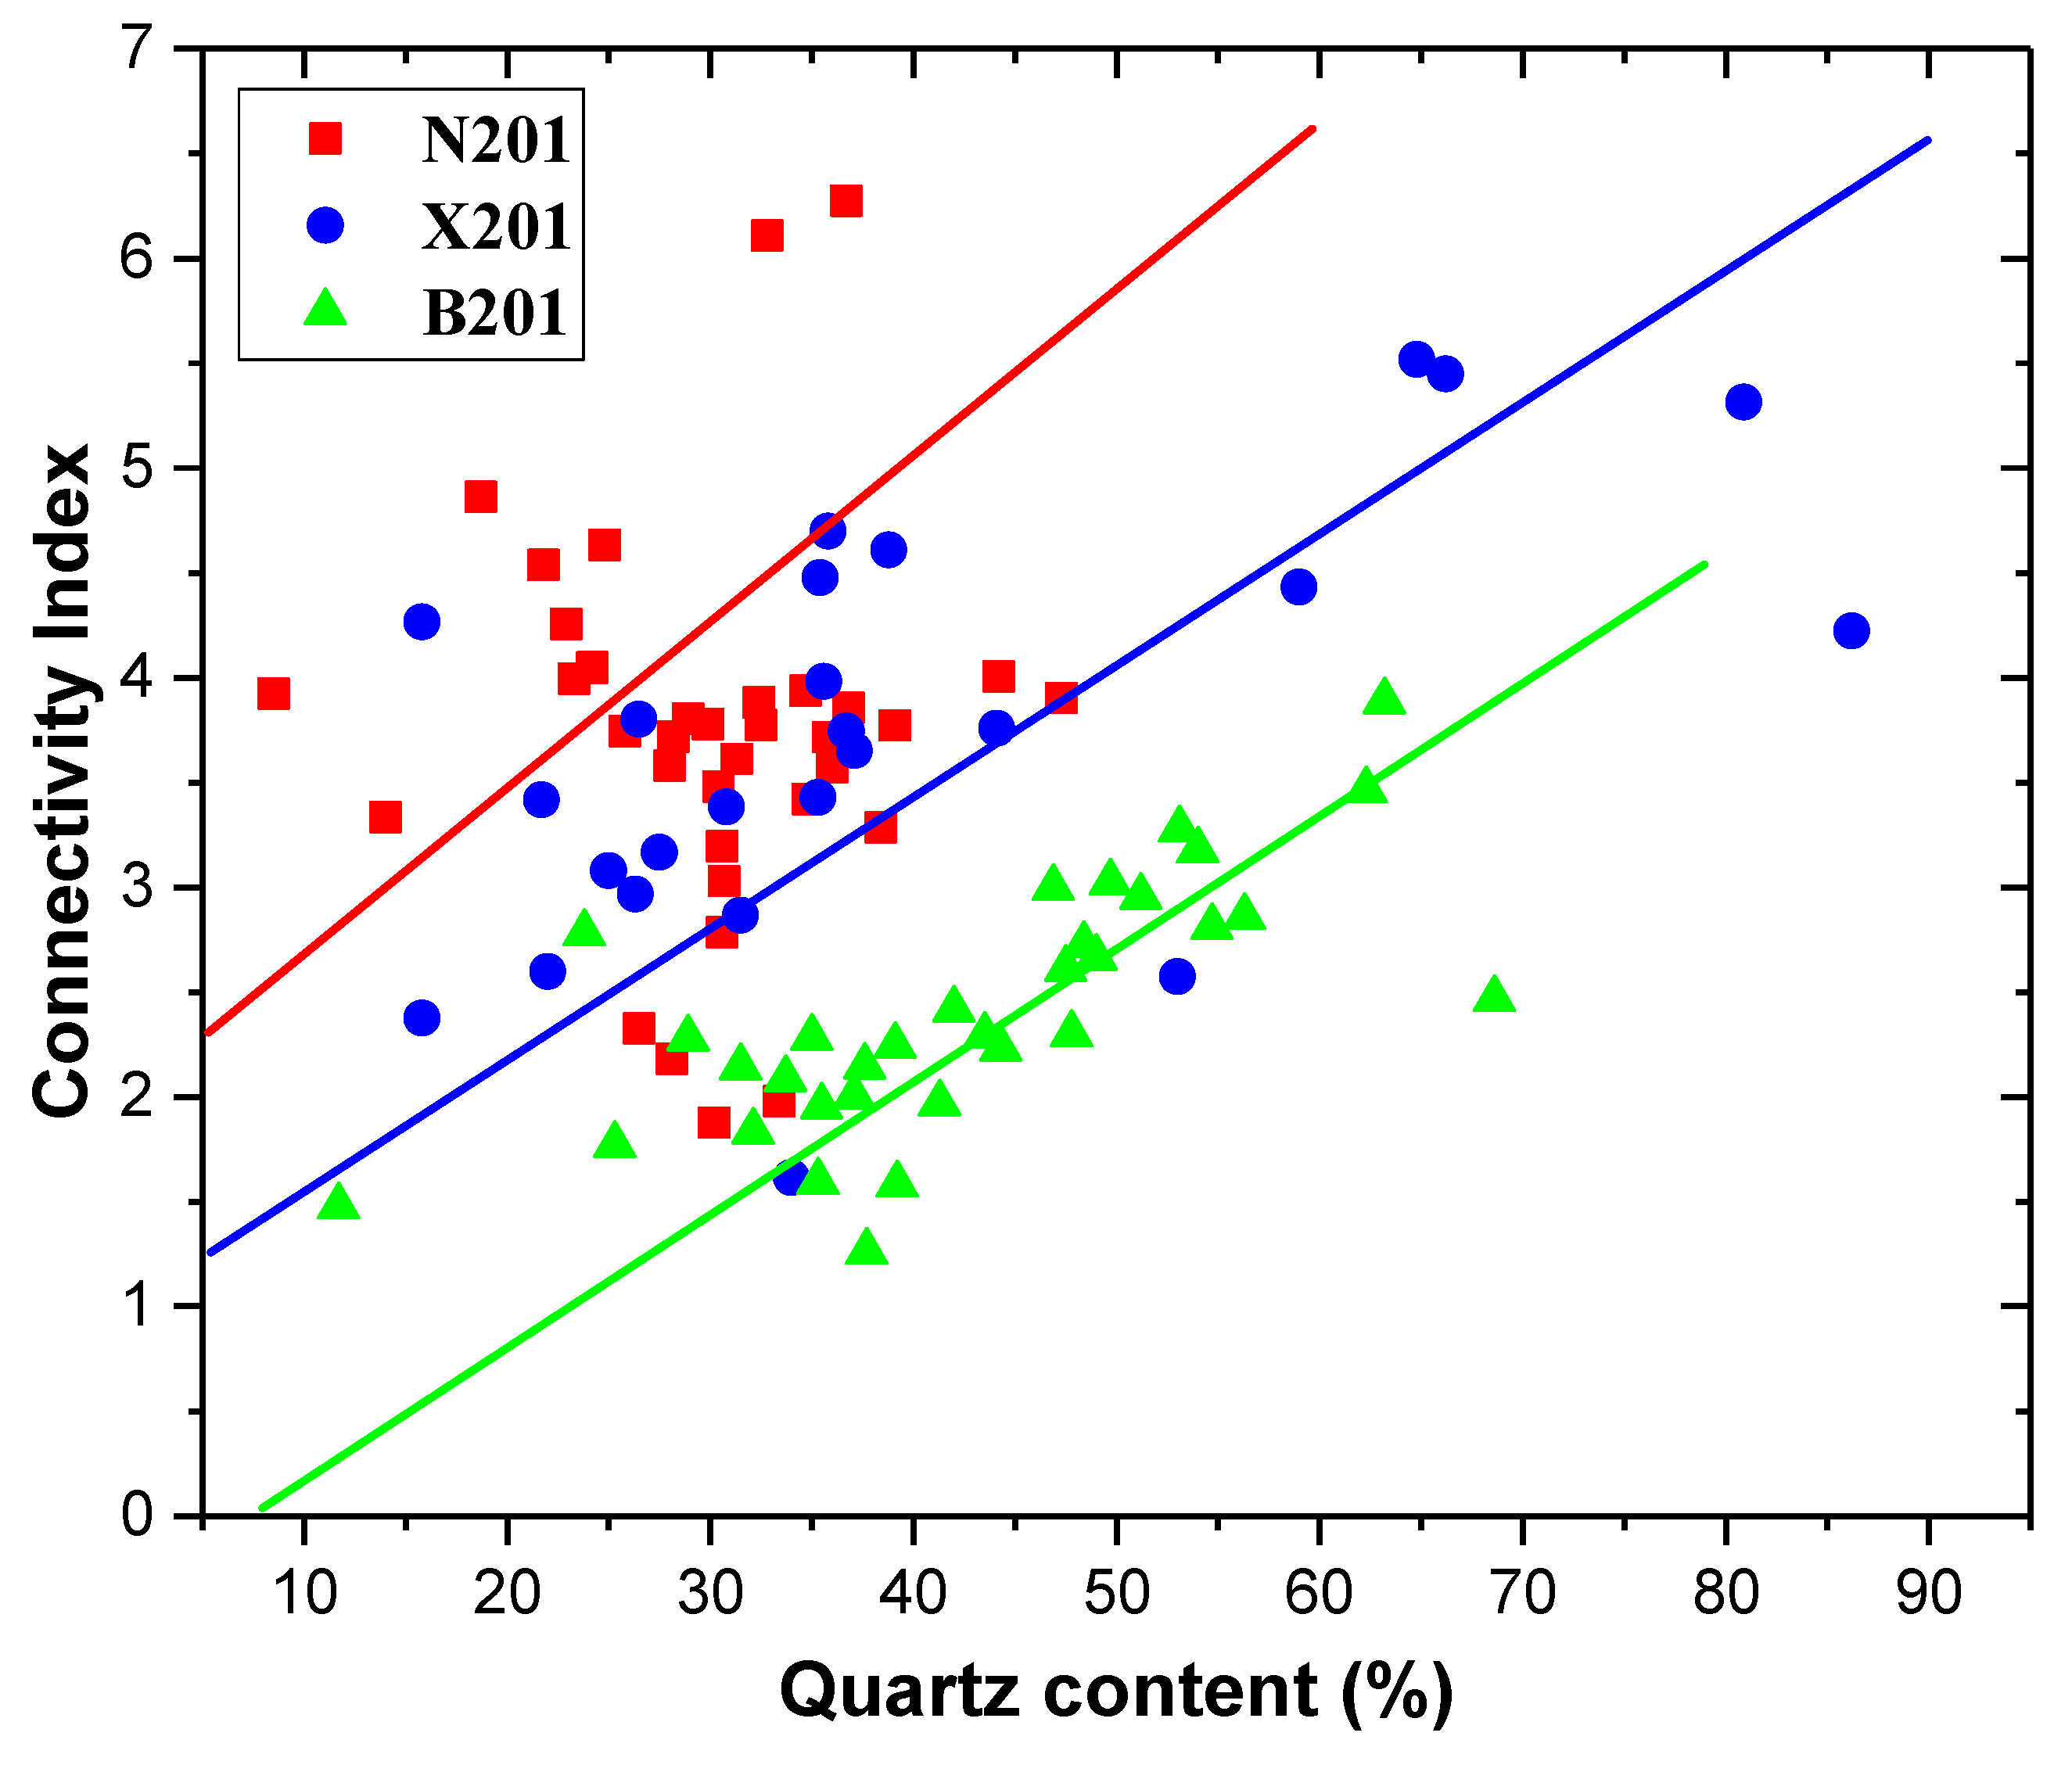
Figure 17 illustrates the correlations between the connectivity index and quartz content in wells N201, X201, and B201. In these wells, increasing quartz content correlates with an increase in the connectivity index. This suggests that quartz can facilitate the increase in pore connectivity, presumably because quartz particles form rigid frames that create connected pore networks [65,66].
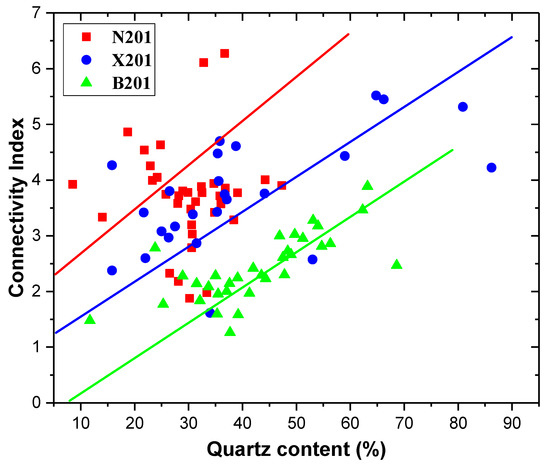
Figure 17.
Quartz effect on connectivity index.
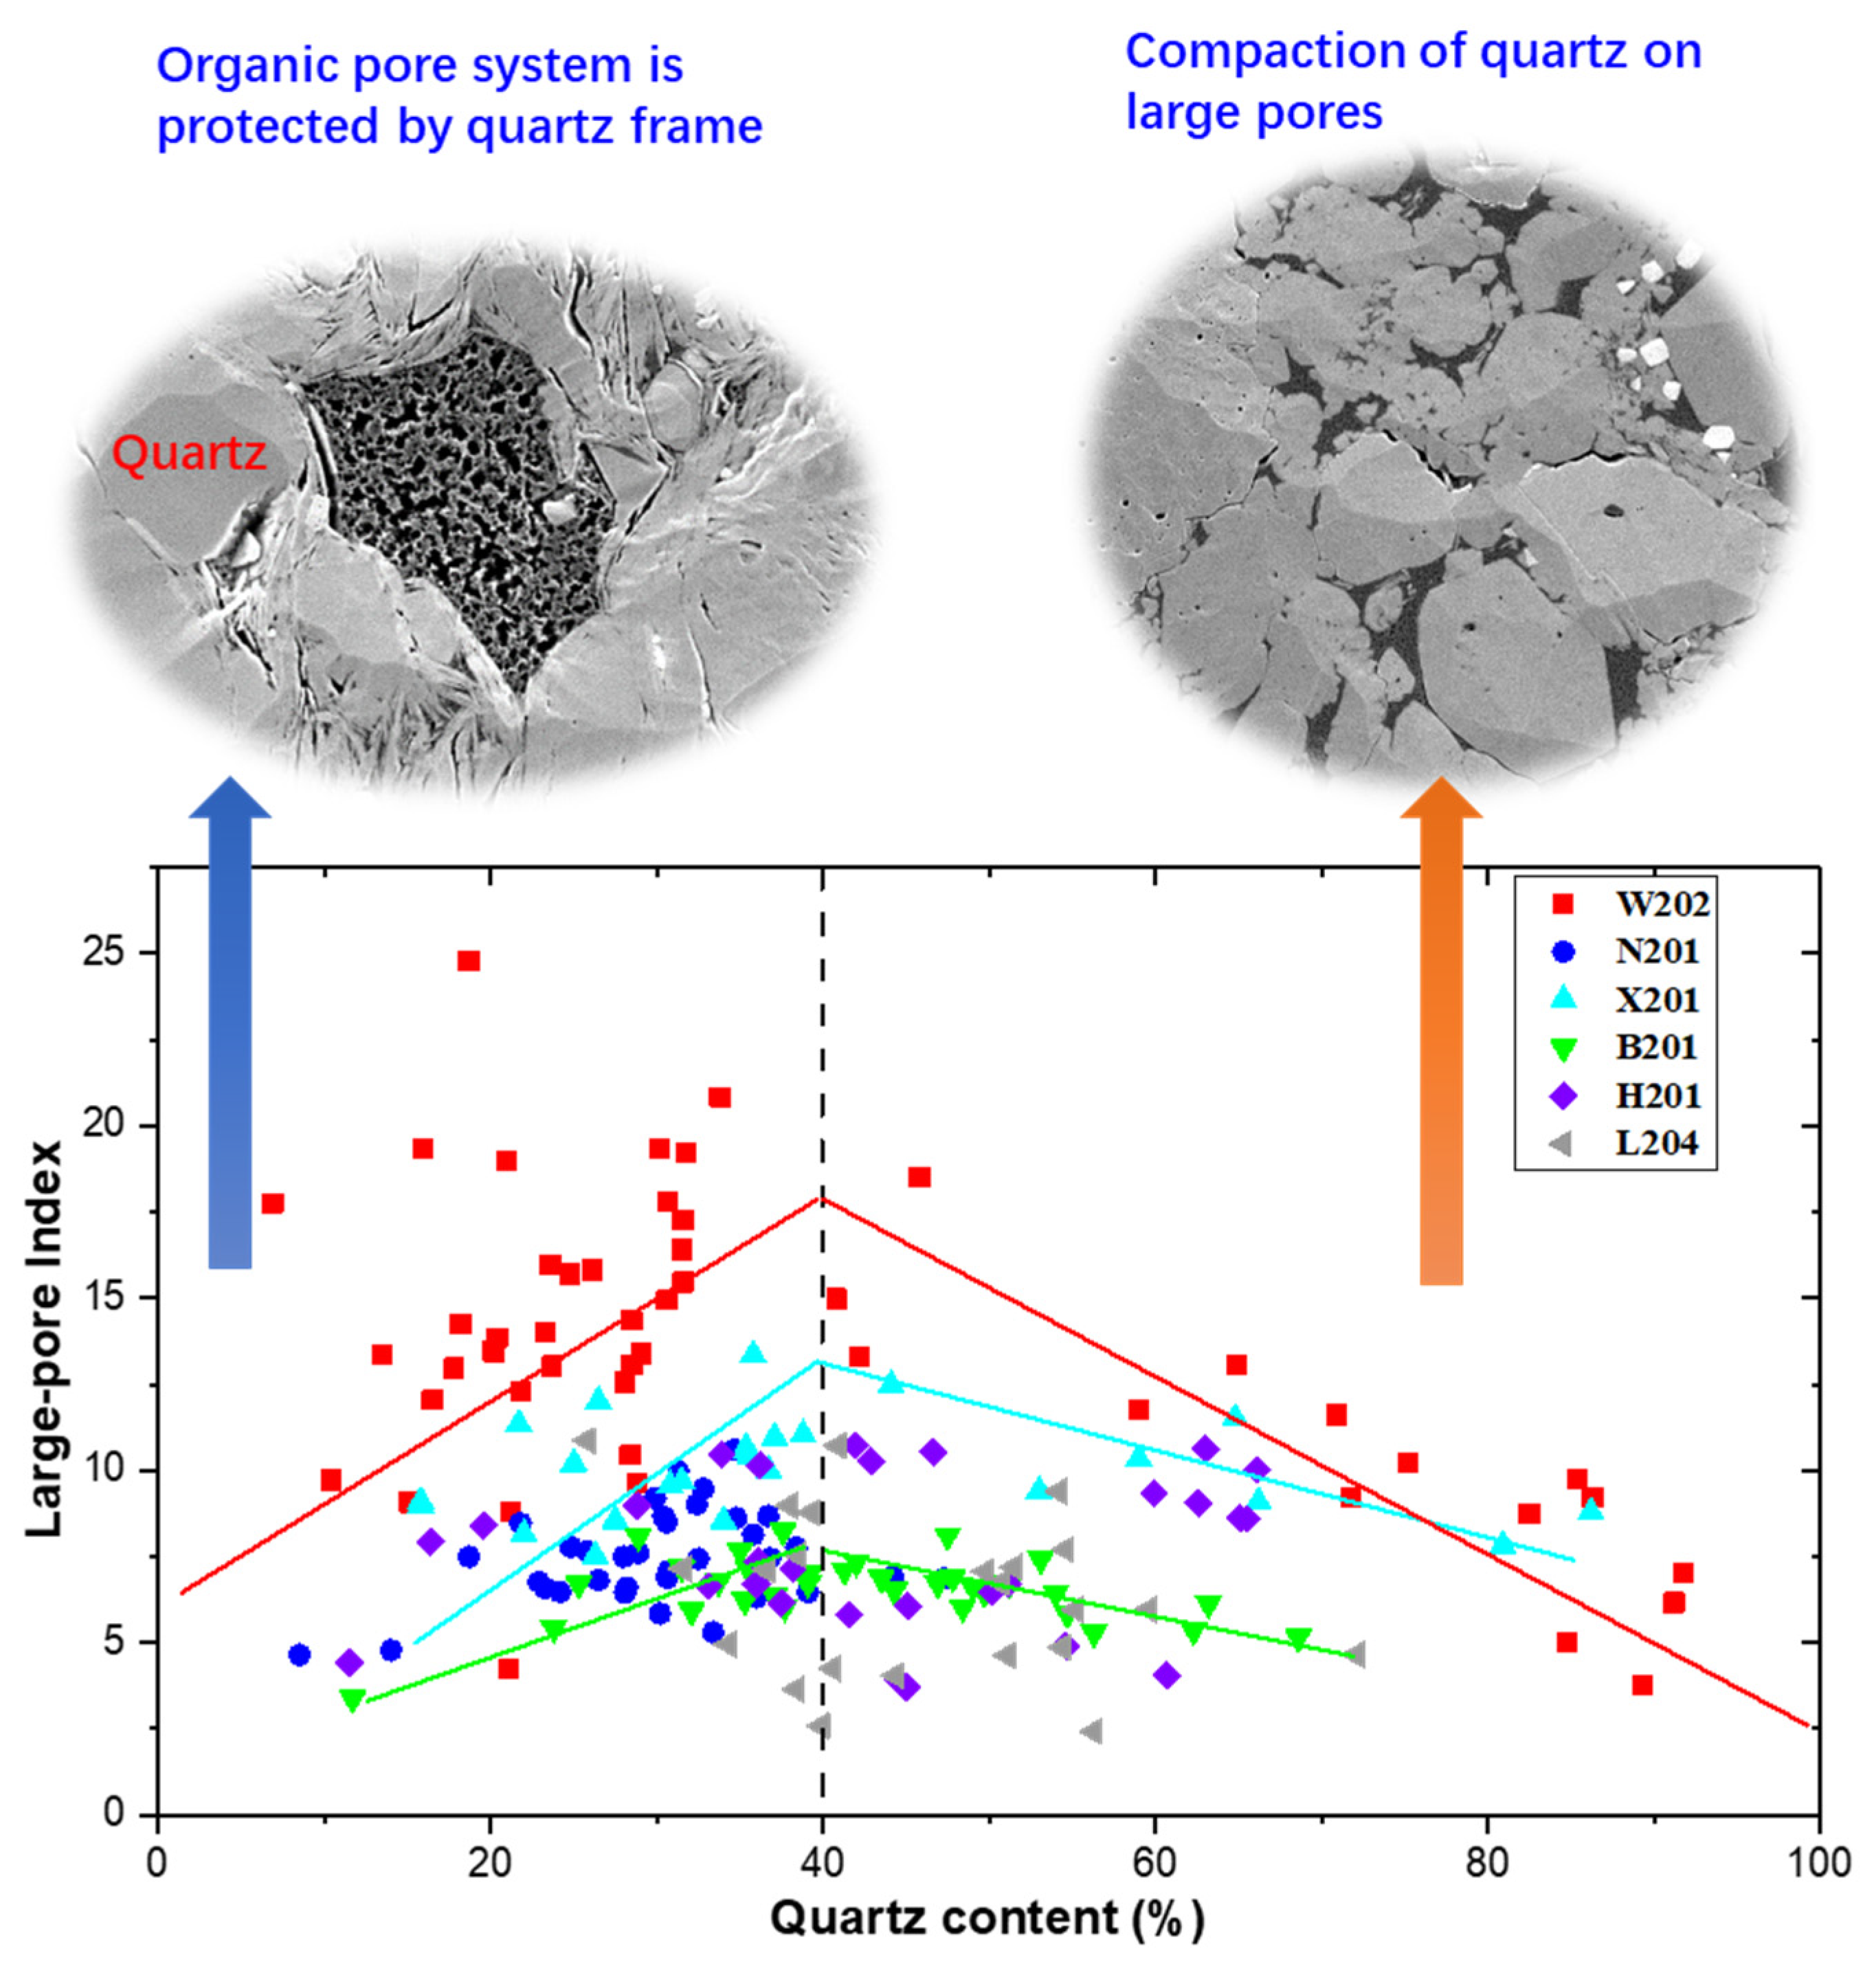
As mentioned in Section 3.2, the large pore index reflects internal volumes of pores greater than 6 nm. For these pores, increasing TOC content does not increase the large pore index. In contrast, in the W202, X201, and B201 wells, the large pore index increases with quartz content as quartz increases from 0 to 40% and decreases as quartz increases from 40% to 100% (Figure 18). This suggests that the quartz particles have a significant effect on the large pore index. When quartz content is less than 40%, more quartz particles are conducive to the formation of large pores and provide more space for free gas storage and transport. However, when the quartz content is greater than 40%, the decrease in the large pore index may be due to compression of the pore volume under the horizontal and vertical pressures.
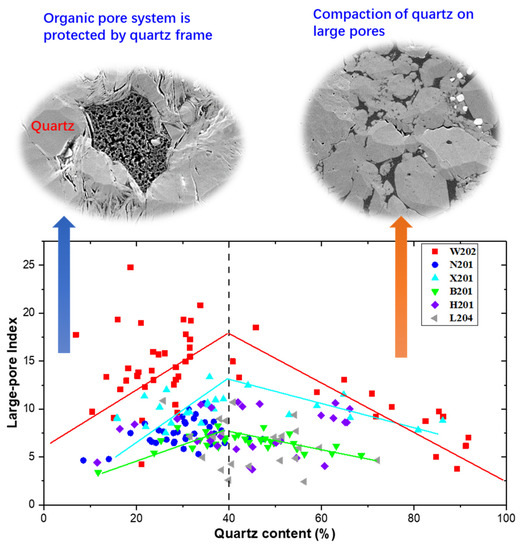
Figure 18.
The correlation between the large pore index and the quartz content.
4.4. Factors That Influence Pore Structure in Different Wells
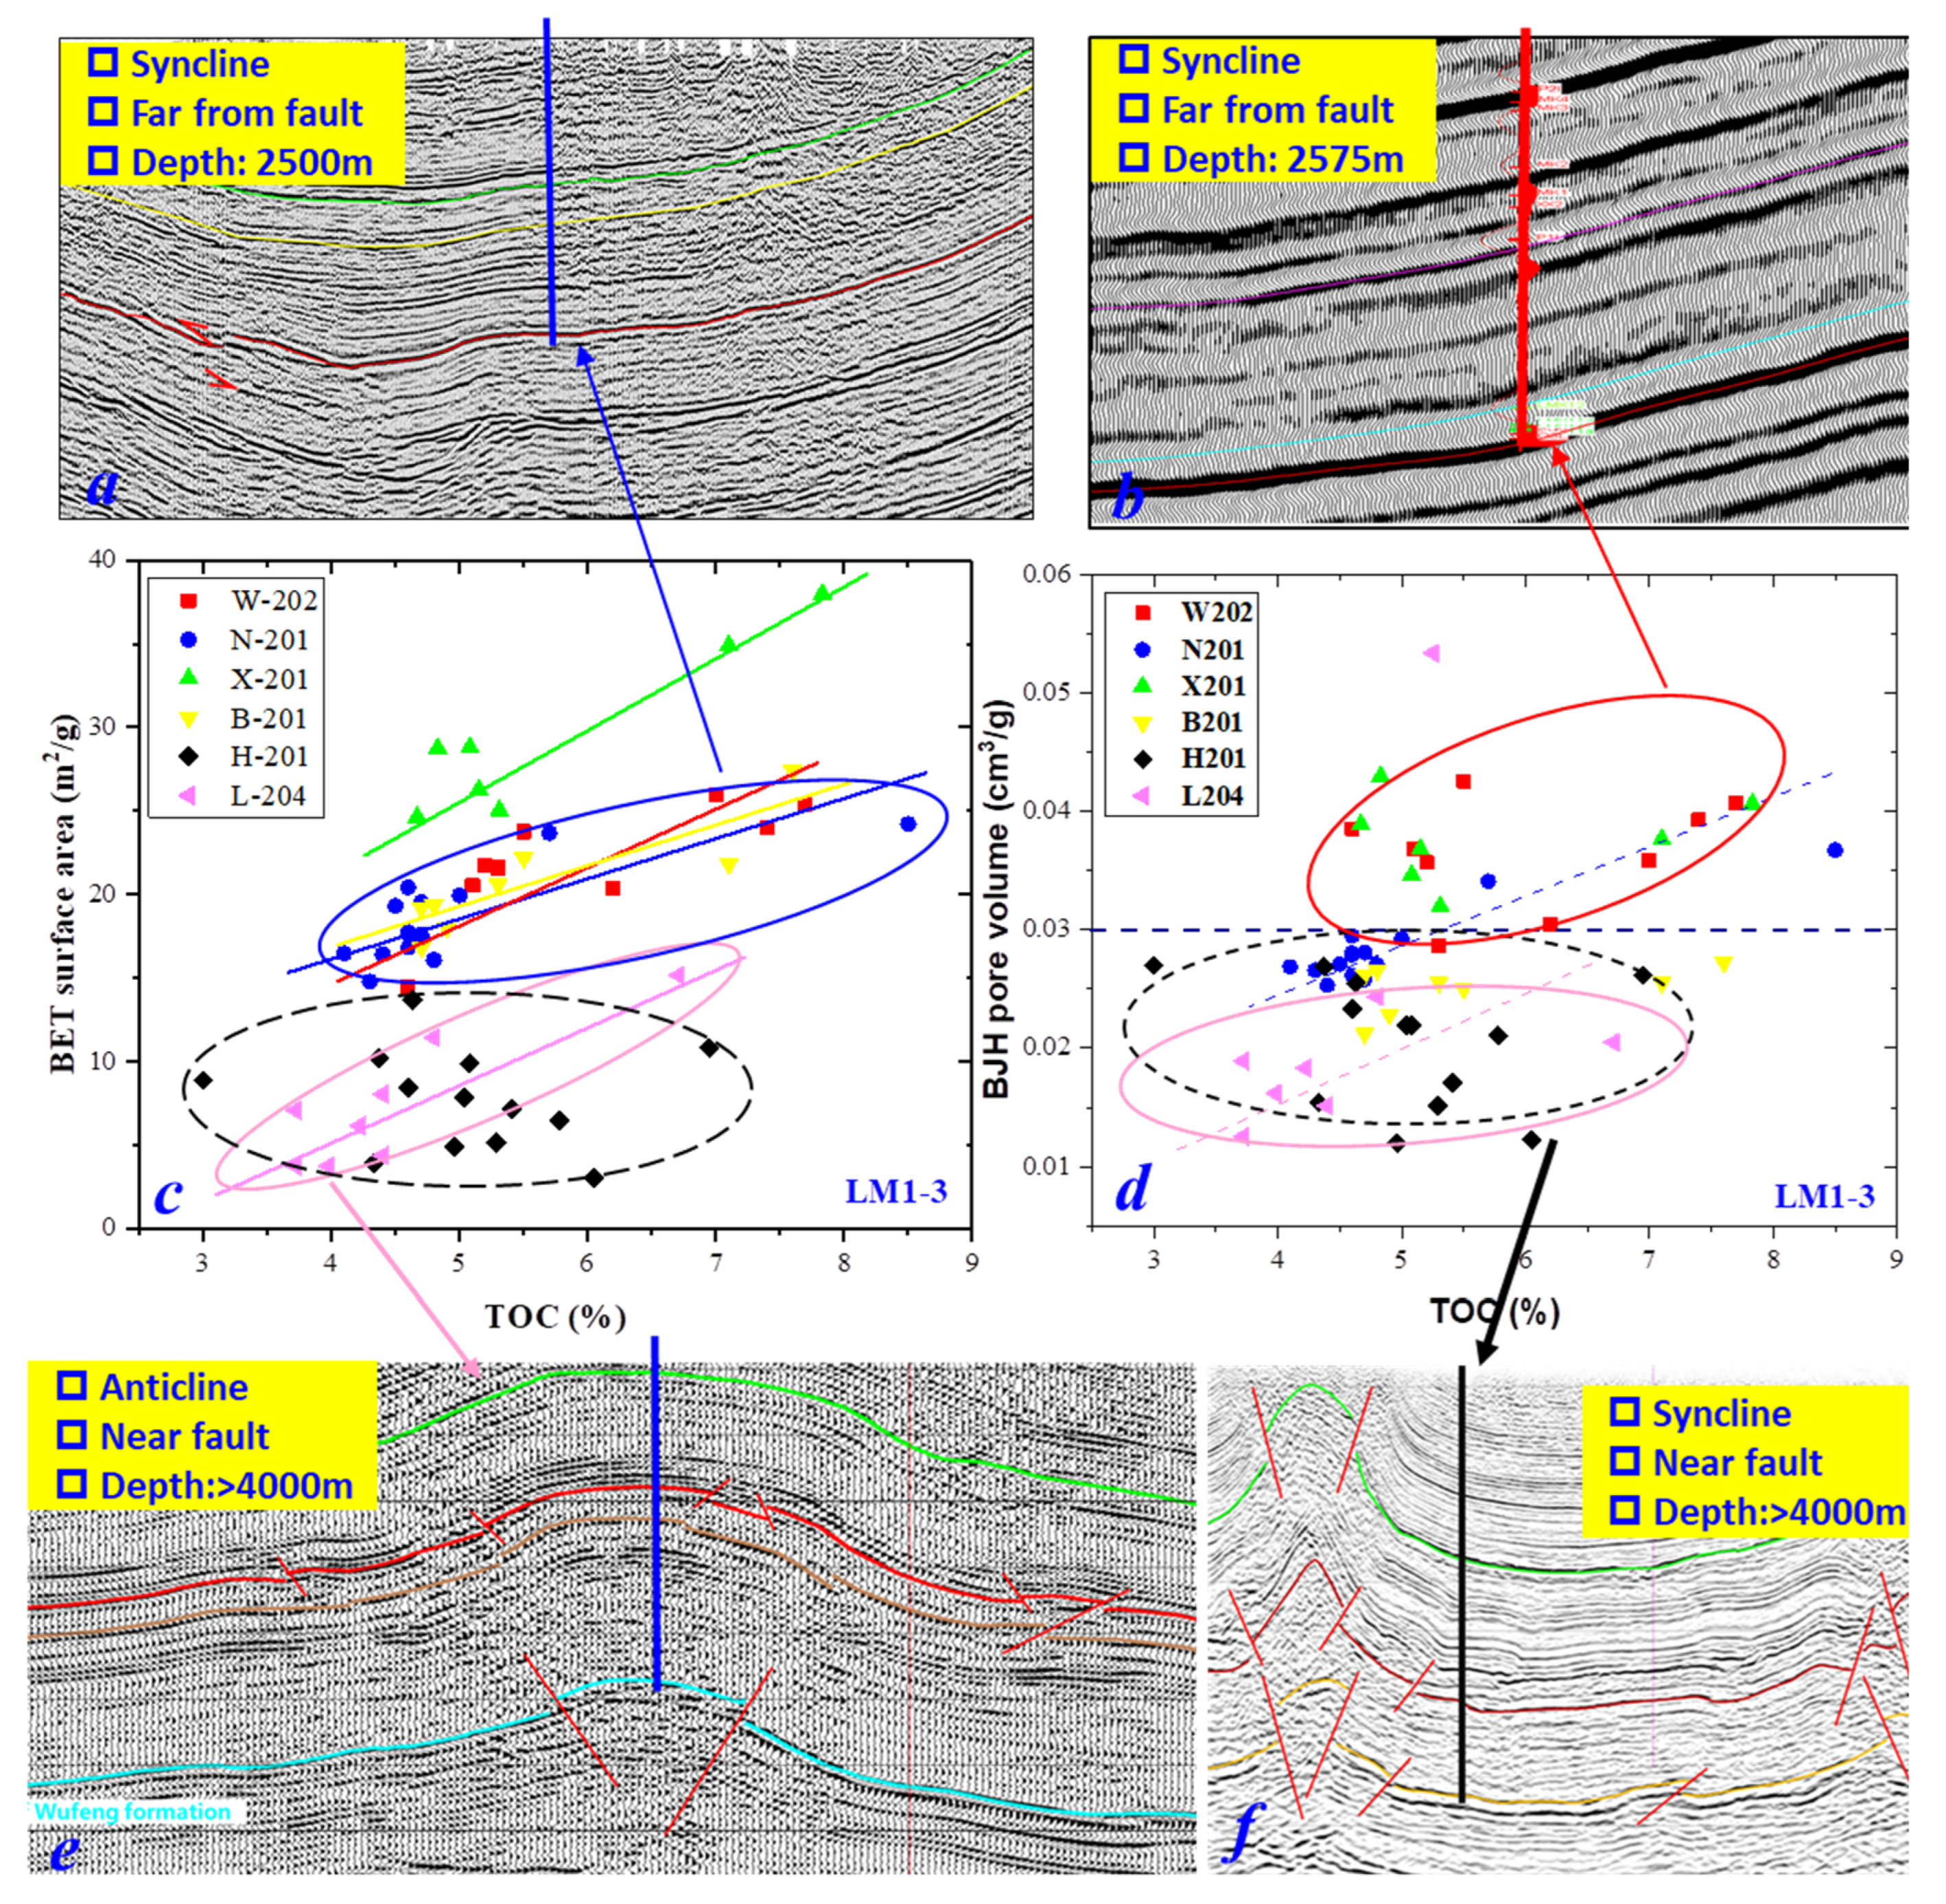
Figure 19 illustrates the pore surface area of LM1-3 samples in different wells. In most wells, the BET surface area tends to increase linearly with increasing TOC content. However, for these LM1-3 substrata shale samples, the correlations between BET surface area and TOC content are different in each well (Figure 19c). The pore surface area of shale from the X201 and N201 wells is greater than that from other samples (Figure 19c). In contrast, the pore surface area of shale samples from L204 well is less than that from other shale wells. The BET surface area and BJH pore volume of LM1-3 shales in the L204 and H201 wells are less than those of other wells. By systemically analyzing the depth, structural form, pore pressure, and tectonic environment, it was found the shale wells of W202, N201, and X201, which have relatively large pore volume and pore surface area, are located in the broad tectonic and overpressure zone (the pressure coefficients are 1.4, 2.03, and 1.95), and these shales are far from large-scale faults. Comparably, the L204 and H201 wells are near faults, and the pore volume and surface area is relatively low (Figure 19). In addition, the B201 is located in an anticline region with strong tectonic extrusion. Strong tectonic compaction will significantly reduce pore volume and specific surface area [62,63,66]. On the contrary, the overpressure and broad structural zones far away from faults are conducive to the preservation of pores.
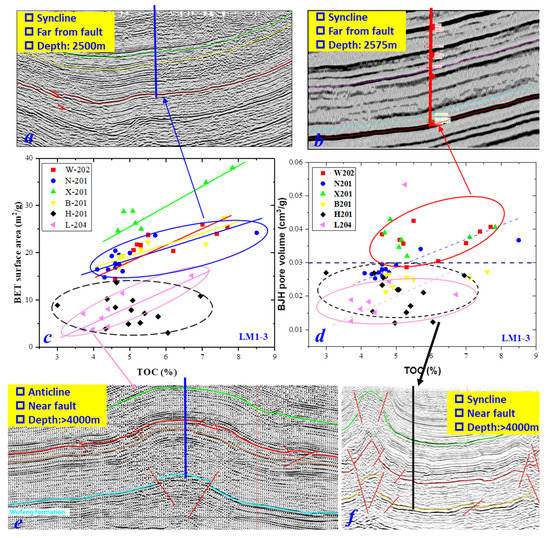
Figure 19.
The geological control factors of pore volume and surface area in different shale wells. (a,b,e,f): seismic cross-sections of well N201, W202, L204 and H201 wells; (c,d): The correlation between TOC content and BET surface area (c), BJH pore volume (d) (LM1-3 substrata).
5. Conclusions
- N2 adsorption and desorption curves are determined by the pore size, pore shapes, and pore connections, and can also provide information on the pore structure and pore connections. Two parameters (connectivity index and large pore volume index) were proposed to reflect the connectivity of pore volume and volume of large nanopores in shale. A larger connectivity index means a larger hysteresis loop and better connectivity, and a larger pore volume index means there is more space volume in large pores for N2 condensation.
- In different shale gas wells, the geological control factors are different. OM and clay minerals can both be the key factor of the pore structure. In this study, in the N201, B201, and X201 wells, organic matter is the key factor. With TOC content increasing, the pore volume and surface area both increase linearly. In the W202 shale gas well, clay minerals are the key factor for pore volume, and with increasing clay mineral content, the BJH pore volume increases linearly.
- The connectivity of the shale pore system is controlled by organic matter and quartz. With TOC content and quartz content increasing, the connectivity index increases. The large pore index increases with quartz increases from 0 to 40% and decreases with quartz increases from 40% to 100%.
- Overpressure and broad structural zones, which are also far from faults, are conducive to the preservation of pores. In contrast, shale from wells that are located in anticline regions with strong tectonic extrusion zones or near large-scale faults have relatively low pore volume and surface area.
Author Contributions
Conceptualization, Q.Z. and Y.L.; Investigation, F.L., Q.Z., B.L., P.C., C.S., Y.Z. and Y.L.; Methodology, F.L., Q.Z., B.L., P.C., Y.Z. and Y.L.; Software, Y.Z.; Visualization, F.L. and C.S.; Writing—original draft, F.L.; Writing—review & editing, Q.Z., C.S. and Y.L. All authors have read and agreed to the published version of the manuscript.
Funding
This research received no external funding.
Institutional Review Board Statement
Not applicable.
Informed Consent Statement
Not applicable.
Data Availability Statement
Not applicable.
Conflicts of Interest
The authors declare no conflict of interest.
References
- Li, W.; Liu, J.; Zeng, J.; Leong, Y.; Elsworth, D.; Tian, J.; Li, L. A fully coupled multidomain and multiphysics model for evaluation of shale gas extraction. Fuel 2020, 278, 118214. [Google Scholar] [CrossRef]
- Curtis, J.B. Fractured Shale-Gas Systems. AAPG Bull. 2002, 86, 1921. [Google Scholar]
- Ma, X.; Xie, J.; Yong, R.; Zhu, Y. Geological characteristics and high production control factors of shale gas reservoirs in Silurian Longmaxi Formation, southern Sichuan Basin, SW China. Petrol. Explor. Dev. 2020, 47, 901–915. [Google Scholar] [CrossRef]
- Hou, P.; Gao, F.; He, J.; Liu, J.; Xue, Y.; Zhang, Z. Shale gas transport mechanisms in inorganic and organic pores based on lattice Boltzmann simulation. Energy Rep. 2020, 6, 2641–2650. [Google Scholar] [CrossRef]
- Yu, H.; Zhu, Y.; Jin, X.; Liu, H.; Wu, H. Multiscale simulations of shale gas transport in micro/nano-porous shale matrix considering pore structure influence. J. Nat. Gas Sci. Eng. 2019, 64, 28–40. [Google Scholar] [CrossRef]
- Zhang, S.; Jia, B.; Zhao, J.; Pu, H. A diffuse layer model for hydrocarbon mass transfer between pores and organic matter for supercritical CO2 injection and sequestration in shale. Chem. Eng. J. 2021, 406, 126746. [Google Scholar] [CrossRef]
- Ross, D.J.K.; Marc Bustin, R. The importance of shale composition and pore structure upon gas storage potential of shale gas reservoirs. Mar. Petrol. Geol. 2009, 26, 916–927. [Google Scholar] [CrossRef]
- Chen, S.; Zhang, C.; Li, X.; Zhang, Y.; Wang, X. Simulation of methane adsorption in diverse organic pores in shale reservoirs with multi-period geological evolution. Int. J. Coal Sci. Technol. 2021, 8, 844–855. [Google Scholar] [CrossRef]
- Guan, M.; Liu, X.; Jin, Z.; Lai, J. The heterogeneity of pore structure in lacustrine shales: Insights from multifractal analysis using N2 adsorption and mercury intrusion. Mar. Petrol. Geol. 2020, 114, 104150. [Google Scholar] [CrossRef]
- Chandra, D.; Vishal, V. A critical review on pore to continuum scale imaging techniques for enhanced shale gas recovery. Earth-Sci. Rev. 2021, 217, 103638. [Google Scholar] [CrossRef]
- Chalmers, G.R.; Bustin, R.M.; Power, I.M. Characterization of gas shale pore systems by porosimetry, pycnometry, surface area, and field emission scanning electron microscopy/transmission electron microscopy image analyses: Examples from the Barnett, Woodford, Haynesville, Marcellus, and Doig units. AAPG Bull. 2012, 96, 1099–1119. [Google Scholar]
- Li, Y.; Chen, J.; Yang, J.; Liu, J.; Tong, W. Determination of shale macroscale modulus based on microscale measurement: A case study concerning multiscale mechanical characteristics. Petrol. Sci. 2022, 19, 1262–1275. [Google Scholar] [CrossRef]
- Xu, S.; Gou, Q.; Hao, F.; Zhang, B.; Shu, Z.; Lu, Y.; Wang, Y. Shale pore structure characteristics of the high and low productivity wells, Jiaoshiba shale gas field, Sichuan Basin, China: Dominated by lithofacies or preservation condition? Mar. Petrol. Geol. 2020, 114, 104211. [Google Scholar] [CrossRef]
- Wang, Y.; Zhu, Y.; Chen, S.; Li, W. Characteristics of the Nanoscale Pore Structure in Northwestern Hunan Shale Gas Reservoirs Using Field Emission Scanning Electron Microscopy, High-Pressure Mercury Intrusion, and Gas Adsorption. Energy Fuels 2014, 28, 945–955. [Google Scholar] [CrossRef]
- Loucks, R.G.; Reed, R.M.; Ruppel, S.C.; Jarvie, D.M. Morphology, Genesis, and Distribution of Nanometer-Scale Pores in Siliceous Mudstones of the Mississippian Barnett Shale. J. Sediment. Res. 2009, 79, 848–861. [Google Scholar] [CrossRef] [Green Version]
- Zhou, S.; Yan, D.; Tang, J.; Pan, Z. Abrupt change of pore system in lacustrine shales at oil- and gas-maturity during catagenesis. Int. J. Coal Geol. 2020, 228, 103557. [Google Scholar] [CrossRef]
- Chen, S.; Li, X.; Chen, S.; Wang, Y.; Gong, Z.; Zhang, Y. A new application of atomic force microscopy in the characterization of pore structure and pore contribution in shale gas reservoirs. J. Nat. Gas Sci. Eng. 2021, 88, 103802. [Google Scholar] [CrossRef]
- Wang, M.; Yu, Q. Pore structure characterization of Carboniferous shales from the eastern Qaidam Basin, China: Combining helium expansion with low-pressure adsorption and mercury intrusion. J. Petrol. Sci. Eng. 2017, 152, 91–103. [Google Scholar] [CrossRef]
- Tiwari, P.; Deo, M.; Lin, C.L.; Miller, J.D. Characterization of oil shale pore structure before and after pyrolysis by using X-ray micro CT. Fuel 2013, 107, 547–554. [Google Scholar] [CrossRef]
- Li, Y.; Yang, J.; Pan, Z.; Tong, W. Nanoscale pore structure and mechanical property analysis of coal: An insight combining AFM and SEM images. Fuel 2020, 260, 116352. [Google Scholar] [CrossRef]
- Zhang, S.; Li, Y.; Pu, H. Studies of the storage and transport of water and oil in organic-rich shale using vacuum imbibition method. Fuel 2020, 266, 117096. [Google Scholar] [CrossRef]
- Li, Y.; Zhang, C.; Tang, D.; Gan, Q.; Niu, X.; Wang, K.; Shen, R. Coal pore size distributions controlled by the coalification process: An experimental study of coals from the Junggar, Ordos and Qinshui basins in China. Fuel 2017, 206, 352–363. [Google Scholar] [CrossRef]
- Zhang, X.; Liu, C.; Zhu, Y.; Chen, S.; Wang, Y.; Fu, C. The characterization of a marine shale gas reservoir in the lower Silurian Longmaxi Formation of the northeastern Yunnan Province, China. J. Nat. Gas Sci. Eng. 2015, 27, 321–335. [Google Scholar] [CrossRef]
- Zhang, R.; Liu, S.; Wang, Y. Fractal evolution under in situ pressure and sorption conditions for coal and shale. Sci. Rep. 2017, 7, 8971. [Google Scholar] [CrossRef]
- Klaver, J.; Desbois, G.; Urai, J.L.; Littke, R. BIB-SEM study of the pore space morphology in early mature Posidonia Shale from the Hils area, Germany. Int. J. Coal Geol. 2012, 103, 12–25. [Google Scholar] [CrossRef]
- Tong, S.; Dong, Y.; Zhang, Q.; Elsworth, D.; Liu, S. Quantitative Analysis of Nanopore Structural Characteristics of Lower Paleozoic Shale, Chongqing (Southwestern China): Combining FIB-SEM and NMR Cryoporometry. Energy Fuels 2017, 31, 13317–13328. [Google Scholar] [CrossRef]
- Yang, F.; Ning, Z.; Wang, Q.; Liu, H. Pore structure of Cambrian shales from the Sichuan Basin in China and implications to gas storage. Mar. Petrol. Geol. 2016, 70, 14–26. [Google Scholar] [CrossRef]
- Zhao, J.; Jin, Z.; Hu, Q.; Liu, K.; Liu, G.; Gao, B.; Liu, Z.; Zhang, Y.; Wang, R. Geological controls on the accumulation of shale gas: A case study of the early Cambrian shale in the Upper Yangtze area. Mar. Petrol. Geol. 2019, 107, 423–437. [Google Scholar] [CrossRef]
- Liu, X.; Xiong, J.; Liang, L. Investigation of pore structure and fractal characteristics of organic-rich Yanchang formation shale in central China by nitrogen adsorption/desorption analysis. J. Nat. Gas Sci. Eng. 2015, 22, 62–72. [Google Scholar] [CrossRef]
- Iqbal, O.; Padmanabhan, E.; Mandal, A.; Dvorkin, J. Characterization of geochemical properties and factors controlling the pore structure development of shale gas reservoirs. J. Petrol. Sci. Eng. 2021, 206, 109001. [Google Scholar] [CrossRef]
- Liu, B.; Gao, Y.; Liu, K.; Liu, J.; Ostadhassan, M.; Wu, T.; Li, X. Pore structure and adsorption hysteresis of the middle Jurassic Xishanyao shale formation in the Southern Junggar Basin, northwest China. Energy Explor. Exploit. 2021, 39, 761–778. [Google Scholar] [CrossRef]
- Lukens, W.W.; Schmidt-Winkel, P.; Zhao, D.; Feng, J.; Stucky, G.D. Evaluating Pore Sizes in Mesoporous Materials: A Simplified Standard Adsorption Method and a Simplified Broekhoff−de Boer Method. Langmuir 1999, 15, 5403–5409. [Google Scholar] [CrossRef]
- Bertier, P.; Schweinar, K.; Stanjek, H.; Ghanizadeh, A.; Clark, C.R.; Busch, A. On the use and abuse of N2 physisorption for the characterization of the pore structure of shales. In The Clay Minerals Society Workshop Lectures Series; Clay Mineral Society: Boulder, CO, USA, 2016; pp. 151–161. [Google Scholar]
- Guo, X.; Qin, Z.; Yang, R.; Dong, T.; He, S.; Hao, F.; Yi, J.; Shu, Z.; Bao, H.; Liu, K. Comparison of pore systems of clay-rich and silica-rich gas shales in the lower Silurian Longmaxi formation from the Jiaoshiba area in the eastern Sichuan Basin, China. Mar. Petrol. Geol. 2019, 101, 265–280. [Google Scholar] [CrossRef]
- Wang, F.; Guo, S. Influential factors and model of shale pore evolution: A case study of a continental shale from the Ordos Basin. Mar. Petrol. Geol. 2019, 102, 271–282. [Google Scholar] [CrossRef]
- Sun, W.; Zuo, Y.; Wu, Z.; Liu, H.; Zheng, L.; Wang, H.; Shui, Y.; Lou, Y.; Xi, S.; Li, T.; et al. Pore characteristics and evolution mechanism of shale in a complex tectonic area: Case study of the Lower Cambrian Niutitang Formation in Northern Guizhou, Southwest China. J. Petrol. Sci. Eng. 2020, 193, 107373. [Google Scholar] [CrossRef]
- Zapata, Y.; Sakhaee-Pour, A. Modeling adsorption–desorption hysteresis in shales: Acyclic pore model. Fuel 2016, 181, 557–565. [Google Scholar] [CrossRef]
- Fan, C.; Nguyen, V.; Zeng, Y.; Phadungbut, P.; Horikawa, T.; Do, D.D.; Nicholson, D. Novel approach to the characterization of the pore structure and surface chemistry of porous carbon with Ar, N2, H2O and CH3OH adsorption. Microporous Mesoporous Mater. 2015, 209, 79–89. [Google Scholar] [CrossRef] [Green Version]
- Sun, C.; Nie, H.; Dang, W.; Chen, Q.; Zhang, G.; Li, W.; Lu, Z. Shale Gas Exploration and Development in China: Current Status, Geological Challenges, and Future Directions. Energy Fuels 2021, 35, 6359–6379. [Google Scholar] [CrossRef]
- Chen, X.; Fan, J.; Zhang, Y.; Wang, H.; Chen, Q.; Wang, W.; Liang, F.; Guo, W.; Zhao, Q.; Nie, H.; et al. Subdivision and Delineation of the Wufeng and Lungmachi Black shales in the Subsurface areas of the Yangtze Platform. J. Stratigr. 2015, 39, 351–358. [Google Scholar]
- Liang, F.; Zhang, Q.; Lu, B.; Jiang, W.; Xiong, X.; Peng, C.; Ren, J.; Ling, P.; Chao, M. Lithofacies and Distribution of Wufeng-Longmaxi Organic-rich Shale and Its Impact on Shale Gas Production in Weiyuan Shale Gas Play, Southern Sichuan Basin, China. Acta Sedimentol. Sin. 2021, 1–14. [Google Scholar] [CrossRef]
- Zou, C.; Dong, D.; Wang, S.; Li, J. Geological characteristics and resource potential of shale gas in China. Petrol. Explor. Dev. 2010, 37, 641–653. [Google Scholar] [CrossRef]
- Sun, H. COMPASS: An ab Initio Force-Field Optimized for Condensed-Phase ApplicationsOverview with Details on Alkane and Benzene Compounds. J. Phys. Chem. B 1998, 102, 7338–7364. [Google Scholar] [CrossRef]
- Fan, C.; Do, D.D.; Nicholson, D. On the Cavitation and Pore Blocking in Slit-Shaped Ink-Bottle Pores. Langmuir 2011, 27, 3511–3526. [Google Scholar] [CrossRef] [PubMed]
- Neimark, A.V.; Ravikovitch, P.I.; Vishnyakov, A. Adsorption hysteresis in nanopores. Phys. Rev. E 2000, 62 Pt 2A, R1493–R1496. [Google Scholar] [CrossRef] [Green Version]
- Bernard, S.; Wirth, R.; Schreiber, A.; Schulz, H.; Horsfield, B. Formation of nanoporous pyrobitumen residues during maturation of the Barnett Shale (Fort Worth Basin). Int. J. Coal Geol. 2012, 103, 3–11. [Google Scholar] [CrossRef]
- Curtis, M.E.; Cardott, B.J.; Sondergeld, C.H.; Rai, C.S. Development of organic porosity in the Woodford Shale with increasing thermal maturity. Int. J. Coal Geol. 2012, 103, 26–31. [Google Scholar] [CrossRef]
- Milliken, K.L.; Rudnicki, M.; Awwiller, D.N.; Zhang, T. Organic matter-hosted pore system, Marcellus Formation (Devonian), Pennsylvania. AAPG Bull. 2013, 97, 177–200. [Google Scholar] [CrossRef]
- Lash, G.G.; Blood, D. Geochemical and textural evidence for early (shallow) diagenetic growth of stratigraphically confined carbonate concretions, Upper Devonian Rhinestreet black shale, western New York. Chem. Geol. 2004, 206, 407–424. [Google Scholar] [CrossRef]
- Knapp, L.J.; Ardakani, O.H.; Uchida, S.; Nanjo, T.; Otomo, C.; Hattori, T. The influence of rigid matrix minerals on organic porosity and pore size in shale reservoirs: Upper Devonian Duvernay Formation, Alberta, Canada. Int. J. Coal Geol. 2020, 227, 103525. [Google Scholar] [CrossRef]
- Yang, Y.; Aplin, A.C. A permeability-porosity relationship for mudstones. Mar. Petrol. Geol. 2010, 27, 1692–1697. [Google Scholar] [CrossRef]
- Ye, Y.; Luo, C.; Liu, S.; Xiao, C.; Ran, B.; Sun, W.; Yang, D.; Luba, J.; Zeng, X. Characteristics of Black Shale Reservoirs and Controlling Factors of Gas Adsorption in the Lower Cambrian Niutitang Formation in the Southern Yangtze Basin Margin, China. Energy Fuels 2017, 31, 6876–6894. [Google Scholar] [CrossRef]
- Zhao, J.; Jin, Z.; Hu, Q.; Liu, K.; Jin, Z.; Hu, Z.; Nie, H.; Du, W.; Yan, C.; Wang, R. Mineral composition and seal condition implicated in pore structure development of organic-rich Longmaxi shales, Sichuan Basin, China. Mar. Petrol. Geol. 2018, 98, 507–522. [Google Scholar] [CrossRef]
- Chalmers, G.R.L.; Bustin, R.M. Lower Cretaceous gas shales in northeastern British Columbia; Part I, Geological controls on methane sorption capacity. Bull. Can. Pet. Geol. 2008, 56, 1–21. [Google Scholar] [CrossRef]
- Zhu, H.; Ju, Y.; Huang, C.; Qi, Y.; Ju, L.; Yu, K.; Li, W.; Feng, H.; Qiao, P. Petrophysical properties of the major marine shales in the Upper Yangtze Block, south China: A function of structural deformation. Mar. Petrol. Geol. 2019, 110, 768–786. [Google Scholar] [CrossRef]
- Chalmers, G.R.L.; Ross, D.J.K.; Bustin, R.M. Geological controls on matrix permeability of Devonian Gas Shales in the Horn River and Liard basins, northeastern British Columbia, Canada. Int. J. Coal Geol. 2012, 103, 120–131. [Google Scholar] [CrossRef]
- Dong, T.; Harris, N.B.; McMillan, J.M.; Twemlow, C.E.; Nassichuk, B.R.; Bish, D.L. A model for porosity evolution in shale reservoirs: An example from the Upper Devonian Duvernay Formation, Western Canada Sedimentary Basin. AAPG Bull. 2019, 103, 1017–1044. [Google Scholar] [CrossRef] [Green Version]
- Xi, Z.; Tang, S.; Wang, J. The reservoir characterization and shale gas potential of the Niutitang formation: Case study of the SY well in northwest Hunan Province, South China. J. Petrol. Sci. Eng. 2018, 171, 687–703. [Google Scholar] [CrossRef]
- Jia, A.; Hu, D.; He, S.; Guo, X.; Hou, Y.; Wang, T.; Yang, R. Variations of Pore Structure in Organic-Rich Shales with Different Lithofacies from the Jiangdong Block, Fuling Shale Gas Field, SW China: Insights into Gas Storage and Pore Evolution. Energy Fuels 2020, 34, 12457–12475. [Google Scholar] [CrossRef]
- Liang, M.; Wang, Z.; Gao, L.; Li, C.; Li, H. Evolution of pore structure in gas shale related to structural deformation. Fuel 2017, 197, 310–319. [Google Scholar] [CrossRef]
- Ji, L.; Zhang, T.; Milliken, K.L.; Qu, J.; Zhang, X. Experimental investigation of main controls to methane adsorption in clay-rich rocks. Appl. Geochem. 2012, 27, 2533–2545. [Google Scholar] [CrossRef]
- Ju, Y.; Sun, Y.; Tan, J.; Bu, H.; Han, K.; Li, X.; Fang, L. The composition, pore structure characterization and deformation mechanism of coal-bearing shales from tectonically altered coalfields in eastern China. Fuel 2018, 234, 626–642. [Google Scholar] [CrossRef]
- Wang, G. Deformation of organic matter and its effect on pores in mud rocks. AAPG Bull. 2020, 103, 21–36. [Google Scholar] [CrossRef]
- Sun, M.; Zhang, L.; Hu, Q.; Pan, Z.; Yu, B.; Sun, L.; Bai, L.; Fu, H.; Zhang, Y.; Zhang, C.; et al. Multiscale connectivity characterization of marine shales in southern China by fluid intrusion, small-angle neutron scattering (SANS), and FIB-SEM. Mar. Petrol. Geol. 2020, 112, 104101. [Google Scholar] [CrossRef]
- Zhu, H.; Ju, Y.; Huang, C.; Han, K.; Qi, Y.; Shi, M.; Yu, K.; Feng, H.; Li, W.; Ju, L.; et al. Pore structure variations across structural deformation of Silurian Longmaxi Shale: An example from the Chuandong Thrust-Fold Belt. Fuel 2019, 241, 914–932. [Google Scholar] [CrossRef]
- Zhu, H.; Ju, Y.; Qi, Y.; Huang, C.; Zhang, L. Impact of tectonism on pore type and pore structure evolution in organic-rich shale: Implications for gas storage and migration pathways in naturally deformed rocks. Fuel 2018, 228, 272–289. [Google Scholar] [CrossRef]


Publisher’s Note: MDPI stays neutral with regard to jurisdictional claims in published maps and institutional affiliations. |
© 2022 by the authors. Licensee MDPI, Basel, Switzerland. This article is an open access article distributed under the terms and conditions of the Creative Commons Attribution (CC BY) license (https://creativecommons.org/licenses/by/4.0/).