Article

Fast Pyrolysis Oil Upgrading via HDO with Fe-Promoted Nb2O5-Supported Pd-Based Catalysts

by
Mariana Myriam Campos Fraga
,
Bruno Lacerda de Oliveira Campos
,
Handoyo Hendrawidjaja
,
Caroline Carriel Schmitt
,
Klaus Raffelt
* and
Nicolaus Dahmen
Institute of Catalysis Research and Technology, Karlsruhe Institute of Technology, 76344 Eggenstein-Leopoldshafen, Germany
*
Author to whom correspondence should be addressed.
Energies 2022, 15(13), 4762; https://doi.org/10.3390/en15134762
Submission received: 30 April 2022 / Revised: 16 June 2022 / Accepted: 21 June 2022 / Published: 29 June 2022
(This article belongs to the Special Issue Renewable Resources and Biorefineries 2021)

Abstract

:
Due to the high acid, oxygen and water contents of fast pyrolysis oil, it requires the improvement of its fuel properties by further upgrading, such as catalytic hydrodeoxygenation (HDO). In this study, Nb2O5 was evaluated as a support of Pd-based catalysts for HDO of fast pyrolysis oil. A Pd/SiO2 catalyst was used as a reference. Additionally, the impact of iron as a promoter in two different loadings was investigated. The activity of the synthesized catalysts was evaluated in terms of H2 uptake and composition of the upgraded products (gas phase, upgraded oil and aqueous phase) through elemental analysis, Karl Fischer titration, GC-MS/FID and 1H-NMR. In comparison to SiO2, due to its acid sites, Nb2O5 enhanced the catalyst activity towards hydrogenolysis and hydrogenation, confirmed by the increased water formation during HDO and a higher content of hydrogen and aliphatic protons in the upgraded oil. Consequently, the upgraded oil with Nb2O5 had a lower average molecular weight and was therefore less viscous than the oil obtained with SiO2. When applied as a promoter, Fe enhanced hydrogenation and hydrogenolysis, although it slightly decreased the acidity of the support, owing to its oxophilic nature, leading to the highest deoxygenation degree (42.5 wt.%) and the highest product HHV (28.2 MJ/kg).

1. Introduction

The increasing global energy demand associated with the necessity to decrease the manmade CO2 footprint due to climate, environmental and resource concerns highlights the potential of biomass as a sustainable, abundant and renewable carbon source [1,2,3]. Depending on the management and process efficiency, biomass-derived fuels can even be CO2 neutral. In light of the recent rise in fossil fuel prices, biomass is particularly important for improving energy supply security on both national and global level [4].
Biomass feedstock can be provided from several sources, including agriculture, forestry, food, and wood industry as well as organic waste. It is already responsible for 70% of the total renewable energy supply worldwide; most of its use is related to cooking and space heating [5]. Notwithstanding, in recent decades, interesting milestones have been achieved by the so-called modern bioenergy, which is defined as the use of biomass in modern heating technologies, in power generation and to produce transportation fuels. The global primary energy demand of modern bioenergy increased from 374 Mtoe (million tons of oil equivalent) in 2000 to 737 Mtoe in the year 2018 [6]. First generation biofuels have been implemented in many countries, such as bioethanol in Brazil and in the United States of America, as well as biodiesel and hydrotreated vegetable oils in the European Union [7]. These fuels are usually made from edible biomass such as corn, sugarcane and vegetable oils, whose conversion process does not normally use the whole plant. Second generation biofuels can be usually produced from agricultural, wood and organic waste. Still, the heterogeneity of residual feedstock poses challenges, and therefore, there is still much need for improvements [8].
Considering thermochemical conversion processes, three main technologies have evolved to convert lignocellulosic biomass into fuels and chemicals precursors, which are: hydrothermal liquefaction, pyrolysis, and gasification [9]. While hydrothermal liquefaction and pyrolysis transform the biomass directly into liquid products, gasification converts biomass mainly into syngas (H2, CO and CO2), which requires further catalytic conversion into liquids [10,11]. Although gasification leads to well-defined products and requires less downstream processing, the simplicity of operation techniques together with reasonable costs make pyrolysis a promising process [12,13].
Pyrolysis is a high temperature degradation of biomass into a condensable mixture of oxygenated compounds, light gases and char, in which the product distribution is controlled by operation parameters [1,14]. The fast pyrolysis consists of the thermal treatment (450–600 °C) of small dry biomass particles at short hot vapor residence time, atmospheric pressure or below, in the absence of oxygen [15]. These conditions aim to maximize the yield of the liquid fraction, the so-called bio-oil or bio-crude [1,16]. There are already commercial fast pyrolysis plants in operation in USA, Canada, the Netherlands and Finland [11]. In all these cases, wood is used as a feedstock and the produced bio-crude is designated for heating purposes [17].
Bio-crude is a complex mixture of oxygenated hydrocarbons, because of depolymerization and fragmentation reactions of lignocellulosic biomass during pyrolysis [15,18]. The following main organic compounds are present: carboxylic acids, alcohols, furans, aromatics, sugars (anhydrous, mono- and oligomeric) and water insoluble lignin-derived compounds [19]. In comparison with fossil heavy oil, bio-crude has higher contents of water (15–30 wt.%) and oxygen (28–40 wt.%), which are responsible for most of the undesired properties of bio-crude, such as high acidity and low heating value [13,14,20]. Thus, while the removal of nitrogen and sulfur is required for heavy oil, further upgrading is also needed for the bio-crude if it is intended to be applied as a fuel. However, considering its properties, the bio-crude cannot be directly processed in conventional refineries as a fuel precursor [16]. In this sense, a promising process for the upgrading of bio-oil is catalytic hydrodeoxygenation (HDO) [13,21,22].

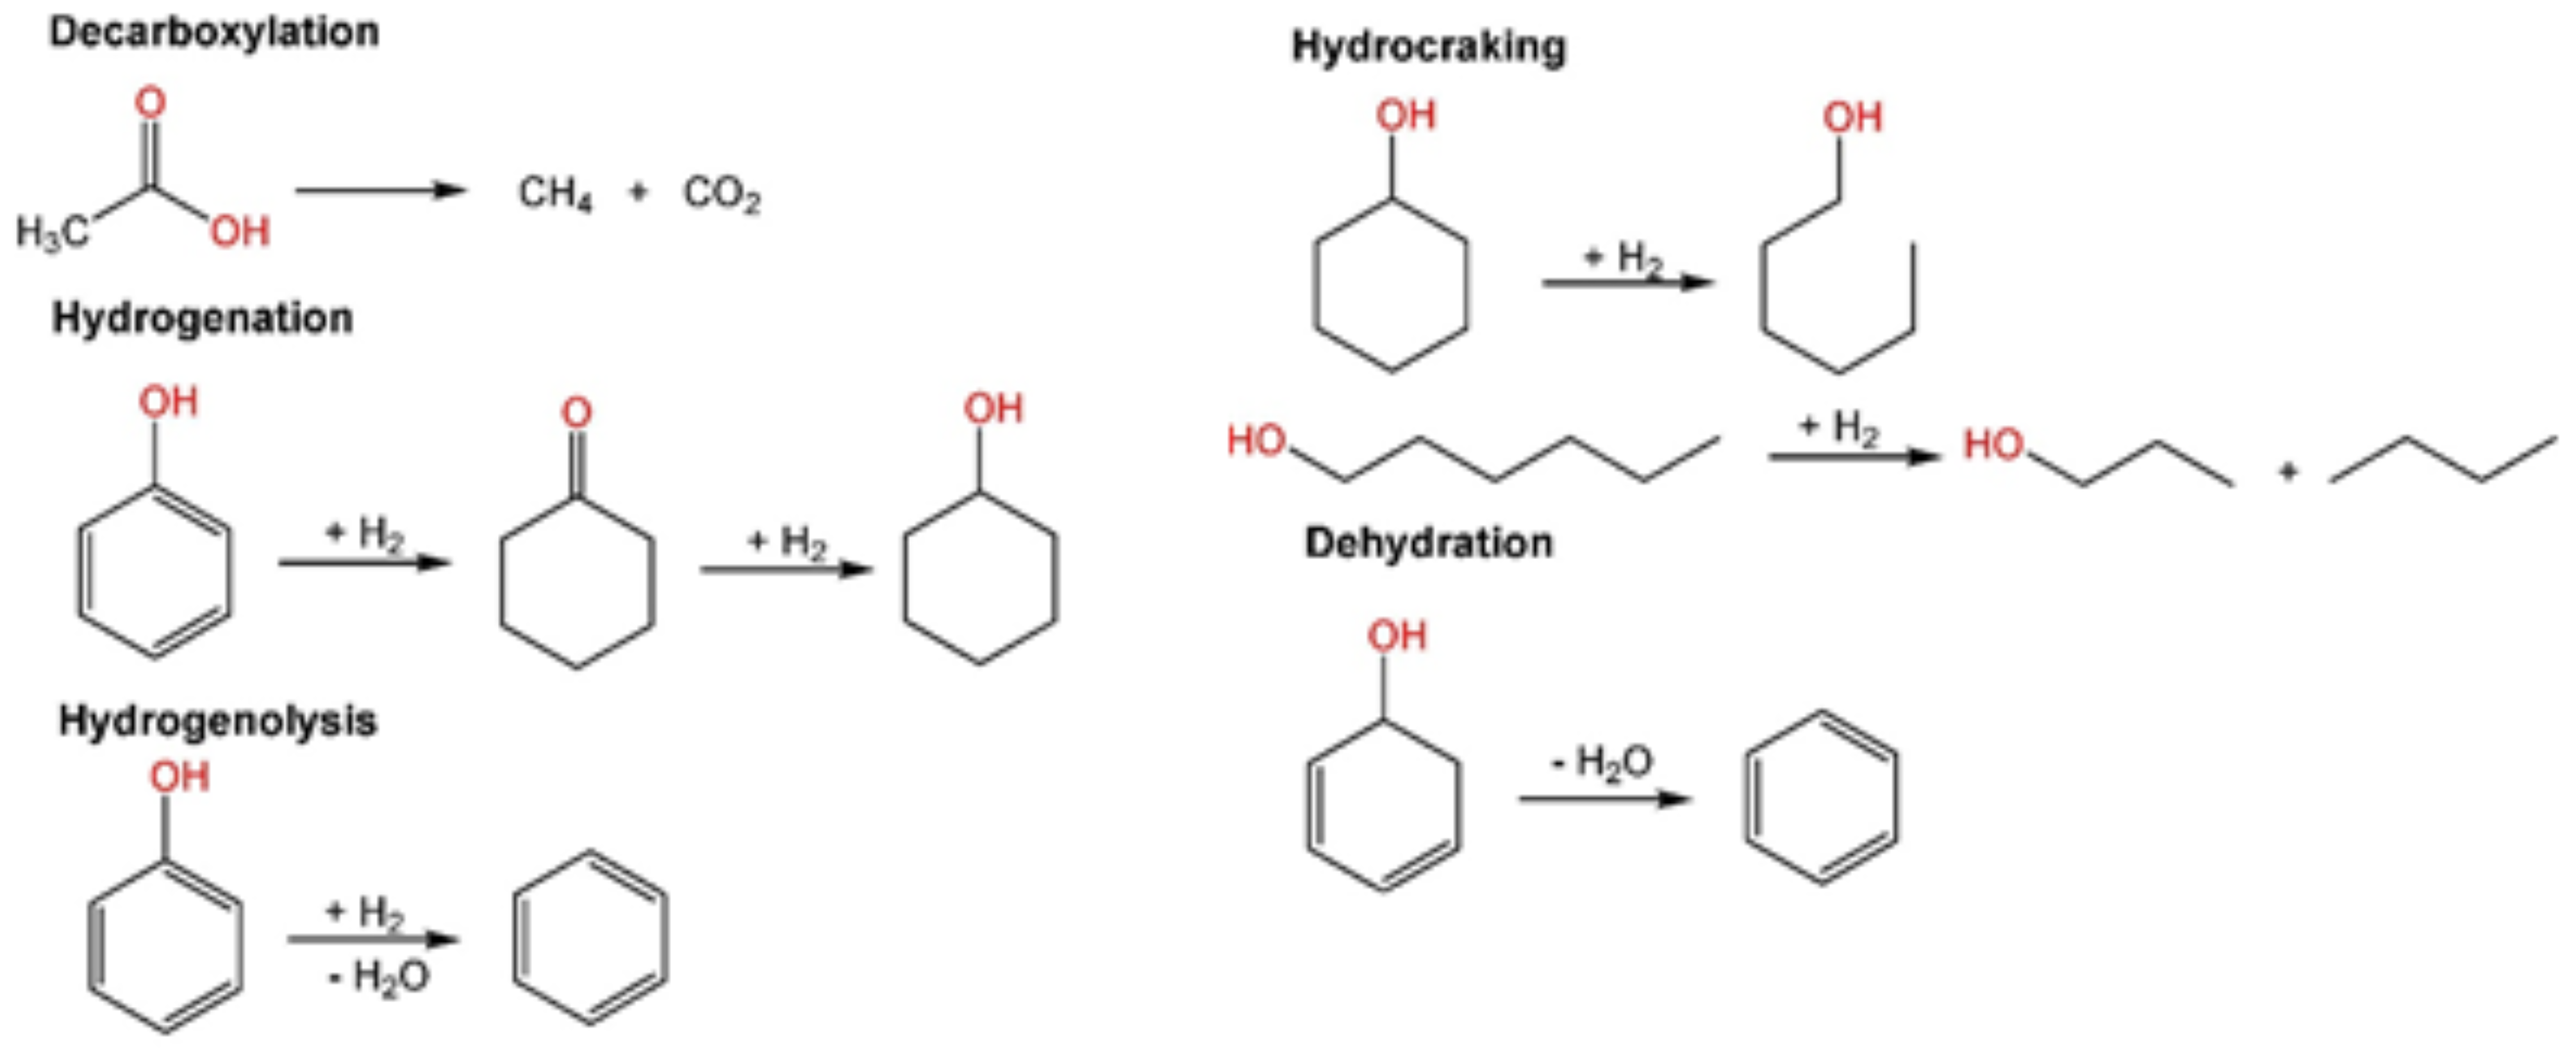
1.1. Catalytic Hydrodeoxygenation of Biomass-Derived Compounds

Catalytic HDO consists of a group of reactions with oxygenated organic molecules under pressurized hydrogen in the presence of an active catalyst, producing less oxygenated compounds. Several reactions take place during the HDO (Figure 1), including desirable and undesirable ones [13,23,24,25]. As mentioned in the literature, the word “hydrogenolysis” is used here to distinguish the specific reaction which consumes H2 and produces water from the general HDO term, which is applied for the whole group of reactions that happen during the hydrotreatment [23,26,27,28].
Designed catalysts for HDO need to overcome several challenges associated with bio-crude properties, such as the degradation promoted by high water content and high acidity, as well as coke formation [29]. The adsorption of inorganic species such as nitrogen or sulfur and the deposition of alkali metals may also deactivate the catalyst. In this sense, metal leaching, pore sintering and consequently losses of active surface should be monitored [22,30].
Noble metals are a promising class of active metals for HDO catalysts due to their high hydrogenation activity of C=C and C=O. Because of their outstanding ability on activating hydrogen and not being deactivated by water, they have been intensively studied. Furthermore, the decarbonylation and decarboxylation are considered a dominant pathway for HDO on Pt and Pd [30,31,32]. This is related to their ability to promote C-C scission, producing CO and CO2.
In addition, they are significantly resistant to sulfur poisoning or oxidative deactivation [23]. However, noble metals are generally expensive and some (i.e., Pt, Pd) have low deoxygenation activities, which motivates the development of new strategies, such as the development of bifunctional catalysts [30]. The bifunctionality can be achieved by several strategies, including the addition of a promoter and the combination of an active metal with interacting support [29,30,33,34]. In this sense, the use of acid solid supports provide catalytic sites to perform different types of elementary reactions, such as hydrocracking, dehydration and isomerization [35,36]. The acidity of these supports is related to Brønsted and Lewis acid sites, each of them playing a different role in the HDO. While the Brønsted acid sites protonate the intermediates, the Lewis acid sites act as a bond between the oxygenated compounds and the catalyst surface [23]. Nonetheless, a high acidity of the support can lead to carbocation formation, which may result in polymerization and further coke formation, if the hydrogen pressure is not high enough [23]. Several solid acid supports have been evaluated such as zeolites, γ-alumina, Nafion/silica, nitric-acid-treated carbon (NAC) and niobia [23,27].

1.2. Niobium Oxide (Nb2O5) as a Solid Acid Support for HDO

As a catalyst support, niobia has attracted considerable attention owing to its water-resistant acid sites which results in its high stability [2]. Because of its properties, niobia has been already studied as a solid acid catalyst for several reactions, such as dehydration, hydration, etherification, hydrolysis, condensation, dehydrogenation, alkylation, photochemical and electrochemical polymerization and oxidation [37,38,39,40]. Considering the significantly high water content from bio-oil and the water-resistant acid sites from niobia as well as its high oxophilicity, niobia has been quoted as a promising support for HDO. Thus, the Nb2O5-supported catalysts have been evaluated for the hydrotreatment of several biomass-derived model compounds. These model compounds studies allowed fundamental studies about the catalyst behavior, including some clarifications regarding the reaction pathways [41]. In several studies, when compared to other typical solid acid catalysts, Nb2O5 has shown a superior HDO performance due to the ability of NbOx species to promote C-O bond cleavage. The acid sites of NbOx species reduces the energy barrier for C-O bond scission of carbonyl, carboxyl, hydroxyl and methoxy groups. In this sense, the oxophilicity of Nb4+ and Nb5+ induces the polarization of the C-O bond due to a charge transfer from the oxygen atom of the organic molecule to the cation Nb4+/Nb5+, resulting in the bond scission. Barrios et al. [41] compared the performance of Pd-based catalysts supported on silica and on niobia for the upgrading of phenol using a fixed bed reactor. The Pd/Nb2O5 showed a 90-fold higher selectivity towards completely deoxygenated products and a 40-fold higher selectivity towards benzene, while cyclohexanone was the main product on Pd/SiO2. Jing et al. [42] compared the performance of Pd catalysts supported on niobia and other compositions (CaO, MgO, MgAl-HT, ZrO2 and Al2O3) for the aldol condensation, followed by the HDO of furfural, 4-heptanone and cyclohexanone. The authors reported a 90% selectivity towards aldol products over Pd/Nb2O5, which is 30% higher than on the other tested catalyst compositions. Besides the use of lignin-derived model compounds, such as phenol, anisole, m-cresol and guaiacol, Teles et al. [43] conducted the HDO of real feed in a vapor phase study. They applied Pd/SiO2, Pd/Nb2O5 and Pd/NbOPO4 for the HDO of pine pyrolysis vapors. The Pd/Nb2O5 led to a 59% reduction in oxygenated compounds on the pyrolysis vapor in contrast with the 24% reduction observed for Pd/SiO2. The application of Pd/Nb2O5 for real feed was also reported by Dong et al. [44]. They evaluated the HDO of raw birch lignin extracted with methanol and upgraded in aqueous solution over 20 h, achieving a high selectivity towards cycloalkanes.

1.3. Iron as Catalyst Promoter for HDO

As already mentioned, the addition of a promoter to a monometallic composition is an effective strategy for improving its HDO activity through the modification of the structural and electronic properties of the metals. The addition of an oxophilic metal, such as Fe, Co and Mo to noble metal-based catalysts, enhances the selectivity of desired products by changing the reactions pathways towards deoxygenated products. Fe has a high potential for HDO due to its high selectivity for deoxygenated aromatics from phenolics, besides its high availability and low cost. Sun et al. [45] compared the performance of bimetallic PdFe/C with their monometallic counterparts (Pd/C and Fe/C) for vapor phase HDO of guaiacol. The authors reported an enhanced activity of the bimetallic catalyst, with a higher selectivity to deoxygenated aromatic compounds than the monometallics Pd/C and Fe/C. At 450 °C, the yield of completely deoxygenated products (benzene, toluene and trimethylbenzene) over PdFe/C reached 83% in contrast with the 43% yield achieved over Fe/C catalyst. This drastic increase is attributed to the modification of Fe nanoparticles promoted by Pd. Related to that, the synergy of Pd-Fe on mesoporous carbon (OMC) was evaluated by Kim et al. [46] on the catalytic decomposition of a lignin representative model compound (i.e., phenethyl phenyl ether), to aromatics under hydrogen atmosphere. Although the monometallic Pd/OMC had the highest conversion of phenethyl phenyl ether (94.1% mol/mol), it also had the highest yield of saturated products and the lowest yield of completely deoxygenated aromatic compounds such as benzene (7.2%) and ethylbenzene (3.4%). In turn, the bimetallic Pd-Fe0.7/OMC had the best compromise between conversion (75.6% mol/mol) and selectivity for aromatics, with a higher yield for benzene (26.5%) and ethylbenzene (27.2%). The performance of the Pd-Fe catalysts was attributed to the interaction between Pd and Fe, which resulted in an electronic transfer from Fe to Pd, forming a bimetallic structure dependent on the metal ratios. Despite the interesting selectivity towards direct C-O cleavage, Fe-containing catalysts might suffer from deactivation by oxidation and by carbon deposition [23].
As mentioned before, Pd-based catalysts supported on Nb2O5 have been evaluated for HDO of biomass-derived model compounds, extracted lignin and pyrolysis vapors with promising results. However, more studies need to be conducted to understand the balance between the enhancement of HDO activity and the catalyst deactivation when exposed to fast pyrolysis oil. The current work reports the application of Nb2O5 as a catalyst support of metallic (Pd) and bimetallic (Pd/Fe) compositions for the upgrading of the light phase of beech wood fast pyrolysis oil through catalytic HDO. Two different Fe loadings (1 wt.% and 8 wt.%) are evaluated. Moreover, the influence of Nb2O5 as a support is compared with SiO2 as a reference. Finally, the characterization of spent catalysts is performed to access catalyst deactivation mechanisms during the hydrotreatment.

2. Materials and Methods

2.1. Catalyst Preparation

Catalyst compositions with four different iron loadings were prepared (0%, 1% and 8 wt.% Fe). All of them were wet impregnated with palladium as the active metal (1 wt.%) (Sigma Aldrich, No. 205761; St. Louis, MO, USA) and supported on Nb2O5 (kindly provided by CBMM—Companhia Brasileira de Minas e Mineração, Minas Gerais, Brazil). Finally, a fourth catalyst with 1 wt.% palladium, no iron and supported on silica was prepared as a reference.
First, pellets of SiO2 (Alfa Aeser, Ward Hill, MA, USA) were milled and the fraction between 0.250 mm and 0.125 mm was further calcined at 350 °C for 3 h. In turn, Nb2O5 was calcined at 500 °C for 4 h before being applied.
The iron-containing catalysts were synthesized as follows. First, the support was calcined for 4 h at 500 °C in air. Then, the iron precursor Fe(NO3)2·6H2O (Sigma-Aldrich, No. 254423; St. Louis, USA) was dissolved in water and mixed with previously calcined Nb2O5 in the proper ratio. The impregnation process was conducted in a rotary evaporator at 45 mbar, 35 °C and 200 rpm until the water was completely evaporated. The solid was dried at 100 °C for at least 12 h and calcined at 350 °C for 3 h. Later, a second impregnation was performed with an aqueous palladium solution prepared with Pd(NO3)2 (Sigma-Aldrich, No. 205761; St. Louis, USA). The solid was once again dried at 100 °C for at least 12 h and calcined at 350 °C. Before the HDO, the catalysts were reduced at 350 °C for 3 h under hydrogen atmosphere (25% v/v H2 and 75% v/v N2). The preparation of the 1 wt.% Pd/Nb2O5 catalyst followed the same procedure, but with a single impregnation.
In the synthesis of the reference catalyst (1 wt.% Pd/SiO2), the silica support (Sigma Aldrich, No. 44740; St. Louis, USA) was calcined at 350 °C for 3 h. Afterwards, the support was impregnated with an aqueous solution of palladium nitrate (Pd(NO3)2 under 45 mbar, 35 °C and 200 rpm until the water evaporated. The drying, calcination and reduction processes were conducted exactly as described for the other catalysts.

2.2. Hydrodeoxygenation (HDO) of Fast Pyrolysis Bio-Oil

The reactions were performed using the light phase of beech wood fast pyrolysis oil (BTG Biomass Technology Group BV, Enschede, The Netherlands). The use of the light phase instead of the whole oil has several advantages. The high water and acid contents of the light phase present an interesting challenge to be overcome by catalysts. Furthermore, because of its high water content (32 wt.%) and consequently low heating value, the light phase would have no value as a fuel precursor without proper upgrading. Finally, due to the low viscosity, the light phase is easier to handle and the losses of upgraded product are smaller. This way, in order to separate both light phase and heavy phase before the hydrotreatment, the bio-oil was intentionally aged at 80 °C for 24 h. The heavy phase, rich in organic compounds, was denser while the light phase, rich in water, was on the upper part.
The HDO reaction was performed on a 200 mL autoclave, manufactured of Inconel alloy 625 to be operated at a maximum pressure of 36 MPa and a maximum temperature of 400 °C. The autoclave is equipped with cartridge heaters in a brass jacket connected to LabView for temperature control and is also equipped with a magnetically coupled gas injection stirrer (80 N∙cm of torque, Premex, Lyss, Switzerland). The H2 input via stirrer is expected to improve gas contact with the oil and, therefore, reduce polymerization and improve the hydrogenation pathway.
The performance of each catalyst was evaluated in triplicate testing. A blank test (without catalyst) was also performed. For each HDO experiment, the batch reactor was filled with 50 g of light phase beech wood pyrolytic oil (feed) and 2 g of pre-reduced catalyst. Then, the autoclave was sealed and purged with argon. Afterwards, it was pressurized to 8 MPa at room temperature with H2 (Air Liquide 6.0, Paris, France). The stirrer rotation speed was set to 800 rpm and the reactor was heated to 250 °C (heating ramp of 3.33 °C∙min−1), with a total reaction time of 2 h including the heating ramp. Then, the reaction was quenched by cooling with compressed air until the temperature inside the reactor was lower than 40 °C. After cooling, a gas sample was taken to be analyzed by gas chromatography. The non-gaseous upgraded products were collected, weighed and separated by centrifugation for 30 min at 13,000 rpm (Thermo Scientific Heräus Biofuge Stratos fixed angle rotor 26, No. 75003014. Thermo Fisher Scientific, Waltham, MA, USA). After centrifugation, aqueous phase (AP) on the top consisted mostly of water and polar compounds, while the oil phase on the bottom, called here upgraded oil (UO), consisted of a rich organic mixture with high viscosity. The solids, mainly recovered catalyst and eventual carbon compounds from coking reactions, were washed with acetone and ethanol to remove all soluble organic products. After separation, the aqueous phase and recovered solids were weighed. The upgraded oil recovery as well as the theoretical recoveries were calculated as described in the Supplementary Material (Equations (S1)–(S4)).

2.3. Characterization of the Gas Phase

The gas sample taken right after reaction quenching was analyzed by gas chromatography. The gas chromatograph (GC) 6890 Agilent, equipped with a valve switching system and two columns (Restek 57096 Hayesep Q and Restek Molsieve 5A), was used. The determination of the compounds was achieved using a thermal conductivity detector (TCD) and a flame ionization detector (FID). The gas chromatography method is described in the Supplementary Material (Section S1.2). With the final concentration of each gas component, as well as the temperature and pressure values before and after the hydrotreatment, the gas production and the hydrogen consumption were calculated with the ideal gas law.

2.4. Characterization of Feedstock and Liquid Products

The feedstock and liquid products were characterized by several techniques. The water content was measured through Karl Fischer titration carried out with the Titrando 841 system, (Metrohm), using iodine, sulfur dioxide and imidazole as titrant.
Carbon, hydrogen and nitrogen contents were determined using elemental analysis performed on Leco True Spec Macro, LECO Europe, Software version 2.53 (22 December 2010) Corporation Copyright® 2001–2010. The oxygen content was determined by assuming the samples were composed only by carbon, nitrogen, hydrogen and oxygen (Equation (S5)). Then, the degree of deoxygenation was calculated with the oxygen content before and after the upgrading in dry basis as shown in Equation (1):
DOD wt.% = 100 wt.% − (Oproduct wt.%)/(Ofeed wt.%)
The higher heating value was calculated using the Chaniwalla equation [47] (Equation (S6)) with the values from elemental analysis.
In terms of organic functional groups, the aqueous phase, upgraded oil as well as the feedstock were characterized by 1H-NMR spectroscopy. The proton NMR measurements were performed at 399.91 MHz on a Varian Inova Unity 400 spectrometer equipped with a 9.4T Oxford magnet and a 5 mm broadband direct detection probe head (1H, X1H, X: heteronucleus 40 MHz to 162 MHz). Sample preparation procedures and the applied method are detailed in the Supplementary Material (Section S1.4). The spectrum treatment was performed using the software MestReNova. The integration of the spectra was carried out with predefined regions adapted from Joseph et al. [48], after subtracting the area of the peak attributed to water molecules.
Quantitative and qualitative gas chromatography were applied for chemical composition analysis. Quantitative analysis was conducted on an HP 5890 gas chromatograph equipped with a Rxi®5Sil MS capillary column (0.25 µm × 0.25 µm × 30 m) paired with a flame ionization detector. For each of the analyzed compounds, an external calibration was previously performed. Qualitative analysis was performed on an Agilent 6890N coupled with Agilent 5973N mass spectrometer (MS) and flame ionization detector (FID) in a column-type RTX-5MS (0.25 µm × 0.25 µm × 30 m). NIST 2008 database was used to provide a qualitative evaluation. All methods applied for the gas chromatography measurements as well as the sample preparation procedures are detailed in the Supplementary Material (Section S1.5).
In order to evaluate the leaching of the catalyst components into the upgraded products, the metal content on aqueous phase and upgraded oil was measured by ICP-OES (Inductively Coupled Plasma Optical Emission Spectroscopy). In order to digest the metals, a pre-digestion with HNO3 (65%), HCl (37%), HF (40%) and H2O2 (35%) was applied in a microwave oven at 240 °C for 45 min. The digested samples were analyzed in an ICP-OES spectrometer Agilent 725 with argon as plasma gas (15 L∙min−1, 40 MHz, 20 KW).

2.5. Characterization of Catalysts and Solid Products

The catalysts (before and after HDO reaction) as well as their intermediates during preparation were characterized by inductively coupled plasma optical emission spectroscopy (ICP-OES), energy-dispersive X-ray spectroscopy (EDS), scanning electron microscope (SEM), X-ray diffraction (XRD), N2 physisorption (BET) and CHN (Elemental analysis).
The metal content of fresh and spent catalysts was determined by ICP-OES, as previously described in Section 2.4.
The catalyst morphology and the elemental distribution on the catalyst surface were determined via SEM and EDS. The FE-SEM (field emission-SEM) DSM 982 Gemini, Carl Zeiss Ltd. (Oberkocken, Germany) equipped with a secondary ion, backscattered and transmission detectors was applied. The surface elemental mapping was performed on representative microsurfaces (1 mm2) with a Si(Li) X-ray detector (INCA Penta FET, 30 mm2 crystal size) Oxford Instrument UK coupled to the SEM.
Determination of total specific surface area (BET) of freshly reduced catalysts was carried out via N2 physisorption at 77 K. The isotherms were recorded with a Belsorp Mini II and calculated using BET method with the fitting range between 0.05 and 0.30 P/P0.
The crystalline structure of calcined, reduced and spent catalysts was analyzed by X-ray diffraction. The measurements were performed on X’Pert PRO MPD instrument (PANanalytical GmbH) endowed with a copper anode (Cu Kα 1.54060 Angstrom). The double Bragg angle range was set from 5° to 120° over 1 h and a step size of 0.017°. The data analysis was performed with the software X’PertHighscore Plus. The average crystallite size was estimated through Scherrer equation (already implemented in X’PertHighscore Plus) after the correction of the instrumental line broadening and the subtraction of the contribution of the support signal.
The carbon content of the spent catalysts was analyzed by elemental analysis. The measurements were performed on True Spec Macro, LECO Europe, Software version 2.53 (22 December 2010) Corporation Copyright® 2001–2010.
Finally, the acidity of the catalysts was analyzed via ammonia temperature programed desorption (NH3-TPD) performed at Ruhr University Bochum. The measurements were conducted in a BELCAT II (fully automated TPD set up, BEL Japan), coupled with online QMS detector (GAM 400 quadrupole mass spectrometer, Balzers, Germany). In total, 100 mg of the sample was pretreated by flushing Helium (NmL/min) for 30 min at 40 °C and for 30 min with 3.5% H2/Ar (50 NmL/min) at 40 °C. The sample was then heated to 250 °C at a rate of 5 K·min−1 and reduced for 120 min at this temperature. Following, the sample was flushed with He (50 NmL·min−1) at 250 °C for 30 min and cooled down to 100 °C. The NH3 adsorption was conducted at 100 °C using a mixture of 10% NH3/He for 60 min. The residual NH3 adsorbed in internal piping was removed by flushing the system for 60 min with 50 NmL·min−1 of He. The measurement was then performed, heating the sample from 100 °C to 600 °C at a rate of 5 K·min−1 in He (30 Nml·min−1) and the desorbed compounds were detected by the online QMS detector.

3. Results and Discussion

In order to evaluate the impact of Nb2O5 as a support and of Fe as a promoter, four different catalyst compositions were tested: Pd/SiO2, Pd/Nb2O5, Pd/1%Fe/Nb2O5 and Pd/8%Fe/Nb2O5. Furthermore, a blank test (a HDO experiment in the absence of a catalyst) was also conducted. The upgrading of the light phase of beech wood pyrolysis oil was performed at 250 °C for 2 h, including the heating ramp of 3.33 °C·min−1 and with an initial H2 pressure of 8 MPa. The performance of catalysts was evaluated in terms of H2 consumption, gas generation during the HDO, yield of upgraded products and properties of upgraded products such as carbon, hydrogen and oxygen content, water content and chemical composition.

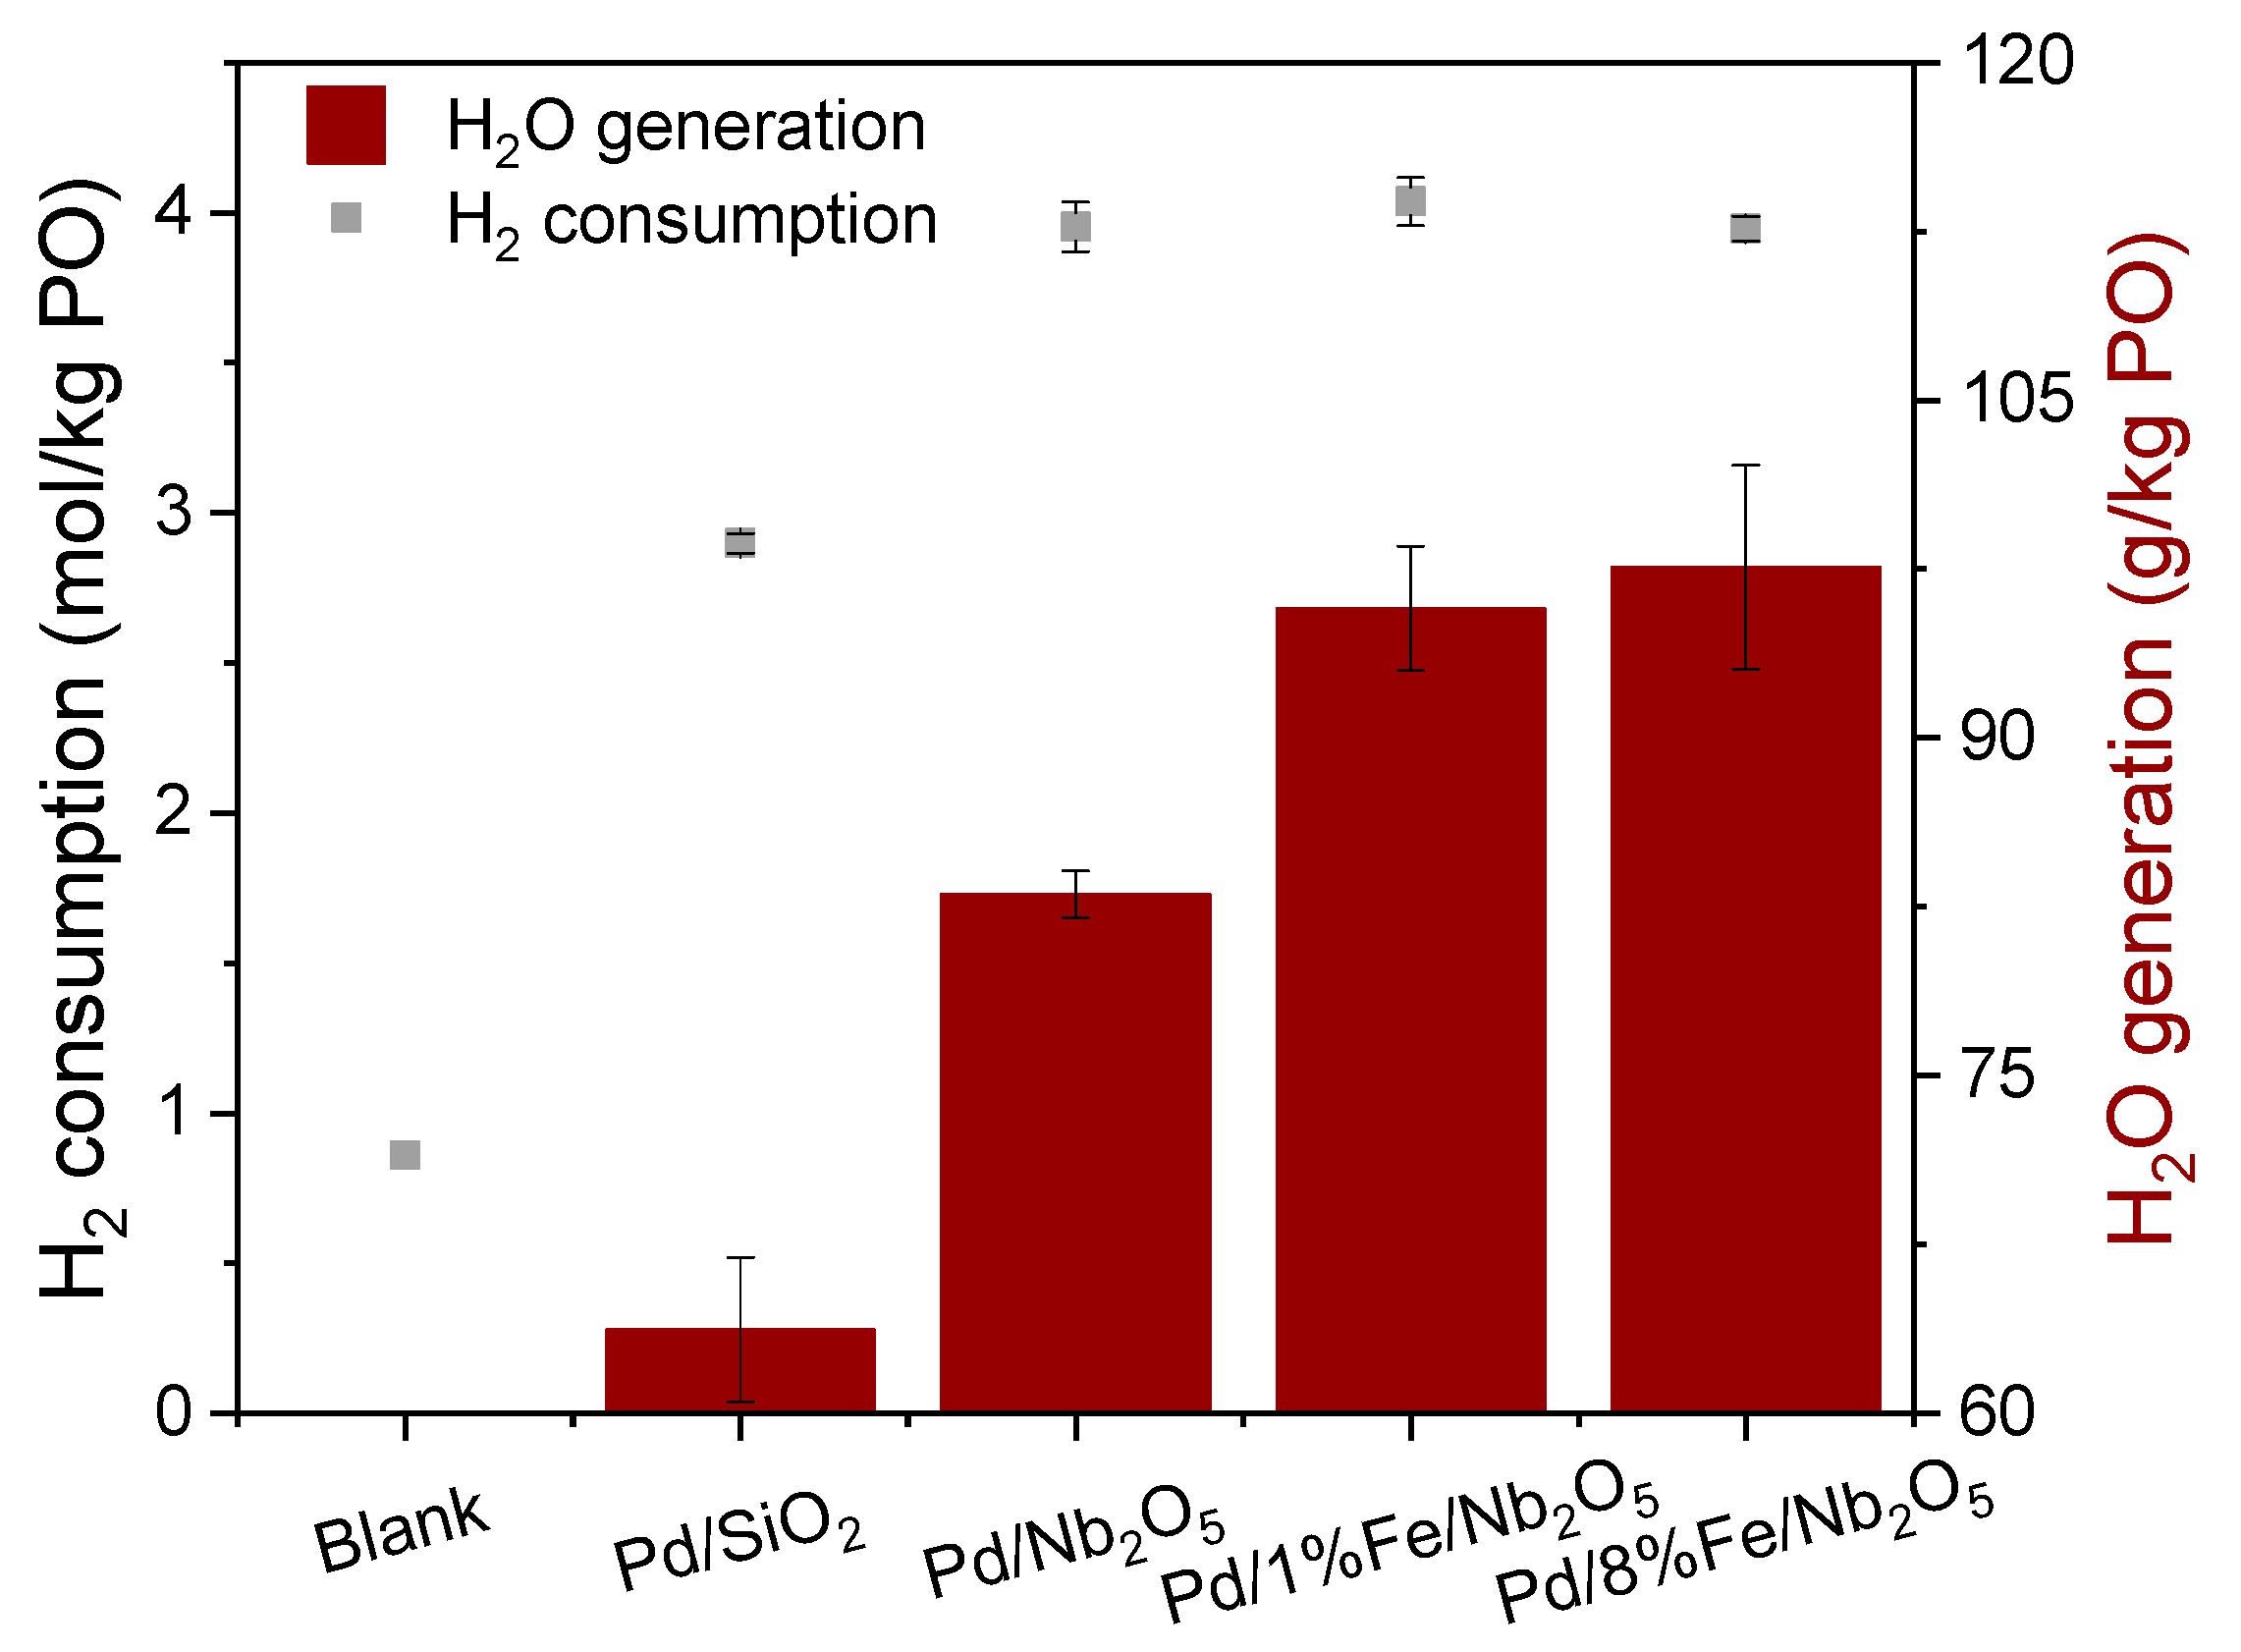
3.1. Hydrogen Consumption and Water Formation

An important performance indicator of a catalyst is the H2 uptake during HDO, as it is correlated to the activity towards hydrogenation and hydrogenolysis. In Figure 2, the hydrogen consumption and the water production during the bio-oil HDO are shown for the different catalysts investigated in this work. As expected, the HDO in the absence of a catalyst (blank) had the lowest hydrogen consumption. Interestingly, by changing the support from SiO2 to Nb2O5, the hydrogen uptake increased significantly (around 30%) and the water production was also enhanced from 64.0 to 82.9–97.9 g/kg P.O. This shows the positive effect of the support Nb2O5 in speeding up both hydrogenolysis and hydrogenation.
Robinson et al. [30] highlighted the role of acid solid supports on activating C-O bonds and catalyzing dehydration reactions. More specifically, the ability of NbOX species on C=O activation, C-O cleavage and dehydration has been reported in several catalytic systems, such as Pd/Nb2O5/SiO2, Ortho-Nb2O5, Pt/Nb2O5 and others [41,43,49,50,51].
Iron addition to Pd/Nb2O5 catalysts further increased the hydrogenolysis extension during the upgrading, as the highest water production (97.9 g/kg of feedstock) occurs for Pd/8%Fe/Nb2O5. The oxophilic sites from Fe are able to catalyze dehydration; hence, the Fe addition has reportedly increased Pd deoxygenation activity [30].

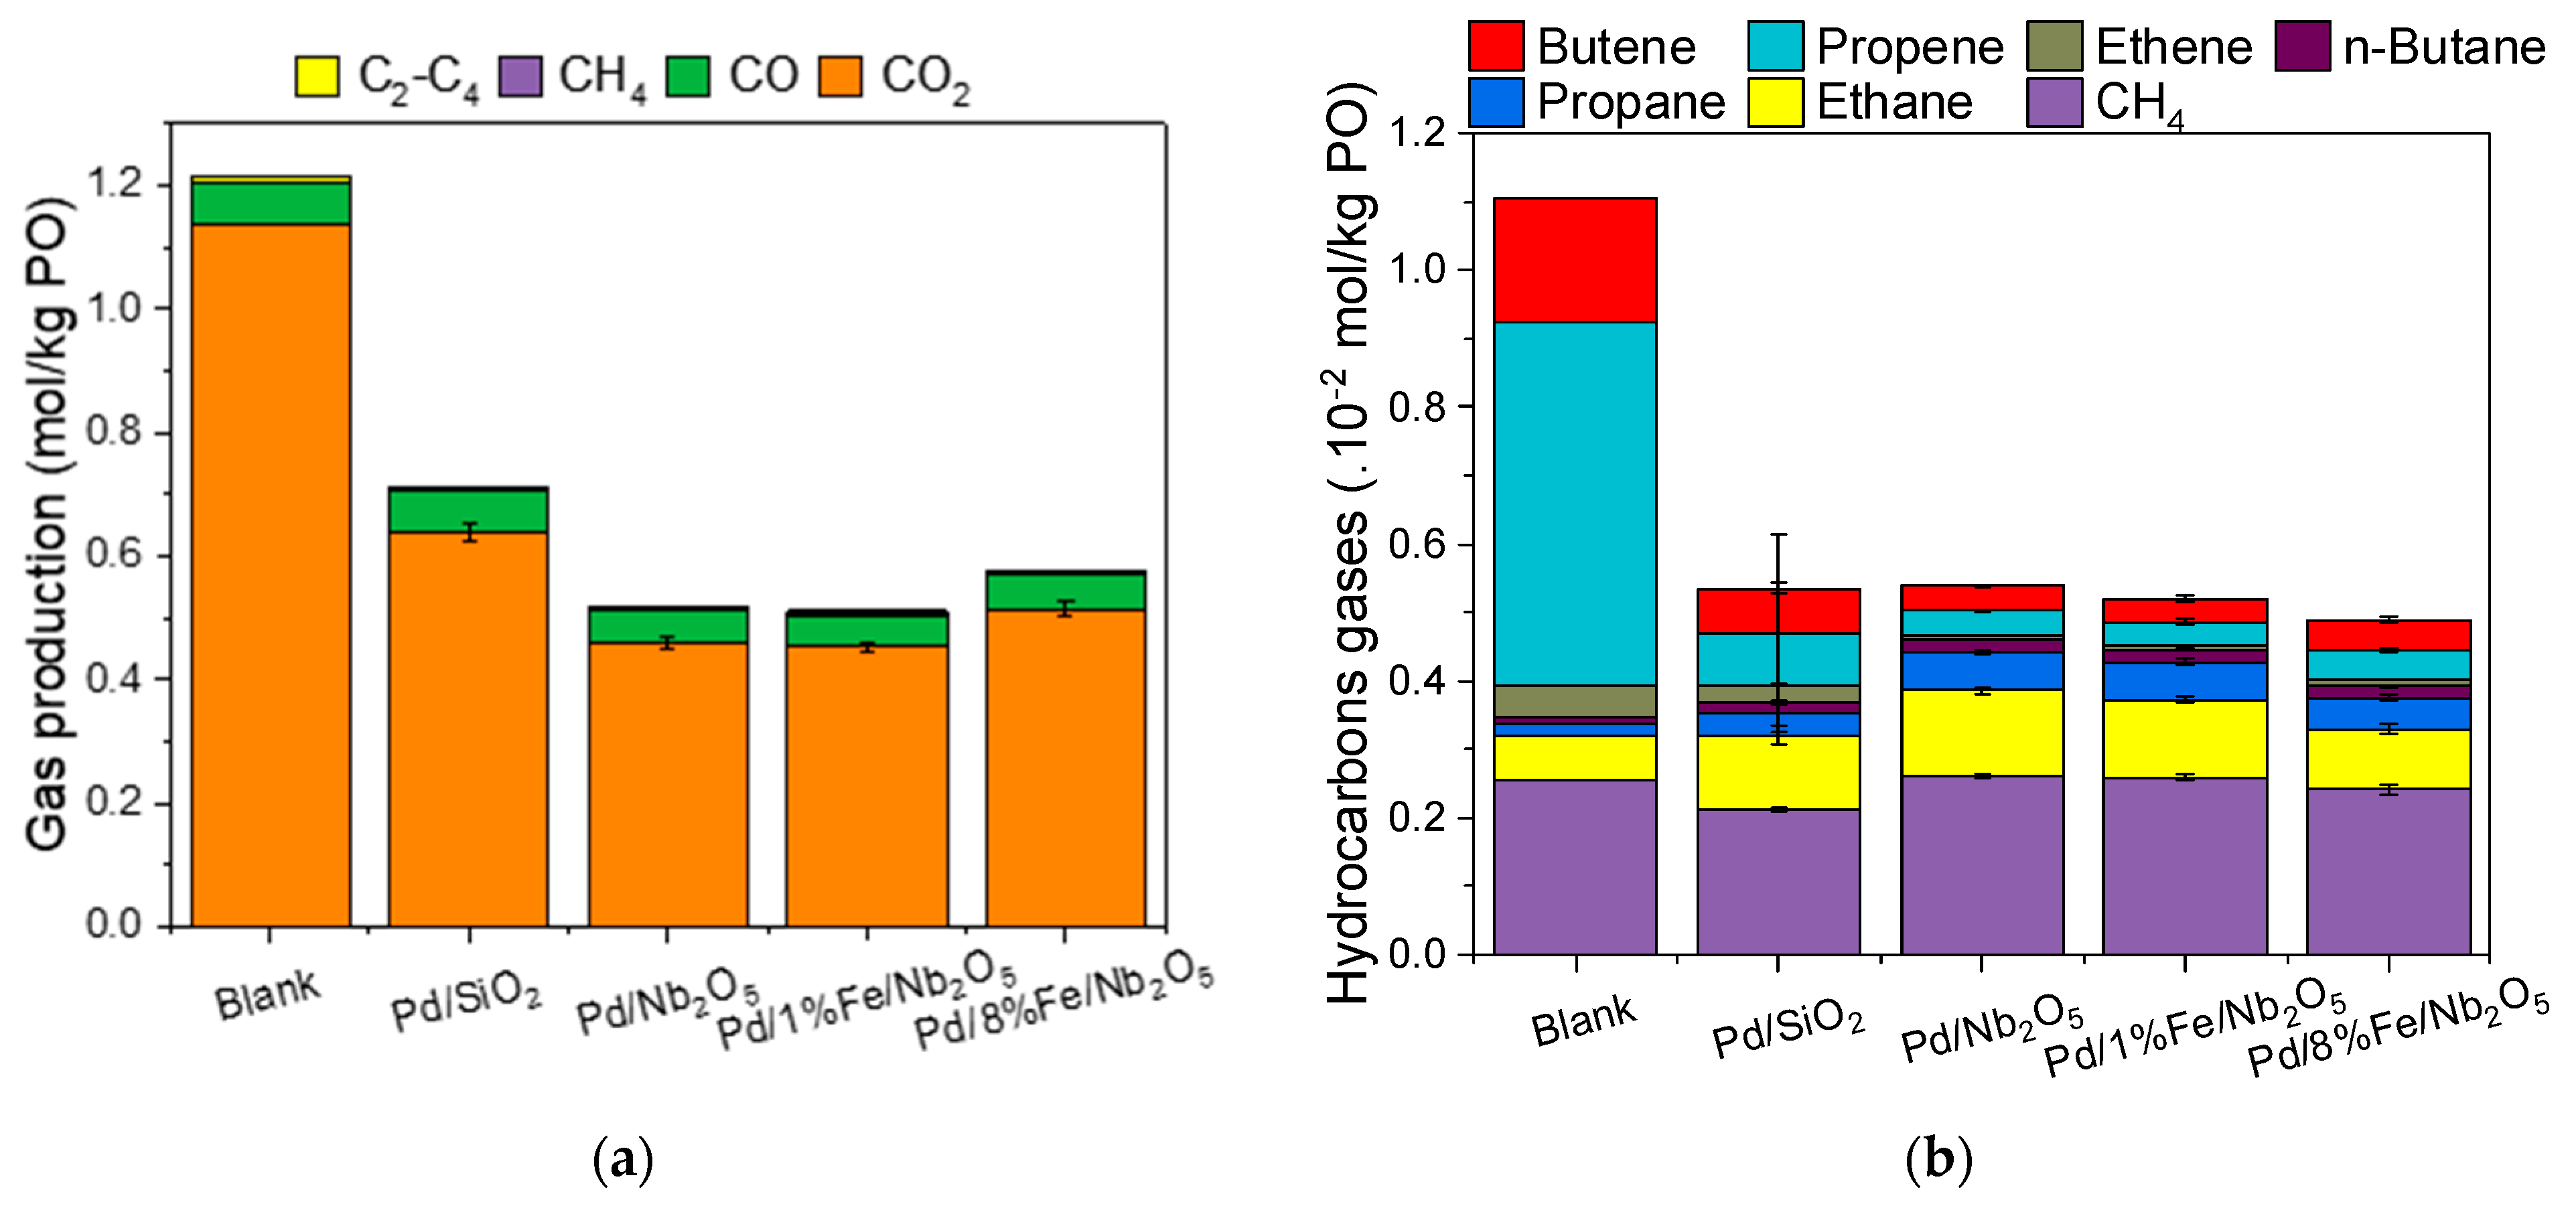
3.2. Characterization of Gas Phase Produced during HDO

The compositions of the gas production during HDO over the different tested catalysts are displaced in Figure 3. The highest gas production occurred in the blank test. By changing the support from SiO2 to Nb2O5, the gas production decreased significantly (around 25%). Finally, the gas production is slightly increased when adding iron to the Pd/Nb2O5 system. In a similar way, Teles et al. [43] also reported a smaller generation of CO2 and CO during the HDO with Pd/Nb2O5 than with Pd/SiO2 in the upgrading of pyrolysis oil in the vapor phase.
The main gas products of the HDO were CO2 and CO. While CO2 is probably formed by decarboxylation, CO is possibly a result of decarbonylation reactions [52]. It should be mentioned here that the water–gas shift reaction also plays a role in determining the concentrations of CO and CO2 [53]. Although CO and CO2 production contributes to the oxygen removal, it is less advantageous than hydrogenolysis, as in the first case there is also carbon removal, consequently decreasing the carbon recovery in the upgraded oil (see discussion in Section 3.4). In fact, the absence of an active catalyst led to the highest tendency towards cracking, with a pronounced production of CO2.
Similarly, as reported by Miguel de Mercader et al. [54], a correlation between hydrogenation, polymerization and CO2 generation was observed in this work. That is, the more hydrogenation, the less polymerization and CO2 formation, and vice versa. As pointed out by Miguel de Mercader et al. [16,54], there is a visible relation between CO2 formation and the increase in molecular weight. However, it is not clear if decarboxylation and polymerization are a consequence of one type of reaction or if they are independent results of various decoupled reactions. If the first case is considered, one hypothesis would be that the high viscosity of polymerized samples restricts the contact of H2 and the molecule to be upgraded on the catalyst surface. This way, instead of catalytic reactions such as hydrogenolysis and hydrogenation, decarboxylation takes places without the necessity of a catalyst. Additionally, related to that, the catalysts with a higher hydrogenation activity, such as the ones supported on Nb2O5, had a lower CO2 production associated with a lower viscosity. One explanation for the low viscosity and low polymerization in these cases could be the deactivation of unstable and reactive compounds such as aldehydes and unsaturated compounds by hydrogenation. Thus, preventing the increase in viscosity that would lead to higher CO2 production.
When looking at the gaseous hydrocarbon production (Figure 3b), the absence of a catalyst led to a higher unsaturated gas production (i.e., ethene, propene, butene). Moreover, although the total gas amount remains approximately constant independent of the catalyst (except for the blank), unsaturated compounds (i.e., ethene, propene) have higher concentrations in the silica-supported catalyst, while saturated compounds have higher concentrations in the niobium-supported catalysts. This is an indication of the higher hydrogenation activity of the Nb2O5 support in comparison to SiO2.

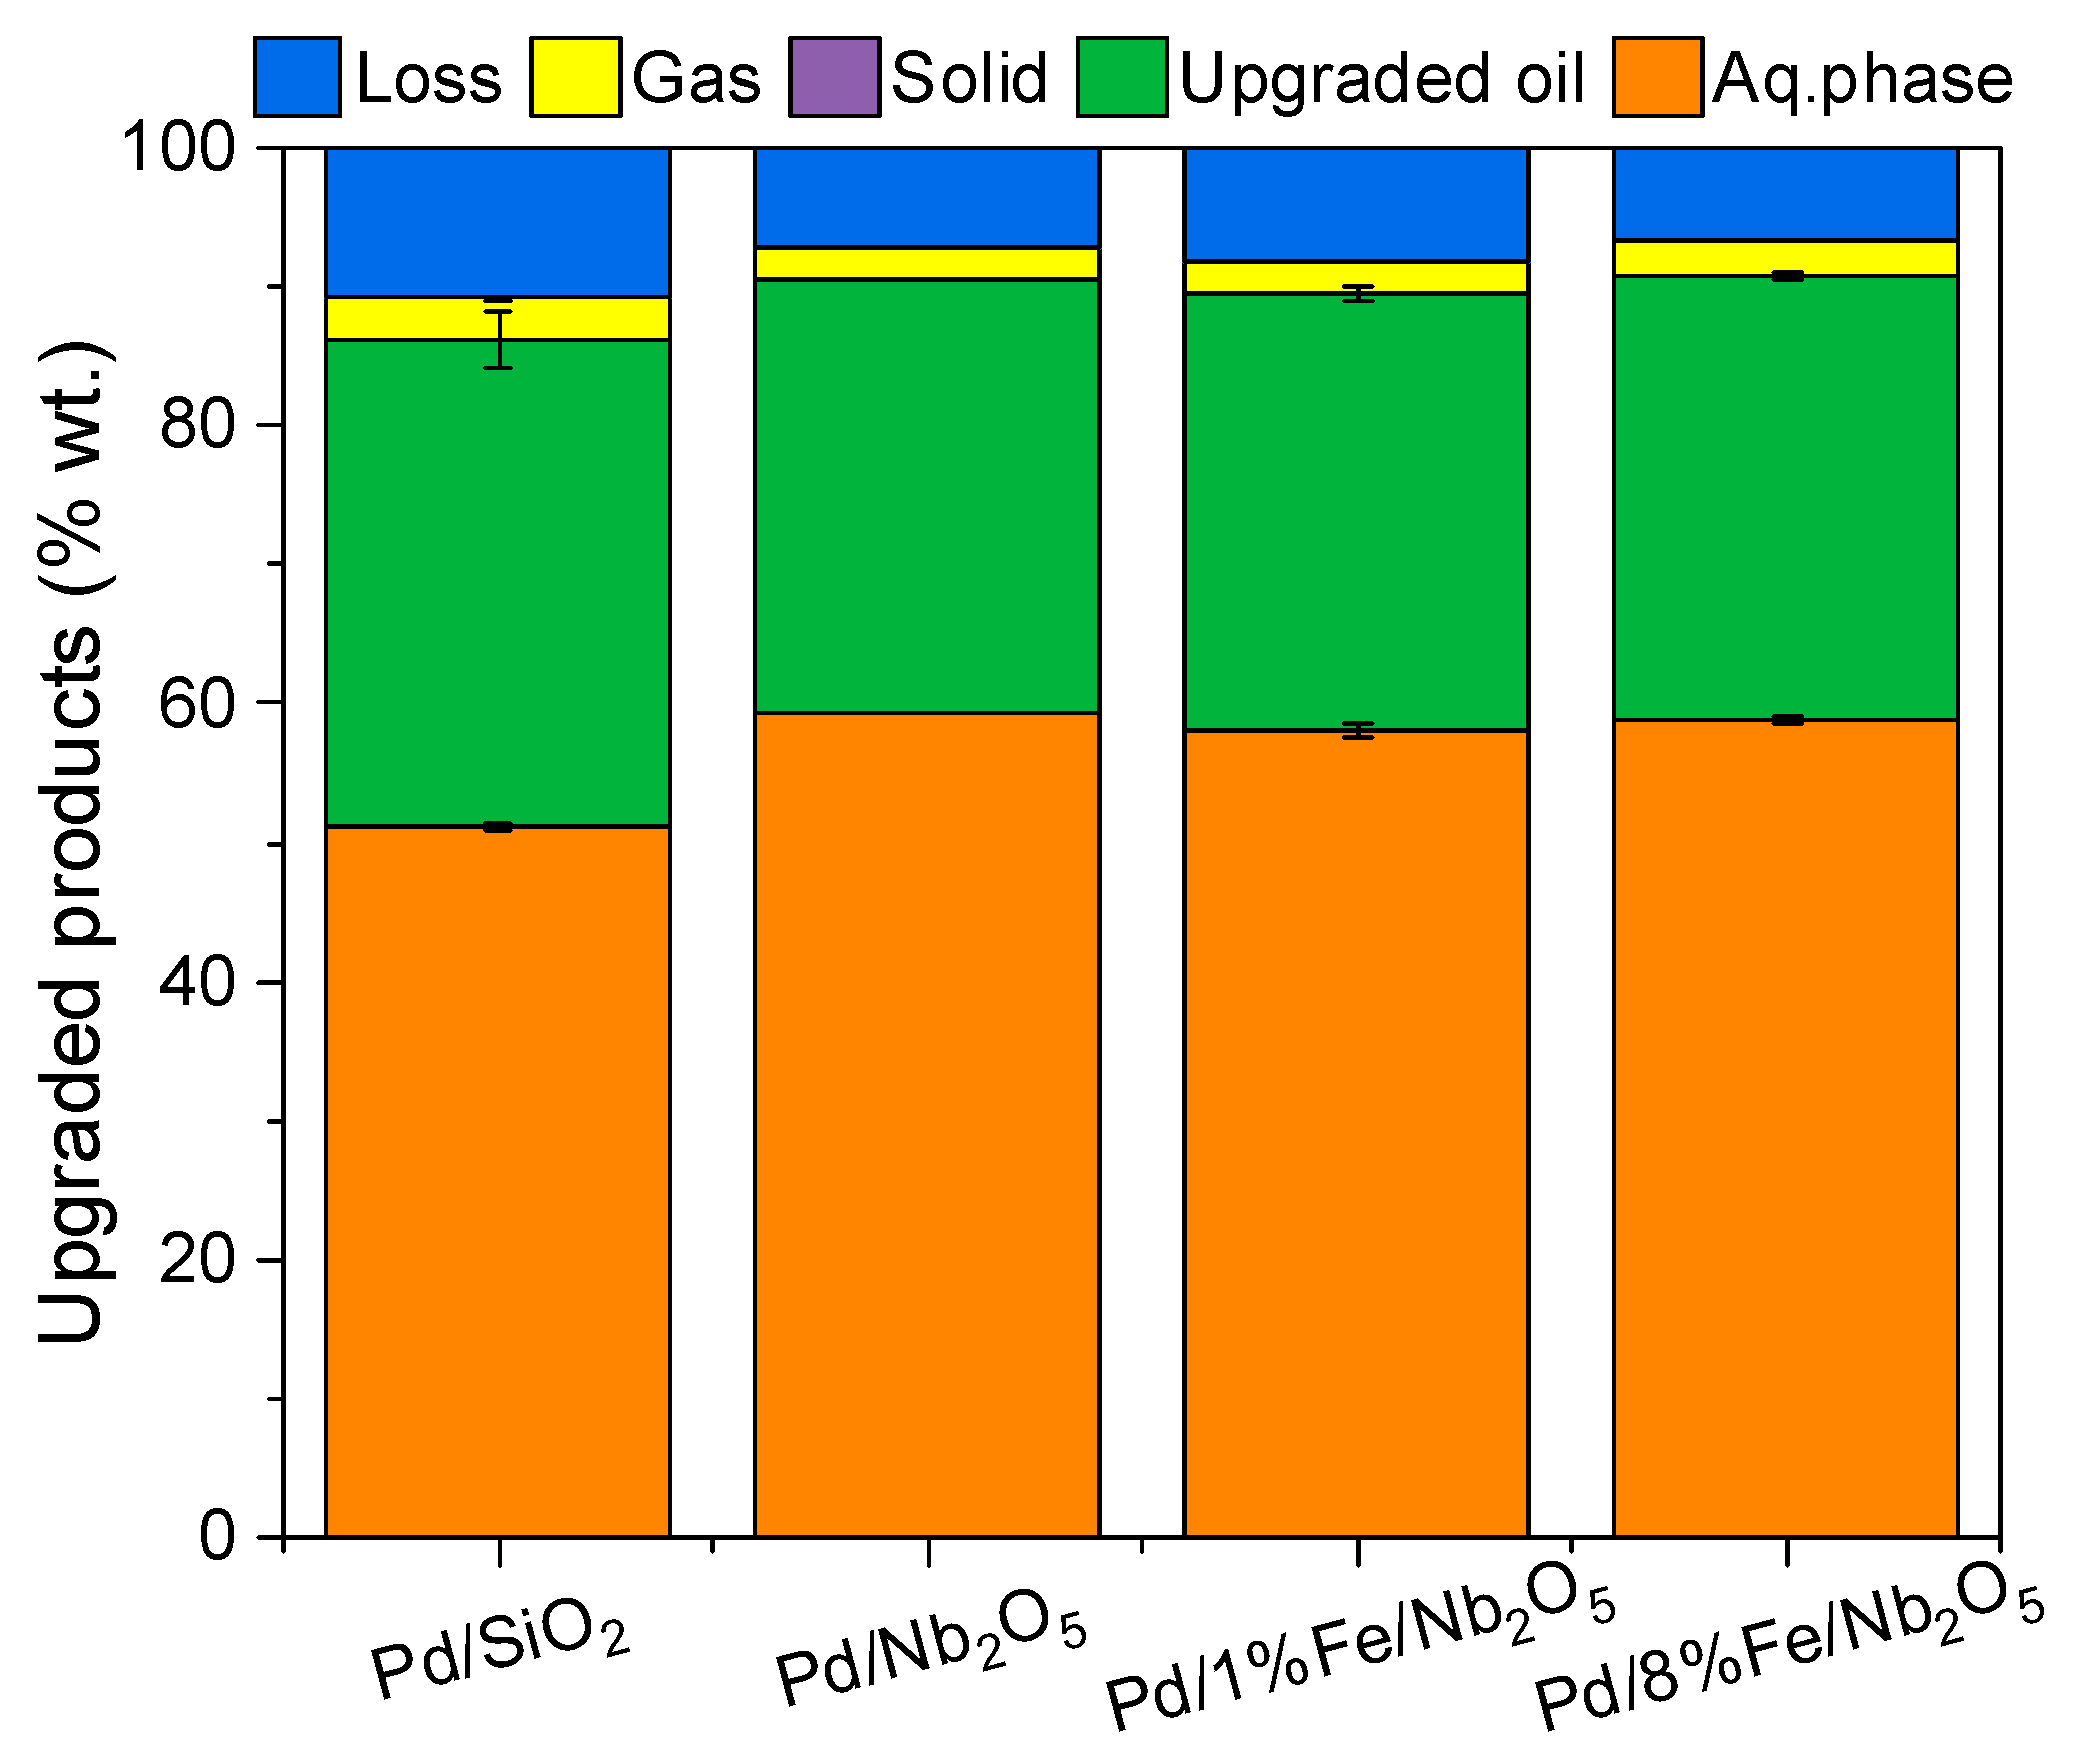
3.3. Product Distribution

Four phases were obtained after the hydrotreatment (Figure 4): an aqueous phase rich in water (51.1–59.3 wt.%); an upgraded oil rich in organic compounds (31.2–35.1 wt.%); a gas phase (2.1–3.0 wt.%) consisting of CO2, CO and C1–C4 hydrocarbons; and a solid phase (0.1 wt.%) composed of coke from polymerization reactions attached on the catalyst. The main losses were due to the oil adhered on the surface of the stirrer and reactor, and they varied according to upgraded oil viscosity and, therefore, with the catalyst composition, as shown in Figure 5. Although the viscosity was not directly measured, the differences depending on the catalyst composition were visible. The upgraded oil obtained on Pd/SiO2 had a higher viscosity than oils obtained over Nb2O5 catalysts. This higher viscosity is associated with a higher degree of polymerization, and explains the higher losses observed in the tests of this catalyst. Although Pd/SiO2 led to a slightly higher yield of upgraded oil, Nb2O5 catalysts considerably increased the aqueous phase yield, which is related to the higher water production (Section 3.1). Since the blank test resulted in a highly polymerized product (see Figure 4), it was not possible to recover and properly measure its product yields. The high polymerization extension in the absence of an active catalyst is in agreement with results reported by Boscagli et al. [52]. Some organic compounds in the bio-oil, such as sugars, alcohols, acids, phenols and aldehydes can easily undergo repolymerization and consequently charring in the absence of an active catalyst [27,54,55]. In contrast, in the presence of a catalyst, the hydrogenation stabilizes the bio-oil compounds by saturating olefinic groups (C=C) and transforming carbonyl groups (C=O) into alcohols [55].

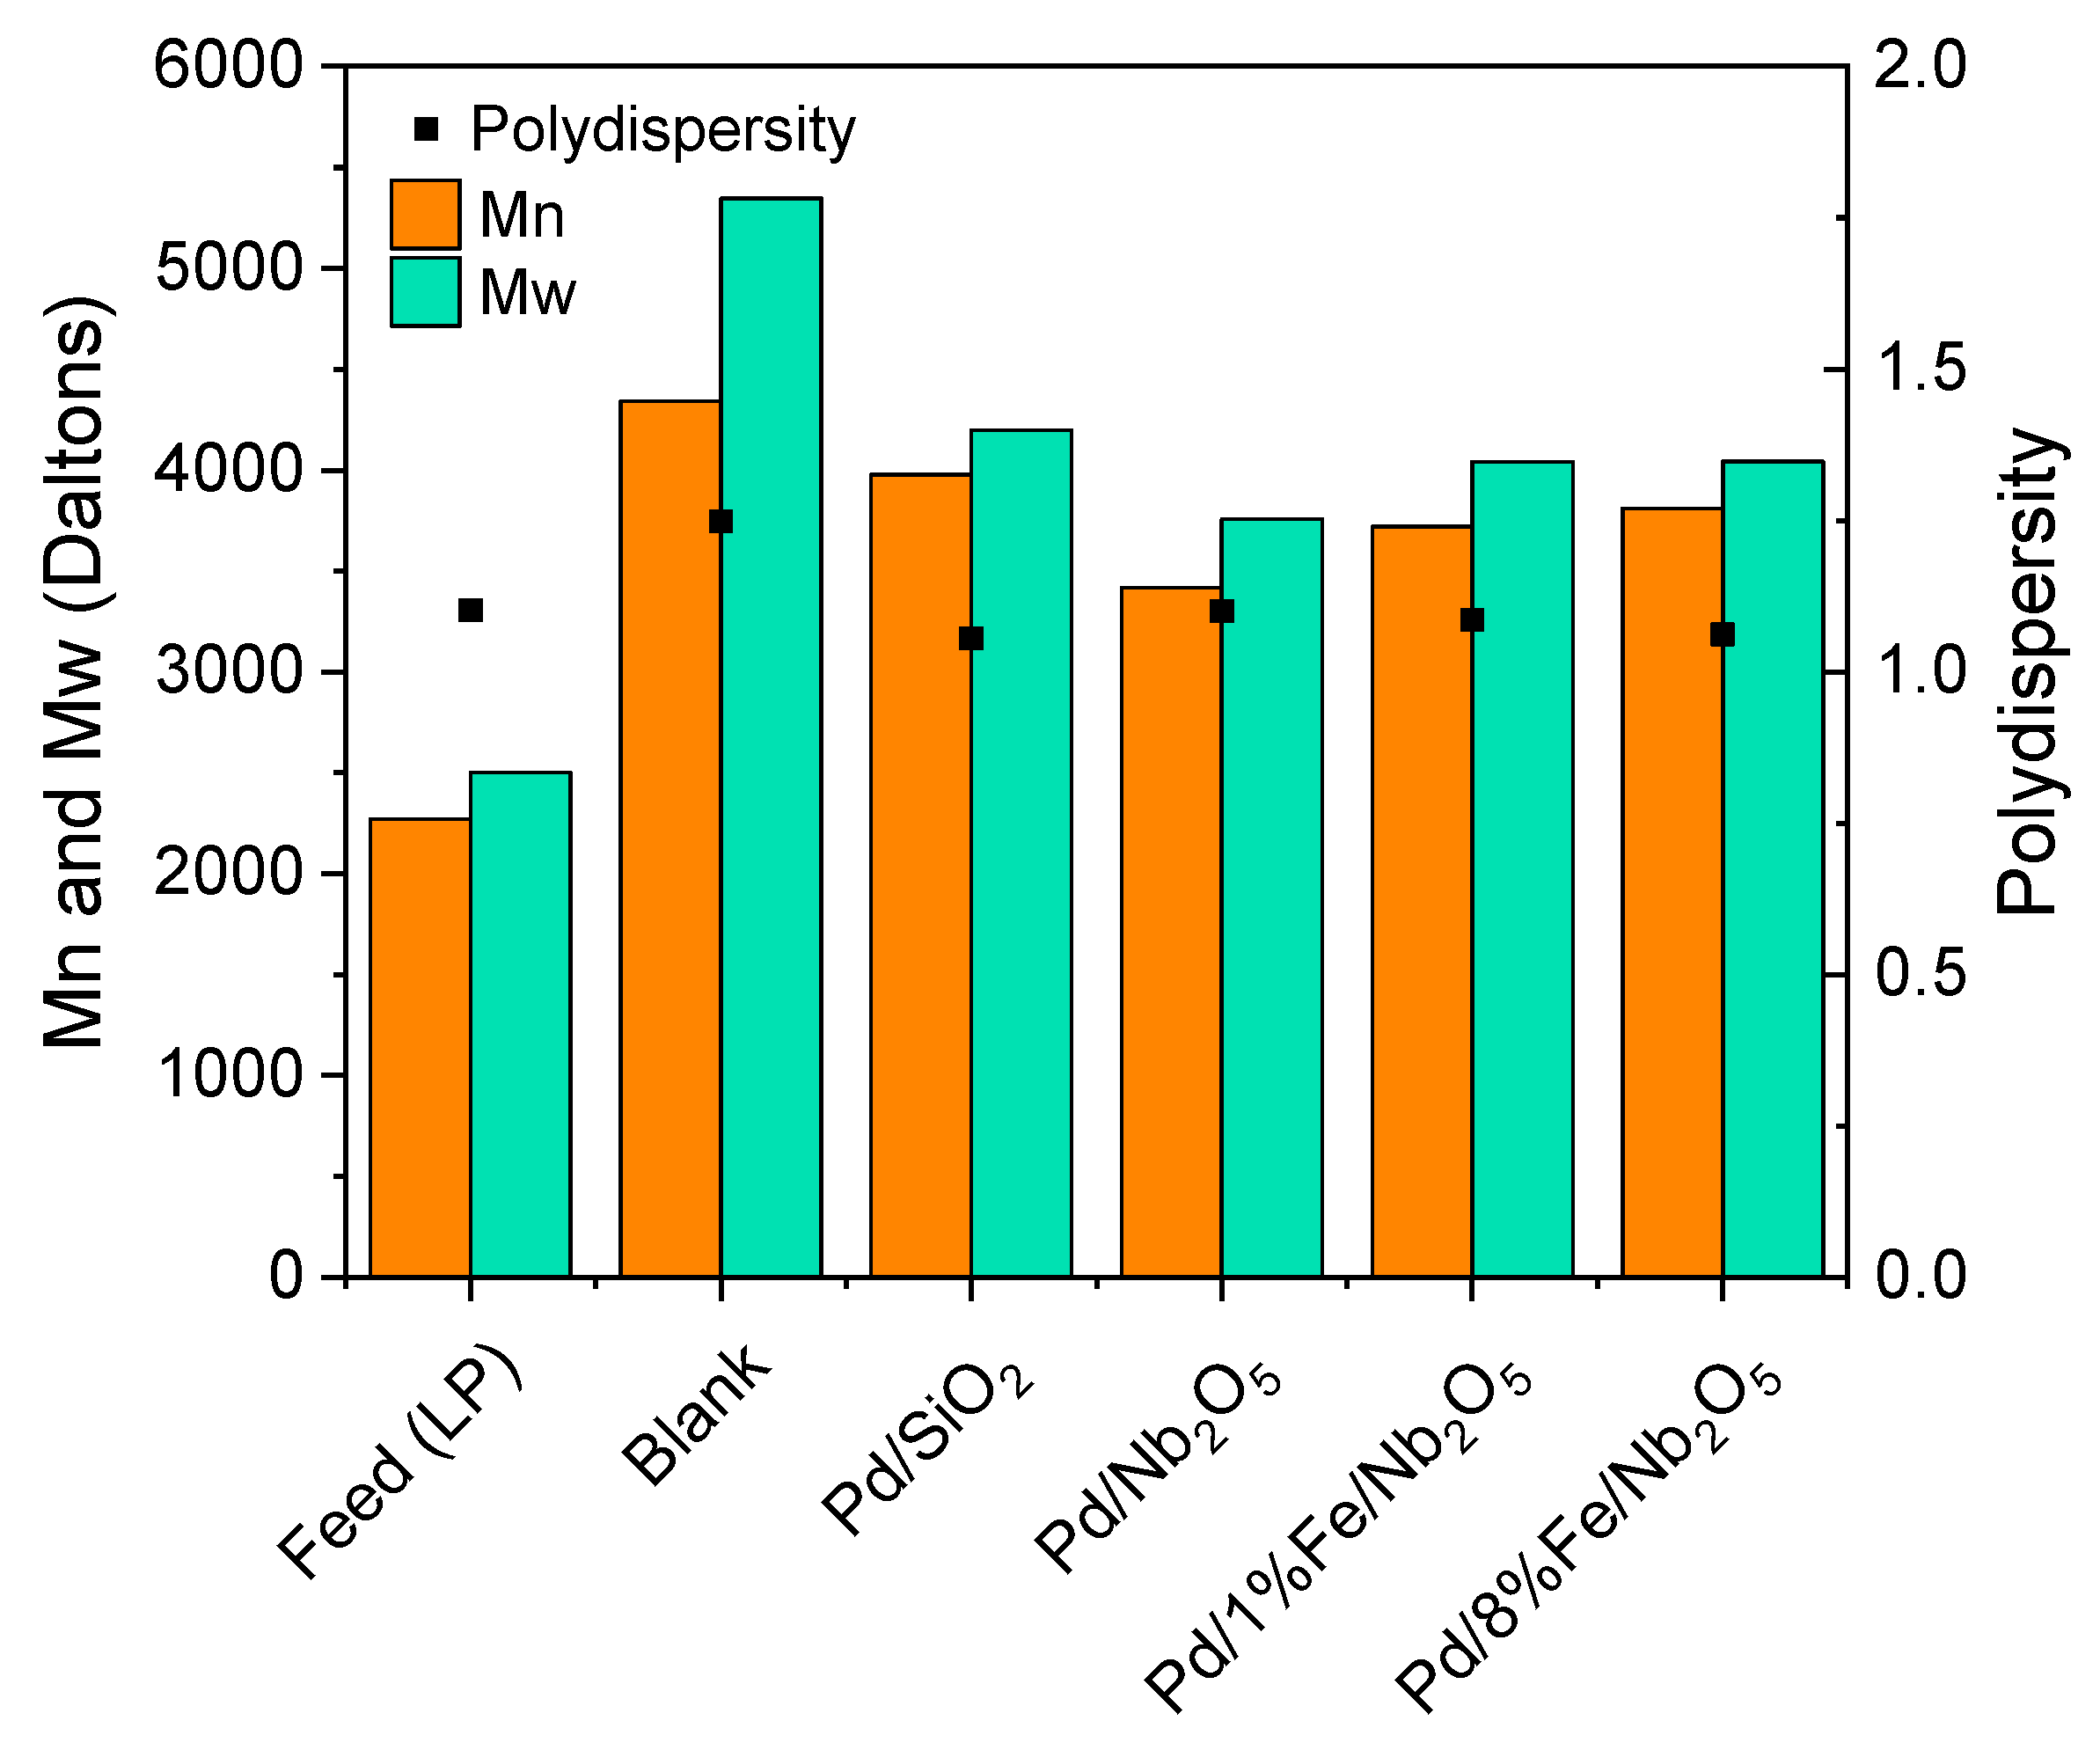
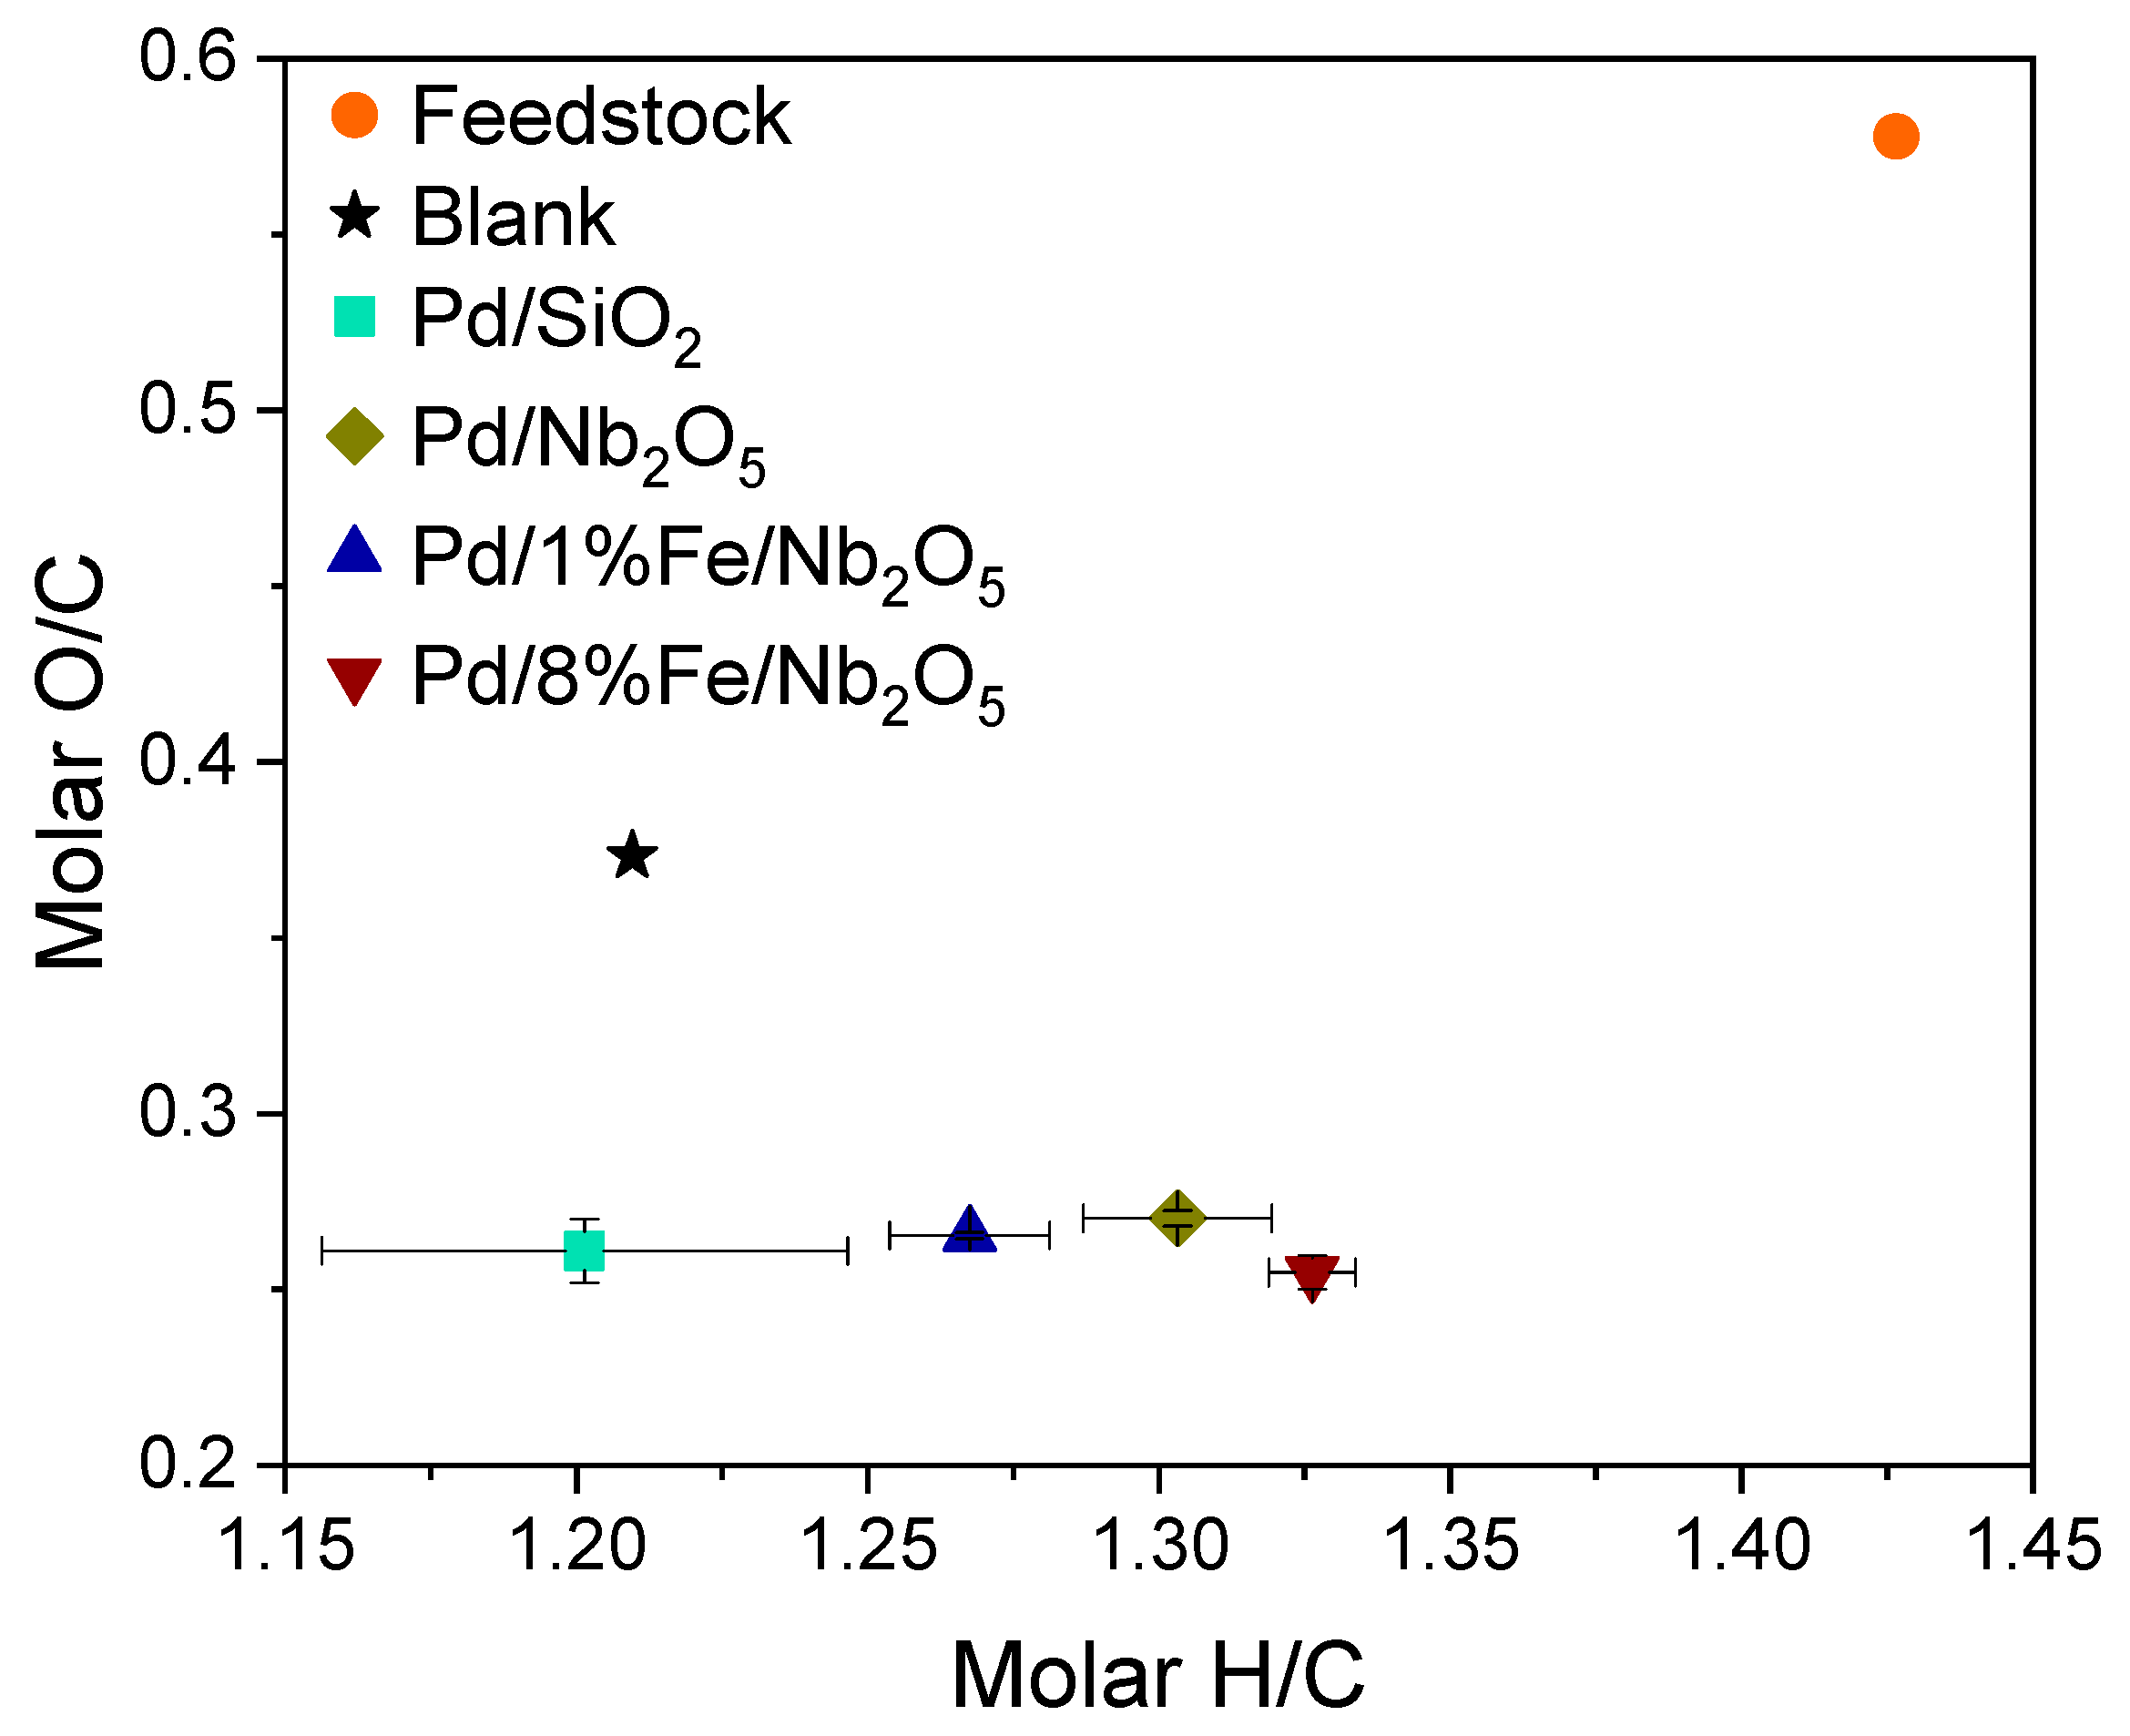
3.4. Product Characterization: Elemental Analysis, Water Content, High Heating Value and Molecular Weight

Elemental composition, water content and higher heating value (HHV) of the upgraded liquid phases and the feedstock are organized in Table 1. Average values of two or three replica are given. The upgraded oil obtained in the blank test was so strongly polymerized that it was not possible to measure its water content via Karl Fischer titration. Therefore, it was considered negligible.
In all cases, most of the carbon content from the feedstock was recovered in the upgraded oils, as intended, increasing the HHV. Consequently, the carbon content of the aqueous phases is significantly low. It is important to mention that the polarity of the phases has a significant impact on the partition of the compounds [54], thus on the concentration of C, H, N and O. The blank experiment resulted on the aqueous phase with the lowest carbon content. The organic compounds underwent repolymerization, forming long chains with low polarity, enhancing the separation and leading to the aqueous phase with the lowest carbon content. Nonetheless, the carbon content on the upgraded oil was negatively impacted due to the loss of carbon to the gas phase, especially in the form of CO2 (Figure 3).
In comparison with the feedstock, the carbon content over Pd/SiO2 increased by 95% (from 32.9 to 64.2 wt.% wb) in the upgraded oil and decreased 58% (From 32.9 to 13.9 wt.% wb) in the aqueous phase. Upgraded oils obtained over Nb-containing catalysts had up to 2 wt.% less C-content than the one obtained over SiO2-supported catalyst, while aqueous phases of Nb-containing catalysts had up to 1.4 wt.% more C-content. Finally, iron-promoted catalysts slightly increased the upgraded oil C-content and slightly decreased the aqueous phase C-content.
The hydrogen content of organic molecules (dry basis) of upgraded oils and aqueous phases increased in comparison to the feedstock. As expected, due to the absence of a catalyst in the blank test, the hydrogen content of its products was the smallest one, a result also reported by Boscagli et al. [52]. Nb2O5 led to a higher hydrogen content in upgraded products than SiO2, which is in agreement with the higher H2 uptake observed for the former (Figure 2). A higher hydrogen content implies a higher hydrogenation of double bonds, which has the beneficial effect of stabilizing the oils and, consequently, reducing the viscosity. As described by De Miguel Mercader [56], there is a competition between hydrogenation and polymerization reactions.
Thus, upgraded oils with a lower hydrogen content had a higher polymerization degree, while upgraded oils with a higher hydrogen content had a lower polymerization degree, and, therefore, lower viscosity.
Besides physical appearance, the viscosity of upgraded oils was also indirectly evaluated through molecular weight accessed by gel permeation chromatography. The obtained values are plotted in Figure 6 in terms of number average molecular weight (Mn) and weight average molecular weight (Mw), as well as polydispersity (p). An increase in the molecular weight was observed for all catalysts. Most likely, polymerization was triggered when heating up the oil. The highest polymerization degree was observed with the blank test, in agreement with the tar-like product, emphasizing the importance of catalytic reactions to control polymerization. In agreement with the already discussed beneficial impact of hydrogenation, Nb2O5-supported catalysts led to a lower average molecular weight than SiO2. As intended, the oxygen content on upgrading oils was significantly reduced during the catalytic hydrotreatment, with around 40% reduction (dry basis) in the upgraded oil, while the aqueous phase maintained the oxygen content of the feedstock. Three different mechanisms of deoxygenation of upgraded oils were observed: removal of oxygen as water (hydrogenolysis), as CO2/CO (decarboxylation/decarbonylation) and finally due to the partition of polar oxygenated organic compounds to the aqueous phase [16]. The latter was confirmed by observing the slight increase in oxygen content of aqueous phases in dry basis, that is, the oxygen on organic molecules.
The lowest oxygen content was seen in the liquid products obtained through the HDO with Pd/8%Fe/Nb2O5. As reported by Sun et al. [45] with Pd/C catalysts, the higher deoxygenation activity of iron promoted catalysts is related to the formation of a Pd-Fe alloy, which increased the adsorption strength of phenolic compounds on the Fe surface. As a consequence of the lowest oxygen content and the highest hydrogen content, the upgraded oil on the iron-promoted catalyst (Pd/8%Fe/Nb2O5) had the highest HHV (30.5 MJ/kg).
Differently from expected in view of the observed hydrogenolysis extension, Nb2O5 did not lead to a lower oxygen content than SiO2. The enhanced removal of oxygen via CO2/CO formation on SiO2 compensated the lower hydrogenolysis, surpassing the total deoxygenation on Nb2O5. However, as already mentioned, this happened at the expense of an undesirable increase in carbon removal, an increased viscosity and an increased molecular weight.
As already mentioned, due to hydrogenolysis, the total amount of water increased, but most of it was collected in the aqueous phase, resulting in an upgraded oil with a low water content. The upgraded oil with Pd/SiO2 had the lowest water content (7.0 wt.%), while its respective aqueous phase had the highest water content (71.4 wt.%). This suggests that its upgraded oil has the lowest polarity, due to its higher molecular weight, in agreement with the higher viscosity observed.
The upgraded oil properties are summarized in terms of dry basis H/C and O/C molar (Figure 7). For co-feeding with refinery streams, it is desirable for the H/C of upgraded oil to be close to the crude oil value of 1.5–2. The reduction in the H/C ratio of upgraded oils in comparison to the feedstock was rather due to a stronger carbon concentration, since the hydrogen content clearly increased during the upgrading (see Table 1).
The same trend observed for hydrogen content was also present for H/C. Nb-containing catalysts had a higher hydrogenation degree (1.26–1.35) than SiO2-containing catalysts, which was probably related to the Lewis acid sites on NbOx species, keeping the oxygenated compounds close to the noble metal active site. The higher hydrogenation of iron promotion at 8 wt.% may be related to the oxophilicity of Fe that led to the formation of strong metal–oxygen bonds with the organic compounds [30]. Possibly, the stronger adsorption of the oxygenated compound on the catalyst surface enabled a better hydrogenation on the noble metal. However, when added in a low amount (1 wt.%), Fe promotion had rather a negative influence on hydrogenation. A possible explanation is that the benefit of introducing such a small amount of iron to the catalyst activity was lower than the negative effect in the catalytic active area caused by the extra impregnation and calcination.
The O/C ratio drastically decreased from 0.58 on the feedstock to 0.25–0.27 on upgraded oils. A second upgrading under more intense conditions (higher temperature, for example) could be applied to further reduce the oxygen content, since for co-feeding with refinery streams, an O/C ratio lower than 0.05 is desirable. Although the O/C ratios achieved on different catalysts are pretty similar, a slightly enhanced deoxygenation due to iron promotion was observed. As already mentioned, iron is an oxophilic metal which forms a much stronger metal–oxygen bond than Pd, consequently favoring C-O scission [30,57,58].
Although the experiments design with bio-oil and its inherent complexity does not properly address the activity of each one of the species on the bifunctional catalysts (Pd, Fe and Nb2O5), some insights can be withdrawn from theoretical studies reported in the literature such as metal–oxygen bond strengths [30]. According to Robinson et al. [30], the hydrogenating sites such as Pd provides the hydrogen. In turn, the oxygenated compounds have a preferential adsorption and activation on the oxophilic sites (in our case Fe and Nb2O5), which leads to an easier C-O scission. This was confirmed in this study in the higher water formation in the presence of Fe or Nb2O5.
A DFT study conducted by Sun et al. [45] with PdFe catalyst on activated carbon also endorsed the preferential adsorption and activation of the oxygenated compounds on Fe sites.

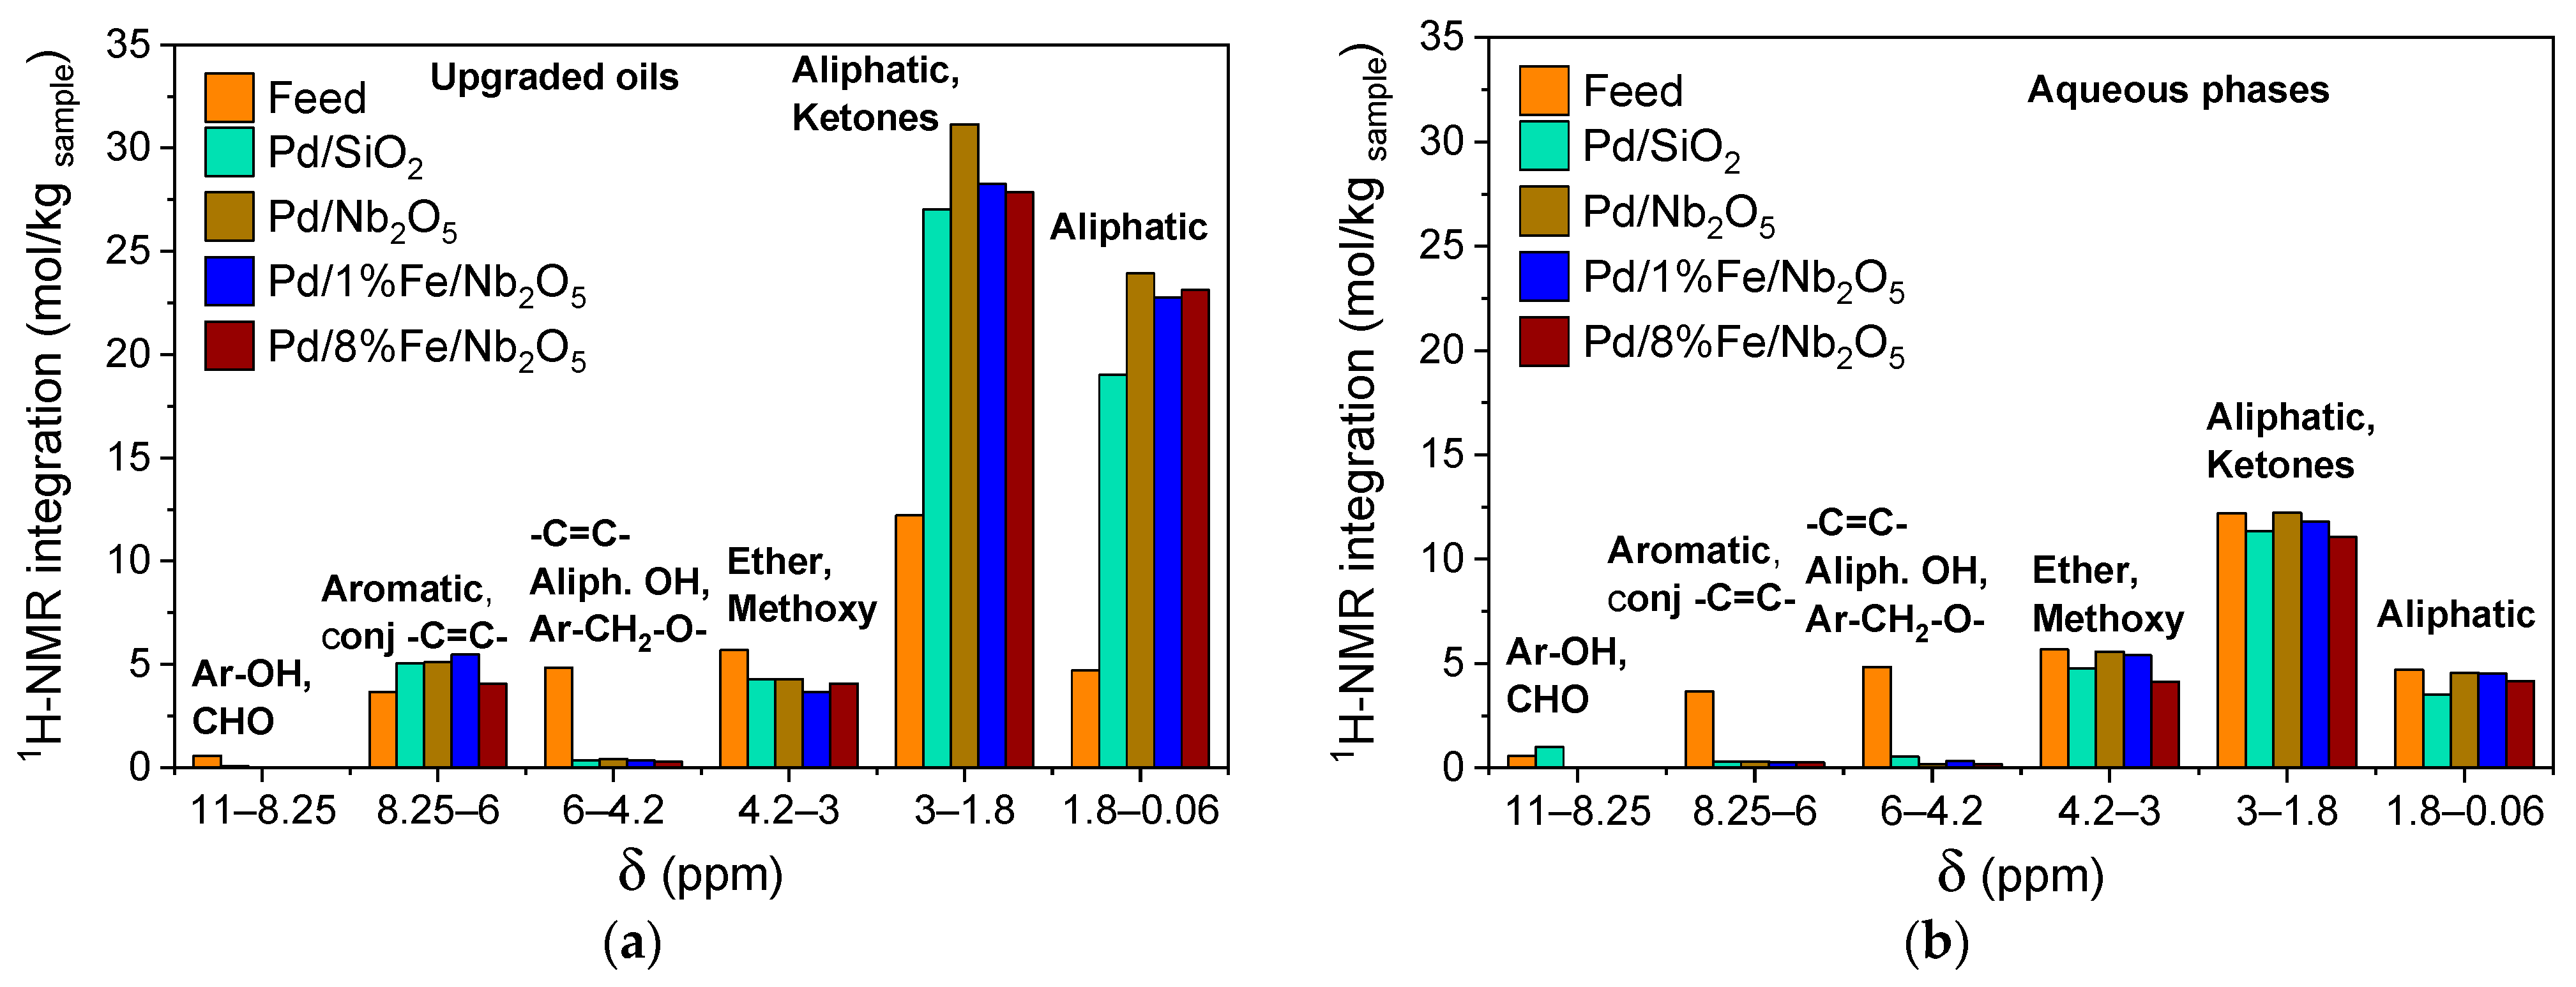
3.5. Product Characterization: Functional Groups via 1H-NMR and Chemical Composition via GC-MS/FID

Further characterization of the upgraded oils and aqueous phases by 1H-NMR and GC-MS/FID were performed in order to understand better the reaction pathways on each catalyst. The functional groups present in the feedstock and upgraded products were characterized via proton magnetic resonance spectroscopy. Due to the complex composition of bio-oil and, consequently, of upgraded products, the obtained spectra presented many overlapping peaks and had to be analyzed through integration ranges for specific functional groups. In this work, the integration ranges were adapted from Joseph et al. [48] and are summarized in Table 2. The quantification of functional groups is based on an added internal standard (Trimethylsilylpropanoic acid, TMSP).
Although carboxylic acids (12.5–11.0 ppm), aldehydes and hydroxyl groups in aromatic rings (11.0–8.25 ppm) are present on pyrolytic oils, these compounds are not consistently detected by proton magnetic resonance, due to proton exchange phenomena and reactivity with OH–groups. Considering the time frame requested to perform the technique, there is an exchange of protons between these groups and water molecules, either water from the oil or dissolved in the deuterated solvent [59].
In Figure 8, the 1H-NMR integration at different ranges is shown for the feedstock, the upgraded oils (Figure 8a) and the aqueous phases (Figure 8b). The main groups of protons of the feedstock as well as of upgraded products were located at the shifts 3–1.8 ppm and 1.8–0.1 ppm, which is assigned to aliphatic protons and protons in the vicinity of ketone groups. While the feedstock and the aqueous phases of all tests had close concentrations of protons at 3.0–0.1 ppm, the upgraded oil from all catalysts had twice as many protons in the range of 3.0–1.8 ppm and more than four times the concentration of protons in the range of 1.8–0.1 ppm. This high increase in the aliphatic protons was a consequence of the hydrogenation of double bonds and deoxygenation, whose products were -CH2- or (C=O)-CH2, promoted by the tested catalysts.
Once again, the enhanced hydrogenation on Nb2O5-containing catalysts is confirmed, this time due to the significantly higher concentrations of aliphatic protons (1.8–0.1 ppm) than the observed on Pd/SiO2. A less pronounced increase was observed in the shift 3.0–1.8 ppm assigned to aliphatic protons and protons in the vicinity of ketones. It is important to highlight that the protons from propanoic acid and acetic acid, present in the feed, can also be found in this region.
In order to have a better analysis in the range of 4.8–3.0 ppm, the peak attributed to protons of water molecules was subtracted. However, although the number of protons integrated from the subtracted peak matched the water amount detected via Karl Fischer titration, this method is still subject to errors, due to the previously mentioned proton exchange effect. Still, it was possible to correlate the tendency observed in this case with the previously mentioned results: the smaller number of protons assigned to ether and methoxy groups (4.8–3.0 ppm) as well as to ketones (3.0–1.8 ppm) observed due to iron promotion (8 wt.%) was in agreement with the larger extension of deoxygenation on this catalyst.
A strong reduction was observed in the concentration of protons assigned to aliphatic hydroxyl groups, alkenes and aromatic esters (6.0–4.8 ppm). These functional groups were consumed due to hydrogenation, thus increasing the concentration of aliphatic protons.
Although there was a reduction in the total number of protons in the region assigned to aromatic groups and conjugated double bonds (8.25–6.0 ppm) (Figure S1), their concentration slightly increased in the upgraded oil, which is explained by the low polarity of these functional groups resulting in a much higher solubility to the organic phase. Furthermore, regarding the addition of Fe as a promoter, different behaviors were observed depending on its loading. In comparison to the Pd/Nb2O5 catalyst, 1 wt.% iron addition led to a slightly higher total number of protons from Ar-CH2-O-, normal double bonds and aliphatic alcohols (6.0–4.8 ppm) as well as from aromatics and conjugated double bonds (8.25–6.0 ppm) (Figure S1). This effect observed with 1% of iron was more visible on upgraded oil samples than on aqueous phase. In contrast, with the addition of 8 wt.%, Fe increased the hydrogenation of conjugated/not-conjugated double bonds and aromatic rings, decreasing the total number of protons in the ranges 8.25–6.0 ppm and 6.0–4.8 ppm, in comparison to other catalysts. Interestingly, both results matched the observations reported by Kim et al. (2015) [46]. In their catalytic system (Pd-Fe/OMC) applied for decomposition of phenethyl phenyl ether under hydrogen atmosphere, the highest selectivity towards aromatics was achieved in a critical Fe/Pd molar ratio of 0.7 (around 0.368 mass ratio). For either higher or lower Fe/Pd ratios, the selectivity towards aromatics decreased. Since the minimum Fe/Pd molar ratio (1 wt.% Fe and 1% wt.% Pd) evaluated in this study was already 1.95, it was possibly close to the critical concentration. Besides that, the Fe/Pd molar ratio of the catalyst Pd/8%Fe/Nb2O5 was more than 21 times the critical value proposed by Kim et al. [46].

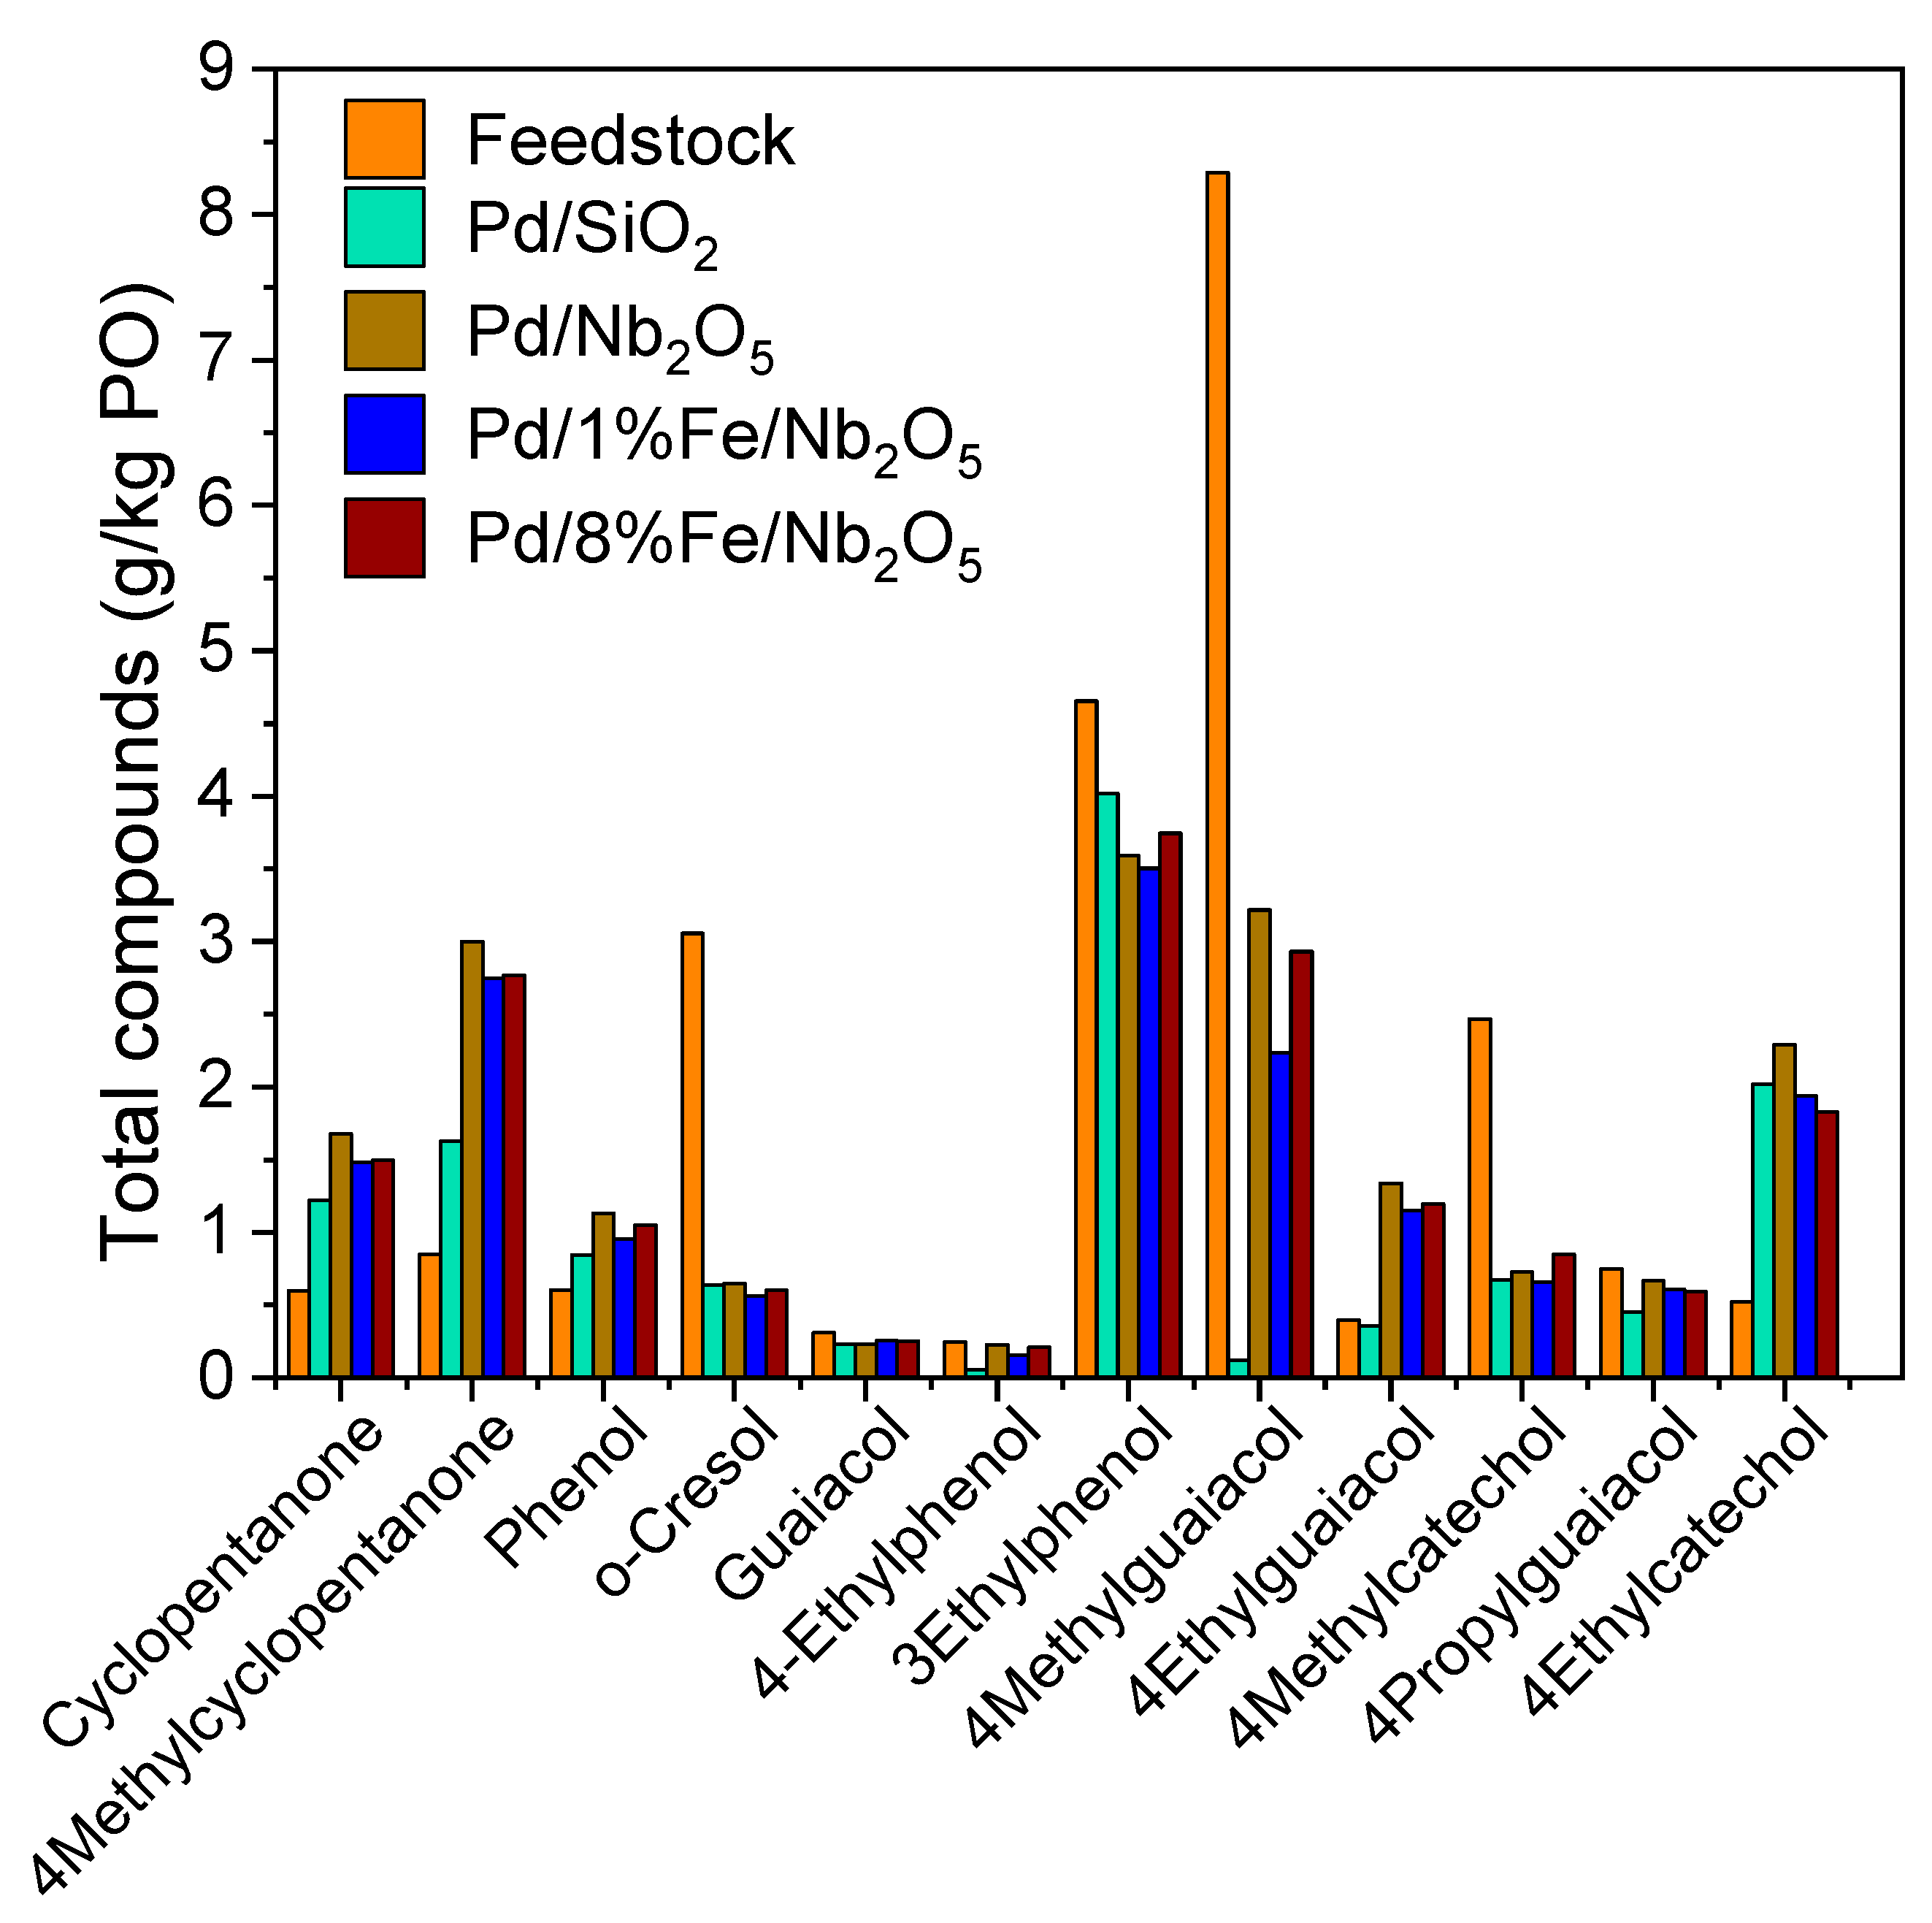
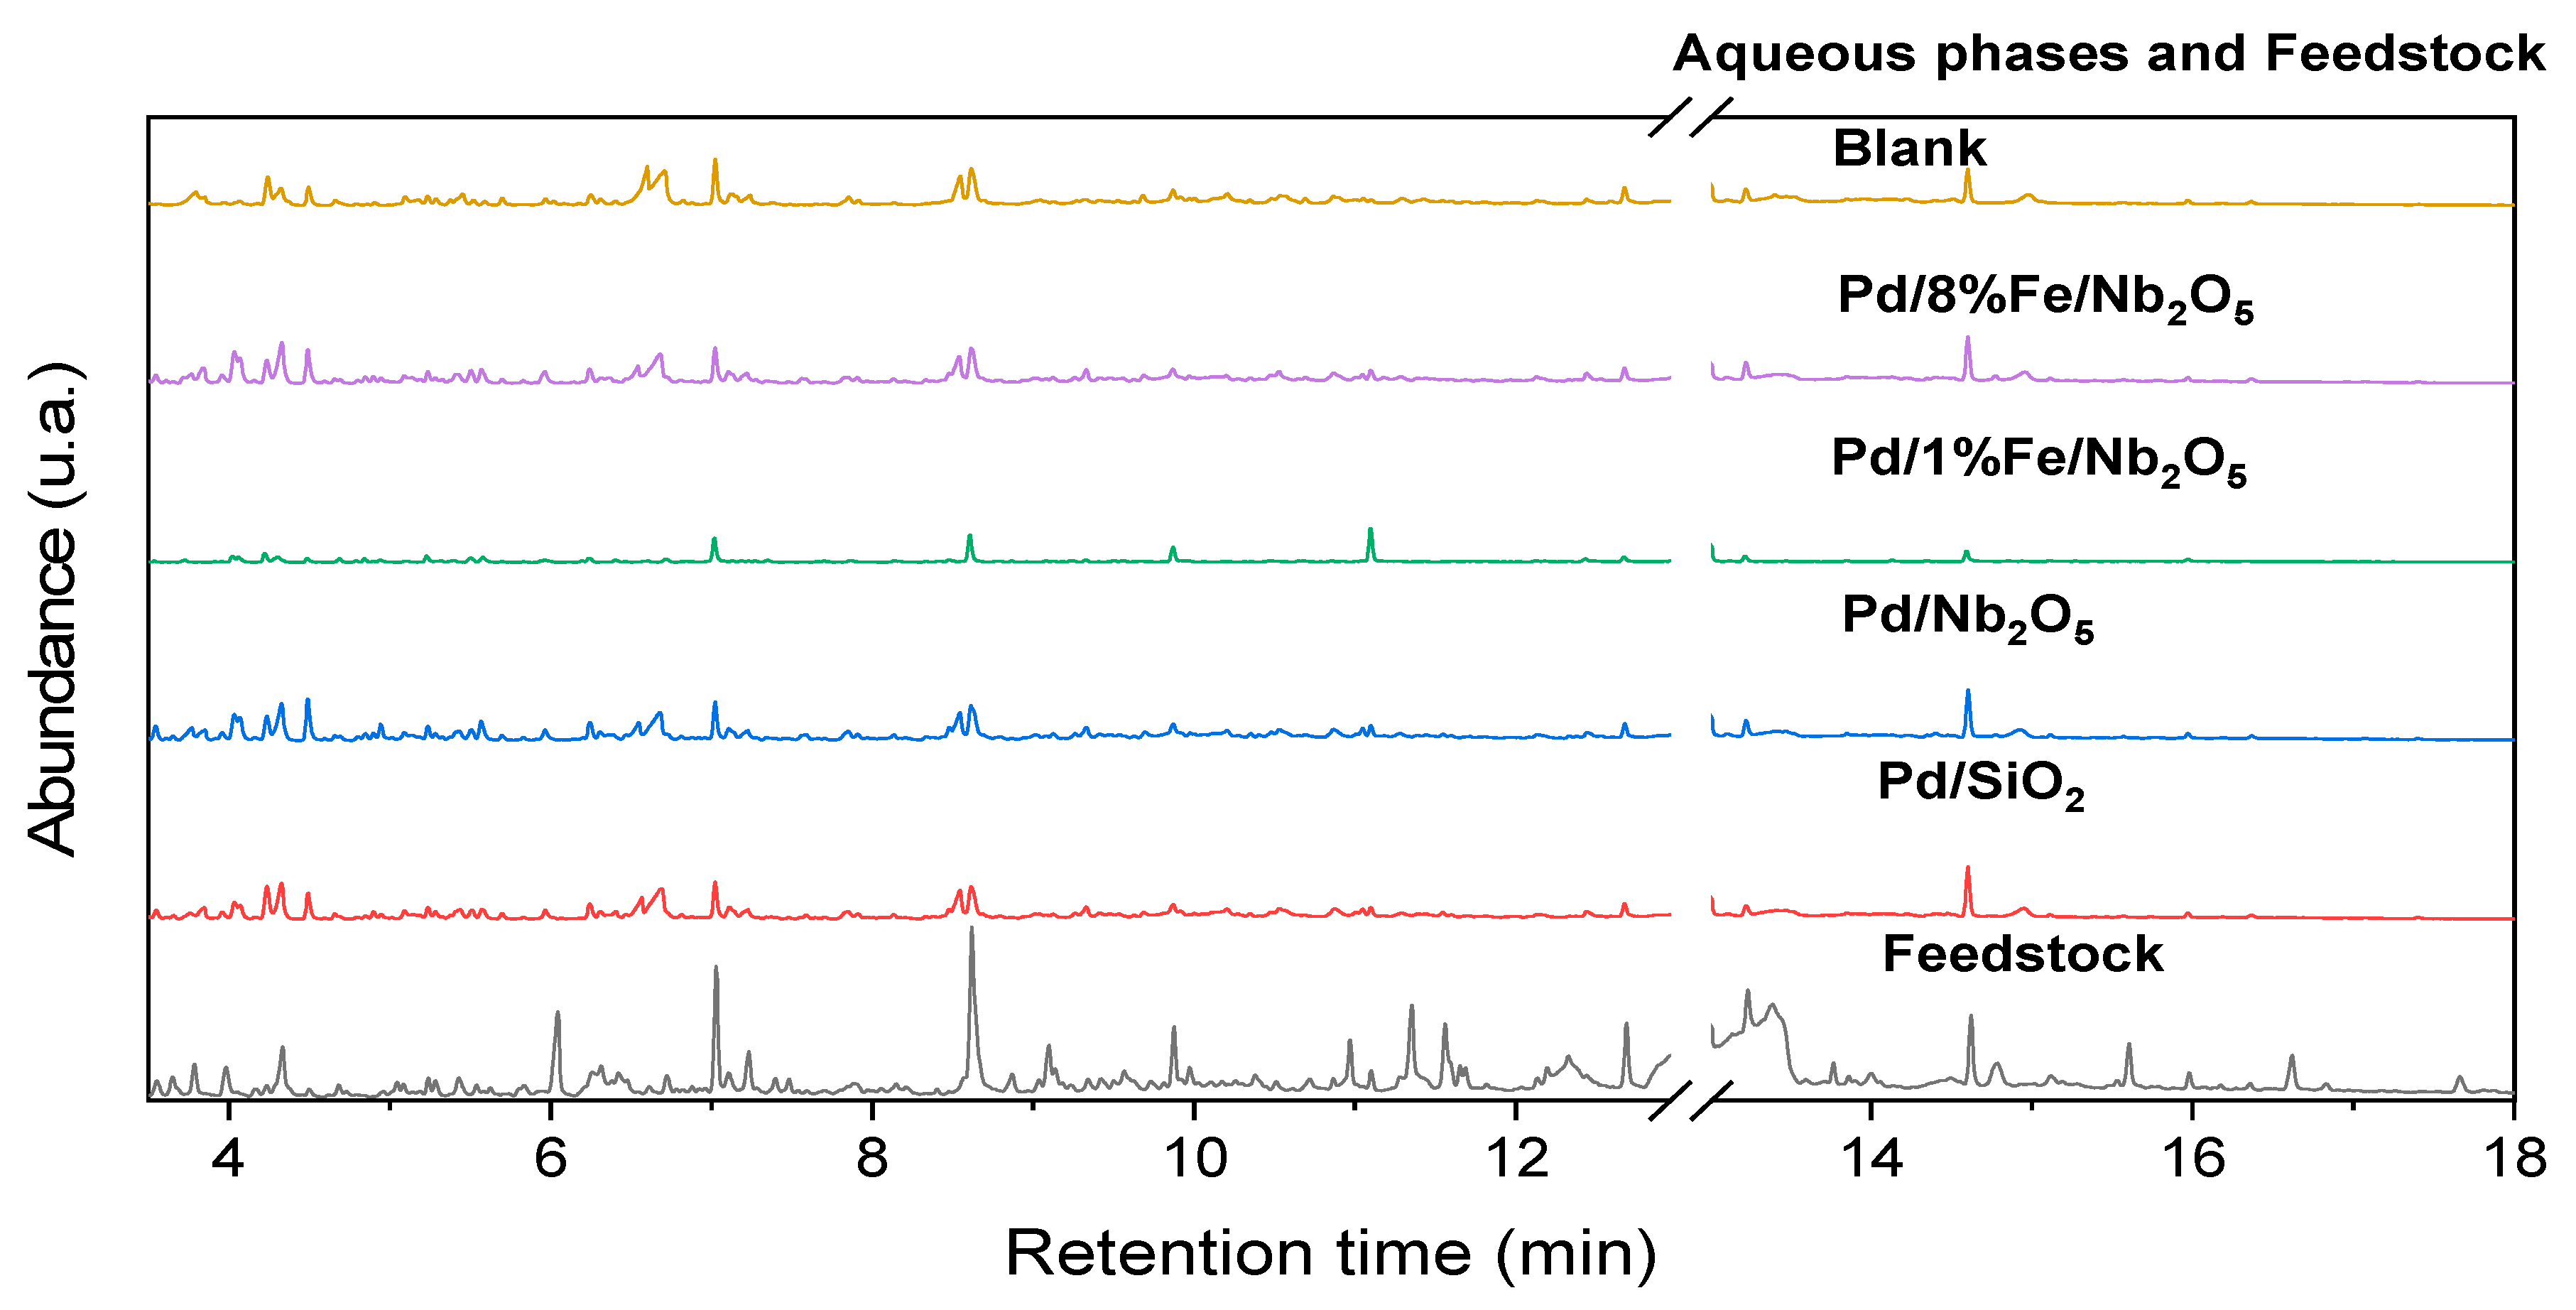
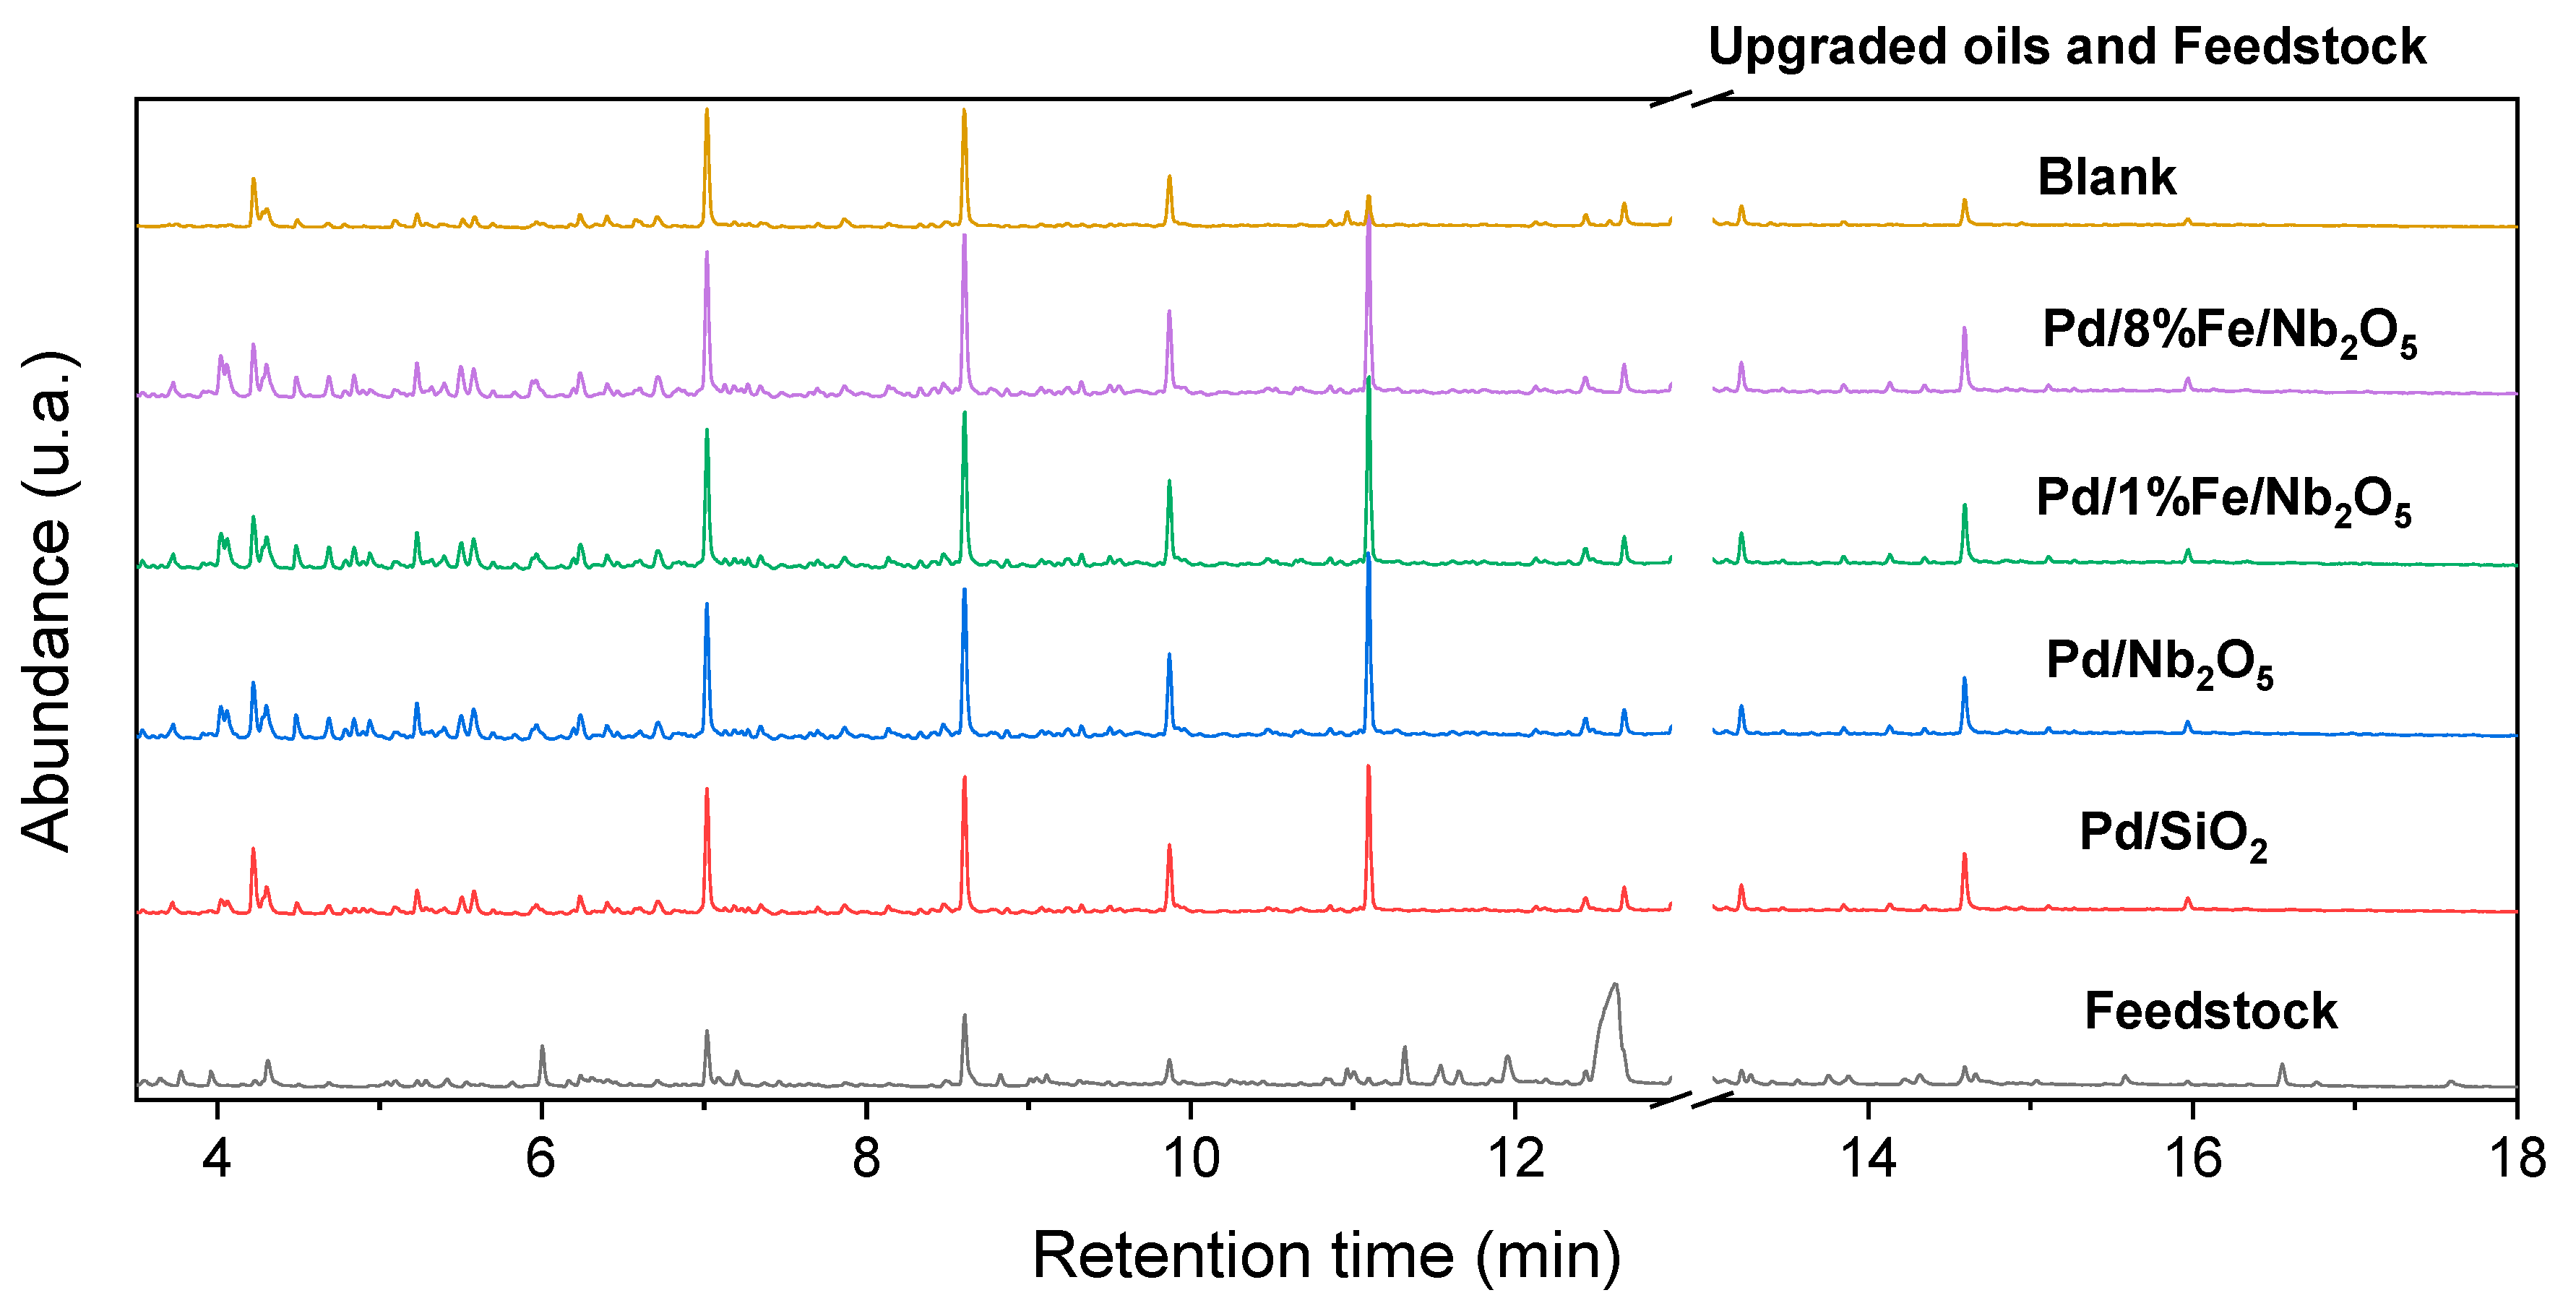
3.6. Product Characterization: Qualitative and Quantitative Analyses of Chemical Composition via GC-FID/MS

In Figure 9, the concentration of representative compounds in the upgraded products (total concentration) and in the feed are compared (measurements from GC-FID). The concentration of these compounds in each one of the upgraded phases are compiled in Figures S2 and S3.
In general, although concentrated on upgraded oils, lignin-derived phenols were drastically reduced over the hydrotreatment considering their total amount in both phases. For example, the total amount of o-cresol (methyl-phenol) was reduced from 3.0 to 0.6 g/kg PO. It may have been converted via hydrogenolysis to 2-methylcyclohexanone, identified by qualitative GC-MS, in agreement with the observations reported by Shafagat et al. [25] for Pd/C catalysts. The 4-methylcatechol (4-methyl-dihydroxybenzene) was also drastically reduced from 2.5 to 0.8–0.7 g/kg PO. It was possibly converted to cresol and then possibly further to toluene [60]. Guaiacol was slightly reduced from 4.7 to 3.5–4.0 g/kg PO, which is probably due to demethoxylation to phenol, in agreement with the concentration increase in phenol, and it could also have been hydrogenated to benzene [43]. In contrast, the amount of some oxygenated aromatic compounds increased, such as 4-ethylguaiacol, and 4-propylguaiacol (propyl-methoxy phenol). In agreement with the results reported by Carriel-Schmitt et al. [61], the increased 4-propylguaiacol may come from the hydrogenation of eugenol, identified on the feedstock—GC-MS, while the 4-ethylguaiacol was probably produced from the hydrogenation of 4-vinylguaiacol.
Interestingly, the amount of 3-methylcyclopentanone and cyclopentanone increased for all tested catalyst, especially in the aqueous phases. The Nb2O5-supported catalysts led to the highest methylcyclopentanone production from 0.9 to 2.7–2.9 g/kg PO. In contrast, Pd/SiO2 had only a slight increase in the methylcyclopentatone amount from 0.9 to 1.6 g/kg PO. As discussed further, 3-methylcyclopentanone was likely produced from 1–2 furanyl-ethanone but also from 5-methylfuraldehyde, both present on the feedstock as GC-MS analysis [62]. Cyclopentanone was also produced during the HDO over all tested catalysts, probably from the hydrogenation of furanic compounds such as furfural and 5-methylfurfural, identified on the feedstock via GC-MS [12,62].
As already mentioned, further analysis of the chemical composition of upgraded products was conducted by qualitative GC-MS/FID. The chromatograms of aqueous phases and upgraded oils as well as the feedstock were placed in Figure 10 and Figure 11 and the retention time of the main compounds identified was compiled in Table 3. The comparison of the GC-MS data of the upgraded products and feedstock enables us to follow the consumption or the production of a certain compound, as well as to have a rough idea of the changes in their concentration. The GC-MS analysis confirmed some relevant observations from the previous analysis of 1H-NMR, as discussed later.
Typical compounds from the decomposition of lignocellulosic biomass such as sugars, aldehydes, phenols, guaiacols, ketones, carboxylic acids and esters were identified. Some of these compounds were completely converted and therefore not detected on upgraded products, while new compounds appeared on upgraded products. It is important to highlight that due to the solvent delay on the analysis method, the compounds with a short retention time such as acetic acid, hydroxypropanone, cyclopentanone and several others are not detected.
Sugars such as levoglucosan, levogalactosan, mannosan and others, abundant on the feed, were completely converted during the hydrotreatment and therefore absent on upgraded products. Due to their high reactivity [52], all aldehydes present in the feed were completely consumed: 2-furaldehyde (RT. 3.30), 5-methyl-2-furaldehyde (RT. 5.04), 5-hydroxymethylfuraldehyde (RT. 9.09), 3-hydroxy-4-methoxy-benzaldehyde (RT. 11.55) and coniferyl-aldehyde (RT. 15.60). In a similar way, maltol (RT. 7.398), a pyranic compound present in the feed, was completely consumed over the hydrotreatment.
Several furans detected in the feedstock such as 2(5H)-furanone (RT. 4.336), 5-methyl-2(5H)-furanone (RT. 4.68), 3-methyl-2(5H)-furanone (RT. 5.282), 4-methyl-2(5H)-furanone (RT. 6.318), 2,5-dihydro-3,5-dimethyl-2-furanone (RT. 5.627), 1-(2-furanyl)-1-ethanone (RT. 4.281) and 2-hydroxy-γ-butyrolactone (RT. 5.43) were totally or almost completely consumed. In contrast, the amount of other furanic compounds already present in the feed increased significantly, such as γ-butyrolactone (RT. 4.3). Another furanic compound, γ-valerolactone (RT. 4.89), not present in the feed, was detected in the products.
Varied lignin-derived compounds were found in the feed as well as in the upgraded products. Besides guaiacol (methoxy-phenol) (RT. 7.016), different substituted guaiacols were detected such as methyl (RT. 8.604), ethyl (RT. 9.865), vinyl (RT. 10.965), propyl (RT. 11.096), allyl (Eugenol) (RT. 11.652) and propenyl (IsoEugenol) (RT. 12.192) guaiacols.
Several phenolic compounds such as phenols, methylphenols, and dimethylphenols were identified. Phenol (RT. 5.24) was increased significantly during the hydrotreatment, especially in upgraded oils. In contrast, all the other substituted phenols were partially consumed, for example, x-cresols (x = o, m, p; RT. 6.40, 6.71) and dimethylphenol (RT. 7.88). Syringols (dimethoxy-phenols) (RT. 10.866) and 4-methyl-syringol (RT. 12.132) were significantly consumed, as well as benzenediols present in the feed, such as catecholes (RT. 8.622) and hydroquinones (RT. 9.731).
In terms of organic function, the ketone group was one of the most impacted groups during the hydrotreatment. Some ketones detected in the feed were completely consumed, such as 1-acetyloxy-2-propanone (RT. 3.65), 3-ethyl-2-hydroxy-2-cyclopenten-1-one (RT. 7.482). Some aromatic ketones identified in the feed, for example, phenyl ketones, such as acetoguaiacone (RT. 12.671), guaiacyl acetone (RT. 13.224) and propioguaiacone (RT.13.863), were consumed during the hydrotreatment.
On the other hand, some ketones present in the feed were increased in the upgraded products, such as 2-methyl-2-cyclopenten-1-one (RT. 4.22), 3-methyl-2-cyclopenten-1-one (RT. 5.09) and 2,5-hexanedione (RT. 4.485), although they were also consumed to form saturated ketones as discussed later. Some of the ketones were only identified in the upgraded products, for example, cyclic ones, such as 2-methyl-cyclopentanone (RT. 3.392), 3-methylcyclopentanone (RT. 3.467), 2-ethyl-cyclopentanone (RT. 4.69), 2-methyl-cyclohexanone (RT. 4.84) and 2-hydroxy-cyclohexanone (RT. 5.569), as well as non-cyclic ones, such as 4-hydroxy-3-hexanone (RT. 4.057), 3,6-heptanedione (RT. 5.966) and 2,5-octanedione (RT. 7.34).
Some reaction mechanisms could be proposed from the previously mentioned product compounds (Figure S4). Several reactions could be proposed involving furaldehyde production and consumption. For example, the conversion of furaldehyde compounds such as 2-furaldehyde (RT. 3.30) and 5-hydroxymethylfuraldehyde (RT. 9.09) to γ-valerolactone (RT. 4.89) via 4-oxopentanoic acid (levulinic acid) (RT. 6.542) [63].
Besides the γ-valerolactone (RT. 4.89), the conversion of furfural alike compounds (5-methylfuraldehyde (RT. 5.04) or 5-hydroxymethylfuraldehyde (RT. 9.098)) could lead to unsaturated ketones such as 2-methyl-2-cyclopenten-1-one (RT. 4.22) and 3-methyl-2-cyclopenten-1-one (RT. 5.09). This could happen via acid catalyzed rearrangement or via acid catalyzed ring opening to 2,5-hexanedione as an intermediate followed by aldol condensation to the mentioned ketones [64].
These unsaturated ketones were possibly hydrogenated to 2-methyl-cyclopentanone (RT. 3.392) and 3-methylcyclopentanone (RT. 3.467) [64], explaining the simultaneous increase in saturated cyclopentanones and unsaturated cyclopentenones. Interestingly, SiO2-supported catalysts led to a much higher amount of unsaturated methyl-cyclopentenones than Nb2O5-supported catalysts. In contrast, the saturated methyl-cyclopentanones were detected in a higher amount over Nb2O5 than over SiO2 catalysts. In a similar way, the addition of Fe (8 wt.%) enhanced the hydrogenation of methyl-cyclopentanones. In both cases, the higher hydrogenation is in agreement with the higher hydrogen consumption previously discussed.
The required amount of furaldehydes to result on the mentioned compounds was probably supplied from the dehydration of C6 sugars like glucosan, galactosan and mannosan [12].
Another proposed reaction involving a furanic compound is the hydrogenation of 2(5H)-furanone to γ-butyrolactone (RT. 4.3), explaining the concentration increase in the latter [65].
Several cyclohexanones were identified, probably from the hydrogenation/demethoxylation of compounds with aromatic rings such as phenols, guaiacols and syringoles. Considering the higher amount of 2-methyl-cyclohexanone (RT. 4.84) with Nb2O5 catalyst and the higher amount of cresol (methyl-phenol) in the SiO2-related products, it is likely that cresol conversion to 2-methyl-cyclohexanone was enhanced with Nb2O5 [66].
The 2-hydroxy-cyclohexanone (RT. 5.569) was possibly formed from guaiacol or catechol (1,2-benzenediol), while the 4-hydroxy-3-hexanone (RT. 4.057) was likely produced via cycle opening. Nb2O5 as a support significantly enhanced the selectivity towards 2-hydroxy-cyclohexanone and 4-hydroxy-3-hexanone. Furthermore, iron as a promoter increased the cycle opening considering the higher amount of 4-hydroxy-3-hexanone and the simultaneous smaller amount of 2-hydroxy-cyclohexanone.
Interestingly, the three aliphatic diketones identified, 2,5-hexanedione, 3,6-heptanedione (RT. 5.966) and 2.5-octanedione (RT. 7.34), were increased with Nb2O5 as a promoter and specifically in the case of 2.5-octanedione, it was only detected with Nb2O5. Finally, besides the conversion to ketones, it is possible that guaiacols and substituted guaiacols were demethoxylated to phenols, increased during the HDO, and substituted phenols such as methyl and ethyl phenols, and further to toluene and benzene [28].

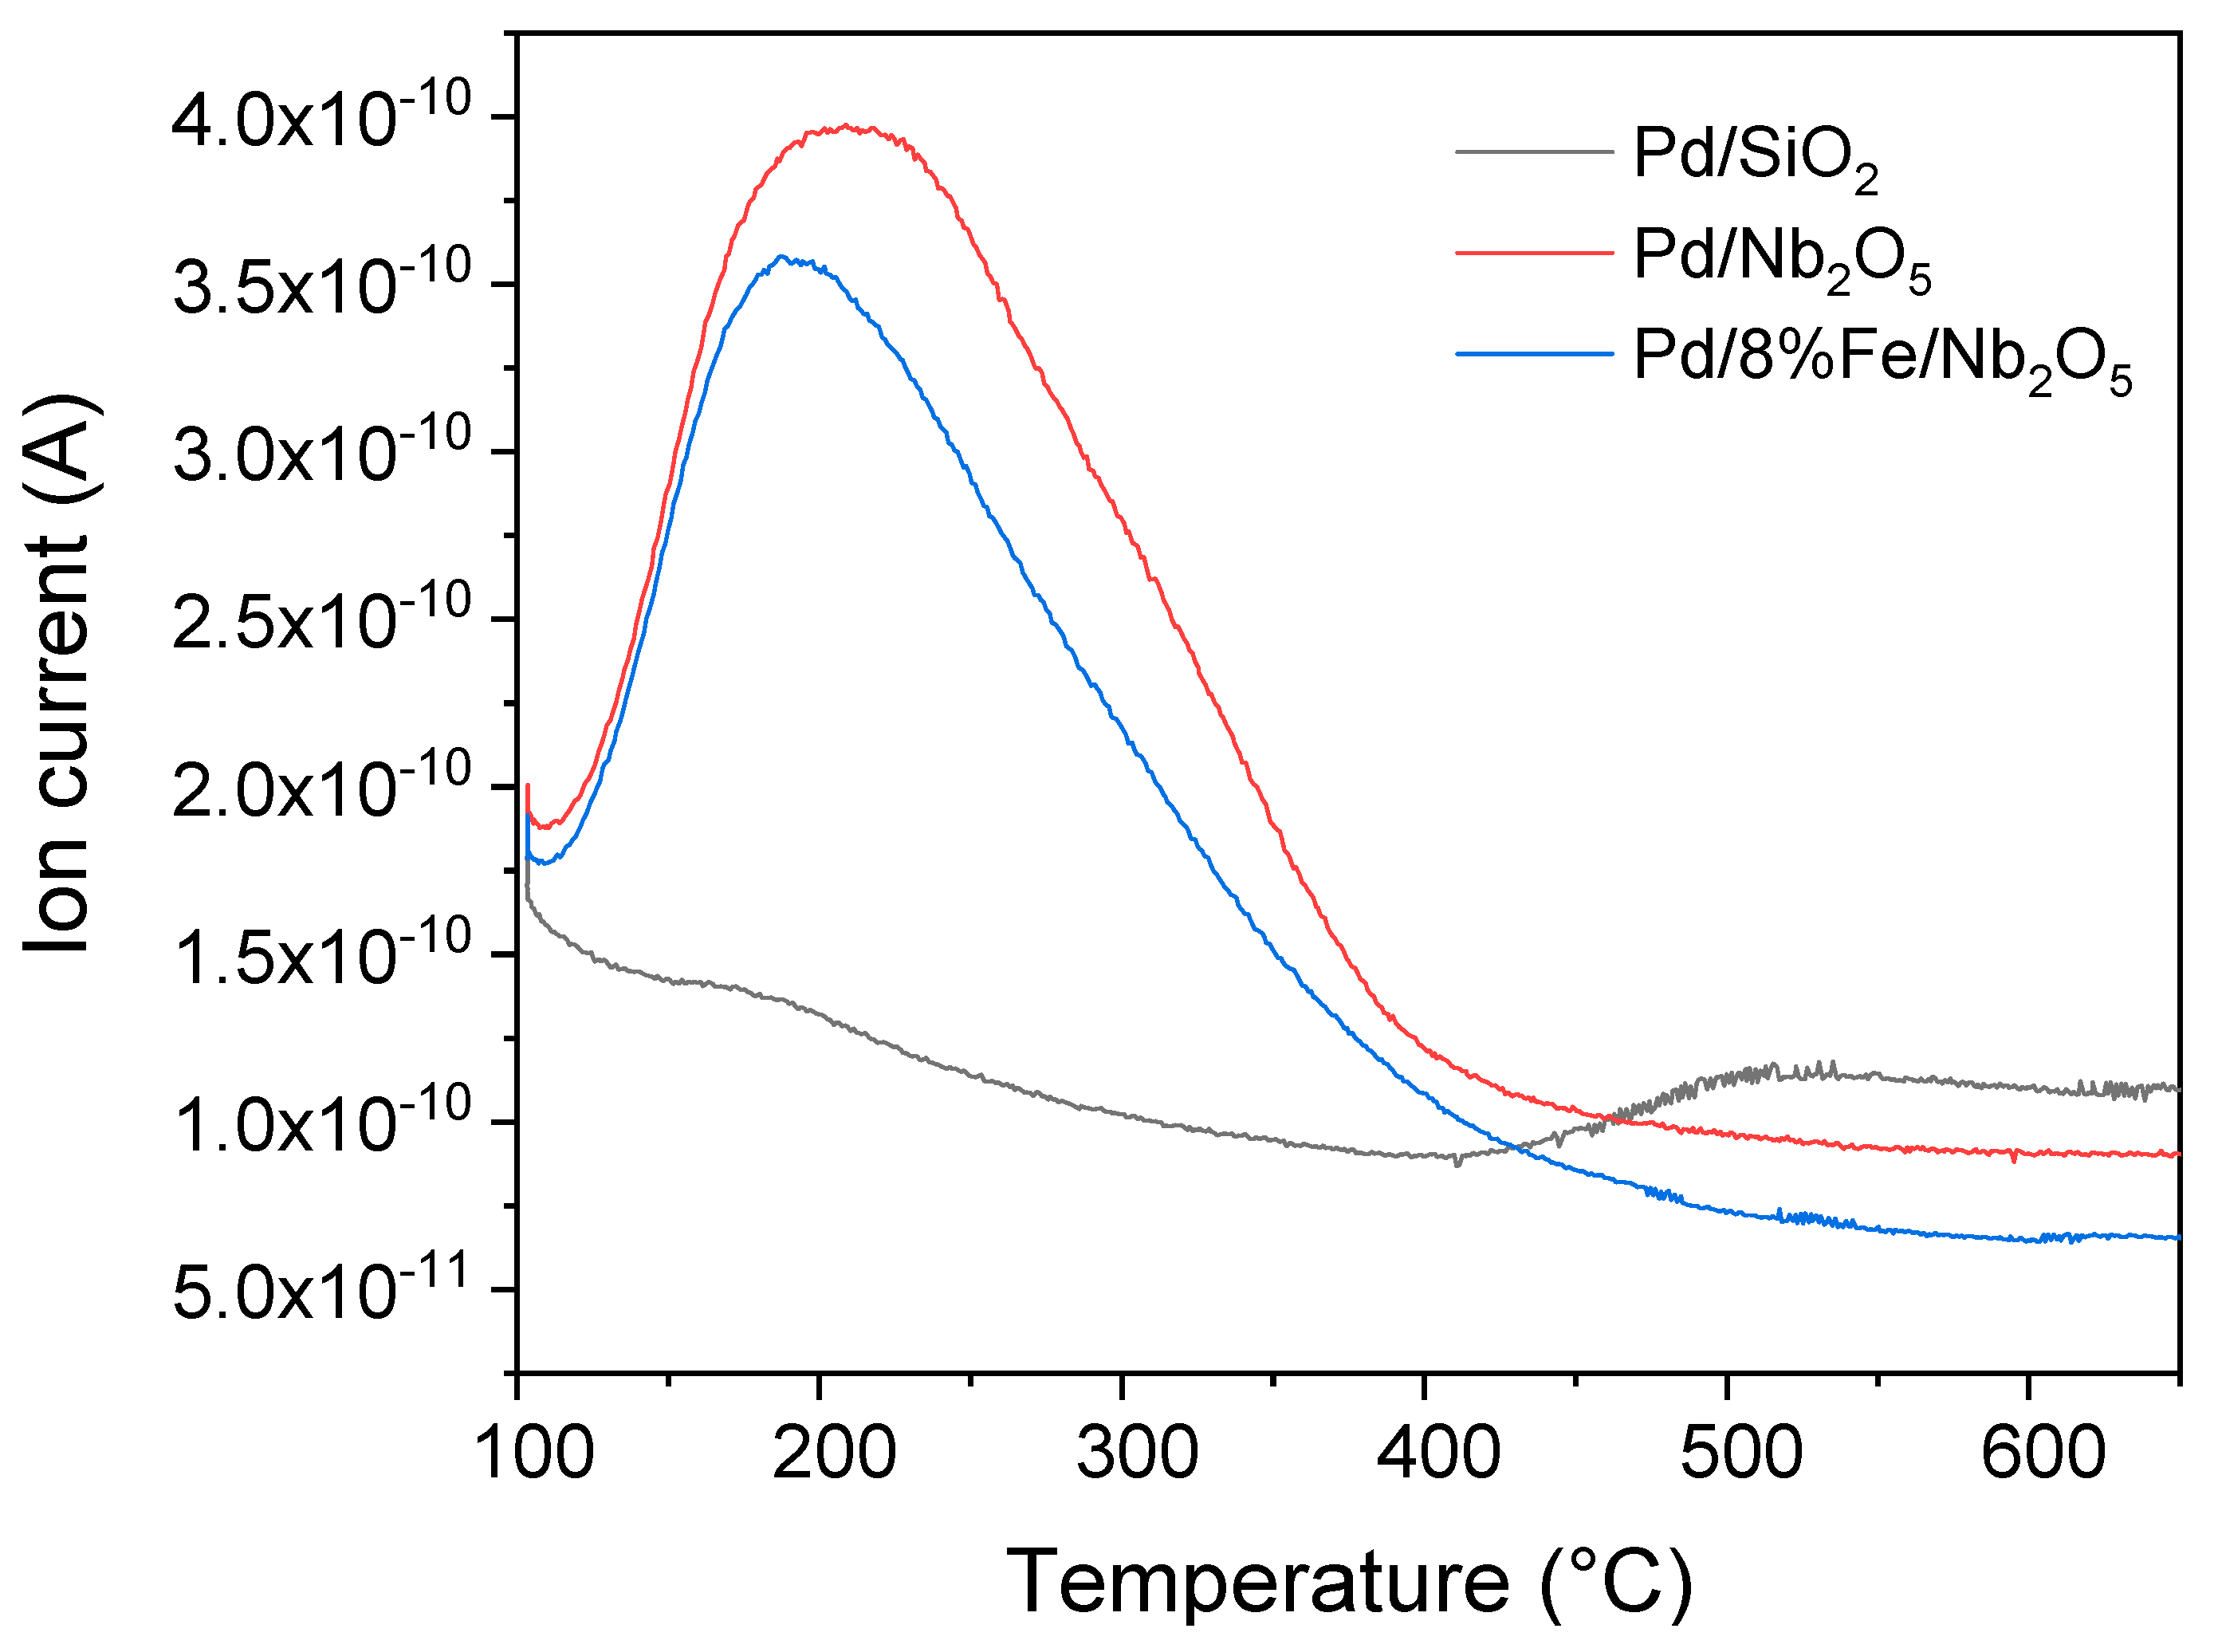
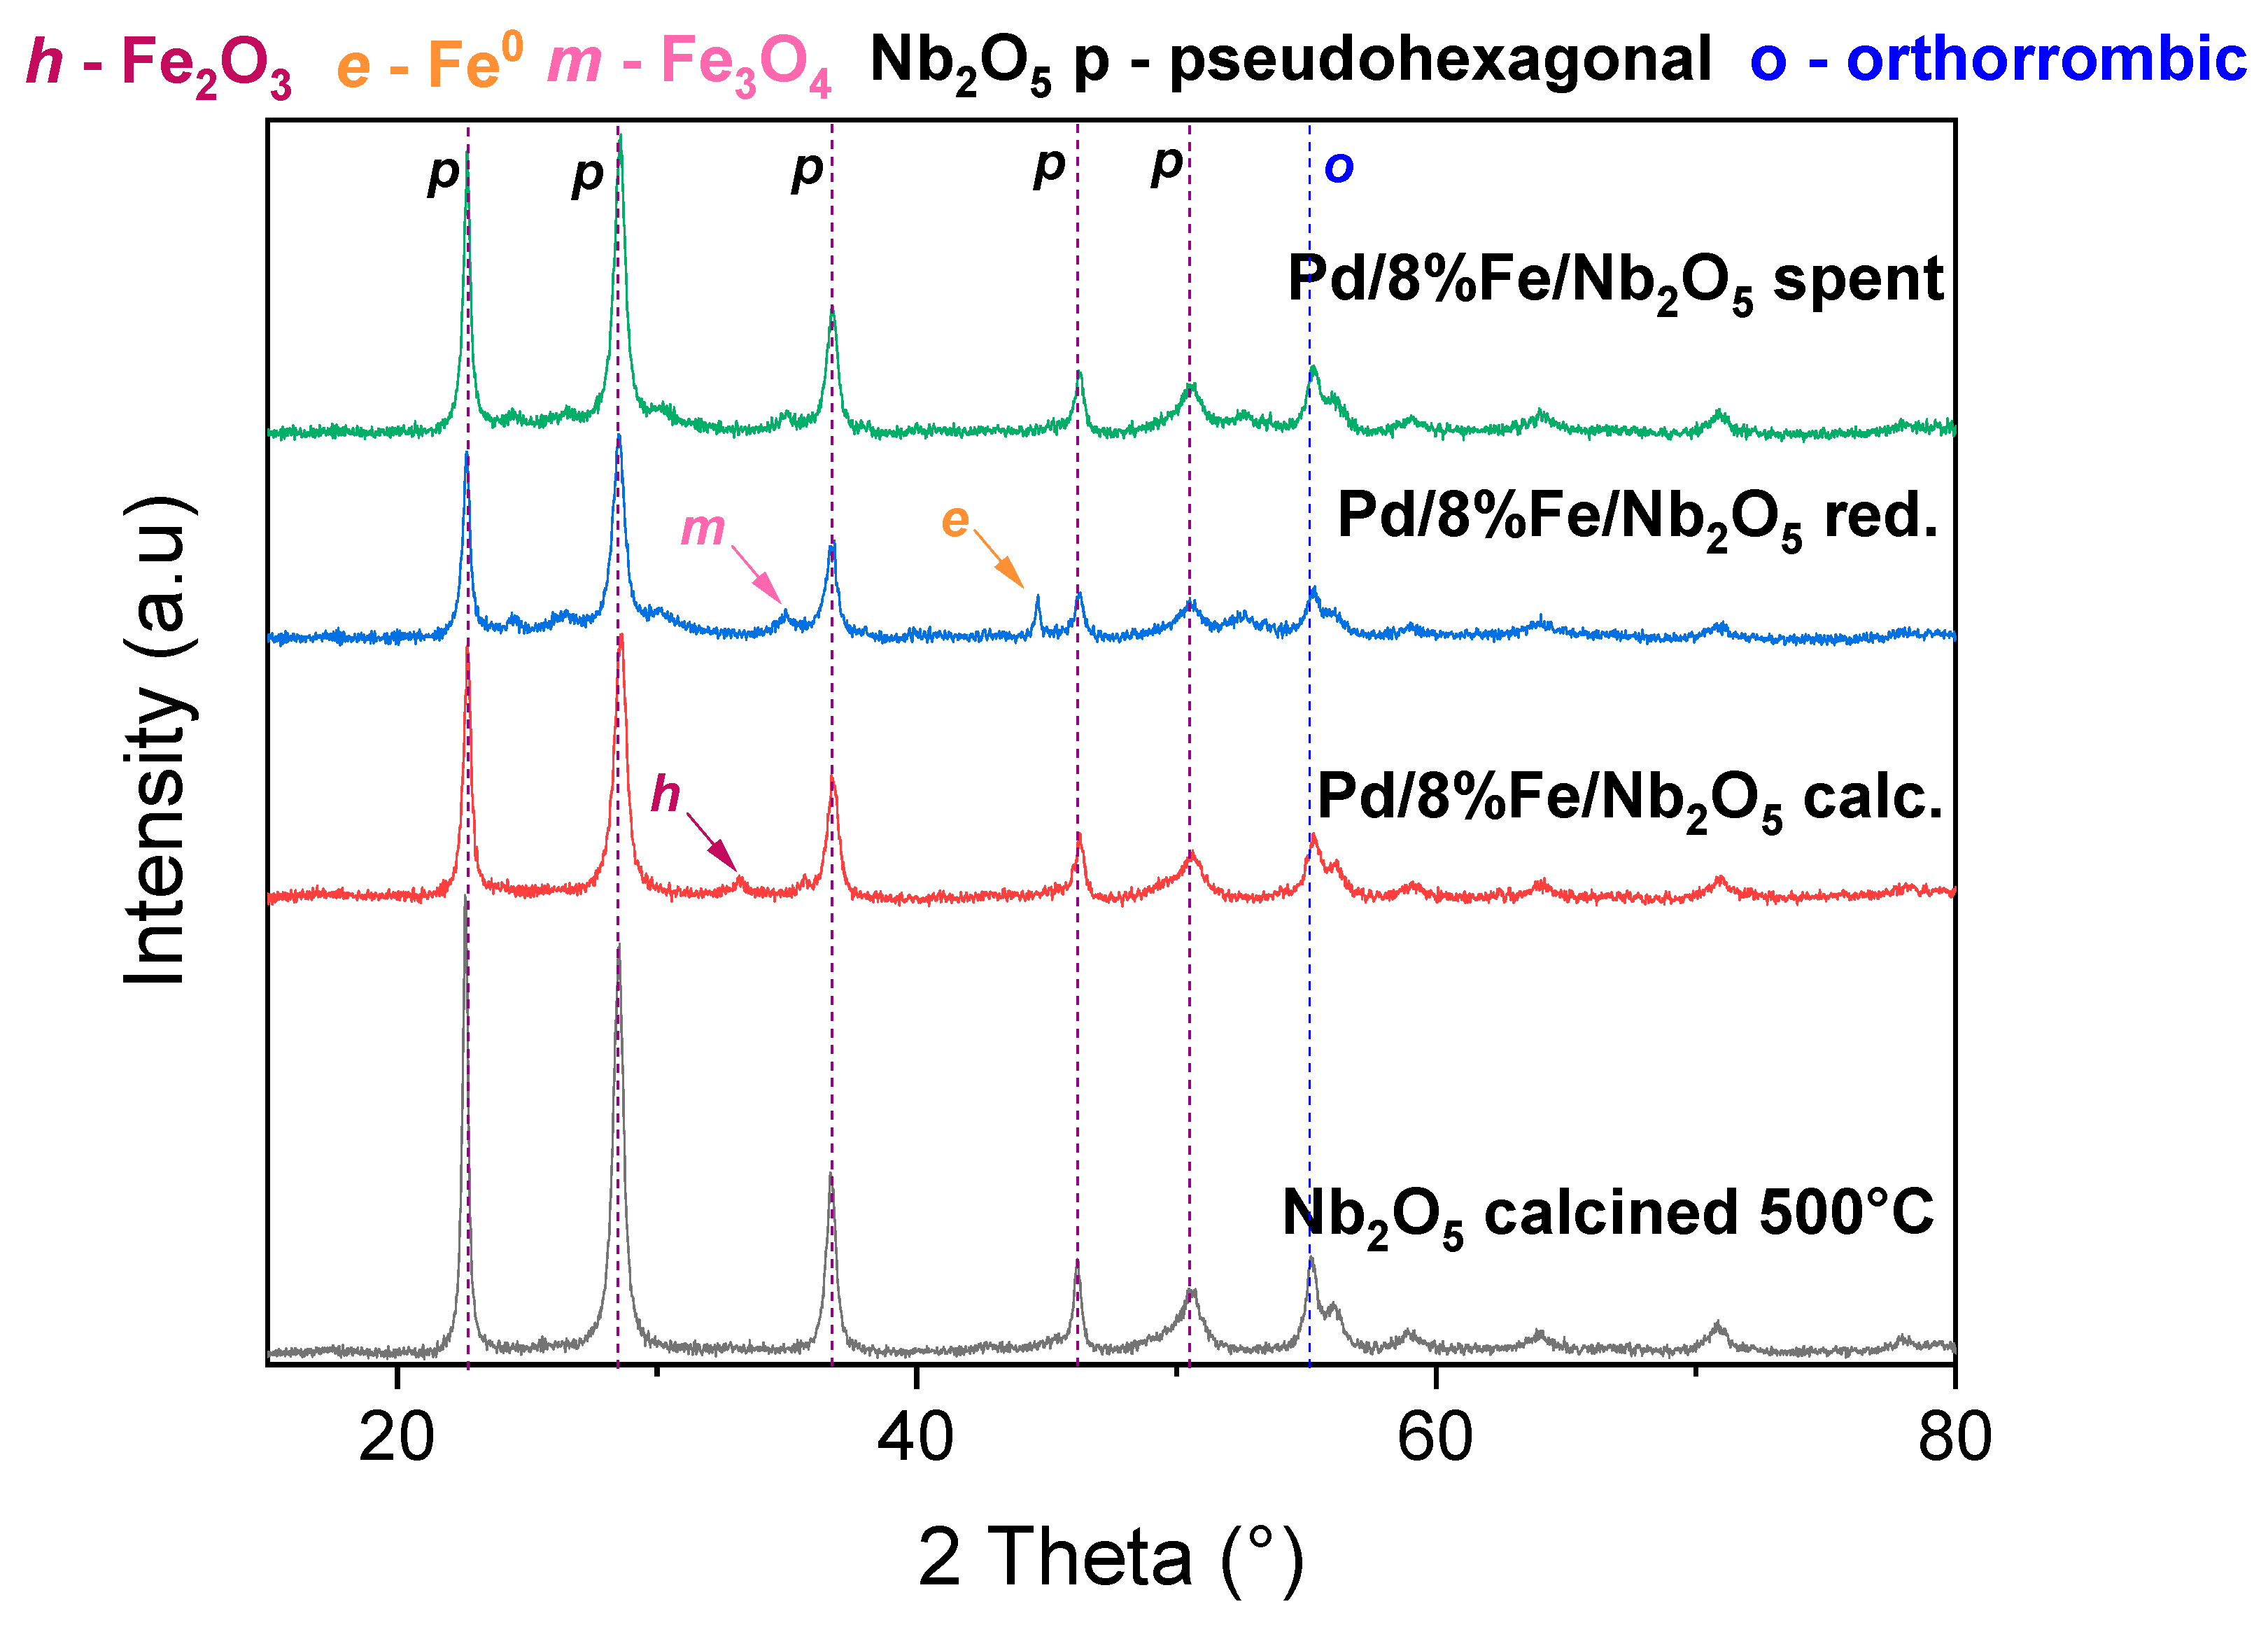
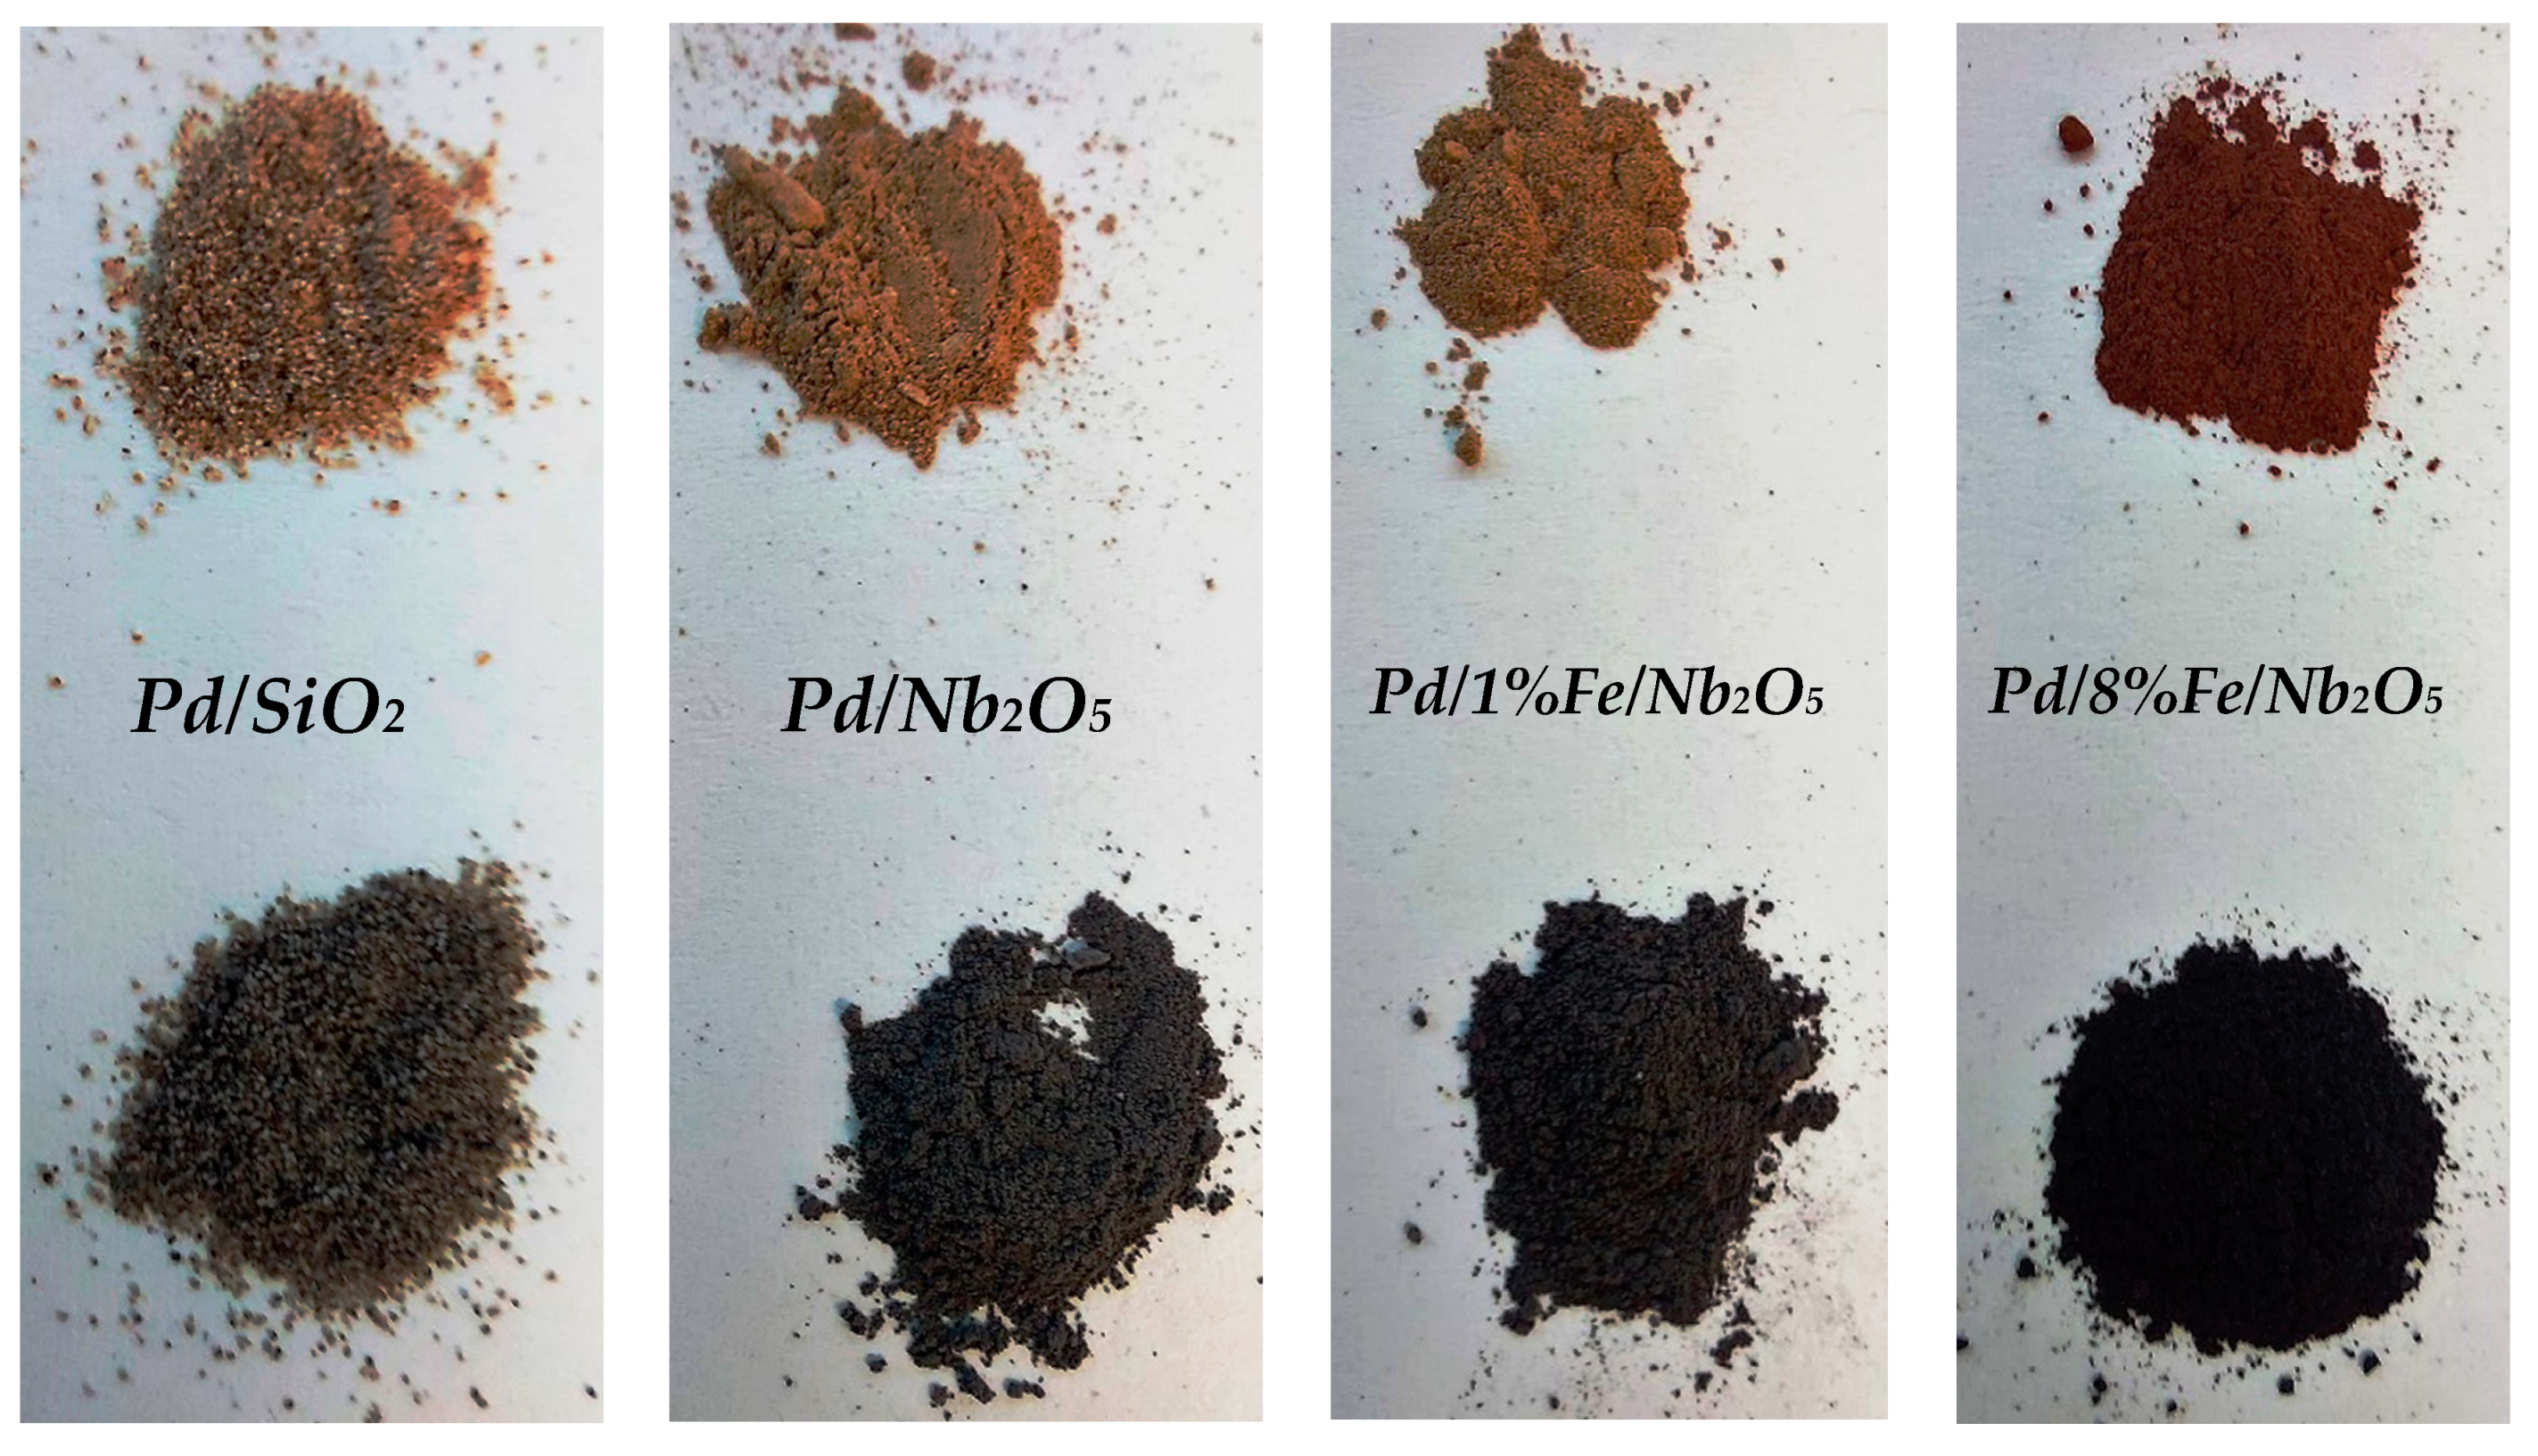
3.7. Characterization of Fresh and Spent Catalysts

In order to correlate the performance of the catalysts with their respective physicochemical properties, several analyses were performed. In Table 4, the metal concentration and the surface area of the fresh catalysts are shown as well as the metal concentration and the carbon content of the spent catalysts.
All fresh catalysts had a Pd content of around 1 wt.% and no significant decrease is observed after the HDO. On the other hand, while the iron loading on fresh catalysts was close to the intended value, a significant decrease was observed after the HDO for both studied Fe loadings. A high concentration of iron (2709 µg/mL) was detected by ICP-OES on the aqueous phase produced with Pd/8%Fe/Nb2O5. This explains the green color of this particular aqueous phase and indicates that the iron was leached into the products as Fe2+. The oxidation of iron catalysts due to phenols, water and carboxylic acids was also observed by Olcese et al. [67]. However, no leaching was reported since they evaluated gas phase HDO. Similarly, Hong et al. [68] emphasized the challenges of using Fe-containing catalysts for HDO due to water formation. Several strategies have been developed to increase the stability of these catalysts against deactivation through oxidation, such as doping with noble metals (Pt and Pd) and with nitrogen [68,69,70]. However, since HDO of bio-oil involves a considerable amount of water, the harsh conditions remain a problem to be overcome for iron catalysts.
Due to the synergy already described in the literature between Pd and Fe [45], it is likely that the iron attached to the support is an active site for catalytic HDO. However, more detailed studies with iron solution should be performed to confirm this hypothesis.
Besides Fe oxidation/leaching, the catalyst deactivation due to coke formation was evaluated through the carbon content on spent catalysts. The Nb2O5 catalysts presented a higher coke formation than the SiO2 catalyst, related to the higher acidic nature of Nb2O5 (Lewis and Brønsted acid sites) [26]. A similar effect was observed by Popov et al. [71] on acid-alumina-supported catalysts. Leal et al. [26] reported that Lewis acid sites present on Nb2O5 supports are important for HDO, but they also enhance deactivation via coke formation. Furthermore, DRIFTS measurements (diffuse reflectance infrared Fourier transform spectroscopy) with adsorbed cyclohexanone conducted by Barrios et al. [41] showed a stronger interaction between the oxygen from the carbonyl group and the oxophilic cation (Nb4+/Nb5+) from Nb2O5, in comparison to other typical supports such as SiO2, TiO2, CeO2, etc. Although the strong interaction reduces the C-O bond dissociation barriers, thus enabling a further bond cleavage, it also enhances the accumulation of intermediates that are prone to polymerization.
The support SiO2 had a BET surface area almost five times higher than the surface area of Nb2O5 after the calcination at 500 °C. In addition, the wet impregnation of iron led to a slight reduction in the support surface area, whose extension depended on the Fe loading. The metal distribution on the catalysts surface is presented in Figure S5. A homogeneous distribution of Pd and Fe was observed. The metal loading on the catalyst surface of some catalysts is shown in Table 4. As expected, there was a significant difference between the metal loading measured by ICP-OES and by EDS on representative surfaces. Since the catalysts were prepared by wet impregnation, the values of metal contents via EDS (metal concentration on the catalyst surface) were, as expected, higher than the metal loadings obtained via ICP-OES (metal concentration on the bulk of the catalyst).
Additionally, the impact of the supports and the promoter on catalyst acidity was evaluated via NH3-TPD (Figure 12). The SiO2 catalyst had no significant desorption of NH3. That is, the acidity of the silica catalyst was close to zero. In contrast, both Nb2O5-supported catalysts had a considerable area under the curve, related to the acid sites from the support. Since the impregnation of iron reduced the catalyst acidity, as shown by the lower area, iron probably blocked some of the acidic surface sites of the Nb2O5. Interestingly, this explains some trends on the chemical composition of the upgraded products, in which organic compounds enhanced by Nb2O5 were slightly reduced with the iron addition.
In addition, the crystalline structure of the catalysts was evaluated through X-ray diffraction and the diffractograms are shown in Figure 13. Due to the calcination temperature of 500 °C, the amorphous Nb2O5 was crystallized into pseudo-hexagonal structure (28.5°, 36.6°) with some orthorhombic parts (22.6°, 46.2° and 50.7°). As reported by Ko and Weissman [72], the patterns attributed to a pseudo-hexagonal crystal structure differed from the orthorhombic ones due to the presence of broader peaks instead of the doublets, characteristic from the orthorhombic structure. In contrast, on silica catalysts, the appearance of only one broad band between 15° < 2θ < 35° indicated that the support silica was either amorphous or had low crystallinity, which was confirmed by the lack of well-defined peaks. Furthermore, the absence of peaks between 1° < 2θ < 10° indicated a lack of long-range ordering. Except for the Pd/SiO2 catalyst, no peaks assigned to Pd were detected, due to the active metal low concentration and good dispersion.
In turn, diffraction peaks attributed to iron on different oxidized states were detected on the XRD patterns of Pd/8%Fe/Nb2O5 (Figure 13 and Figure 14). After the calcination, the diffraction peaks at 33.7° and 35.7° were attributed to Fe2O3, coherent with the reddish color of the powder (Figure 15). In contrast, the reduced Pd/8%Fe/Nb2O5 catalyst had diffraction peaks assigned to Fe3O4 (29.7° and 34.9°) and to Fe0 (44.6°) in agreement with the grey color of the powder (Figure 15). These species derived from Fe2O3 reduction under a hydrogen-rich atmosphere at 350 °C and they conferred ferromagnetic properties to the catalyst, as shown in Figure 16. Munoz et al. [73] also reported ferromagnetic properties associated with the presence of Fe3O4 and Fe0 obtained on 4%Fe/γ-Al2O3 reduced at 350 °C for 2 h. However, in the present study, after the HDO, the spent catalyst was not ferromagnetic anymore, indicating that it was oxidized under the acid aqueous environment from the bio-oil. Indeed, in the XRD patterns of the spent catalyst (Figure 14), there was no peak attributed to Fe0, which underwent oxidation processes by phenols, carboxylic acids and water as previously mentioned. Nonetheless, fundamental research with Mössbauer spectrometry and X-ray photoelectron spectroscopy (XPS) should be conducted to clarify the oxidation state of iron species in this system.

4. Conclusions

In this work, Pd/Nb2O5 catalysts were tested for HDO of the light phase of beech wood fast pyrolysis oil at 250 °C and its performance was compared to the Pd/SiO2 catalyst. The characterization of the reduced and spent catalysts was conducted to correlate the performance with their properties as well as possible deactivation via leaching or coke formation.
The higher acidity of Nb2O5 enhanced hydrogenolysis and hydrogenation reactions during the upgrading, which is in agreement with a higher H2 uptake, resulting in less viscous oil. In this sense, Nb2O5 upgraded oils showed the highest content of aliphatic protons observed by 1H-NMR. In contrast, the lower hydrogenolysis and hydrogenation activity of Pd/SiO2 during HDO led to a more viscous upgraded oil with higher average molecular weight, correlated to a higher CO2 and CO production. While the deactivation of reactive compounds avoided further polymerization over Nb2O5, the higher CO2 production with SiO2 catalysts was strongly related with polymerization.
In terms of oxygen content, due to the contribution of decarboxylation and decarbonylation and hydrogenolysis, both the Pd/SiO2 and the Pd/Nb2O5 led to similar deoxygenation degree, 41 wt.% and 39.8 wt.%, respectively. Both catalyst supports increased the bio-oil energy content evidenced by the HHV increase from 14.9 MJ/kg (wet basis) on the feedstock to 27.5 MJ/kg and 27.9 MJ/kg, respectively.
Low coke formation was observed on both Nb2O5 (2.8 wt.%) and SiO2 (1.7 wt.%) catalysts, with the higher carbon content related to the oxophilic sites Nb4+/Nb5+. Investigation on the regeneration and reusability of Nb2O5 catalysts is proposed for further studies.
In addition, Fe was tested as a promoter on Pd/Nb2O5 in two different loadings (1 wt.% and 8 wt.%). Due to its oxophilic nature, Fe enhanced even more hydrogenolysis/hydrogenation activity of Nb2O5-supported catalysts. Consequently, the catalyst Pd/8%Fe/Nb2O5 had the upgraded oil with the highest deoxygenation degree, 42.5 wt.%, and the highest HHV, 28.2 MJ/kg (wet basis). Interestingly, this catalyst composition was ferromagnetic after its reduction under H2 owing to the presence of elemental Fe and Fe3O4. However, after HDO, the catalyst lost this ability due to oxidation and further leaching of iron to the aqueous phase. In this sense, future studies should investigate proper ways to avoid Fe oxidation and still enable mass transfer to and from Fe sites. Consequently, the ferromagnetic properties of the catalyst would be kept until the end of the upgrading, helping catalyst recovery.

Supplementary Materials

The following supporting information can be downloaded at: https://www.mdpi.com/article/10.3390/en15134762/s1, Figure S1: Total amount of functional groups obtained via 1H-NMR integration at different ranges after the upgrading, considering the sum of aqueous phase and upgraded oil, as well as the amount present in feedstock (Pyrolysis oil light phase); Figure S2: Concentration of representative compounds present in the aqueous phase; Figure S3: Concentration of representative compounds present in upgraded oil; Figure S4: Suggested reaction pathways during the HDO. Figure S5: Elemental distribution on the catalyst surface via EDS; Equation (S1): Mass of upgraded oil through mass balance; Equations (S2)–(S4): Theoretical upgraded product recovery; Equation (S5): Calculation of oxygen content in upgraded products; Equation (S6): HHV via Channiwala equation.

Author Contributions

Conceptualization, M.M.C.F., K.R. and C.C.S.; experimental performance and material analysis, M.M.C.F. and H.H.; data treatment, B.L.d.O.C.; results discussion, M.M.C.F., B.L.d.O.C., H.H. and K.R.; resources, K.R and N.D.; writing—original draft preparation, M.M.C.F.; writing—review and editing, B.L.d.O.C., C.C.S. and K.R. All authors have read and agreed to the published version of the manuscript.’

Funding

This work received funding from Coordenação de Aperfeiçoamento de Pessoal de Nível Superior (CAPES) in the form of PhD scholarships for M. M. Campos Fraga and B. L. O. Campos (Process numbers: 88881.174050/2018-01 and 88881.174609/2018-01). It also received financial support by the KIT-Publication Fund of the Karlsruhe Institute of Technology.

Institutional Review Board Statement

Not applicable.

Informed Consent Statement

Not applicable.

Acknowledgments

The authors are thankful for the PhD scholarship of M.M.C.F. provided by Coordenação de Aperfeiçoamento de Pessoal de Nível Superior (CAPES). The authors kindly thank CBMM for providing the Nb2O5 used in this study. The authors are thankful for the support from the analytical department of IKFT—especially to Armin Lautenbach, Tomas Zevaco, Michael Zimmerman, Christopher, Petra Janke and Melany Frank as well from the mechanical workshop from IKFT.

Conflicts of Interest

The authors declare no conflict of interest.

References

  1. Bridgwater, A.V.; Meier, D.; Radlein, D. An overview of fast pyrolysis of biomass. Org. Geochem. 1999, 30, 1479–1493. [Google Scholar] [CrossRef]
  2. Schmitt, C.C.; Fonseca, F.G.; Fraga, M.M.C.; Wisniewski, A.; Karp, S.; José, H.M.; Rodrigues, R.C.L.B.; Moreira, R.; Hirayama, D.E.; Raffelt, K.; et al. Thermochemical and Catalytic Conversion Technologies for the Development of Brazilian Biomass Utilization. Catalysts 2021, 11, 1549. [Google Scholar] [CrossRef]
  3. Dahmen, N.; Henrich, E.; Dinjus, E.; Weirich, F. The bioliq® bioslurry gasification process for the production of biosynfuels, organic chemicals, and energy. Energy. Sustain. Soc. 2012, 2, 1–44. [Google Scholar] [CrossRef]
  4. IEA Bioenergy. Contribution of Bioenergy to the World’s Future Energy; IEA: Paris, France, 2007. [Google Scholar]
  5. IRENA. Global Renewables Outlook: Energy Transformation 2050; IRENA: Abu Dhabi, United Arab Emirates, 2020. [Google Scholar]
  6. IEA. World Energy Outlook 2019; IEA: Paris, France, 2019; p. 1. [Google Scholar]
  7. IEA. Renewables 2019—Analysis and Forecast to 2024; IEA: Paris, France, 2019; p. 204. [Google Scholar]
  8. Balan, V. Current Challenges in Commercially Producing Biofuels from Lignocellulosic Biomass. ISRN Biotechnol. 2014, 2014, 463074. [Google Scholar] [CrossRef]
  9. Wang, Z. 1.23 Energy and Air Pollution. Compr. Energy Syst. 2018, 1–5, 909–949. [Google Scholar]
  10. Tijmensen, M.J.A.; Faaij, A.P.C.; Hamelinck, C.N.; van Hardeveld, M.R.M. Exploration of the possibilities for production of Fischer Tropsch liquids and power via biomass gasification. Biomass Bioenergy 2002, 23, 129–152. [Google Scholar] [CrossRef]
  11. Glushkov, D.; Nyashina, G.; Shvets, A.; Pereira, A.; Ramanathan, A. Current Status of the Pyrolysis and Gasification Mechanism of Biomass. Energies 2022, 14, 7541. [Google Scholar] [CrossRef]
  12. Schmitt, C.C.; Reolon, M.B.G.; Zimmermann, M.; Raffelt, K.; Grunwaldt, J.-D.; Dahmen, N. Synthesis and Regeneration of Nickel-Based Catalysts for Hydrodeoxygenation of Beech Wood Fast Pyrolysis Bio-Oil. Catalysts 2018, 8, 449. [Google Scholar] [CrossRef] [Green Version]
  13. Mortensen, P.M.; Grunwaldt, J.-D.; Jensen, P.A.; Knudsen, K.G.; Jensen, A.D. A review of catalytic upgrading of bio-oil to engine fuels. Appl. Catal. A Gen. 2011, 407, 1–19. [Google Scholar] [CrossRef]
  14. Mohan, D.; Pittman, C.U., Jr.; Steele, P.H. Pyrolysis of Wood/Biomass for Bio-Oil: A Critical Review. Energy Fuels 2006, 20, 848–889. [Google Scholar] [CrossRef]
  15. Elliott, D.C. Biofuel from fast pyrolysis and catalytic hydrodeoxygenation. Curr. Opin. Chem. Eng. 2015, 9, 59–65. [Google Scholar] [CrossRef] [Green Version]
  16. Mercader, F.D.M.; Groeneveld, M.; Kersten, S.; Venderbosch, R.; Hogendoorn, J. Pyrolysis oil upgrading by high pressure thermal treatment. Fuel 2010, 89, 2829–2837. [Google Scholar] [CrossRef]
  17. Schmitt, C.C. Catalytic Upgrading of Fast Pyrolysis Bio-Oils Applying Nickel-Based Catalysts. Ph.D. Thesis, KIT, Karlsruhe, Germany, 2021. [Google Scholar]
  18. Collard, F.X.; Blin, J. A review on pyrolysis of biomass constituents: Mechanisms and composition of the products obtained from the conversion of cellulose, hemicelluloses and lignin. Renew. Sustain. Energy Rev. 2014, 38, 594–608. [Google Scholar] [CrossRef]
  19. Sarangi, P.K.; Nanda, S.; Vo, D.-V.N. Technological Advancements in the Production and Application of Biomethanol. In Biorefinery of Alternative Resources: Targeting Green Fuels and Platform Chemicals; Springer: Singapore, 2020. [Google Scholar] [CrossRef]
  20. Pinheiro Pires, A.P.; Arauzo, J.; Fonts, I.; Domine, M.E.; Fernández Arroyo, A.; Garcia-Perez, M.E.; Montoya, J.; Chejne, F.; Pfromm, P.; Garcia-Perez, M. Challenges and Opportunities for Bio-Oil Refining: A Review. Energy Fuels 2019, 33, 4683–4720. [Google Scholar] [CrossRef]
  21. Jones, S.B.; Snowden-Swan, L.L. Production of Gasoline and Diesel from Biomass via Fast-Pyrolysis, Hydrotreating and Hydrocracking: 2012 State of Technology and Projections to 2017; PNNL Report No. 22684; Pacific Northwest National Laboratory: Richland, WA, USA, 2013. [Google Scholar]
  22. Han, Y.; Gholizadeh, M.; Tran, C.-C.; Kaliaguine, S.; Li, C.-Z.; Olarte, M.; Garcia-Perez, M. Hydrotreatment of pyrolysis bio-oil: A review. Fuel Process. Technol. 2019, 195, 106140. [Google Scholar] [CrossRef]
  23. Jin, W.; Pérez, L.P.; Shen, D.; Sepúlveda-Escribano, A.; Gu, S.; Reina, T.R. Catalytic Upgrading of Biomass Model Compounds: Novel Approaches and Lessons Learnt from Traditional Hydrodeoxygenation—A Review. ChemCatChem 2018, 11, 924–960. [Google Scholar] [CrossRef] [Green Version]
  24. Kim, S.; Kwon, E.E.; Kim, Y.T.; Jung, S.; Kim, H.J.; Huber, G.W.; Lee, J. Recent advances in hydrodeoxygenation of biomass-derived oxygenates over heterogeneous catalysts. Green Chem. 2019, 21, 3715–3743. [Google Scholar] [CrossRef]
  25. Shafaghat, H.; Rezaei, P.S.; Daud, W.M.A.W. Catalytic hydrodeoxygenation of simulated phenolic bio-oil to cycloalkanes and aromatic hydrocarbons over bifunctional metal/acid catalysts of Ni/HBeta, Fe/HBeta and NiFe/HBeta. J. Ind. Eng. Chem. 2016, 35, 268–276. [Google Scholar] [CrossRef]
  26. Leal, G.F.; Lima, S.; Graça, I.; Carrer, H.; Barrett, D.; Teixeira-Neto, E.; Curvelo, A.A.S.; Rodella, C.; Rinaldi, R. Design of Nickel Supported on Water-Tolerant Nb2O5 Catalysts for the Hydrotreating of Lignin Streams Obtained from Lignin-First Biorefining. iScience 2019, 15, 467–488. [Google Scholar] [CrossRef] [Green Version]
  27. Mäki-Arvela, P.; Murzin, D.Y. Hydrodeoxygenation of Lignin-Derived Phenols: From Fundamental Studies towards Industrial Applications. Catalysts 2017, 7, 265. [Google Scholar] [CrossRef] [Green Version]
  28. Tran, N.; Uemura, Y.; Trinh, T.; Ramli, A. Hydrodeoxygenation of Guaiacol over Pd–Co and Pd–Fe Catalysts: Deactivation and Regeneration. Processes 2021, 9, 430. [Google Scholar] [CrossRef]
  29. Si, Z.; Zhang, X.; Wang, C.; Ma, L.; Dong, R. An Overview on Catalytic Hydrodeoxygenation of Pyrolysis Oil and Its Model Compounds. Catalysts 2017, 7, 169. [Google Scholar] [CrossRef] [Green Version]
  30. Robinson, A.M.; Hensley, J.E.; Medlin, J. Bifunctional Catalysts for Upgrading of Biomass-Derived Oxygenates: A Review. ACS Catal. 2016, 6, 5026–5043. [Google Scholar] [CrossRef]
  31. Lugo-José, Y.K.; Monnier, J.R.; Williams, C.T. Gas-phase, catalytic hydrodeoxygenation of propanoic acid, over supported group VIII noble metals: Metal and support effects. Appl. Catal. A Gen. 2014, 469, 410–418. [Google Scholar] [CrossRef]
  32. Resende, K.A.; Hori, C.; Noronha, F.B.; Shi, H.; Gutierrez, O.Y.; Camaioni, D.M.; Lercher, J. Aqueous phase hydrogenation of phenol catalyzed by Pd and PdAg on ZrO2. Appl. Catal. A Gen. 2017, 548, 128–135. [Google Scholar] [CrossRef]
  33. Zhang, J.; Wang, K.; Nolte, M.W.; Choi, Y.S.; Brown, R.C.; Shanks, B.H. Catalytic Deoxygenation of Bio-Oil Model Compounds over Acid–Base Bifunctional Catalysts. ACS Catal. 2016, 6, 2608–2621. [Google Scholar] [CrossRef]
  34. Dixon, D.J. Bifunctional catalysis. Beilstein J. Org. Chem. 2016, 12, 1079–1080. [Google Scholar] [CrossRef] [Green Version]
  35. Gutierrez, A.; Kaila, R.; Honkela, M.; Slioor, R.; Krause, A. Hydrodeoxygenation of guaiacol on noble metal catalysts. Catal. Today 2009, 147, 239–246. [Google Scholar] [CrossRef]
  36. Tanabe, K.; Hölderich, W.F. Industrial application of solid acid-base catalysts. Appl. Catal. A Gen. 1999, 181, 399–434. [Google Scholar] [CrossRef]
  37. Noronha, F.; Frydman, A.; Aranda, D.; Perez, C.; Soares, R.; Morawek, B.; Castner, D.; Campbell, C.; Frety, R.; Schmal, M. The promoting effect of noble metal addition on niobia-supported cobalt catalysts. Catal. Today 1996, 28, 147–157. [Google Scholar] [CrossRef]
  38. Nowak, I.; Ziolek, M. Niobium Compounds: Preparation, Characterization, and Application in Heterogeneous Catalysis. Chem. Rev. 1999, 99, 3603–3624. [Google Scholar] [CrossRef] [PubMed]
  39. Passos, F.B.; Aranda, D.A.G.; Soares, R.R.; Schmal, M. Effect of preparation method on the properties of Nb2O5 promoted platinum catalysts. Catal. Today 1998, 43, 3–9. [Google Scholar] [CrossRef]
  40. Tanabe, K. Catalytic applications of niobium compounds. Niobium Sci. Technol. 2001, 78, 269–290. [Google Scholar]
  41. Barrios, A.M.; Teles, C.A.; De Souza, P.M.; Rabelo-Neto, R.C.; Jacobs, G.; Davis, B.H.; Borges, L.E.; Noronha, F.B. Hydrodeoxygenation of phenol over niobia supported Pd catalyst. Catal. Today 2017, 302, 115–124. [Google Scholar] [CrossRef]
  42. Jing, Y.; Xin, Y.; Guo, Y.; Liu, X.; Wang, Y. Highly efficient Nb2O5 catalyst for aldol condensation of biomass-derived carbonyl molecules to fuel precursors. Chin. J. Catal. 2019, 40, 1168–1177. [Google Scholar] [CrossRef]
  43. Teles, C.A.; De Souza, P.M.; Rabelo-Neto, R.C.; Griffin, M.B.; Mukarakate, C.; Orton, K.A.; Resasco, D.E.; Noronha, F.B. Catalytic upgrading of biomass pyrolysis vapors and model compounds using niobia supported Pd catalyst. Appl. Catal. B Environ. 2018, 238, 38–50. [Google Scholar] [CrossRef]
  44. Dong, L.; Shao, Y.; Han, X.; Liu, X.; Xia, Q.; Parker, S.F.; Cheng, Y.Q.; Daemen, L.L.; Ramirez-Cuesta, A.J.; Wang, Y.; et al. Comparison of two multifunctional catalysts [M/Nb2O5 (M = Pd, Pt)] for one-pot hydrodeoxygenation of lignin. Catal. Sci. Technol. 2018, 8, 6129–6136. [Google Scholar] [CrossRef] [Green Version]
  45. Sun, J.; Karim, A.; Zhang, H.; Kovarik, L.; Li, X.S.; Hensley, A.; McEwen, J.-S.; Wang, Y. Carbon-supported bimetallic Pd–Fe catalysts for vapor-phase hydrodeoxygenation of guaiacol. J. Catal. 2013, 306, 47–57. [Google Scholar] [CrossRef]
  46. Kim, J.K.; Lee, J.K.; Kang, K.H.; Song, J.C.; Song, I.K. Selective cleavage of C–O bond in benzyl phenyl ether to aromatics over Pd–Fe bimetallic catalyst supported on ordered mesoporous carbon. Appl. Catal. A Gen. 2015, 498, 142–149. [Google Scholar] [CrossRef]
  47. Channiwala, S.A.; Parikh, P.P. A unified correlation for estimating HHV of solid, liquid and gaseous fuels. Fuel 2002, 81, 1051–1063. [Google Scholar] [CrossRef]
  48. Joseph, J.; Baker, C.; Mukkamala, S.; Beis, S.H.; Wheeler, M.C.; DeSisto, W.J.; Jensen, B.L.; Frederick, B.G. Chemical Shifts and Lifetimes for Nuclear Magnetic Resonance (NMR) Analysis of Biofuels. Energy Fuels 2010, 24, 5153–5162. [Google Scholar] [CrossRef]
  49. Shao, Y.; Xia, Q.; Liu, X.; Lu, G.; Wang, Y. Pd/Nb2O5/SiO2 Catalyst for the Direct Hydrodeoxygenation of Biomass-Related Compounds to Liquid Alkanes under Mild Conditions. ChemSusChem 2015, 8, 1761–1767. [Google Scholar] [CrossRef]
  50. Nakajima, K.; Hirata, J.; Kim, M.; Gupta, N.K.; Murayama, T.; Yoshida, A.; Hiyoshi, N.; Fukuoka, A.; Ueda, W. Facile Formation of Lactic Acid from a Triose Sugar in Water over Niobium Oxide with a Deformed Orthorhombic Phase. ACS Catal. 2018, 8, 283–290. [Google Scholar] [CrossRef]
  51. Kon, K.; Onodera, W.; Takakusagi, S.; Shimizu, K.I. Hydrodeoxygenation of fatty acids and triglycerides by Pt-loaded Nb2O5catalysts. Catal. Sci. Technol. 2014, 4, 3705–3712. [Google Scholar] [CrossRef]
  52. Boscagli, C.; Raffelt, K.; Zevaco, T.A.; Olbrich, W.; Otto, T.N.; Sauer, J.; Grunwaldt, J.-D. Mild hydrotreatment of the light fraction of fast-pyrolysis oil produced from straw over nickel-based catalysts. Biomass Bioenergy 2015, 83, 525–538. [Google Scholar] [CrossRef] [Green Version]
  53. French, R.J.; Stunkel, J.; Baldwin, R.M. Mild Hydrotreating of Bio-Oil: Effect of Reaction Severity and Fate of Oxygenated Species. Energy Fuels 2011, 25, 3266–3274. [Google Scholar] [CrossRef]
  54. Mercader, F.D.M.; Groeneveld, M.J.; Kersten, S.R.A.; Geantet, C.; Toussaint, G.; Way, N.W.J.; Schaverien, C.J.; Hogendoorn, K.J.A. Hydrodeoxygenation of pyrolysis oil fractions: Process understanding and quality assessment through co-processing in refinery units. Energy Environ. Sci. 2011, 4, 985–997. [Google Scholar] [CrossRef]
  55. Venderbosch, R.H.; Ardiyanti, A.R.; Wildschut, J.; Oasmaa, A.; Heeres, H.J. Stabilization of biomass-derived pyrolysis oils. J. Chem. Technol. Biotechnol. 2010, 85, 674–686. [Google Scholar] [CrossRef]
  56. Mercader, F.D.M.; Koehorst, P.J.J.; Heeres, H.; Kersten, S.R.A.; Hogendoorn, J.A. Competition between hydrotreating and polymerization reactions during pyrolysis oil hydrodeoxygenation. AIChE J. 2010, 57, 3160–3170. [Google Scholar] [CrossRef]
  57. Haynes, W.M. CRC Handbook of Chemistry and Physics; CRC Press: New York, NY, USA, 2014. [Google Scholar]
  58. Dean, J.A. Lange’s Handbook of Chemistry, 15th ed.; McGraw-Hill: New York, NY, USA, 1998. [Google Scholar]
  59. Meiboom, S. Nuclear Magnetic Resonance Study of the Proton Transfer in Water. J. Chem. Phys. 1961, 34, 375–388. [Google Scholar] [CrossRef]
  60. Bouxin, F.P.; Zhang, X.; Kings, I.N.; Lee, A.F.; Simmons, M.J.H.; Wilson, K.; Jackson, S.D. Mechanistic Aspects of Hydrodeoxygenation of p-Methylguaiacol over Rh/Silica and Pt/Silica. Org. Process Res. Dev. 2018, 22, 1586–1589. [Google Scholar] [CrossRef]
  61. Schmitt, C.C.; Moreira, R.; Neves, R.C.; Richter, D.; Funke, A.; Raffelt, K.; Grunwaldt, J.-D.; Dahmen, N. From agriculture residue to upgraded product: The thermochemical conversion of sugarcane bagasse for fuel and chemical products. Fuel Process. Technol. 2019, 197, 106199. [Google Scholar] [CrossRef]
  62. Dutta, S.; Bhat, N.S. Catalytic Transformation of Biomass-Derived Furfurals to Cyclopentanones and Their Derivatives: A Review. ACS Omega 2021, 6, 35145–35172. [Google Scholar] [CrossRef]
  63. Girisuta, B.; Janssen, L.P.B.M.; Heeres, H.J. A kinetic study on the decomposition of 5-hydroxymethylfurfural into levulinic acid. Green Chem. 2006, 8, 701–709. [Google Scholar] [CrossRef] [Green Version]
  64. Ren, D.; Song, Z.; Li, L.; Liu, Y.; Jin, F.; Huo, Z. Production of 2,5-hexanedione and 3-methyl-2-cyclopenten-1-one from 5-hydroxymethylfurfural. Green Chem. 2016, 18, 3075–3081. [Google Scholar] [CrossRef]
  65. Li, X.; Wan, W.; Chen, J.G.; Wang, T. Selective Hydrogenation of Biomass-Derived 2(5H)-Furanone to γ-Butyrolactone over Ni-Based Bimetallic Catalysts. ACS Sustain. Chem. Eng. 2018, 6, 16039–16046. [Google Scholar] [CrossRef]
  66. Mukundan, S.; Wahab, A.; Atanda, L.; Konarova, M.; Beltramini, J. Highly active and robust Ni–MoS2supported on mesoporous carbon: A nanocatalyst for hydrodeoxygenation reactions. RSC Adv. 2019, 9, 17194–17202. [Google Scholar] [CrossRef] [Green Version]
  67. Olcese, R.; Bettahar, M.M.; Malaman, B.; Ghanbaja, J.; Tibavizco, L.; Petitjean, D.; Dufour, A. Gas-phase hydrodeoxygenation of guaiacol over iron-based catalysts. Effect of gases composition, iron load and supports (silica and activated carbon). Appl. Catal. B Environ. 2013, 129, 528–538. [Google Scholar] [CrossRef]
  68. Hong, Y.; Zhang, H.; Sun, J.; Ayman, K.M.; Hensley, A.J.R.; Gu, M.; Engelhard, M.H.; McEwen, J.-S.; Wang, Y. Synergistic Catalysis between Pd and Fe in Gas Phase Hydrodeoxygenation of m-Cresol. ACS Catal. 2014, 4, 3335–3345. [Google Scholar] [CrossRef]
  69. Yang, Y.; Tan, M.; Garcia, A.; Zhang, Z.; Lin, J.; Wan, S.; McEwen, J.-S.; Wang, S.; Wang, Y. Controlling the Oxidation State of Fe-Based Catalysts through Nitrogen Doping toward the Hydrodeoxygenation of m-Cresol. ACS Catal. 2020, 10, 7884–7893. [Google Scholar] [CrossRef]
  70. Yang, Y.; Chen, J.; Zhang, L.; Tan, M.; Lin, J.; Wan, S.; Wang, S.; Wang, Y. Enhanced Antioxidation Stability of Iron-Based Catalysts via Surface Decoration with ppm Platinum. ACS Sustain. Chem. Eng. 2018, 6, 14010–14016. [Google Scholar] [CrossRef]
  71. Popov, A.; Kondratieva, E.; Goupil, J.M.; Mariey, L.; Bazin, P.; Gilson, J.-P.; Travert, A.; Maugé, F. Bio-oils Hydrodeoxygenation: Adsorption of Phenolic Molecules on Oxidic Catalyst Supports. J. Phys. Chem. C 2010, 114, 15661–15670. [Google Scholar] [CrossRef]
  72. Ko, E.; Weissman, J. Structures of niobium pentoxide and their implications on chemical behavior. Catal. Today 1990, 8, 27–36. [Google Scholar] [CrossRef]
  73. Munoz, M.; de Pedro, Z.M.; Menendez, N.; Casas, J.A.; Rodriguez, J.J. A ferromagnetic γ-alumina-supported iron catalyst for CWPO. Application to chlorophenols. Appl. Catal. B Environ. 2013, 136–137, 218–224. [Google Scholar] [CrossRef]
Figure 1. Typical reactions taking place in the hydrodeoxygenation. Adapted with permission from [23]. Copyright 2018, copyright Wiley.
Energies 15 04762 g001
Figure 2. Hydrogen consumption and water increase during the bio-crude hydrotreatment on different catalysts.
Energies 15 04762 g002
Figure 3. (a) Total gas production and (b) hydrocarbon production during the bio-crude hydrotreatment on different catalysts.
Energies 15 04762 g003
Figure 4. (a) Upgraded products obtained during the HDO with an active catalyst: upgraded oil, aqueous phase and recovered catalyst together with solid phase. (b) Polymerized product obtained in the absence of an active catalyst.
Energies 15 04762 g004
Figure 5. HDO products and losses observed for the different catalyst tests.
Energies 15 04762 g005
Figure 6. Average molecular weight and polydispersity of upgraded oils in comparison to the feedstock.
Energies 15 04762 g006
Figure 7. Van Krevelen diagram of feedstock and upgraded oils on different catalysts and in the absence of a catalyst (blank).
Energies 15 04762 g007
Figure 8. 1H-NMR integration at different ranges for (a) the upgraded oils and (b) the aqueous phases.
Energies 15 04762 g008
Figure 9. Total amount of representative oxygenated compounds after the upgrading, considering the sum of aqueous phase and upgraded oil, as well as the amount present on feedstock (Pyrolysis oil light phase).
Energies 15 04762 g009
Figure 10. GC-MS: Aqueous phases and feedstock.
Energies 15 04762 g010
Figure 11. GC-MS: Upgraded oil and feedstock.
Energies 15 04762 g011
Figure 12. NH3-TPD—Ammonia temperature programmed desorption of tested catalysts.
Energies 15 04762 g012
Figure 13. XRD-diffractogram of SiO2 and Nb2O5 supports after calcination and of the catalysts Pd/SiO2, Pd/Nb2O5, Pd/1%Fe/Nb2O5 and Pd/8%Fe/Nb2O5 after reduction under H2.
Energies 15 04762 g013
Figure 14. XRD-diffractogram of calcined Nb2O5 support and Pd/8%Fe/Nb2O5 after calcination, after reduction under H2 and after the HDO.
Energies 15 04762 g014
Figure 15. Appearance of synthesized catalysts after calcination (top) and after reduction (bottom). The color change indicates the reduction of hematite (Fe2O3) typically red to Fe and Fe3O4 (grey).
Energies 15 04762 g015
Figure 16. Presence of magnetic properties in the fresh catalyst Pd/8%Fe/Nb2O5.
Energies 15 04762 g016
Table 1. Elemental composition, water content and high heating value (HHV) of the feedstock and the liquid upgraded phases.
C (wt.%)H (wt.%)N (wt.%)O (wt.%)H2O (wt.%)HHV (MJ/kg)
wb.db.wb.db.wb.db.wb.db.wb.wb.db.
Feedstock32.952.88.16.20.10.258.940.737.714.921.6
Upgraded oil
Blank10.0-6.3-0.1-31.1---26.0
Pd/SiO264.2 ± 0.269.0 ± 0.87.2 ± 0.16.9 ± 0.20.1 ± 0.00.1 ± 0.028.6 ± 0.124.0 ± 0.67.0 ± 0.727.9 ± 0.129.7 ± 0.1
Pd/Nb2O561.8 ± 0.267.8 ± 0.17.7 ± 0.17.4 ± 0.10.3 ± 0.00.3 ± 0.030.2 ± 0.124.5 ± 0.28.8 ± 0.327.5 ± 0.129.8 ± 0.2
Pd/1%Fe/Nb2O562.1 ± 0.268.3 ± 0.17.6 ± 0.17.2 ± 0.10.3 ± 0.00.3 ± 0.030.0 ± 0.224.2 ± 0.19.1 ± 0.327.5 ± 0.129.8 ± 0.1
Pd/8%Fe/Nb2O562.8 ± 0.268.7 ± 0.37.9 ± 0.07.5 ± 0.00.3 ± 0.00.3 ± 0.029.0 ± 0.223.4 ± 0.38.6 ± 0.228.2 ± 0.130.5 ± 0.1
Aqueous phase
Blank12.245.59.96.61.76.323.841.673.213.419.3
Pd/SiO213.9 ± 0.848.5 ± 3.19.6 ± 0.05.8 ± 0.00.3 ± 0.01.0 ± 0.076.4 ± 0.944.7 ± 3.171.4 ± 0.18.3 ± 0.419.1 ± 1.4
Pd/Nb2O515.3 ± 0.148.7 ± 0.49.9 ± 0.17.5 ± 0.20.3 ± 0.01.0 ± 0.074.4 ± 0.142.8 ± 0.568.5 ± 0.29.3 ± 0.0121.4 ± 0.3
Pd/1%Fe/Nb2O515.1 ± 0.148.7 ± 0.49.6 ± 0.06.3 ± 0.10.3 ± 0.01.0 ± 0.175.0 ± 0.144.1 ± 0.468.9 ± 0.48.8 ± 0.019.8 ± 0.1
Pd/8%Fe/Nb2O514.9 ± 0.449.5 ± 2.09.9 ± 0.67.1 ± 0.90.3 ± 0.01.0 ± 0.074.9 ± 0.642.4 ± 2.469.8 ± 0.69.1 ± 0.521.2 ± 1.7
wb.: wet basis, db.: dry basis.
Table 2. Integration ranges and respective proton assignments for proton magnetic resonance of pyrolysis oil. Adapted with permission from Joseph et al. [48]. Copyright 2013, copyright ACS.
Integration Range (ppm)Proton Assignments
12.5–11.0carboxylic acids
11.0–8.25-CHO, aromatic OH
8.25–6.0aromatic, conjugated -C=C-
6.0–4.8aliphatic OH, -C=C-, Ar-CH2-O-
4.8–3.0ether, methoxy
3.0–1.8CH2C=O, aliphatics, CH3 of acetic acid, CH2 of propanoic acid
1.8–0.1aliphatic
Table 3. Main compounds identified over GC-MS and their respective retention time.
Retention TimeChemical CompoundRetention TimeChemical Compound
3.3052-furaldehyde7.398maltol
3.3922-methyl-cyclopentanone7.4823-ethyl-2-hydroxy-2-cyclopenten-1-one
3.4142-hydroxyethyl ester acetic acid7.872,4-dimethyl-phenol
3.4673-methyl-cyclopentanone8.6044-methylguaiacol
3.6531-acetyloxy- 2-propanone8.622catechol (1,2-Benzenediol)
4.0574-hydroxy-3-hexanone8.8681,4;3,6-dianhydro-.α.-D-glucopyranose
4.2222-methyl-2-cyclopenten-1-one9.0312,3-anhydro-d-galactosan
4.2811-(2-furanyl)-1-ethanone9.0985-hydroxymethylfuraldehyde
4.3γ-butyrolactone9.1321,6-anhydro-β.-D-glucopyranose
4.3362(5H)-furanone9.3382,3-anhydro-d-mannosan
4.4852,5-hexanedione9.5643-methyl-catechol
4.6572-hydroxyethyl ester propanoic acid9.731hydroquinone (1,4-Benzenediol)
4.685-methyl-2(5H)-furanone9.8654-ethylguaiacol
4.692-ethyl-cyclopentanone9.9734-methyl-catechol
4.842-methyl-cyclohexanone10.7192-methyl-hydroquinone
4.899γ-valerolactone10.866syringol
5.0455-methyl-2-furaldehyde10.965eugenol or vinyl guaiacol
5.0863-methyl-2-cyclopenten-1-one11.0964-propylguaiacol
5.24phenol11.2774-ethylcatechol
5.2823-methyl-2(5H)-furanone11.5473-Hydroxy-4-methoxy-benzaldehyde
5.432-hydroxy-γ-butyrolactone11.652Eugenol
5.5692-hydroxy-cyclohexanone12.1324-Methyl-syringol
5.6272,5-dihydro-3,5-dimethyl-2-furanone12.192Isoeugenol
5.9663,6-heptanedione12.6711-3-hydroxy-4-methoxyphenyl-ethanone (Acetoguaiacone)
6.211propyl-ester acetic acid
6.3184-methyl-2(5H)-furanone13.2241-4-hydroxy-3-methoxyphenyl- 2-propanone (Guaiacyl acetone)
6.4x-cresol (x = o, m, p) (methyl-phenol)
6.5424-oxopentanoic acid13.7681’hydroxy-eugenol
6.711x-cresol (x = o, m, p) (methyl-phenol)13.8631-4-hydroxy-3-methoxyphenyl-1-propanone (Propioguaiacone)
7.016guaiacol (methoxy-phenol)
7.342,5-octanedione
Table 4. Properties of the supports, fresh catalysts and spent catalysts.
Pd (wt.%)Fe (wt.%)C–Coke (wt.%)Surface Area (m2/g)
Support
SiO2---245.1
Nb2O5---25.9
Fresh catalysts
Pd/SiO20.9--220.5
Pd/Nb2O51.0 (1.4 *)--38.8
Pd/1%Fe/Nb2O51.00.9-37.6
Pd/8%Fe/Nb2O51.0 (1.4 *)7.8 (15.2 *)-33.3
Spent catalysts
Pd/SiO20.7-1.7-
Pd/Nb2O50.90.12.8-
Pd/1%Fe/Nb2O50.90.33.0-
Pd/8%Fe/Nb2O51.03.82.6-
(*) Metal loading on the catalyst surface measured by EDS on representative surfaces (1 mm2); - Not measured.
Publisher’s Note: MDPI stays neutral with regard to jurisdictional claims in published maps and institutional affiliations.

