Article

Modeling and Experimental Investigation of the Anode Inlet Relative Humidity Effect on a PEM Fuel Cell

1
School of Mechanical-Electronic and Vehicle Engineering, Beijing University of Civil Engineering and Architecture, Beijing 100044, China
2
State Key Laboratory of Automotive Safety and Energy, Tsinghua University, Beijing 100084, China
3
Singapore Institute of Manufacturing Technology (SIMTech), 73 Nanyang Drive, Singapore 637662, Singapore
4
School of Humanities, Beijing University of Civil Engineering and Architecture, Beijing 100044, China
*
Authors to whom correspondence should be addressed.
Energies 2022, 15(13), 4532; https://doi.org/10.3390/en15134532
Submission received: 10 March 2022 / Revised: 12 June 2022 / Accepted: 14 June 2022 / Published: 21 June 2022
(This article belongs to the Special Issue Design, Testing and Fault Diagnosis for Fuel Cells)

Abstract

:
External humidification has been used as a flexible water management strategy for the proton exchange membrane fuel cell (PEMFC). To study the anode inlet relative humidity (ARH) effect on the performance of PEMFC, the anode inlet water content (AIWC) model is established, including condensation rates and water activity. A comparable analysis between the AIWC model, Fluent model and experiment is conducted at 60 °C operating temperature, four different anode relative humidities (25%, 50%, 75% and 100%), and 100% cathode relative humidity (CRH). The species distributions of water content and hydrogen concentration are presented and analyzed. The results show the relative error of the voltage results derived from the AIWC model has been reduced by 3.2% (the original is 4.6% in the Fluent model) especially at 240 mA·cm−2 for 50% ARH. An increase in hydrogen humidity can improve the PEMFC output at low ARH (25% and 50%). Meanwhile, at high ARH (100%), the excess water produced does not play a positive role. At 50% ARH, the water content and hydrogen distribution are more uniform all over the anode channels.

Graphical Abstract

1. Introduction

Due to the increasingly serious issues of resource scarcity and climate warming, an energy revolution has been established by optimizing energy consumption structure and introducing effective low-carbon technology [1]. Hydrogen fuel, as an alternative energy with short re-fueling time and broad resource, may potentially revolutionize the energy supply chain and decarbonize fuel consumption by a certain hydrogen energy conversion device [2,3]. The proton exchange membrane fuel cell (PEMFC) has been widely used in carrier vehicles for its high energy conversion efficiency, short start-up time, low operating temperature, and quick response to load changes [4,5]. In the PEM fuel cells, hydrogen reacts with oxygen to generate water, heat and electricity. Water management plays an extremely important role in the normal output of a PEM fuel cell [6,7,8,9]. For one thing, hydration of the membrane is required to ensure the proton delivery in the PEM and maintain high levels of the fuel cell performance [10,11]. For another, excessive water generated during the oxygen reduction reaction at cathodes may result in flooding in a fuel cell, eventually impeding the diffusion and flow of reactant gases and increasing the risk of performance degradation (i.e., gas starvation) [7,9]. Proper water content and balanced distribution are important factors to ensure that the PEM fuel cell performs well.
External humidification, a flexible water management strategy, has been adopted to control the relative humidity (RH) of the inlet reactant gases. Several pieces of research have been conducted to study the effect of RH on fuel cell operation. For example, Peng et al. [12] adopted operando µ-Raman spectroscopy to observe the water distribution through AquivionTM and Nafion® membranes based on an operating fuel cell, and they found that the water contents of the membranes increased with the RH increase. Martinez et al. [13] confirmed the dynamic process of water variation inside and outside the PEM in real time. Pineda-Delgado et al. [14] investigated the influence of RH and temperature on the performance of an electrochemical hydrogen compressor working as a PEMFC. They found that low RH and high temperature gave rise to a diminution of the proton conductivity by dehydrating of membrane, thus enhancing the backdiffusion toward the anode. Akhtar et al. [15] concluded that the water transport mechanism is a highly coupled phenomena which interlinks the local distribution of temperature, liquid saturation and the RH. Owejan et al. [16] elucidated the dominant water discharge mechanism by considering capillary and vapor transport at different channel RH. They measured water flux for vapor diffusion and capillary pressure-driven transport by ex situ separate experiments within the MPL and CL. In addition, humidity and local temperature seemed to cause the degradation of PEMFC in the automotive application. Jo et al. [17] used a comprehensive two-phase fuel cell model to investigate the characteristics of low-humidified reactant inlet conditions that are typical of automotive fuel cell operations to simplify the fuel cell system, and they mainly focused on analyzing the water content distribution in the membrane and film formation in the CL. Nandjou et al. [18] conducted the durability tests and found that elevated RH caused the appearance of membrane microcracks, resulting in a sudden loss of the fuel cell’s performance. Askaripour et al. [19] researched the effect of operation conditions on the polarization curves for a PEM fuel cell. They found that the higher operating temperatures reinforce the water vapor content, which correspondingly increased the water activity and water content of the membrane, leading to the membrane conductivity increasing and ohmic loss decreasing. Significantly, RH has an impact on the distributions of water content in the membrane, thereby possibly impacting the MEA parameters, e.g., electrochemical surface area (ECSA), hydrogen crossover, short-circuit resistance and double-layer capacitance. Zhu et al. [20] found that ECSA decreased with the reduction in water content because of ionomer shrink. Ren et al. [21] evaluated the MEA parameters by micro-current excitation and found that the RH affected the anodic hydrogen partial pressure and water content of the membrane, which directly determined the hydrogen crossover rates that describe the diffusion of the hydrogen from the anode to the cathode through the membrane due to the hydrogen concentration gradient.
In the last few decades, many researchers have studied the internal reaction of PEM fuel cells from simulations and experiments. The simulations for the studies of the species movement and distribution were carried out mainly by establishing one-dimensional (1D) to three-dimensional (3D) mathematical models. Song et al. [22] developed a 1D non-isothermal transient model to study the transient behavior of water transport in the GDL. They found that increasing gas phase pressure, water vapor and oxygen concentration would increase the water saturation at the interface of the CL and GDL, but these decrease the time needed for the liquid water saturation to reach steady state. For 2D mathematical models, He et al. [23] developed a two-phase, multicomponent transport model to investigate the effects of gas and liquid water hydrodynamics on the PEMFC performance by considering Darcy’s law and liquid water transport mechanism with the shear force of gas flow and capillary force included. Wang et al. [24] defined a comprehensive model for both single-phase analysis at low current densities and two-phase calculation at high current densities, which can predict PEMFC performance accurately and ensure the smooth transition from the single-phase to two-phase region automatically. For 3D mathematical models, Sahraoui et al. [25] established a two-phase flow model to explore the material transport phenomena of fuel cells. Furthermore, the influences of anode and cathode RH were taken into consideration in the model. Hao et al. [26] performed 3D computations and experimental comparisons for a large-scale PEMFC, and they further demonstrated quantitative comparisons of liquid water distribution in the fuel cell with neutron imaging measurements. Falcão et al. [27] carried out 1D and 3D numerical simulations to research the roles of the water content on a PEM fuel cell performance. They concluded that the 1D model should be established to predict water management impacts on the fuel cell’s performance, and the calculation speed of the 1D model was much faster than that of the 3D model under optimal operating conditions. Pasaogullari et al. [28] developed a multidimensional two-phase model based on the liquid water transport through the hydrophobic GDL. By comparing the single-phase predictions of the polarization curves at different inlet RH, they found that two-phase transport phenomena and water flooding lowered PEMFC performance, which was mainly because of the reduced gas transport and active catalytic area. Arama et al. [29] developed a semi-experimental mathematical model of a PEMFC to evaluate water activity under different operating conditions, and then, they predicted variations of behavior responding to load demand and water flow rates in fuel cells.
For the relative humidity research, phase transition would be an important issue, which lies in the determination of operation condition at local places. As we know, the vaporization and condensation occurs anywhere in the fuel cell, which is influenced by many variables, such as temperature, pressure and pore structure. Compared with temperature, the local pressure changes dramatically due to consumption and friction. In previous CFD simulations, the internal pressure at each point was analyzed for the meshed grids one by one. Each mesh needed to be calculated and solved using Navier–Stokes equations [9]. Therefore, a continuous iterative calculation process may increase the risk of error amplification. Most importantly, the calculated local pressure is hard to validate. Thus, the calculation of evaporation and condensation are affected greatly. For the purpose of rapid calculation and relatively accurate determination of the phase transition to achieve a more accurate model, the local pressure could be determined in terms of semi-empirical pressure drop formula involving the condition parameters. For example, Pei et al. [30] performed a frictional pressure loss formula that was related to mixture viscosity, operating temperature, operating pressure, stoichiometric ratio and current. In our previous study [31], a water condensation rate model of PEMFC is established based on the conditions of the water–gas interface, considering the effect of the evaporation condensation ratio and the pressure drop on water content. We investigated the effect of local water behaviors on PEMFC performance at different operating pressures.
In this study, experiments and simulations are presented to investigate the anode inlet relative humidity effect on a PEM fuel cell. A comprehensive 3D mathematical model is established based on electrochemical, species transport, and conservation equations. The phase change of evaporation and condensation are considered into the new model, namely the anode inlet water content (AIWC) model. This model introduces a semi-empirical two-phase-flow pressure drop formula proposed by Pei et al. [30]; thus, the problems of calculation error caused by unknown parameters and error magnification can be solved. Meanwhile, the experiment is conducted at operating temperature of 60 °C, 0.1 MPa, and different relative humidities (25%, 50%, 75% and 100%) for the anode side and full humidity for the cathode side. The species distribution contours are presented and analyzed. Finally, the AIWC simulation and experimental results are used to evaluate the effects of water content on a PEM fuel cell performance.

2. Model Establishment

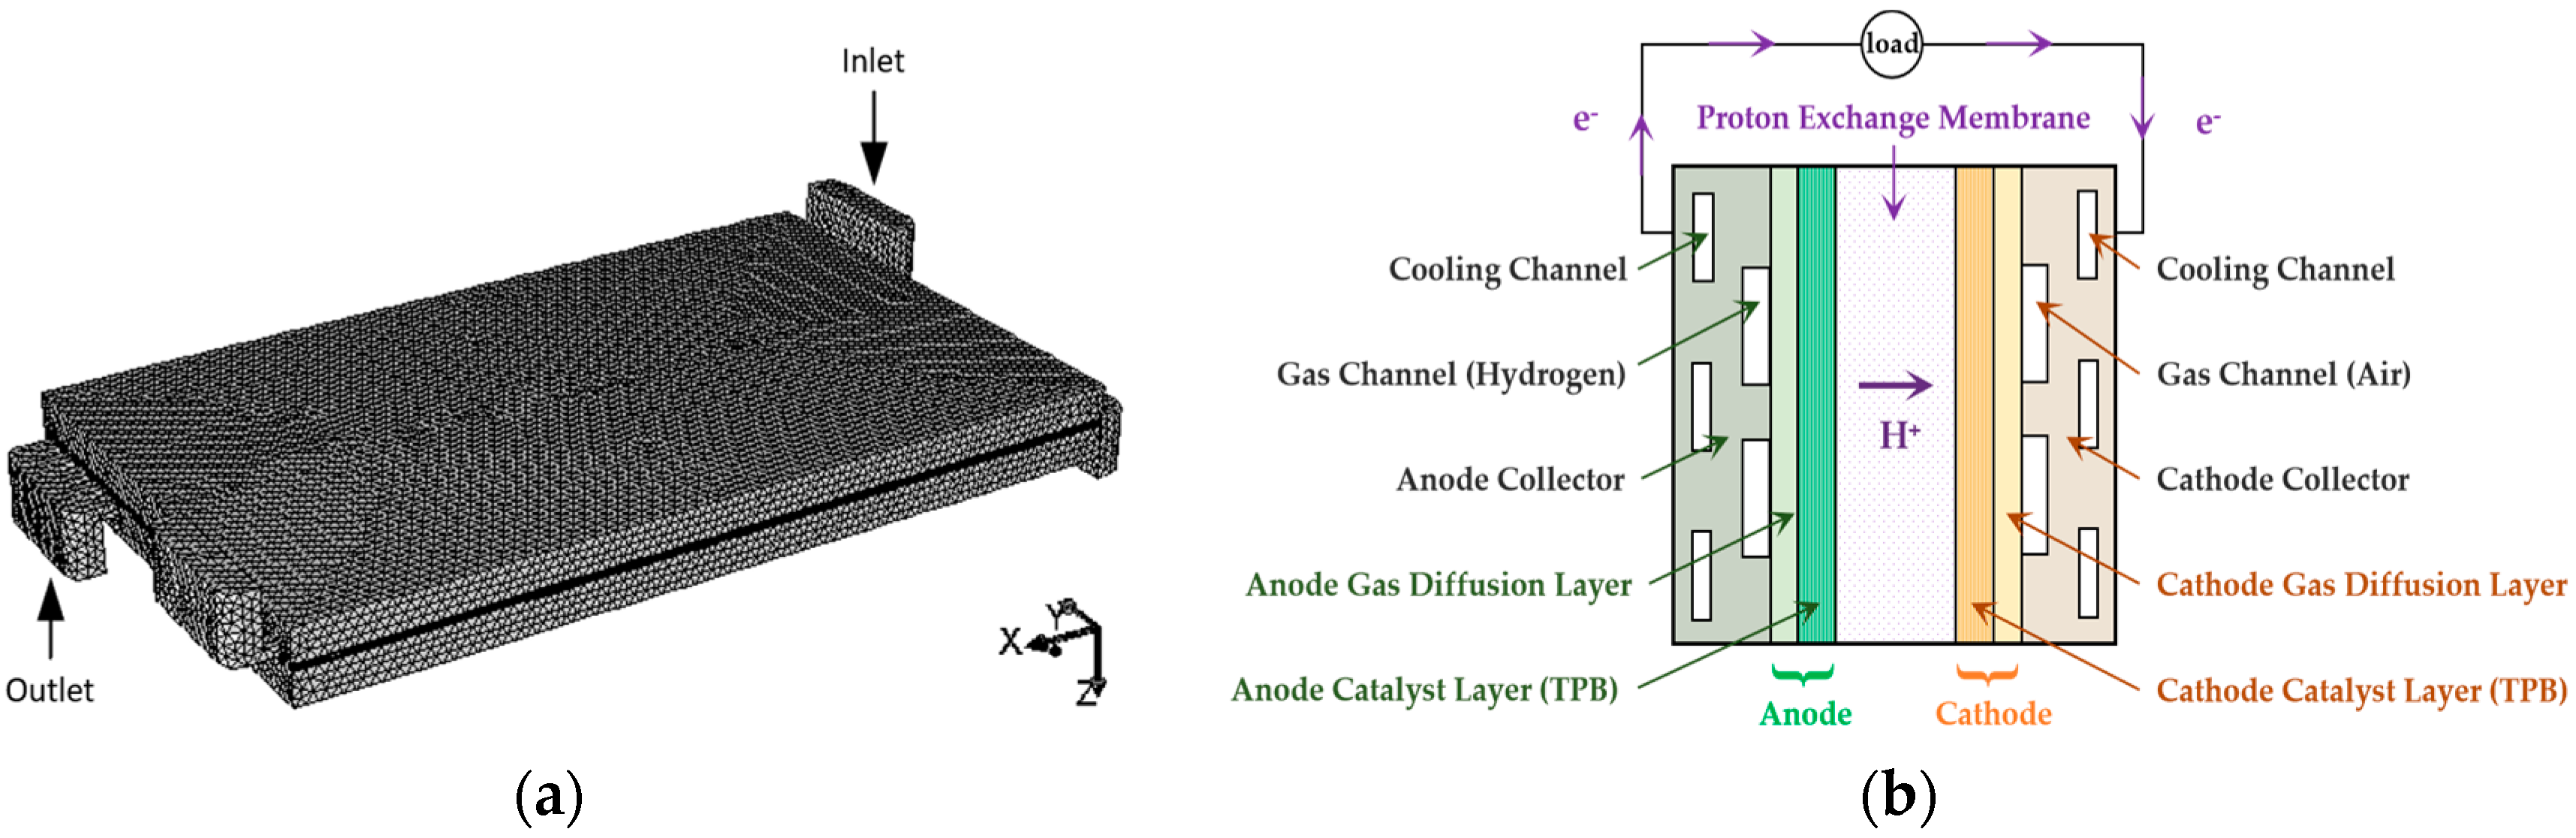
2.1. Model Computational Domain

A three-dimensional steady-state model of a 3D PEMFC with parallel flow channel and water-cooled form is considered. Figure 1 displays the messing employed for the computational domain and the geometry configuration established for a standard PEMFC with all major components, i.e., a proton exchange membrane (PEM), catalyst layers (CLs), gas diffusion layers (GDLs), anode/cathode gas channels, and anode/cathode current collectors.
As shown in Table 1, the size of the simulation geometry model is based on the actual size of the experimental PEM fuel cell. Table 2 lists the number and type of messing employed for the geometry model. The PEM fuel cell mesh contains 3,307,609 elements, and the type of element is Hex/Hybrid.

2.2. Governing Equations

The main process in a PEMFC is the electrochemical reaction, which is driven by the presence of surface overpotential. Therefore, two potential energy equations are used to solve it. Equation (1) represents the process by which hydrogen molecules lose electrons and oxidize to hydrogen ions. Equation (2) accounts for the progress that oxygen molecules obtain electrons and react with protons.
Reaction equation of hydrogen in the anode:
H 2 2 H + + 2 e
Reaction equation of oxygen in the cathode:
1 2 O 2 + 2 H + + 2 e H 2 O
Overall electrochemical reaction equation:
H 2 + 1 2 O 2 H 2 O
The PEMFC simulation model is based on the electrochemistry reaction, charge transfer (i.e., electrons and protons), water formation and transportation equations mentioned above. Essential conservation laws of mass, momentum, energy and reaction species are included. Meanwhile, major assumptions employed in this model for the governing equations are described as below:
(1)
The simulation model for a PEMFC is a non-isothermal steady state model.
(2)
The flow in parallel flow channel is laminar flow due to the low Reynolds number.
(3)
The reactant gas in the fuel cell is regarded as an incompressible ideal gas, which follows the ideal gas law.
(4)
The proton exchange membrane, catalytic layer, micro-porous layer, and gas diffusion layer are a homogeneous porous structure.
Based on the description of the model, the detailed governing equations and associated source terms are simply expressed as follows [32,33]:
Mass conservation:
( ε ρ ) t + ( ε ρ u ) = S m
ρ = Y i ρ i
where ε is the porosity of electrodes, ρ is the density of gas mixture (kg m3), and u is the velocity vector (m s−1). Here, Y i and ρ i stand for the mass fraction of i species and density of i species (kg m3). Sm is the mass source term obtained from Equation (4). In this paper, the gas species of H2, O2 and H2O are considered.
S m = { S an = S H 2 ( anode ) S cat = S O 2 + S H 2 O ( cathode )
Momentum conservation:
( ε ρ u ) t + ( ε ρ u u ) = ( ε μ u ) ε p + S u
μ = Y i μ i
where p is the pressure (kPa). μ represents the viscosity of the fluid calculated by the mass averaged value (Pa s) [34], μi stands for the dynamic viscosity of i species (Pa s), and Su is a momentum source term.
For PEMFC, additional momentum sources are various at different layers. For gas channels, Su is set to be zero. For backing layers and voids of the CLs, it can be expressed as:
S u = ε 2 μ K u
where K is the permeability of porous media (m2).
Energy conservation:
The general energy conservation equation can be given by:
( ε ρ c p T ) t + ( ε ρ c p u T ) = ( k eff T ) + S T
c p = Y i ( c p ) i
where T is the temperature (K), cp is the specific heat capacity of gas mixture (J kg−1 K−1), (cp)i stands for the heat capacity of i species (Pa s), keff is the effective thermal conductivity (W m−1 K−1). ST is an energy source term derived from the heat generated by the ohmic thermal effect and the electrochemical reaction.
Owing to irreversible processes, the released chemical energy cannot transform into electrical work completely. An additional energy source ST is expressed as below:
S T = I 2 R ohm + J an ,   cat η an ,   cat + H react + H phase
H react = ( H ) H 2 O ( H ) H 2 0.5 ( H ) O 2
H phase = H g ( T sat ) H l ( T sat )
where I is the surface current density (A m−2), Rohm is the specific resistance (Ώ m) consisting of electronic resistance in the electron conducting materials and ionic resistance to proton transfer in the membrane, Jan,cat is the volumetric exchange current density (A m3), and ηan,cat is the overpotential in the anode or cathode triple-phase boundary (V). Hreact stands for the enthalpy change of the electrochemical reaction (J s−1 m−3). Hphase represents the enthalpy change due to the phase change of H2O (J s1 m3). Hg is the specific enthalpy of the steam (J s1 m3), Hl is the specific enthalpy of the droplet (J s1 m3), and Tsat is the saturation temperature. Jan,cat and ηan, cat are given in equations as follows.
Species conservation:
The transport and conservation of each species is described by:
( ε ρ Y i ) t + ( ε ρ u Y i ) = ( ρ D i eff Y i ) + S i
where Dieff stands for the effective diffusivity of each species i (m2 s1). Si is the source term for species i.
Generally, Si is equal to zero in the membrane, GDLs and gas flow channels. In the CLs, the volumetric source term of species is, respectively, expressed as follows:
S i = { S H 2 = M H 2 2 F J an S O 2 = M O 2 4 F J cat S H 2 O = M H 2 O 2 F J cat  
where F is the Faraday constant (C kmol−1) and M H 2 , M O 2 and M H 2 O are the molecular weights of H2, O2, and H2O (kg mol−1), respectively.
Charge conservation:
The electrons transport through the CLs, GDLs and current collectors, and protons transport through the membrane phase. So, the potential equation accounts for the electron transport through the solid conductive materials (e.g., current collectors and solid grids of the porous media). The other potential equation stands for the protonic conductive phase (i.e., the membrane and ionic phase in the CLs).
( σ e φ e ) + S e = 0
( σ ion φ ion ) + S ion = 0
where σ is the electrical conductivity (S m−1), and φ is the electric potential (V). The subscript character “e” represents the solid phase for electron conducting, and “ion” represents the membrane phase for ion conducting, respectively. Se and Sion stand for the charge generation rate in the electron-conducting phase and proton-conducting phase.
For the electron-conducting phase, Se is equal to zero in the GDLs and current collectors. In the CLs, Se can be given by:
S e = { J an ( anode ) J cat ( cathode )
For the proton-conducting phase, Sion is equal to zero in the membrane, as there is no charge generation in the membrane. In the CLs, Sion can be given by:
S ion = { J an   ( anode ) J cat ( cathode )
Herein, J is the volumetric transfer current density for anode and cathode reactions (A m−3) [35]. It should be noted that the equation here is a simple Bernardi–Verbrugge formulation, neglecting the concentration dependence and thermodynamic consistency of the electrode kinetics, not a standard Butler–Volmer equation. In response to this issue, Dickinson et al. [36] probed into the PEMFC simulations using various possible kinetic treatments, providing a critical discussion of the Butler–Volmer equation for PEMFC electrode kinetics.
J an = ( ς an j an ref ) ( [ A ] [ A ] ref ) γ an ( e α an an F η an R T e α cat an F η an R T )
J cat = ( ς cat j cat ref ) ( [ C ] [ C ] ref ) γ cat ( e α an cat F η cat R T e α cat cat F η cat R T )
where ς is the specific active surface area (1 m−1), jref is the reference exchange current density per active surface area (A m−2), [ A ] and [ C ] are the local species concentrations (kmol m−3), and [ A ]ref and [ C ]ref are the reference molar concentrations (kmol m−3). γ represents the concentration dependence, α an an and α cat an represent anode and cathode transfer coefficients for the anode electrode, α an cat and α cat cat represent anode and cathode transfer coefficients for the cathode electrode, ηan and ηcat are the anode and cathode overpotentials (V), which are given in equations as follows.
η an = φ e φ ion
η cat = φ e φ ion V o
where Vo is the open-circuit voltage (V).
Source terms:
Sm, Su, ST and Si are source terms for mass, momentum, energy, and species conservation, which have been explained in the above equations.

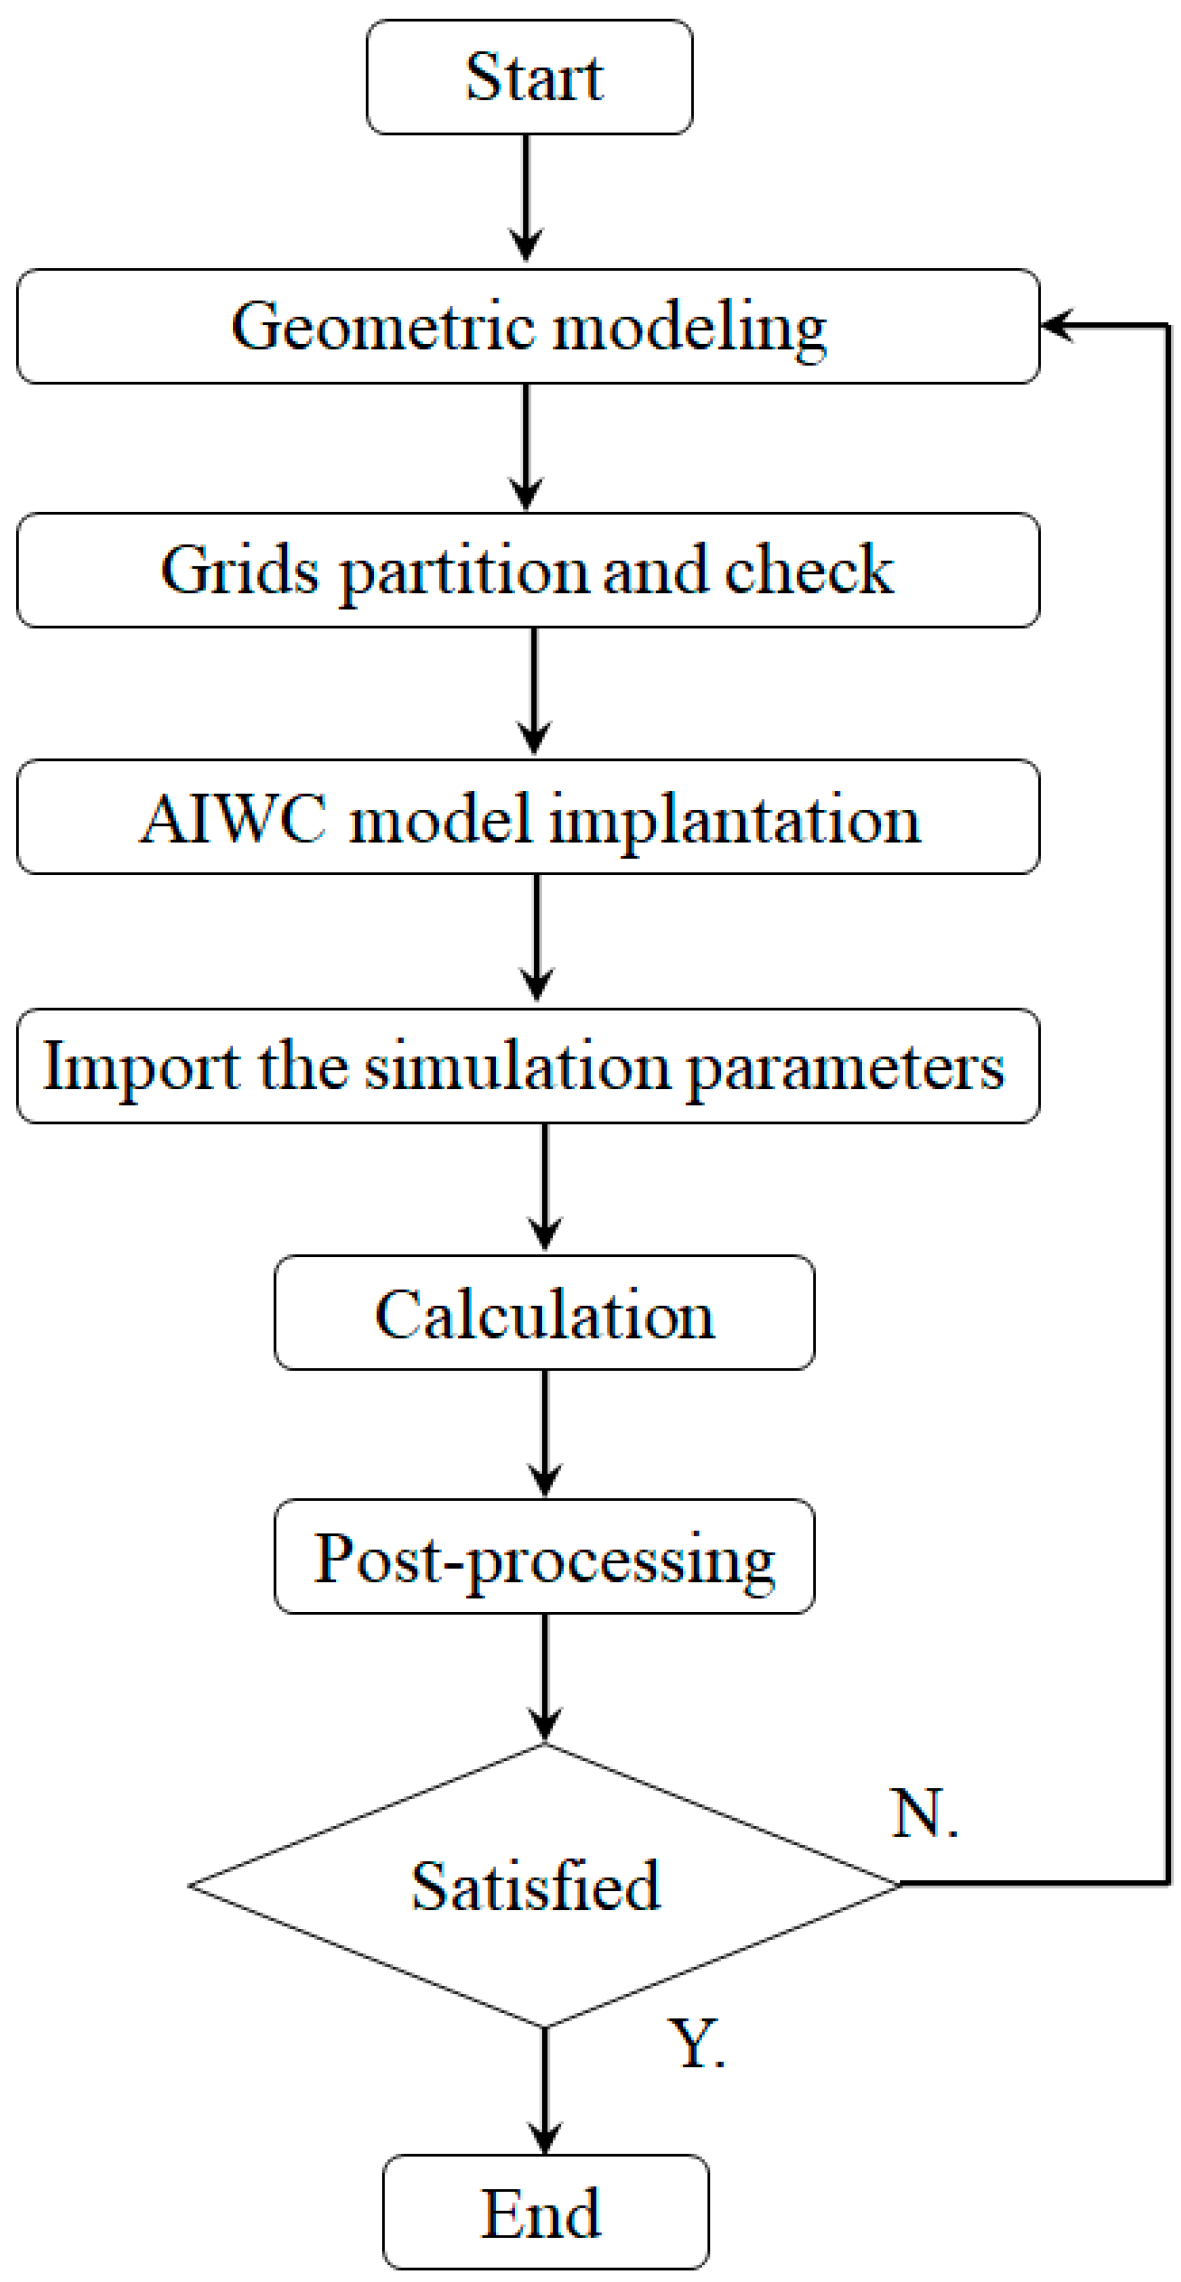
2.3. Anode Inlet Water Content (AIWC) Model Development

The relative humidities of anode inlet gas are defined as:
R H ( % ) = P wv P sat × 100 %
where Pwv is the water vapor partial pressure (kPa) in the anode stream, and Psat is the saturated water vapor pressure (kPa) at a certain temperature, which can be calculated by:
log 10 ( P sat ) = 2.1794 + 0.02953 ( T 273.17 ) 9.1837 × 10 5 ( T 273.17 ) 2 + 1.4454 × 10 7 ( T 273.17 ) 3
where T is the temperature of the PEMFC (K).
As PEM fuel cells operate at temperatures below 100 degrees Celsius, water vapor exists in the channel or GDL may transform into the liquid phase, especially at high current densities. The formation and transport of water in gas and liquid should be considered in the model. For better understanding the role of water behavior, the AIWC model was compared with the default Fluent model based on the ANSYS Fluent® 15.0 PEM Fuel Cell Module. The corresponding equations and used parameters can be found in the ANSYS Fluent manual [37] and related literature [27,32,38].
According to the ANSYS Fluent® manual, the Fluent default PEMFC model employs a saturation model. Details of the implementation and corresponding conservations for water saturation can be found in [27,32]. Carton et al. [33] compared the Fluent model and experimental results, and they found that the Fluent default model cannot predict the polarization curves for PEMFC accurately. One of the reasons would be an improper consideration of phase transition resulted from the inaccurate estimation of local parameter, such as pressure, especially at the complicated two-phase-flow scenario.
Based on the fact that the condensation and evaporation of water occurs in the whole channel, the rates of water condensation and evaporation are related to local conditions in the channel, such as local pressure, pore structure and water–gas interface. The local pressure will be determined by a semi-empirical and relatively accurate pressure drop, which considers the two-phase-flow. Gas species flowing through the flow field experiences pressure loss, i.e., frictional loss and discrete loss. Pei et al. [30] reported that as liquid water condensed in the anode channels, the pressure drop of hydrogen increased obviously. Therefore, pressure drop has an impact on the water content in channels. According to the experimental verification and theoretical derivation, the pressure drop Δ Pf along the anode channels can be defined as
Δ P f = 1.1748 × 10 9 ( C w + C d ) 2 L e T 275.7 T n ( C w C d ) 3 ( P in P sat ) P 0.0263 ( λ H 2 0.5 ) I   ( 313   K T 373   K )
where Δ P f is the pressure drop of the anode (kPa), Cw is the width of the flow channels (m), Cd is the depth of the flow channels (m), L and n are the length (m) and number of flow channels, λ H 2 is the excess coefficient of hydrogen, and I is the total current (A).
The pressure at a local position in the flow channel can be denoted as:
P = P in Δ P f
The water vapor pressure is calculated based upon the vapor molar fraction and the total pressure:
P wv = x H 2 O P
Therefore, a volumetric condensation/evaporation rate at local positions can be redefined as:
R cond / evap = ( P wv P sat ) h pc
where R cond / evap is the volumetric water condensation rate in a local position (g s−1 m−3), and hpc is the condensation/evaporation parameter, which is determined as:
h pc = k c ε ( 1 s ) x H 2 O 2 R T [ 1 + | P wv P sat | P wv P sat ] + k e ε s ρ H 2 O 2 M H 2 O [ 1 | P wv P sat | P wv P sat ]
kc and ke are the condensation and evaporation rate coefficients, s is the liquid water saturation, and ρ H 2 O is the liquid water density (g m−3).
The ion conductivity in the membrane phase is described by [38]:
σ ion = ( 0.514 λ 0.326 ) e 1268 ( 1 303 1 T )
The osmotic drag coefficient nd is governed by:
n d = 2.5 λ 22
The backdiffusion flux J d and membrane water diffusivity D ( λ ) (m2 s1) are given by:
J d = ρ m M m M H 2 O D ( λ ) λ
D ( λ ) = f ( λ ) e 2416 ( 1 303 1 T )
where λ represents the water content and ρm is the density of the membrane (kg m3). M m is the membrane equivalent weight (kg mol1).
f ( λ ) = { 3.10 × 10 7 λ ( e 0.28 λ 1 ) e 2346 / T   0 < λ < 3 4.17 × 10 8 λ ( 1 + 161 e λ ) e 2346 / T   other
λ = { 0.043 + 17.18 a 39.85 a 2 + 36 a 3   0 < a < 1 1.4 + 1.4 ( a 1 )   1 < a < 3
where a represents the water content, which is defined as:
a = P wv P sat + 2 s
Liquid water saturation s, i.e., the volume fraction of liquid water-filled pores in this model, is calculated as [8]:
s = C H 2 O C sat ρ H 2 O M H 2 O C sat
where C H 2 O is the vapour/liquid water concentrantion (kmol m−3), C sat is the saturation water concentrantions (kmol m−3) based on saturation pressure of water by ideal gas law.

2.4. Model Parameters and Boundary Conditions
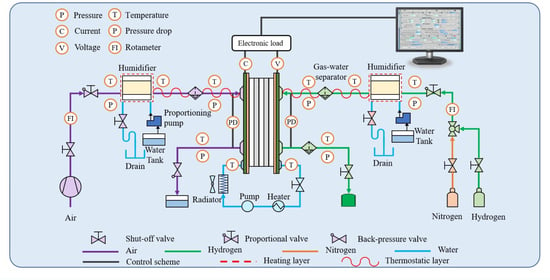
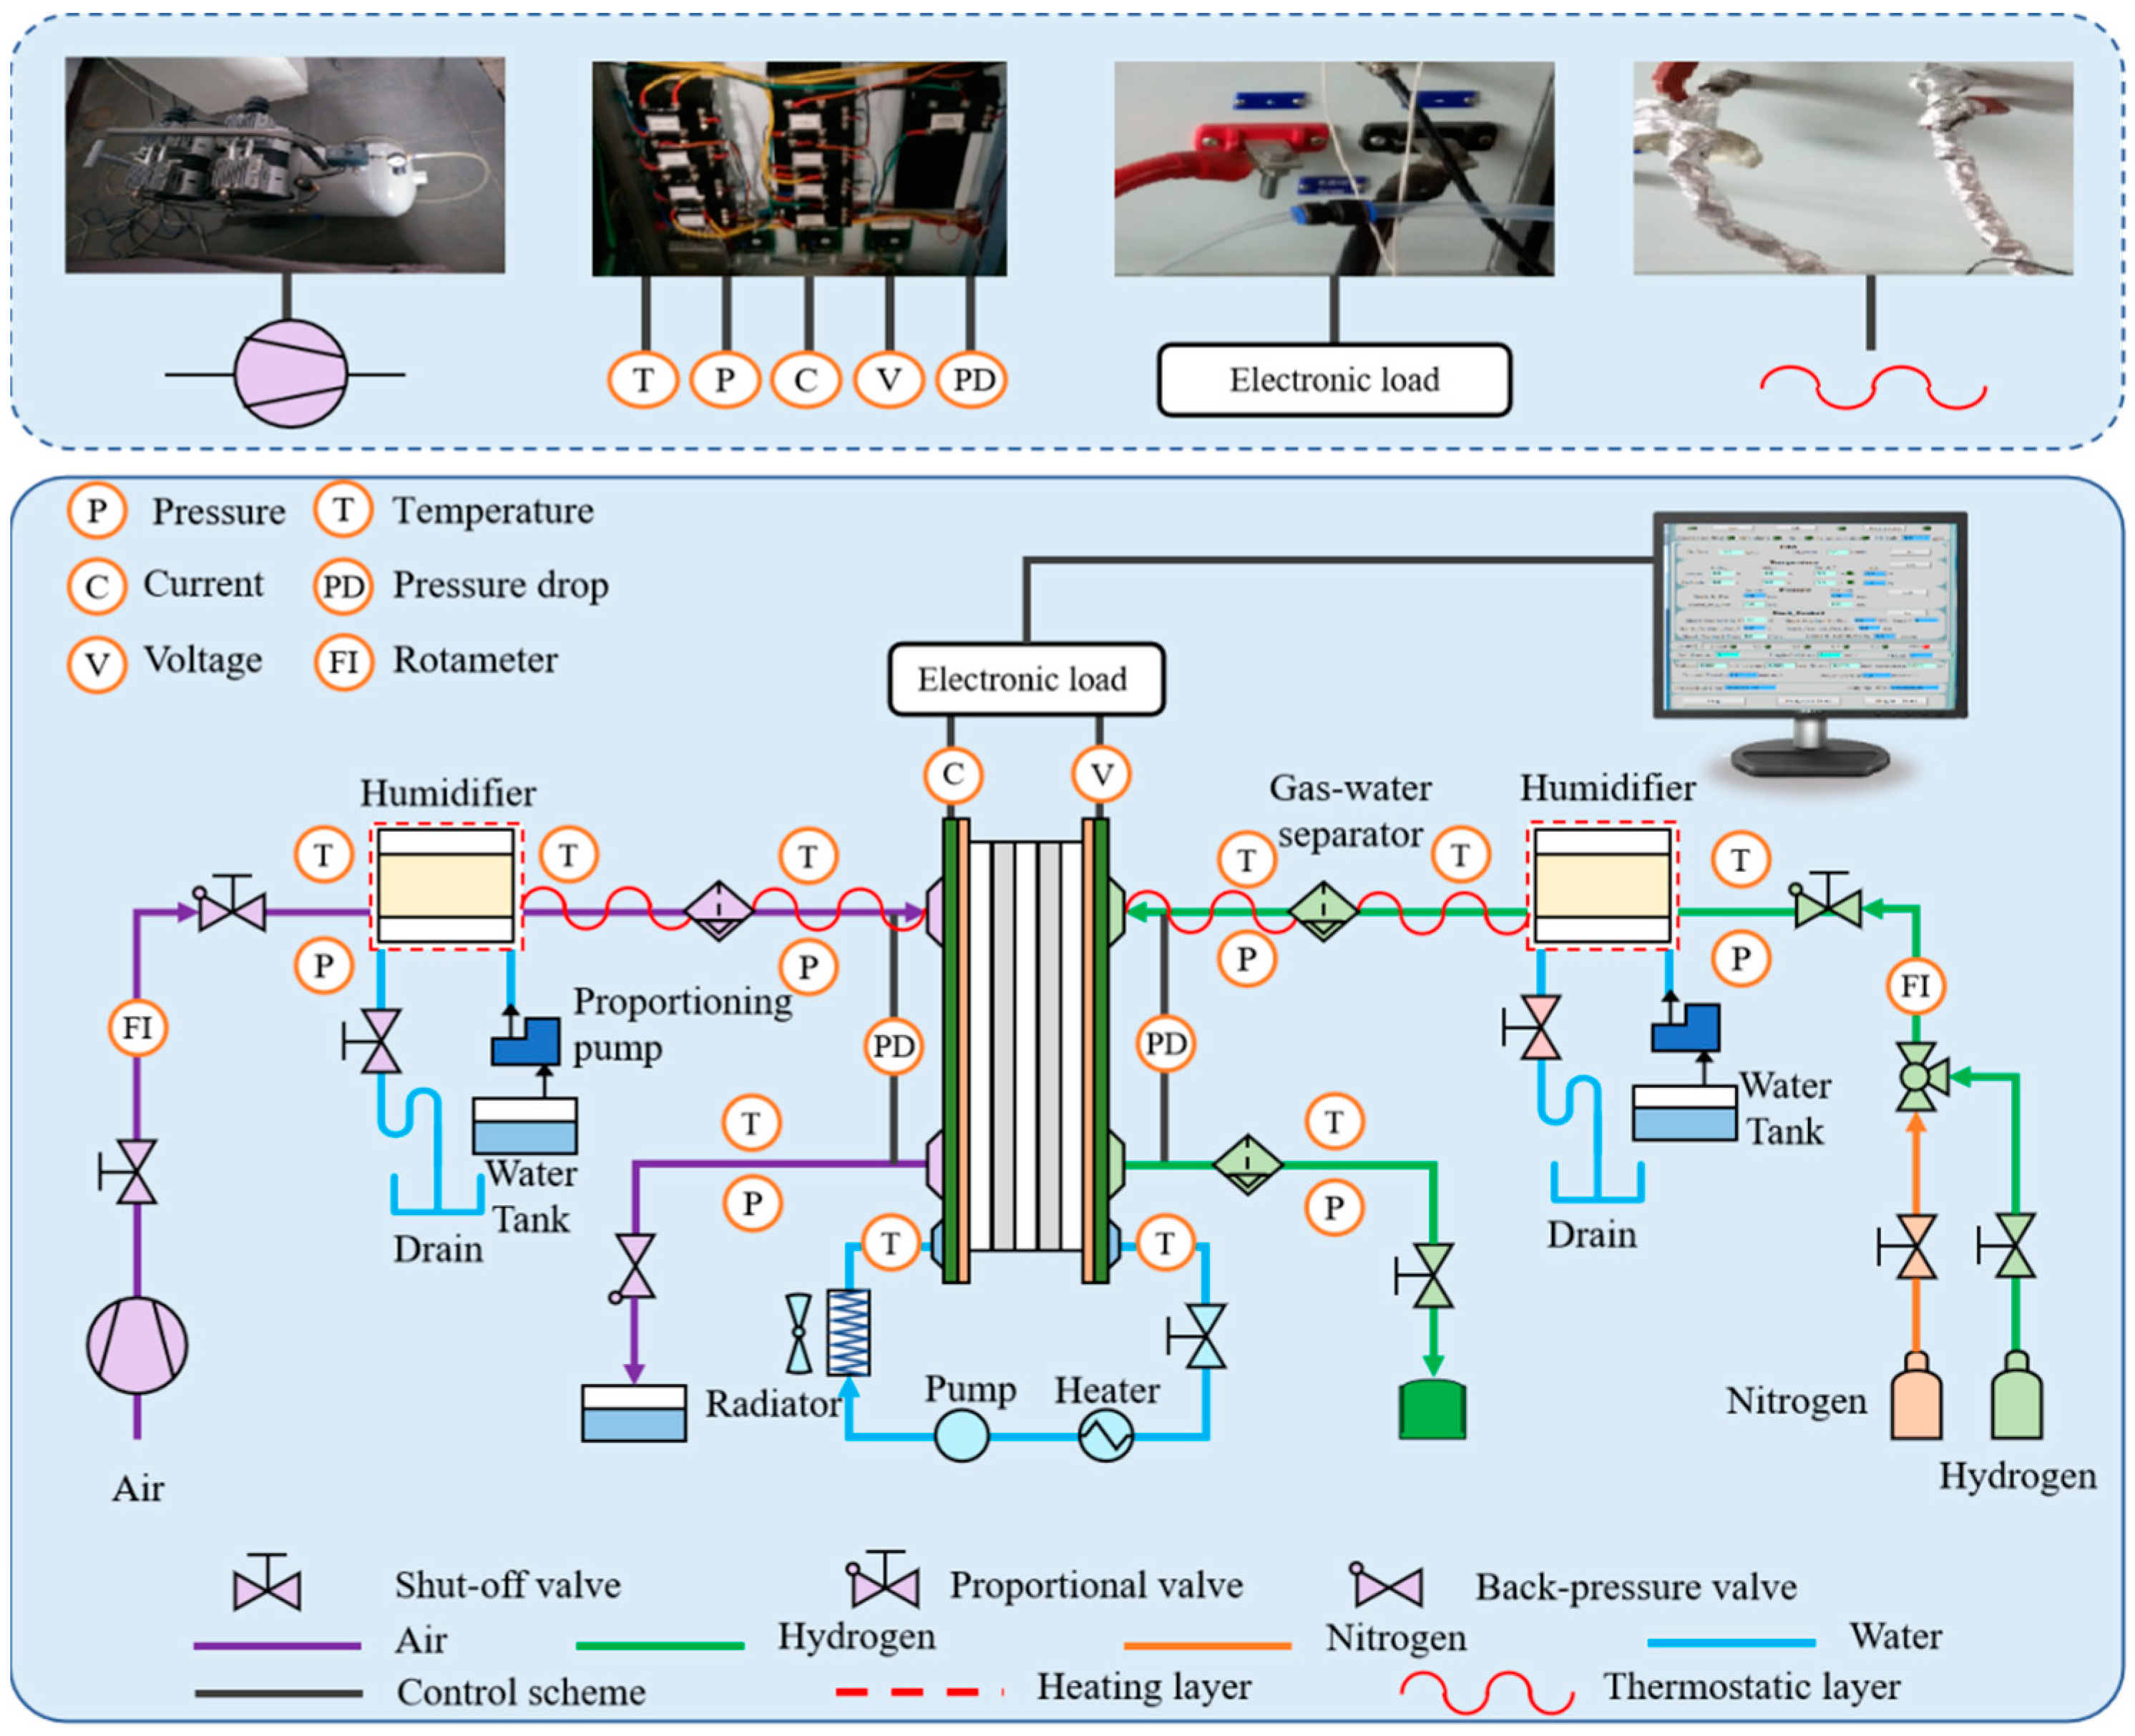
A schematic diagram of the simulation is shown in Figure 2, which requires GAMBIT software to build the 3D PEM fuel cell geometry. After partitioning the mesh, the quality of the mesh needs to be detected. Subsequently, the AIWC model is imported into Fluent, and the operational parameters for the simulation process are imported into the AIWC model. Finally, CFD files are imported into Fluent to set up the AIWC model, and the species distribution contours are obtained by postprocessing the simulation results. A detailed definition of the parameters is provided in Table 3. It is worth noting that the operation parameters are set identical for the Fluent default model and the AIWC model simulation that follows, since the main focus is the effect of phase transition behavior and pressure drop on the performance. The coupling process of components in the 3D PEM fuel cell is consistent; only the operating parameters (i.e., pressure, etc.) are different along the channels.
Boundary conditions are defined according to the actual state of fuel cells. At the inlet zones of the flow channels, the boundary types are specified as “mass-flow inlet”, and the mass flow rates of air and hydrogen are given according to the conditions of the reactant gases. At the outlet zones of the flow channels, the boundary types are specified as “pressure outlet”. The surfaces of the gas channels are specified as “wall”. A no-slip boundary condition is applied to the cell and manifolds walls. As no protonic leaves the PEMFC through the external boundary, the proton phase potential φion is set as the zero flux boundary for all outside boundaries. For the electron phase potential, φe is set to zero on the anode external contact boundary, whereas on the cathode end surface, it is set to the requested cell voltage. The inlet temperature is specified as the internal surface temperature of the fuel cells. The relative humidity of hydrogen at the anode inlet is set to 25%, 50%, 75% and 100%, assuming no liquid droplets formation in the flow.

3. Experiment

3.1. Apparatus and Schematic

A schematic diagram of the experimental setup is shown in Figure 3, which consists of fuel cells, the control system, and an auxiliary system. The control system includes the pressure pickup, electronic flowmeter, temperature sensor, hygrometer, and electrical valve. Furthermore, the control system adopts the Ethernet connection mode to connect the computer with all the controlled electronic components. The auxiliary system generally includes the temperature control system, hydrogen and air supply systems. When the gas is not humidified, the air is collected by the air pump and subsequently fed into the fuel cell under the monitoring of various sensors. In the same way, hydrogen is released from the hydrogen storage tank and then fully reacts with the air under a series of parameter monitoring. When the gas needs to be humidified or changed the relative humidity, the valve leading to the humidifier line is opened.
The humidifier ensures that the gas carries sufficient water content by spraying and bubbling. It is possible to obtain a controllable and easily measurable relative humidity value by controlling the dew point temperature. In addition, the temperature control system maintains the temperature of the fuel cell by a water-cooling and heating device. Furthermore, the water storage device includes a water tank and a water pump to ensure the continuous operation of the water cycle. To control operation parameters, e.g., the operating temperature and relative humidity of the inlet gases, the computer is connected with pressure pickups, temperature sensors, hygrometers and a temperature control system.

3.2. Experimental Conditions

The experimental analysis was carried out on a commercial single-cell PEM FC (WUT New Energy Co. Ltd., Wuhan, China) with Nafion® 212 membrane in the thickness of 50 µm, and catalyst loadings of 0.1 mg cm−2 and 0.3 mg cm−2 for the anode and cathode are adopted. Other detailed parameters of the single cell are shown in Table 4.
In this experiment, a 1000 W fuel cell test station (NBT-1000 W, BaiTe Technology, Ningbo, China) was used to set and record operation parameters. Reaction gases were supplied by a hydrogen cylinder and air compressor through respective intake devices, and inlet pressure was controlled at 0.1 MPa. The inlet flow rates for the anode and cathode were 2 L min−1 and 5 L min−1. The operating temperature of the single cell was maintained at 60 °C. Dew point humidifying was conducted by adjusting the humidified temperature. For the anode, the stoichiometry of hydrogen was 1.5. For the cathode, fully humidified air was fed to the cell, and the stoichiometry was 2.0.
The single cell performance was tested by measuring the I-V and I-P curves scanned with the NBT 1000 W fuel cell test system. In addition, an electronic load (H&H ZS) was used to consume the output of the single cell and control the load changing processes. The current controllable range was 0–200 A, and the current density was 0–400 mA cm−2. The PEM fuel cell voltage changes were observed through current density change, which uses the current as an input variable.

4. Results and Discussion

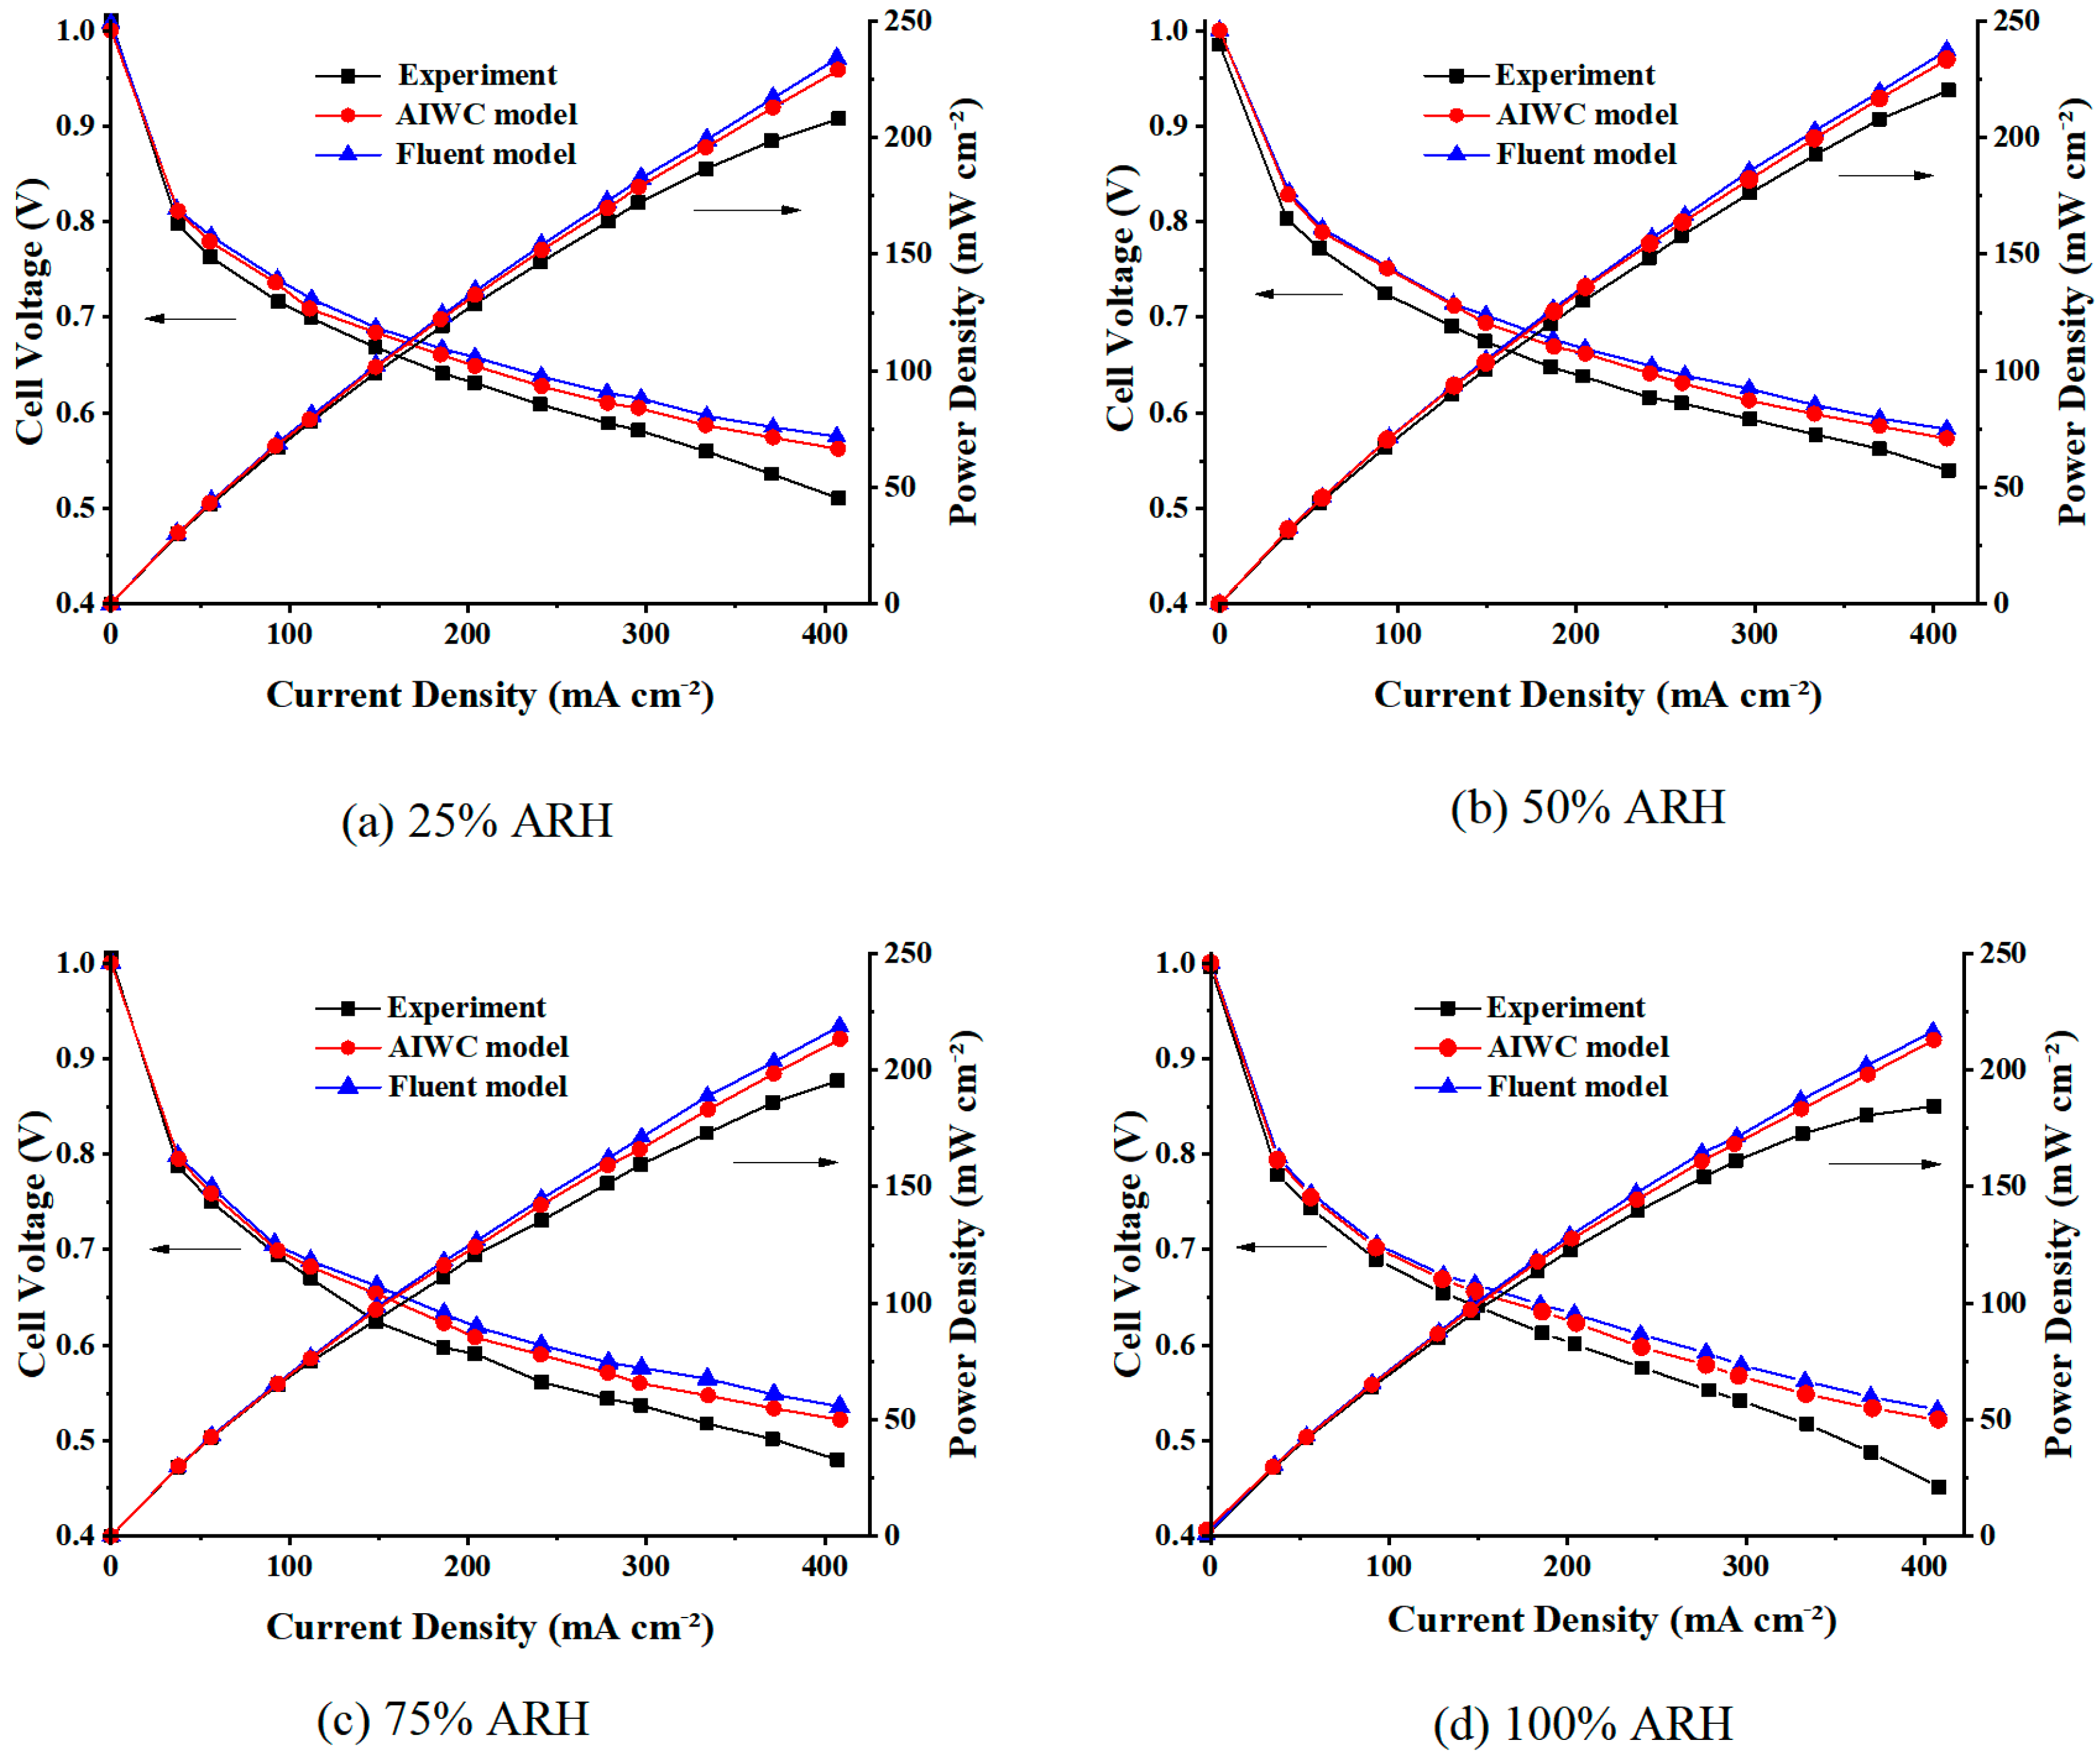
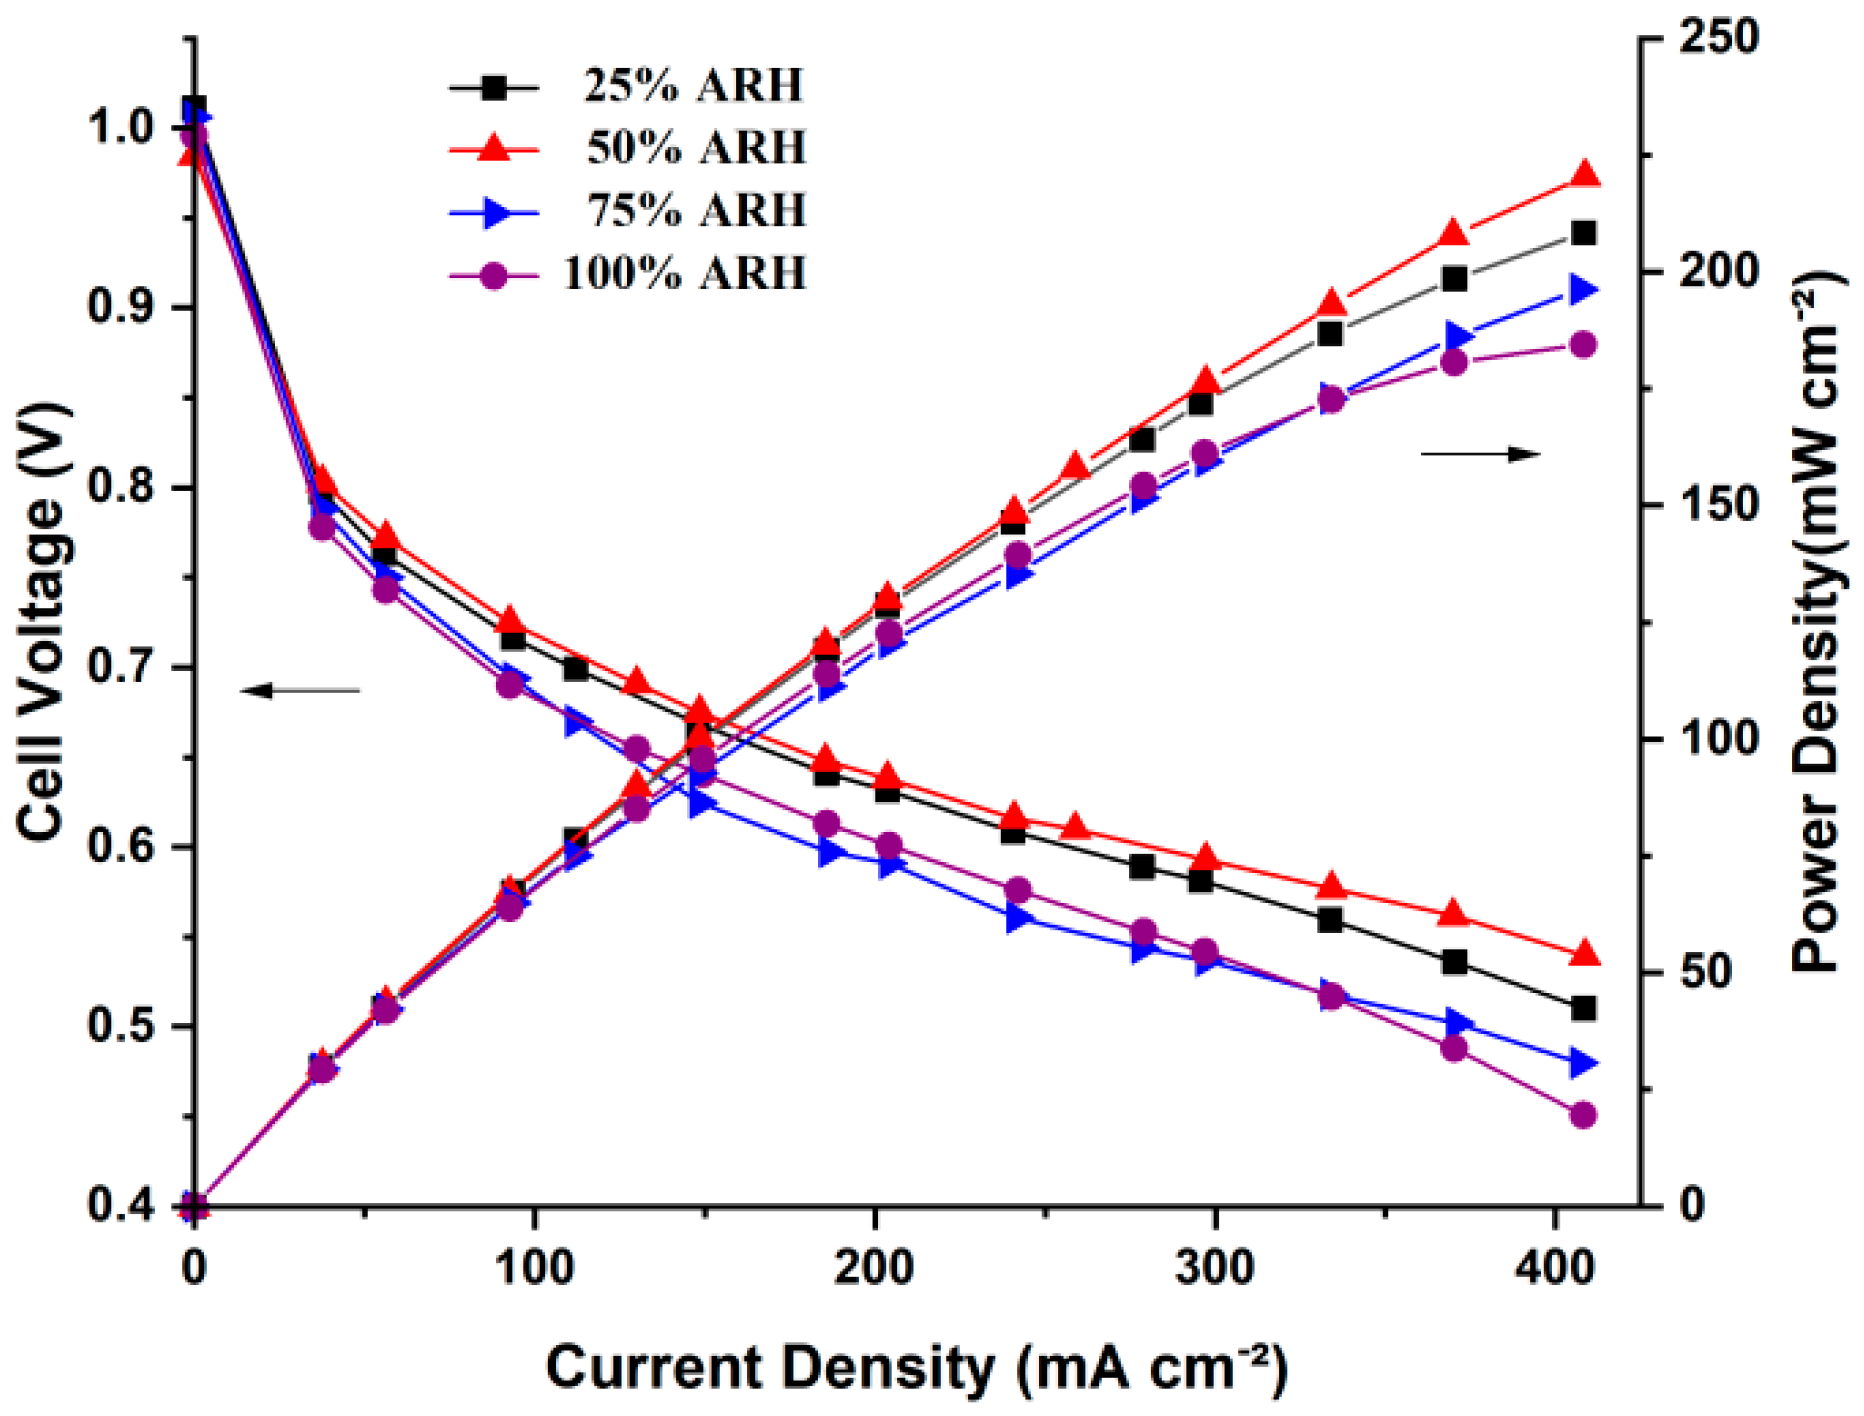
4.1. Polarization Curves

The experiment, AIWC model and Fluent model are compared in Figure 4. The Fluent model is the default model for simulating fuel cell reactions in Fluent software.
Figure 4a depicts polarization curves of the AIWC model, Fluent model and experimental data for the PEM fuel cell; the relative humidity of the anode and cathode are set as 25% and 100%, and the cell operating temperature and pressure are set as 60 °C and 0.1 MPa. The trend of the polarization curve can be divided into two stages. Voltage drops sharply in the activation polarization stage (0–50 mA cm−2), and the voltage drops slowly in the ohmic polarization stage (50–400 mA cm−2). When the current density ranges from 0 to 50 mA cm−2, the voltages of the experimental data, the AIWC model and the Fluent model, respectively, drop from 1.01 to 0.76 V, 1.00 to 0.78 V and 1.00 to 0.79 V, respectively. When the current density ranges from 50 to 400 mA cm−2, the voltages of the experimental data, the AIWC model and the Fluent model drop from 0.76 to 0.51 V, 0.78 to 0.56 V and 0.79 to 0.58 V, respectively.
At low current density, voltages drop rapidly, but the descent rates decrease gradually. More importantly, the voltage drop is caused by the activation loss of electrochemical reactions. In this process, the electrochemical reaction is not violent, and the dehydration of the PEM leads to low proton conductivity. Furthermore, the minor amount of water produced by the reactions cannot make the membrane obviously hydrated. In the current density range of 50–400 mA cm−2, the voltage drop tends to be steady. It is mainly affected by the ohmic loss. In this current density range, the influence of the ohmic polarization increases gradually. When the current density approaches 300 mA cm−2, the voltages of the experiment, AIWC model and Fluent model are 0.58 V, 0.61 V and 0.62 V, respectively. Among them, voltage of the AIWC model is closer to the experimental data than that of the Fluent model, and the relative error of the prediction results of the AIWC model has been reduced by 5.2% (the original is 7.0% in the Fluent model). When the current density is 407.70 mA cm−2, the experimental power density reaches a maximum of 208.04 mW cm−2. Furthermore, the power density increases with increasing current density, and the slope of the polarization curves decreases gradually because the proton conductivity of the membrane increases with increasing water content and decreasing ohmic loss in the membrane.
Figure 4b shows the polarization curves of the AIWC model, Fluent model and experimental data for the PEM fuel cell; the relative humidity of the anode and cathode are set as 50% and 100%, and the cell operating temperature and pressure are set as 60 °C and 0.1 MPa. When the current density ranges from 0 to 50 mA cm−2, the voltages of the experiment, the AIWC model and Fluent model severally drop from 0.99 to 0.77 V, 1.00 to 0.79 V and 1.00 to 0.79 V, respectively. When the current density ranges from 50 to 400 mA cm−2, the voltages of the experiment, the AIWC model and the Fluent model drop from 0.77 to 0.54 V, 0.79 to 0.57 V and 0.79 to 0.58 V, respectively. The influences of the concentration polarization increase gradually in the current density range of 300 to 400 mA cm−2. In the condition of 240 mA cm−2, the relative error of the voltage results derived from the AIWC model has been reduced to 3.2% (the original is 4.6% in the Fluent model).
Figure 4c depicts the polarization curves of the AIWC model, Fluent model and experimental data for the PEM fuel cell; the relative humidity of the anode and cathode are set as 75% and 100%, and the cell operating temperature and pressure are set as 60 °C and 0.1 MPa. When the current density ranges from 0 to 50 mA cm−2, voltages of the experimental data, AIWC model and the Fluent model, respectively, drop from 1.01 to 0.75 V, 1.00 to 0.76 V and 1.00 to 0.77 V, respectively. When the current density ranges from 50 to 400 mA cm−2, the voltages of the experiment, AIWC model and Fluent model drop from 0.75 to 0.48 V, 0.76 to 0.52 V and 0.77 to 0.54 V, respectively. As shown in Figure 4c, the power density value increases with increasing current density, and the slope of the I-P curves decreases gradually when the current density approaches 407.17 mA cm−2. This is because the membrane proton conductivity of the membrane increases with increasing water content, and the ohmic resistance in the membrane decreases.
Figure 4d depicts the polarization curves of the AIWC model, Fluent model and experimental data for the PEM fuel cell; the relative humidity of the anode and cathode are set as 100% and 100%, and the cell operating temperature and pressure are set as 60 °C and 0.1 MPa. When the current density ranges from 0 to 50 mA cm−2, the voltages of the experiment, AIWC model, and Fluent model, respectively, drop from 1.00 to 0.74 V, 1.00 to 0.76 V and 1.00 to 0.76 V, respectively. When the current density ranges from 50 to 300 mA cm−2, the voltages of the experiment, AIWC model, and Fluent model drop from 0.74 to 0.54 V, 0.76 to 0.57 V and 0.76 to 0.58 V, respectively. When the current density ranges from 300 to 400 mA cm−2, the voltages of the experiment, the AIWC model and the Fluent model drop from 0.54 to 0.45 V, 0.57 to 0.52 V and 0.58 to 0.53 V, respectively.
As can be seen in Figure 4, the AIWC model-predicted polarization curves are closer to the experimental values than Fluent model. The voltage obtained from the Fluent model is higher than that of the AIWC model and the experiment results at the same current density. The reason for the numerical difference is that the AIWC model takes the anode channel pressure drop and phase change into account, which leads to a minimal condensation rate and liquid water activity. Therefore, the humidifying ability of the humidified hydrogen on the anode side membrane is less obvious at low ARH. In addition, Sun et al. [39] also found that the membrane at the fuel cell inlet was still not fully hydrated and resulted in a decrease in the local current when the hydrogen was not humidified. All local currents increased when the humidified temperature of the anode was increased from 50 to 90 °C. It can be concluded that there is an increasing of water content in the fuel cell as the anode humidification temperature increases.
It is worth noting that the AIWC model matches the experimental data well at low current densities. However, for the final region, there are qualitative differences between the experiment and both Fluent and AIWC models. The main reason is the presence of transport limitations above 300 mA cm−2. At high current densities, large amounts of water are produced by electrochemical reactions, but they cannot move away from GDL or CL in time. Therefore, insufficient oxygen reaches the active sites on the catalyst surface and eventually leads to a difference that affects performance.
Four polarization curves and power density curves with different relative humidities of 25%, 50%, 75% and 100% are shown in Figure 5. Obviously, the performance of 50% ARH is greater than ARH 25% and ARH 75%, and the differences of ARH 75% and ARH 100% are very close.
For low relative humidities of 25% and 50%, the water content in the membrane is increased with the increase in anode humidity; thereby, protons can transport through the water-filled ionic channels in the membrane networks more easily, resulting in low ohmic resistance and high output performance. Choi et al. [40] found a similar trend. In their study, when the current density was 400 mA cm−2, the voltages of the polarization curve obtained without humidification and humidification were 0.62 V and 0.65 V, respectively. At low current density, the small amount of water produced by the reactions cannot make the membrane hydrated. Therefore, when hydrogen is humidified, the condensed water promotes the hydration of the membrane, which leads to a high proton conductivity. Therefore, when the current density ranges from 0 to 400 mA cm−2, the performance of the PEM fuel cell can be improved with increasing ARH before full humidification of the membrane.
For high relative humidity, the improvement of anode humidity leads to the opposite result. With the increase in relative humidity, the water content in the membrane increases until saturation. Once the membrane is saturated with water, it may cause the clogging of catalyst pores, an increase in liquid water saturation, and flooding of the anode flow channel. Compared with the other three conditions, the slope of the voltage curve under RH 100% is larger because of the appearance of local flooding. When PEM is completely humidifying, as the current increases, excess water produced by condensation does not play a positive role in improving the performance of the PEM fuel cell, and it even reduces reaction rates by plugging the pores of the diffusion layer.
Some researchers have come to similar conclusions. Kim et al. [41] found that ARH was an important factor in improving performance at high current densities. The saturation of liquid water is influenced by the decrease in ARH when the operating voltage is 0.50 to 0.70 V. Their experiments indicated that the reverse diffusion of liquid water from the cathode to the anode increased with decreasing ARH. In this paper, the chemical reactions and mass transfer are enhanced due to the increase in water content in the membrane, which leads to a better performance of the PEM fuel cell with the increased ARH.

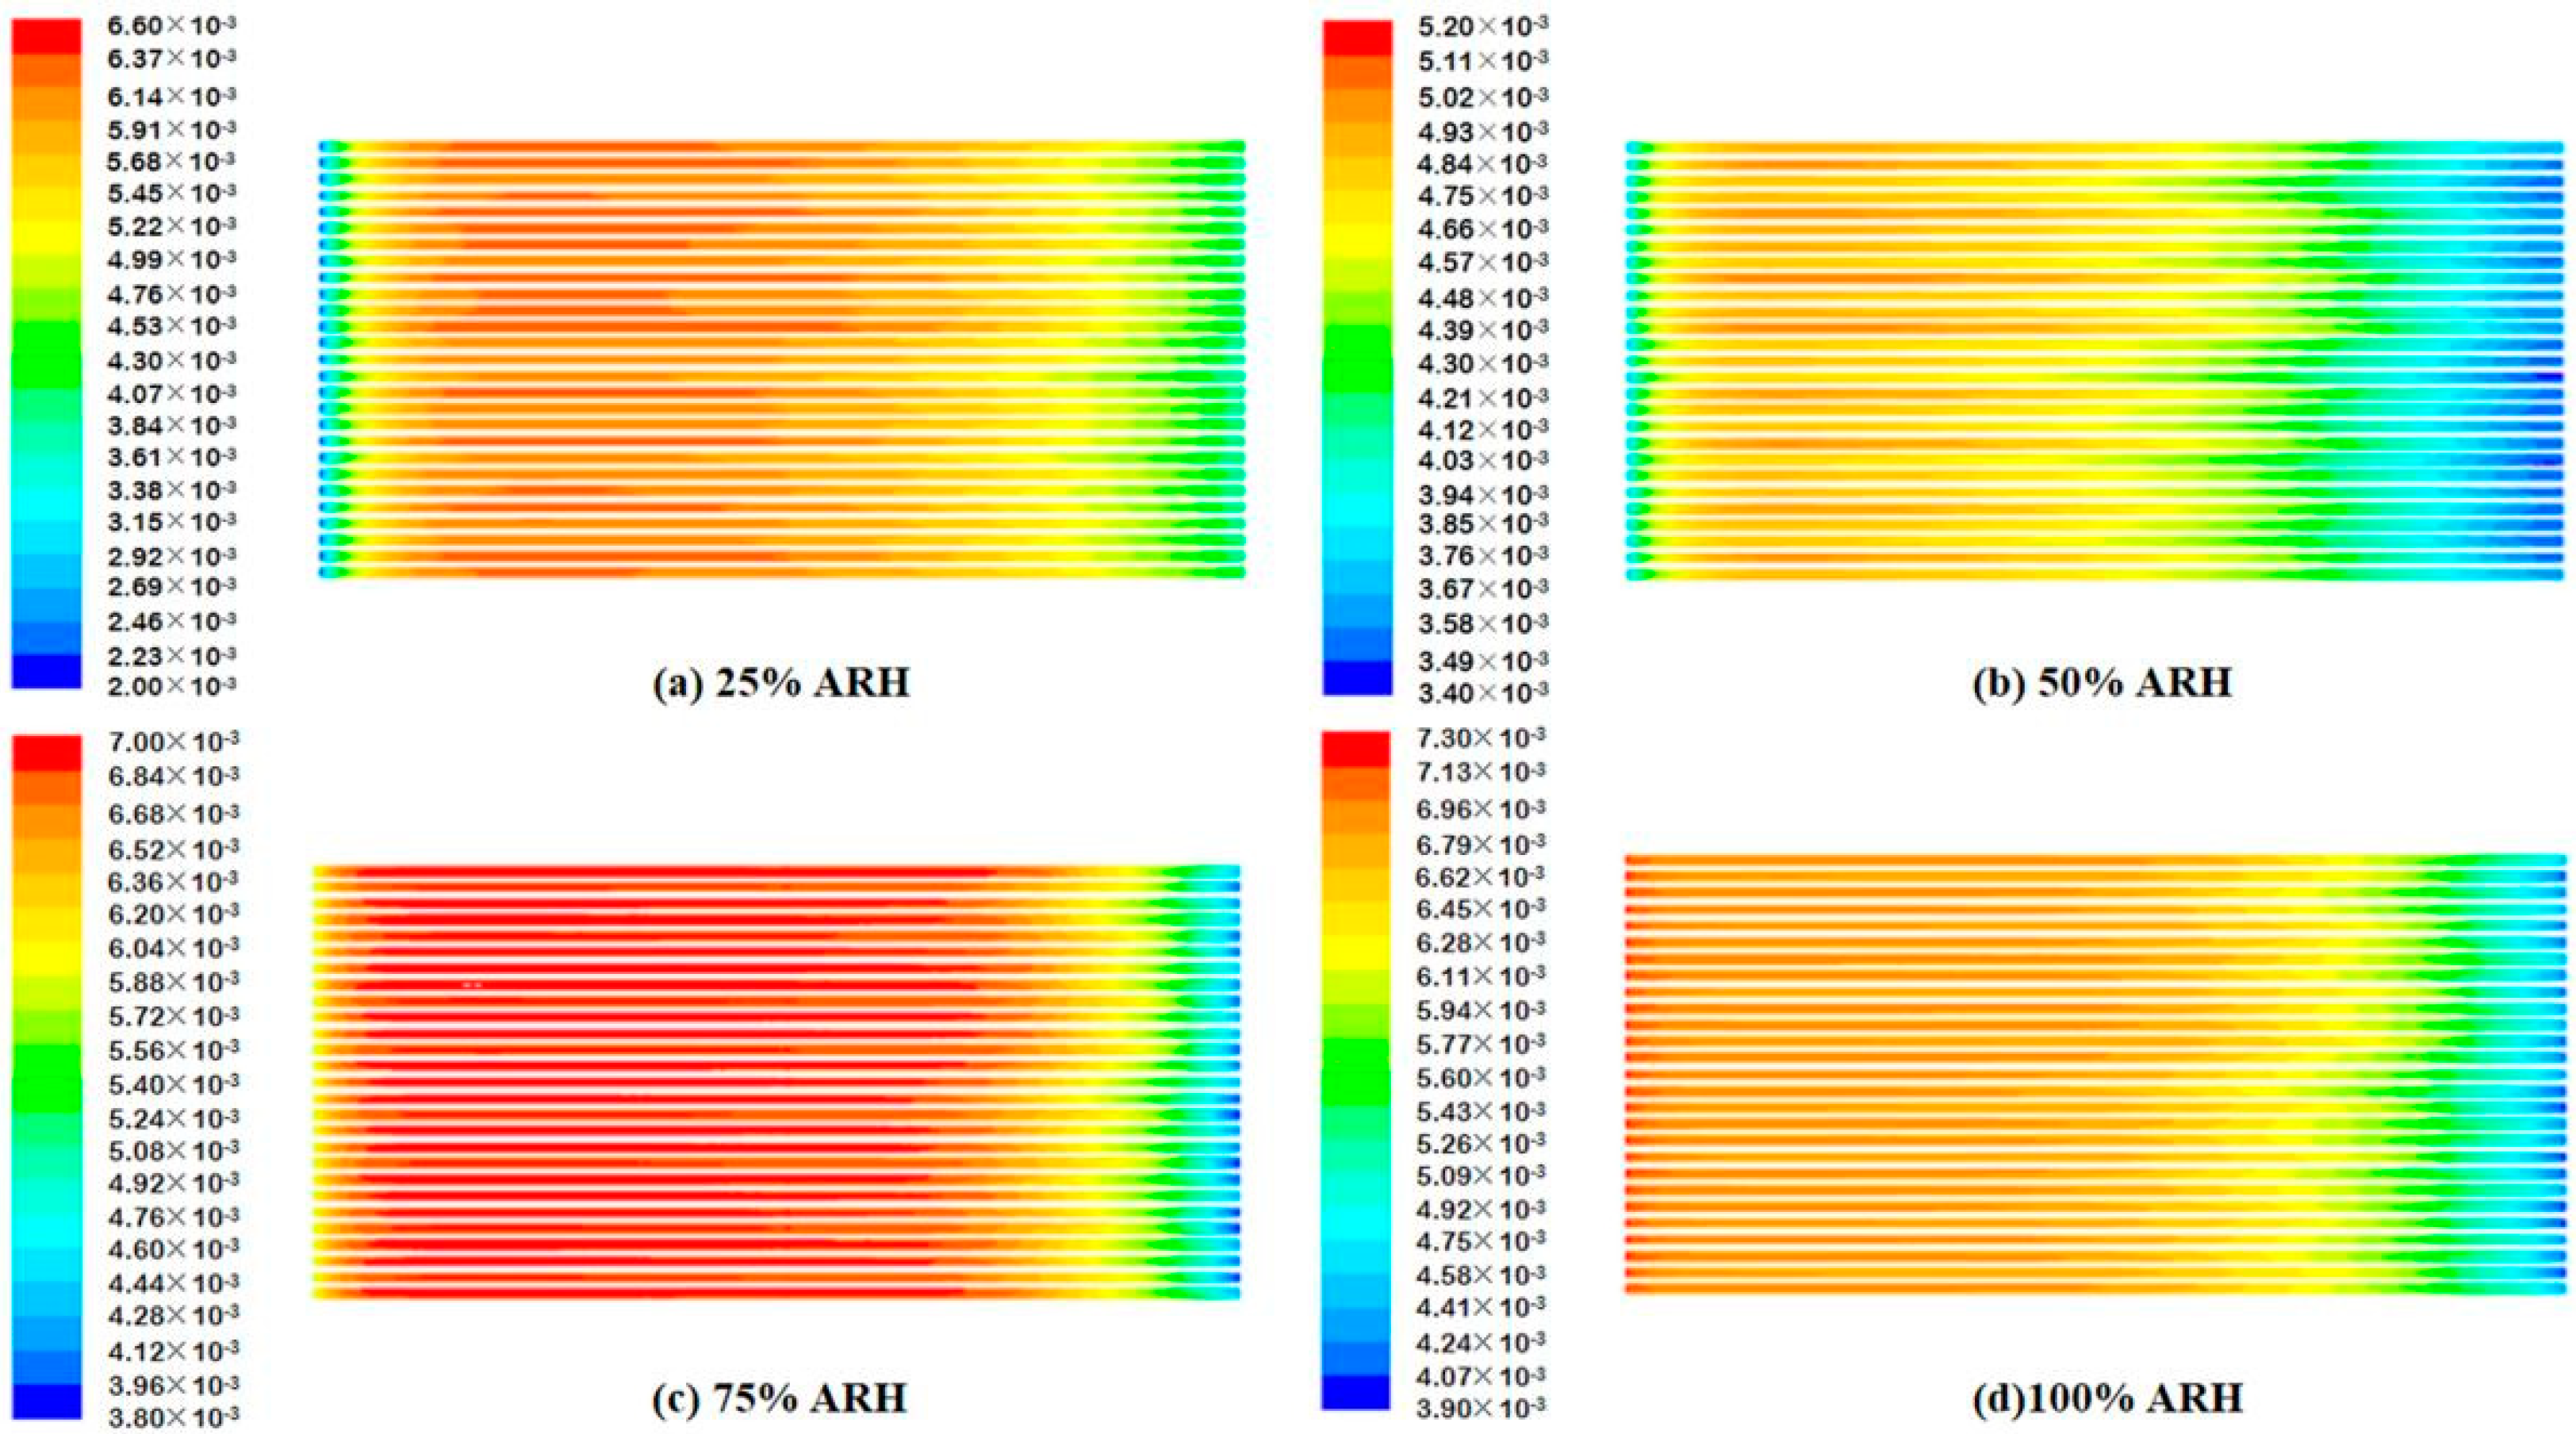
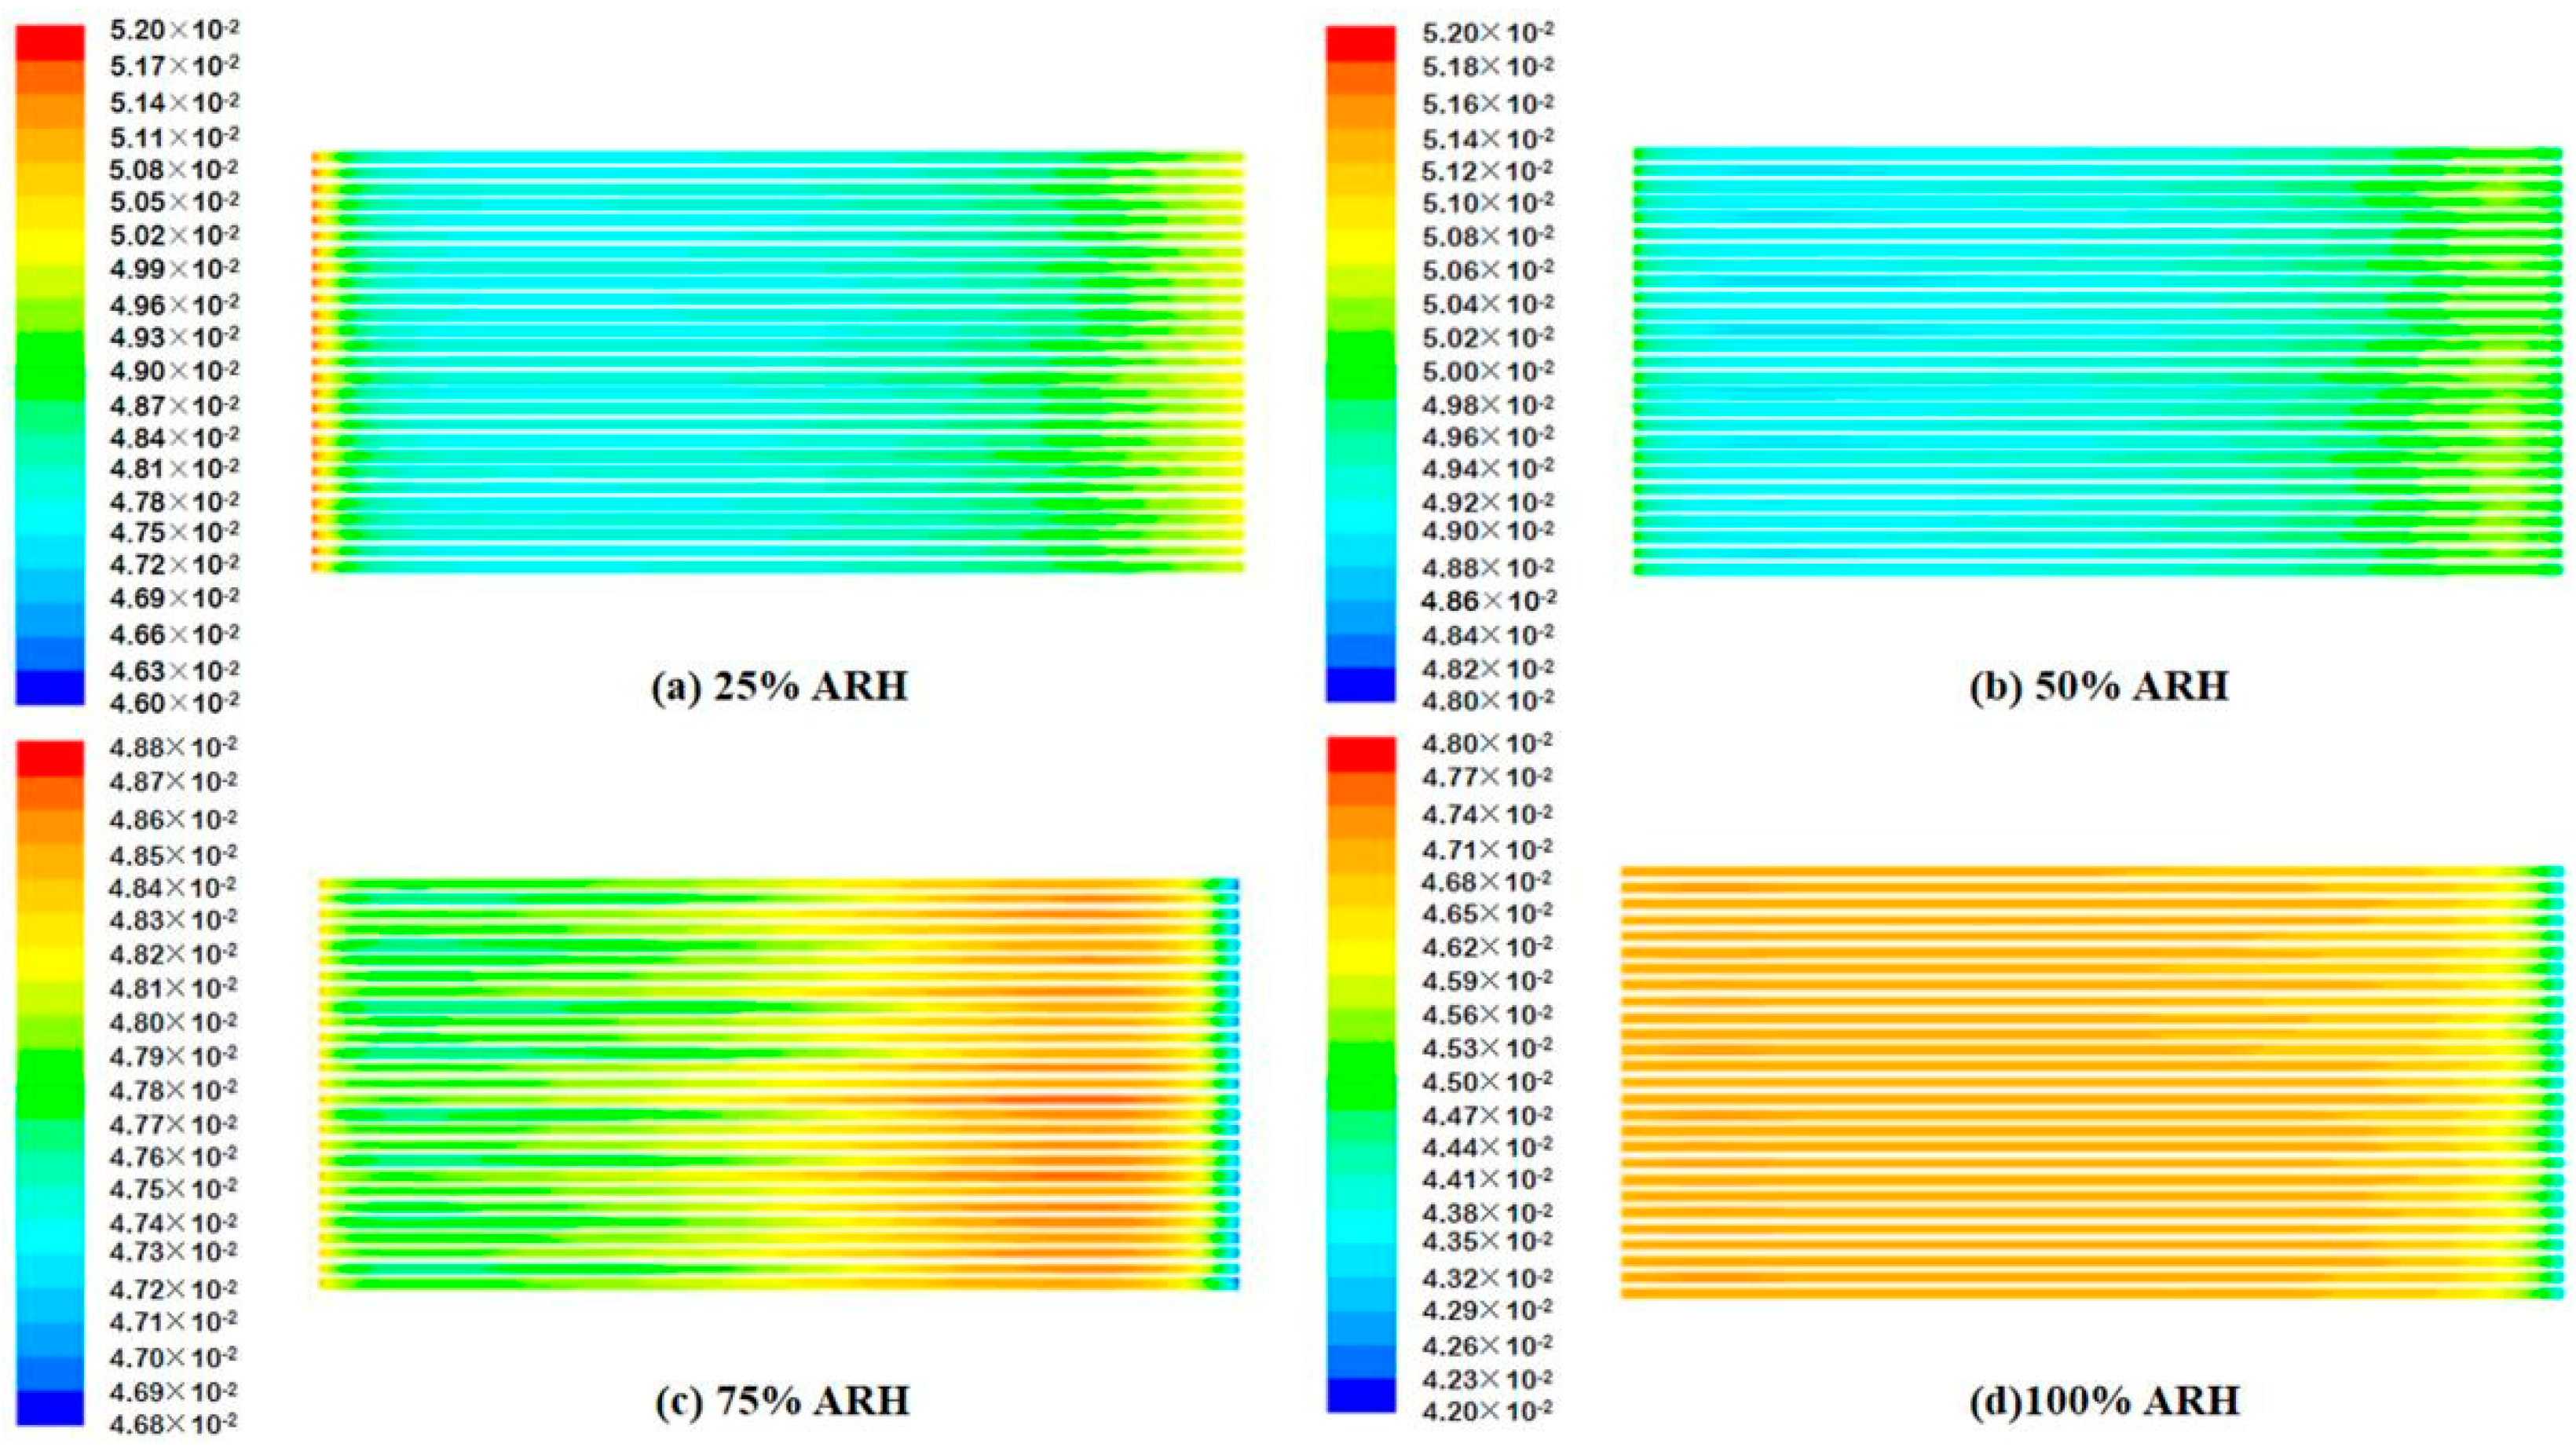
4.2. Contours of Fuel Cell Species Distribution

Experimental results can reflect real working conditions, involving more physico-chemical factors, and whether the simulation takes into account as many relevant factors as possible is what determines its better match with the experiment. However, the reaction parameters inside the PEM fuel cell are difficult to obtain through the experiment. The water transportation phenomenon is unobservable. Simulation can compensate for this deficiency because the simulation results can display the internal reflection of the PEM fuel cell directly through postprocessing technology. The results are compared and analyzed by the polarization curves and the contours of the water and hydrogen molar concentrations.
The contours of water molar concentrations are shown in Figure 6. While the anode is not saturated humidification, the water content in the gas flow increases to the maximum and then decreases along the direction of the flow field when the fuel cell humidification is moderate. When the anode channels are operated at 100% ARH, the water content inside the anode channels reaches saturation. Therefore, the water content in the contour is relatively uniform, and the water content is approximately 6.79 × 10⁻³ kmol m−3 in most areas. For 100% ARH, liquid water is likely to be generated in the anode channels and leads to low performance of the PEM fuel cell because the water has filled the pores of the electrode structure and increased the resistance of the anode gases to the diffusion layer. However, the proton conductivity increases with increasing water content. Therefore, the PEM fuel cell should be maintained in good humidification conditions to achieve better performance. Similarly, Caglayan et al. [42] drew a conclusion that a larger membrane area caused overestimation of current densities at low voltages where the ohmic losses became significant.
The hydrogen consumption in the anode channels is analyzed by observing the hydrogen molar concentrations in Figure 7. At 50% ARH, the hydrogen distribution is more uniform all over the anode channels compared with the other three conditions, and the hydrogen concentrations are greatest at the left entrance. In addition, the hydrogen molar concentrations inside the anode channels can reach the lowest value of 4.20 × 10⁻² kmol m−3. The increase in gaseous water in the anode channels is beneficial to the performance of the PEM fuel cell, as shown by comparing Figure 5 with Figure 6. When gaseous water in the anode channels increases, the hydration of the proton exchange membrane is enhanced, while the hydrogen concentrations are reduced and the conductivities are improved. Therefore, the ultimate effects are beneficial to the performance of the PEM fuel cell when ARH rises from 50% to 100%.
In the contours, the PEM fuel cell can form liquid water, which can improve the hydrogen proton conductivity. However, when the liquid water content increases to a certain extent, the PEM fuel cell can lead to concentration polarization and water flooding, which will block the capillary of the PEM fuel cell diffusion layer. In addition, there are many technical difficulties in obtaining detailed data in experiments. Therefore, the contours can be used to display the reaction process of the PEM fuel cell, and the results obtained from the experiment can be used to verify the simulation results.

5. Conclusions

In the present work, the experiments and simulations are presented to investigate the effect of the anode inlet relative humidity on the PEMFC performance. The AIWC model is established with the condensation rates and water activity introduced. The experiment is conducted at 60 °C operating temperature, with four different anode relative humidities (25%, 50%, 75% and 100%) and 100% cathode relative humidity. By analyzing the PEM fuel cell performance and the contours of water molar concentrations and hydrogen molar concentrations in the anode channels, the effect of inlet water content on the water transfer and the performance of the PEMFC is studied. The conclusions are as follows:
  • The AIWC model is more applicable to study the anode inlet relative humidity on the PEMFC performance than the Fluent model. The relative error of the voltage results derived from the AIWC model has been reduced to 3.2% (the original is 4.6% in the Fluent model), especially at 240 mA cm−2 for 50% ARH. At 50% ARH, 100% CRH, and 60 °C, the water content and hydrogen distribution are more uniform all over the anode channels, and the maximum power density is achieved.
  • At low relative humidity (25% ARH and 50% ARH), an increase in hydrogen humidity can improve the performance of the PEM fuel cell at low current density. The water content and hydrogen distribution is more uniform all over the anode channels at 50% ARH. At high relative humidity (100% ARH), the excess water produced by condensation does not play a positive role in the fuel cell performance.

Author Contributions

L.Z. and Y.L. proposed innovative points on the anode inlet relative humidity effect on the performance of PEMFC. L.Z. performed the calculations and paper writing. L.Z., Y.L. and G.B. performed the funding acquisition. L.Z., L.W. and X.L. performed the investigation and experimental validation. L.W., Y.W., G.B. and H.S. performed the review and editing of the paper. All authors have read and agreed to the published version of the manuscript.

Funding

This work was supported by the State Key Laboratory of Automotive Safety and Energy under Project (No. KFY2218); Beijing Postdoctoral Research Foundation (No. 21009920007); Fundamental Research Funds for the Beijing Universities (No. X21057); Open Research Fund Program of Beijing Engineering Research Center of Monitoring for Construction Safety (BJC2020K005).

Institutional Review Board Statement

Not applicable.

Informed Consent Statement

Not applicable.

Data Availability Statement

Not applicable.

Conflicts of Interest

The authors declare that they have no known competing financial interest or personal relationship that could have appeared to influence the work reported in this paper.

References

  1. Khalil, Y.F. Science-based framework for ensuring safe use of hydrogen as an energy carrier and an emission-free transportation fuel. Process Saf. Environ. Prot. 2018, 117, 326–340. [Google Scholar] [CrossRef]
  2. Chen, D.; Pei, P.; Li, Y.; Ren, P.; Meng, Y.; Song, X.; Wu, Z. Proton exchange membrane fuel cell stack consistency: Evaluation methods, influencing factors, membrane electrode assembly parameters and improvement measures. Energy Convers. Manag. 2022, 261, 115651. [Google Scholar] [CrossRef]
  3. Pei, P.; Chen, D.; Wu, Z.; Ren, P. Nonlinear methods for evaluating and online predicting the lifetime of fuel cells. Appl. Energy 2019, 254, 113730. [Google Scholar] [CrossRef]
  4. Ren, P.; Pei, P.; Chen, D.; Li, Y.; Wang, H.; Fu, X.; Zhang, L.; Wang, M.; Song, X. Micro-current excitation for efficient diagnosis of membrane electrode assemblies in fuel cell stacks: Error analysis and method optimization. Energy Convers. Manag. 2022, 258, 115489. [Google Scholar] [CrossRef]
  5. Ren, P.; Pei, P.; Li, Y.; Wu, Z.; Chen, D.; Huang, S. Degradation mechanisms of proton exchange membrane fuel cell under typical automotive operating conditions. Prog. Energy Combust. Sci. 2020, 80, 100859. [Google Scholar] [CrossRef]
  6. Liu, Q.; Lan, F.; Chen, J.; Zeng, C.; Wang, J. A review of proton exchange membrane fuel cell water management: Membrane electrode assembly. J. Power Sources 2022, 517, 230723. [Google Scholar] [CrossRef]
  7. Ren, P.; Pei, P.; Li, Y.; Wu, Z.; Chen, D.; Huang, S.; Jia, X. Diagnosis of water failures in proton exchange membrane fuel cell with zero-phase ohmic resistance and fixed-low-frequency impedance. Appl. Energy 2019, 239, 785–792. [Google Scholar] [CrossRef]
  8. Jiao, K.; Li, X. Water transport in polymer electrolyte membrane fuel cells. Prog. Energy Combust. Sci. 2011, 37, 221–291. [Google Scholar] [CrossRef]
  9. Li, Y.; Pei, P.; Wu, Z.; Ren, P.; Jia, X.; Chen, D.; Huang, S. Approaches to avoid flooding in association with pressure drop in proton exchange membrane fuel cells. Appl. Energy 2018, 224, 42–51. [Google Scholar] [CrossRef]
  10. Sun, C.; Negro, E.; Nale, A.; Vezzù, K.; Zawodzinski, T.A.; Meda, L.; Gambaro, C.; Noto, V.D. An efficient barrier toward vanadium crossover in redox flow batteries: The bilayer [Nafion/(WO3)x] hybrid inorganic-organic membrane. Electrochim. Acta 2021, 378, 138133. [Google Scholar] [CrossRef]
  11. Dutta, K.; Das, S.; Kundu, P.P. Partially sulfonated polyaniline induced high ion-exchange capacity and selectivity of Nafion membrane for application in direct methanol fuel cells. J. Membr. Sci. 2015, 473, 94–101. [Google Scholar] [CrossRef]
  12. Peng, Z.; Badets, V.; Huguet, P.; Morin, A.; Schott, P.; Tran, T.B.H.; Porozhnyy, M.; Nikonenko, V.; Deabate, S. Operando μ-Raman study of the actual water content of perfluorosulfonic acid membranes in the fuel cell. J. Power Sources 2017, 356, 200–211. [Google Scholar] [CrossRef]
  13. Martinez, N.; Peng, Z.; Morin, A.; Porcar, L.; Gebel, G.; Lyonnard, S. Real time monitoring of water distribution in an operando fuel cell during transient states. J. Power Sources 2017, 365, 230–234. [Google Scholar] [CrossRef]
  14. Pineda-Delgado, J.L.; Chávez-Ramirez, A.U.; Gutierrez, B.C.K.; Rivas, S.; Marisela, C.-R.; de Jesús Hernández-Cortes, R.; Menchaca-Rivera, J.A.; Pérez-Robles, J.F. Effect of relative humidity and temperature on the performance of an electrochemical hydrogen compressor. Appl. Energy 2022, 311, 118617. [Google Scholar] [CrossRef]
  15. Akhtar, N.; Kerkhof, P. Effect of channel and rib width on transport phenomena within the cathode of a proton exchange membrane fuel cell. Int. J. Hydrogen Energy 2011, 36, 5536–5549. [Google Scholar] [CrossRef]
  16. Owejan, J.P.; Owejan, J.E.; Gu, W.; Trabold, T.A.; Tighe, T.W.; Mathias, M.F. Water transport mechanisms in PEMFC gas diffusion layers. J. Electrochem. Soc. 2010, 157, B1456. [Google Scholar] [CrossRef]
  17. Jo, A.; Gwak, G.; Moazzam, M.; Lee, J.; Ju, H. Analysis of water film formation and low-humidity operation characteristics of a polymer electrolyte fuel cell (PEFC). Int. J. Hydrogen Energy 2017, 42, 3731–3747. [Google Scholar] [CrossRef]
  18. Nandjou, F.; Poirot-Crouvezier, J.P.; Chandesris, M.; Blachot, J.F.; Bonnaud, C.; Bultel, Y. Impact of heat and water management on proton exchange membrane fuel cells degradation in automotive application. J. Power Sources 2016, 326, 182–192. [Google Scholar] [CrossRef]
  19. Askaripour, H. Effect of operating conditions on the performance of a PEM fuel cell. Int. J. Heat Mass Transf. 2019, 144, 118705. [Google Scholar] [CrossRef]
  20. Zhu, M.; Xie, X.; Wu, K.; Jiao, K. Experimental investigation of the effect of membrane water content on PEM fuel cell cold start. Energy Procedia 2019, 158, 1724–1729. [Google Scholar] [CrossRef]
  21. Ren, P.; Pei, P.; Chen, D.; Li, Y.; Wu, Z.; Zhang, L.; Li, Z.; Wang, M.; Wang, H.; Wang, B.; et al. Novel analytic method of membrane electrode assembly parameters for fuel cell consistency evaluation by micro-current excitation. Appl. Energy 2022, 306, 118068. [Google Scholar] [CrossRef]
  22. Song, D.; Wang, Q.; Liu, Z.; Huang, C. Transient analysis for the cathode gas diffusion layer of PEM fuel cells. J. Power Sources 2006, 159, 928–942. [Google Scholar] [CrossRef]
  23. He, W.; Yi, J.S.; Van Nguyen, T. Two-phase flow model of the cathode of PEM fuel cells using interdigitated flow fields. AIChE J. 2000, 46, 2053–2064. [Google Scholar] [CrossRef]
  24. Wang, Z.H.; Wang, C.Y.; Chen, K.S. Two-phase flow and transport in the air cathode of proton exchange membrane fuel cells. J. Power Sources 2001, 94, 40–50. [Google Scholar] [CrossRef] [Green Version]
  25. Sahraoui, M.; Bichioui, Y.; Halouani, K. Three–dimensional modeling of water transport in PEMFC. Int. J. Hydrogen Energy 2013, 38, 8524–8531. [Google Scholar] [CrossRef]
  26. Hao, L.; Moriyama, K.; Gu, W.; Wang, C. Three dimensional computations and experimental comparisons for a large-scale proton exchange membrane fuel cell. J. Electrochem. Soc. 2016, 163, F744. [Google Scholar] [CrossRef]
  27. Falcão, D.S.; Gomes, P.J.; Oliveira, V.B.; Pinho, C.; Pinto, A. 1D and 3D numerical simulations in PEM fuel cells. Int. J. Hydrogen Energy 2011, 36, 12486–12498. [Google Scholar] [CrossRef]
  28. Pasaogullari, U.; Wang, C.Y. Two-phase modeling and flooding prediction of polymer electrolyte fuel cells. J. Electrochem. Soc. 2005, 152, A380. [Google Scholar] [CrossRef]
  29. Arama, F.Z.; Mammar, K.; Laribi, S.; Necaibia, A.; Ghaitaoui, T. Implementation of sensor based on neural networks technique to predict the PEM fuel cell hydration state. J. Energy Storage 2020, 27, 101051. [Google Scholar] [CrossRef]
  30. Pei, P.; Ouyang, M.; Feng, W.; Lu, L.; Huang, H.; Zhang, J. Hydrogen pressure drop characteristics in a fuel cell stack. Int. J. Hydrogen Energy 2006, 31, 371–377. [Google Scholar] [CrossRef]
  31. Zhang, L.; Liu, Y.; Pei, P.; Liu, X.; Wang, L.; Wan, Y. Variation characteristic analysis of water content at the flow channel of proton exchange membrane fuel cell. Energies 2022, 15, 3280. [Google Scholar] [CrossRef]
  32. Arvay, A.; Ahmed, A.; Peng, X.H.; Kannan, A.M. Convergence criteria establishment for 3D simulation of proton exchange membrane fuel cell. Int. J. Hydrogen Energy 2012, 37, 2482–2489. [Google Scholar] [CrossRef]
  33. Carton, J.G.; Olabi, A.G. Three-dimensional proton exchange membrane fuel cell model: Comparison of double channel and open pore cellular foam flow plates. Energy 2017, 136, 185–195. [Google Scholar] [CrossRef] [Green Version]
  34. Cheddie, D.; Munroe, M. Mathematical model of a PEMFC using a PBI membrane. Energy Convers. Manag. 2006, 47, 1490–1504. [Google Scholar] [CrossRef]
  35. Liu, Y.; Tu, Z.; Chan, S.H. Performance enhancement in a H2/O2 PEMFC with dual-ejector recirculation. Int. J. Hydrogen Energy 2022, 47, 12698–12710. [Google Scholar] [CrossRef]
  36. Dickinson, E.J.F.; Hinds, G. The Butler-Volmer equation for polymer electrolyte membrane fuel cell (PEMFC) electrode kinetics: A critical discussion. J. Electrochem. Soc. 2019, 166, F221. [Google Scholar] [CrossRef]
  37. ANSYS, Inc. ANSYS FLUENT 15.0 Fuel Cells Module Manual. November 2013. Available online: https://documents.pub/document/fluent-udf-manual-fluent-udfansys-fluent-udf-manual-ansys-inc-release-150.html?page=1 (accessed on 9 March 2022).
  38. Cheng, Z.; Luo, L.; Huang, B.; Jian, O. Effect of humidification on distribution and uniformity of reactants and water content in PEMFC. Int. J. Hydrogen Energy 2021, 46, 26560–26574. [Google Scholar] [CrossRef]
  39. Sun, H.; Zhang, G.; Guo, L.J.; Dehua, S.; Liu, H. Effects of humidification temperatures on local current characteristics in a PEM fuel cell. J. Power Sources 2007, 168, 400–407. [Google Scholar] [CrossRef]
  40. Choi, K.H. Water transport in polymer membranes for PEMFC. J. Power Sources 2000, 86, 197–201. [Google Scholar] [CrossRef]
  41. Kim, Y.B. Study on the effect of humidity and stoichiometry on the water saturation of PEM fuel cells. Int. J. Energy Res. 2012, 36, 509–522. [Google Scholar] [CrossRef]
  42. Caglayan, D.G.; Sezgin, B.; Devrim, Y.; Eroglu, I. Three–dimensional modeling of a high temperature polymer electrolyte membrane fuel cell at different operation temperatures. Int. J. Hydrogen Energy 2016, 41, 10060–10070. [Google Scholar] [CrossRef]
Figure 1. Schematic diagram of the meshing employed for computational domain (a) and geometry configuration (b).
Energies 15 04532 g001
Figure 2. Schematic diagram of the simulation.
Energies 15 04532 g002
Figure 3. Schematic diagram of the test system.
Energies 15 04532 g003
Figure 4. Curves of volt–ampere characteristics.
Energies 15 04532 g004
Figure 5. Polarization curves based on experiment results at different ARH (25%, 50%, 75%, 100%).
Energies 15 04532 g005
Figure 6. Contours of water molar concentrations (kmol·m−3).
Energies 15 04532 g006
Figure 7. Contours of hydrogen molar concentrations (kmol·m−3).
Energies 15 04532 g007
Table 1. The detailed parameters of fuel cell.
StructureValueUnits
Active area 2 . 75 × 10 4 m 2
Channel width 2.00 × 10 4 m
Channel depth 1.00 × 10 4 m
Channel number27.00--
Thickness of proton exchange membrane 5.00 × 10 5 m
Thickness of gas diffusion layer 2.00 × 10 5 m
Thickness of catalytic layer 1.00 × 10 5 m
Table 2. The number and type of mesh elements.
PEMFC 3D ModelNumberType
Anode Collector806,291Hybrid
Anode Channel195,641Hybrid
Anode Gas Diffusion Layer260,749Hex
Anode Catalyst Layer260,749Hex
Proton Exchange Membrane260,749Hex
Cathode Catalyst Layer260,749Hex
Cathode Gas Diffusion Layer260,749Hex
Cathode Channel195,641Hybrid
Cathode Collector806,291Hybrid
Table 3. Detailed model parameters and operating conditions.
ParameterValueUnits
Reference diffusivity of hydrogen ( D H 2 eff )9.15 × 10⁻⁵m2 s−1
Reference diffusivity of oxygen ( D O 2 eff )2.2 × 10⁻⁵m2 s−1
Reference diffusivity of water ( D H 2 O eff )2.56 × 10⁻⁵m2 s−1
Thermal conductivity of the membrane ( k m eff )0.4W (m K)−1
Thermal conductivity of the GDL ( k GDL eff )1.2W (m K)−1
Thermal conductivity of the CL ( k CL eff )1.5W (m K)−1
Thermal conductivity of the current collector ( k CC eff )20W (m K)−1
Electrical conductivity of the GDL ( σ GDL )2500S m−1
Electrical conductivity of the CL ( σ CL )2500S m−1
Electrical conductivity of the current collector ( σ CC )20,000S m−1
Hydrogen reference exchange current density ( j an ref )4000A m−2
Oxygen reference exchange current density ( j cat ref )5.75A m−2
Hydrogen reference concentration ( [ A ] ref )1.00Kmol m−3
Oxygen reference concentration ( [ C ] ref )1.00Kmol m−3
Concentration dependence at anode ( γ an )0.5--
Concentration dependence at cathode ( γ cat )1--
Anode transfer coefficient for the anode electrode ( α an an )0.5--
Cathode transfer coefficient for the anode electrode ( α cat an )0.5--
Anode transfer coefficient for the cathode electrode ( α an cat )0.5--
Cathode transfer coefficient for the cathode electrode ( α cat cat )0.5--
Equivalent weight of membrane ( M m )1100Kg kmol−1
Density of the membrane ( ρ m )1980kg m3
Porosity of the GDL ( ε GDL )0.5--
Porosity of the CL ( ε CL )0.28--
Permeability of the GDL ( K GDL )1.18 × 10⁻¹²m2
Permeability of the CL ( K CL )2.3 × 10⁻¹³m2
Molecular weight of H2 ( M H 2 )2 × 10⁻³Kg mol−1
Molecular weight of O2 ( M O 2 )32 × 10−3Kg mol−1
Molecular weight of H2O ( M H 2 O )18 × 10−3Kg mol−1
Faraday constant (F)9.65 × 10⁷C kmol−1
Universal gas constant (R)8.3134J mol−1 K−1
Open circuit voltage ( V o )0.95V
Operating temperature (T)60°C
Operating pressure (P)0.1MPa
Anode inlet gas flow rate ( Q an , in )2L min−1
Cathode inlet gas flow rate ( Q cat , in )5L min−1
Anode relative humidity (ARH)25, 50, 75, 100%
Cathode relative humidity (CRH)100%
Table 4. Parameters of the single fuel cell.
ParameterFuel Cell
Area of membrane (cm2)275
Flow fieldParallel
MembraneNafionTM 212
GDLToray 200 µm
Cat. loading0.1/0.3 mg cm2
Material of bipolar plateMetal
Publisher’s Note: MDPI stays neutral with regard to jurisdictional claims in published maps and institutional affiliations.

