Article

Techno-Economic Assessment of Solid–Liquid Biogas Treatment Plants for the Agro-Industrial Sector

by
Roberto Eloy Hernández Regalado
1,2,3,*,
Jurek Häner
2,3,
Elmar Brügging
2,3 and
Jens Tränckner
1
1
Faculty of Agriculture and Environmental Sciences, University of Rostock, Justus-von-Liebig-Weg 6, 18059 Rostock, Germany
2
Faculty of Energy Building Services Environmental Engineering, Münster University of Applied Sciences, Stegerwaldstr. 39, 48565 Steinfurt, Germany
3
Institute Association for Resources, Energy and Infrastructure, Münster University of Applied Sciences, Stegerwaldstr. 39, 48565 Steinfurt, Germany
*
Author to whom correspondence should be addressed.
Energies 2022, 15(12), 4413; https://doi.org/10.3390/en15124413
Submission received: 14 May 2022 / Revised: 10 June 2022 / Accepted: 15 June 2022 / Published: 17 June 2022

Abstract

:
The urgent need to meet climate goals provides unique opportunities to promote small-scale farm anaerobic digesters that valorize on-site wastes for producing renewable electricity and heat, thereby cushioning agribusinesses against energy perturbations. This study explored the economic viability of mono-digestion of cow manure (CWM) and piglet manure (PM) in small manured-based 99 kWel plants using three treatment schemes (TS): (1) typical agricultural biogas plant, (2) a single-stage expanded granular sludge bed (EGSB) reactor, and (3) a multistage EGSB with a continuous stirred tank reactor. The economic evaluation attempted to take advantage of the financial incentives provided by The Renewable Energy Sources Act in Germany. To evaluate these systems, batch tests on raw and solid substrate fractions were conducted. For the liquid fraction, data of continuous tests obtained in a laboratory was employed. The economical evaluation was based on the dynamic indicators of net present value and internal return rate (IRR). Sensitivity analyses of the electricity and heat selling prices and hydraulic retention time were also performed. Furthermore, an incremental analysis of IRR was conducted to determine the most profitable alternative. The most influential variable was electricity selling price, and the most profitable alternatives were TS1 (CWM) > TS1 (PM) > TS3 (CWM). However, further studies on co-digestion using TS3 are recommended because this scheme potentially provides the greatest technical flexibility and highest environmental sustainability.

1. Introduction

At the end of 2019, global energy demand was projected to grow by 12% by 2030 [1]. The share of fossil fuels in the primary energy mix has remained above 80% since the 1950s [2]. COP26 promised to kickstart the urgently needed transition from pledges to real-world actions [3]. To minimize global warming and the impact of climate change, greenhouse gas (GHG) emissions must be reduced drastically [4]. “Another important global challenge is the security of energy supply because most of the known conventional oil and gas reserves are concentrated in politically unstable regions” [5].
In this context, biogas from wastes, residues, and energy crops are expected to play an important role in the future [5,6,7]. Biogas contributes to the primary targets of the current energy transition by replacing fossil resources and reducing methane emissions related to the disposal of biodegradable waste, thereby reducing GHG emissions. In addition, the resulting digestate can be used to enrich agricultural soils, which contributes to creating carbon sinks. Methane-rich biogas can also replace natural gas as a feedstock in the production of chemicals and materials [5,7].
The Renewable Energy Sources Act (Gesetz für den Ausbau erneuerbarer Energie, EEG) stimulated an increase in biogas plants in Germany from approximately 1000 in 2000 to approximately 9632 operating plants in 2020 [8,9]. However, due to changes in the EEG, only small liquid manure plants and waste digestion plants benefit from the original remuneration system outlined in 2012. In addition, economical support for processing biogas that can be put into the natural gas grid (biomethane) has increased. Supports for participating in direct marketing (market and flexibility premium) have also increased. Thus, the current funding conditions are directing biogas technology toward decentralized and flexible power generation from biogenic residues and waste materials [9].
A commonly used criterion to assess the performance of the anaerobic digestion (AD) of a given substrate is the biomethane potential (BMP) [10]. BMP tests are routinely performed in academia and industry to determine the methane potential of a given substrate [11]. Determining the BMP is the first step in evaluating the digestibility or applicability of a substrate because the BMP parameter provides valuable information about general degradability, expectable energy yield, and the economic evaluation of new biogas plants. Typically, BMP is determined by a BMP test procedure in a batch anaerobic fermentation assay, which is a reliable and straightforward method that avoids inconsistencies in the collected data [10,12,13].
Profitability is another challenge in the biogas industry [14]. Broader implementation of the biochemical conversion of biowaste, especially in rural areas, requires an intensive analysis of various technical aspects, e.g., biodigester design and its applications, pre-treatment, and co-digestion processes to enhance the biogas yield. In addition, economics plays a crucial role, and various cost factors, e.g., substrates, substrate collection, transport, biodigester, electricity, and heat selling prices, must be considered. In addition, current and future policies are essential to realizing the practical implementation of new technologies [6,14], and techno-economic models are used to identify the industrialization potential of a project [15].
An important challenge in the implementation of AD from manure and wastes is selecting the most cost-effective combination of technologies [16]. Two-stage or multistage reactors, in which the hydrolysis/acidogenesis and acetogenesis/methanogenesis steps occur in the same or separate digesters are becoming increasingly popular because they allow easier control and optimization of the operation, thereby obtaining higher rates and yields of biogas, by separating the steps in which AD occurs [17]. Another two-stage process that has drawn attention is the dual solid–liquid treatment system, as reported by Zhang et al. [18], who compared the digestion of raw food waste versus the digestion of the liquid and solid phases of the food waste. They found that methane production increased by 13.6% in the dual system compared to raw digestion. In addition, El-Mashad and Zhang [19] used batch tests to compare the co-digestion of a raw mixture of dairy manure and food waste, as well as its liquid and solid fractions. The mass balance showed that co-digestion of the liquid phase yielded 32% less methane compared to the raw mixture. El-Mashad and Zhang stated that the yield of the solid phase should also be included in the balance to realize a more complete analysis. Although digestion of the solid phase presents some issues in a continuous stirred tank reactor (CSTR) due to high solid content, it should not be used directly as a fertilizer or as composting feedstock because this will produce GHG emissions [19].
In this study, we attempt to determine the economic profitability of integrating an expanded granular sludge bed (EGSB) reactor and a solid–liquid separation process in a typical agricultural biogas plant to provide flexibility and increase the efficiency of treating raw, solid, and liquid manures (and other agricultural substrates). The assessment was conducted using batch tests to determine the methane yield and methane production rate of the raw, solid, and liquid phases. An economical analysis using the net present value (NPV) as a function of hydraulic retention time (HRT) for the solid and raw phases in a CSTR was conducted to compare the profitability of the dual solid–liquid system compared to raw digestion.

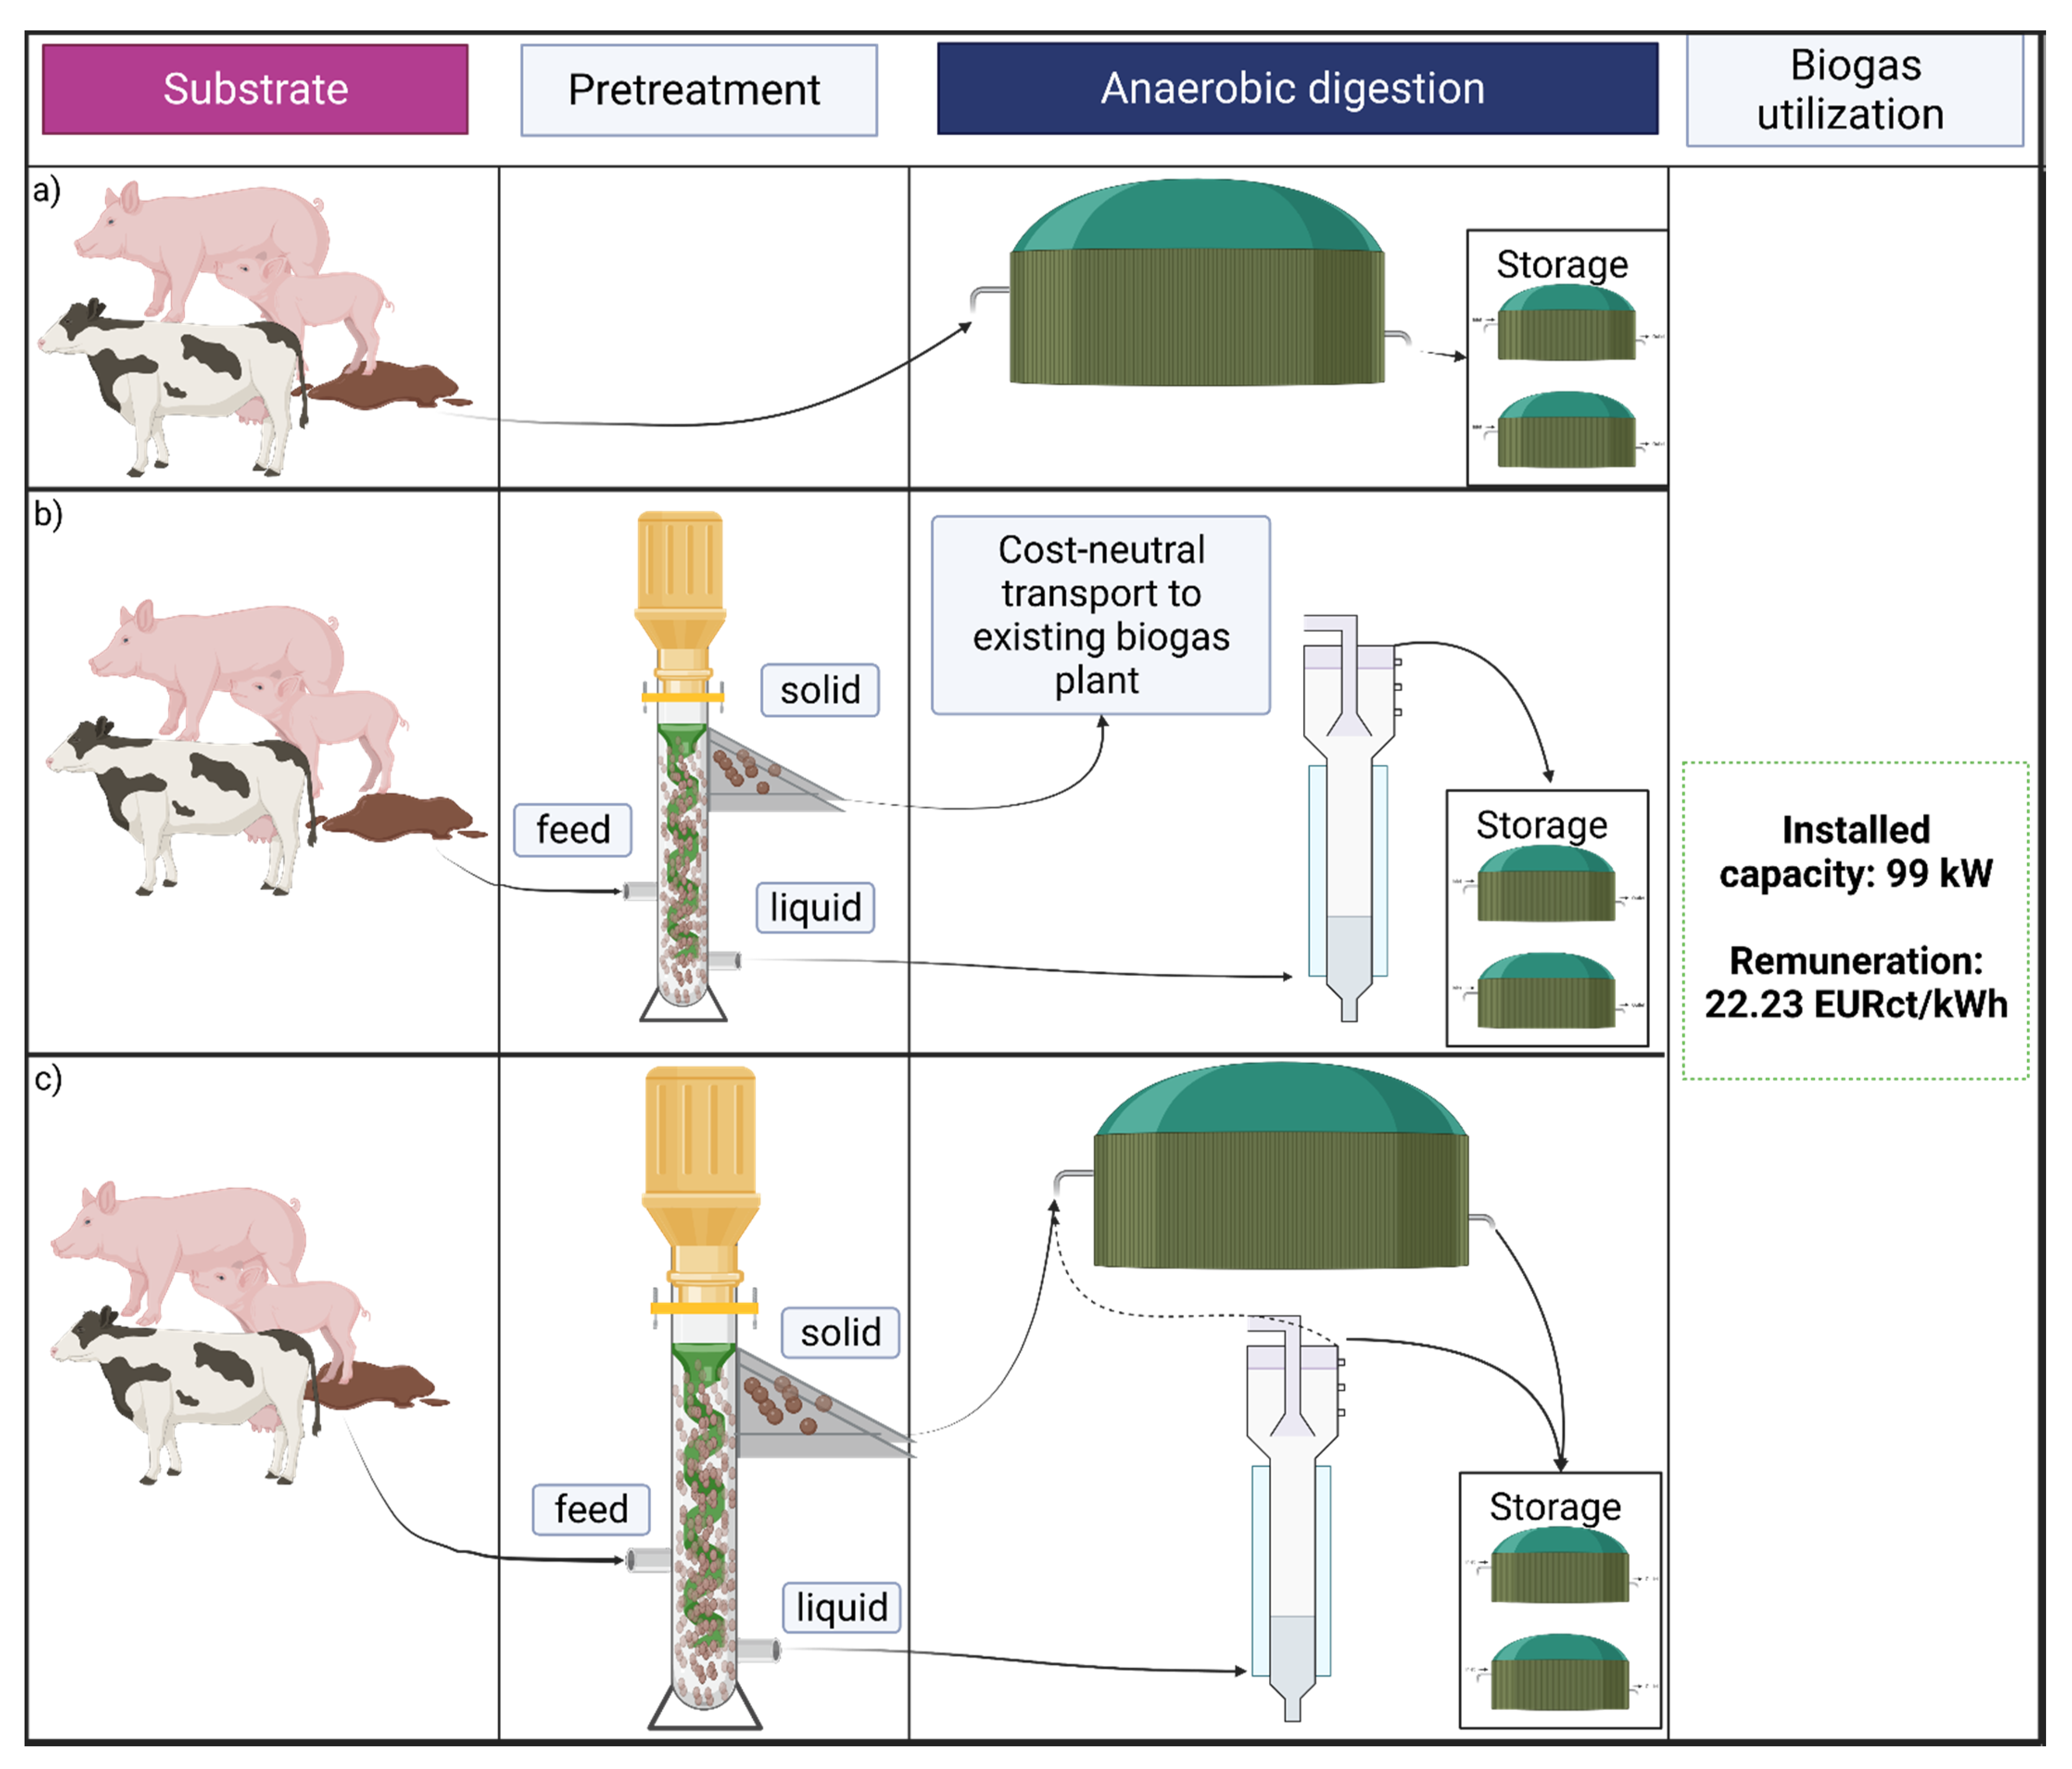
2. Materials and Methods

2.1. Raw Materials

Two substrates were considered in this study, i.e., piglet manure (PM) and cow manure (CWM). PM and CWM were chosen because the German government has implemented special incentives to address GHG reduction in the agricultural sector and improve the circular use of nitrogen [20].
The PM and CWM were previously processed using screw press systems that separated the solid and liquid phases. Here, a separation process with a 100 µm sieve (Klass Wendelfilter, KLASS Filter GmbH, Eresing, Germany) was applied for the PM. The CWM was collected from farmers in a pre-separated form, which was then processed by a second separation using a screw press with a sieve size of 200 µm [10].
The raw, solid, and liquid fractions of the substrates were characterized by the dry matter (DM) content, volatile solids (VS), macromolecules, and nutrients. The results of these analyses are given in Table 1.

2.2. Setup, Experimental Validation, and Mathematical Modeling of Batch Tests

The batch assays of the organic substances were conducted according to the Association of German Engineers [21]. The setup is thoroughly described by Regalado et al. [10]. The data used to analyze the methane yield curves (MYC) were the net daily methane cumulative production (inoculum contribution subtracted). Here, the following criteria based on recommendations from the literature [21,22,23] were applied to confirm the validity of the experiments.
  • Stopping criterion. The test concluded when the relative increase in YCH4 was less than 1% for three consecutive days.
  • Plausibility criterion. The existence of abrupt or nonmonotonic trends in the curves requires individual analysis of the affected test.
  • Reproducibility/accuracy criterion. After eliminating potential outlier(s) or outlier curve(s), a coefficient of variation (CV) less than 6% between the curves was required.
  • The BMP of the positive control (cellulose) was between 85 and 100% of the theoretical BMP (between 352 and 414 NLCH4 kgVS).
Once the MYCs of the raw and solid phases of the substrates satisfied these requirements, a first-order one-step model (Equation (1)) was fit using the average of the curves. Note that the liquid phases were characterized using the results from Regalado et al. [10], who reported the root mean square errors (RMSEs) of the fit.
MY   ( t ) = BMP   · ( 1 e kt )
Here, MY is the methane yield LCH4/kgVS, BMP is the extrapolated MY at infinite retention time in LCH4/kgVS, and k is the first-order reaction constant (1/d).
The degradation fraction (fd) values were calculated by modifying the equations from Raposo et al. and Ebner et al. [13,24], where, rather than using a BMP value calculated using data from Weender or Van Soest analysis, the BMP value was taken from the fit from Equation (1).
fd   = MY tfinal BMP  
Here, MYtfinal is the methane yield LCH4/kgVS at the end of the tests and BMP is the extrapolated MY at infinite retention time in LCH4/kgVS.

2.3. Estimation of HRTs in Continuous Stage

Substrate conversion is time- and process-dependent [21,25]. Weinrich [26] presented a general relation of batch tests and CSTRs with different substrates in Equation (3), which assumes that the rate constant k is transferable from a batch to a continuous system. This assumption is based on the correct theoretical determination of biogas potential via model-based extrapolation, as in Equation (1).
MY   ( t ) = BMP   · ( k · HRT 1 + k · HRT )
Here, MY is the methane yield LCH4/kgVS, BMP is the extrapolated MY at infinite retention time in LCH4/kgVS, k is the first-order reaction constant (1/d), and HRT is the hydraulic retention time (d).
Note that an MY(t) must be selected to estimate the operational HRT in a CSTR; thus, 0.8 of the BMP fit by Equation (1) was considered the standard if a quality adjustment was obtained.
The HRTs in the EGSB reactors were assessed based on practical experiments conducted at a laboratory scale published by Häner et al. [27]. Häner et al. [27] employed filtered pig slurry as a substrate in an EGSB reactor and a fixed-bed (FB) reactor. The author fitted linear regression models for both reactors using the organic loading rate (OLR) measured in gCOD/L/d as the independent variable and methane production rate (MPR) as the response variable. The smallest HRT considered efficient was 3 d for the EGSB reactor; however, an inverse relationship between MY and OLR has been described previously [28,29,30].
Thus, Regalado et al. [31] performed experiments in the same laboratory using three EGSB reactors, each identical to the reactor used by Häner et al. [27], to perform co-digestion of the liquid fractions of PM, CWM, starch wastewater (SWW), and sugar beets (SBT) using three 30 L EGSB reactors. The author studied the synergistic effects of two three-substrate mixtures (i.e., PM + CWM + SWW and PM + CWM + SBT) using the PM + CWM mixture as a benchmark. Here, Stover–Kincannon models for the MPR were combined with an inverse function for the MY to find the optimal operational HRT intervals.
In addition, Batstone et al. [32] indicated a linear relationship between the log (HRT) vs. log (% DM) at low DM content values. However, this relationship is only valid up to a DM content of 1%, and both mixtures were greater than this threshold. In the work of Regalado et al. [31], the optimal HRTs of both three-substrate mixtures were proportional to the DM ratio between both mixtures. Cremonez et al. [33] suggested an inverse relationship between the degradation rate and substrate complexity in the order of sugar (mono and disaccharides), starch, proteins, hemicellulose, lignin, and waxes and greases.
Thus, the HRT for the PM liquid was selected in reference to the work of Häner et al. [27]. However, a constraint of 50 ± 5% of the maximal MPR was imposed because optimal intervals were identified by Regalado et al. [31] close to this interval. For the CWM liquid, the HRT value of the PM liquid was adjusted by multiplying by DM (CWM)/DM(PM) because both substrates have similar complexity.

2.4. Economic and Environmental Impact Assessment

Three treatment schemes were analyzed in this study. As shown in Figure 1a, the first scheme is a typical single-stage agricultural biogas plant using a CSTR. In the second scheme, an EGSB replaces the CSTR of the single-stage plant, and a solid–liquid separation stage is included. Here, the liquid fraction is treated by the EGSB reactor, and the solid phase is transported to another plant (with assumed cost-neutral transport), as shown in Figure 1b. In the third scheme, substrates undergo solid–liquid separation. Then, the liquid phase is treated by an EGSB reactor, and the solid phase is treated using a CSTR (Figure 1c).
Economic performance is one of the most important factors affecting a project’s viability [34]. The economic assessments of the treatment schemes shown in Figure 1 are based on special subsidies for biogas plants provided by the German government [35] (EEG; acronym from untranslated German). Effective as of 2021, the EEG states that biogas plants using predominantly manure (>80 wt%) with an installed electrical capacity of less than 150 kWel are eligible to receive funding corresponding to 22, 23 EURct/kWhel. Note that this funding has a yearly degression of 0.5% depending on the year of commissioning, which is also shown in Figure 1.
The economic performance of each scheme was estimated based on the material and energy balances. Here, the HRTs were calculated as described in Section 2.3, and the electrical power outputs were fixed to satisfy the requirements for special funding as per the EEG. In addition, a yearly input flow of the respective raw substrate was calculated based on a fixed 99 kWel using the methane yield. The equipment costs were obtained by direct quotations from German companies with respective cost versus scale, and the costs were validated according to the literature.
Capital expenses (CAPEX) were calculated based on the reactor(s) and the combined heat and power (CHP) system costs. For each area, the direct cost and working capital were calculated as a function of the equipment costs [36,37].
In addition, operational expenditures (OPEX) were calculated according to the mass and energy balances. Here, the OPEX calculations for each scenario included the energy costs for pumps, separation, heating, internal electricity, salary, as well as substrate transport costs.
Note that this economic assessment is classified as a preliminary study (budget authorization) with a precision of –20% to +25% according to Don W. Green and Robert H. Perry [38]. The general procedure is illustrated in Figure 2. The economic profitability of the three treatment schemes was evaluated based on dynamic indicators, e.g., the NPV and internal rate of return (IRR). In addition, an incremental analysis of the IRR was performed to compare profitable alternatives.

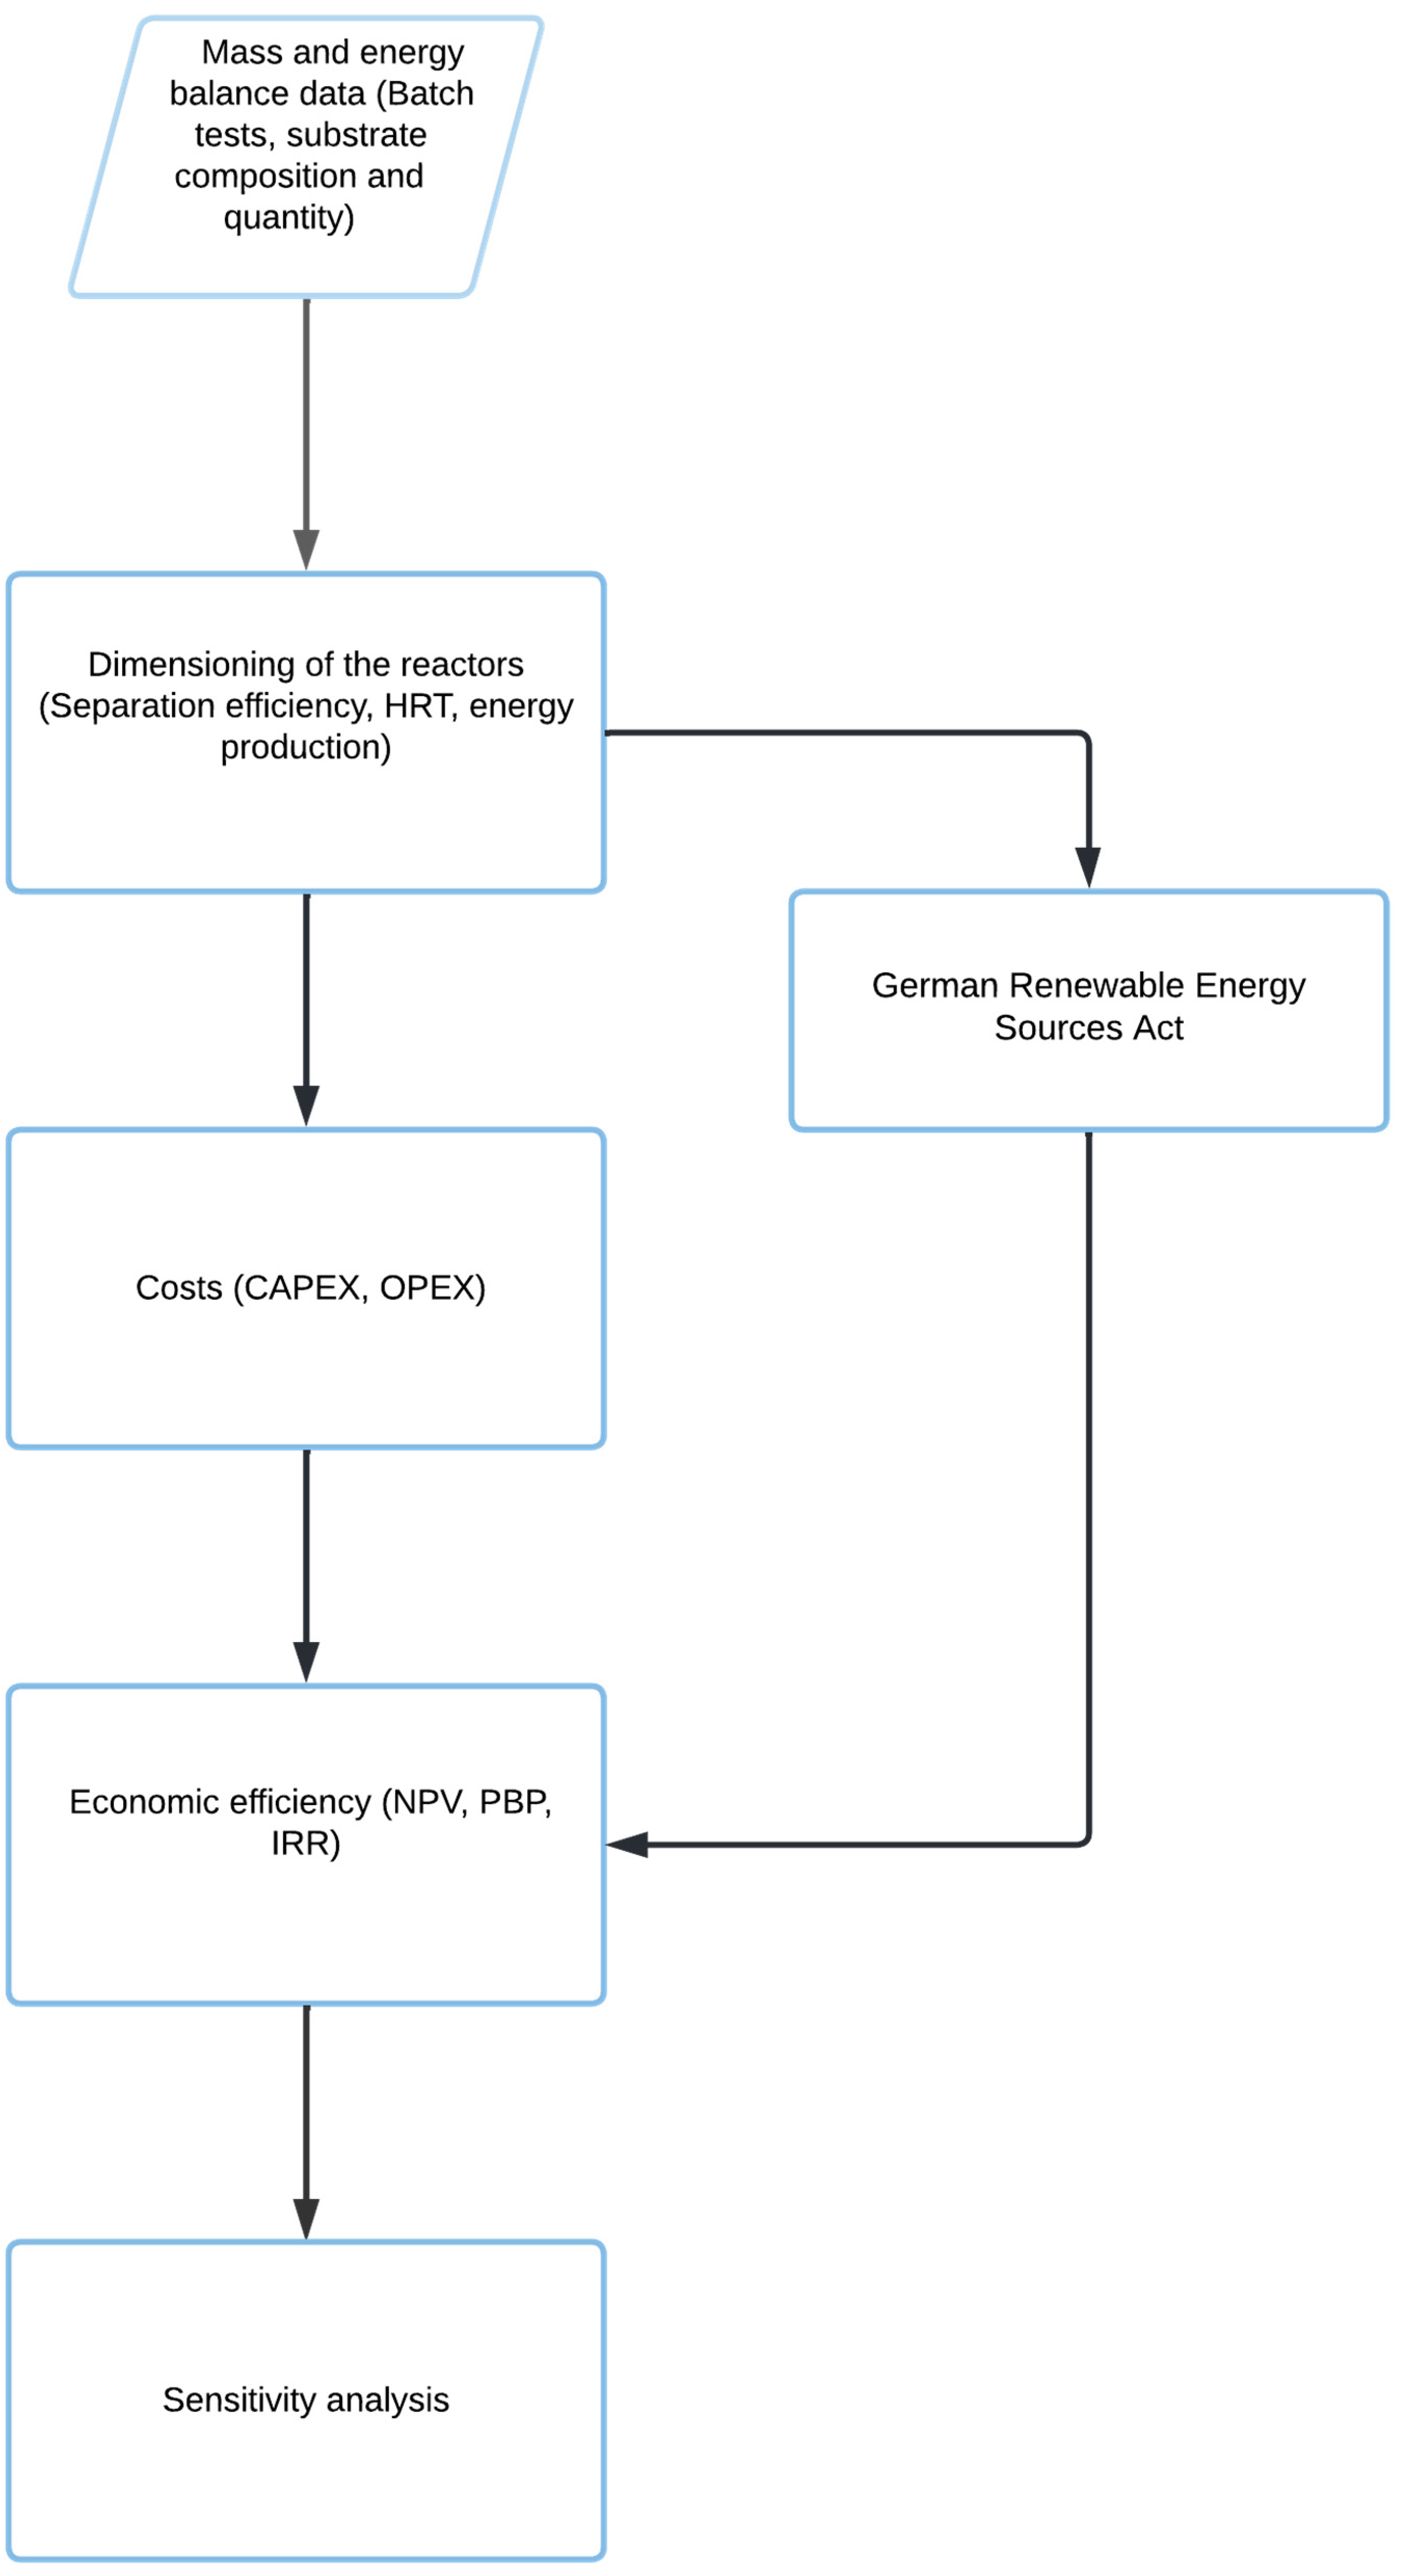
2.5. Economic Assessment Calculation Flow Diagram

Sensitivity Analysis

Sensitivity analysis was conducted to identify the most influential input parameters on the investment’s economic sustainability. Here, three parameters were varied, i.e., HRT, electricity, and heat selling price. These input parameters were varied by ±10%, ±20%, and ±30% compared to the baseline. In addition, the effect of the economy of scale was measured by varying the capacity of the plant for all scenarios because, in many biogas industries, the startup process requires more time, and the plant must occasionally operate at a reduced capacity due to the instability of the process [15]. Note that limiting conditions (NPV = 0) were also investigated for each scheme.

3. Results

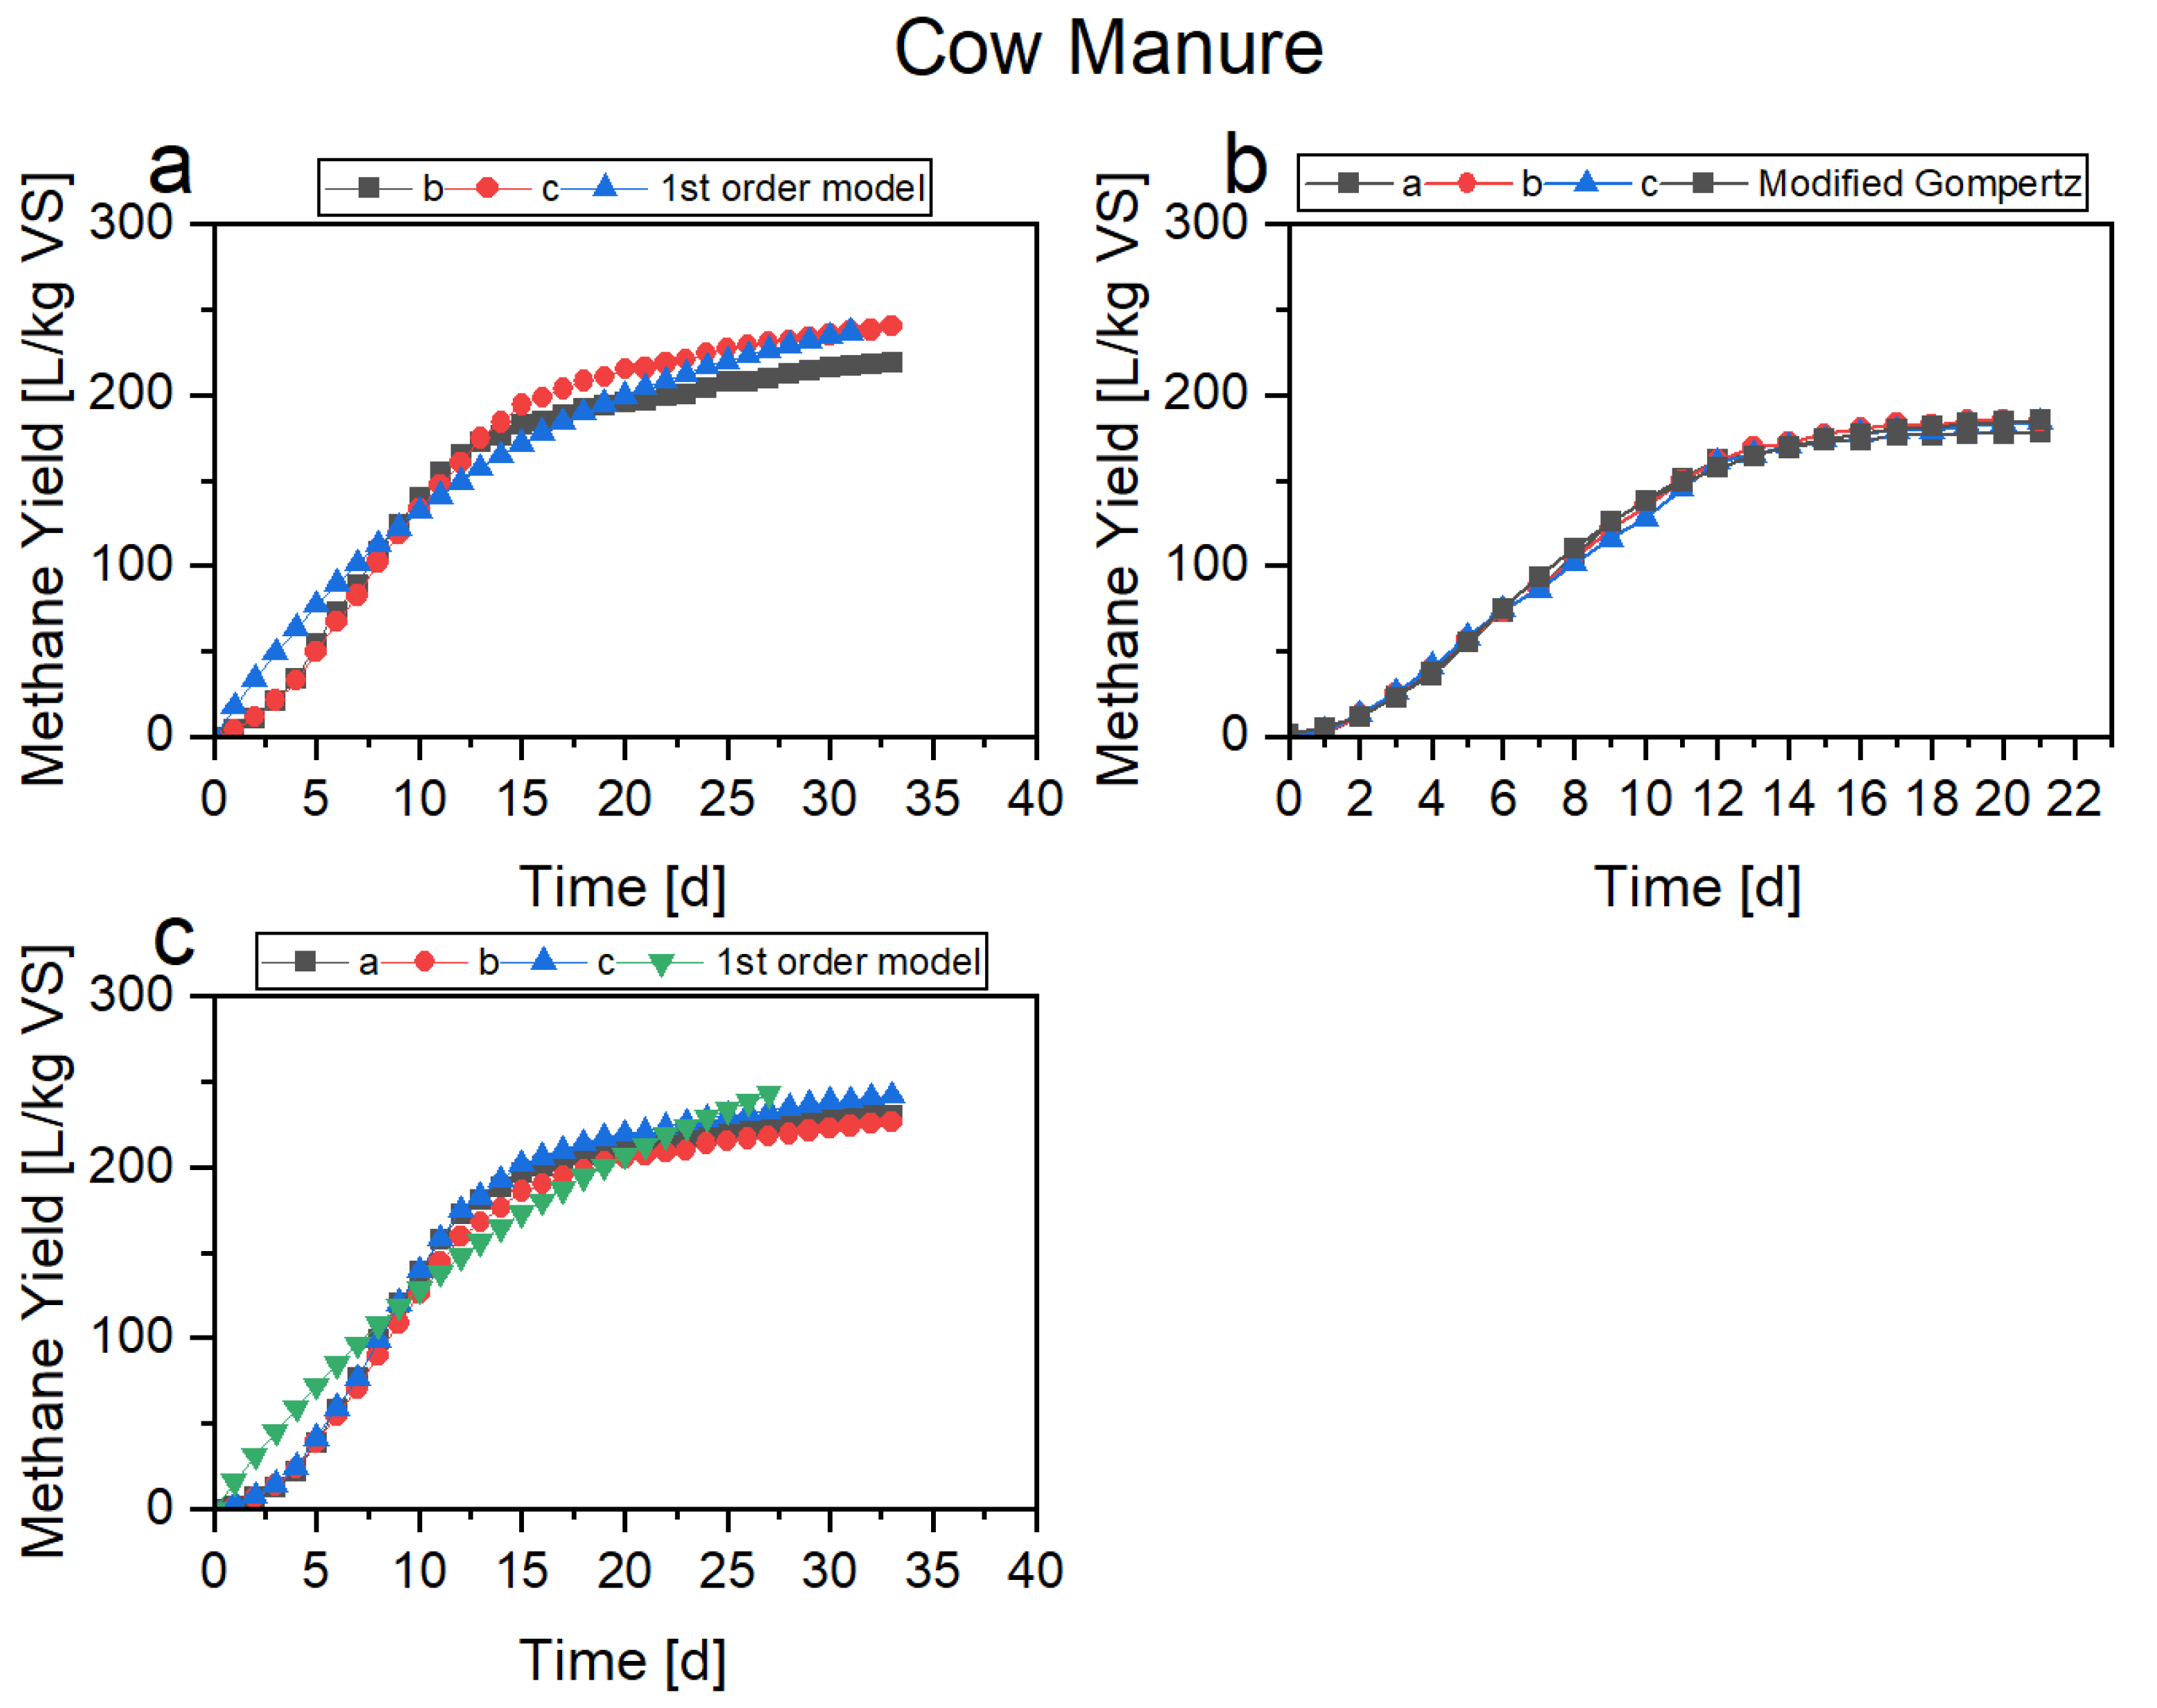
3.1. Batch Test Results

The dispersion analysis of the MYCs identified the presence of one outlier curve for PM raw, PM liquid, and CWM raw, respectively. These individual MYCs were eliminated to maintain a CV of less than 6%. The curves are shown in Figure 3 and Figure 4, where the numbers in the legends represent the valid number of replicates for each curve.
The MYCs of the solid and raw phases of the substrates exhibited slow growth on the first days of the tests, which is in agreement with the liquid phase results reported by Regalado et al. [10]. Regalado et al. [10] identified slow methane production at the beginning of the tests and there were small lag phases. Consequently, the best fit of the three compared models was the modified Gompertz model, as shown in Figure 3b and Figure 4b. Note that the lag phase was present in the raw substrate; thus, in the solid phase, an overestimation of the biogas production is expected for the first days by the first-order model. Nevertheless, the application of the first-order model was in the interest of the research due to the simplicity and the ability to predict the HRT of a CSTR in the continuous phase using the parameters of the fit model using Equation (3) extracted from Weinrich [26].
The fits of the first model for the raw substrate and solid phase of both manure types are summarized in Table 2. As can be seen, the difference between the model and the CMW solid was the largest, which is primarily due to the step lag phase. Consequently, CWM solid also had the lowest fd and relatively short termination of the test by the applied criteria. Despite having an equal k value to the solid PM, the BMP value was much higher, which indicates overestimation by the first-order model.
The raw PM obtained the best fit, and its k value was approximately three times that of the k value for the solid phase. Nevertheless, a higher value of k is expected in the raw phase than in the solid phase, given that the organic matter is more accessible due to solubilization [39]. In addition, the test appeared to reach a degradation value of 0.99 in 27 days. However, the results reported by Regalado et al. [10] for the liquid phase were 444.57 LCH4/kgVS, and a test duration of 17 d if the same 1% criterion is followed.
Thus, despite the encouraging results for the raw PM, a comparison between treatment systems using a combination of solid and liquid phases or only the raw substrate was considered necessary to determine the most profitable alternative.

3.2. Estimation of Hydraulic Retention Times in Continuous Stage

The operational HRTs of the treatment of the solid and raw substrates in the CSTRs were estimated using Equation (3). Here, the target MY value was 0.8 of the BMP value shown in Table 2. For the CWM solid, the target value was the average MY value because the BMP was likely overestimated by the first-order model, as shown in Figure 3c. Nevertheless, the first-order constant of the model was employed in this case. The resulting MY and HRT values are summarized in Table 3.
We found that the raw PM can be processed in less than 30 days, which represents a large time reduction compared to a typical agricultural biogas plant where representative HRT values are between 50 and 150 days [40,41]. Biogas plants at an industrial scale are rarely operated using mono-digestion of manures. Typically, manures are co-digested with substrates with high DM content to increase OLR to take advantage of the co-digestion positive interactions [42,43,44]. Nevertheless, several studies were conducted at the pilot plant scale or under mono-digestion of manures using CSTR technology. For example, Jurado et al. [45] operated a CSTR at an HRT of 25 days, and through the AD model no. 1 (ADM1), they found that the operating time was not sufficiently large to assure disintegration and hydrolysis of the solid manure matter. Consequently, the organic particulate matter did not contribute significantly to methane production. Rodriguez-Verde et al. [46] operated a CSTR with raw pig manure at an HRT value of 20 days. Batstone et al. [32] suggested a layout recommendation for the treatment by reactor type and DM content, being HRT 10 d the lowest achievable for CSTR (mixed reactors) but at DM content lower than 1%. Thus, the HRT is strongly influenced by substrate complexity and DM content. As a result, to ensure a similar substrate degradation in dry anaerobic to the ones achieved in regular or wet AD, higher operational HRTs should be applied since the organic matter is usually less available [33,43,47,48]. Therefore, the model’s predictions are consistent with results reported in the literature regarding industrial use of biogas plants. Nevertheless, studies at lower operating scales suggest that lower HRT values can be realized.
To estimate the HRT of the liquid phase, the model represented by Equation (4) was implemented to determine the HRTs interval for which MPR/MPRmax equal to 50% ± 5% is encountered. Given that the model is purely empirical, it was only valid for the liquid PM. Then, the HRTs of the liquid CWM were determined by multiplying the limits of the HRTs interval from the liquid PM by DM (CWM)/DM(PM). The determination of the HRT for CWM from PM corresponds to an extrapolation of the relationship between HRT and DM in the feed of the reactor for high-rate AD proposed by Batstone et al. (2015). The results are shown in Table 4.
MPR   = 0.2527   ·   OLR   + 0.1292  
A large difference between the HRTs from the liquid PM and CWM was observed as calculated according to the above criteria. Nevertheless, this difference also existed in the treatment of raw substrates using the CSTR reactors despite a critical difference in the underlying assumptions for the HRT estimate. For the CSTR, the calculations were based on batch data, and for the EGSB, the calculations were based on an adjustment by the DM content of the continuous experimental data of the liquid PM obtained in our laboratory. However, large differences were observed between the results of the raw and liquid phases of both PM and CWM.
In Table 5 the results of different studies using similar substrates and reactor technologies are presented.
The calculated values are within the interval reviewed in the literature (Table 4). Lower HRT values and higher OLRs are likely achievable; however, given that MY and COD removal efficiency tends to diminish with lower HRT values [28,29,30], an HRT that assured a more balanced relationship between MPR and substrate usage efficiency was targeted. However, the values for the mono-digestion of liquid CMW in an EGSB reactor are rather large.

3.3. Economic Assessment and Sensitivity Analysis

3.3.1. Capital Expenditures

The economic analysis was performed based on quoted cost curves received for the main equipment. The CAPEX of all treatment schemes at a rated capacity of 99 kWhel is shown in Table 6.
Peters and Timmerhaus [55] recommended Lang factors for the chemical industry with values of 4.13 and 4.83 for plants handling liquids and solids–liquids, respectively. Nevertheless, smaller values are typically used for biogas plants [56,57,58]. Amigun and Blottnitz [56] found that a factor of 2.63 can be used to accurately predict the costs of medium or small biogas plants in Africa, and a smaller value of 1.79 is a better predictor for large plants. Vo et al. [57] employed a factor of 1.79 for a biogas plant with biogas upgrading technology included. Nevertheless, the accuracy of those values was questioned by Kenneth Ndyabawe and William S. Kisaalita [58], who found that the Lang factor should be 2.40–2.98 depending on the location of the plant. Thus, a factor of 2.69 was selected because it is the average of the values reported by Kenneth Ndyabawe and William S. Kisaalita [58].
The total capital investment of the plants was compared to the values reported by Balussou et al. [59]. The comparison was established between treatment scheme 1 and business case A from the work of Balussou et al. [59], which evaluated a typical biogas plant without a biogas upgrading unit with an output of two 380 kWel CHP units for a total value of 760 kWel from Balussou et al. [59]. All purchase costs were adjusted by capacity in consideration of the inflation factor by means of the six-tenths rule and the chemical engineering plant cost index [60]. The obtained value was 1.11 million euros, which has a relative difference of approximately 13.5% from that estimated for treatment scheme 1 in Table 6. Thus, the Lang factor values employed were considered valid for the specific case of Germany.
For both substrates, the costs of investment for all treatment schemes were similar, and those from CWM were consistently slightly more expensive than those from the PM. This difference existed due to the substrate properties because CWM requires higher HRT for all treatment schemes. The OPEX values are shown in Table 7.
As can be seen, the largest operating cost was electricity, which increases with the amount of required substrate. Thus, the costs associated with PM are always higher than those for CWM because the DM content of PM is significantly lower than in CWM. The operation costs were significantly higher in treatment scheme number 2 because only the liquid fraction of the substrate is employed in this scheme.
Introducing the EGSB reactor appreciably increases the electricity consumption of the system due to the high-power consumption of the recirculation pump. Possible alternatives to reduce costs are reducing the up-flow velocity or completely replacing the EGSB with a UASB reactor, which is a very similar high-rate reactor [61,62,63].
The NPV calculations for the base case for each substrate by treatment scheme are shown in Figure 5a,b.
In both cases, the more profitable scheme is the typical agricultural biogas plant, i.e., treatment scheme 1. For both substrates, the investment is recovered between years seven and eight. The other profitable alternative under the basic case involves adding an EGSB reactor to treatment scheme 1, i.e., treatment scheme 3 should be employed to treat CWM. However, the investment is not recovered until after year 13 in this case.
We found that treatment scheme 2 is not profitable under the current conditions, being slightly more profitable for PM than for CWM. The main cause for this lack of profitability was the high operational costs, primarily electricity costs.
The NPVs and IRRs for all alternatives are given in Table 8.
The IRRs of the two alternatives in treatment scheme 1 were appreciably better than the others. However, the alternative with the highest IRR is not always the best option; thus, an incremental analysis of IRR was performed. The results demonstrated that the order among profitable alternatives is treatment scheme 1 (CWM) > treatment scheme 1 (PM) > treatment scheme 3 (CWM). Thus, the treatment schemes involving high-rate reactors should only be used if special financial support for treating very low DM content is applied.

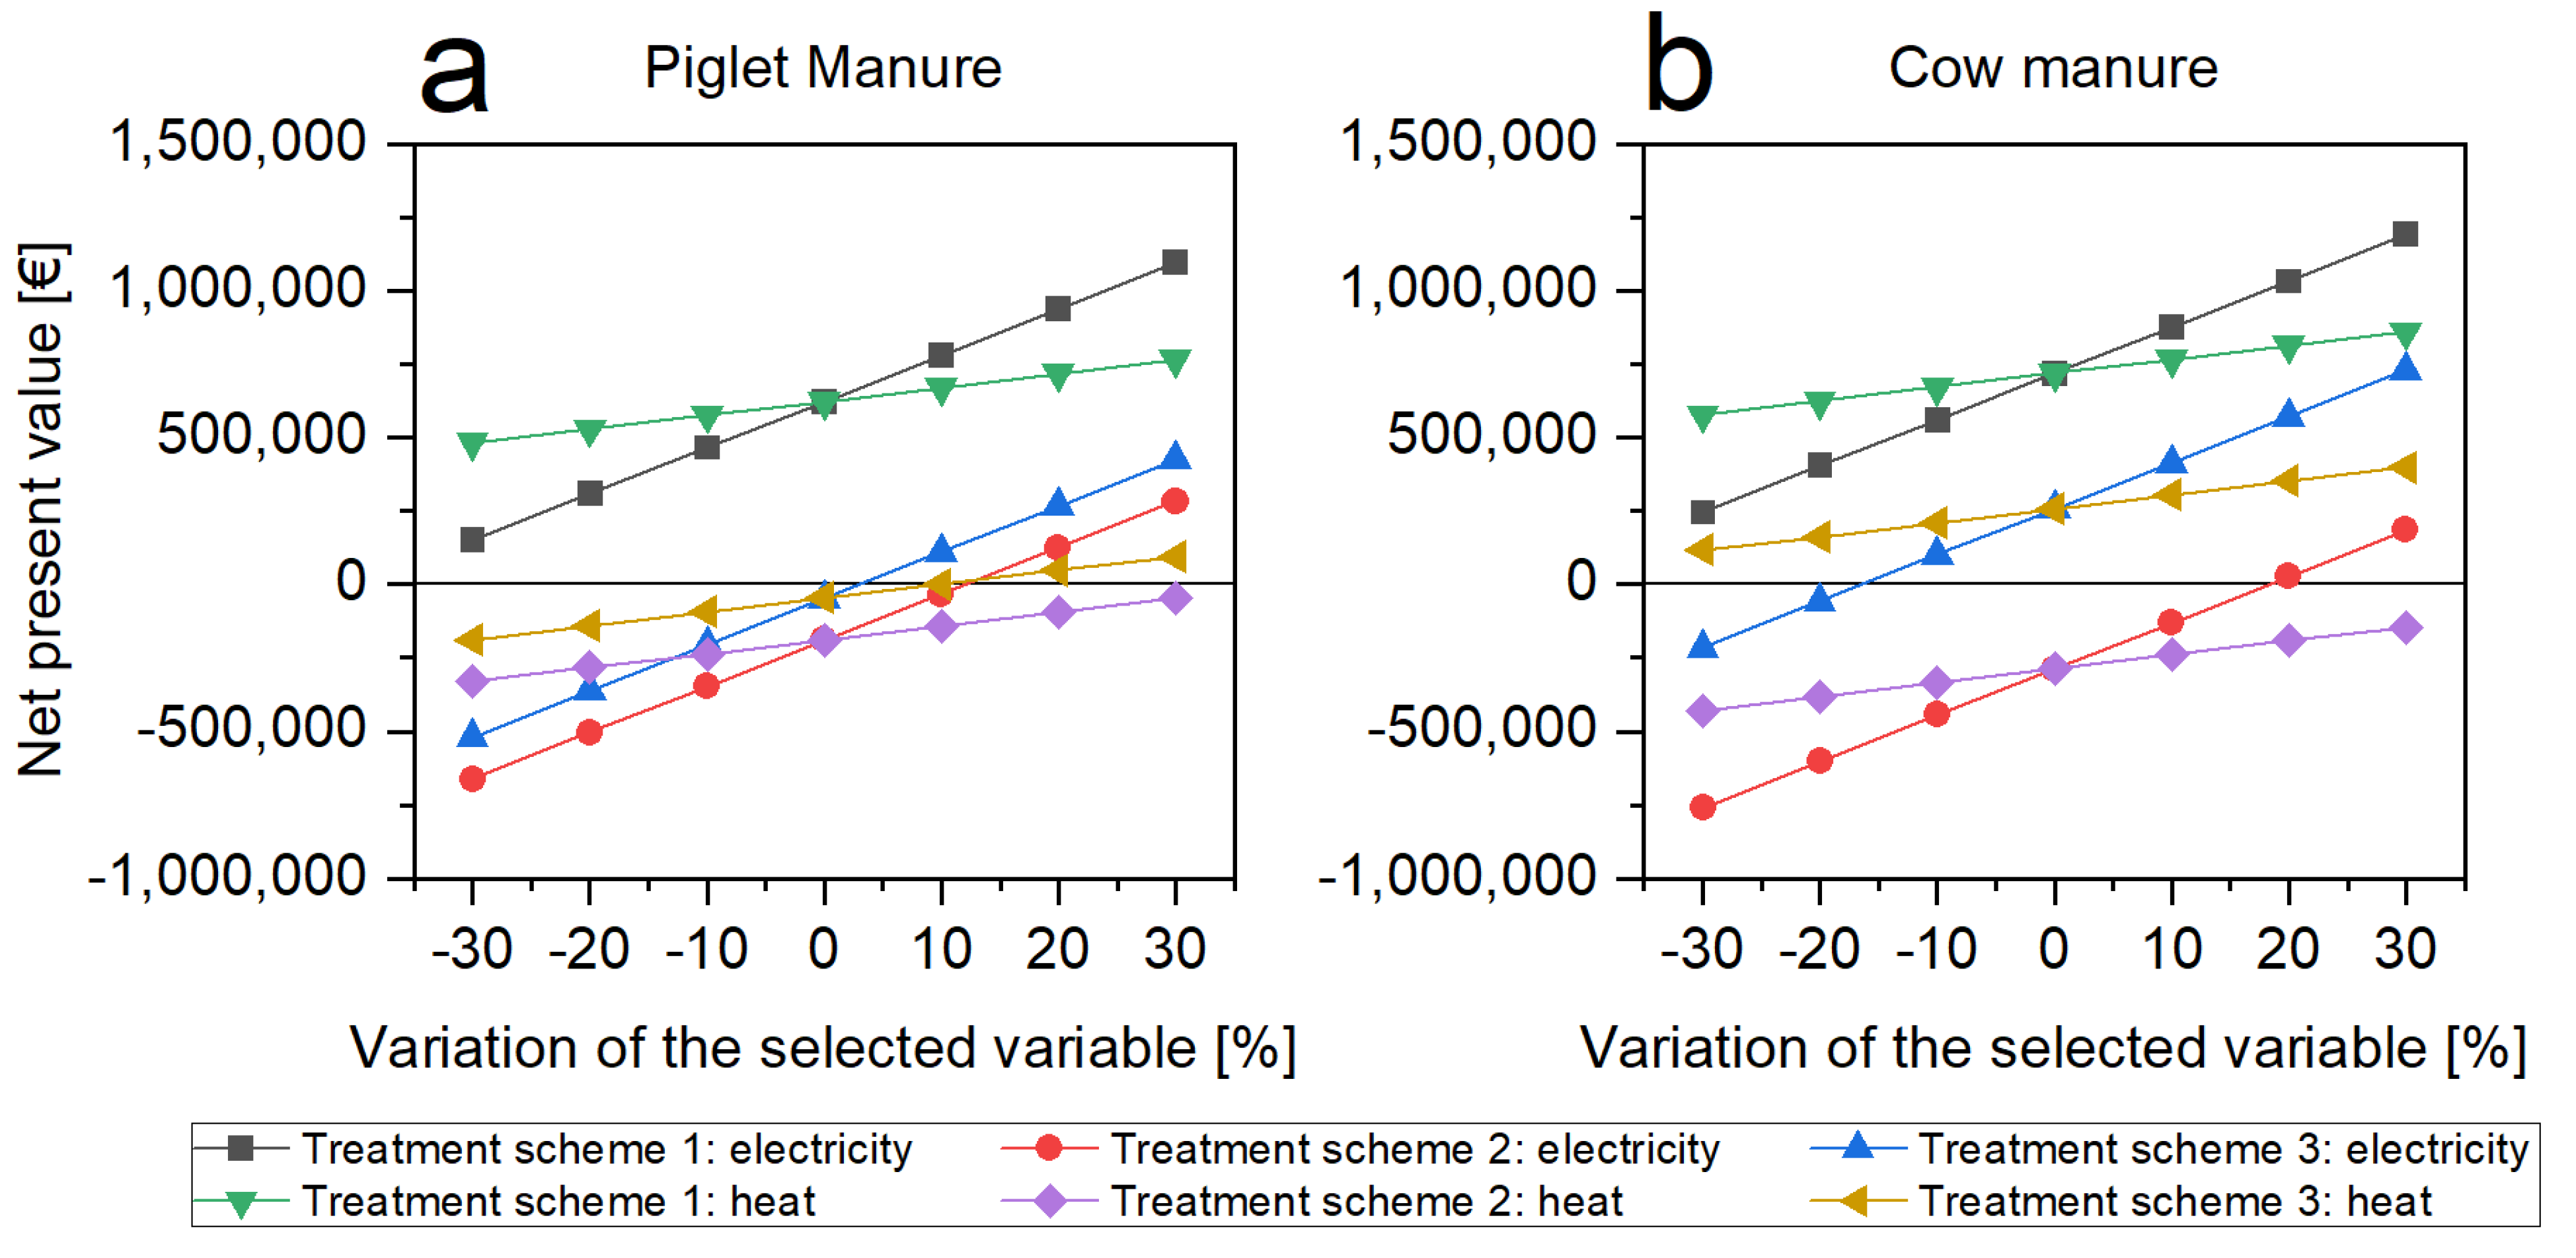
3.3.2. Sensitivity Analysis

To evaluate the profitability of the treatment schemes, a sensitivity analysis of the electricity and heat selling price was conducted for each substrate, where the NPV at year 20 was calculated. The results are summarized in Figure 6a,b.
In both cases, the electricity selling price had a larger influence on the profitability of the schemes than the heat selling price, as shown by the slope in Figure 6a,b. Treatment scheme 1 was profitable under all analysis conditions, which demonstrates the robustness of the system. In contrast, treatment scheme 2 requires an increase in the electricity selling price of 12.06% for PM and 18. 31% for CWM to reach the break-even point. Treatment scheme 3 reached the break-even point at 3.01% for PM and –16.32% in the electricity selling price. Thus, treatment scheme 3 is likely to be profitable based on the recent increments in electricity prices in Europe and specifically in Germany given that the KWh price has risen to 42 cents/kWh for renewable energies [64]. This represents a price increment of 200% of the electricity compared to the reference price used in this study. At such a high price, all treatment schemes are profitable. As a reference, treatment scheme 2 for CWM was the least profitable system, and its IRR changed from 7.00% up to 21.44%.
The most significant change due to heat selling price is realizing the break-even point at approximately 10.05% for PM. Thus, including the EGSB in the typical treatment scheme for both substrates is very close to being profitable.
In addition, sensitivity analysis of the HRT was conducted under the assumption that the MY value remained constant in the interval of ±30% variation in the HRT. The results are shown in Figure 7a,b.
The difference in the slope from the different costs is explained by the difference in electricity costs, which depends on equipment sizing. The high operational costs of the EGSB, particularly electricity costs, are significantly hindered by the applied OLR; hence, the slope of treatment scheme 2 diverges between both substrates. In addition, the break-even point for PM is reached when the HRT value of both reactors in treatment scheme 3 is reduced by 9.12%.
Of the three variables employed in the sensitivity analysis (electricity selling price, heat selling price, and HRT), the most influential variable was the electricity selling price, which currently has reached a price above the highest one analyzed by the sensitivity analysis.

4. Discussion

Biogas plants are much more than energy producers. They are a central piece of sustainable agriculture, especially for livestock farms where optimal use of all resources, including manure, supports increased productivity of grass, forage, and arable land. In addition, the optimal use of livestock manure is a stepping stone on the path to net-zero emissions [65,66]. However, AD involving manure is typically performed using energy crops as a co-substrate, and, in the case of Germany, their mass-specific use is 48% of manures (primarily cattle manure) and 47% of renewable resources (primarily grass silage) [9]. Due to the relatively low fresh mass-specific yields of manures, less than 20% of the energy-related output is attributed to manures [65]. The German government looks forward to encouraging the use of large quantities of manure in biogas plants by providing incentives to plants that digest at least 80% of manure. However, as of 2019, the total number of plants that take advantage of this incentive was less than 15% of all plants [67]. Liebetrau et al. [65] pointed out that the reason for this was that the incentive as written in law for small manure plants only worked for plants with optimal locations with the available substrate to fulfill the installed power of the plant and that the success was hindered by farm size and their distribution in Germany. In addition, less than 20% of the available PM and 33% of available CWM are currently used in German biogas plants. Thus, although economical profitability is an important indicator of project development, it should not be the only factor because digestion of all available manure could save 3.6 million tons of CO2 [65]. Therefore, using an EGSB reactor as an alternative in the mono-digestion of liquid PM and CWM provides an alternative to realize effective digestion [50,51].
However, the relatively high operational costs of EGSB reactors compared to CSTR reactors represent a barrier to their implementation. Despite the advantages of reducing the operating HRTs the associated costs of the substrate and the energy requirement of the recirculation pump mitigate or even negate the advantages afforded by implementing the EGSB reactors. One possible way to address this issue is to reduce the up-flow velocity of the reactor; however, this may negatively impact the reactor’s flow pattern, which may in turn impact reactor performance [68,69]. Thus, an assessment of the most effective up-flow velocity is required because since up-flow velocity involves a tradeoff relationship, i.e., a higher up-flow velocity increases the rate of collisions between suspended particles and sludge, which can improve the reactor’s efficiency. In contrast, increasing up-flow velocity can also increase the hydraulic shearing force, which hinders the effectiveness of the removal mechanism by exceeding the settling velocity of a larger number of particles and breaking up or reducing the size of the biomass granules, thereby reducing efficiency [70]. Thus, experiments can be conducted to determine the optimal recirculation rate in the EGSB reactor to enhance reactor effectiveness while potentially reducing OPEX [71,72].
Another possible solution could be to replace the EGSB reactor with a UASB reactor, which is the precursor of the EGSB, but without recirculation [73,74], which would reduce operational costs. However, the second solution only makes sense if the reduction in the power consumption can mitigate the difference in reactor performance. With the UASB, problems occur more frequently in the flow pattern, e.g., short circuits or dead zones [75,76]; thus, it is not easy to predict if the overall economic efficiency of the UASB reactor will be better than that of the EGSB. Note that other types of high-rate reactors can be also employed, e.g., anaerobic filters, anaerobic membrane bioreactors (AnMBR), and anaerobic sequential batch reactors or fixed bed reactors [77]. However, UASB and EGSB reactors have been proven effective in the treatment of liquid manures [78].
In this study, we found that treatment scheme 1 was the most profitable; however, as mentioned previously, only a small fraction of plants in Germany use large volumes of manures. The flexibility provided by treatment scheme 3 can be exploited by taking advantage of incentives afforded by treating substrates (or mixtures of substrates) that are otherwise not profitable due to low OLR, e.g., PM or wastewaters [65]. Accordingly, Regalado et al. [10] selected optimal mixtures with greater than 80% mass-specific content of manure that demonstrated a possible synergistic effect. This was validated by Regalado et al. [31] in continuous operation mode, thereby proving synergistic effects between triple mixtures of PM, CWM, and either sugar beets or starch wastewater. Therefore, the treatment of liquid agro-industrial mixtures with 80% manure and an optimal C/N ratio in EGSB reactors represents an opportunity that would typically not be realized in a CSTR [65]. In addition, the life cycle assessment by Rodriguez-Verde et al. [46] demonstrated the importance of energy recovery to improve the environmental and economic feasibility of the PM treatment, as well as the improvement in both variables by co-digesting agro-industrial wastes. Prapaspongsa et al. [79] also stated that AD of manure is the most effective technology for energy recovery while retaining good economic sustainability.
As a substrate, CWM is known to be difficult to manage in mono-digestion due to its low degradability because it has already been partially degraded by the microorganisms in the cows and its high nitrogen content [80]. Thus, it is typically either mixed for its treatment with carbon-rich substrates or treated in multistage systems [9,80]. Thus, the increased flexibility of plants that employ treatment scheme 3 would also increase the environmental and economical profitability of the system while avoiding negative effects. Furthermore, tt has been found that the use of slurry or manure as a single substrate or co-substrate in AD improves both the performance and environmental sustainability of the process [46,65,66,81].
Single-stage digesting systems have a wide range of applications due to their low operational complexity and affordability [33]. Nevertheless, AD in multiple stages allows for manipulating the operating variables in each stage in a way that results in optimal conditions for the whole process [80]. Nonetheless, two stages are usually employed for mono- or co-digestion of readily degradable substrates given that the rapidly degradable substrates promote the production of VFAs at a higher rate than those consumed by methanogens, resulting in sudden pH drops and, as a result, process inhibition [17,33,80]. Therefore, multiple stage systems arranged with one first stage for the hydrolysis/acidogenesis and the second tank optimizes the acetogenesis/methanogenesis or hydrolysis/acidogenesis/acetogenesis and the last reactor only with methanogesis do not seem to be very economically effective, given that manures are relatively complex substrates. Nevertheless, some examples of technologically successful applications of two stages systems for manures can be found in Schievano et al. Panichnumsin et al. Demirer and Chen, Nielsen et al. [81,82,83,84].
Furthermore, a different approach for a multistage approach is the treatment of substrate(s) with very different DM content, as pointed out by Van et al. [47]. Van et al. [47] stated that two-stage systems can be better combined as two wet stages or one dry and wet stage, respectively. Hence, the possibility to combine the output of the EGSB with the input of the CSTR will be investigated to optimize the TS3.
Overall, we believe that breakthroughs in the deployment of AD will depend on various technical aspects and incentives provided by the government [66].

5. Conclusions

The typical agricultural biogas proved to be more profitable than the alternative of using either a single-stage EGSB or a multistage EGSB-CSTR to treat the liquid and the solid phase, respectively. Nevertheless, a multistage treatment scheme involving a high-rate reactor offers a possible solution for establishing a better-rounded circular economy. In addition, a multistage system allows treating large quantities of manure that otherwise would not be treated, thereby increasing the amount of carbon-neutral energy output, which is beneficial because energy security is currently a major concern.
In addition, reductions in the OPEX of the EGSB reactor as a result of optimizing up-flow velocity will make multistage treatment more competitive from an economical perspective. Furthermore, co-digestion of manure-based mixtures up to 80% FM of manure can potentially make better use of the EEG incentives for small manure-based AD plants. Thus, further research into the life cycle assessment of the co-digestion of agricultural manure-based mixtures is required.

Author Contributions

Conceptualization, R.E.H.R. and J.H.; methodology, R.E.H.R. and J.H.; software, R.E.H.R. and J.H.; formal analysis, R.E.H.R.; investigation, R.E.H.R.; resources, J.H.; data curation, R.E.H.R.; writing—original draft preparation, R.E.H.R.; writing—review and editing, J.H. and J.T.; visualization, R.E.H.R. and J.H.; supervision, J.T.; project administration, E.B. and J.H.; funding acquisition, E.B. All authors have read and agreed to the published version of the manuscript.

Funding

This research was funded under the Bio-Smart Project. The Bio-Smart project is funded by the Federal Ministry of Food and Agriculture based on a resolution of the German Bundestag (project management agency Fachagentur Nachwachsende Rohstoffe e.V. (FNR), FKZ: 22031318).

Institutional Review Board Statement

Not applicable.

Informed Consent Statement

Not applicable.

Data Availability Statement

The data presented in this study are available on request from the corresponding author.

Conflicts of Interest

The authors declare no conflict of interest.

References

  1. IEA. Global Electricity Demand by Scenario, 2010–2030. Available online: https://www.iea.org/data-and-statistics/charts/global-electricity-demand-by-scenario-2010-2030 (accessed on 18 April 2022).
  2. Organisation for Economic Co-operation and Development OECD. World Energy Outlook 2020; Organisation for Economic Co-operation and Development OECD: Paris, France, 2020; ISBN 9789264621992. [Google Scholar]
  3. Smith, P.; Beaumont, L.; Bernacchi, C.J.; Byrne, M.; Cheung, W.; Conant, R.T.; Cotrufo, F.; Feng, X.; Janssens, I.; Jones, H.; et al. Essential outcomes for COP26. Glob. Chang. Biol. 2022, 28, 1–3. [Google Scholar] [CrossRef] [PubMed]
  4. Arias, P.; Bellouin, N.; Coppola, E.; Jones, R.; Krinner, G.; Marotzke, J.; Naik, V.; Palmer, M.; Plattner, G.-K.; Rogelj, J.; et al. Climate Change 2021: The Physical Science Basis; Contribution of Working Group14 I to the Sixth Assessment Report of the Intergovernmental Panel on Climate Change; Technical Summary; Intergovernmental Panel on Climate Change: Geneva, Switzerland, 2021. [Google Scholar]
  5. Weiland, P. Biogas production: Current state and perspectives. Appl. Microbiol. Biotechnol. 2010, 85, 849–860. [Google Scholar] [CrossRef] [PubMed]
  6. Glivin, G.; Kalaiselvan, N.; Mariappan, V.; Premalatha, M.; Murugan, P.C.; Sekhar, J. Conversion of biowaste to biogas: A review of current status on techno-economic challenges, policies, technologies and mitigation to environmental impacts. Fuel 2021, 302, 121153. [Google Scholar] [CrossRef]
  7. Iglesias, R.; Muñoz, R.; Polanco, M.; Díaz, I.; Susmozas, A.; Moreno, A.D.; Guirado, M.; Carreras, N.; Ballesteros, M. Biogas from Anaerobic Digestion as an Energy Vector: Current Upgrading Development. Energies 2021, 14, 2742. [Google Scholar] [CrossRef]
  8. German Biogas Association. Biogas Market Data in Germany 2020/2021. Available online: https://www.biogas.org/edcom/webfvb.nsf/id/EN-German-biogas-market-data/$file/21-10-14_Biogasindustryfigures_2020-2021_english.pdf (accessed on 15 December 2021).
  9. Weinrich, S.; Nelles, M. Basics of Anaerobic Digestion: Biochemical Conversion and Process Modelling; DBFZ Deutsches Biomasseforschungszentrumgemeinnützige GmbH: Leipzig, Germany, 2021; ISBN 978-3-946629-72-6. [Google Scholar]
  10. Regalado, R.E.H.; Weide, T.; Baumkötter, D.; Wettwer, L.; Häner, J.; Brügging, E.; Tränckner, J. Optimization and Analysis of Liquid Anaerobic Co-Digestion of Agro-Industrial Wastes via Mixture Design. Processes 2021, 9, 877. [Google Scholar] [CrossRef]
  11. Koch, K.; Hafner, S.D.; Weinrich, S.; Astals, S. Identification of Critical Problems in Biochemical Methane Potential (BMP) Tests From Methane Production Curves. Front. Environ. Sci. 2019, 7, 178. [Google Scholar] [CrossRef]
  12. Pagés-Díaz, J.; Pereda-Reyes, I.; Taherzadeh, M.J.; Sárvári-Horváth, I.; Lundin, M. Anaerobic co-digestion of solid slaughterhouse wastes with agro-residues: Synergistic and antagonistic interactions determined in batch digestion assays. Chem. Eng. J. 2014, 245, 89–98. [Google Scholar] [CrossRef] [Green Version]
  13. Raposo, F.; Fernández-Cegrí, V.; de La Rubia, M.A.; Borja, R.; Béline, F.; Cavinato, C.; Demirer, G.; Fernández, B.; Fernández-Polanco, M.; Frigon, J.C.; et al. Biochemical methane potential (BMP) of solid organic substrates: Evaluation of anaerobic biodegradability using data from an international interlaboratory study. J. Chem. Technol. Biotechnol. 2011, 86, 1088–1098. [Google Scholar] [CrossRef]
  14. Wang, Y.; Yang, L.; Li, Y.; Fu, L.; Yuan, C.; Li, Y.; Luo, J. Reactor performance and economic evaluation of singular, binary, and ternary mixing of feedstocks for anaerobic digestion. Environ. Technol. 2019, 42, 1–11. [Google Scholar] [CrossRef]
  15. Rajendran, K.; Kankanala, H.R.; Martinsson, R.; Taherzadeh, M.J. Uncertainty over techno-economic potentials of biogas from municipal solid waste (MSW): A case study on an industrial process. Appl. Energy 2014, 125, 84–92. [Google Scholar] [CrossRef] [Green Version]
  16. de Vrieze, J.; Colica, G.; Pintucci, C.; Sarli, J.; Pedizzi, C.; Willeghems, G.; Bral, A.; Varga, S.; Prat, D.; Peng, L. Resource recovery from pig manure via an integrated approach: A technical and economic assessment for full-scale applications. Bioresour. Technol. 2019, 272, 582–593. [Google Scholar] [CrossRef] [PubMed]
  17. Rabii, A.; Aldin, S.; Dahman, Y.; Elbeshbishy, E. A review on anaerobic co-digestion with a focus on the microbial populations and the effect of multi-stage digester configuration. Energies 2019, 12, 1106. [Google Scholar] [CrossRef] [Green Version]
  18. Zhang, C.; Su, H.; Tan, T. Batch and semi-continuous anaerobic digestion of food waste in a dual solid-liquid system. Bioresour. Technol. 2013, 145, 10–16. [Google Scholar] [CrossRef] [PubMed]
  19. El-Mashad, H.M.; Zhang, R. Biogas production from co-digestion of dairy manure and food waste. Bioresour. Technol. 2010, 101, 4021–4028. [Google Scholar] [CrossRef] [PubMed]
  20. Guidehouse, T.S.; Beyschlag, L.; Bruhin, A.; Kerres, P.; Lotz, B.; Oppermann, L. Climate Action in Figures (2021) (EN)—BMUV-Publikation: Facts, Trends and Incentives for German Climate Policy 2021 Edition. 2021. Available online: https://www.bmuv.de/publikation/climate-action-in-figures-2021-en (accessed on 13 January 2022).
  21. VDI 4630; Fermentation of Organic Materials—Characterisation of the Substrate, Sampling, Collection of Material Data, Fermentation Tests. Association of German Engineers: Düsseldorf, Germany, 2016.
  22. Holliger, C.; Alves, M.; Andrade, D.; Angelidaki, I.; Astals, S.; Baier, U.; Bougrier, C.; Buffière, P.; Carballa, M.; de Wilde, V.; et al. Towards a standardization of biomethane potential tests. Water Sci. Technol. 2016, 74, 2515–2522. [Google Scholar] [CrossRef] [PubMed]
  23. Holliger, C.; Astals, S.; de Laclos, H.F.; Hafner, S.D.; Koch, K.; Weinrich, S. Towards a standardization of biomethane potential tests: A commentary. Water Sci. Technol. 2021, 83, 247–250. [Google Scholar] [CrossRef]
  24. Ebner, J.H.; Labatut, R.A.; Lodge, J.S.; Williamson, A.A.; Trabold, T.A. Anaerobic co-digestion of commercial food waste and dairy manure: Characterizing biochemical parameters and synergistic effects. Waste Manag. 2016, 52, 286–294. [Google Scholar] [CrossRef]
  25. Batstone, D.J.; Tait, S.; Starrenburg, D. Estimation of hydrolysis parameters in full-scale anerobic digesters. Biotechnol. Bioeng. 2009, 102, 1513–1520. [Google Scholar] [CrossRef]
  26. Weinrich, S. Value of Batch Tests for Biogas Potential Analysis: Method Comparison and Challenges of Substrate and Efficiency Evaluation of Biogas Plants; IEA Bioenergy: Dublin, Ireland, 2018; ISBN 1910154482. [Google Scholar]
  27. Häner, J.; Weide, T.; Alexander, N.; Regalado, R.E.H.; Wetter, C.; Brügging, E. Anaerobic Digestion of Pig Slurry in Fixed-Bed and Expanded Ganular Sludge Bed Reactors; MDPI: Basel, Switzerland, 2022. [Google Scholar]
  28. Yu, H.; Wilson, F.; Tay, J.-H. Kinetic analysis of an anaerobic filter treating soybean wastewater. Water Res. 1998, 32, 3341–3352. [Google Scholar] [CrossRef]
  29. Verma, A.K.; Bhunia, P.; Dash, R.R. Carbonaceous organics removal kinetics in an upflow anaerobic sludge blanket (UASB) reactor treating physico-chemically pre-treated textile wastewater. Desalination Water Treat. 2014, 54, 1–12. [Google Scholar] [CrossRef]
  30. Jafarzadeh, M.T.; Jamshidi, N.; Talebiazar, L.; Aslaniavali, R. Performance evaluation of an anaerobic hybrid reactor treating petrochemical effluent. Int. J. Geol. 2021, 14, 51–57. [Google Scholar] [CrossRef]
  31. Regalado, R.E.H.; Häner, J.; Baumkötter, D.; Wettwer, L.; Brügging, E.; Tränckner, J. Continuous Co-Digestion of Agro-Industrial Mixtures in Laboratory Scale Expanded Granular Sludge Bed Reactors. Appl. Sci. 2022, 12, 2295. [Google Scholar] [CrossRef]
  32. Batstone, D.J.; Puyol, D.; Flores-Alsina, X.; Rodríguez, J. Mathematical modelling of anaerobic digestion processes: Applications and future needs. Rev. Environ. Sci. Biotechnol. 2015, 14, 595–613. [Google Scholar] [CrossRef]
  33. Cremonez, P.A.; Teleken, J.G.; Weiser Meier, T.R.; Alves, H.J. Two-Stage anaerobic digestion in agroindustrial waste treatment: A review. J. Environ. Manag. 2021, 281, 111854. [Google Scholar] [CrossRef] [PubMed]
  34. Alfonso-Cardero, A.; Pagés-Díaz, J.; Kalogirou, E.; Psomopoulos, C.S.; Lorenzo-Llanes, J. To dream or not to dream in Havana: Multi-criteria decision-making for material and energy recovery from municipal solid wastes. Environ. Sci. Pollut. Res. Int. 2021, 1–16. [Google Scholar] [CrossRef]
  35. Grantham Research Institute on Climate Change and the Environment. Renewable Energy Sources Act: EEG; Grantham Research Institute on Climate Change and the Environment: London, UK, 2021. [Google Scholar]
  36. Brennan, D.J. Process Industry Economics: Principles, Concepts and Applications, 2nd ed.; Elsevier: San Diego, CA, USA, 2020; ISBN 9780128195604. [Google Scholar]
  37. Alfonso-Cardero, A.; Pagés-Díaz, J.; Contino, F.; Rajendran, K.; Lorenzo-Llanes, J. Process simulation and techno-economic assessment of vinasse-to-biogas in Cuba: Deterministic and uncertainty analysis. Chem. Eng. Res. Des. 2021, 169, 33–45. [Google Scholar] [CrossRef]
  38. Don, W.G.; Robert, H.P. Perry’s Chemical Engineers’ Handbook, 8th ed.; McGraw-Hill: New York, NY, USA, 2008; ISBN 9780071422949. [Google Scholar]
  39. Rico, J.L.; García, H.; Rico, C.; Tejero, I. Characterisation of solid and liquid fractions of dairy manure with regard to their component distribution and methane production. Bioresour. Technol. 2007, 98, 971–979. [Google Scholar] [CrossRef]
  40. Weinrich, S.; Nelles, M. Systematic simplification of the Anaerobic Digestion Model No. 1 (ADM1)—Model development and stoichiometric analysis. Bioresour. Technol. 2021, 333, 125124. [Google Scholar] [CrossRef]
  41. Ruile, S.; Schmitz, S.; Mönch-Tegeder, M.; Oechsner, H. Degradation efficiency of agricultural biogas plants—A full-scale study. Bioresour. Technol. 2015, 178, 341–349. [Google Scholar] [CrossRef]
  42. Tallou, A.; Haouas, A.; Jamali, M.Y.; Atif, K.; Amir, S.; Aziz, F. Review on Cow Manure as Renewable Energy. In Smart Village Technology: Concepts and Developments, 1st ed.; Patnaik, S., Sen, S., Mahmoud, M.S., Eds.; Springer: Cham, Switzerland, 2020; pp. 341–352. ISBN 978-3-030-37794-6. [Google Scholar]
  43. Neshat, S.A.; Mohammadi, M.; Najafpour, G.D.; Lahijani, P. Anaerobic co-digestion of animal manures and lignocellulosic residues as a potent approach for sustainable biogas production. Renew. Sustain. Energy Rev. 2017, 79, 308–322. [Google Scholar] [CrossRef]
  44. Mata-Alvarez, J.; Dosta, J.; Romero-Güiza, M.S.; Fonoll, X.; Peces, M.; Astals, S. A critical review on anaerobic co-digestion achievements between 2010 and 2013. Renew. Sustain. Energy Rev. 2014, 36, 412–427. [Google Scholar] [CrossRef]
  45. Jurado, E.; Antonopoulou, G.; Lyberatos, G.; Gavala, H.N.; Skiadas, I.V. Continuous anaerobic digestion of swine manure: ADM1-based modelling and effect of addition of swine manure fibers pretreated with aqueous ammonia soaking. Appl. Energy 2016, 172, 190–198. [Google Scholar] [CrossRef] [Green Version]
  46. Rodriguez-Verde, I.; Regueiro, L.; Carballa, M.; Hospido, A.; Lema, J.M. Assessing anaerobic co-digestion of pig manure with agroindustrial wastes: The link between environmental impacts and operational parameters. Sci. Total Environ. 2014, 497–498, 475–483. [Google Scholar] [CrossRef]
  47. Van, D.P.; Fujiwara, T.; Leu Tho, B.; Song Toan, P.P.; Hoang Minh, G. A review of anaerobic digestion systems for biodegradable waste: Configurations, operating parameters, and current trends. Environ. Eng. Res. 2020, 25, 1–17. [Google Scholar] [CrossRef] [Green Version]
  48. Rocamora, I.; Wagland, S.T.; Villa, R.; Simpson, E.W.; Fernández, O.; Bajón-Fernández, Y. Dry anaerobic digestion of organic waste: A review of operational parameters and their impact on process performance. Bioresour. Technol. 2020, 299, 122681. [Google Scholar] [CrossRef] [PubMed]
  49. Weide, T. Biochemical Conversion of Liquid, Biogenous Waste Resources via Anaerobic High Performance Reactors for the Optimization of Conventional Biogas Processes. 2017. Available online: https://www.hb.fh-muenster.de/opus4/frontdoor/index/index/start/27/rows/10/sortfield/score/sortorder/desc/searchtype/simple/query/wetter/author_facetfq/Wetter%2C+Christof/yearfq/2017/docId/8834 (accessed on 18 April 2022).
  50. Rico, C.; Rico, J.L.; Lasa, C. Anaerobic digestion of the liquid fraction of dairy manure separated by screw pressing and centrifugation in a upflow anaerobic sludge blanket reactor at 25 °C. Biosyst. Eng. 2012, 112, 344–351. [Google Scholar] [CrossRef]
  51. Rico, C.; Montes, J.A.; Rico, J.L. Evaluation of different types of anaerobic seed sludge for the high rate anaerobic digestion of pig slurry in UASB reactors. Bioresour. Technol. 2017, 238, 147–156. [Google Scholar] [CrossRef] [PubMed] [Green Version]
  52. Castrillón, L.; Vázquez, I.; Marañón, E.; Sastre, H. Anaerobic thermophilic treatment of cattle manure in UASB reactors. Waste Manag. Res. 2002, 20, 350–356. [Google Scholar] [CrossRef] [Green Version]
  53. Marañón, E.; Castrillón, L.; Vázquez, I.; Sastre, H. The influence of hydraulic residence time on the treatment of cattle manure in UASB reactors. Waste Manag. Res. 2001, 19, 436–441. [Google Scholar] [CrossRef]
  54. Lee, Y.-S.; Han, G.-B. Pig slurry treatment by a hybrid multi-stage unit system consisting of an ATAD and an EGSB followed by a SBR reactor. Biosyst. Eng. 2012, 111, 243–250. [Google Scholar] [CrossRef]
  55. Peters, M.S.; Timmerhaus, K.D. Plant Design and Economics for Chemical Engineers, 4th ed.; McGraw-Hill: New York, NY, USA, 1991; ISBN 9780070496132. [Google Scholar]
  56. Amigun, B.; von Blottnitz, H. Capital cost prediction for biogas installations in Africa: Lang factor approach. Environ. Prog. Sustain. Energy 2009, 28, 134–142. [Google Scholar] [CrossRef]
  57. Vo, T.T.; Wall, D.M.; Ring, D.; Rajendran, K.; Murphy, J.D. Techno-economic analysis of biogas upgrading via amine scrubber, carbon capture and ex-situ methanation. Appl. Energy 2018, 212, 1191–1202. [Google Scholar] [CrossRef]
  58. Ndyabawe, K.; Kisaalita, W.S. Validity of the Africa-wide Lang factor of 2.63 for estimating small biogas plant installation costs in Uganda. Int. J. Agric. Biol. Eng. 2014, 7, 70–76. [Google Scholar] [CrossRef]
  59. Balussou, D.; Kleyböcker, A.; McKenna, R.; Möst, D.; Fichtner, W. An Economic Analysis of Three Operational Co-digestion Biogas Plants in Germany. Waste Biomass Valor. 2012, 3, 23–41. [Google Scholar] [CrossRef] [Green Version]
  60. Sinnott, R.K.; Towler, G.P. Chemical Engineering Design: SI Edition, 6th ed.; Butterworth-Heinemann, Elsevier: Oxford, UK, 2020; ISBN 9780081026007. [Google Scholar]
  61. Teixeira Corrêia, G.; Pérez-Pérez, T.; Pereda-Reyes, I.; Merencio, D.O.; Zaiat, M.; Kwong, W.H. Mathematical Modeling of the Hydrodynamics of an EGSB Reactor. J. Chem. Chem. Eng. 2014, 8, 602–610. [Google Scholar]
  62. Cruz-Salomón, A.; Ríos-Valdovinos, E.; Pola-Albores, F.; Lagunas-Rivera, S.; Meza-Gordillo, R.; Ruíz-Valdiviezo, V. Evaluation of Hydraulic Retention Time on Treatment of Coffee Processing Wastewater (CPWW) in EGSB Bioreactor. Sustainability 2018, 10, 83. [Google Scholar] [CrossRef] [Green Version]
  63. Londoño, Y.A.; Castrillón, L.V.; Pino, N.J.; Chica, E.L.; Peñuela, G.A. Analysis and Modeling of the Hydraulic Behavior of EGSB Reactors with Presence and Absence of Granular Biomass at Different Hydraulic Retention Times. Ing. Investig. 2019, 39. [Google Scholar] [CrossRef] [Green Version]
  64. tttStrompreise. Available online: https://www.stromauskunft.de/strompreise/ (accessed on 11 April 2022).
  65. Liebetrau, J.; O’Shea, R.; Wellisch, M.; Lyng, K.-A.; Bochmann, G.; McCabe, B.K.; Harris, P.W.; Lukehurst, C.; Kornatz, P.; Murphy, J.D. Potential and Utilization of Manure to Generate Biogas in Seven Countries; IEA Bioenergy: Paris, France, 2021. [Google Scholar]
  66. Bywater, A.; Kusch-Brandt, S. Exploring Farm Anaerobic Digester Economic Viability in a Time of Policy Change in the UK. Processes 2022, 10, 212. [Google Scholar] [CrossRef]
  67. Majer, S.; Kornatz, P.; Daniel-Gromke, J.; Rensberg, N.; Brosowski, A.; Oehmichen, K.; Liebetrau, J. (Eds.) Stand und Perspektiven der Biogaserzeugung aus Gülle; Deutsches Biomasseforschungszentrum Gemeinnützige GmbH: Leipzig, Germany, 2019; ISBN 9783946629481. [Google Scholar]
  68. Cruz-Salomón, A.; Ríos-Valdovinos, E.; Pola-Albores, F.; Lagunas-Rivera, S.; Meza-Gordillo, R.; Ruíz-Valdiviezo, V.M.; Cruz-Salomón, K.C. Expanded granular sludge bed bioreactor in wastewater treatment. Glob. J. Environ. Sci. Manag. 2019, 5, 119–138. [Google Scholar] [CrossRef]
  69. Mahmoud, N.; Zeeman, G.; Gijzen, H.; Lettinga, G. Solids removal in upflow anaerobic reactors, a review. Bioresour. Technol. 2003, 90, 1–9. [Google Scholar] [CrossRef]
  70. Ratanatamskul, C.; Siritiewsri, T. A compact on-site UASB–EGSB system for organic and suspended solid digestion and biogas recovery from department store wastewater. Int. Biodeterior. Biodegrad. 2015, 102, 24–30. [Google Scholar] [CrossRef]
  71. van der Last, A.R.M.; Lettinga, G. Anaerobic Treatment of Domestic Sewage under Moderate Climatic (Dutch) Conditions Using Upflow Reactors at Increased Superficial Velocities. Water Sci. Technol. 1992, 25, 167–178. [Google Scholar] [CrossRef]
  72. Fuentes, M.; Scenna, N.J.; Aguirre, P.A. A coupling model for EGSB bioreactors: Hydrodynamics and anaerobic digestion processes. Chem. Eng. Process. Process Intensif. 2011, 50, 316–324. [Google Scholar] [CrossRef]
  73. López, I.; Borzacconi, L. Modelling of an EGSB treating sugarcane vinasse using first-order variable kinetics. Water Sci. Technol. 2011, 64, 2080–2088. [Google Scholar] [CrossRef] [PubMed]
  74. Bhattacharyya, D.; Singh, K.S. Understanding the Mixing Pattern in an Anaerobic Expanded Granular Sludge Bed Reactor: Effect of Liquid Recirculation. J. Environ. Eng. 2010, 136, 576–584. [Google Scholar] [CrossRef]
  75. Pérez-Pérez, T.; Correia, G.T.; Kwong, W.H.; Pereda-Reyes, I.; Oliva-Merencio, D.; Zaiat, M. Effects of the support material addition on the hydrodynamic behavior of an anaerobic expanded granular sludge bed reactor. J. Environ. Sci. 2017, 54, 224–230. [Google Scholar] [CrossRef] [PubMed]
  76. Khanal, S.K. Anaerobic Biotechnology for Bioenergy Production: Principles and Applications; Wiley-Blackwell: Ames, IA, USA, 2008. [Google Scholar]
  77. Kougias, P.G.; Angelidaki, I. Biogas and its opportunities—A review. Front. Environ. Sci. Eng. 2018, 12, 14. [Google Scholar] [CrossRef]
  78. Prapaspongsa, T.; Poulsen, T.G.; Hansen, J.A.; Christensen, P. Energy production, nutrient recovery and greenhouse gas emission potentials from integrated pig manure management systems. Waste Manag. Res. 2010, 28, 411–422. [Google Scholar] [CrossRef]
  79. Dareioti, M.A.; Vavouraki, A.I.; Tsigkou, K.; Kornaros, M. Assessment of Single- vs. Two-Stage Process for the Anaerobic Digestion of Liquid Cow Manure and Cheese Whey. Energies 2021, 14, 5423. [Google Scholar] [CrossRef]
  80. Theuerl, S.; Herrmann, C.; Heiermann, M.; Grundmann, P.; Landwehr, N.; Kreidenweis, U.; Prochnow, A. The Future Agricultural Biogas Plant in Germany: A Vision. Energies 2019, 12, 396. [Google Scholar] [CrossRef] [Green Version]
  81. Schievano, A.; Tenca, A.; Scaglia, B.; Merlino, G.; Rizzi, A.; Daffonchio, D.; Oberti, R.; Adani, F. Two-stage vs single-stage thermophilic anaerobic digestion: Comparison of energy production and biodegradation efficiencies. Environ. Sci. Technol. 2012, 46, 8502–8510. [Google Scholar] [CrossRef] [PubMed]
  82. Panichnumsin, P.; Nopharatana, A.; Ahring, B.K.; Chaiprasert, P. Enhanced biomethanation in co-digestion of Cassava pulp and pig manure using a two-phase anaerobic system. J. Sustain. Energy Environ. 2012, 3, 73–79. [Google Scholar]
  83. Demirer, G.N.; Chen, S. Two-phase anaerobic digestion of unscreened dairy manure. Process Biochem. 2005, 40, 3542–3549. [Google Scholar] [CrossRef]
  84. Nielsen, H.B.; Mladenovska, Z.; Westermann, P.; Ahring, B.K. Comparison of two-stage thermophilic (68 °C/55 °C) anaerobic digestion with one-stage thermophilic (55 °C) digestion of cattle manure. Biotechnol. Bioeng. 2004, 86, 291–300. [Google Scholar] [CrossRef]
Figure 1. Pig and cow manure anaerobic digestion in (a) treatment scheme 1, (b) treatment scheme 2, and (c) treatment scheme 3.
Energies 15 04413 g001
Figure 2. HRT: hydraulic retention time; CAPEX: capital expenditures; OPEX: operational expenditures; NPV: the net present value; IRR: internal rate of return; PBP: payback period.
Energies 15 04413 g002
Figure 3. Methane yield curves of piglet manure: (a) raw, (b) liquid, and (c) solid.
Energies 15 04413 g003
Figure 4. Methane yield curves of cow manure: (a) raw, (b) liquid, and (c) solid.
Energies 15 04413 g004
Figure 5. Cumulative discounted cashflow diagrams by treatment schemes for (a) piglet and (b) cow manure.
Energies 15 04413 g005
Figure 6. Sensitivity analysis of NPV by electricity and selling price for different treatment schemes for (a) piglet manure and (b) cow manure.
Energies 15 04413 g006
Figure 7. Sensitivity analysis of NPV by hydraulic retention time for different treatment schemes for (a) piglet manure and (b) cow manure.
Energies 15 04413 g007
Table 1. Characterization of the liquid fraction of substrates.
VariablePiglet ManureCow Manure
SolidRawLiquidSolidRawLiquid
DM/FM (wt%)17.503.801.8026.707.305.30
VS/FM (wt%)90.1367.9058.3389.0378.5069.81
VS/DM (wt%)15.772.581.0523.775.733.70
Crude protein/FM (wt%)2.402.500.802.502.402.60
Crude fat/FM (wt%)0.400.300.250.300.300.30
Crude fiber/FM (wt%)5.700.000.009.301.400.00
Free nitrogen extracts/FM (wt%)7.500.000.0011.701.600.80
ash/FM (wt%)1.501.000.752.901.601.60
DM: dry matter; VS: volatile solids; FM: fresh matter.
Table 2. Summary of batch test results.
ParameterPiglet Manure SolidPiglet Manure RawCow Manure SolidCow Manure Raw
BMP (LCH4/kgVS)280.85359.77327.31270.98
k (1/d)0.050.140.050.07
RMSE (LCH4/kgVS)12.743.1718.1613.31
MYAVG (LCH4/kgVS)229.80356.24224.49227.30
fd0.820.990.680.84
Time (d)39272731
BMP∞: biomethane potential; k: first-order reaction constant; RMSE: root mean square error; MYAVG: average methane yield; fd: degradation fraction; Time: test duration.
Table 3. Estimation of operational hydraulic retention times in continuous stirred tank reactor.
ParameterPiglet Manure SolidPiglet Manure RawCow Manure SolidCow Manure Raw
MY224.68287.81224.49216.78
HRT81.8028.0679.9159.99
MY: methane yield; HRT: hydraulic retention time.
Table 4. Estimation of operational hydraulic retention time interval in expandable granular sludge bed reactors.
Substrate DM/FM (wt%)CODaverage (gCOD/L)OLR Interval (gCOD/L/d)HRT Interval (d)
Piglet manure liquid1.8025.48[4.63–5.77][4.41–5.50]
Cow manure liquid 5.3028.06[1.73–2.15][13.00–16.20]
DM: dry matter; FM: fresh matter; COD: chemical oxygen demand; OLR: organic loading rate; HRT: hydraulic retention time.
Table 5. Comparison of previous studies to the current research on the achievable hydraulic retention times of different manures.
SubstrateReactor TypeTemperature (°C)OLRmax (gCOD/L/d)HRTmin (d)Reference
Pig manure hydrolysatesEGSB35211.5[46]
Separated pig manureFB401.8218[49]
Liquid fraction of dairy manureUASB250.6534.8[50]
Pig slurryUASB3616.41.5[51]
Cattle manureUASB555.067.3[52]
Cattle manureUASB378.635.3[53]
Pig slurryATAD + EGSB + SBR355.006.96[54]
Filtered pig slurryFB4013.51.7[27]
Filtered pig slurryEGSB408.13.0[27]
EGSB: expanded granular sludge bed; FB: fixed bed; UASB: up-flow anaerobic sludge blanket; ATAD: autothermal thermophilic aerobic digestion; SBR: sequencing batch reactor.
Table 6. Capital expenditures by substrate and treatment scheme.
Capital Expenditure (EUR)Treatment Scheme 1Treatment Scheme 2Treatment Scheme 3
Piglet ManureCow ManurePiglet
Manure
Cow
Manure
Piglet
Manure
Cow
Manure
EGSB reactor and associated costs--241,153361,016213,157232,913
CSTR and associated costs181,644204,927--74,19087,583
Separator--10,37817,368859611,200
Combined heat and power unit175,000175,000175,000175,000175,000175,000
Lang factor for the fixed plant cost 2.692.692.692.692.692.69
Total Invest959,3721,022,0041,147,3681,488,6031,266,8371,363,012
Table 7. Operational expenditures by substrate and treatment scheme.
Operational Expenditures (EUR/Year)Treatment Scheme 1Treatment Scheme 2Treatment Scheme 3
Piglet ManureCow ManurePiglet
Manure
Cow
Manure
Piglet
Manure
Cow
Manure
Electricity costs24,97413,27990,35365,68266,00228,076
Wage rate547554755475547554755475
Transport costs raw manure13,875622121,08317,23115,4015524
Internal power consumption10,19310,94410,92710,92710,19310,944
Total operational costs54,51635,919127,83799,31497,07150,019
Table 8. Net present values and internal rate of return of the different treatment schemes.
Dynamic Economic IndicatorTreatment Scheme 1Treatment Scheme 2Treatment Scheme 3
Piglet ManureCow ManurePiglet
Manure
Cow
Manure
Piglet
Manure
Cow
Manure
Net present value (EUR)622,383718,084−189,836−288,237−47,373257,034
Internal return rate (%)18.7019.407.497.009.4412.67
Publisher’s Note: MDPI stays neutral with regard to jurisdictional claims in published maps and institutional affiliations.

