
An Experimental Study of Drift Caused by Partial Shading Using a Modified DC-(P&O) Technique for a Stand-Alone PV System


Abstract
:1. Introduction
1.1. Background, Related Research, and Motivation
1.2. Research Gap
1.3. Contribution and Case Description
- In this research, a modified fast-tracking DC-(P&O) approach was used to facilitate the determination of MPP at a certain position;
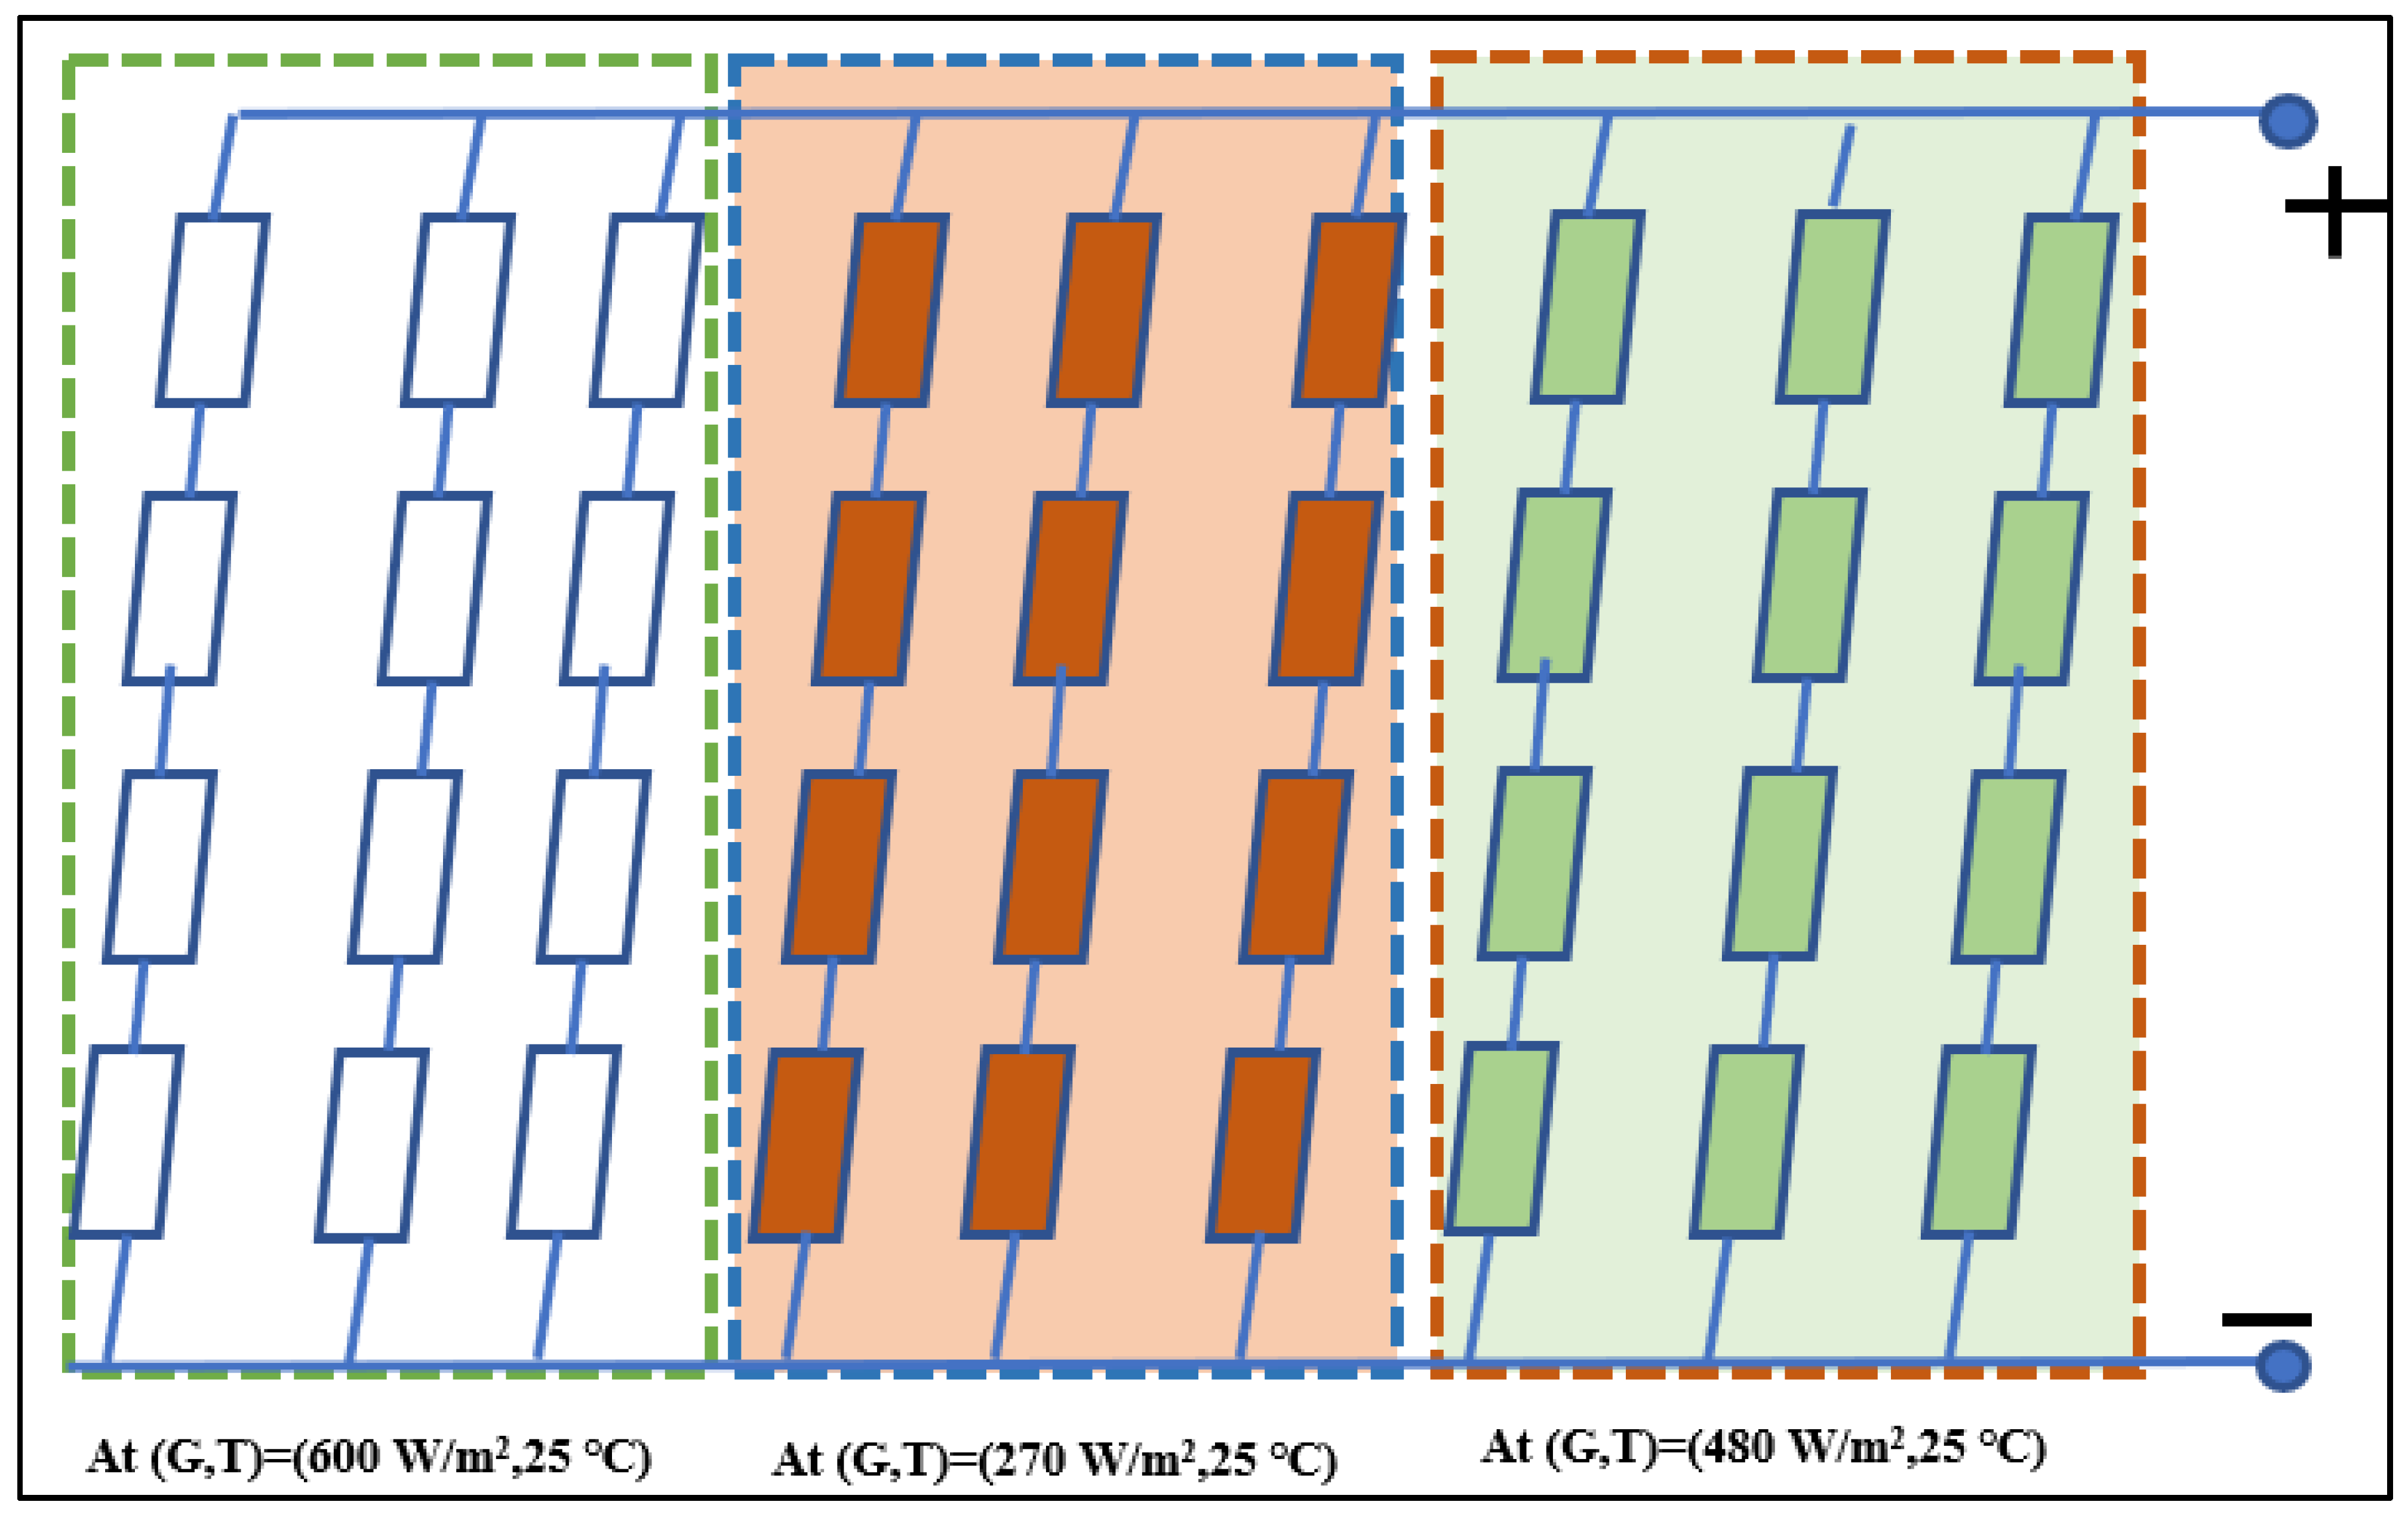
- A 40 W PV panel consisting of 36 cells, with 4 rows each having 9 cells with a DC load, was used to prepare an experimental setup on which the PS effect of 30% was observed;
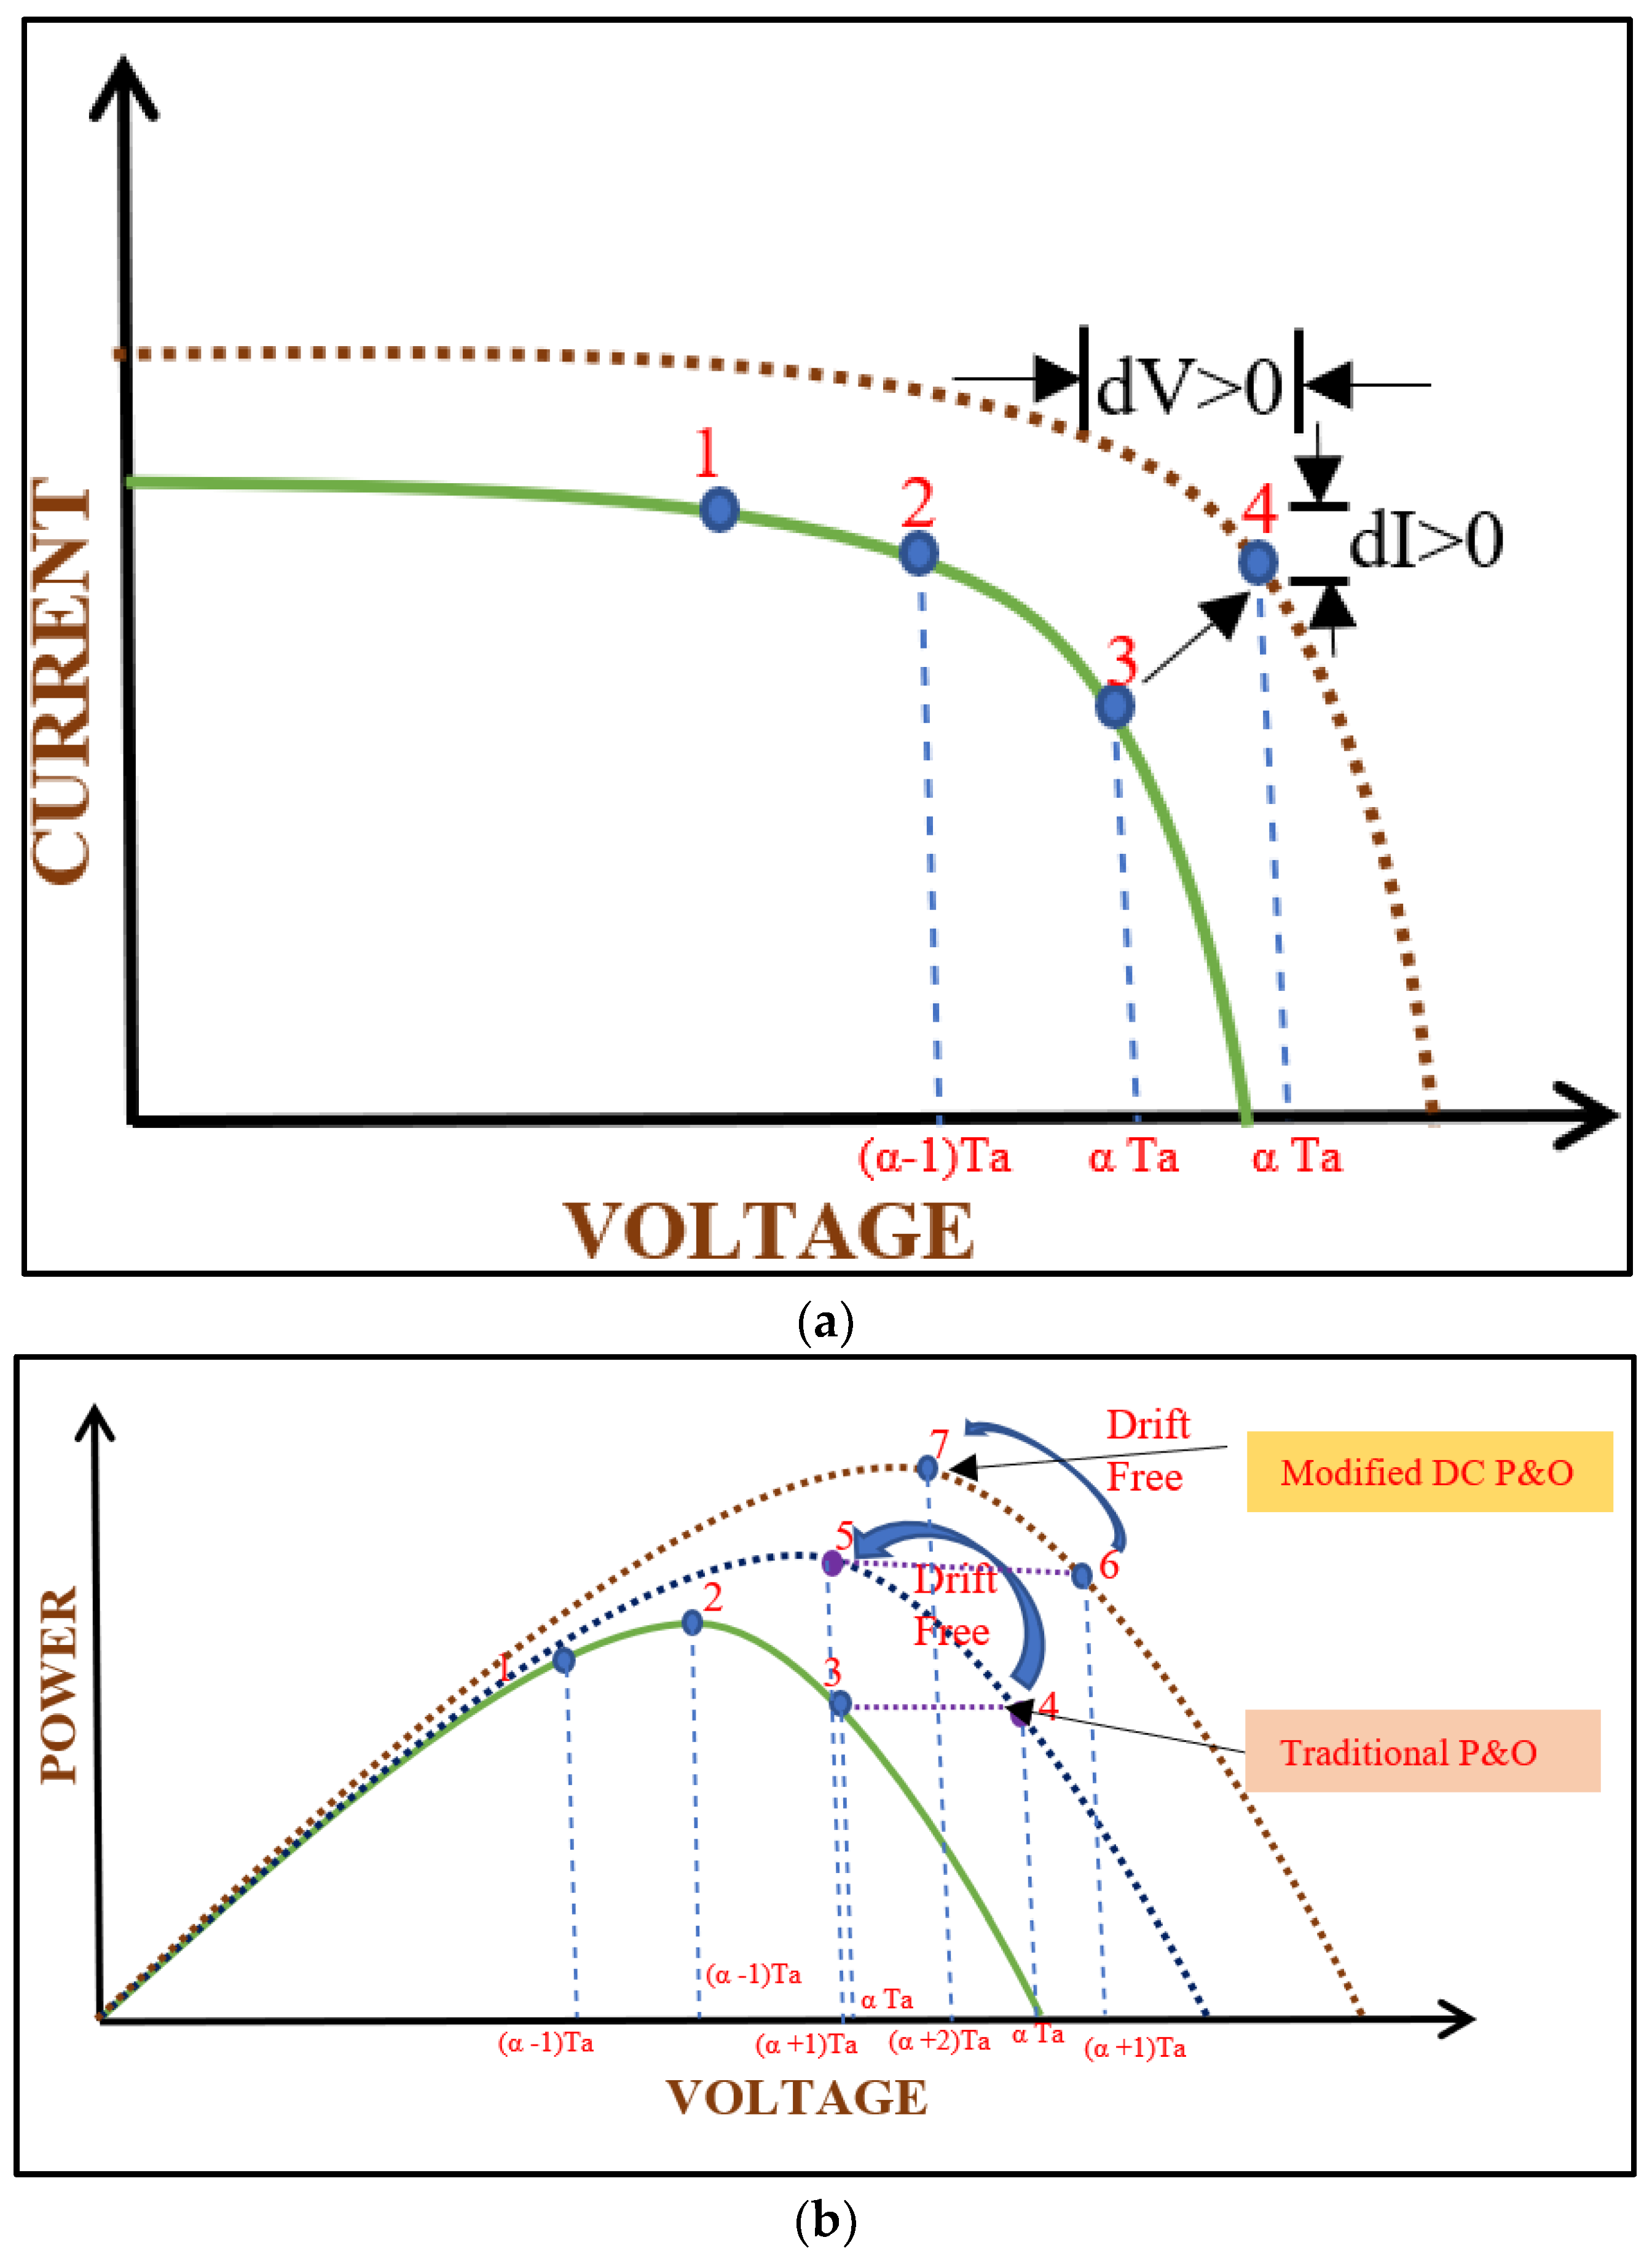
- In this study, it was found that modified DC-(P&O) can control and trace MPP during darkened conditions with the help of slope position on PV characteristics. If , then MPP will be on the left, and otherwise on the right;
- The proposed study provides a solution to drift when rapid changes occur in the environment.
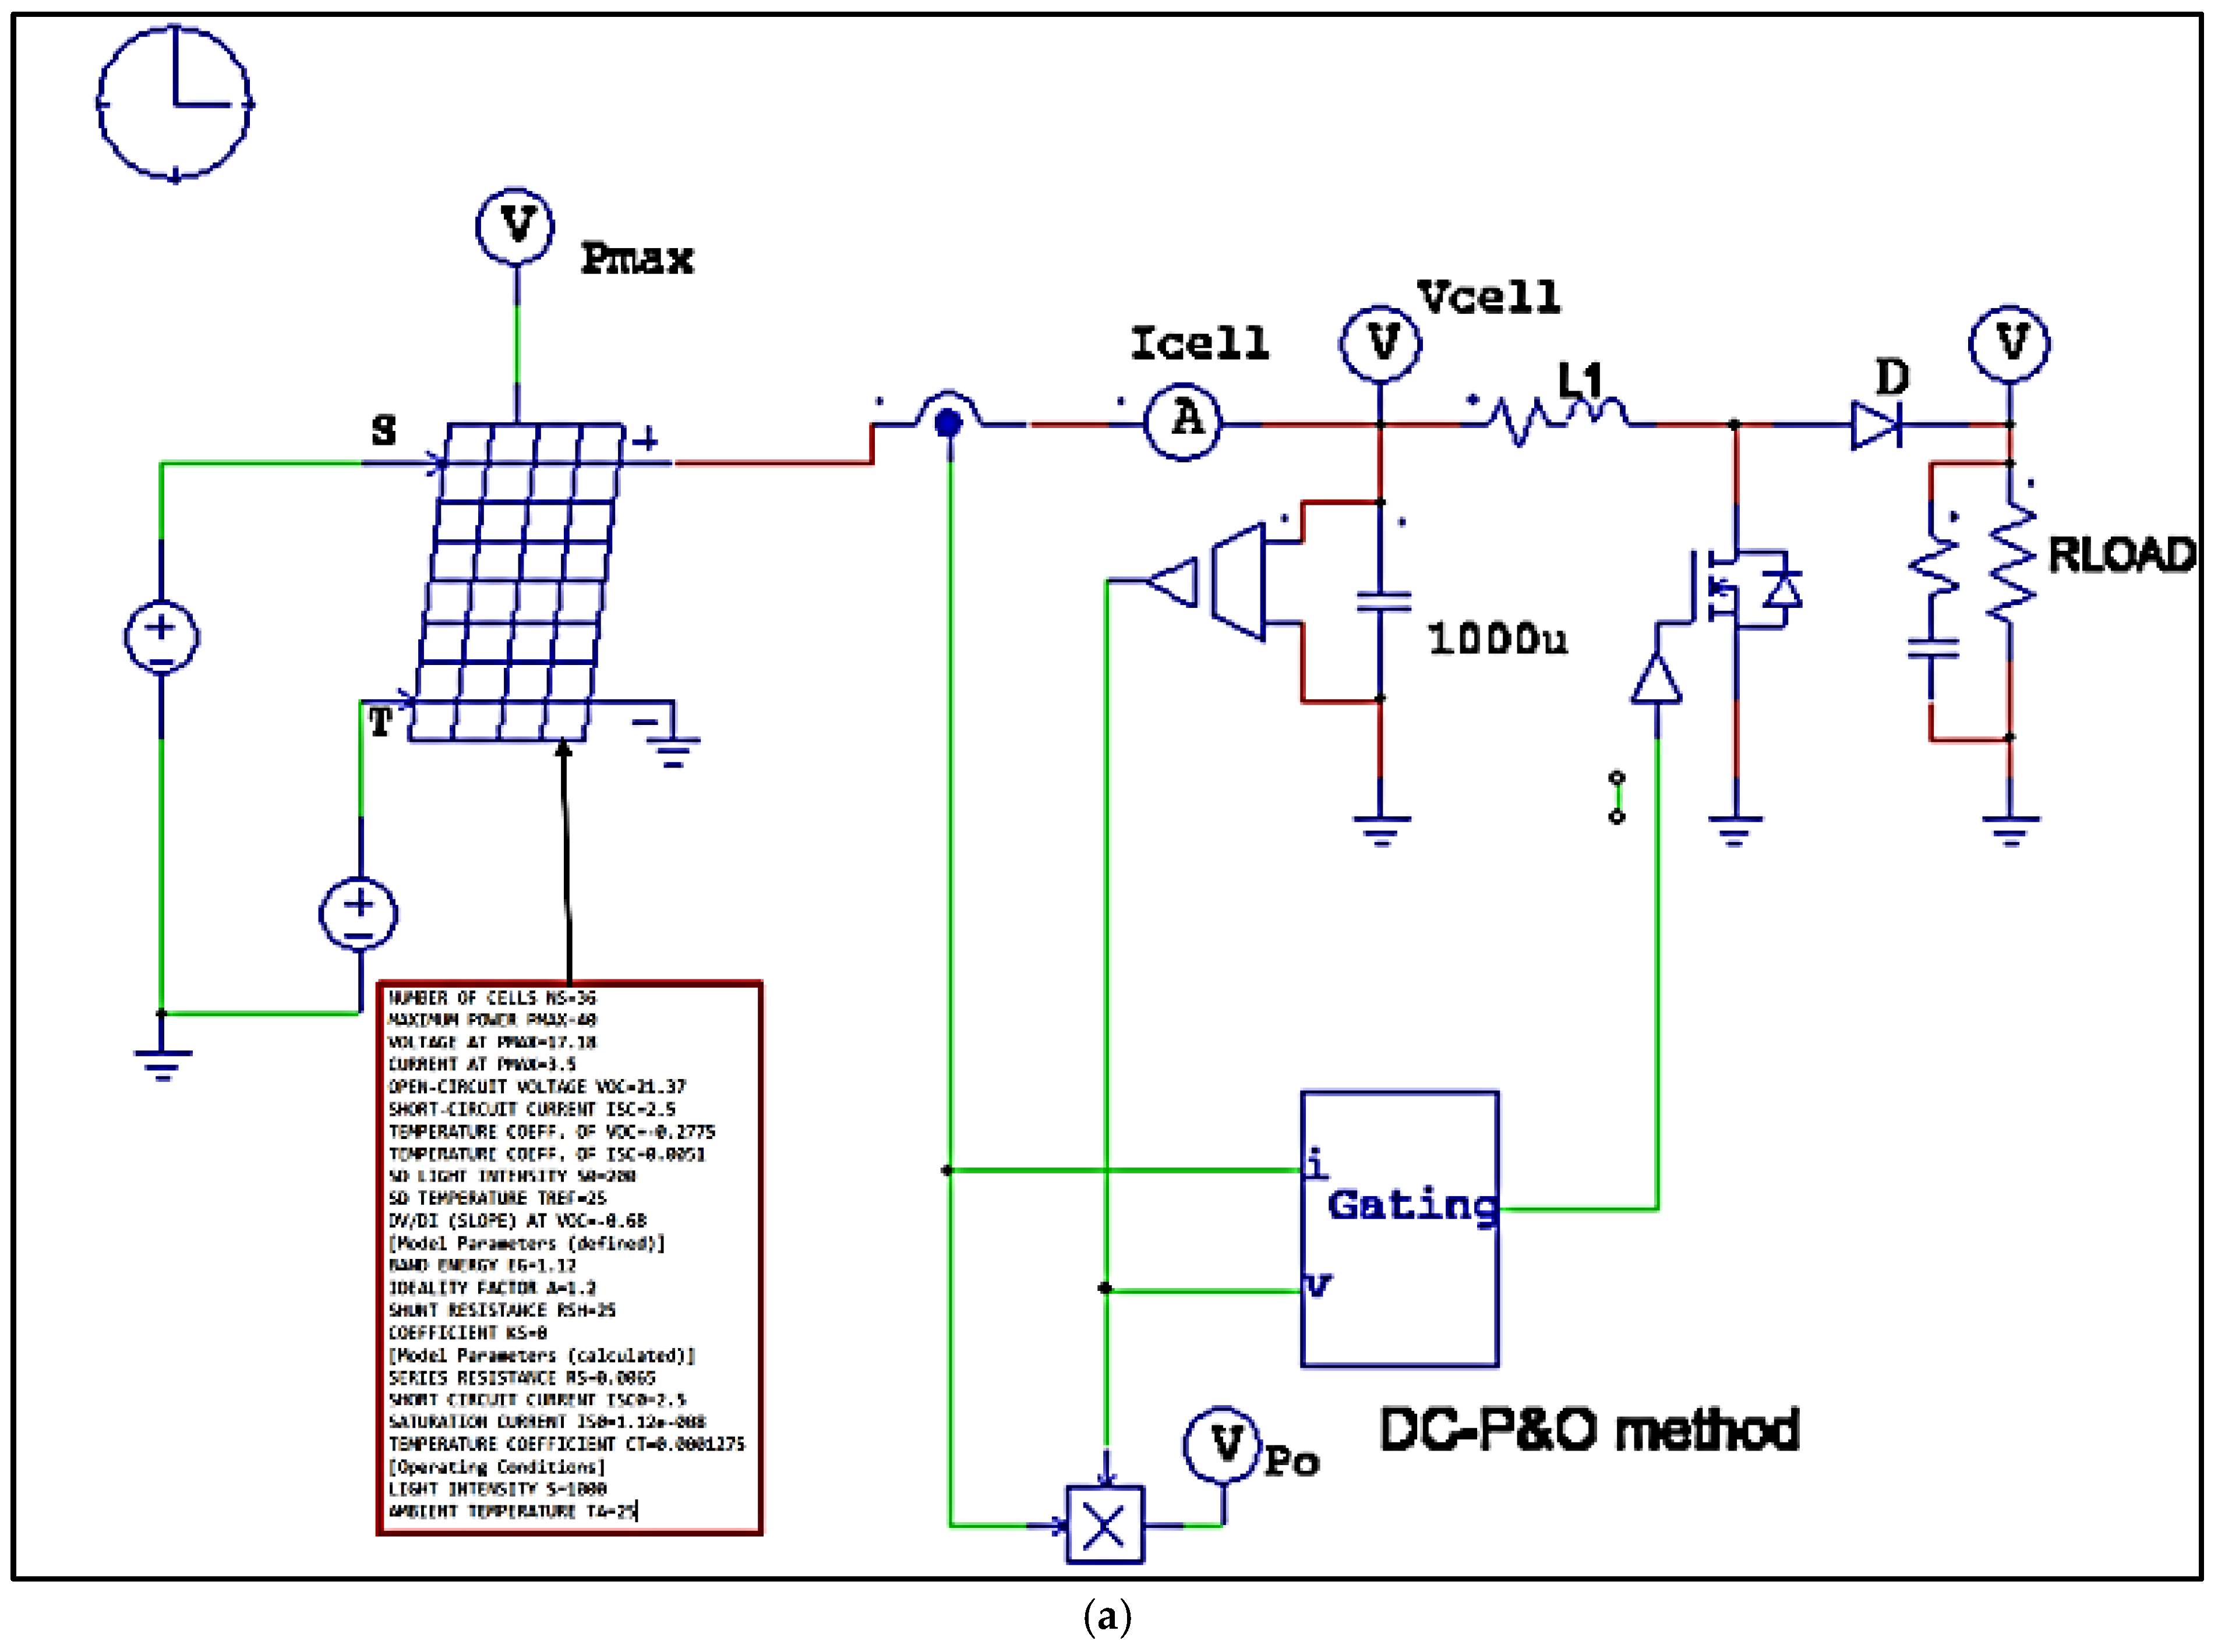
1.4. Modelling of Single-Diode Model with a Boost Convertor Using Modified DC-(P&O)
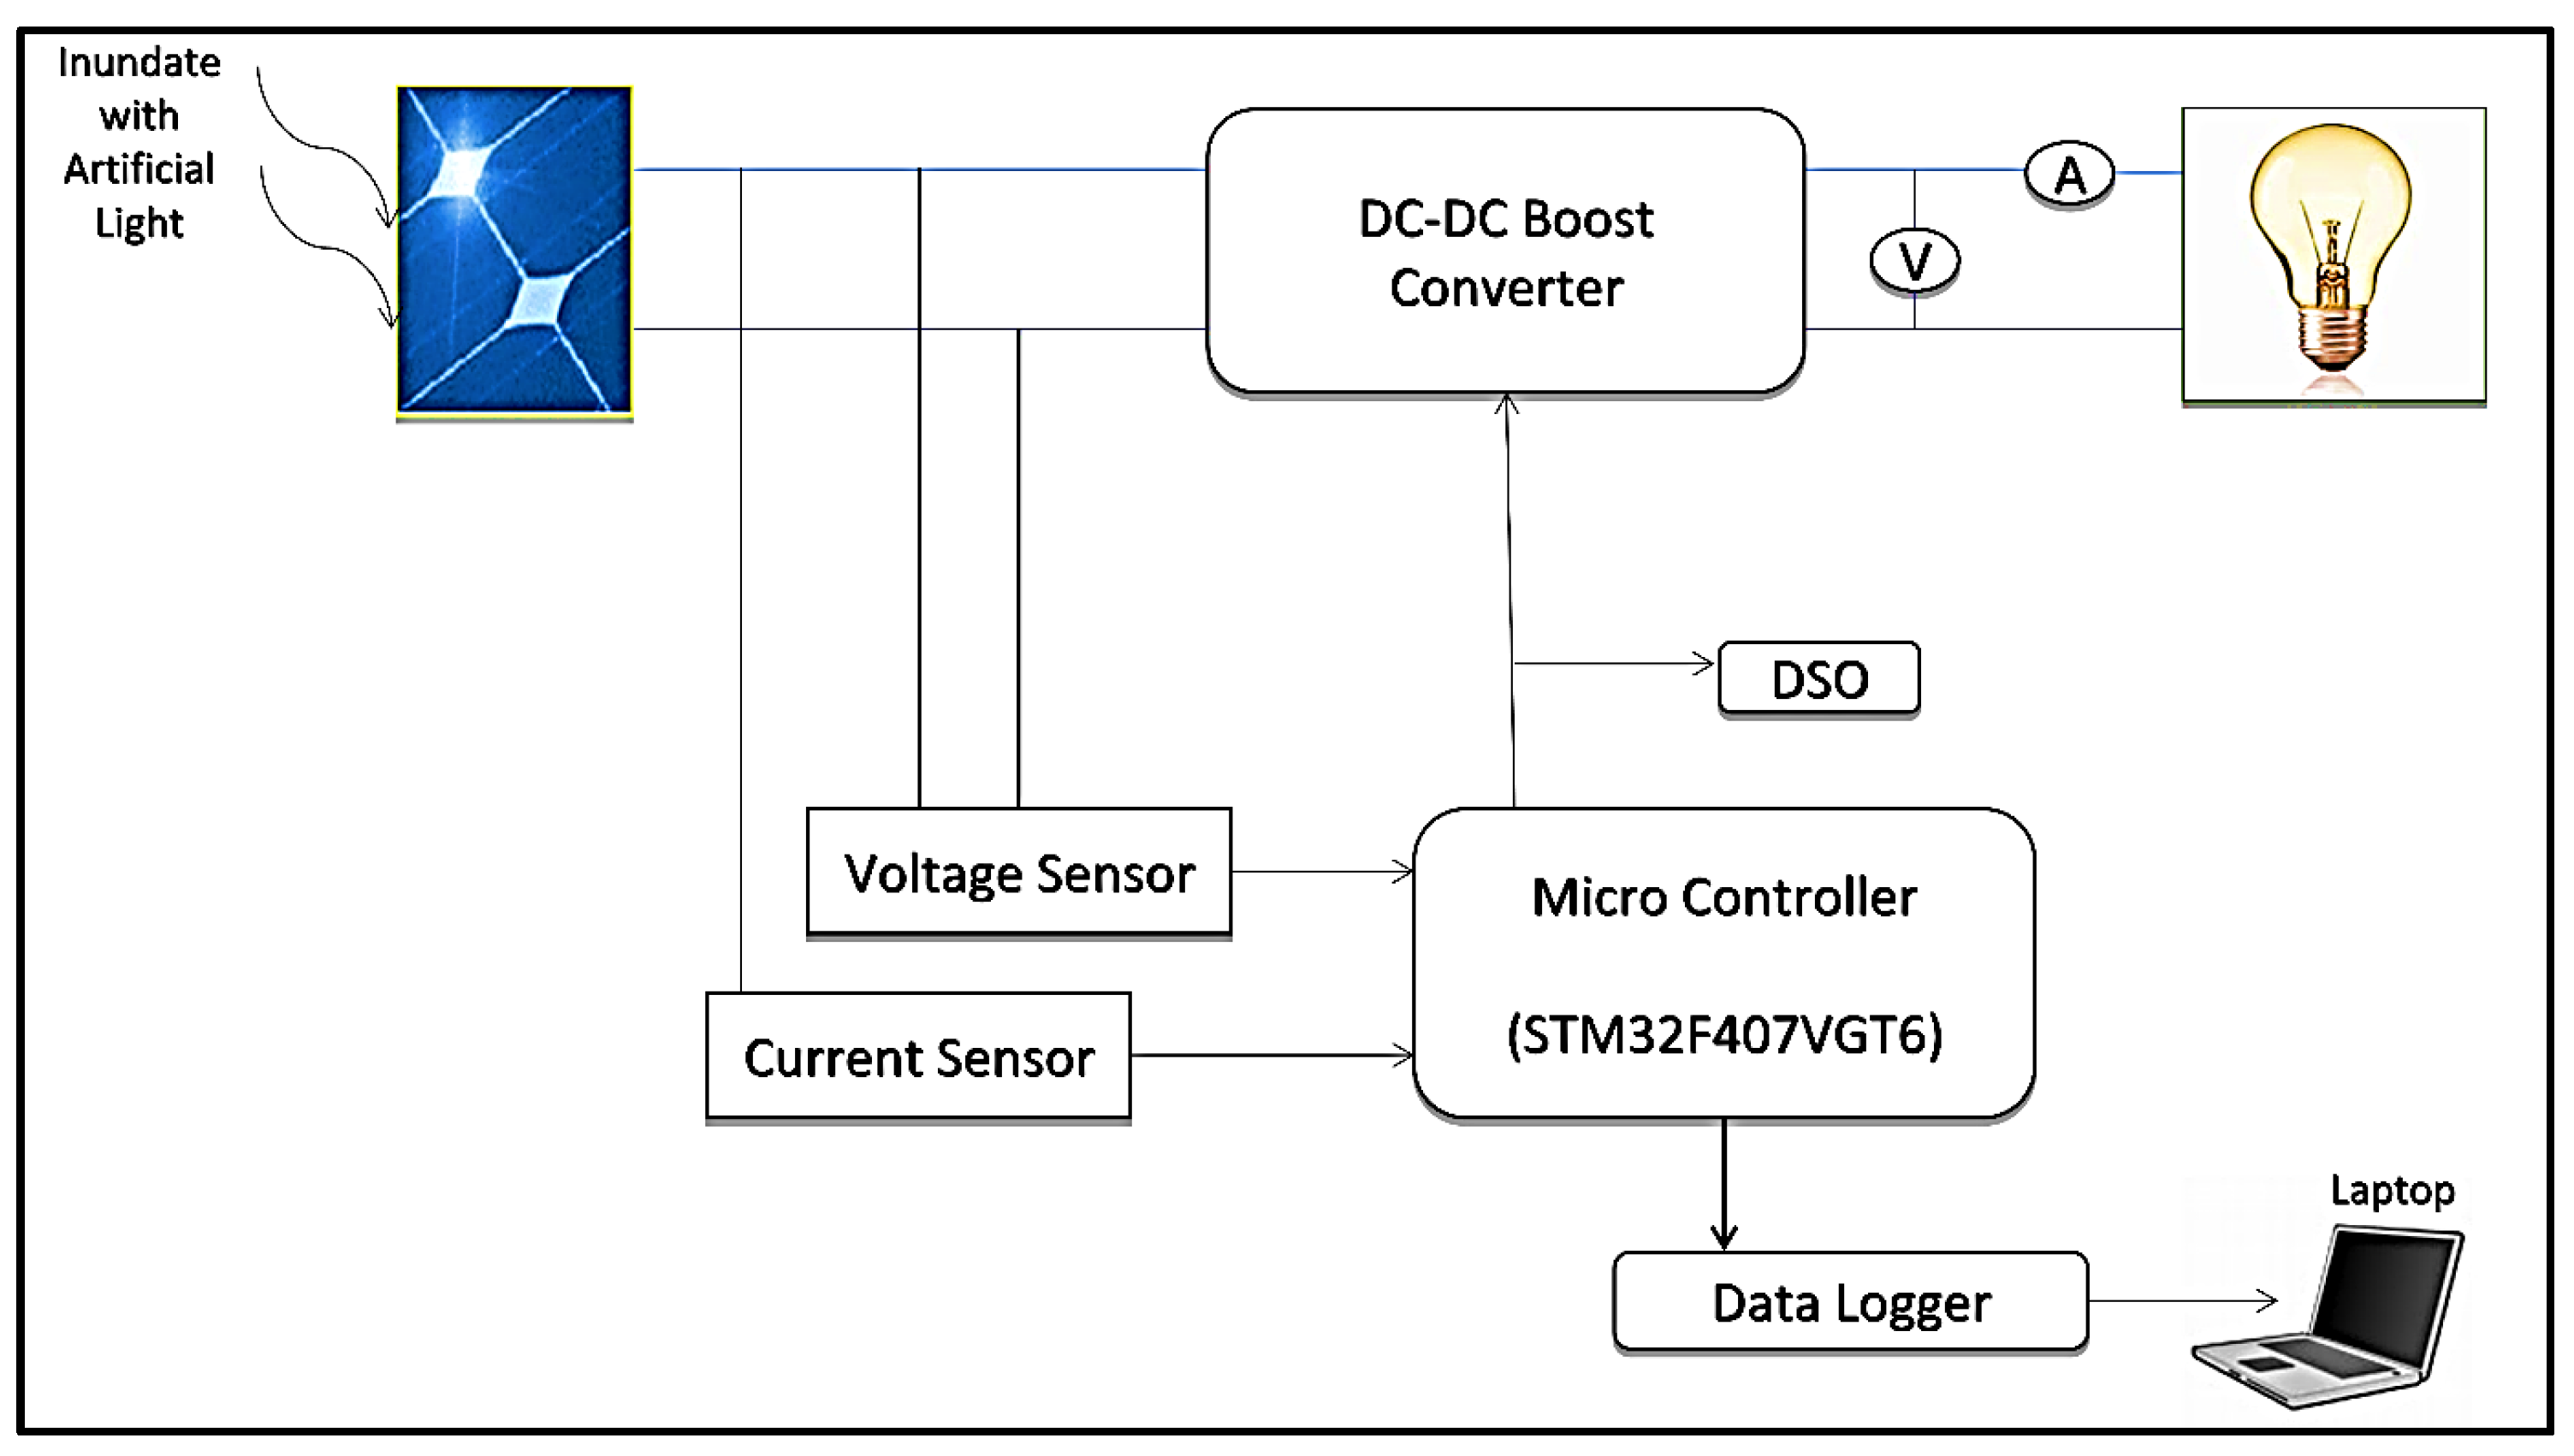
2. Block Diagram of Workflow
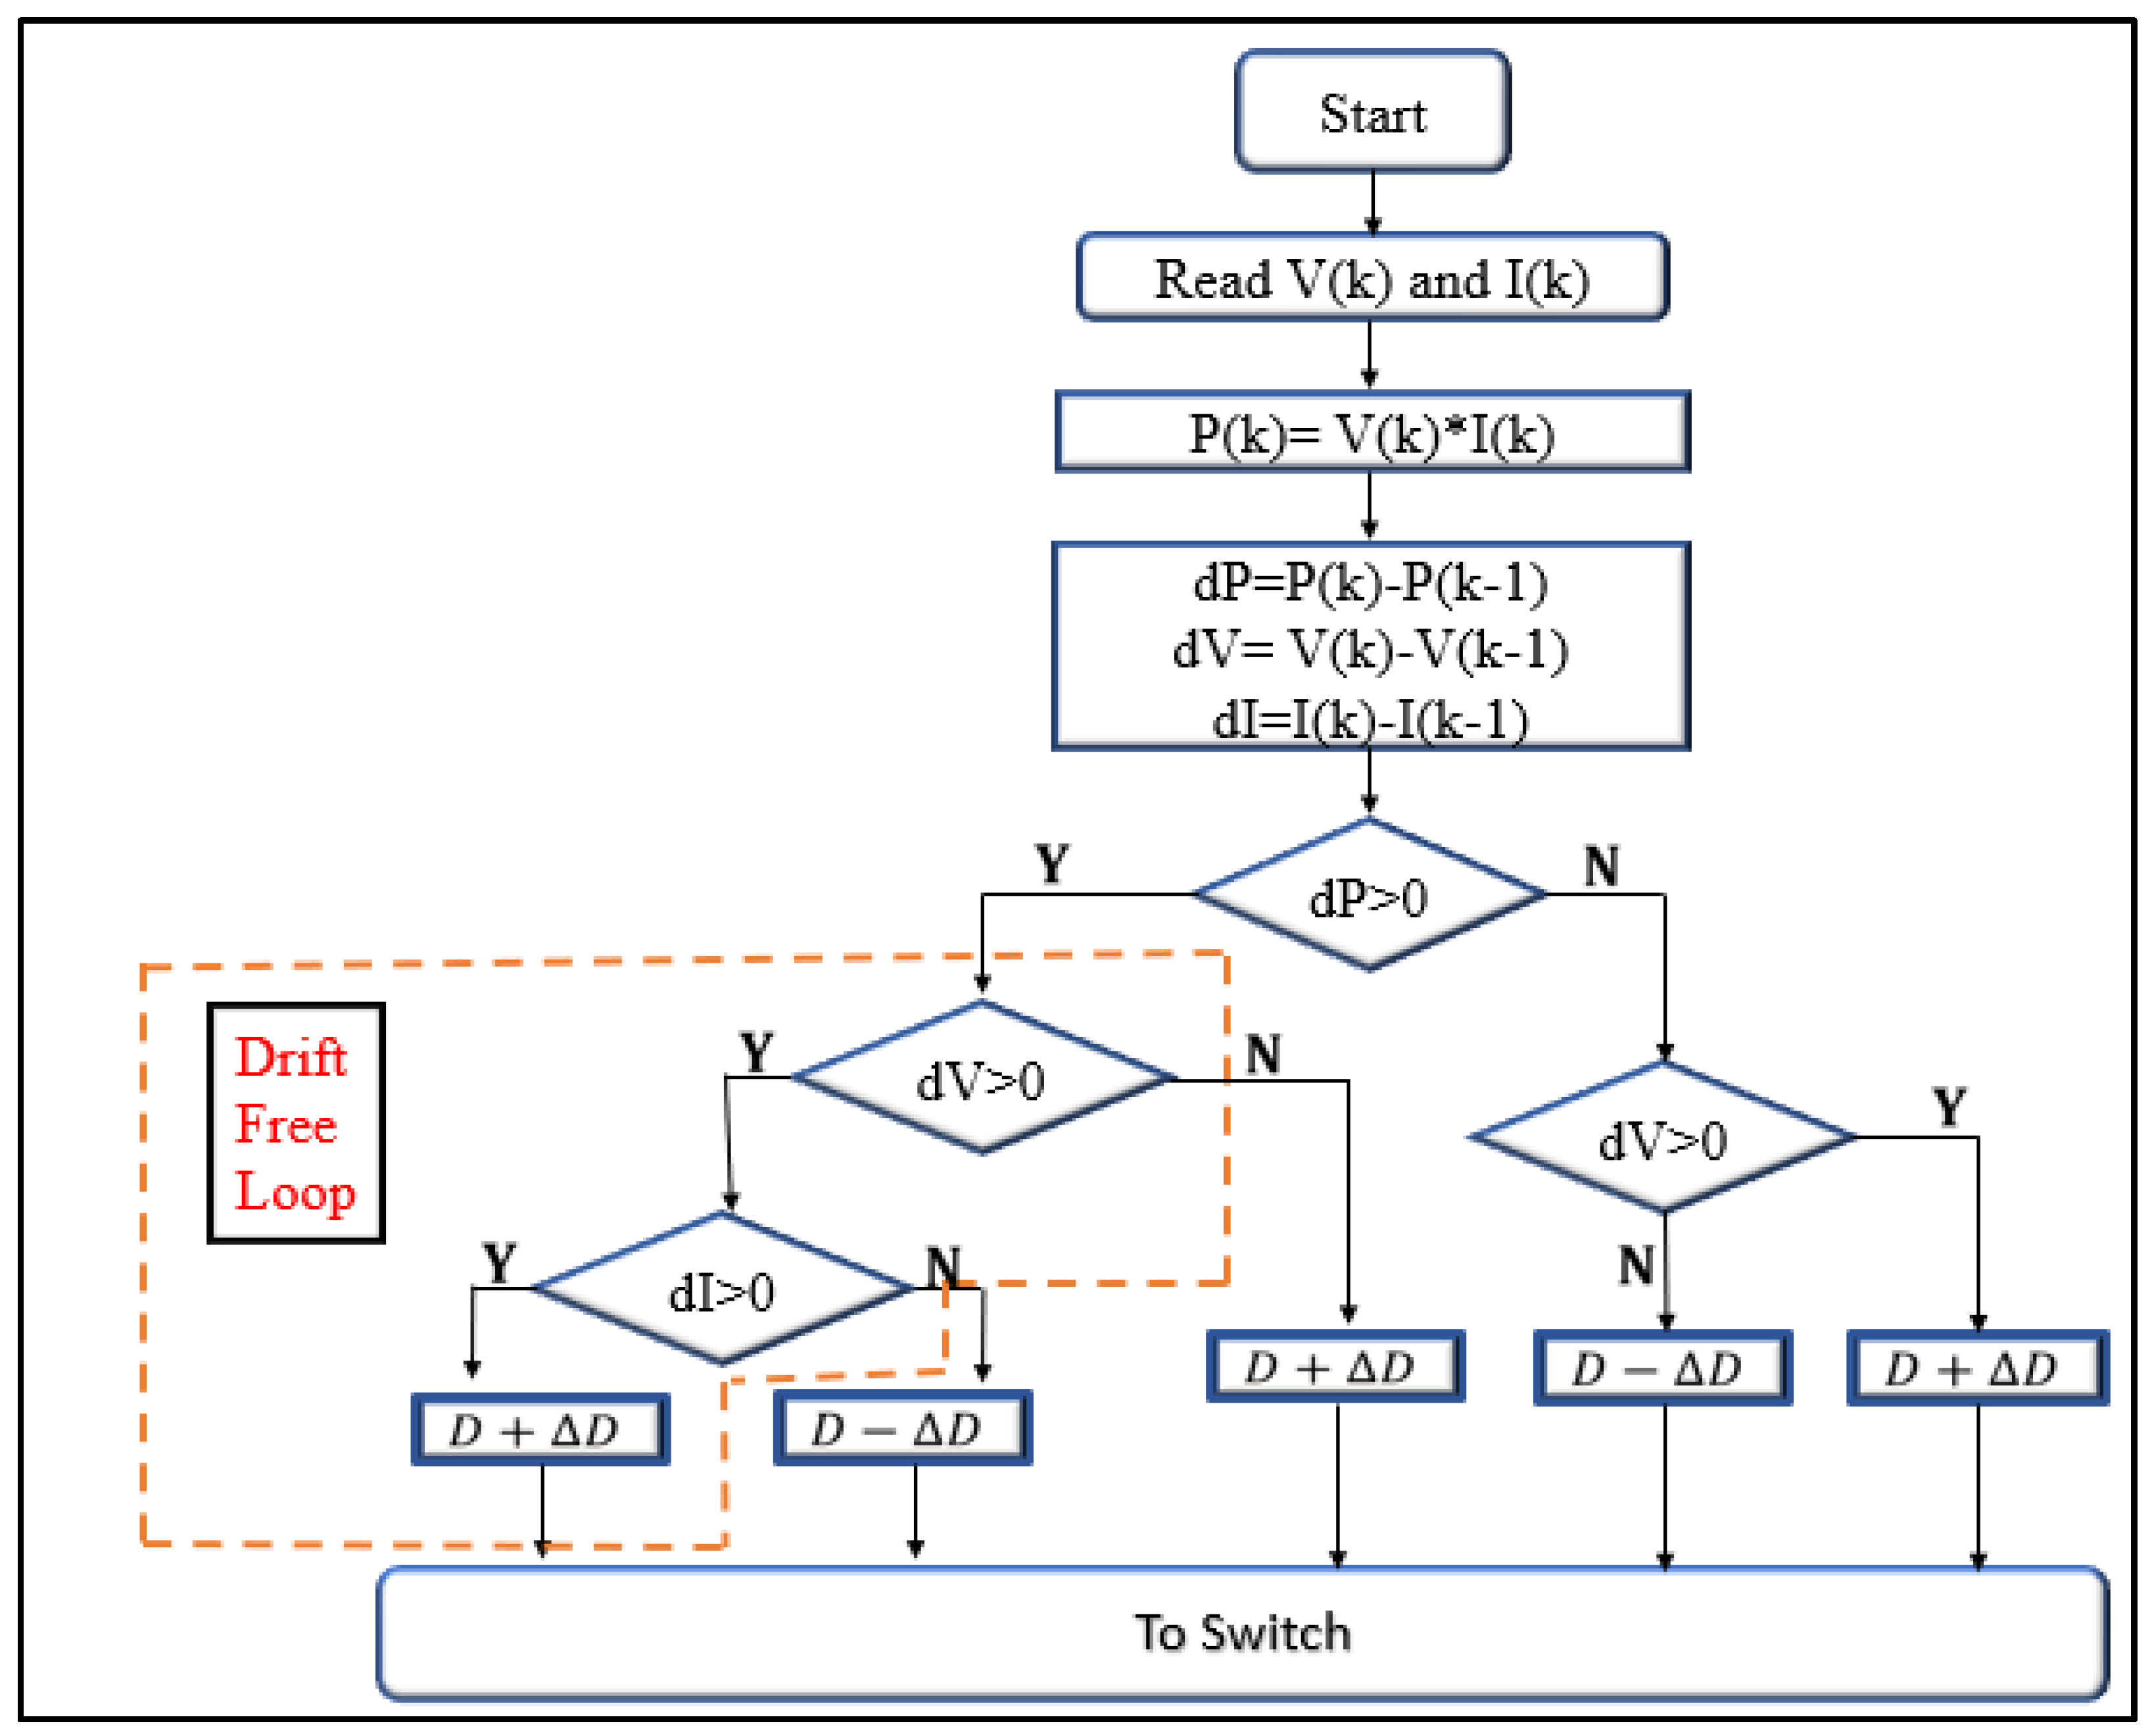
3. Modified DC-(P&O) Mitigation Technique
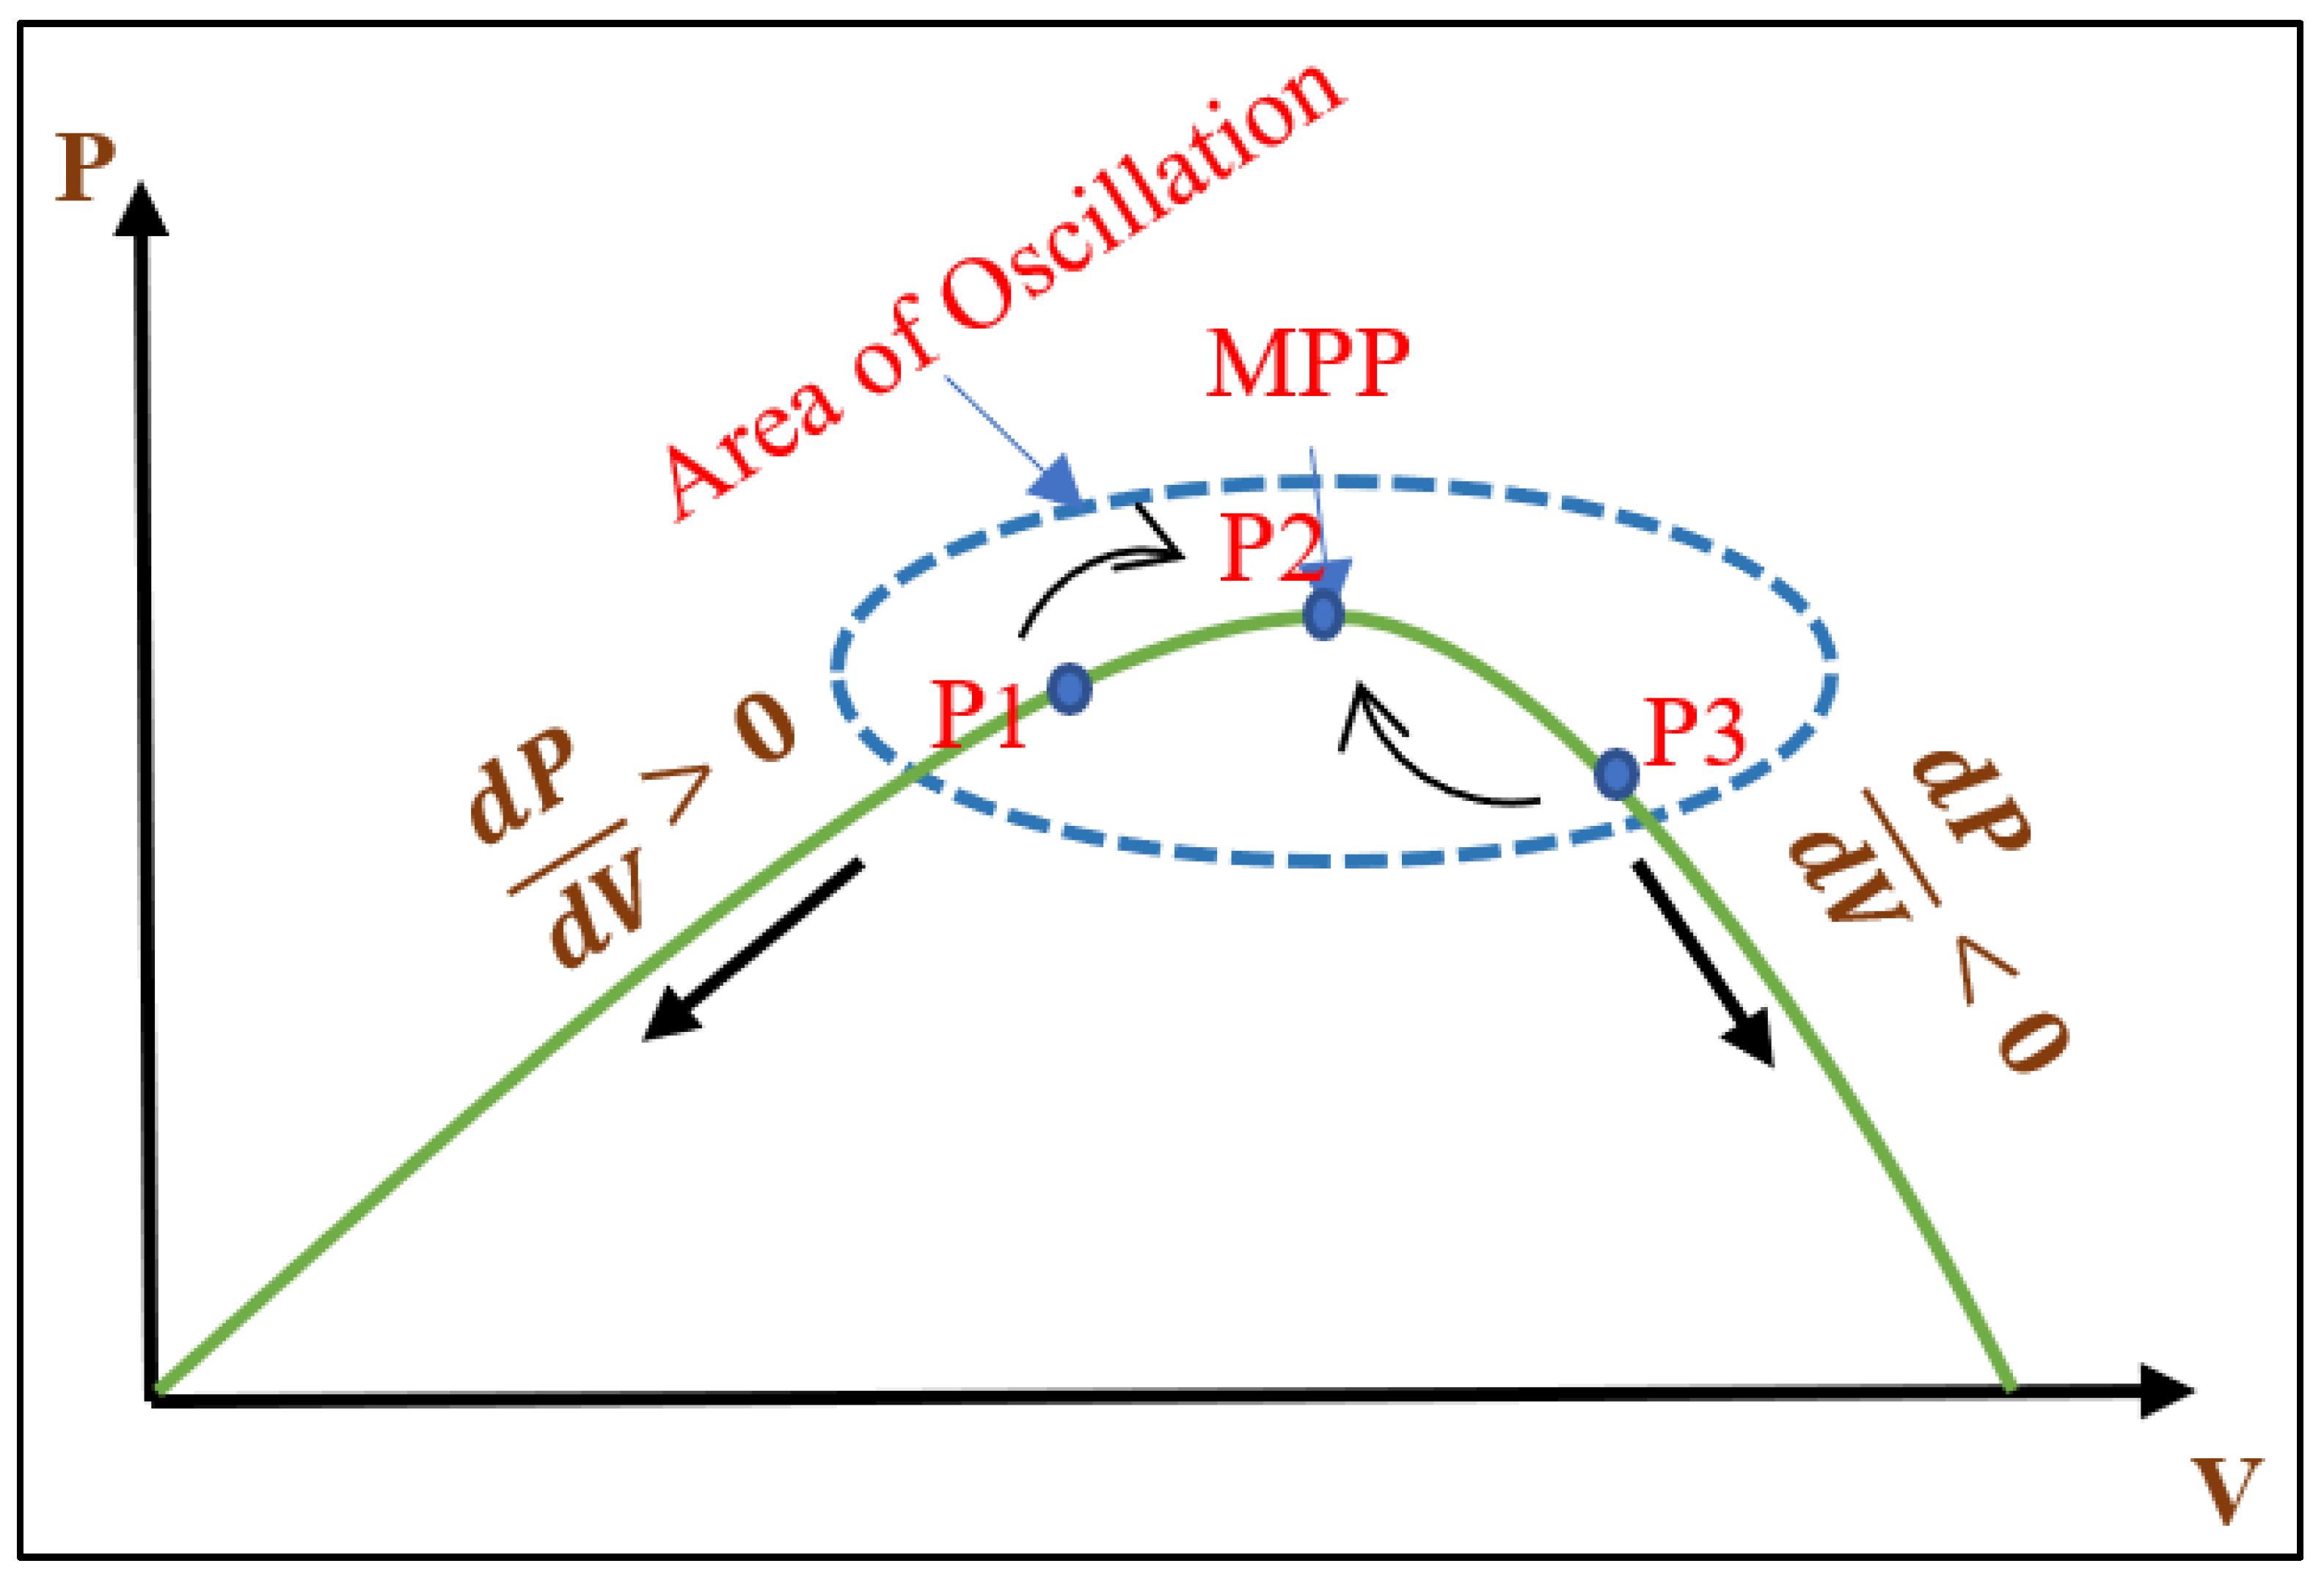
3.1. Steady-State Operation (SSO) of Traditional P&O Procedure
3.2. Steady-State Operation (SSO) of Proposed Modified DC-(P&O) Procedure without Drift
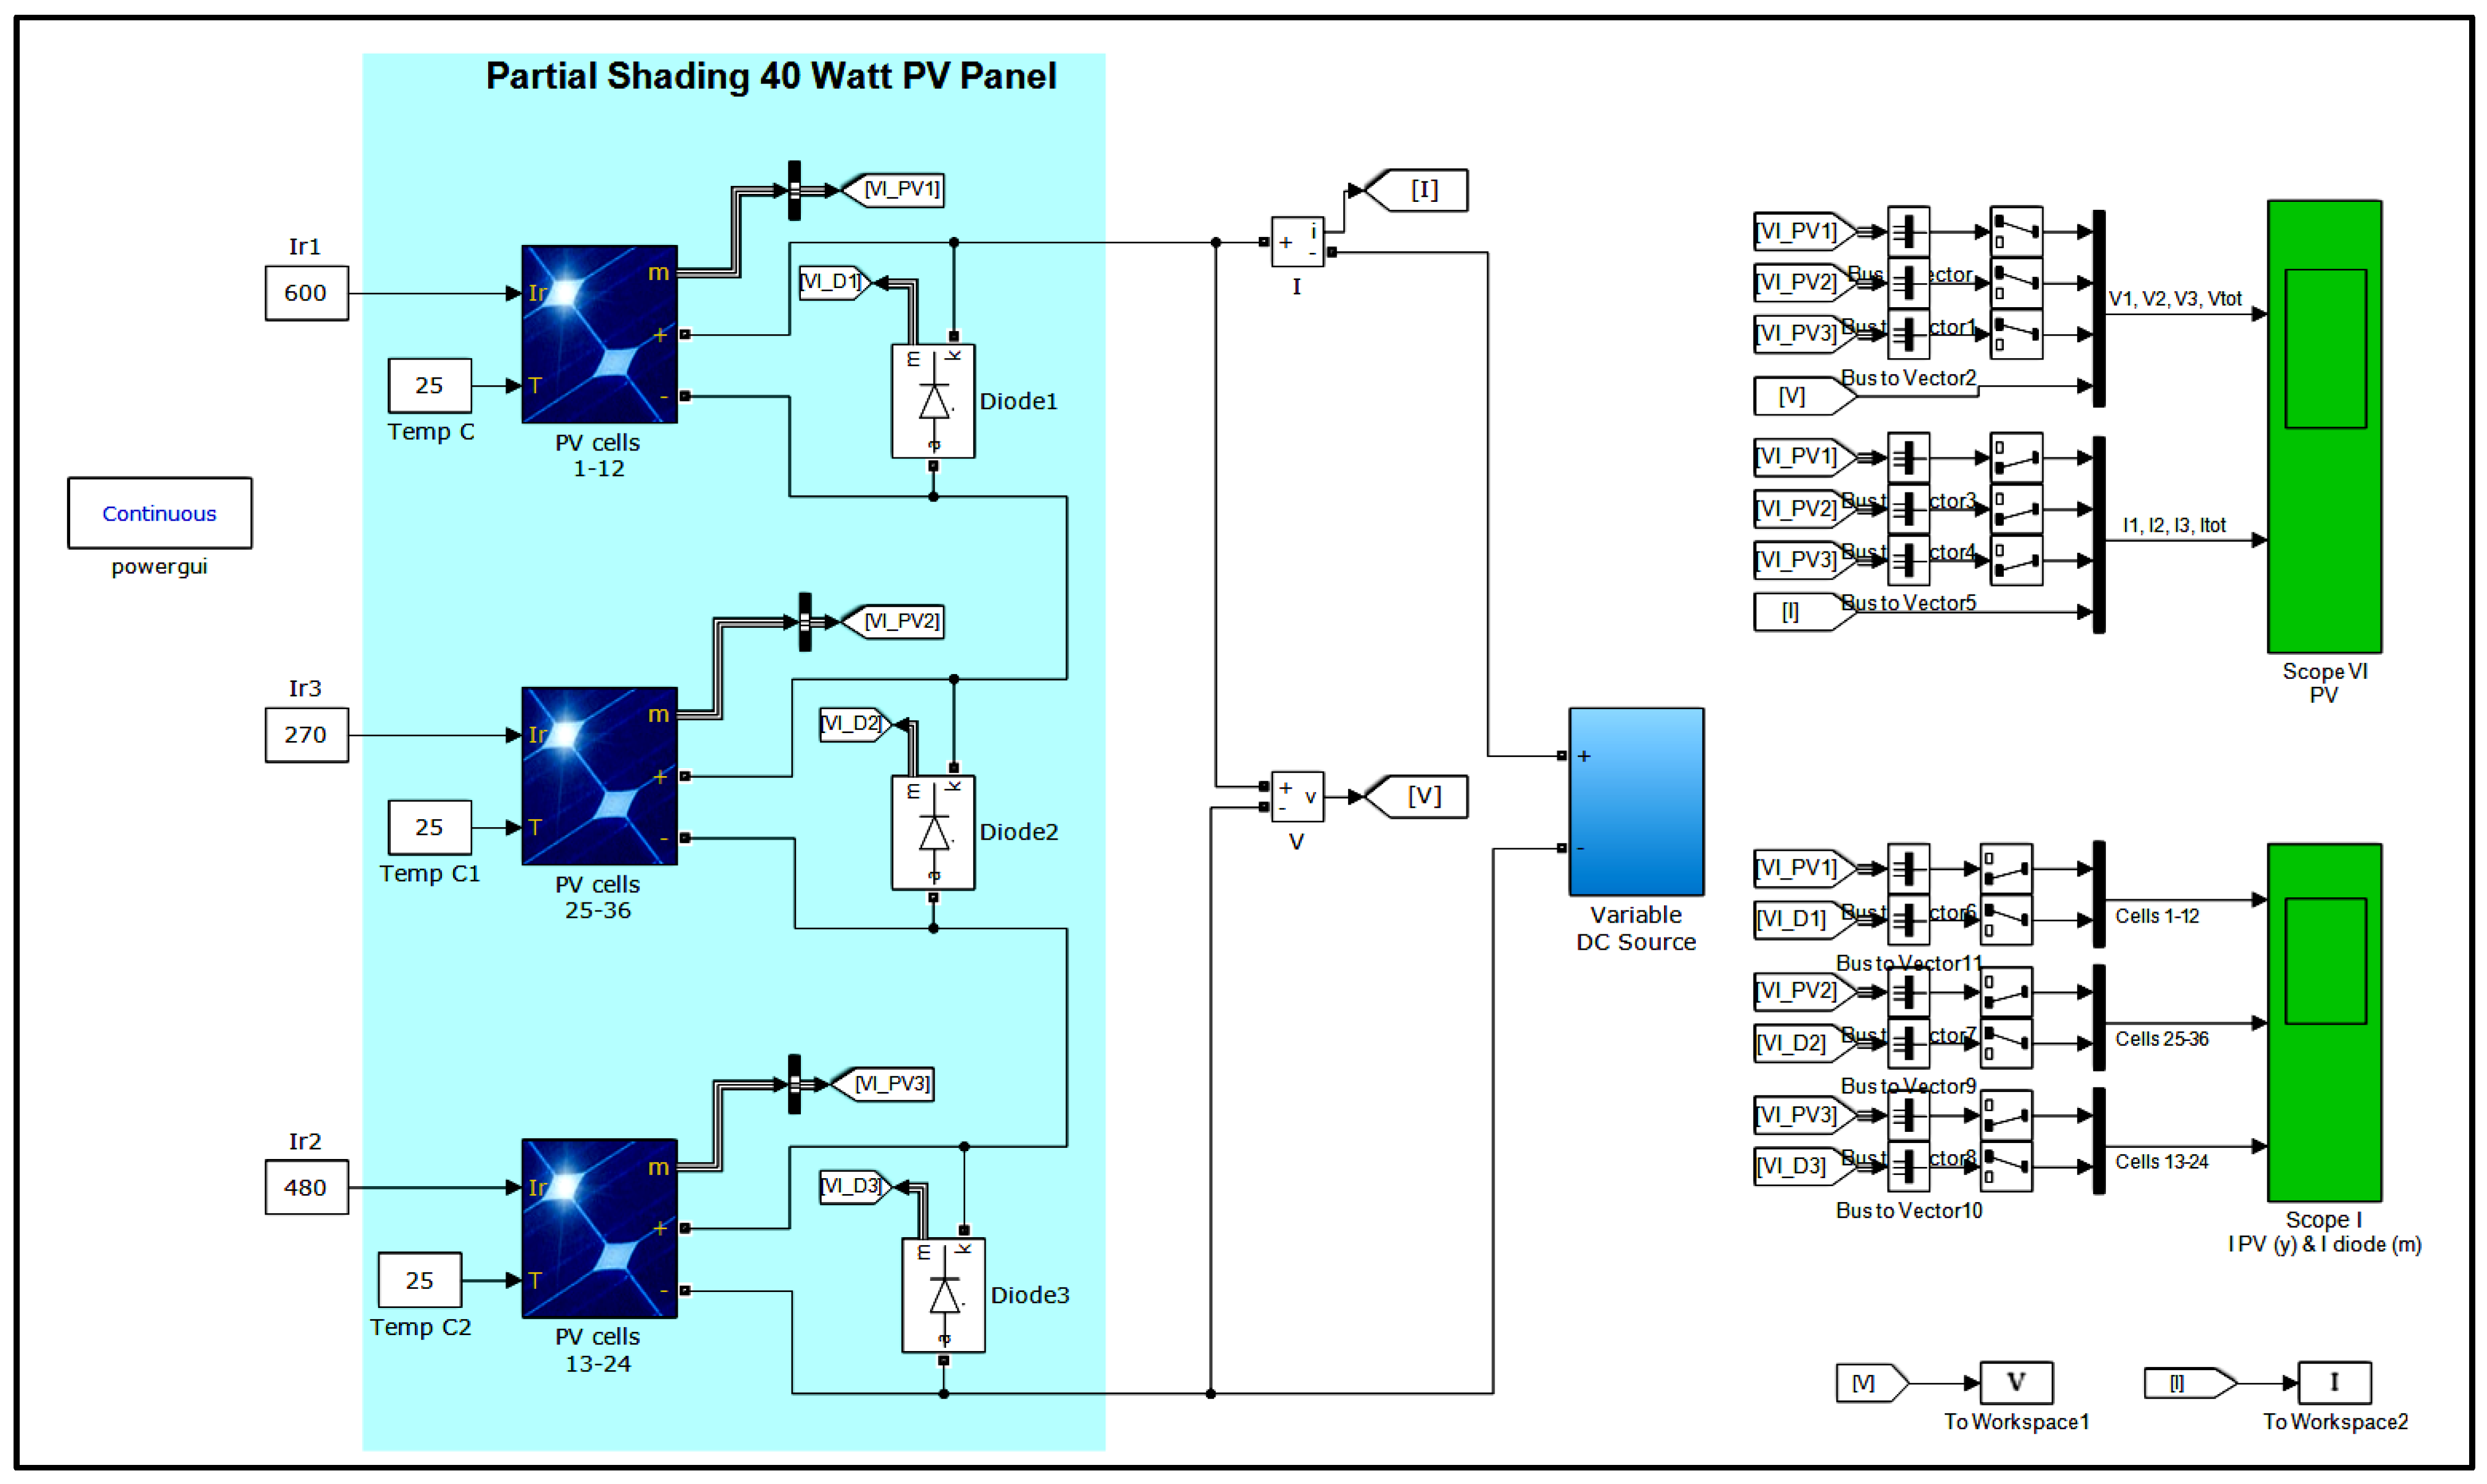
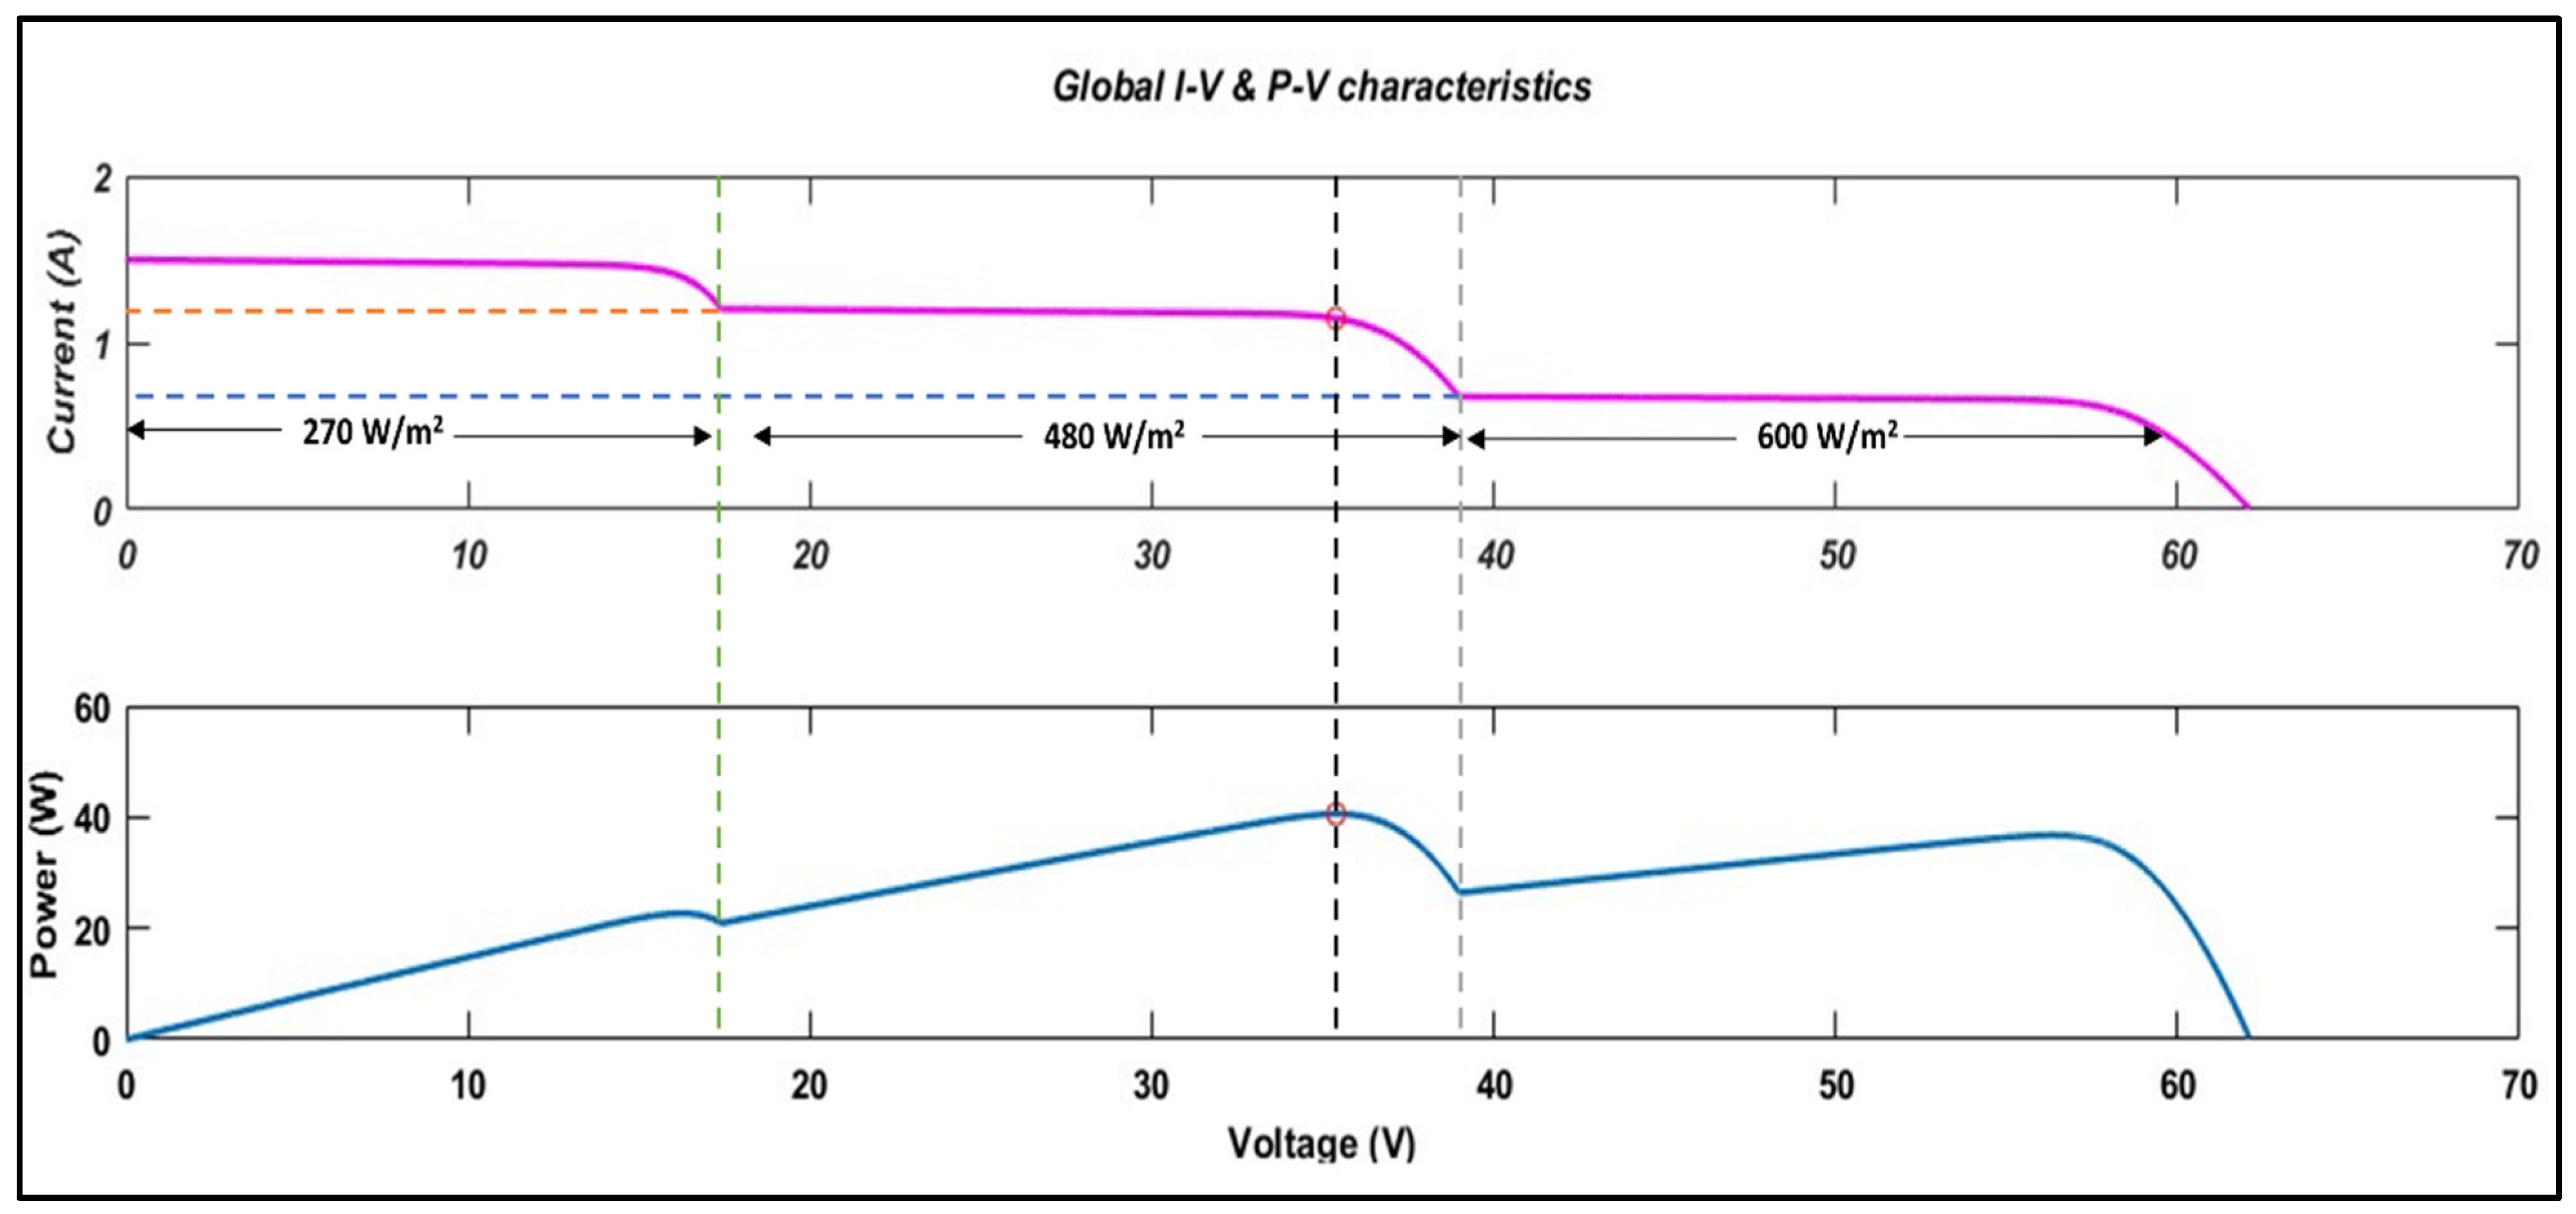
4. Simulation Model for Partial Shading

| S.No | Parameter Description | Values at 1000 W/m2 on STC |
|---|---|---|
| 1 | Number of cells (NS) | 36 |
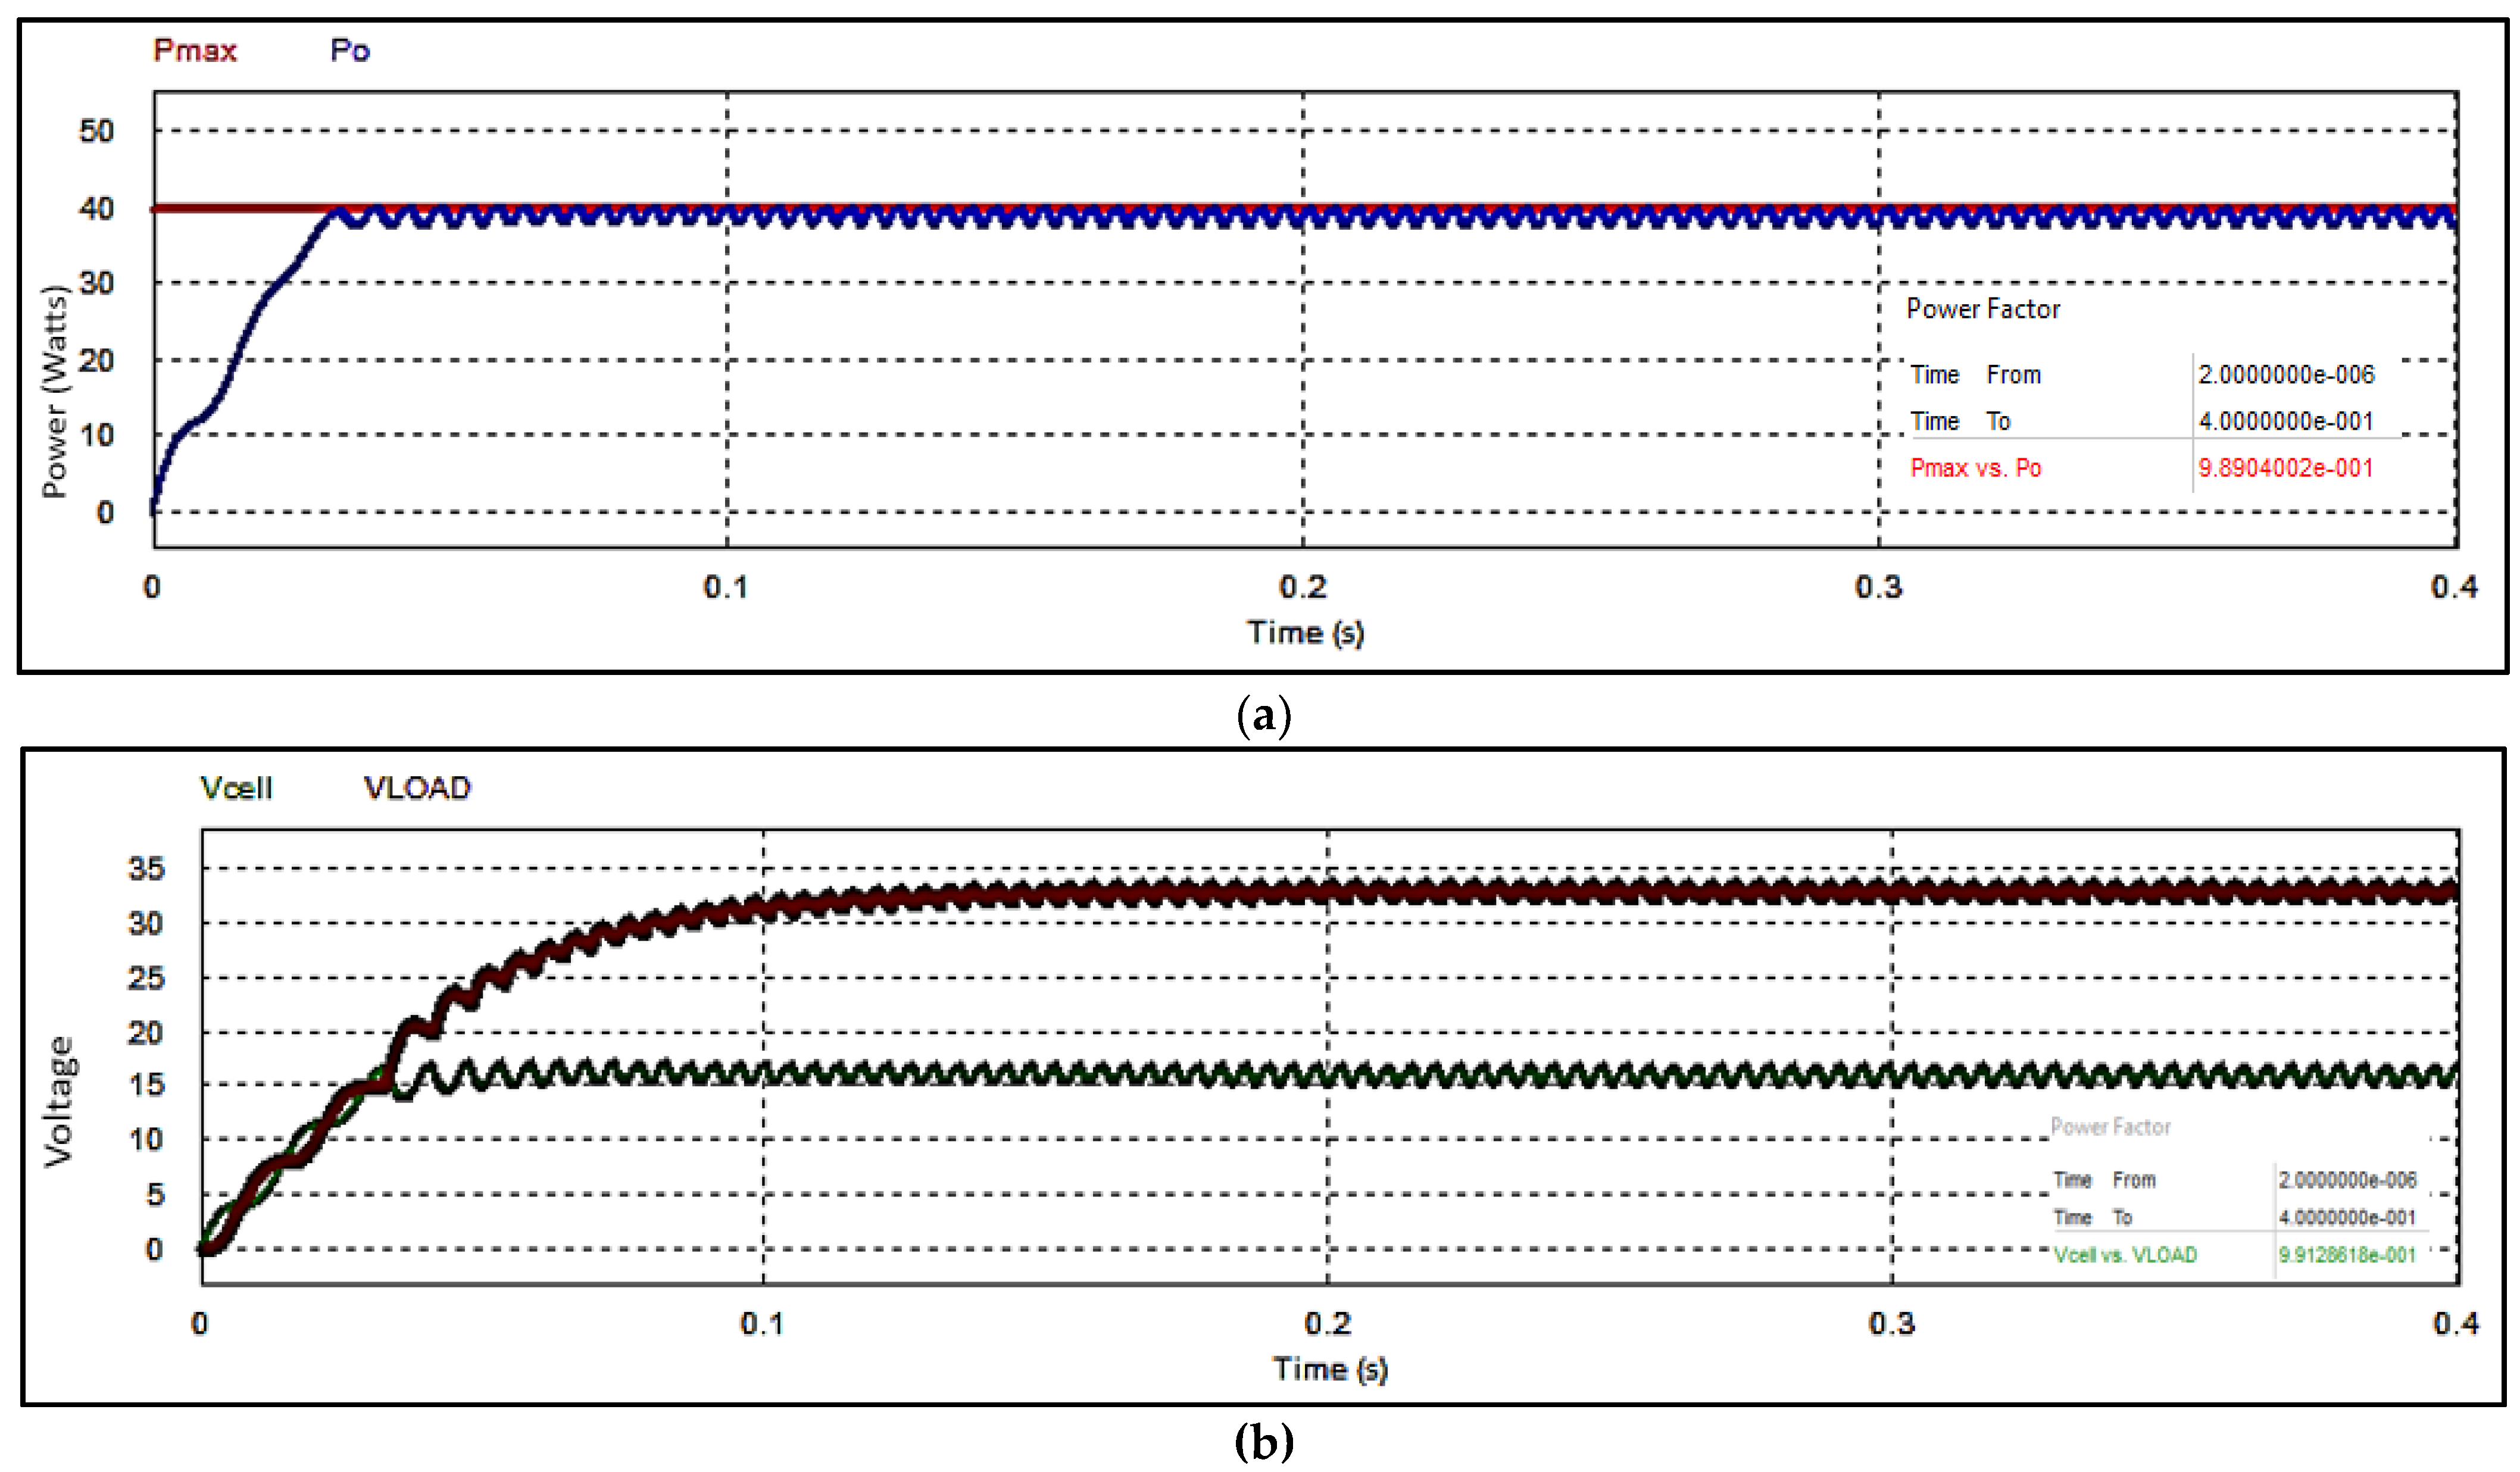
| 2 | Maximum power (PMAX) | 40 Watt |
| 3 | Voltage at PMAX | 17.18 W |
| 4 | Current at IMAX | 2.33 A |
| 5 | Open-circuit voltage (VOC) | 21.37 V |
| 6 | Short-circuit current (ISC) | 2.5 A |
| 7 | Temperature coefficient of VOC | −0.2775 V |
| 8 | Temperature coefficient of ISC | 0.0051 A |
| 9 | at VOC | −0.68 V |
| 10 | Brand energy gap (EG) | 1.12 |
| 11 | Ideality factor (n) | 1.2 |
| 12 | Shunt resistance (RSH) | 25 Ω |
| 13 | Series resistance (RS) | 0.0065 Ω |
| 14 | Ambient temperature (TA) | 25 °C |
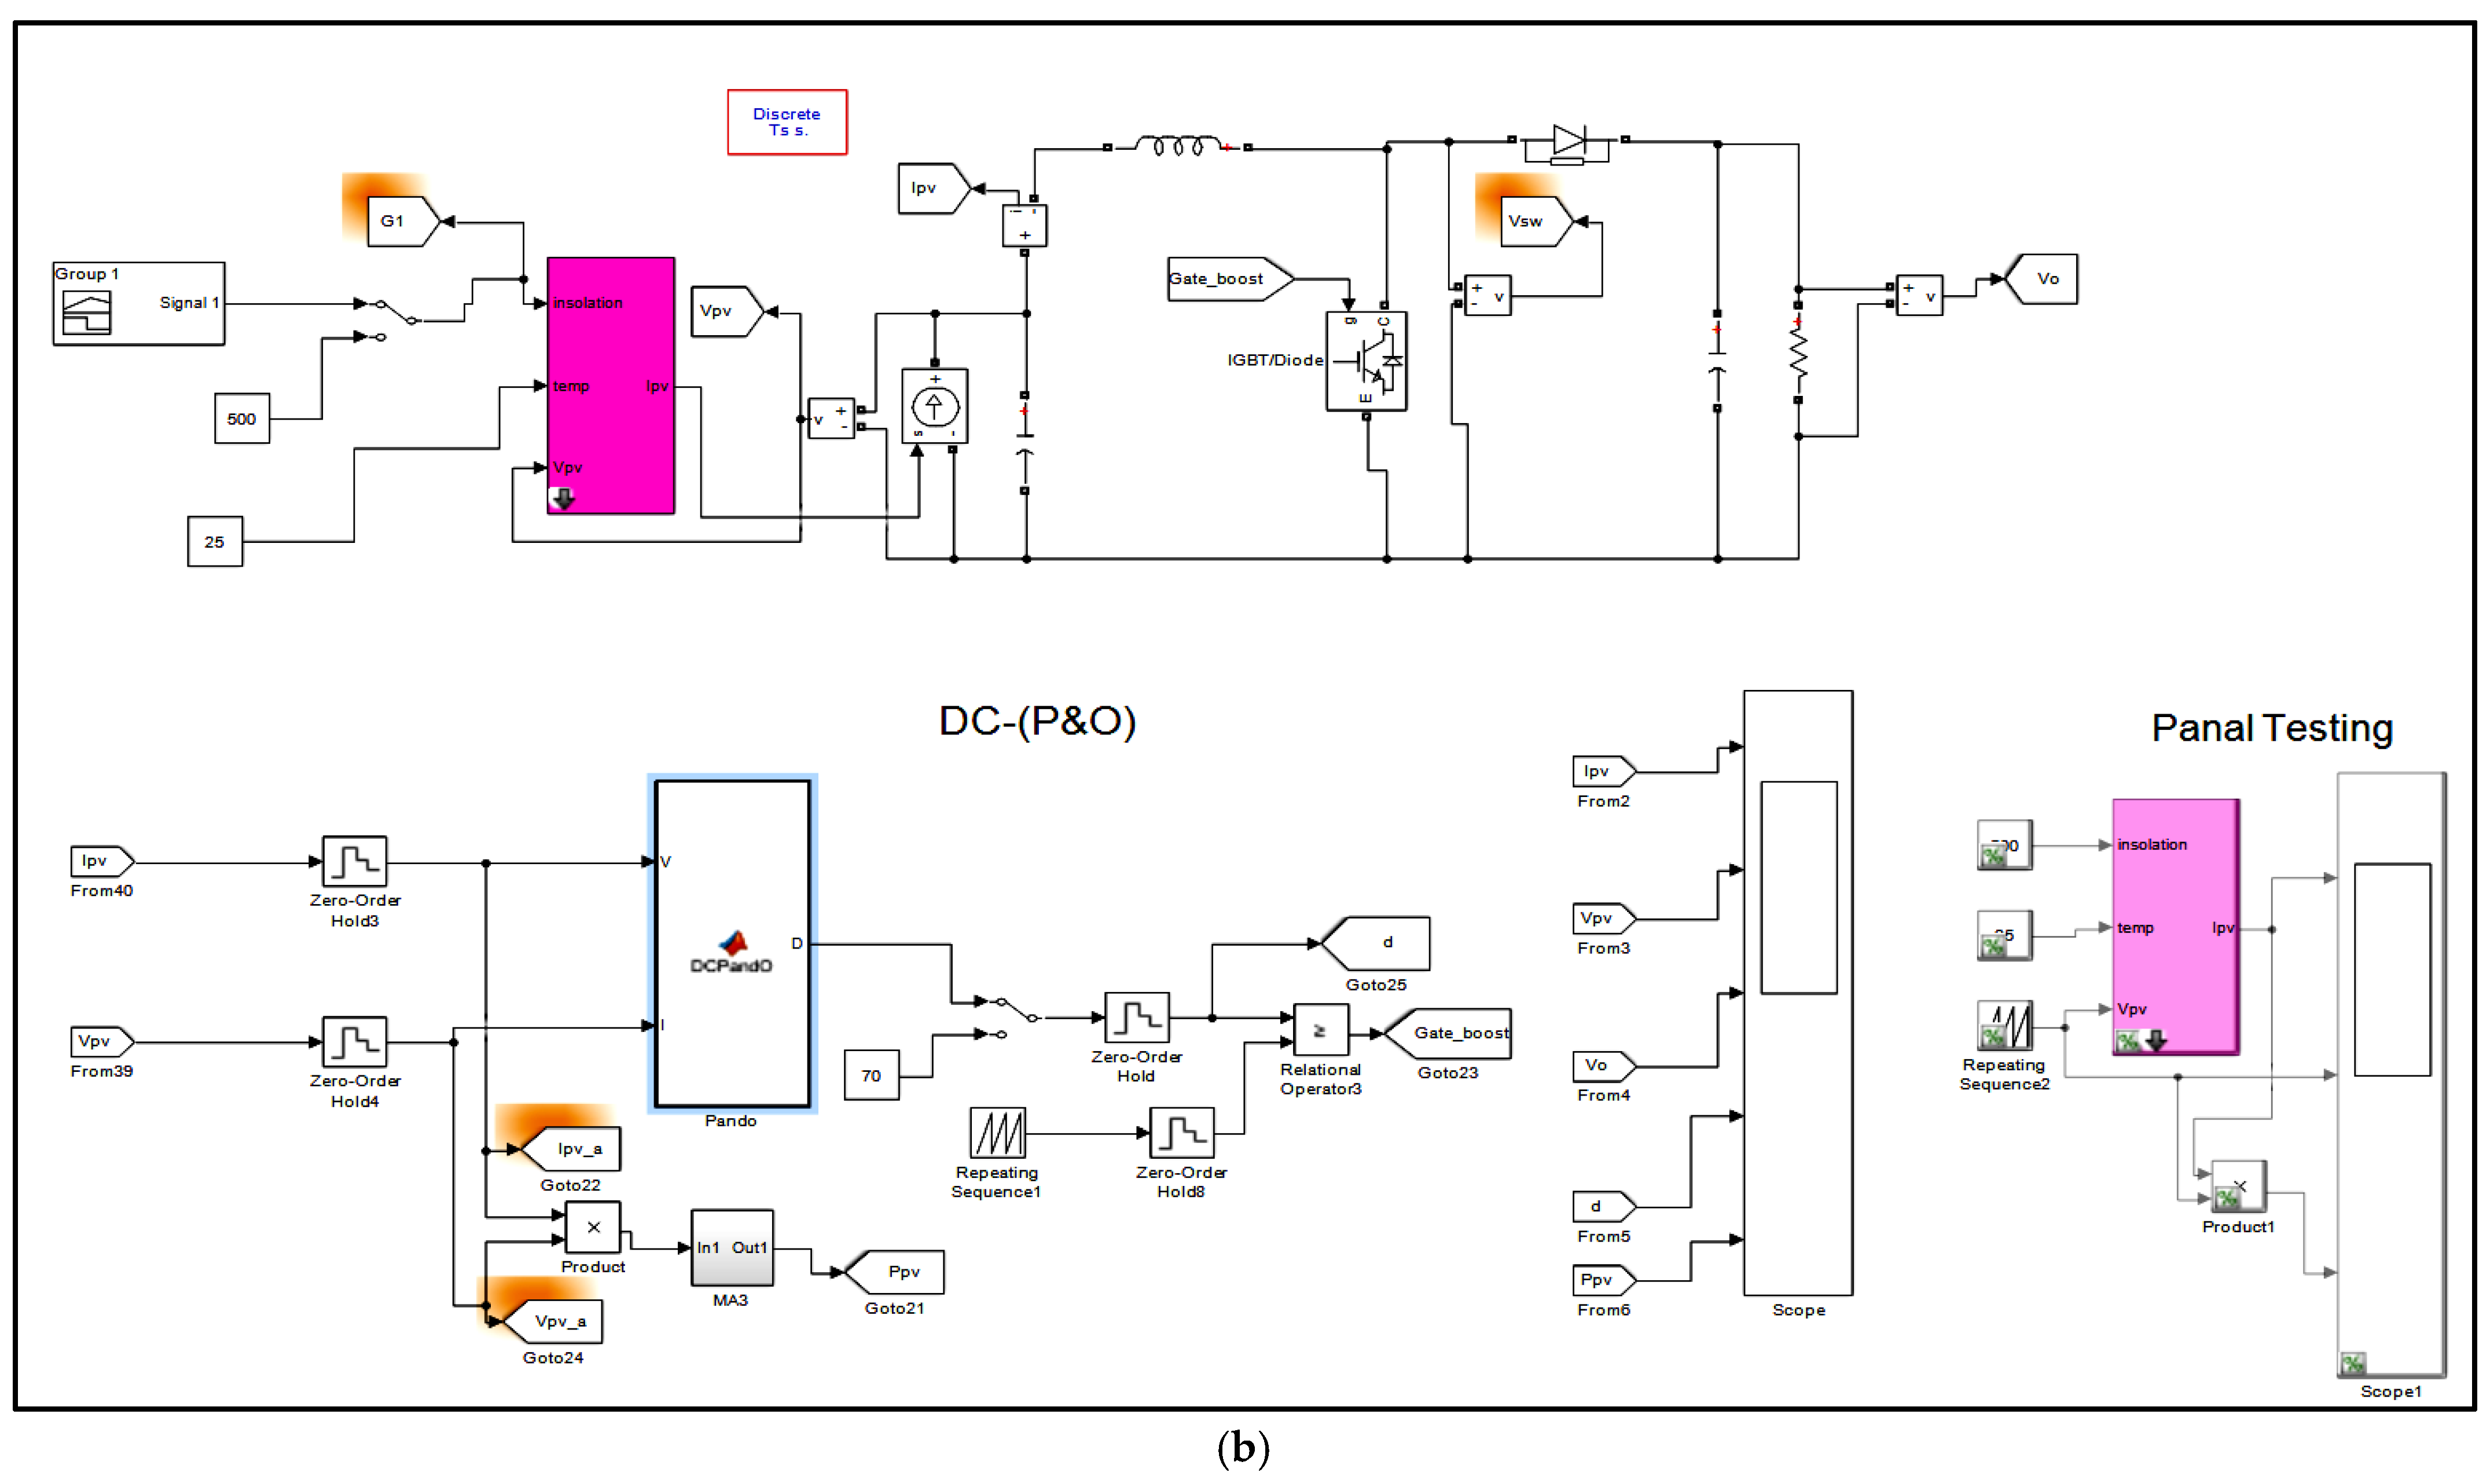
5. Simulation Model
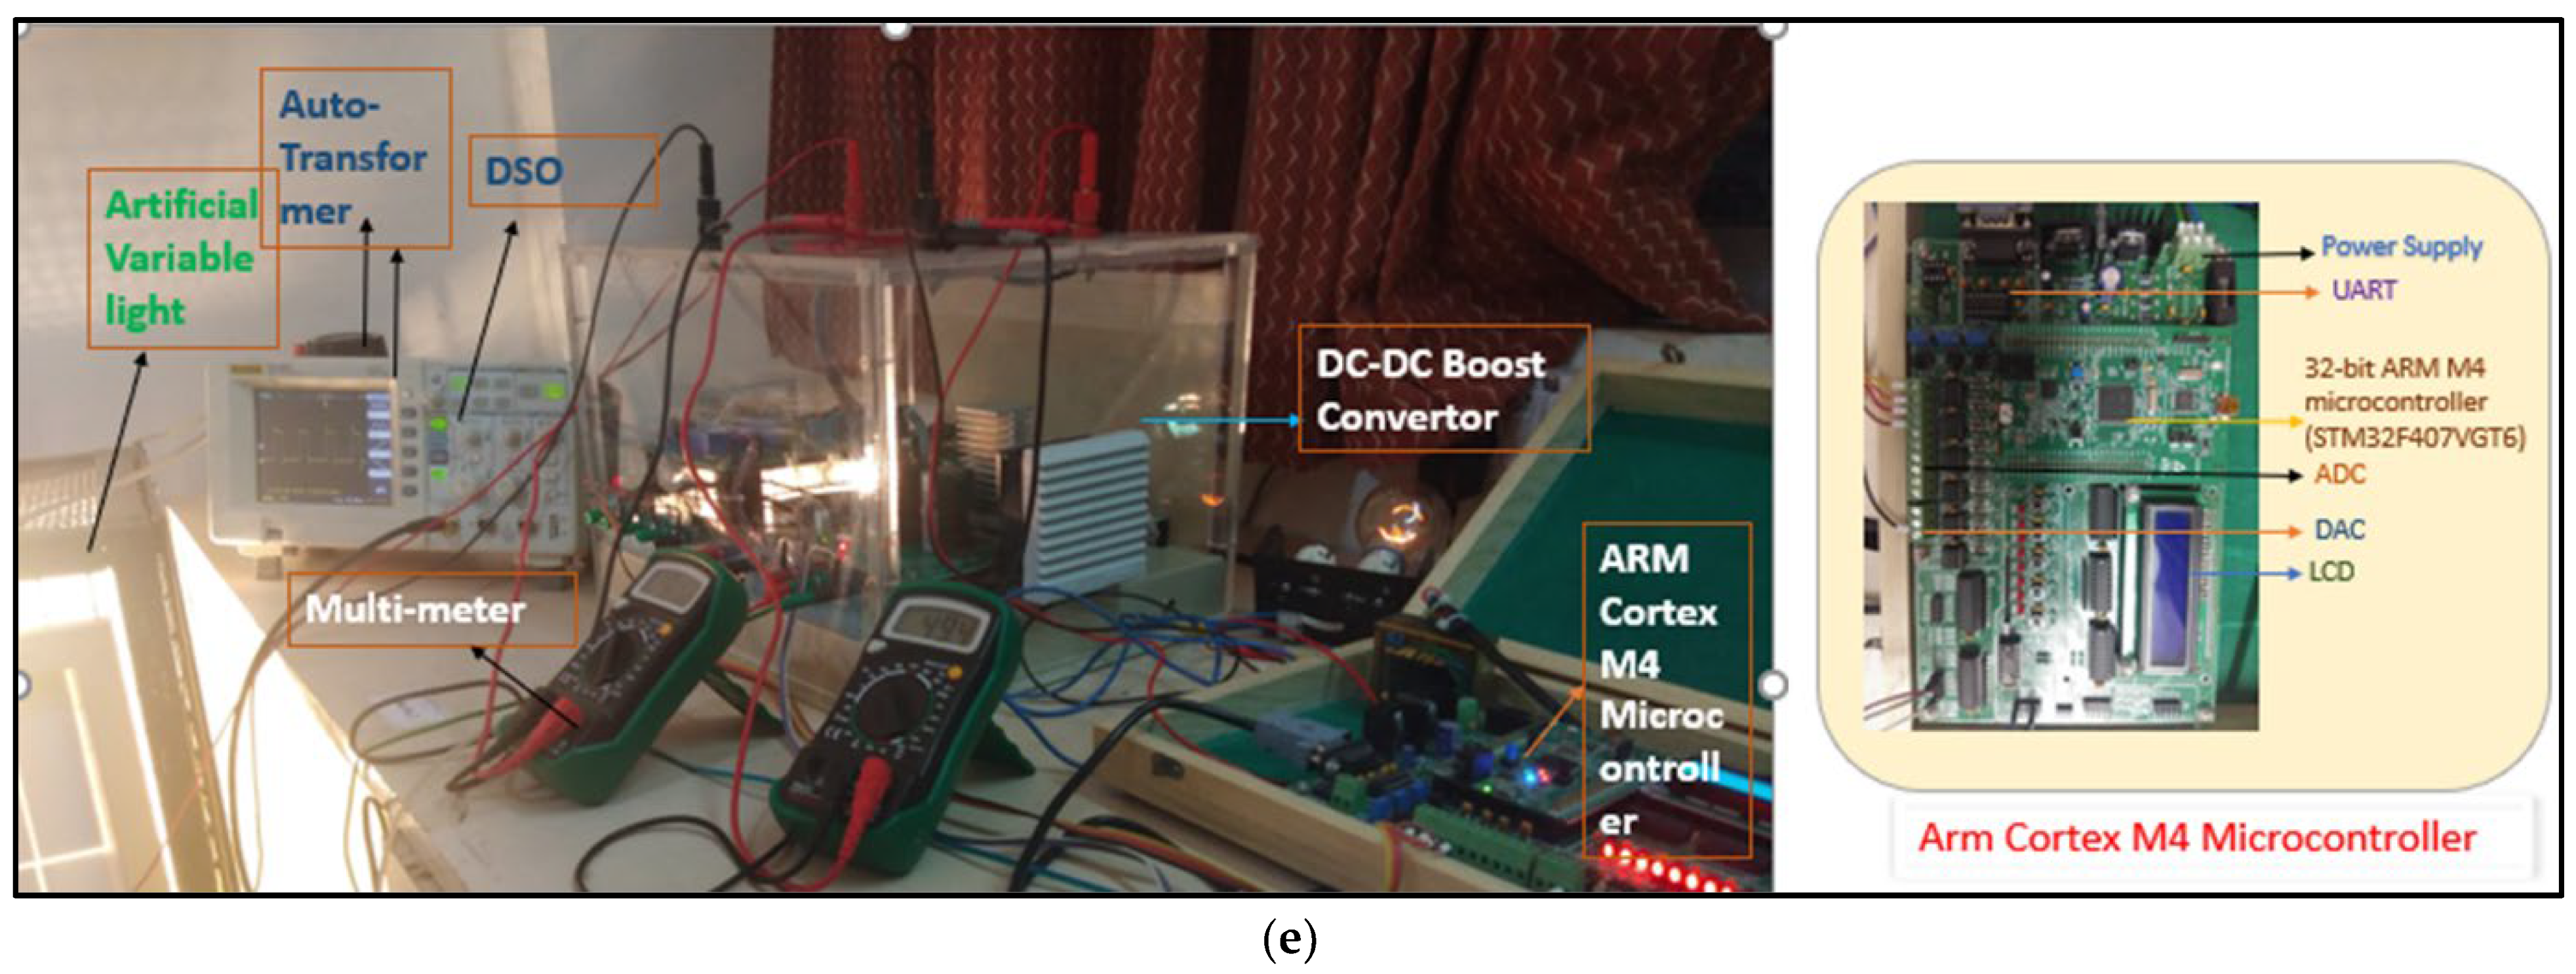
6. STM 32 ARM Cortex M4 Microcontroller
Hardware Descriptive View
- (a)
- Target setup: It consists of sampling time, MC unit and compiler, etc. For a given MC unit, this remains the same for all developed models. Here, we had to configure only the target device, as shown in Figure 14a;
- (b)
- Controller operation: The pulse and sine generator block, and other Simulink blocks can be used to create control logic blocks or code for any customizable applications. These blocks define a model’s control logic and are used to generate an application’s control signals/firing pulses. Control blocks for closed-loop applications can be designed using ADC and DAC, as shown in Figure 14a,b.

7. Experimental Setup
8. Results and Discussion
9. Conclusions
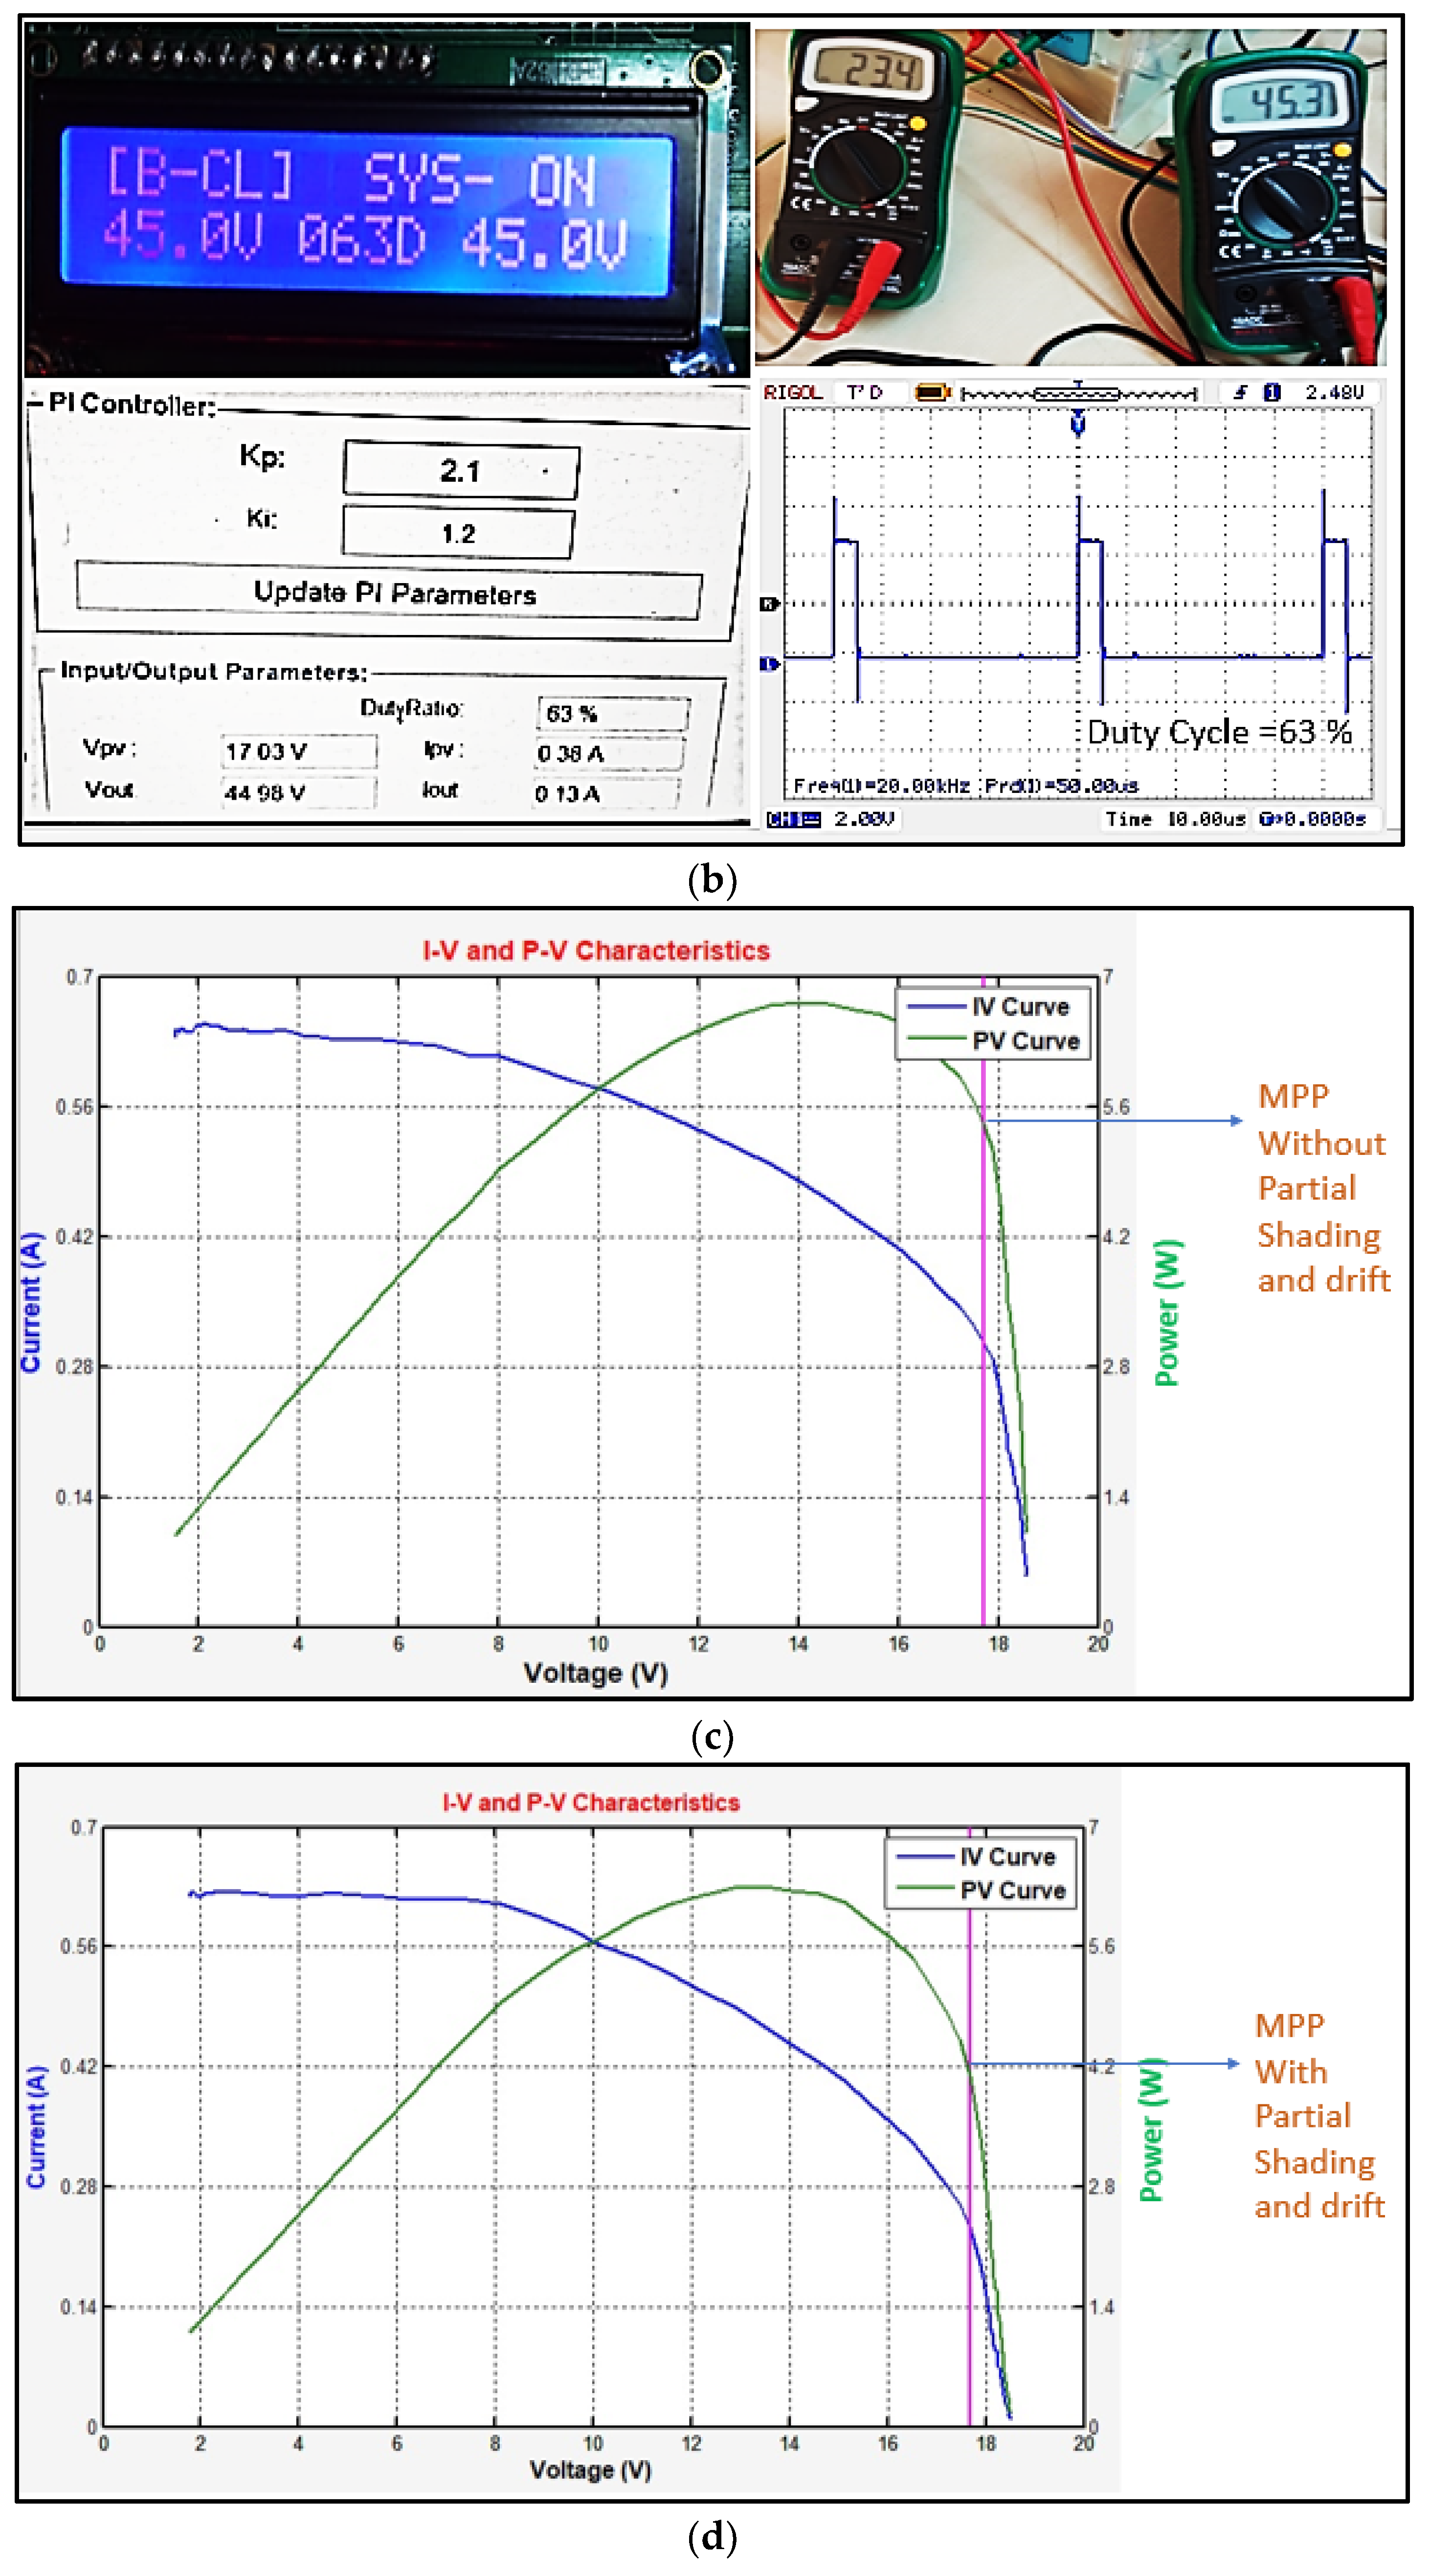
- The proposed technique performed well in the condition of having PS and drifts, with the power output of 4.1 W at 30% PS and 270 W/m2 insolation levels;
- The used converter yielded a 34.45 V output at 30% PS and 270 W/m2 insolation level, which is more than expected;
- This experimental study confirmed that the proposed technique performed well under rapid changes in the environment;
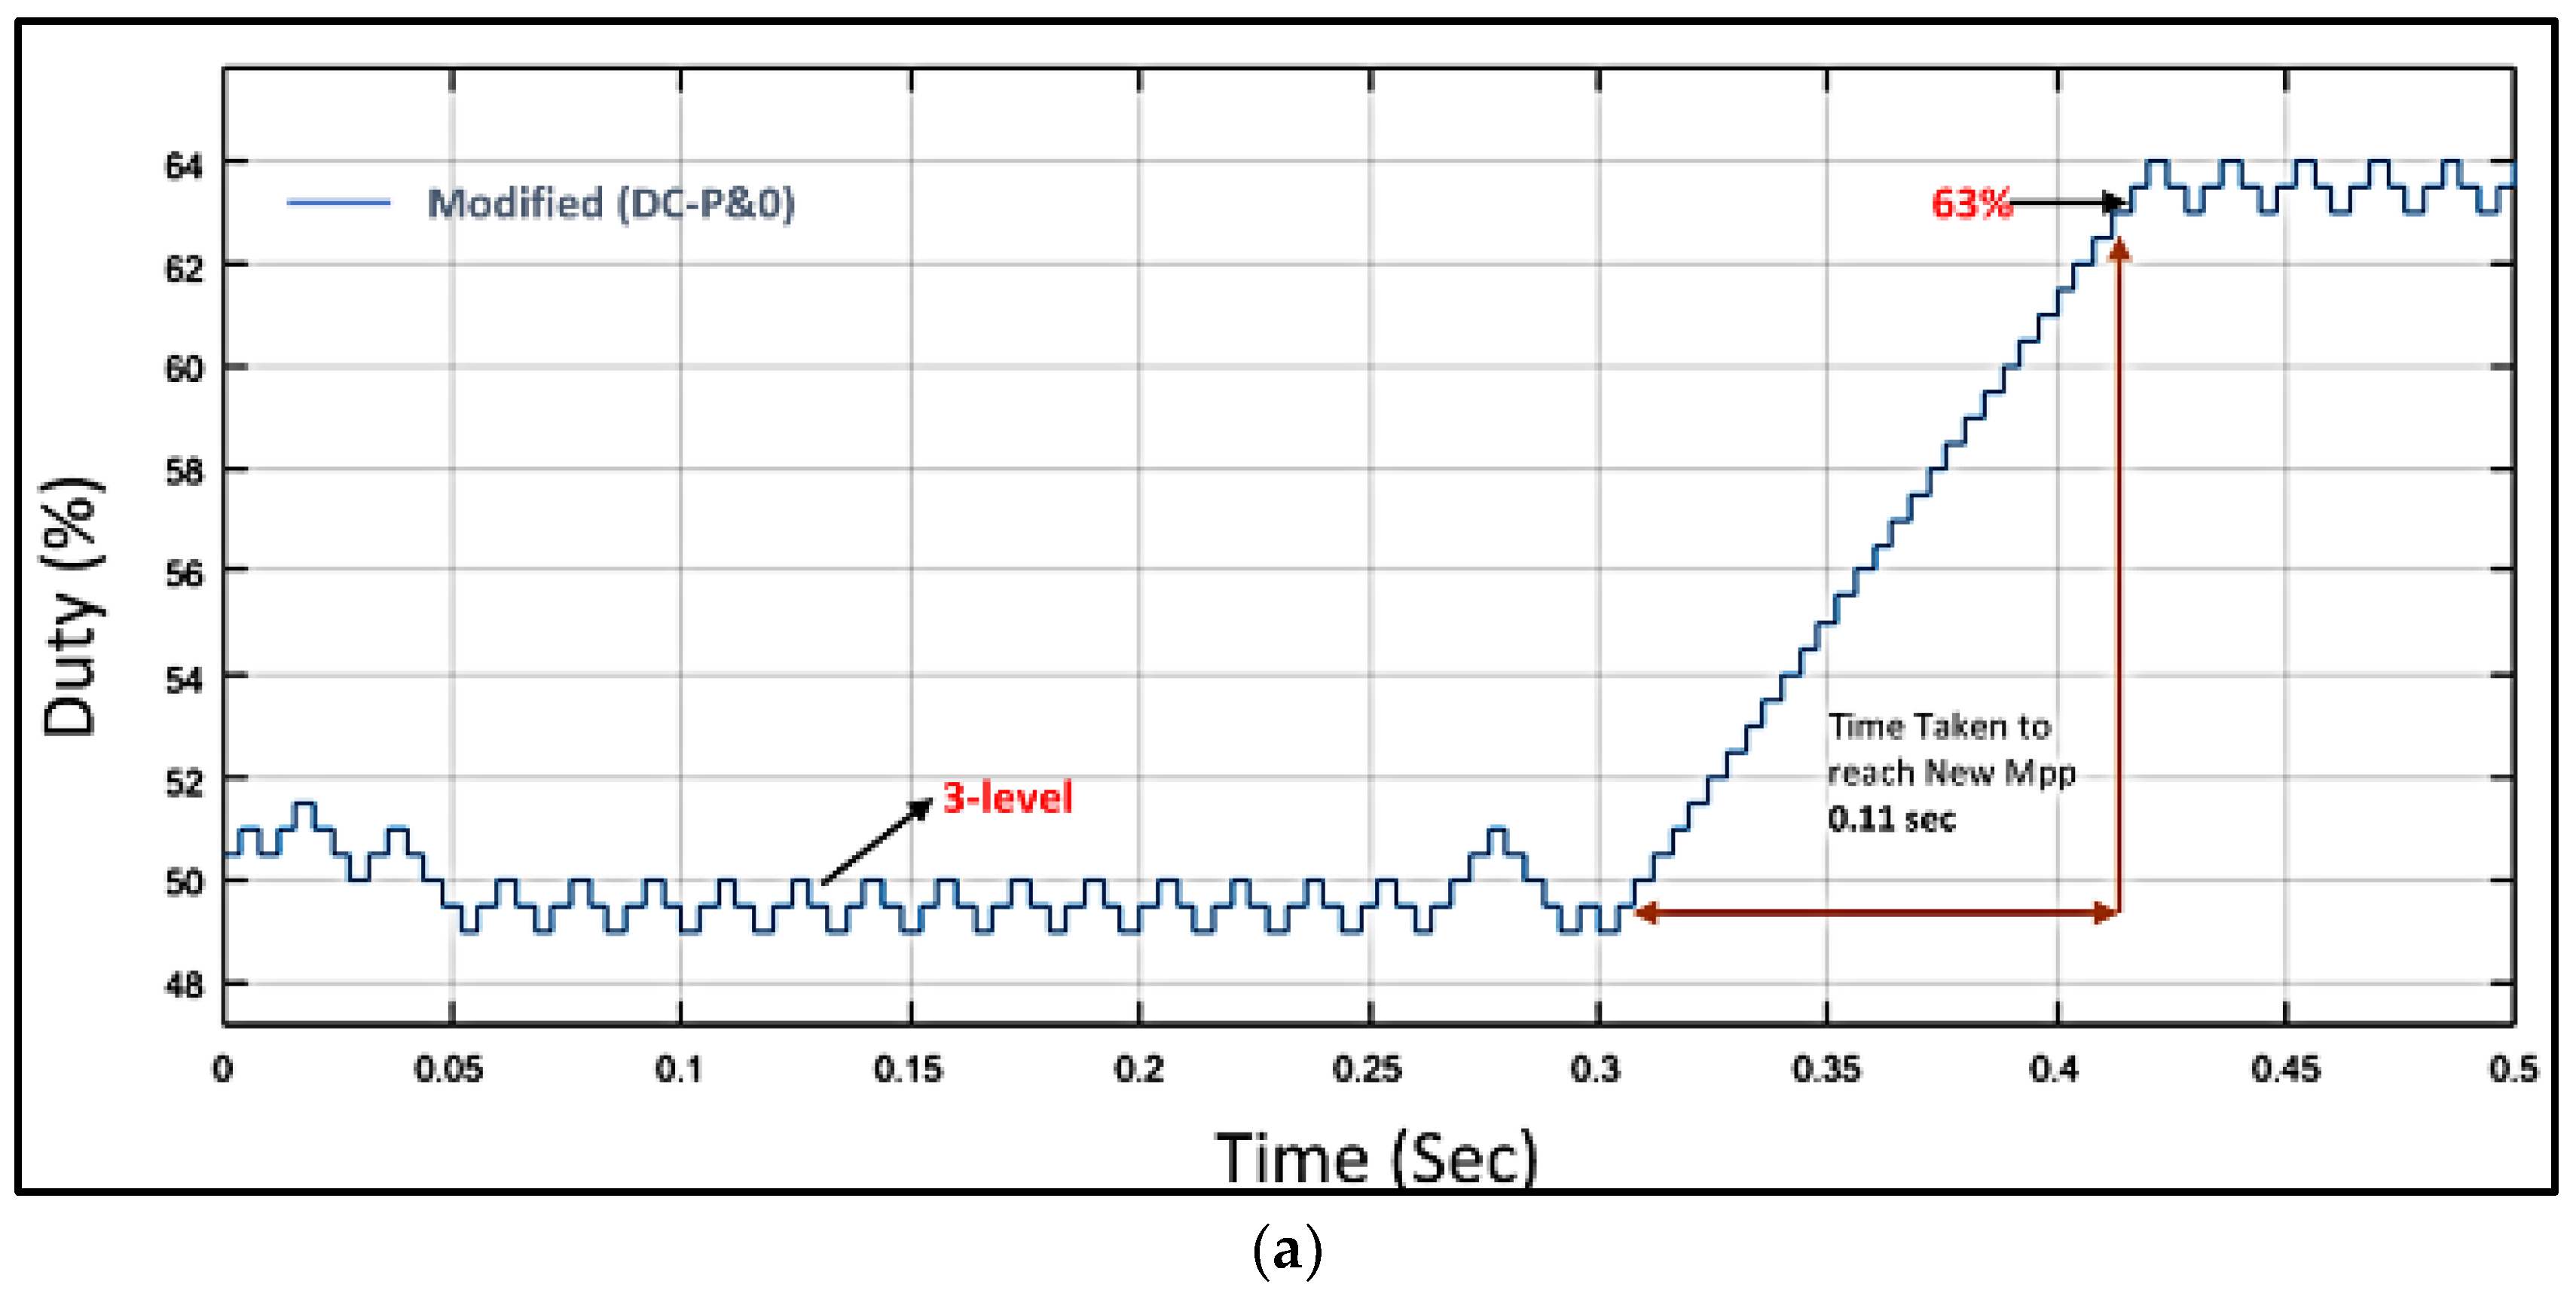
- The proposed technique facilitated the tracking of the MPP at 63% within 0.11 s;
- The controller used for the experimental study worked on open-loop (OL) and closed-loop (CL) controls to obtain real-time P–V and I–V curves, as shown in Figure 16c,d;
- The conversion efficiency of this controller was 94.48% without PS and drift, and 80.39% with 30% PS, both of which are more than the data mentioned in the literature survey;
- The proposed technique is better suited for low-voltage-based stand-alone PV systems;
- The proposed approach yielded a percentage absolute error within the hardware limits.
Author Contributions
Funding
Institutional Review Board Statement
Informed Consent Statement
Data Availability Statement
Conflicts of Interest
Abbreviations
| Term | Description |
| MPPT | Maximum power point technique |
| DC-(P&O) | Drift control-(perturbation and observation) |
| PSIM | Power simulator |
| PV | Photovoltaic cell |
| MPP | Maximum power point |
| IGBT | Insulated gate bipolar transistor |
| DC | Direct current |
| PID | Proportional integral derivative |
| RAM | Random-access memory |
| D/A | Digital to analogue |
| DMA | Direct-memory access |
| FIFO | First in first out |
| Voc | Open-circuit voltage |
| Isc | Short-circuit current |
| Vmp | Voltage at maximum power |
| Imp | Current at maximum power |
| Vout | Output voltage |
| Iout | Output current |
| Pout | Output power |
| SSP | Steady-state points |
| SDPV | Single-diode PV |
| MC | Microcontroller |
| SSO | Steady-state operations |
References
- Ahmed, M.; Abdelrahem, M.; Harbi, I.; Kennel, R. An Adaptive Model-Based MPPT Technique with Drift-Avoidance for Grid-Connected PV Systems. Energies 2020, 13, 6656. [Google Scholar] [CrossRef]
- Foster, E.; Contestabile, M.; Blazquez, J.; Manzano, B.; Workman, M.; Shah, N. The unstudied barriers to widespread renewable energy deployment: Fossil fuel price responses. Energy Policy 2017, 103, 258–264. [Google Scholar] [CrossRef]
- Kumar, S.R.; Gafaro, F.; Daka, A.; Raturi, A. Modelling and analysis of grid integration for high shares of solar PV in small isolated systems—A case of Kiribati. Renew. Energy 2017, 108, 589–597. [Google Scholar] [CrossRef]
- Das, P.; Mohapatra, A.; Nayak, B. Modeling and characteristic study of solar photovoltaic system under partial shading condition. Mater. Today Proc. 2017, 4, 12586–12591. [Google Scholar] [CrossRef]
- Roman, E.; Alonso, R.; Ibanez, P.; Elorduizapatarietxe, S.; Goitia, D. Intelligent PV Module for Grid-Connected PV Systems. IEEE Trans. Ind. Electron. 2006, 53, 1066–1073. [Google Scholar] [CrossRef]
- Singhal, A.K.; Beniwal, N.S.; Almutairi, K.; Dhanraj, J.A.; Mostafaeipour, A.; Issakhov, A.; Chaurasiya, P.K.; Goudarzi, H.; Singh, V.K. Experimental Analysis of Modified DC-P&O Technique with Arm Controller for a Stand-Alone 40 W PV System. Energies 2021, 14, 6169. [Google Scholar] [CrossRef]
- Khatoon, S.I.; Jalil, M.F. Analysis of solar photovoltaic array under partial shading conditions for different array configrations. In Proceedings of the 2014 International Conference on Innovative Applications of Computational Intelligence on Power, Energy and Controls with Their Impact on Humanity, Ghaziabad, India, 28–29 November 2014; pp. 452–456. [Google Scholar] [CrossRef]
- Ramaprabha, R.; Mathur, B.L. A Comprehensive Review and Analysis of Solar Photovoltaic Array Configurations under Partial Shaded Conditions. Available online: https://www.hindawi.com/journals/ijp/2012/120214/ (accessed on 28 May 2022).
- Belhachat, F.; Larbes, C. Modeling, analysis and comparison of solar photovoltaic array configurations under partial shading conditions. Sol. Energy 2015, 120, 399–418. [Google Scholar] [CrossRef]
- Shah, R.; Mithulananthan, N.; Bansal, R.; Ramachandaramurthy, V. A review of key power system stability challenges for large-scale PV integration. Renew. Sustain. Energy Rev. 2015, 41, 1423–1436. [Google Scholar] [CrossRef]
- Saravanan, S.; Babu, N.R. Maximum power point tracking algorithms for photovoltaic system—A review. Renew. Sustain. Energy Rev. 2016, 57, 192–204. [Google Scholar] [CrossRef]
- Javed, M.Y.; Gulzar, M.M.; Rizvi, S.T.H.; Arif, A. A hybrid technique to harvest maximum power from PV systems under partial shading conditions. In Proceedings of the 2016 International Conference on Emerging Technologies, Islamabad, Pakistan, 18–19 October 2016. [Google Scholar] [CrossRef]
- Alferidi, A.; Karki, R. Development of Probabilistic Reliability Models of Photovoltaic System Topologies for System Adequacy Evaluation. Appl. Sci. 2017, 7, 176. [Google Scholar] [CrossRef] [Green Version]
- Robles-Campos, H.R.; Azuaje–Berbecí, B.J.; Scheller, C.J.; Angulo, A.; Mancilla–David, F. Detailed modeling of large scale photovoltaic power plants under partial shading conditions. Sol. Energy 2019, 194, 485–498. [Google Scholar] [CrossRef]
- Shams, I.; Mekhilef, S.; Tey, K.S. Advancement of voltage equalizer topologies for serially connected solar modules as partial shading mitigation technique: A comprehensive review. J. Clean. Prod. 2020, 285, 124824. [Google Scholar] [CrossRef]
- Baba, A.O.; Liu, G.; Chen, X. Classification and Evaluation Review of Maximum Power Point Tracking Methods. Sustain. Futur. 2020, 2, 100020. [Google Scholar] [CrossRef]
- Teng, J.-H.; Huang, W.-H.; Hsu, T.-A.; Wang, C.-Y. Novel and Fast Maximum Power Point Tracking for Photovoltaic Generation. Available online: https://ieeexplore.ieee.org/abstract/document/7450664/ (accessed on 2 February 2022).
- Obukhov, S.; Ibrahim, A.; Diab, A.A.Z.; Al-Sumaiti, A.S.; Aboelsaud, R. Optimal Performance of Dynamic Particle Swarm Optimization Based Maximum Power Trackers for Stand-Alone PV System Under Partial Shading Conditions. IEEE Access 2020, 8, 20770–20785. [Google Scholar] [CrossRef]
- Valenciaga, F.; Inthamoussou, F.A. A novel PV-MPPT method based on a second order sliding mode gradient observer. Energy Convers. Manag. 2018, 176, 422–430. [Google Scholar] [CrossRef]
- Kumar, M.R.; Narayana, S.S.; Vulasala, G. Advanced sliding mode control for solar PV array with fast voltage tracking for MPP algorithm. Int. J. Ambient. Energy 2018, 41, 1192–1200. [Google Scholar] [CrossRef]
- Dallago, E.; Liberale, A.; Miotti, D.; Venchi, G. Direct MPPT algorithm for PV sources with only voltage measurements. IEEE Trans. Power Electron. 2015, 30, 6742–6750. [Google Scholar] [CrossRef]
- Endo, F.A.; Courousse, D.; Charles, H.-P. Micro-architectural simulation of in-order and out-of-order ARM microprocessors with gem5. In Proceedings of the 2017 International Conference on Embedded Computer Systems: Architectures, Modeling and Simulation, Pythagorion, Greece, 17–20 July 2017; pp. 266–273. [Google Scholar] [CrossRef]
- Shaw, R.N.; Walde, P.; Ghosh, A. IOT based MPPT for Performance Improvement of Solar PV Arrays Operating under Partial Shade Dispersion. In Proceedings of the 9th IEEE Power India International Conference, Delhi, India, 28 February–1 March 2020. [Google Scholar] [CrossRef]
- Kandemir, E.; Cetin, N.S.; Borekci, S. A comprehensive overview of maximum power extraction methods for PV systems. Renew. Sustain. Energy Rev. 2017, 78, 93–112. [Google Scholar] [CrossRef]
- Benkercha, R.; Moulahoum, S.; Taghezouit, B. Extraction of the PV modules parameters with MPP estimation using the modified flower algorithm. Renew. Energy 2019, 143, 1698–1709. [Google Scholar] [CrossRef]
- Belhachat, F.; Larbes, C. Global maximum power point tracking based on ANFIS approach for PV array configurations under partial shading conditions. Renew. Sustain. Energy Rev. 2017, 77, 875–889. [Google Scholar] [CrossRef]
- Manoharan, P.; Subramaniam, U.; Babu, T.S.; Padmanaban, S.; Holm-Nielsen, J.B.; Mitolo, M.; Ravichandran, S. Improved Perturb and Observation Maximum Power Point Tracking Technique for Solar Photovoltaic Power Generation Systems. IEEE Syst. J. 2020, 15, 3024–3035. [Google Scholar] [CrossRef]
- Alik, R.; Jusoh, A. An enhanced P&O checking algorithm MPPT for high tracking efficiency of partially shaded PV module. Sol. Energy 2018, 163, 570–580. [Google Scholar] [CrossRef]
- Pilakkat, D.; Kanthalakshmi, S. Drift Free Variable Step Size Perturb and Observe MPPT Algorithm for Photovoltaic Systems under Rapidly Increasing Insolation. Electron. ETF 2018, 22, 19–26. [Google Scholar] [CrossRef] [Green Version]
- Ba, A.; Ehssein, C.O.; Mahmoud, M.E.M.O.M.; Hamdoun, O.; Elhassen, A. Comparative Study of Different DC/DC Power Converter for Optimal PV System Using MPPT (P&O) Method. Appl. Sol. Energy 2018, 54, 235–245. [Google Scholar] [CrossRef]
- Ravindran, V.; Sutaria, J. Implementation in arm microcontroller to maximize the power output of solar panel using Hill Climbing Algorithm. In Proceedings of the 2016 International Conference on Electrical, Electronics, and Optimization Techniques (ICEEOT), Chennai, India, 3–5 March 2016; pp. 1234–1240. [Google Scholar] [CrossRef]
- Gammoudi, R.; Brahmi, H.; Hasnaoui, O. Developed and STM implementation of modified P&O MPPT technique for a PV system over sun. EPE J. 2018, 29, 99–119. [Google Scholar] [CrossRef]


| S.No | Name of the Parameter | Values/Specification |
|---|---|---|
| 1 | Vin | 12–22 V |
| 2 | Vout | 36 V |
| 3 | 20 Khz | |
| 4 | Lboost | 5 mH |
| 5 | Cboost | 2200 µF |
| 6 | Diode | RHRP30120 |
| 7 | Relay | 5 V |
| 8 | Pout | 40 W |
| 9 | IGBT | 1200 V, 25 A (KGT25 N120 N) |
| S.No. | Name of Parameter | Tuned Condition | Blocking Condition |
|---|---|---|---|
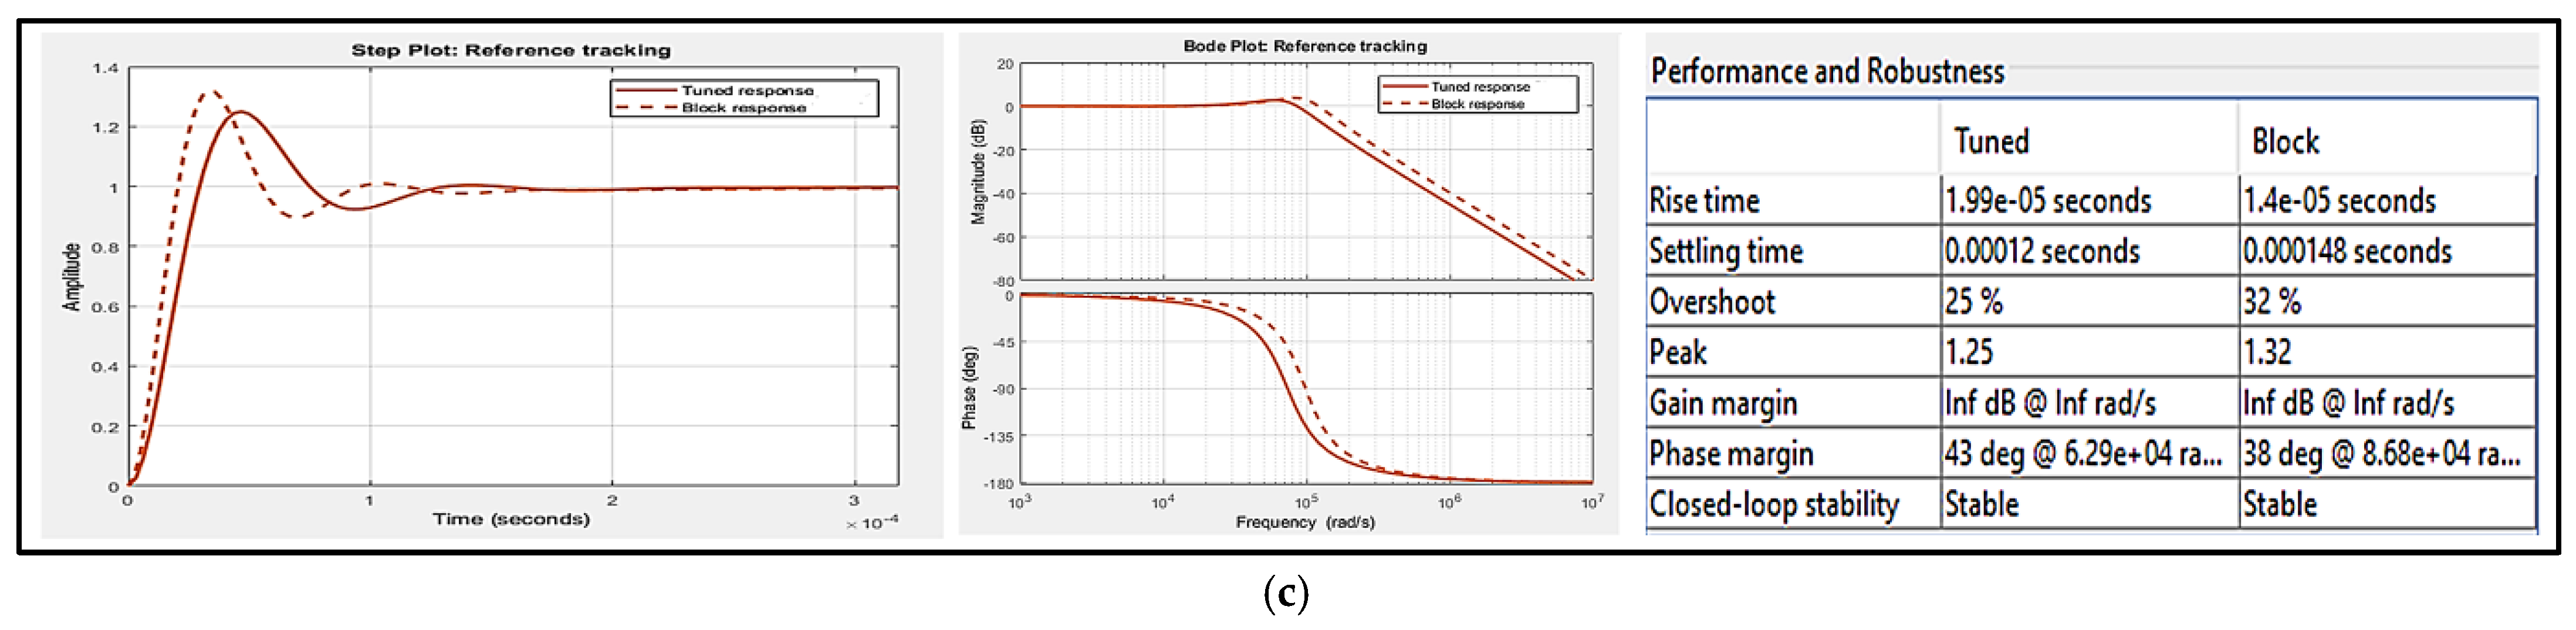
| 1. | Rise time | ||
| 2. | Settling time | 0.00012 s | 0.000148 s |
| 3. | Overshoot | 25% | 32% |
| 4. | Peak | 1.25 | 1.32 |
| 5. | Gain margin | ||
| 6. | Phase margin | 43 °C | 38 °C |
| 7. | Closed-loop stability | Stable | Stable |
| S.No | Name of the Parameters | Hardware Results of Modified DC-(P&O) without PS and Drift | Simulation Results of Modified DC-(P&O) without PS and Drift | Hardware Results of Modified (DC-P&O) with PS and Drift | Simulation Results of Modified DC-(P&O) with PS and Drift |
|---|---|---|---|---|---|
| 1 | Voc | 18.50 V | 18.50 V | 18.50 V | 18.50 V |
| 2 | Isc | 0.60 A | 0.60 A | 0.60 A | 0.60 A |
| 3 | Vmax | 15.56 V | 16.62 V | 13.47 V | 14.2 V |
| 4 | Imax | 0.486 A | 0.43 A | 0.47 A | 0.53 A |
| 5 | Duty ratio | 63% | 63% | 63% | 63% |
| 6 | Vout | 45 V | 39.4 V | 34.45 V | 35.53 V |
| 7 | Iout | 0.123 A | 0.149 A | 0.119 A | 0.123 A |
| 8 | MPP reaching time | 0.11 s | 0.11 s | 0.11 s | 0.117 s |
| 9 | Pout | 5.5 W | 5.9 W | 4.1 W | 4.4 W |
| 10 | Real time (Ppv) | 5.8 W | 6.22 W | 5.1 W | 5.24 W |
| 11 | Controller efficiency | 94.48% | 97.39% | 80.39% | 83.9% |
| 12 | % Error calculation for modified DC-(P&O) without PS and drift | 7.2 | |||
| 13 | % Error calculation for modified DC-(P&O) with PS and drift | 7.3 | |||
Publisher’s Note: MDPI stays neutral with regard to jurisdictional claims in published maps and institutional affiliations. |
© 2022 by the authors. Licensee MDPI, Basel, Switzerland. This article is an open access article distributed under the terms and conditions of the Creative Commons Attribution (CC BY) license (https://creativecommons.org/licenses/by/4.0/).
Share and Cite
Singhal, A.K.; Beniwal, N.S.; Beniwal, R.; Lalik, K. An Experimental Study of Drift Caused by Partial Shading Using a Modified DC-(P&O) Technique for a Stand-Alone PV System. Energies 2022, 15, 4251. https://doi.org/10.3390/en15124251
Singhal AK, Beniwal NS, Beniwal R, Lalik K. An Experimental Study of Drift Caused by Partial Shading Using a Modified DC-(P&O) Technique for a Stand-Alone PV System. Energies. 2022; 15(12):4251. https://doi.org/10.3390/en15124251
Chicago/Turabian StyleSinghal, Ashish Kumar, Narendra Singh Beniwal, Ruby Beniwal, and Krzysztof Lalik. 2022. "An Experimental Study of Drift Caused by Partial Shading Using a Modified DC-(P&O) Technique for a Stand-Alone PV System" Energies 15, no. 12: 4251. https://doi.org/10.3390/en15124251
APA StyleSinghal, A. K., Beniwal, N. S., Beniwal, R., & Lalik, K. (2022). An Experimental Study of Drift Caused by Partial Shading Using a Modified DC-(P&O) Technique for a Stand-Alone PV System. Energies, 15(12), 4251. https://doi.org/10.3390/en15124251