1. Introduction
The promotion of electric vehicles (EVs) is considered to be an important way to alleviate the problems of huge consumption of oil resources and serious environmental pollution in traditional internal combustion engine vehicles. Compared with internal combustion engine vehicles, EVs have the advantages of low emission, high efficiency, low noise, and simple structure, which represent a highly-valued development direction in the contemporary automobile industry [
1].
Studies have shown that the use of multi-speed transmissions in EVs, such as two-speed, three-speed, and four-speed transmissions, can greatly improve the power and economy of vehicles [
2,
3]. Since the multi-speed transmission can adopt low or high gear, on the one hand, it can reduce the requirements for the motor power and the manufacturing cost of the vehicle on the premise of ensuring vehicle performance. On the other hand, it can make the motor work more in the high efficiency range, and further reduce the energy consumption of the vehicle. Therefore, multi-speed transmission has increasingly become the point of focus in the are of EV transmissions [
4].
The gear ratio is an important design parameter for a multi-speed transmission. Whether the gear ratio is reasonable or not has an important influence on the vehicle performance. Therefore, research on the optimization of gear ratios is of great significance to further improve vehicle performance.
In the field of multi-speed transmissions for EVs, two-speed transmissions are widely used, such as automated manual transmission (AMT), dual clutch transmission (DCT), and automatic transmission (AT) [
5,
6,
7]. AMT has strong power performance, high transmission efficiency, and lower manufacturing cost, and is the primary choice of transmission for EVs. Its disadvantage is that there is a power interruption during the shift process, resulting in poor driving comfort. Inverse automated manual transmission (I-AMT) is proposed to realize the seamless gearshift of the two-speed AMT [
8]. The first gear of the transmission transmits power through the synchronizer or the overrunning clutch, and the second gear transmits power through the clutch installed at the end of the input shaft. The power interruption can be avoided by switching the two components during shifting. It is worth mentioning that, besides I-AMT, a torque-assisted AMT can also achieve seamless gearshifts [
9]. The transmission retains the synchronizer shift mode, and the assist clutch is installed at the end of the input shaft. When the synchronizer is separated, the assist clutch is used for power assistance. The unique shift mode means that torque-assisted AMTs have an important application value.
Compared with two-speed transmissions, three-speed transmissions have stronger driving torque and lower energy consumption, which can meet the driving needs of large vehicles and complex road conditions. Therefore, three-speed transmissions, such as three-speed AMT and three-speed AT, are currently primarily used in electric buses [
10,
11]. In order to further improve vehicle performance and meet higher driving demand, three-speed transmission will replace two-speed transmission and become the main choice of the next generation of transmissions for EVs [
12]. Therefore, this paper selects a torque-assist seamless three-speed transmission as the subject of research.
Regarding the gear ratio optimization method, the initial optimization method usually takes the dynamic and economic performance of the vehicle as the objective function for obtaining the gear ratio where the vehicle achieves its best performance [
13,
14]. This optimization method is too simple to consider the impact of many factors on the optimization process. Although it has high optimization efficiency, the optimization results are not accurate. With the deepening of research, researchers have considered the influence of the change of the shift point on the optimization result [
15,
16]. In the optimization process, the gear ratio value is dynamically changing, and the shift point is also changing with it. Therefore, the gear ratio optimization should be combined with the shift schedule to obtain more accurate optimization results. Some researchers believe that the reasonable matching between power battery parameters, electric motor parameters, and gear ratio has a comprehensive impact on vehicle performance. Hence, the parameters of the powertrain are jointly optimized, and the optimal parameters such as power battery capacity, number of battery modules, peak power, peak torque, peak speed of electric motor, and gear ratio are obtained [
17,
18,
19]. Kihan Kwon et al. [
20] believe that the transmission efficiency of a multi-speed transmission is lower than that of a single-speed transmission. Therefore, the internal loss of the multi-speed transmission is analyzed, and the transmission efficiency varying with driving conditions is adopted to optimize the gear ratio, obtaining more accurate optimization results.
Most of the vehicle performance evaluation indexes selected for optimization focus on dynamic performance (such as acceleration time and maximum speed) and economic performance (such as energy consumption and driving range) [
21,
22,
23]. In fact, in addition to power and economy, comfort (such as jerk) is also an important evaluation indicator. With the development of EVs, consumers demand not only stronger acceleration performance and longer driving range, but also a more comfortable driving experience. Optimizing the jerk can significantly improve the driving comfort of the vehicle, and it is also beneficial in terms of safety [
24,
25]. Therefore, it is necessary to comprehensively consider the power, economy, and comfort.
In previous studies, the calculation of acceleration time usually only includes the acceleration time in gear, while ignoring the shift time. Even if the shift time is added, it is only a fixed shift time [
26,
27]. The acceleration time obtained by the above calculation not only has a certain error with regard to the actual value, but also fails to achieve optimization of the shift time. For transmissions with a clutch (such as I-AMT, torque-assisted AMT, and DCT), as a part of energy consumption, the large amount of friction generated by the clutch during shifting cannot be ignored. Gao et al. [
28] estimated the friction of I-AMT, and the results showed that the maximum friction reached 20 kJ in only one upshift process. Therefore, it is necessary to consider reducing the friction loss of the clutch to the greatest extent while optimizing energy consumption. The jerk during vehicle driving can be divided into the jerk when the vehicle is in gear and the jerk when the vehicle shifts. For AMT, shift jerk accounts for a large proportion. Transmission without power interruption can improve driving comfort and enhance user satisfaction. On this basis, the shift comfort of the vehicle can be further improved by optimizing the jerk. In summary, the reasonable allocation of gear ratio has a significant influence on shifting time, friction work, and jerk. It is necessary to consider the shift performance of the transmission when optimizing the gear ratio.
The power and economy of vehicles are usually in conflict with each other, which means that the two optimization objectives cannot be optimized at the same time. Previous studies transformed multi-objective optimization into a single-objective optimization by weighting, and then obtained an optimal solution through single-objective optimization algorithms such as a genetic algorithm [
29], particle swarm optimization [
30], and dynamic programming [
31]. The optimal solution depends on the weight coefficient, and the selection of the weight coefficient is mainly based on the experience of the researchers, which has certain limitations. Solving the Pareto front using a multi-objective optimization algorithm is the main trend of current research. The Pareto front reflects the trade-off between the objective functions and meets the requirements of multi-objective optimization of vehicle performance. Widely used multi-objective optimization algorithms include the non-dominated sorting genetic algorithm II (NSGA-II) [
32,
33] and the multi-objective particle swarm optimization algorithm (MOPSO) [
34,
35]. Most studies use NSGA-II to solve the two-objective optimization problem of power and economy, which has good convergence. However, for the three-objective optimization problem, the optimization process is more complex and the amount of calculation is larger, so a more superior optimization algorithm is needed. A reference-point based non-dominated sorting genetic algorithm II (NSGA-III) adopts a new selection mechanism on the basis of the NSGA-II framework, which is suitable for multi-objective optimization problems with three or more objectives [
36].
In summary, taking the torque-assisted seamless three-speed AMT (hereinafter referred to as three-speed AMT), with power, economy, and comfort as the optimization objectives, the gear ratio of the three-speed AMT is optimized by NSGA-III on the MATLAB simulation platform, and the shift performance is considered in the optimization objectives. The remaining contents of this paper are arranged as follows: the structure of the three-speed AMT and the shift process without power interruption are introduced in
Section 2. In
Section 3, in order to optimize the gear ratio, the EV simulation model is established. The multi-objective optimization process of gear ratio, with consideration of shifting performance, is analyzed in detail in
Section 4. In
Section 5, the multi-objective optimization algorithm is used to solve the optimization problem and analyze the simulation results.
Section 6 summarizes the research contents of this paper.
2. Seamless Three-Speed AMT
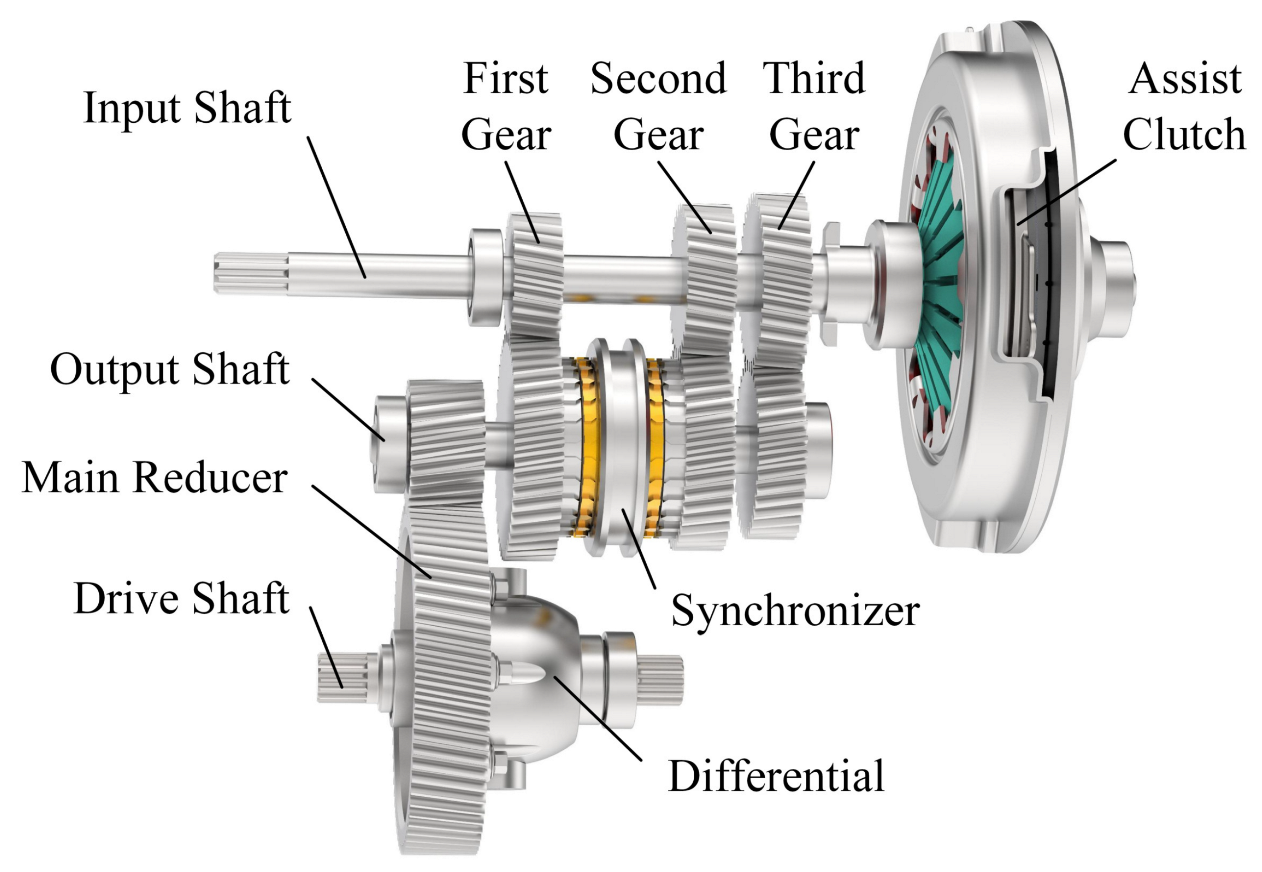
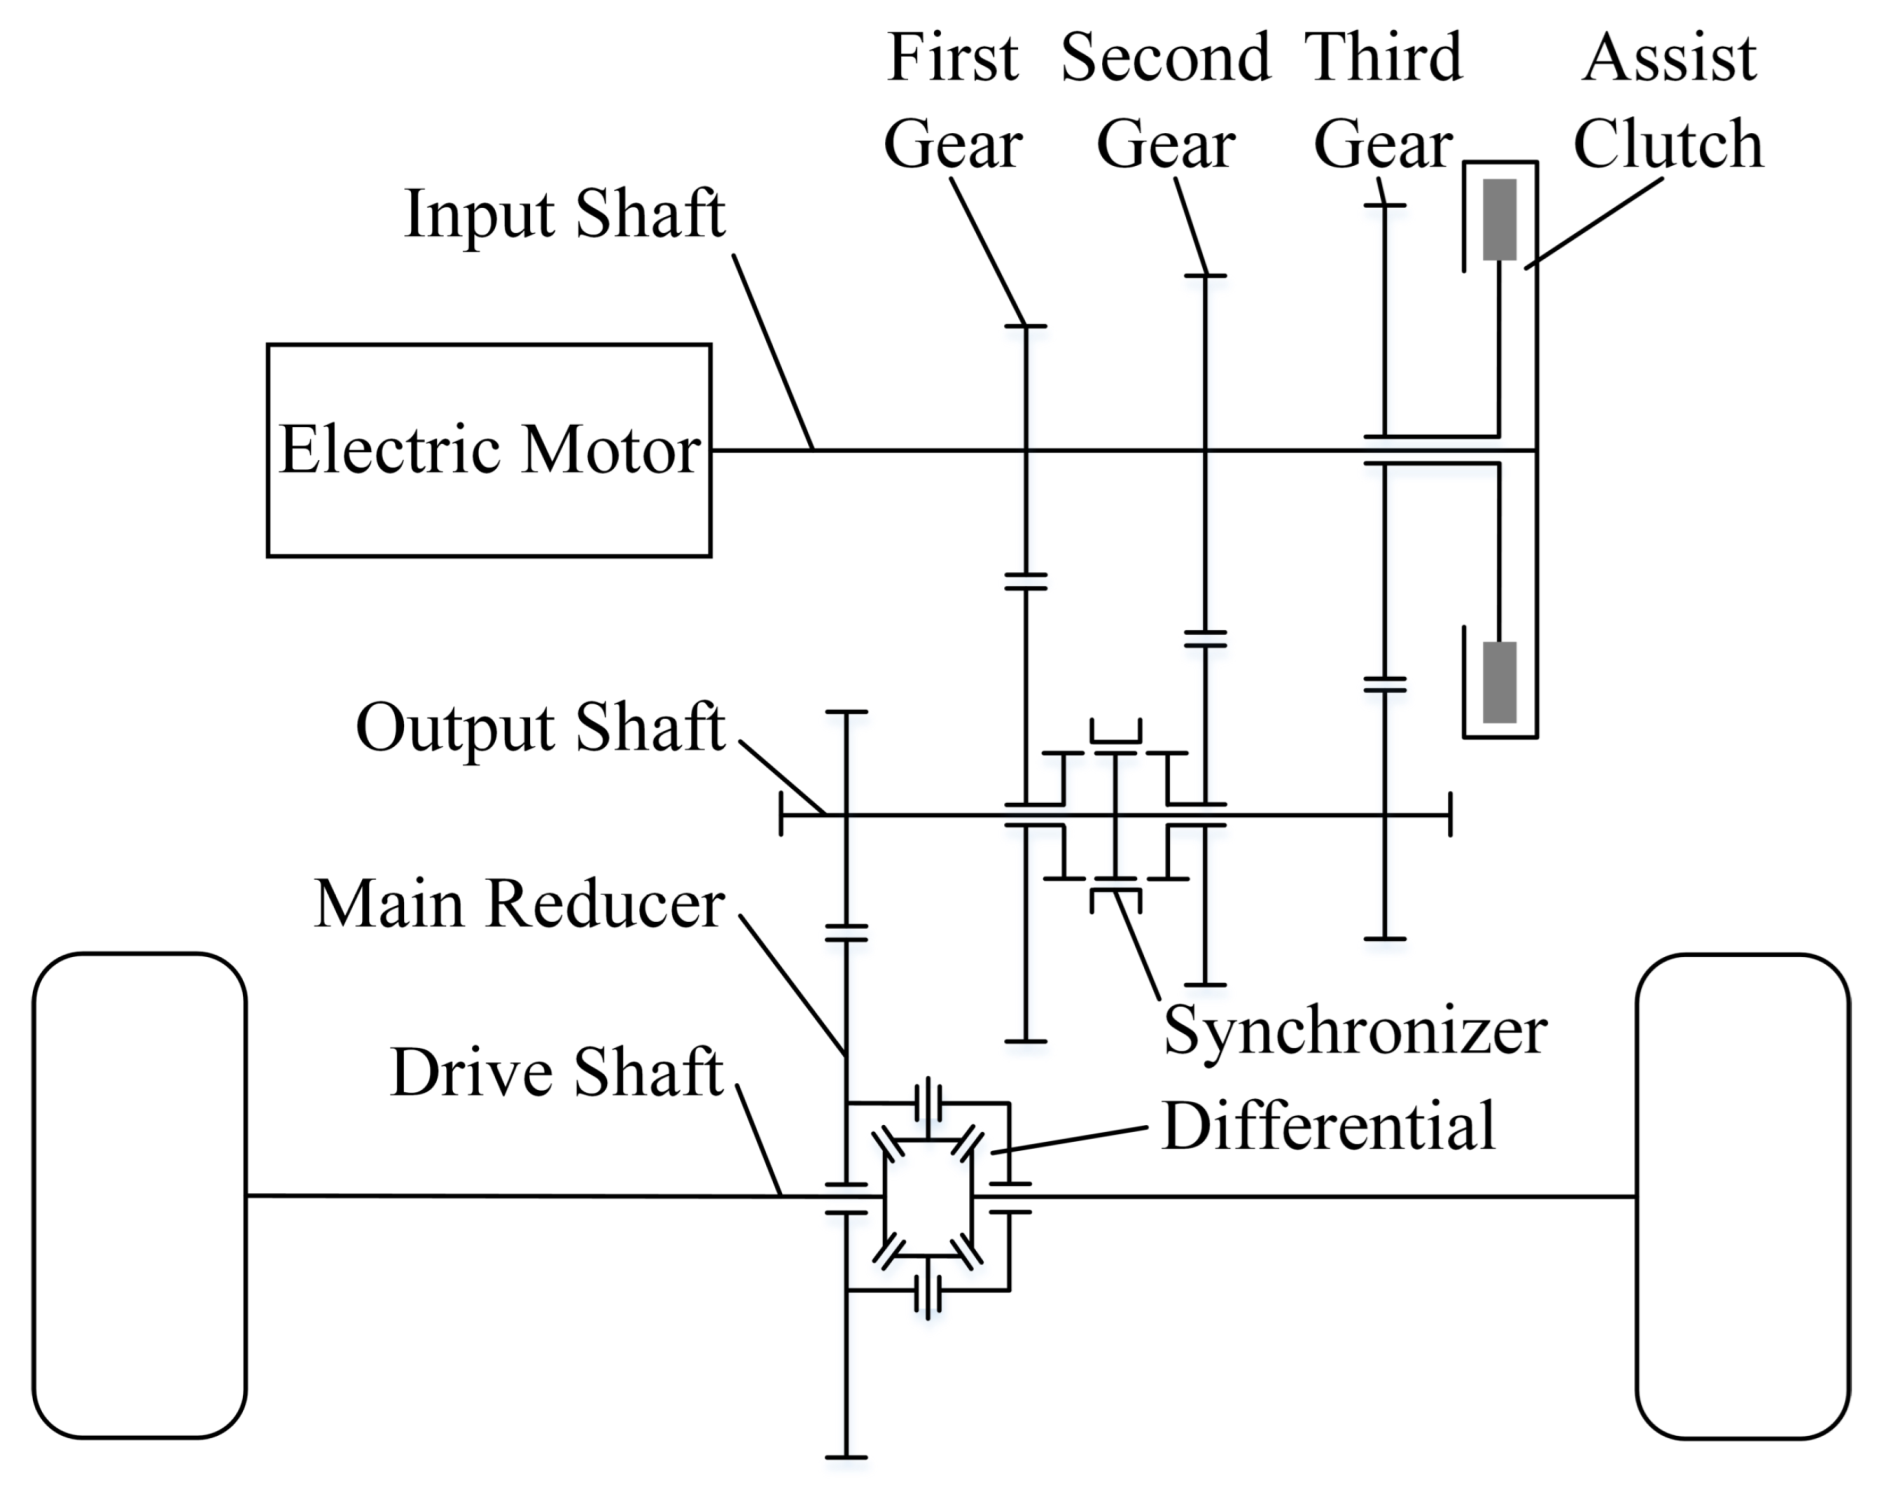
The powertrain equipped with the three-speed AMT is shown in
Figure 1, which mainly includes electric motor, three-speed transmission, main reducer, and differential. The transmission consists of the first gear pair, second gear pair, third gear pair, assist clutch, and synchronizer. When the first gear or second gear is engaged, the synchronizer is combined with the first driven gear or second driven gear respectively to transmit the electric motor torque to the main reducer. The assist clutch driving plate is connected with the flywheel installed at the end of input shaft, and the assist clutch driven plate is connected with the driving gear of the third gear pair. When the third gear is engaged, the torque is transmitted by the assist clutch and the third gear pair. The three-dimensional model of the driveline system is shown in
Figure 2.
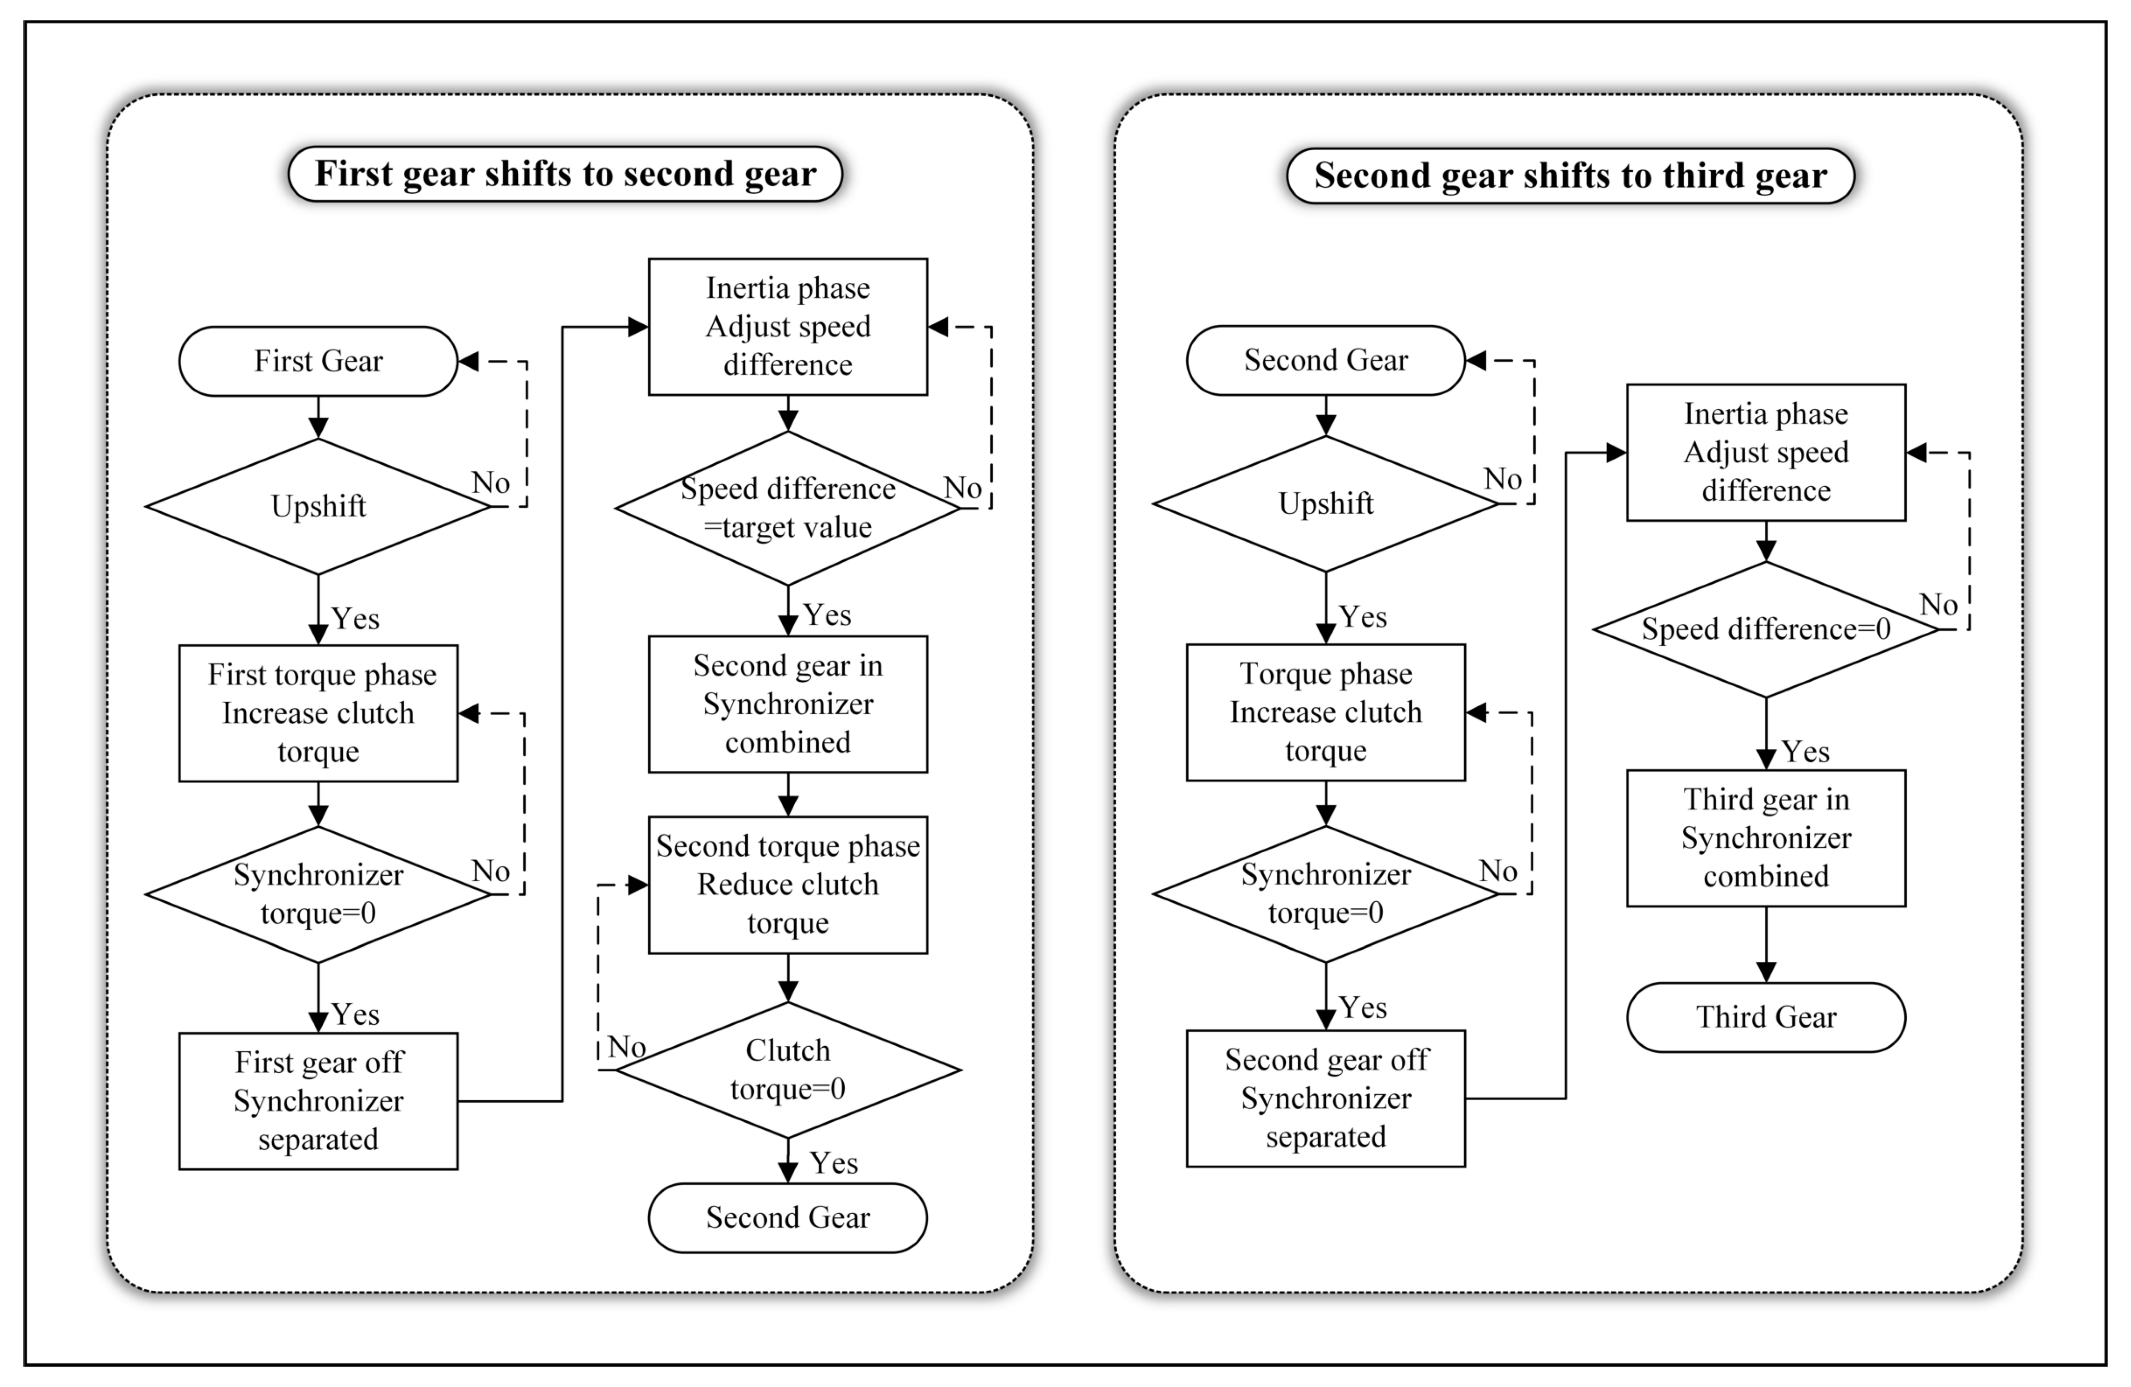
Three-speed AMT can achieve seamless gearshift between three gears. Taking the upshift process as an example, the shift process is shown in
Figure 3.
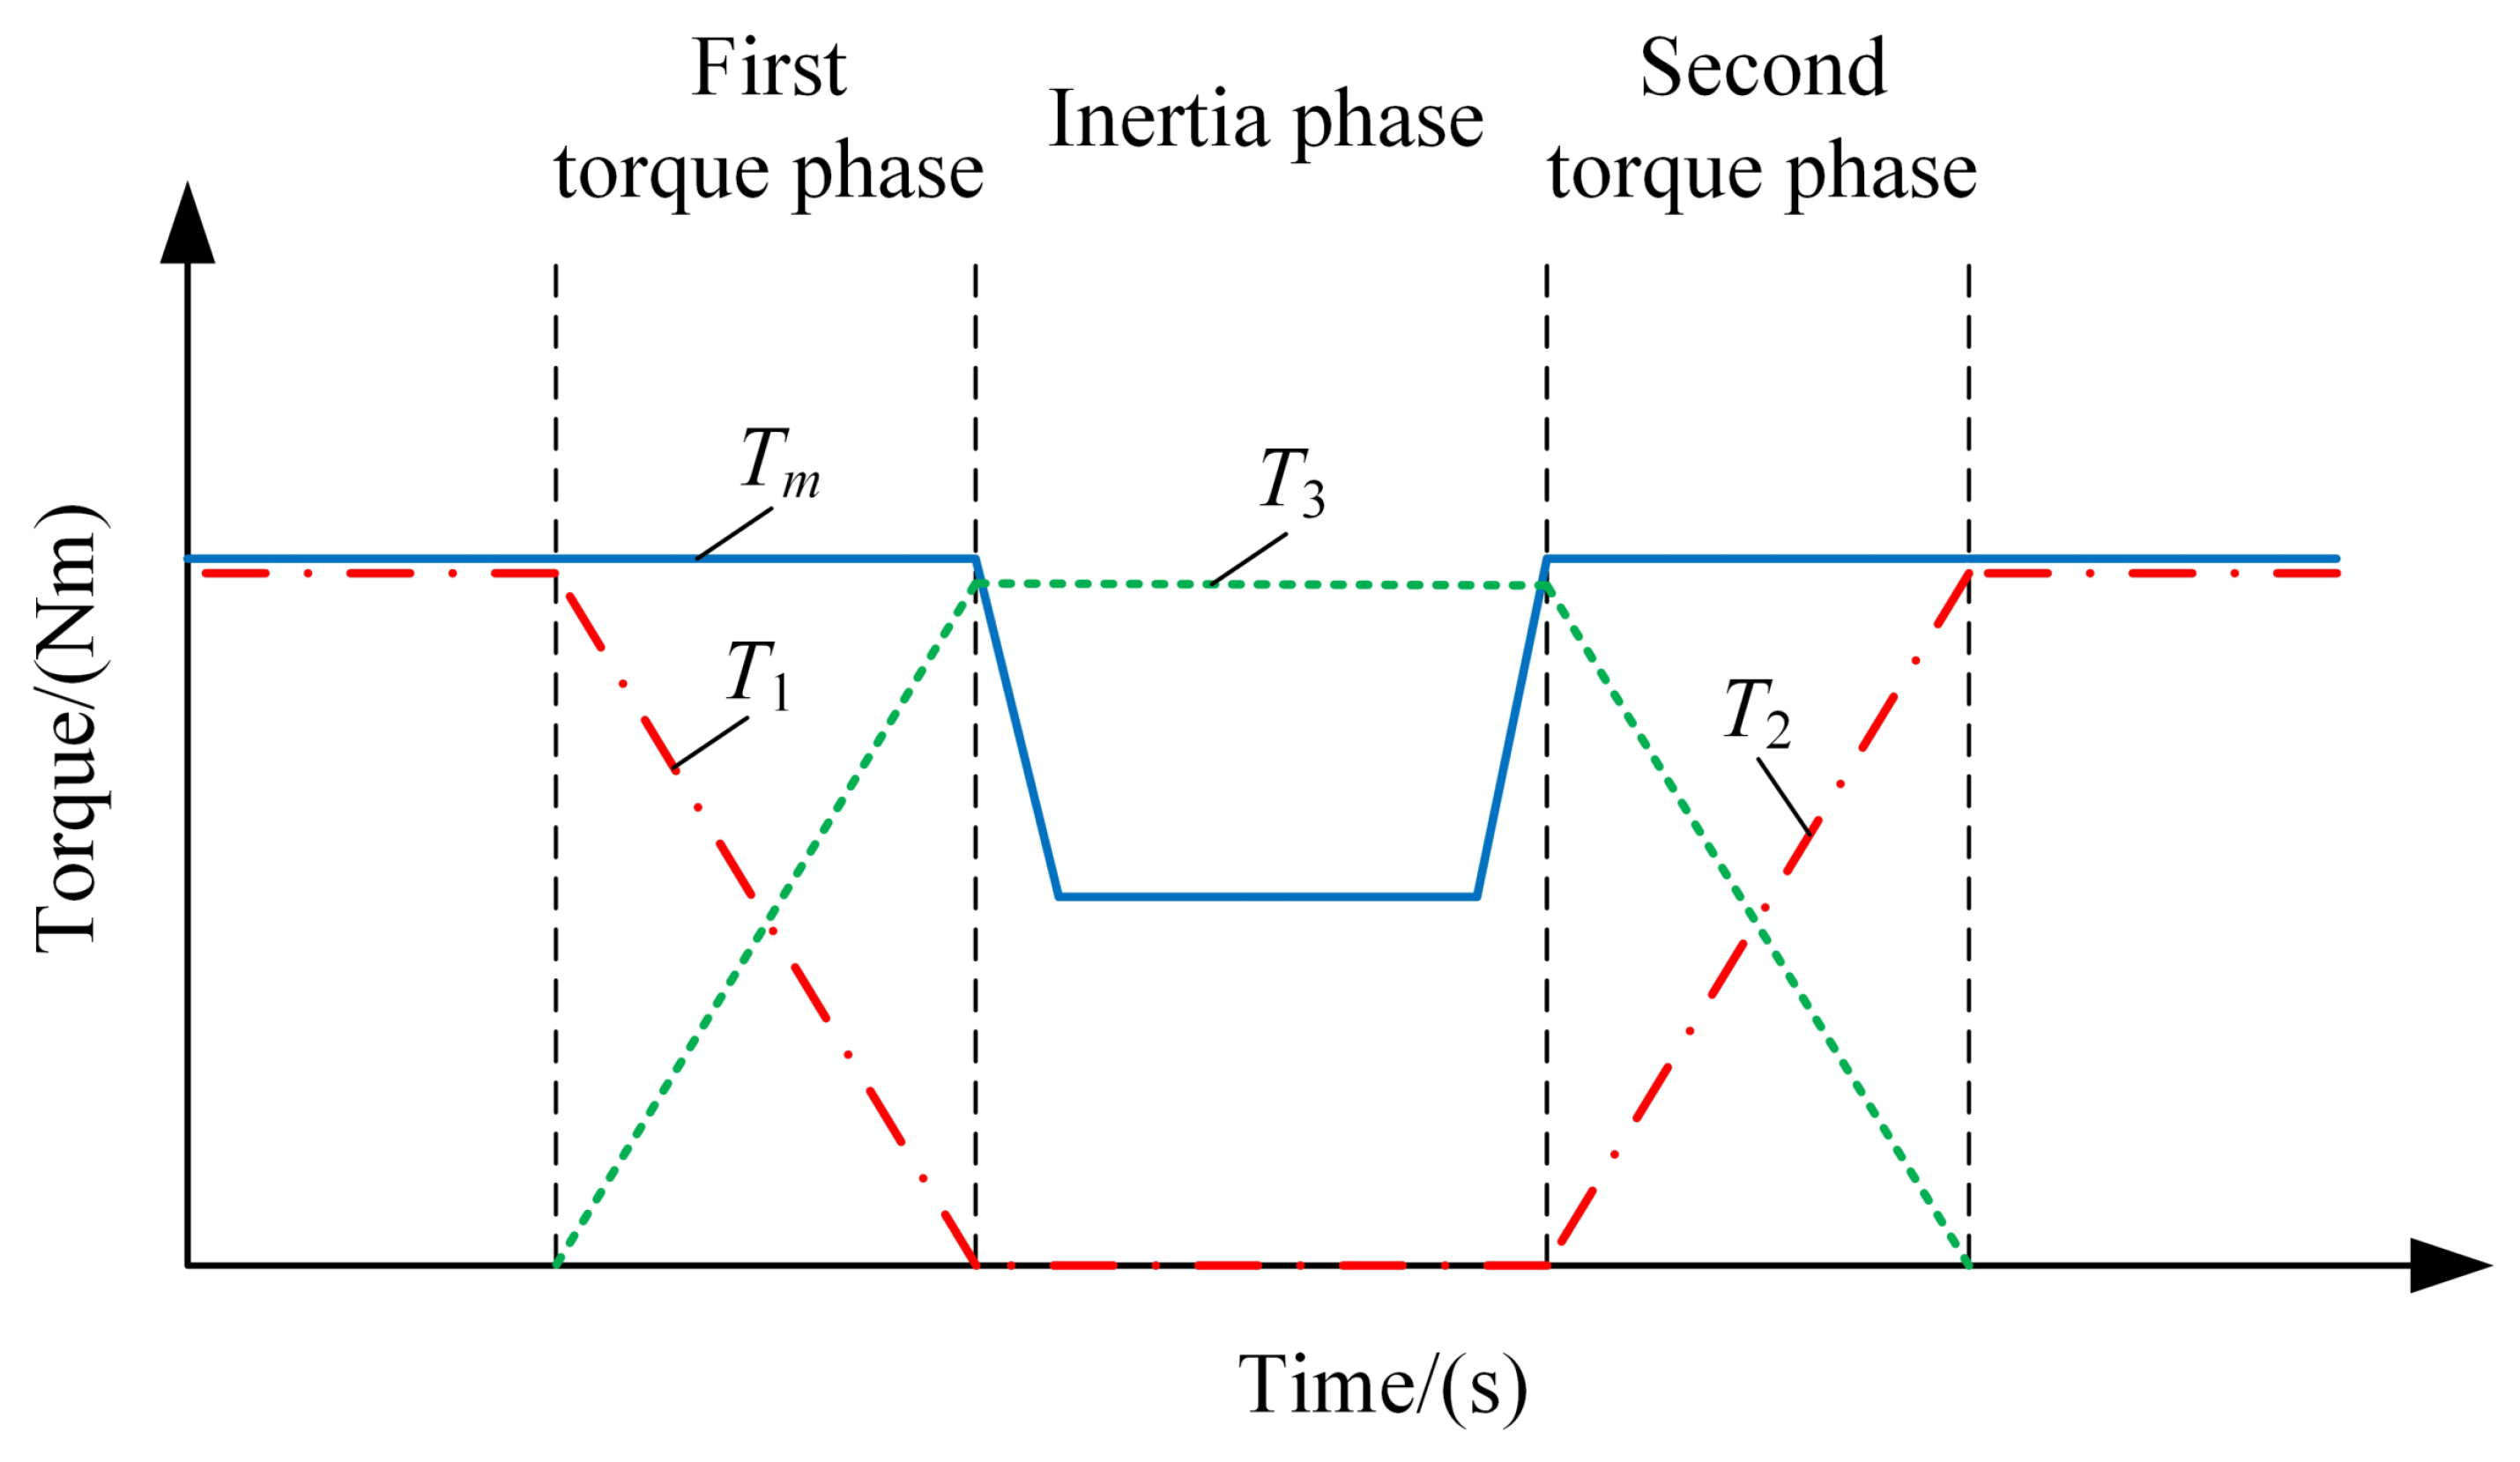
The process from the first gear to the second gear is divided into three phases: the first torque phase, inertia phase, and the second torque phase. In the first torque phase, the clutch begins to engage, and the clutch and the synchronizer jointly transmit the electric motor torque. The clutch torque gradually increases, while the synchronizer torque decreases. When the synchronizer torque drops to zero, the synchronizer is separated from the first driven gear, and the first gear is disengaged. In the inertia phase, the speed difference between the driving plate and driven plate of the clutch is adjusted to synchronize the synchronizer and the second driven gear. When the synchronizer and the second driven gear are combined, the second gear is engaged. In the second torque phase, the clutch is gradually disengaged. When the clutch is completely disengaged, the upshift process is completed.
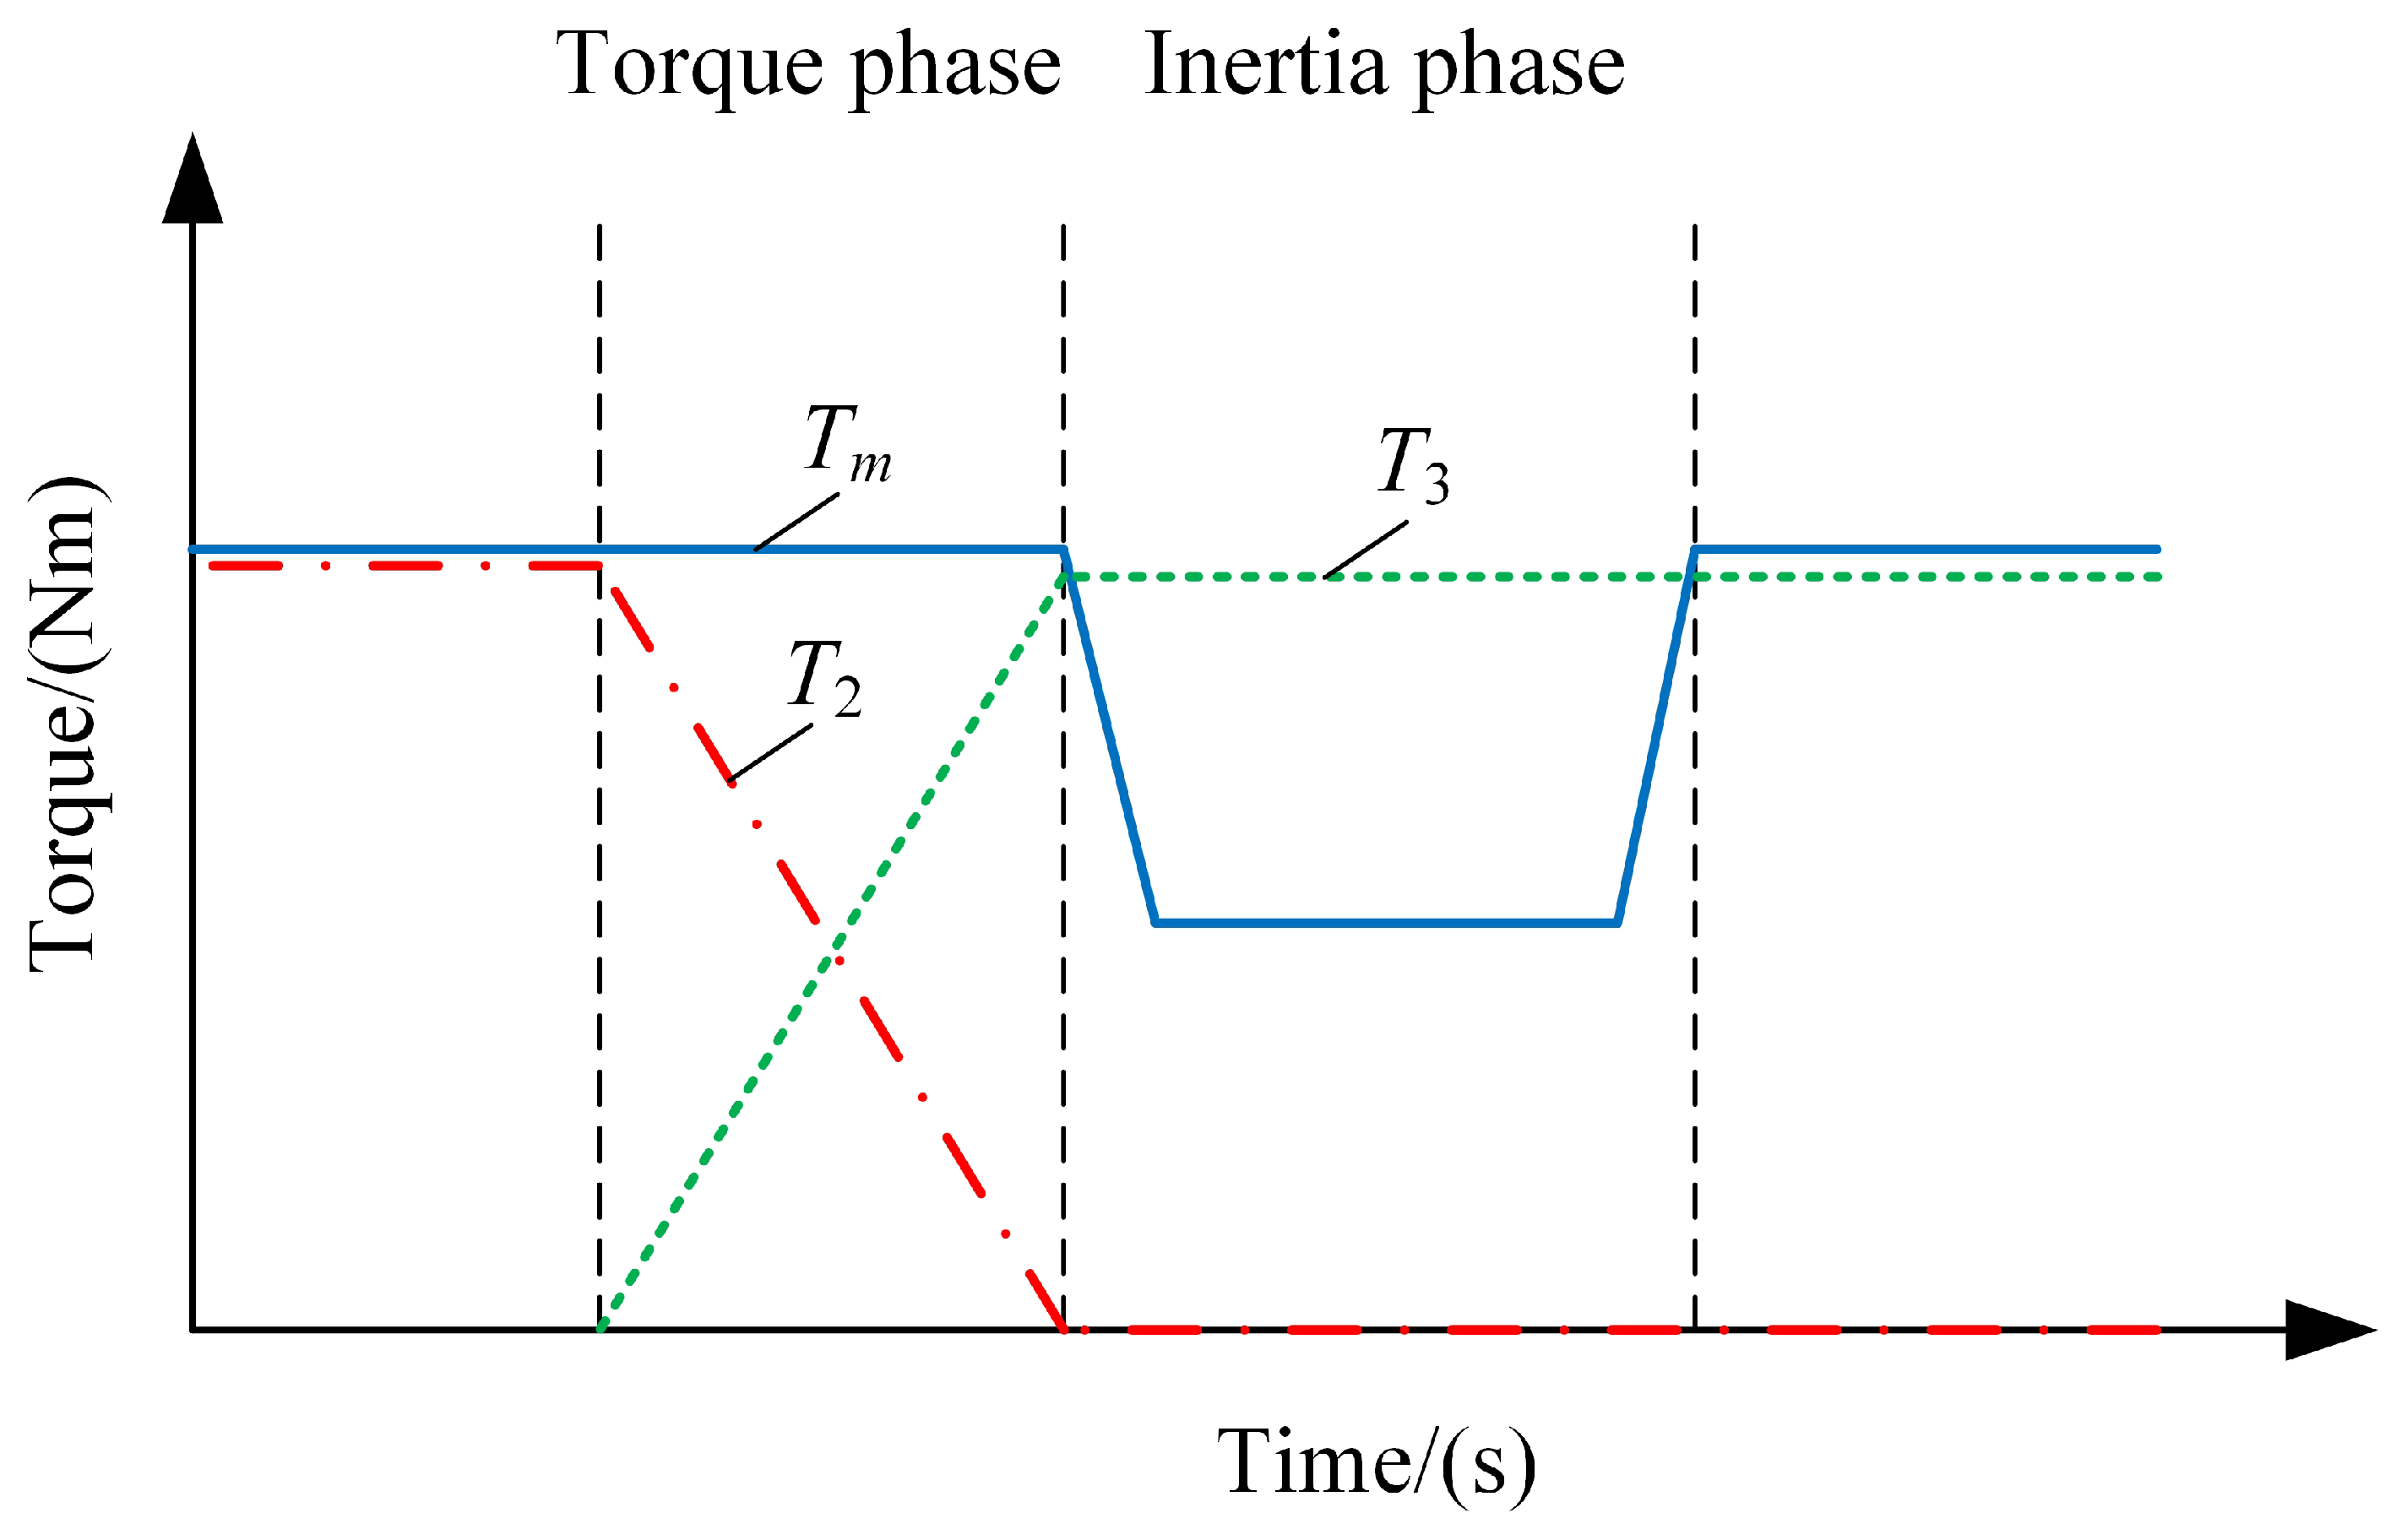
The process from the second gear to the third gear is divided into torque phase and inertia phase. In torque phase, the clutch torque gradually increases. When the synchronizer torque drops to zero, the second gear is disengaged. In the inertia phase, the speed difference between the driving plate and driven plate of the clutch is adjusted to engage the clutch. When the clutch is completely engaged, the third gear is engaged, and the upshift process is completed. The downshift process is similar to the upshift process, which will not be described in detail here.
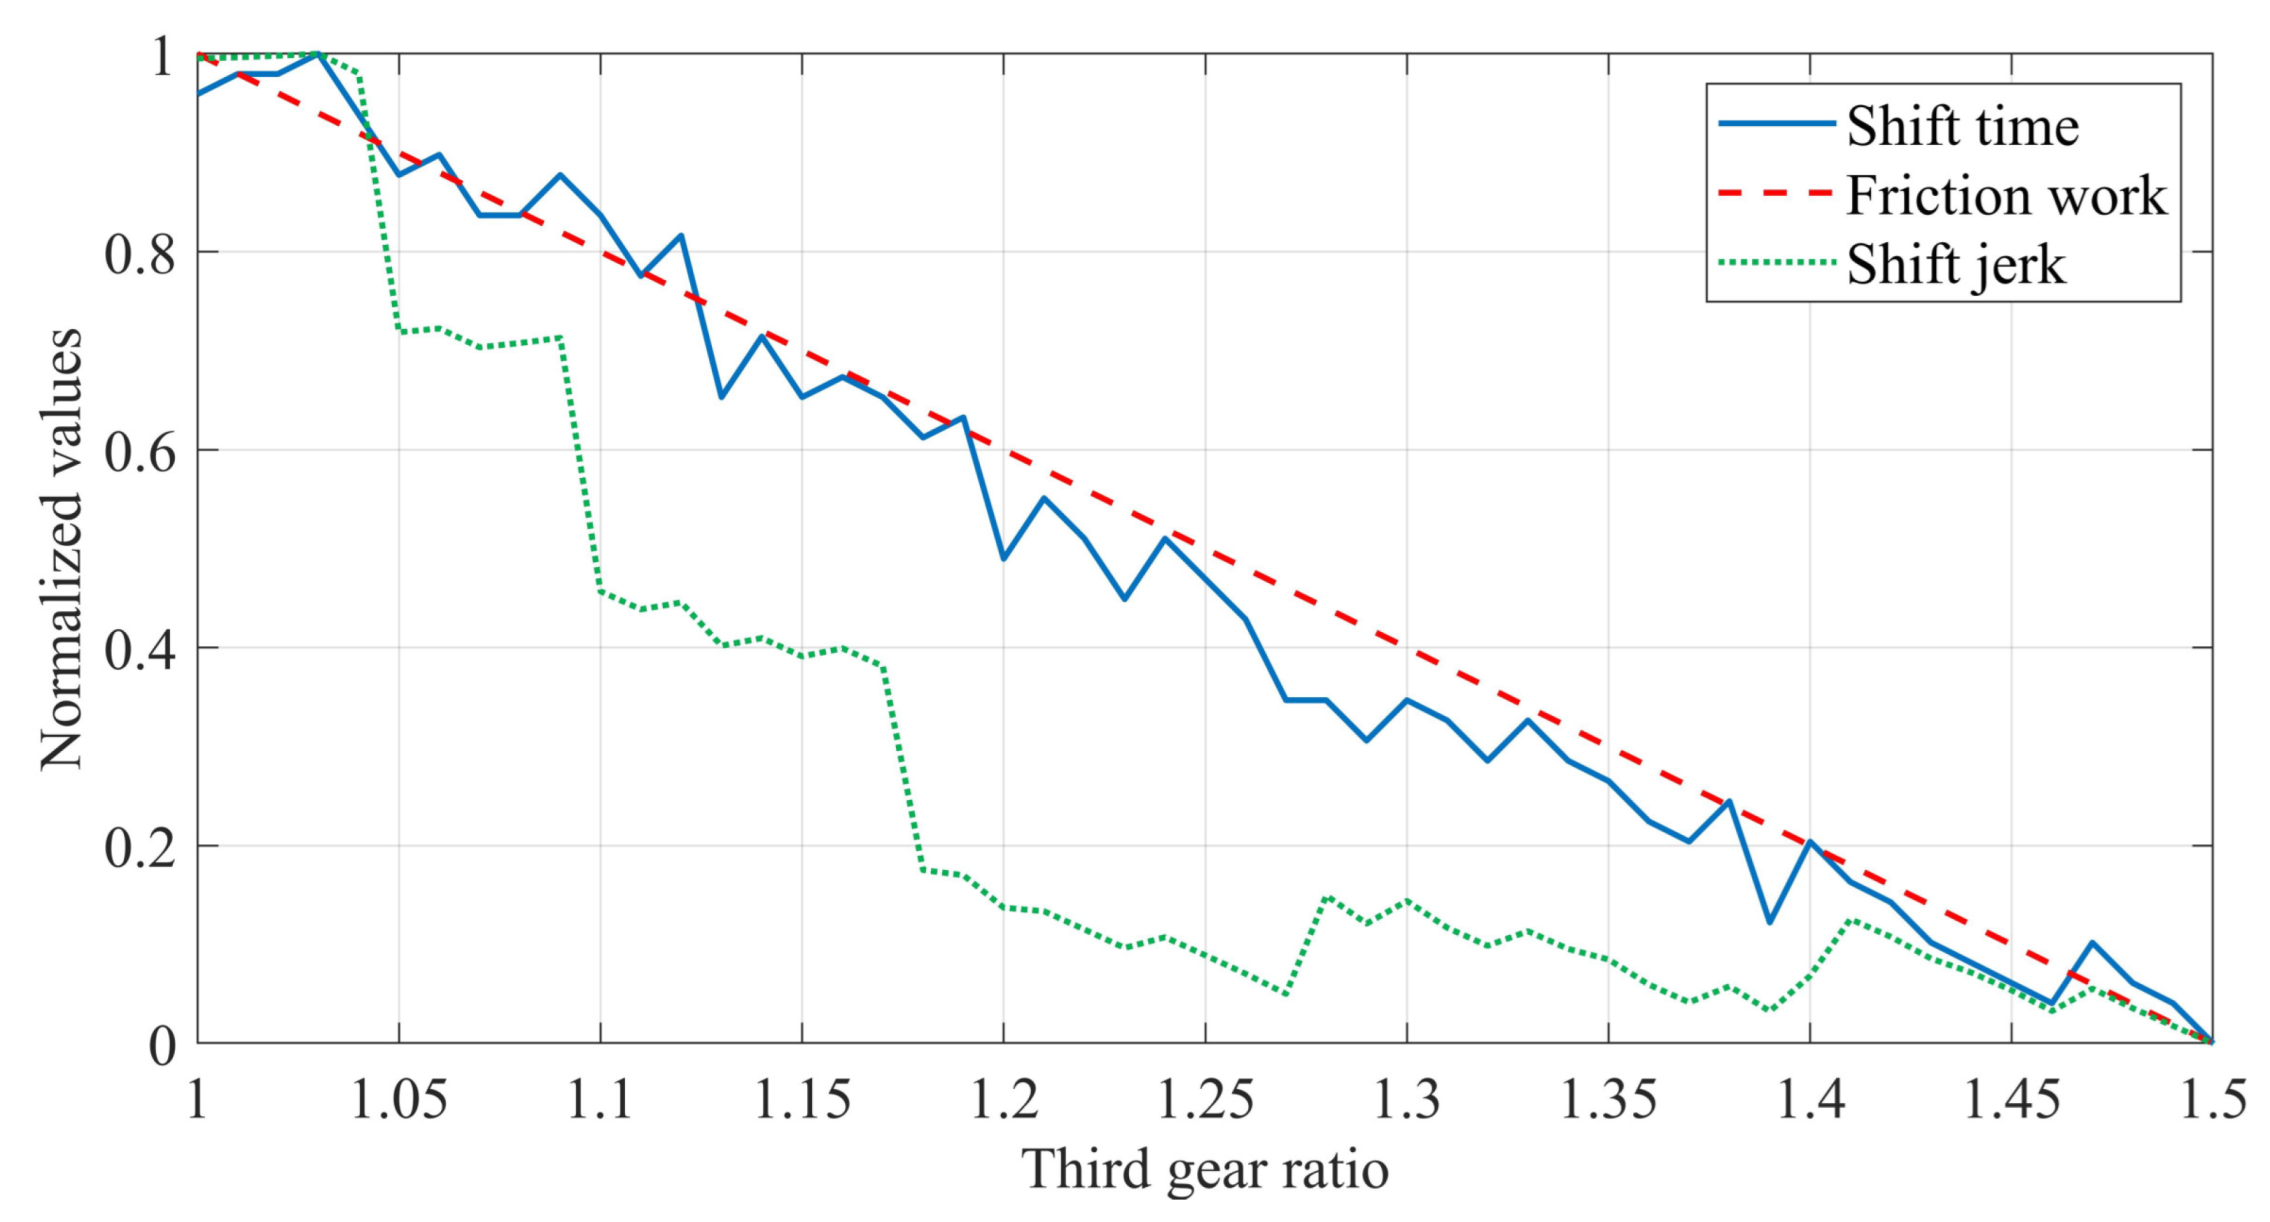
The third gear pair and assist clutch have two functions: on the one hand, torque assistance is carried out when the first gear rises to the second gear to make up for power interruption. The other is to realize the power transmission of the third gear. Due to the application of the assist clutch, the three-speed AMT can shift without power interruption. However, the defect of the transmission is that it depends on the assist clutch to a great extent during shifting, which makes the friction work of the clutch higher. At the same time, the shift process from the first gear to the second gear is complex, resulting in long shift time and large shift jerk. Reducing the shift time, friction work, and shift jerk can be achieved not only by selecting the appropriate shift control strategy, but also by reasonably configuring the gear ratio of each gear. In order to illustrate the influence of gear ratio on shift performance, the first and second gear ratios are fixed, and the shift performance under a different third gear ratio is shown in
Figure 4 (The first gear ratio is 2.426, the second gear ratio is 1.529 and the range of the selected third gear ratio is 1∼1.5).
The shift performance includes the total shift time, friction work, and shift jerk from the first gear to the second gear and from the second gear to the third gear. To facilitate observation together, the values of shift time, friction work, and shift jerk are normalized using the min-max standardization method. It can be seen from
Figure 4 that when the third gear ratio approaches the second gear ratio, the shift performance of the vehicle is better. This is because the smaller the difference between the two gears, the easier it is to shift from one to the other. However, we should not blindly demand better shift performance and continuously increase the third gear ratio. The third gear ratio also determines the maximum speed of the vehicle. With the increase of the third gear ratio, the maximum speed is lower. Hence, the gear ratio has an important influence on the shift performance, and it is necessary to consider the shift performance in the process of gear ratio optimization.
3. EV Model
In order to optimize the gear ratio of three-speed AMT, the EV simulation model needs to be established firstly. The EV model includes driver model, vehicle control unit (VCU) model, power battery model, electric motor model, transmission model, vehicle longitudinal dynamics model and transmission control unit (TCU) model. In this article, the vehicle parameters refer to a medium sized front drive EV, and the performance indexes are determined according to the Chinese national standard GB/T 28382. The parameters of power battery and electric motor were matched according to the vehicle parameters and performance indexes. The main parameters of the vehicle, power battery, electric motor, and transmission and performance indexes are shown in
Table 1. In MATLAB/Simulink simulation platform, the sub models are established as follows.
3.1. Driver Model
The driver model generates accelerating or braking commands according to the difference between the actual speed and the expected speed of the vehicle. Proportional-integral-differential (PID) control is adopted, and the driving command
is:
where:
,
and
are proportional, integral, and differential gain, respectively,
is the error between the actual vehicle speed and the expected vehicle speed:
where:
v is the actual vehicle speed,
is the expected vehicle speed. The range of drive command
is between −1 and 1. When
is greater than zero, the vehicle is in driving mode. When
is less than zero, the vehicle is in braking mode.
3.2. VCU Model
The VCU model generates the driving torque demand or braking torque demand according to the driving command . During braking, the electric motor can be used as a generator to charge the power battery. In order to improve energy efficiency, braking energy recovery is carried out in VCU model.
When the vehicle is in driving mode, the driving torque demand
is:
where:
is the maximum torque of the electric motor corresponding to the speed
.
When the vehicle is in braking mode, the braking torque demand
is:
where:
is the maximum braking torque.
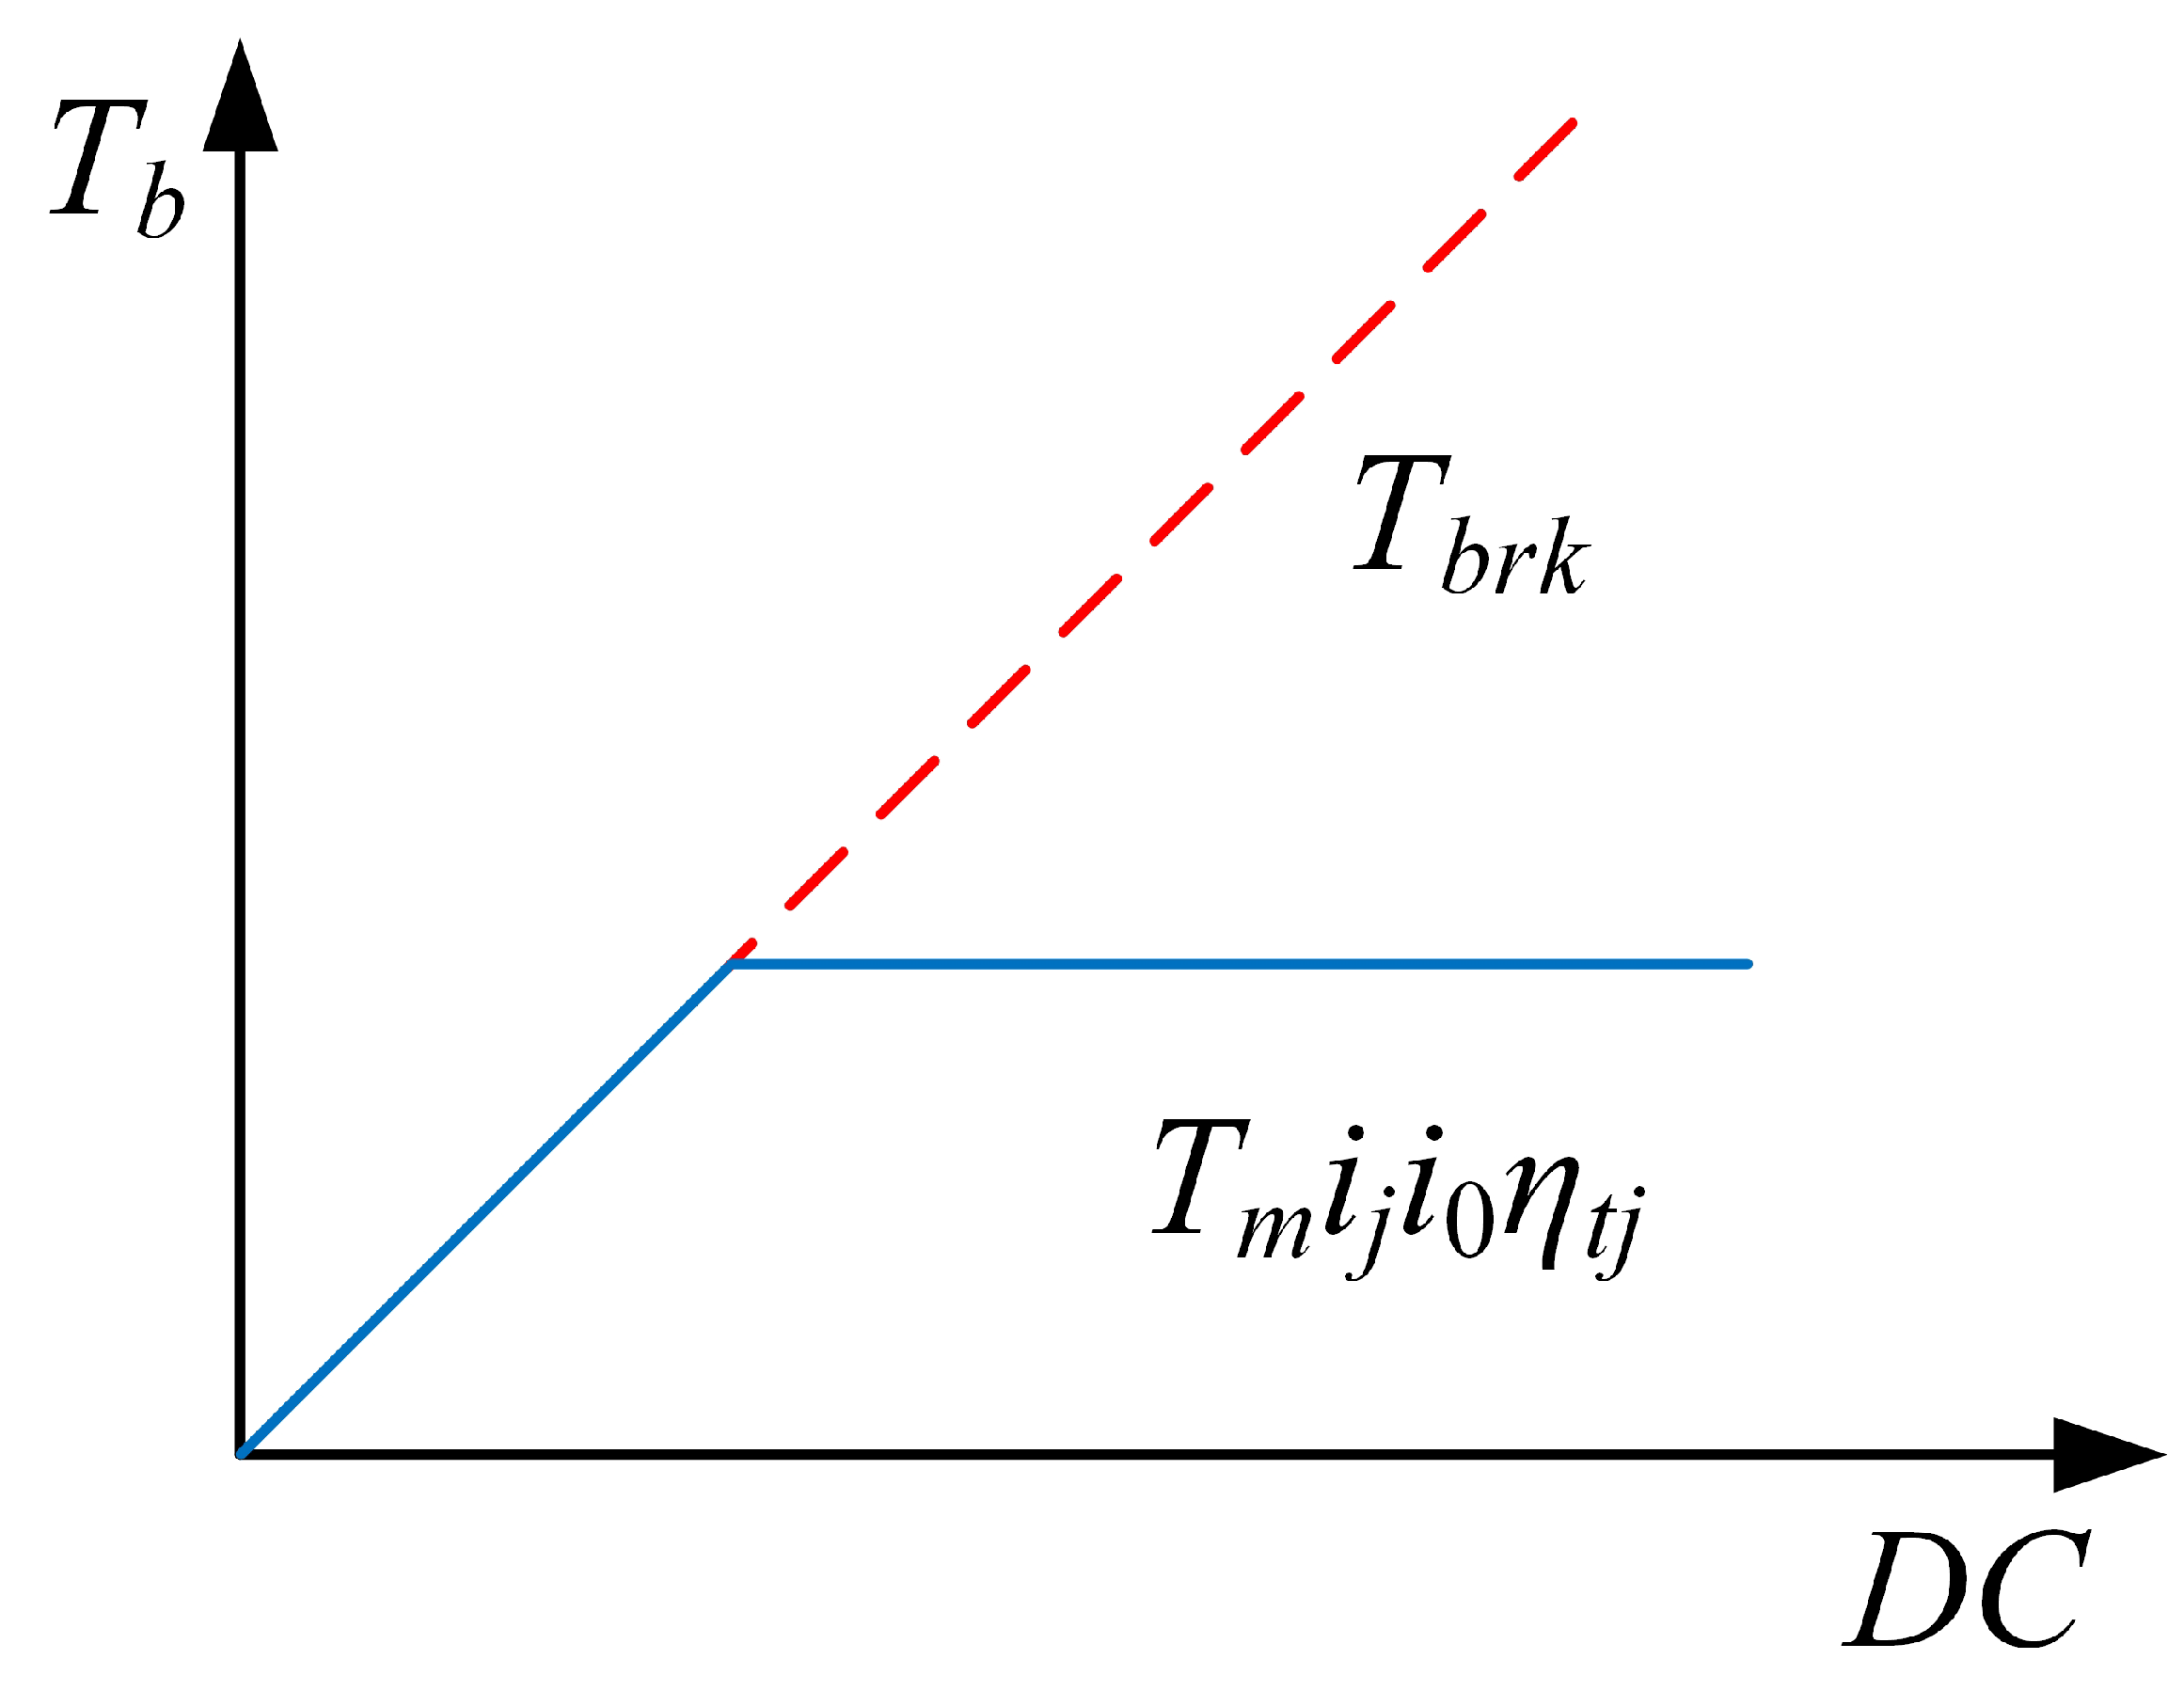
The source of braking torque includes two parts: the regenerative braking torque generated by electric motor and the mechanical braking torque generated by brake pedal. Hence, the braking torque can be written as follows:
where:
is the electric motor torque,
is the gear ratio of gear
j, subscript
j is the gear position,
j = 1, 2, 3.
is the main reducer ratio,
is the transmission efficiency of gear
j,
is the mechanical braking torque.
Braking torque distribution involves the economy, safety, and stability of vehicles. It is necessary to maximize the proportion of braking energy recovery on the premise of ensuring safety and stability. The series braking strategy is adopted in this paper, and the principle of braking torque distribution is shown in
Figure 5. When the braking torque demand is low, the braking torque is all provided by the regenerative braking torque of the electric motor. When the braking torque demand exceeds the maximum regenerative braking torque, the excess part adopts the mechanical braking. The mechanical braking
can be written as follows:
where:
is the minimum torque of the electric motor corresponding to the speed
.
3.3. Power Battery Model
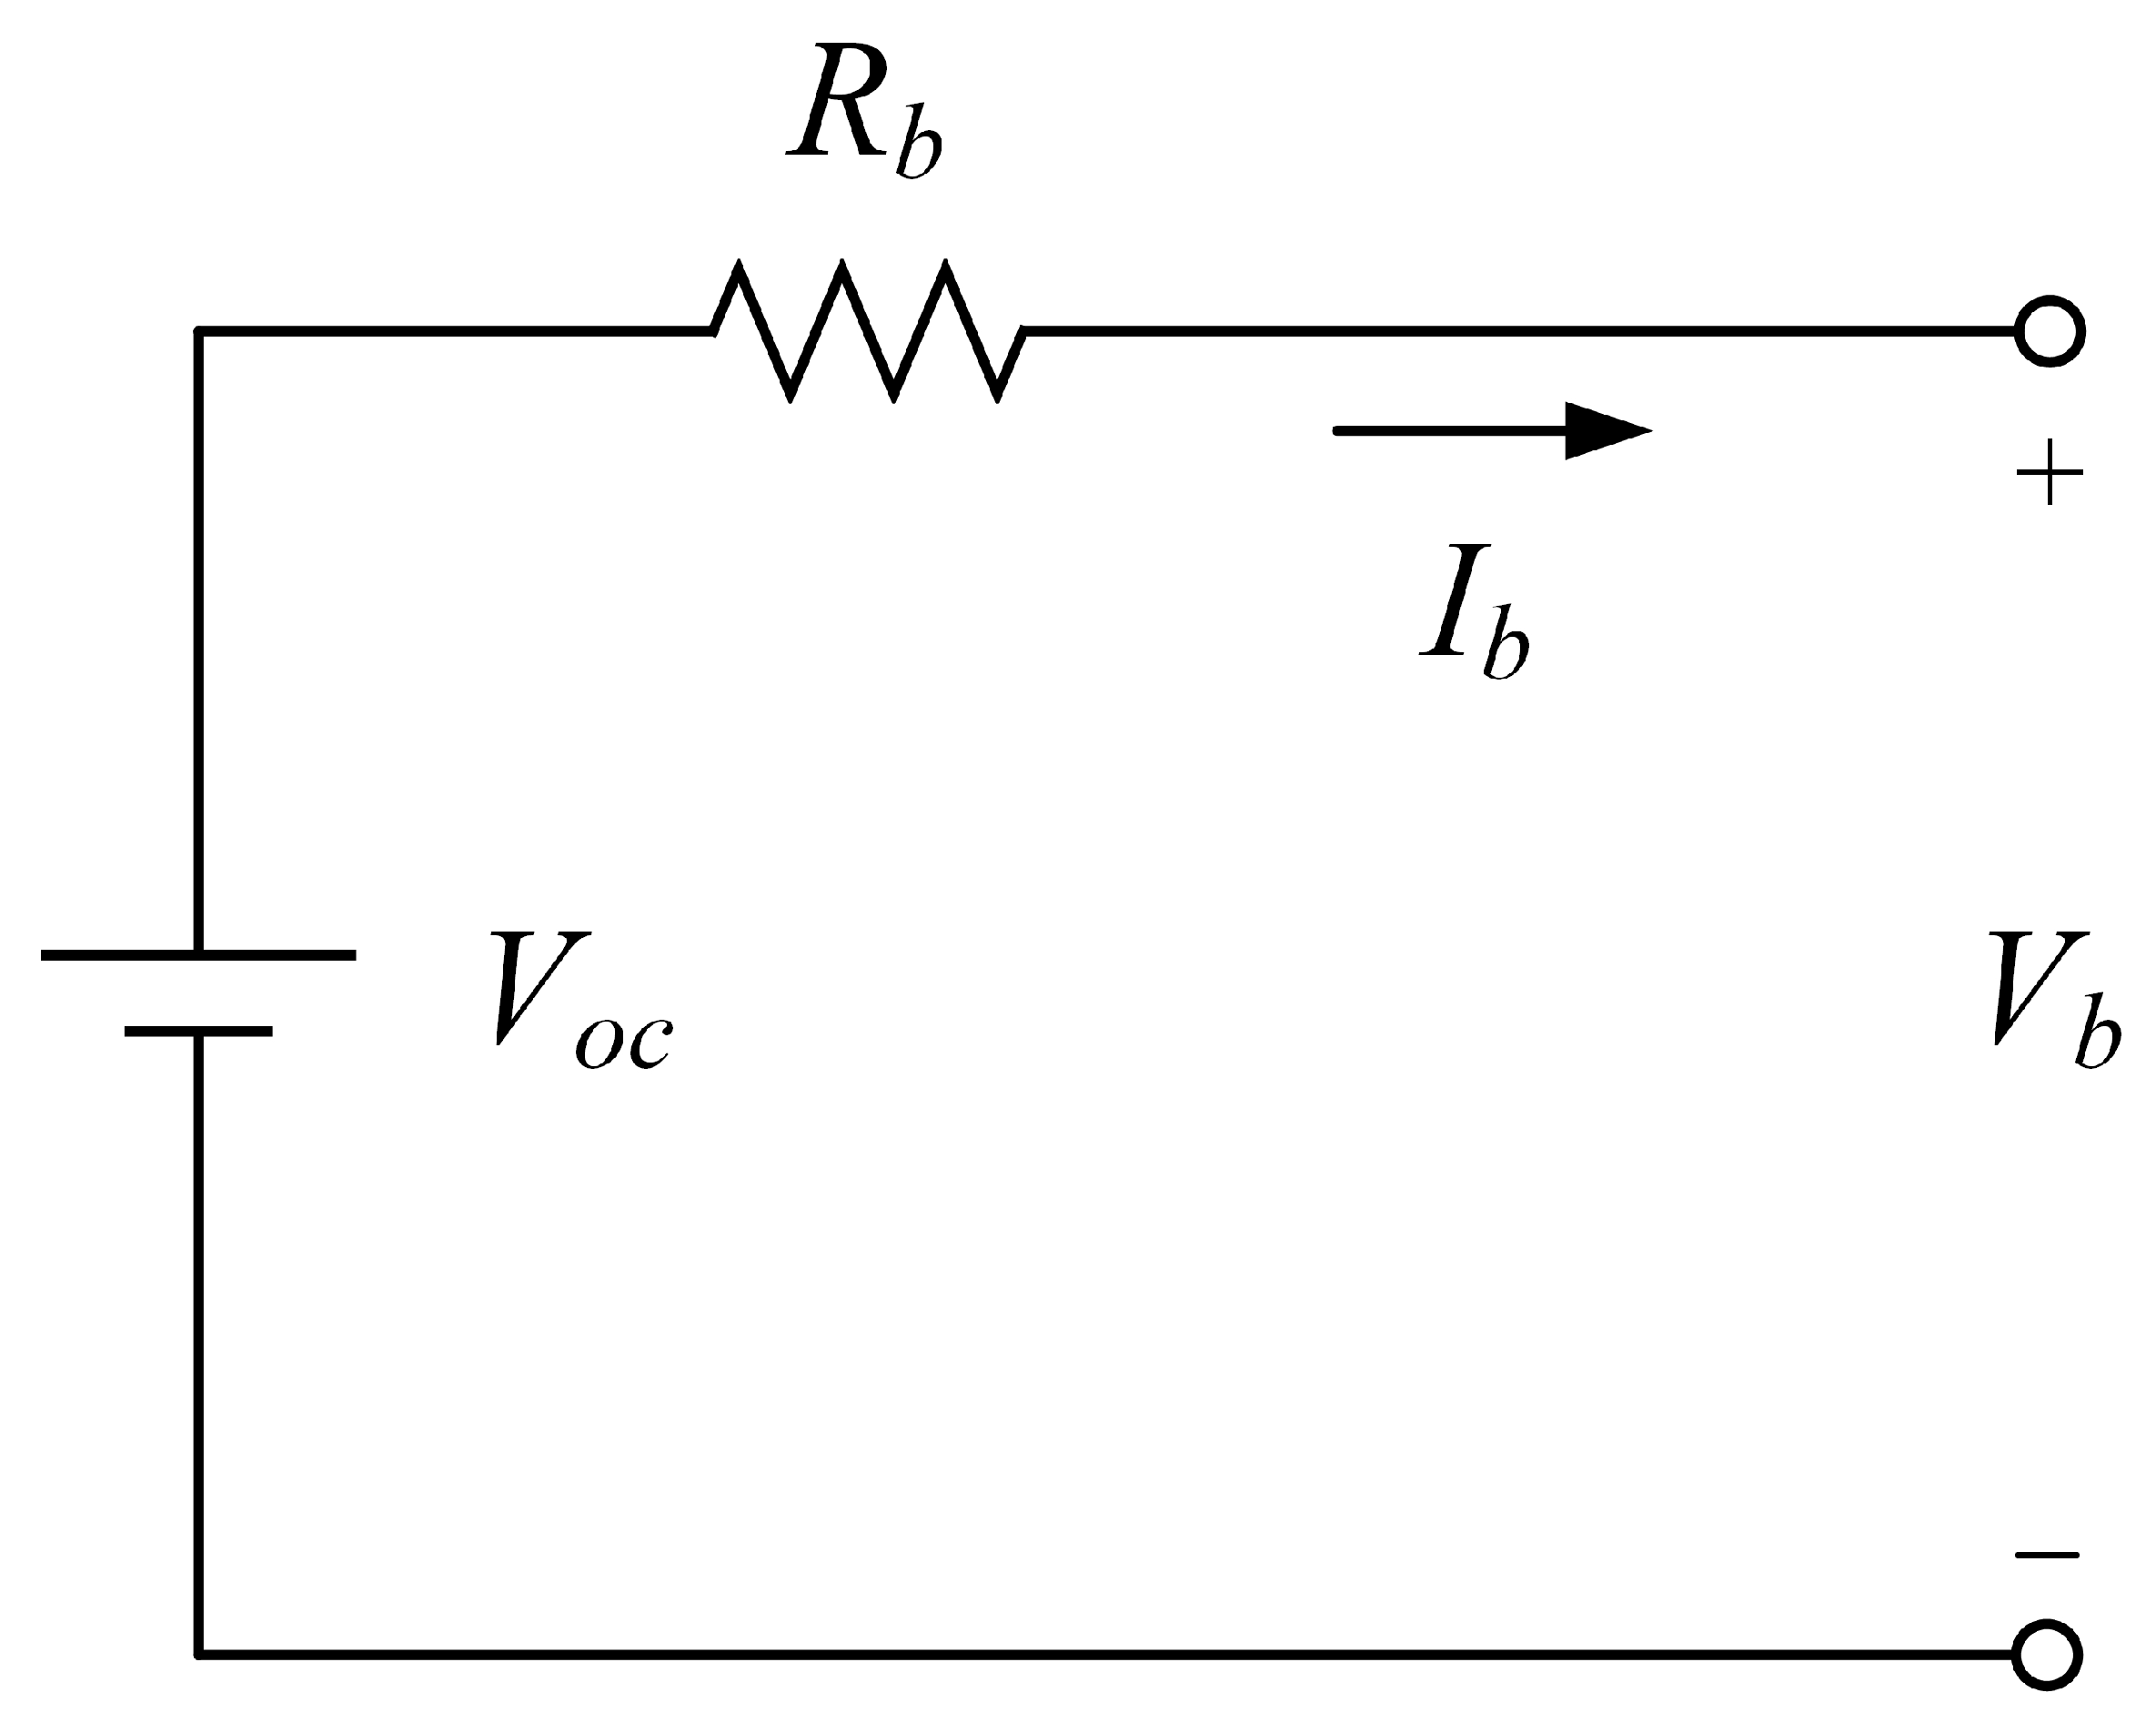
The simplified internal resistance model is adopted in the power battery model, which ignores the influence of temperature and service life. The equivalent circuit of the power battery is shown in
Figure 6. The output voltage
is:
where:
is the open circuit voltage,
is the equivalent internal resistance,
is the current.
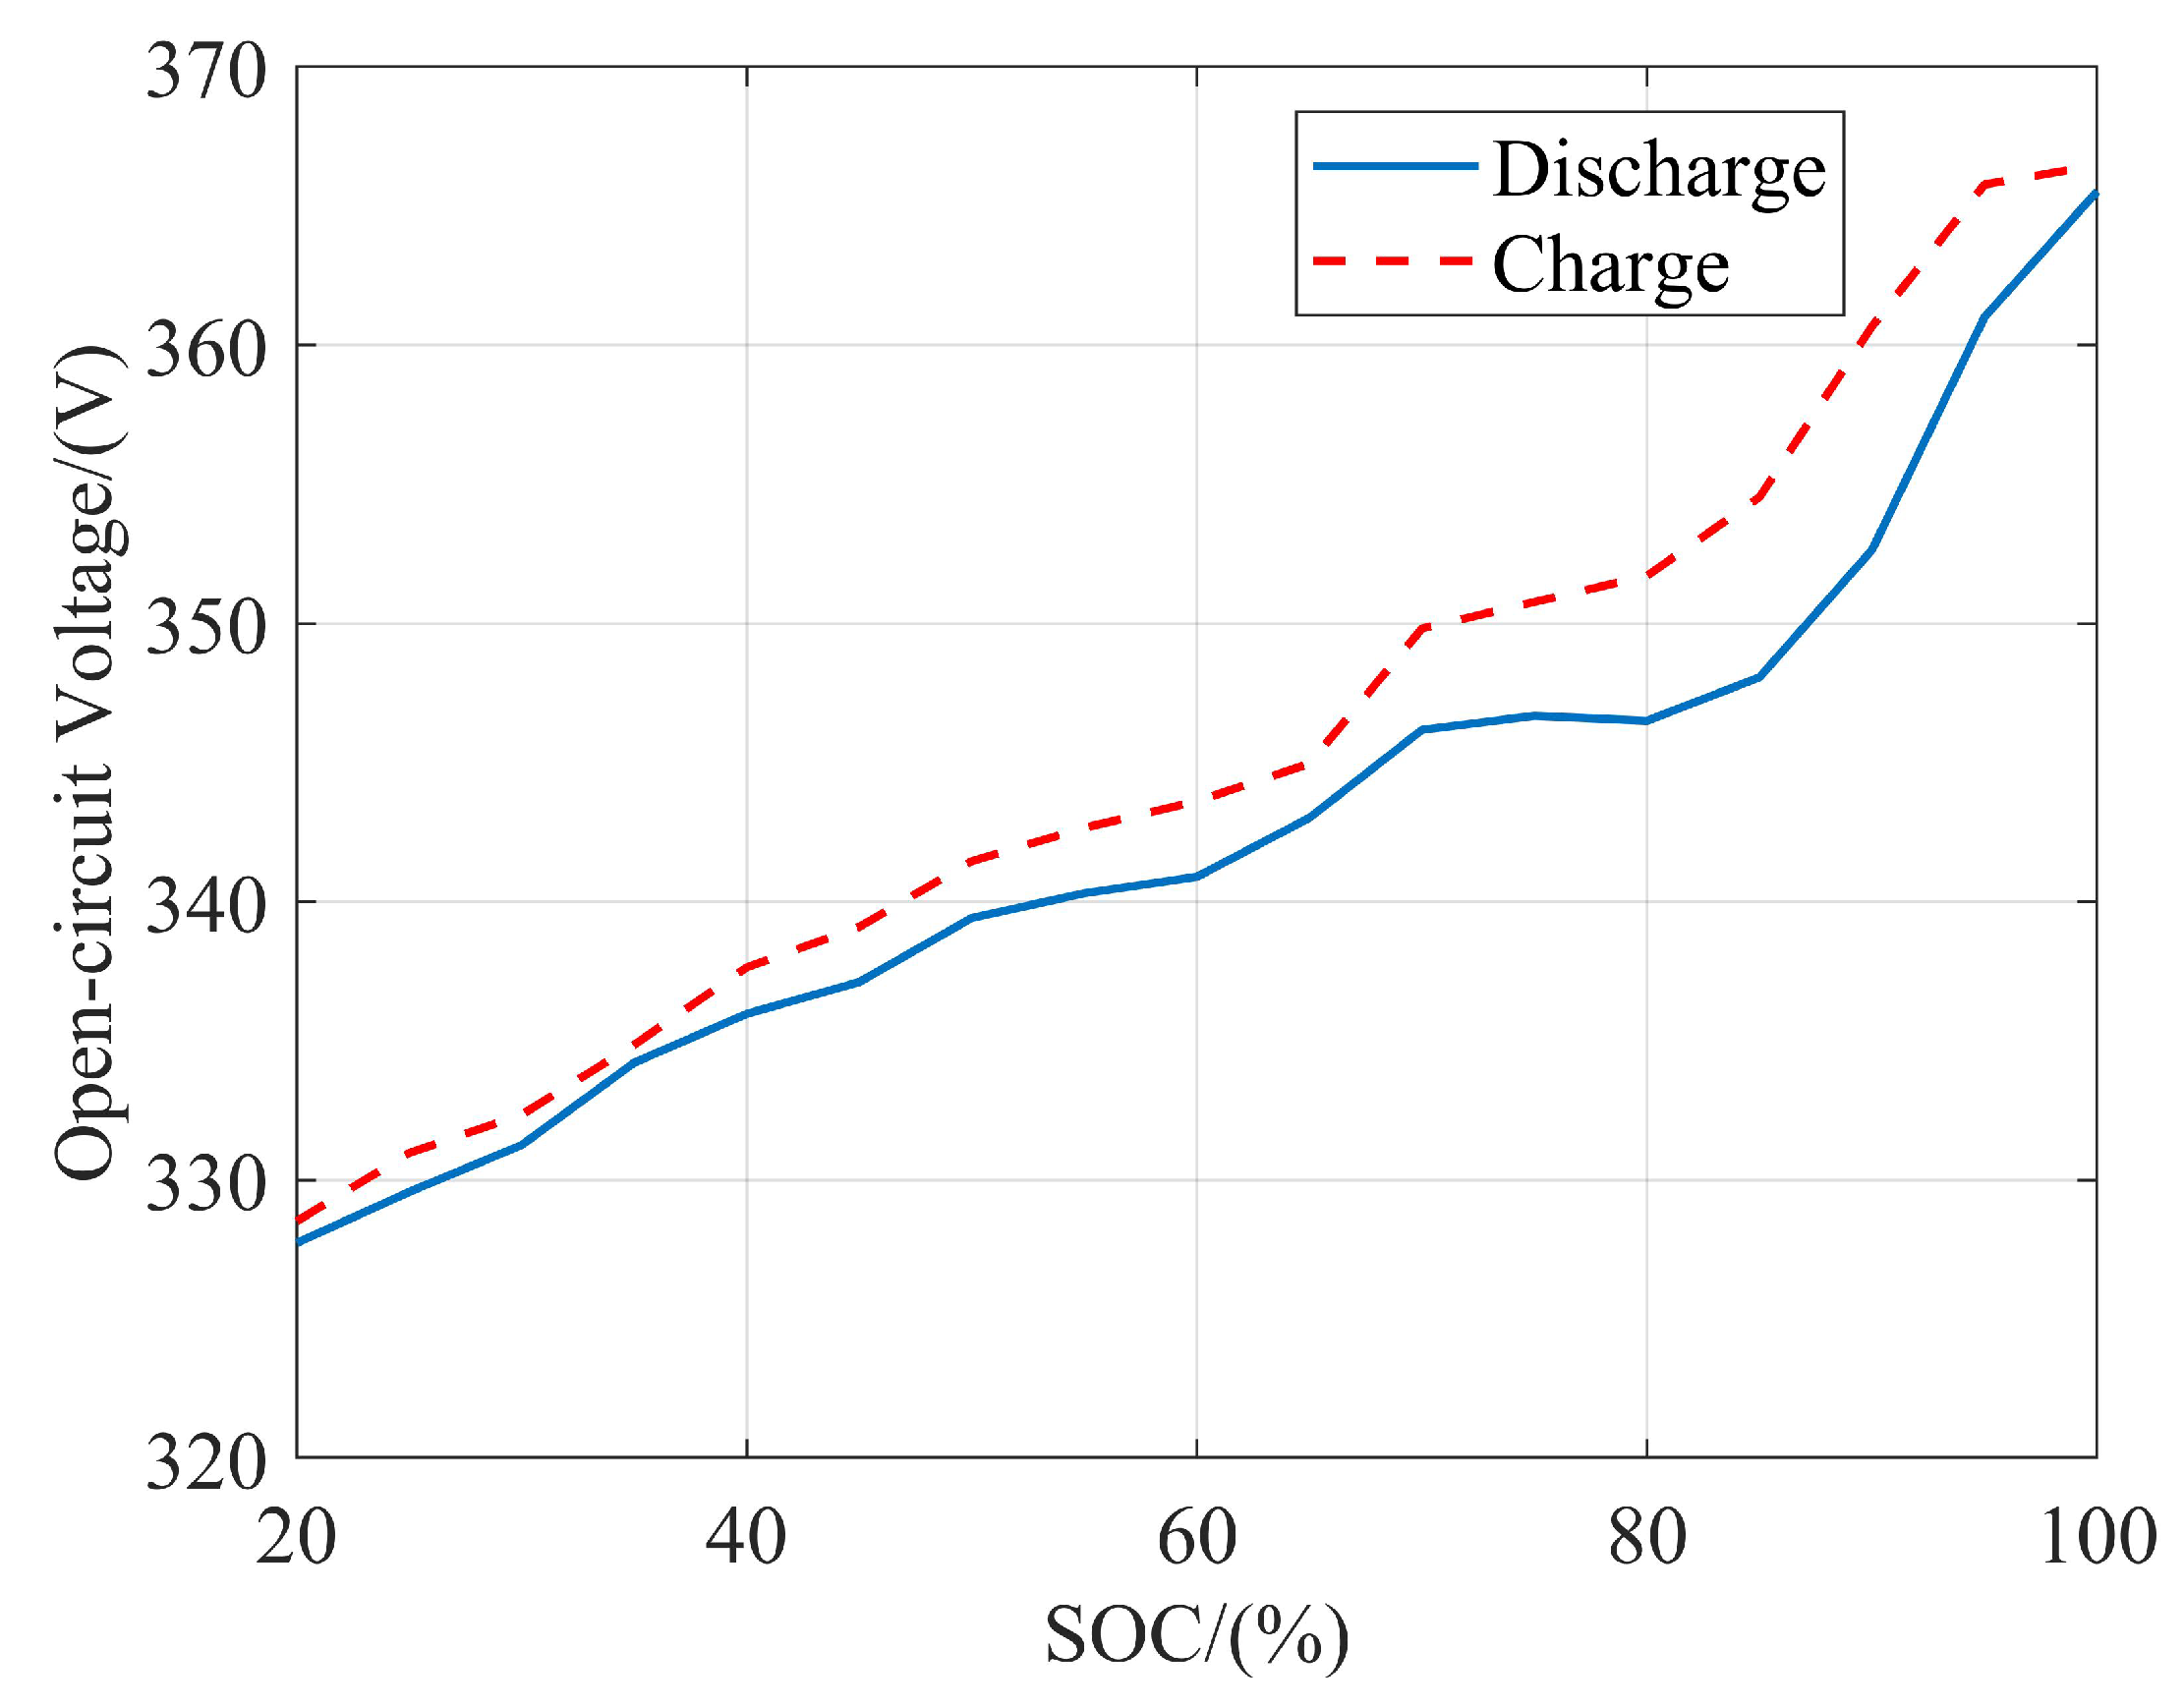
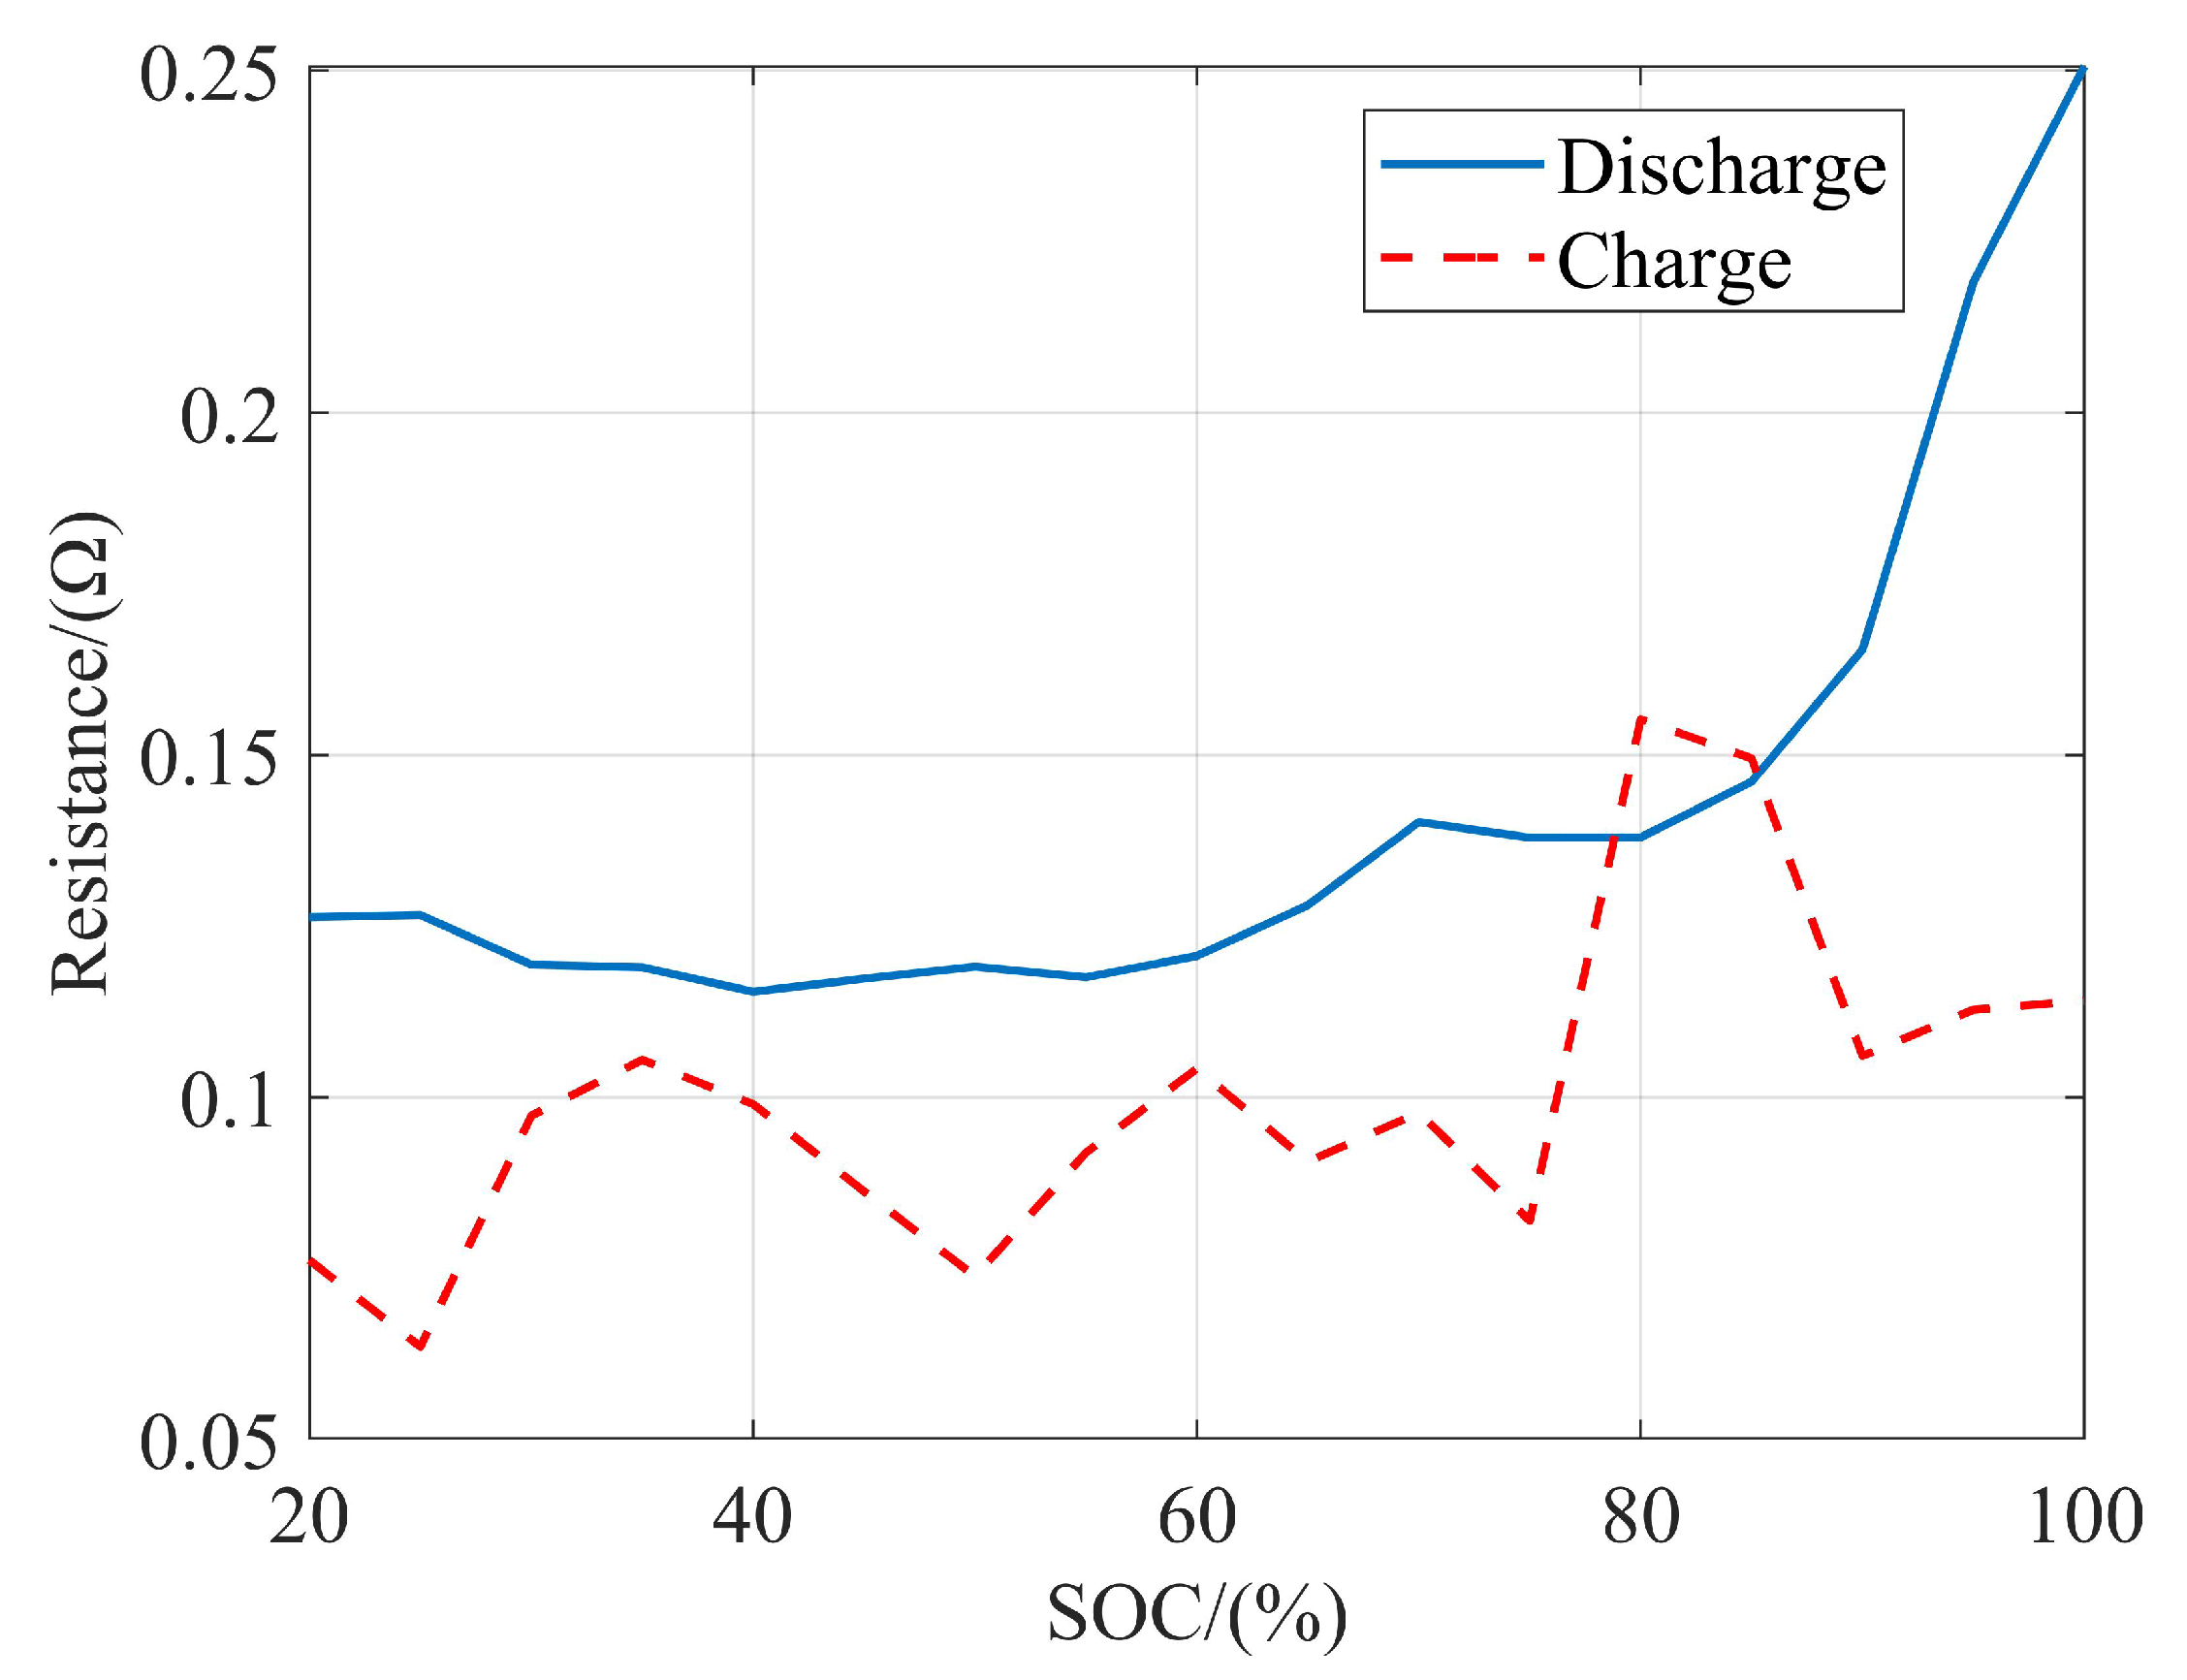
When the battery is charged or discharged, the open circuit voltage and equivalent internal resistance have a mapping relationship with the state of charge (SOC), as shown in the
Figure 7 and
Figure 8. The battery currents in the two states are:
where:
is the discharge power of power battery,
is the charge power of power battery.
The initial SOC of the battery is determined to be 90%, and the energy consumption
is:
where:
is the rated capacity.
3.4. Electric Motor and Transmission Model
When the electric motor works in motor mode, the driving torque is generated according to the driving torque demand and transmitted to the transmission model. When the electric motor operates in generator mode, the braking energy is recovered and stored in the power battery.
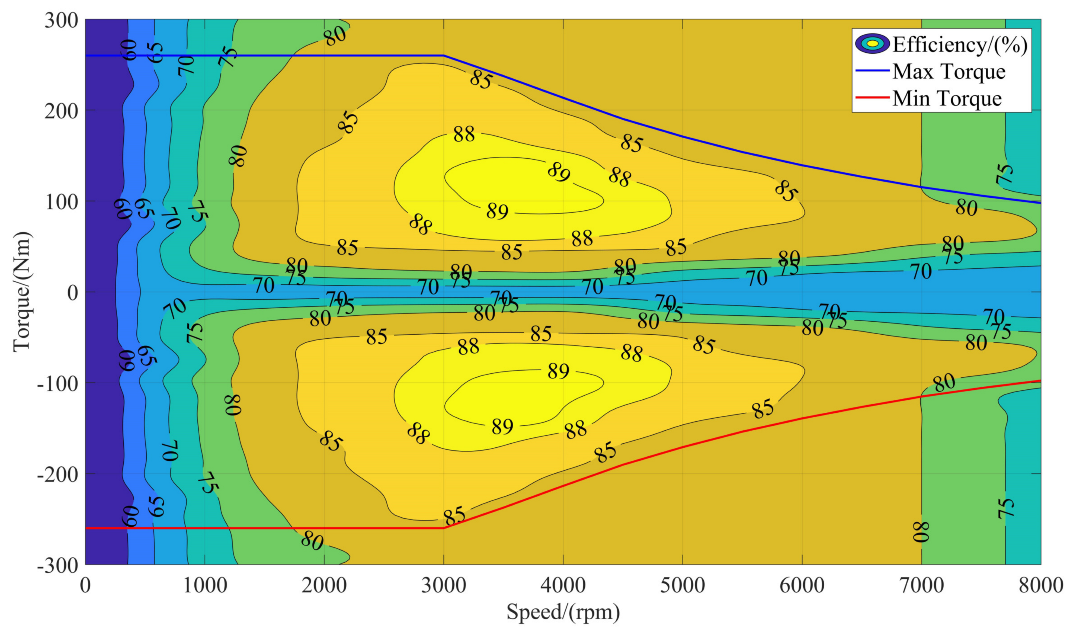
The output power of electric motor in motor mode
is:
where:
is the electric motor efficiency. The electric motor selected in this article is an AC asynchronous motor, and the electric motor efficiency is shown in
Figure 9.
The generating power of the electric motor in generator mode
is:
The transmission model adopts a simplified three-speed transmission model, and the transmission torque
is:
3.5. Vehicle Longitudinal Dynamics Model
The vehicle longitudinal dynamics model calculates the driving resistance and acceleration. The driving resistance includes rolling resistance
, slope resistance
, and air resistance
. The calculation formulas are as follows:
where:
m is the vehicle mass, which includes the power battery weight.
g is the acceleration of gravity,
is the rolling resistance coefficient,
is the road slope,
is the air density,
is the air resistance coefficient,
A is the vehicle frontal area.
When the vehicle is in driving mode, the longitudinal dynamic equilibrium equation is:
where:
a is the vehicle longitudinal acceleration,
r is the dynamic radius of the wheel,
is the rotating mass conversion coefficient of gear
j:
where:
is the moment of inertia of wheel,
is the moment of inertia of the flywheel.
When the vehicle is in braking mode, the longitudinal dynamic equilibrium equation is:
3.6. TCU Model
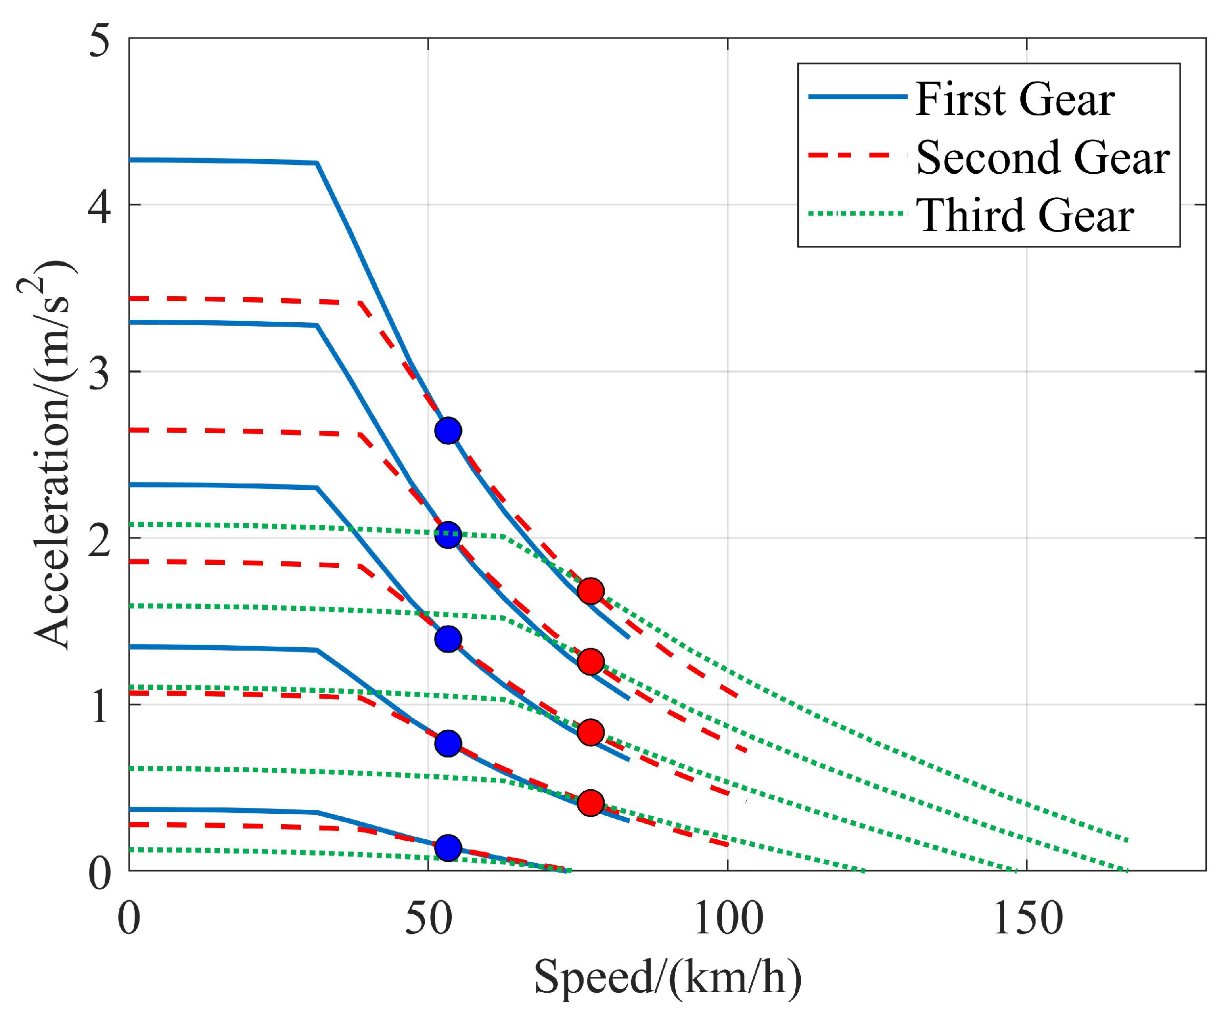
A TCU model is used to make the shift decision. The shift strategy is divided into a dynamic shift strategy and an economic shift strategy. The dynamic shift strategy selects the gear with high acceleration to ensure that the vehicle has stronger dynamic performance. The economic shift strategy selects the gear with high electric motor efficiency to ensure low energy consumption.
The dynamic shift strategy selects the intersection of the acceleration curves of the adjacent gear as the best shift point under the same accelerator pedal opening. The vehicle acceleration
a is:
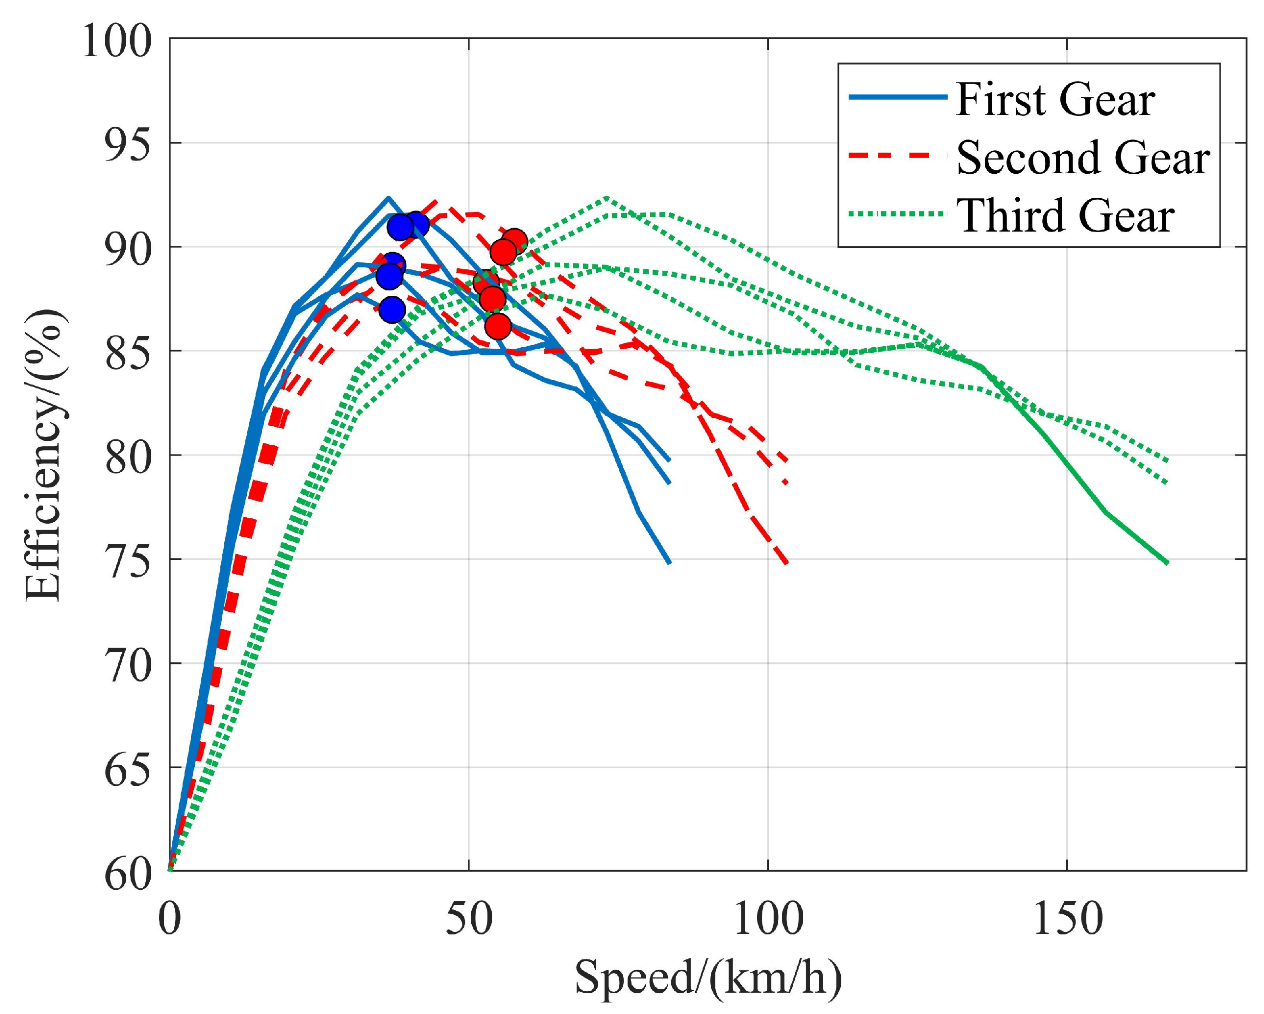
The economic shift strategy selects the intersection of the electric motor efficiency of adjacent gears as the best shift point under the same accelerator pedal opening. The electric motor efficiency
can be expressed as a function of torque and speed:
The dynamic shift points and economic shift points can be calculated according to the above two formulas. For example, under a set of gear ratios, the dynamic and economic shift strategy map are plotted as shown in
Figure 10 and
Figure 11.
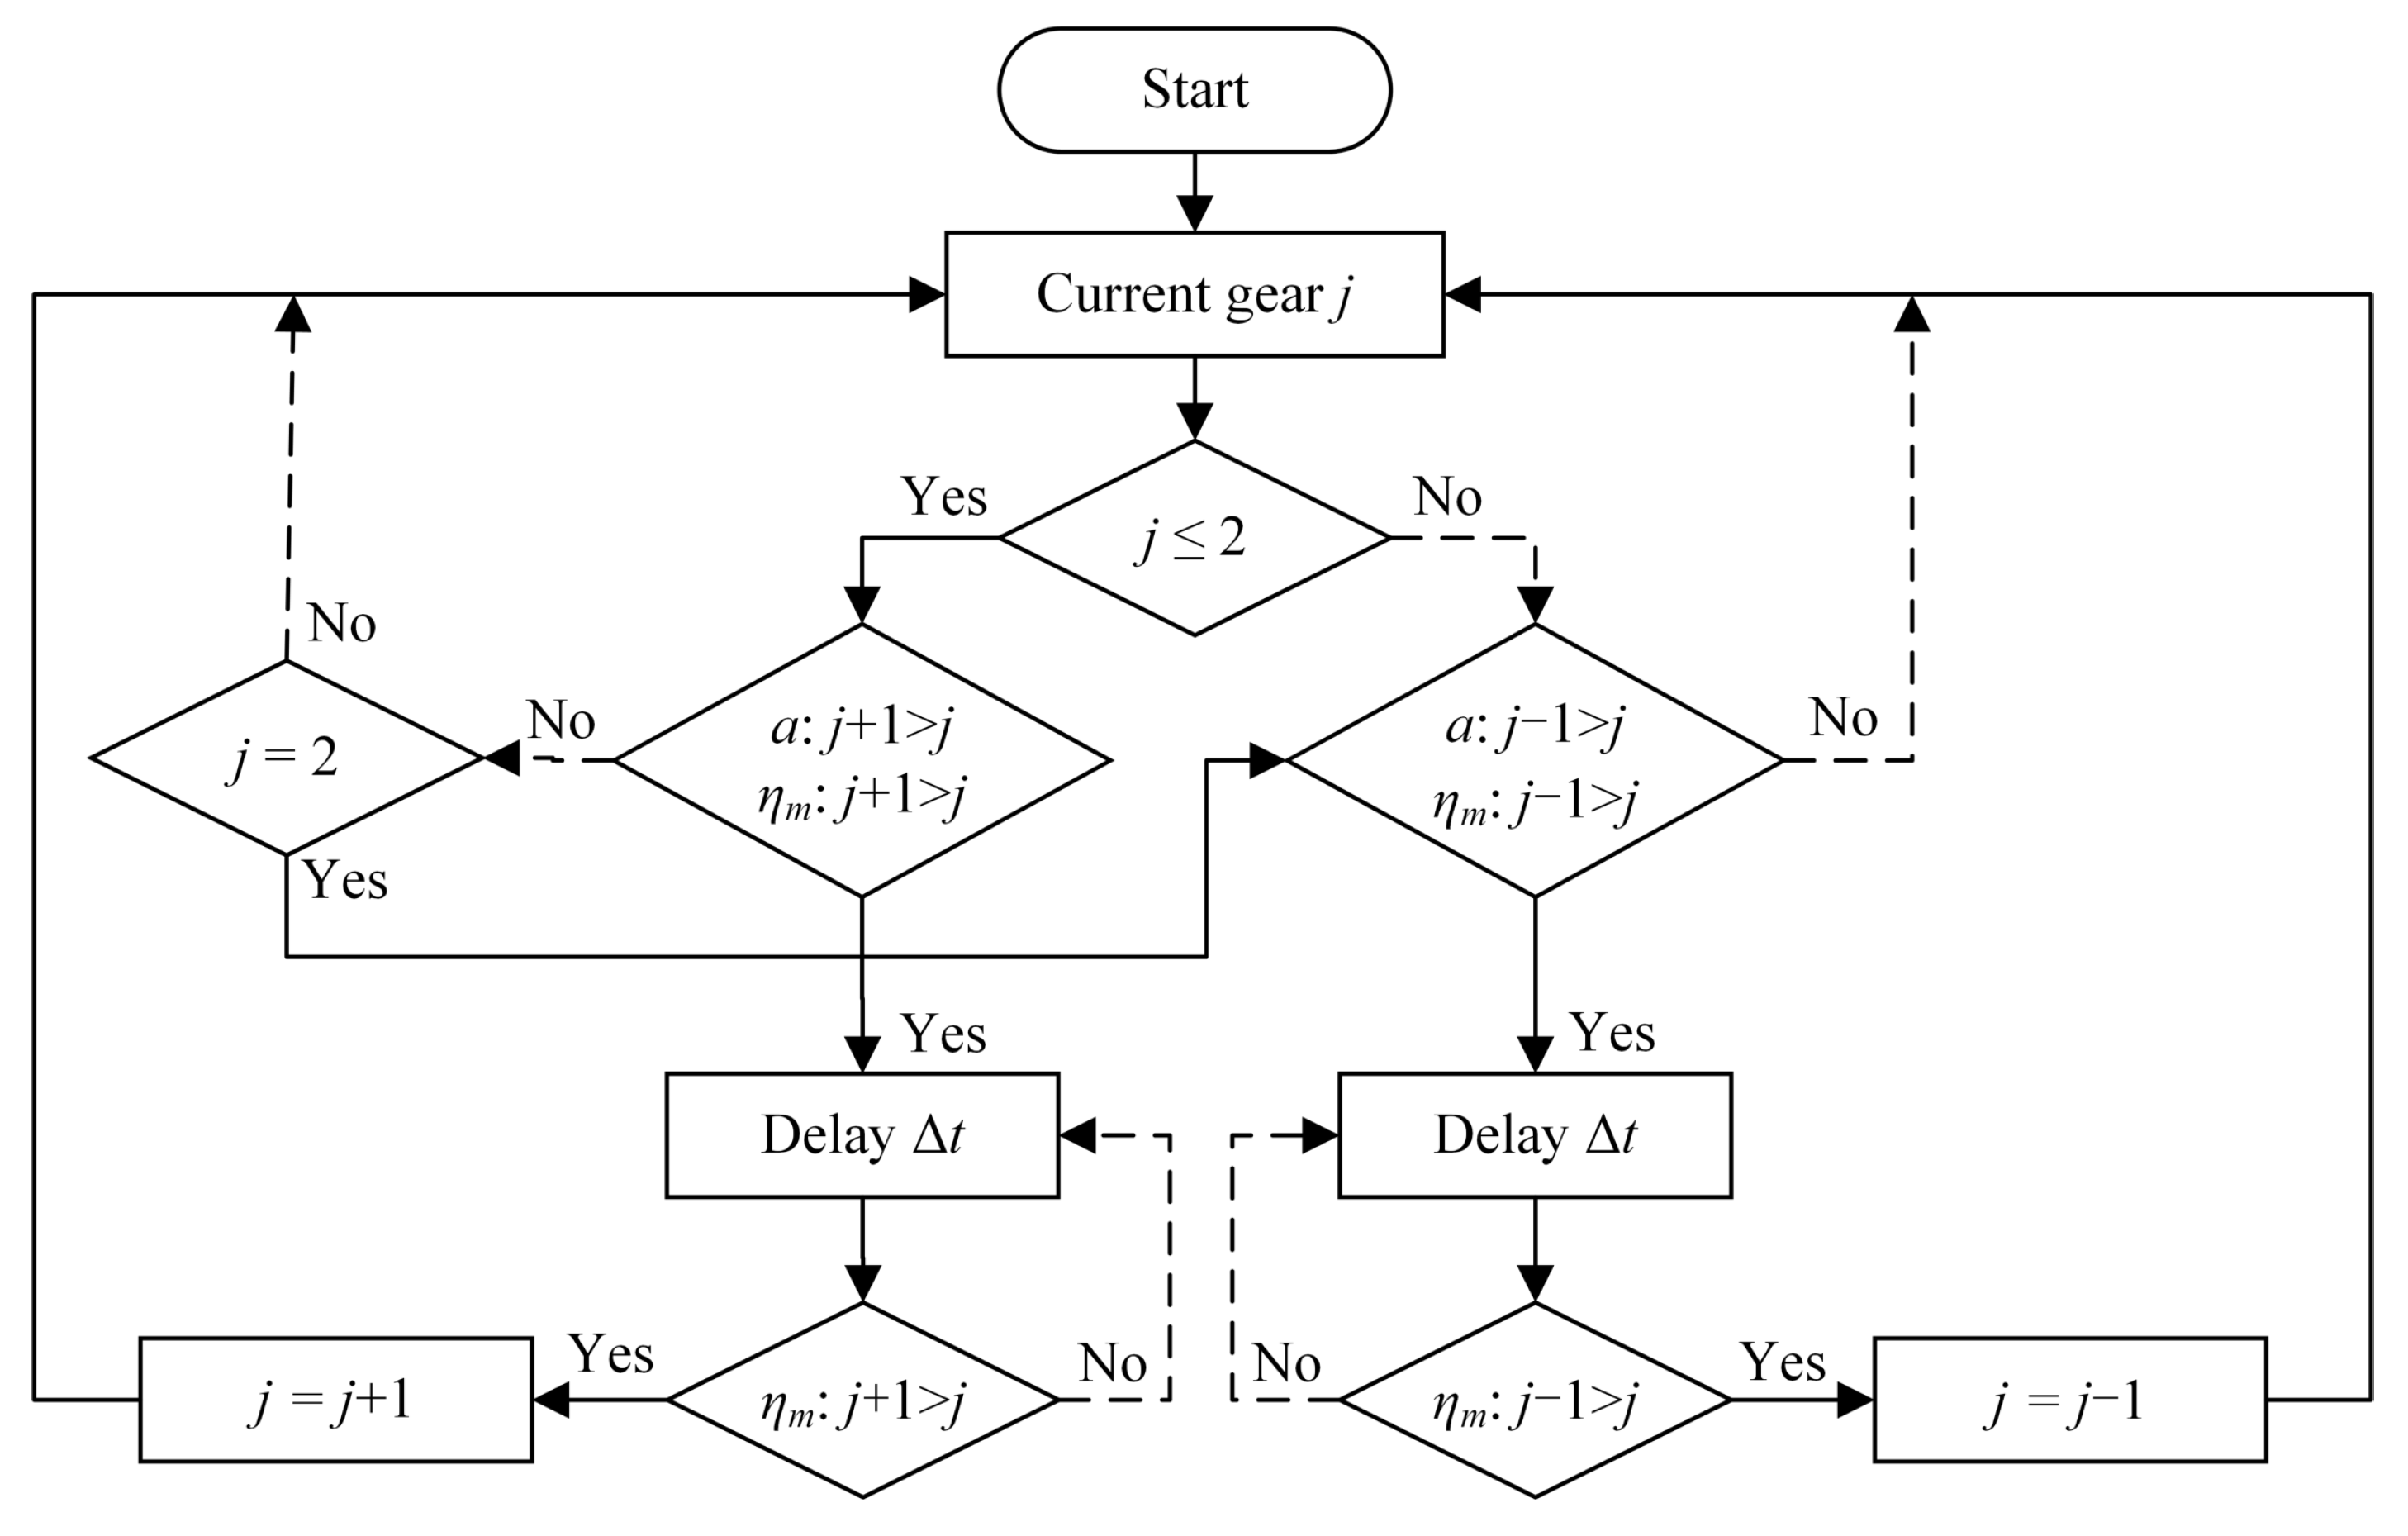
In order to take into account the power and economy of the vehicle, the dynamic and economic shift schedule is adopted in the driving cycle simulation [
34]. The strategy is shown in
Figure 12.
If the current gear or 2, compare the acceleration and electric motor efficiency of gear j and gear . If the acceleration and efficiency of gear are greater than that of gear j, and after seconds, the efficiency is still large, it will shift to gear . If the current gear , keep the first gear. If the current gear , further judge whether it needs to downshift. Similarly, if the current gear , and the acceleration and efficiency of the second gear are greater than that of the third gear, and after seconds, the efficiency is still large, it will shift to the second gear. Otherwise, it will remain in third gear.
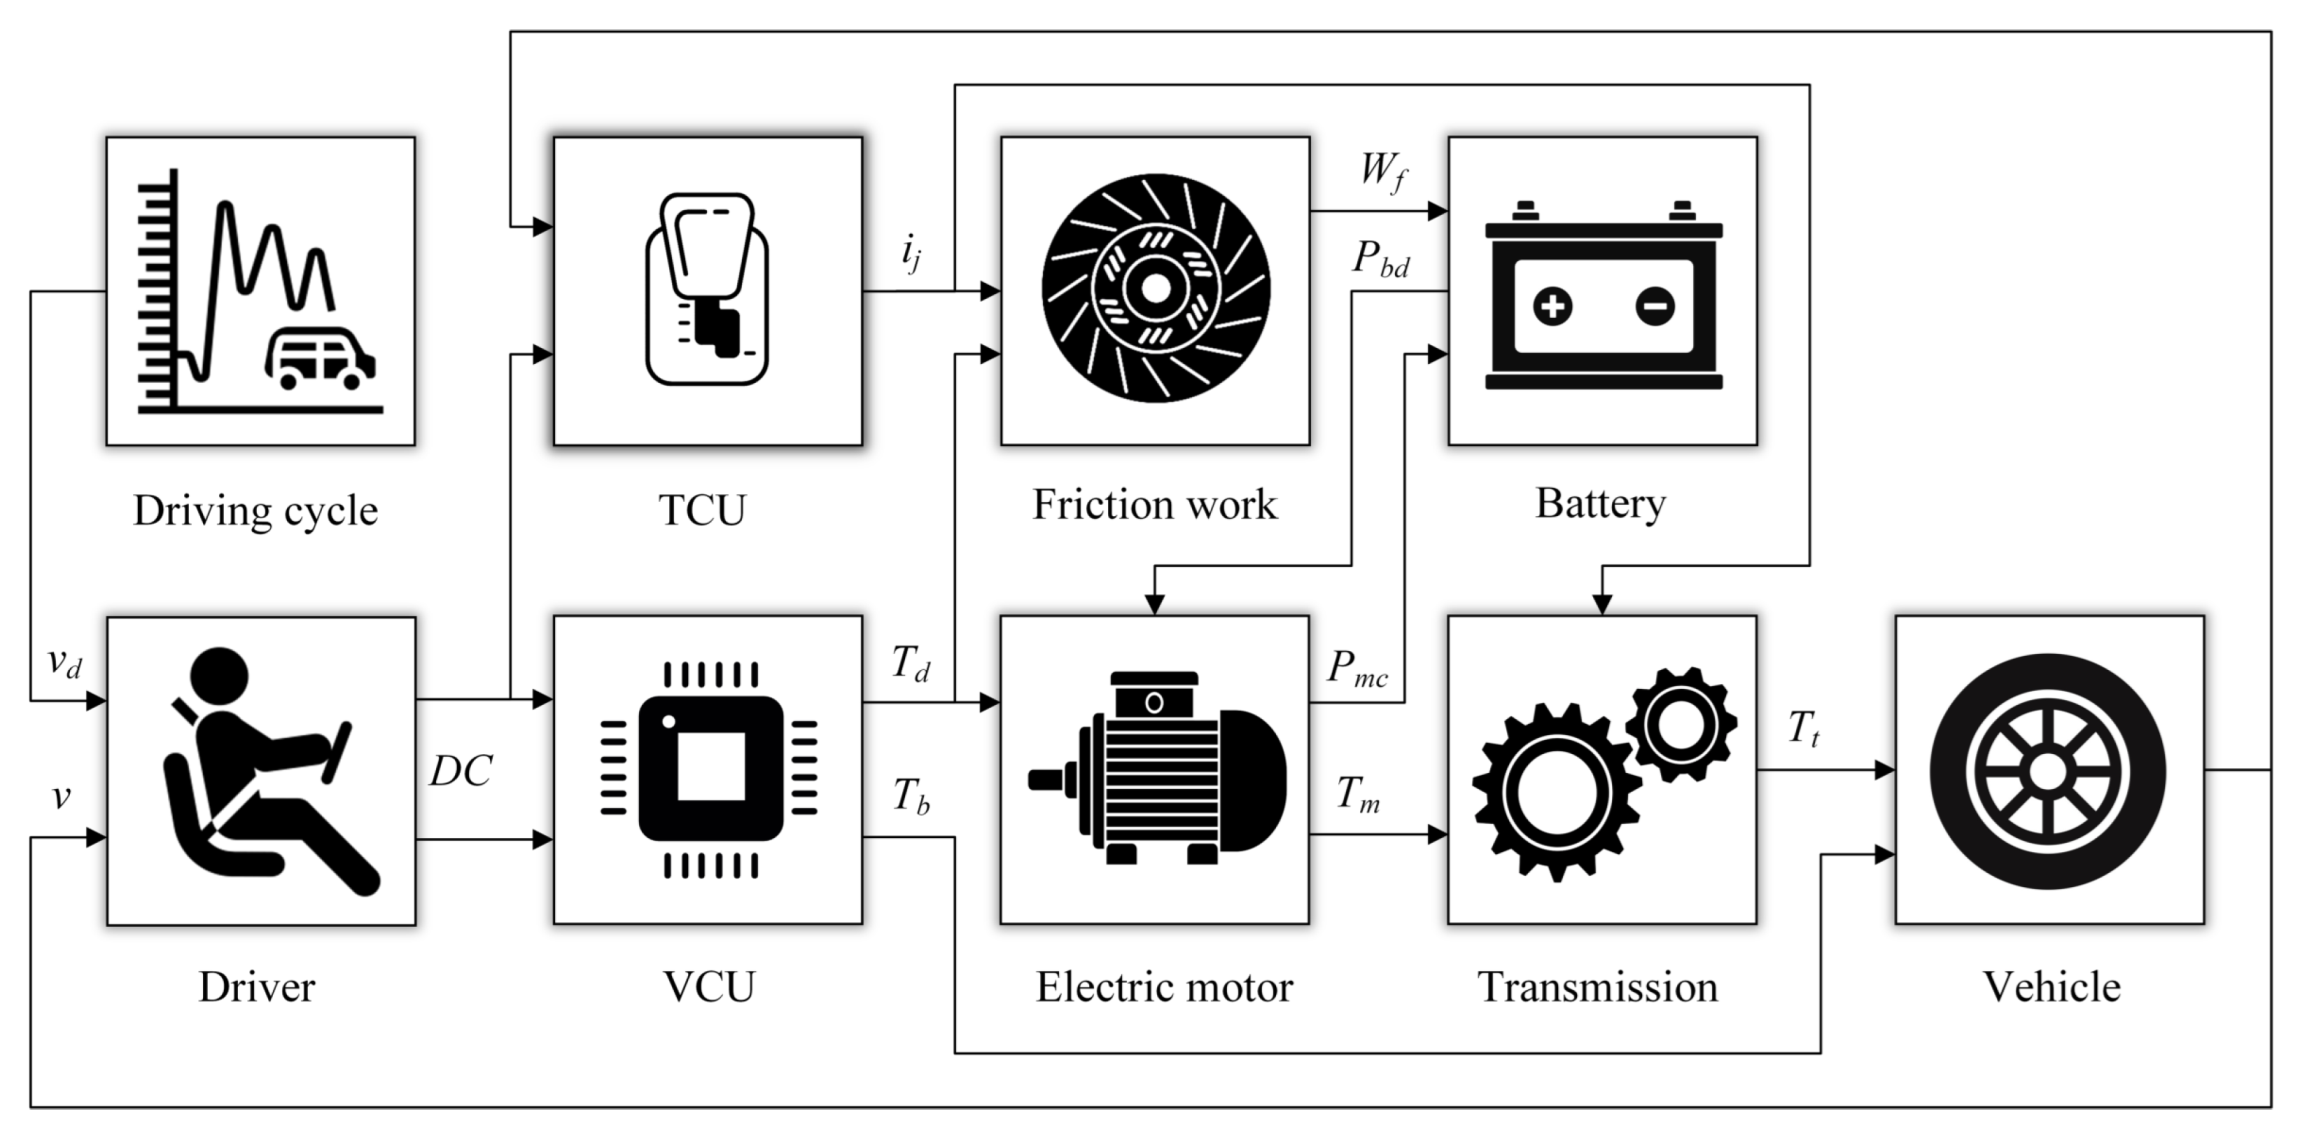
The EV model after modeling is shown in
Figure 13.
4. Multi-Objective Optimization of Gear Ratios Considering Shift Performance
The shift time, clutch friction work, and shift jerk are considered in the process of gear ratio optimization. On the premise of meeting the maximum vehicle speed, multi-objective optimization of gear ratios is carried out with power, economy, and comfort as vehicle performance evaluation indexes. Taking the gear ratio of a transmission produced by the Great Wall Motor Company as a reference, the gear ratio of the main reducer is selected as a certain value within a reasonable range (
= 4.059). The three gear ratios of the transmission are optimized separately as optimization variables, and the optimization variable
is:
4.1. Shift Control Strategy
In order to optimize the shift performance, it is necessary to determine the shift control strategy of the three-speed AMT firstly. In this paper, the shift control strategy widely used in two-speed transmission is adopted to control the shift process from the first gear to the second gear and from the second gear to the third gear respectively. In the torque phase, linear feedforward control is adopted. In the inertia phase, PID control is adopted to track the speed difference of the clutch [
28,
37]. The shift control strategy in the upshift process is shown in
Figure 14 and
Figure 15. Two diagrams show the change process of the electric motor torque, clutch torque, and synchronizer torque in different shift phases.
4.2. Objective Function
The 0∼100 km acceleration time, energy consumption under driving cycle, and jerk generated during 0∼100 km acceleration are taken as the optimization objectives of dynamic, economic, and comfort performance, respectively, and the calculation processes of the objective functions are as follows.
4.2.1. Dynamic Performance
Acceleration time is the primary index to evaluate dynamic performance. In order to calculate the acceleration time more accurately and optimize the shift time, the shift time is added to the calculation of objective function. Hence, the acceleration time
includes the first gear acceleration time
, the shift time from the first gear to the second gear
, the second gear acceleration time
, the shift time from the second gear to the third gear
and the third gear acceleration time
:
where:
is the upshift speed from the first gear to the second gear under the dynamic shift strategy,
is the speed at upshift completion of the second gear,
is the upshift speed from the second gear to the third gear under the dynamic shift strategy,
is the speed at upshift completion of the third gear,
,
, and
are the maximum driving force of wheels in the first gear, second gear, and third gear respectively,
and
are the maximum driving force of wheels when the first gear shifts to the second gear and the second gear shifts to the third gear respectively.
For convenience, the maximum driving force of wheels of different gears is expressed as
. According to the torque characteristics of the electric motor,
can be divided into the following two cases:
where:
is the rated speed of electric motor,
is the peak power of electric motor,
n is the speed of electric motor.
The maximum driving force of wheels during upshift
and
are related to the shift control strategy. Using the shift control strategy described above,
and
are as follows:
where:
,
, and
are the torque of the first, second and third gear pairs, respectively.
4.2.2. Economic Performance
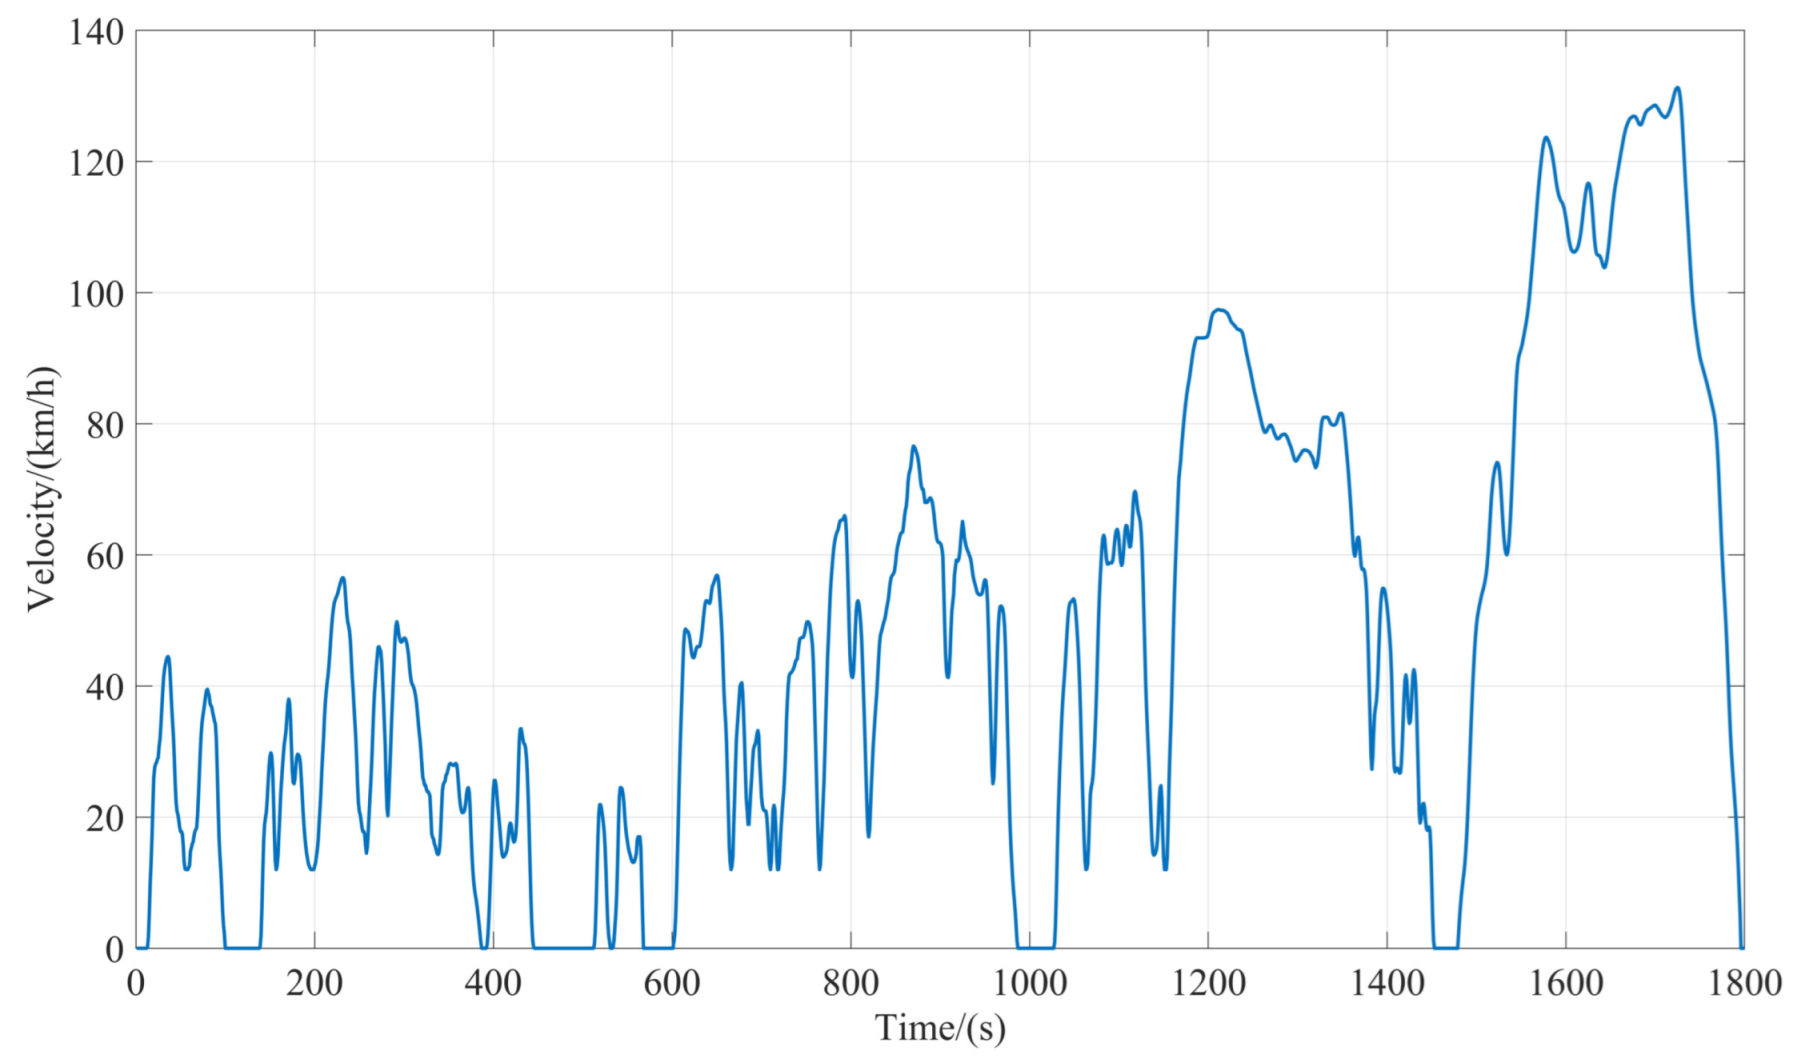
Energy consumption is the direct reflection of economic performance. The worldwide light vehicles test procedure (WLTP) is closer to actual driving conditions and more stringent than other driving cycles. Therefore, this paper uses the energy consumption under the WLTP as the economic index. The WLTP is shown in
Figure 16.
Through the EV model established in the previous chapter, the
of the power battery during a WLTP driving cycle is taken as the energy consumption in gear. In addition, to optimize the friction work of the clutch, the friction work is added to the objective function. In the driving cycle simulation, the shift process is power-on upshift and power-off downshift. Compared with the power-on upshift, the friction work of power-off downshift is very small, so it is ignored. Using the shift control strategy described above, the friction work and that of the first gear shifts to the second gear
and the second gear shifts to the third gear
are:
where:
is the angular velocity of wheels,
is the clutch speed difference from the first gear to the second gear,
is the clutch speed difference from the second gear to the third gear.
The total friction work
is the sum of the friction work generated by each upshift:
where:
p is the number from the first gear shift to the second gear,
q is the number from the second gear shift to the third gear.
The EV model with friction work is shown in
Figure 13. To sum up, the total energy consumption includes the energy consumption in gear
and total friction work
. Since the units of
and
are different, in order to facilitate the calculation of total energy consumption, it is necessary to unify the units of the two. Transforming
into the proportional form similar to
, and the energy consumption of friction after the change
is:
Finally, the total energy consumption
is:
4.2.3. Comfort Performance
Jerk is used to evaluate the driving comfort. The smaller the jerk, the higher the driving comfort. Taking the total jerk generated during 0∼100 km acceleration as the comfort index, the acceleration jerk
includes the first gear jerk
, the jerk from the first gear to the second gear
, the second gear jerk
, the jerk from the second gear to the third gear
, and the third gear jerk
:
In the above formula, the driving force under each phase is calculated in the same way as the ‘Dynamic performance’ section, which will not be repeated here.
4.3. Constraint Condition
During driving, a low speed gear is usually used for starting, accelerating, and climbing conditions, and a high speed gear is used for high speed driving conditions. The reasonable matching of gear ratio should also make the electric motor work efficiently. Therefore, the constraints of each gear are as follows. The first gear ratio should meet the climbing performance, while taking into account the motor efficiency at low speed area. The third gear ratio should meet the requirement of the maximum vehicle speed, while reducing the motor speed as much as possible. The second gear ratio should ensure the shift smoothness with adjacent gear to improve driving comfort.
When driving in the first gear, the upper limit of the first gear ratio
should meet the adhesion condition between the wheel and the ground:
where:
b is the distance from centroid to rear axle,
is the coefficient of road adhesion,
= 0.8,
L is the wheelbase.
The lower limit of the first gear ratio
should meet the requirement of maximum climbing:
where:
is the maximum climbing degree,
is the climbing speed,
= 30 km/h.
When driving in the third gear, the upper limit of the third gear ratio
should meet the requirement of the maximum vehicle speed:
where:
is the peak speed of the electric motor,
is the maximum vehicle speed.
The lower limit of the third gear ratio
should meet that the electric motor is in the constant power area when driving at the maximum vehicle speed:
where:
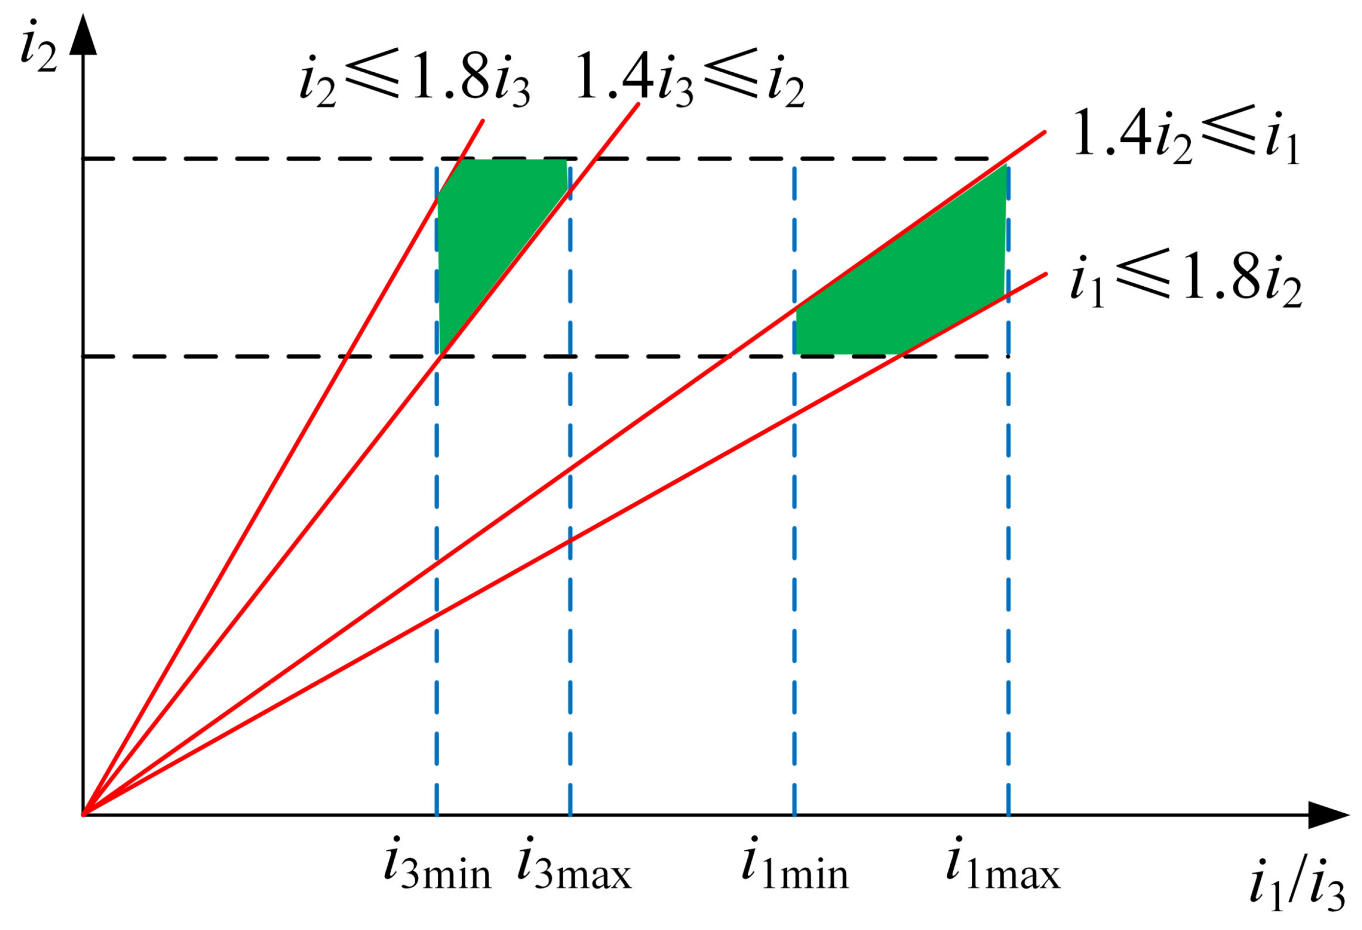
is the electric motor torque at maximum vehicle speed. The distribution of gear ratio of adjacent gears shall ensure the shift smoothness. According to the design experience, the gear ratio between adjacent gears should satisfy the following relation:
Based on the above constraints, the feasible region of gear ratios
is:
The feasible region
is shown in the shaded part in
Figure 17.
4.4. Solving Optimization Problem
To sum up, the multi-objective optimization problem of gear ratios in this article can be expressed as follows:
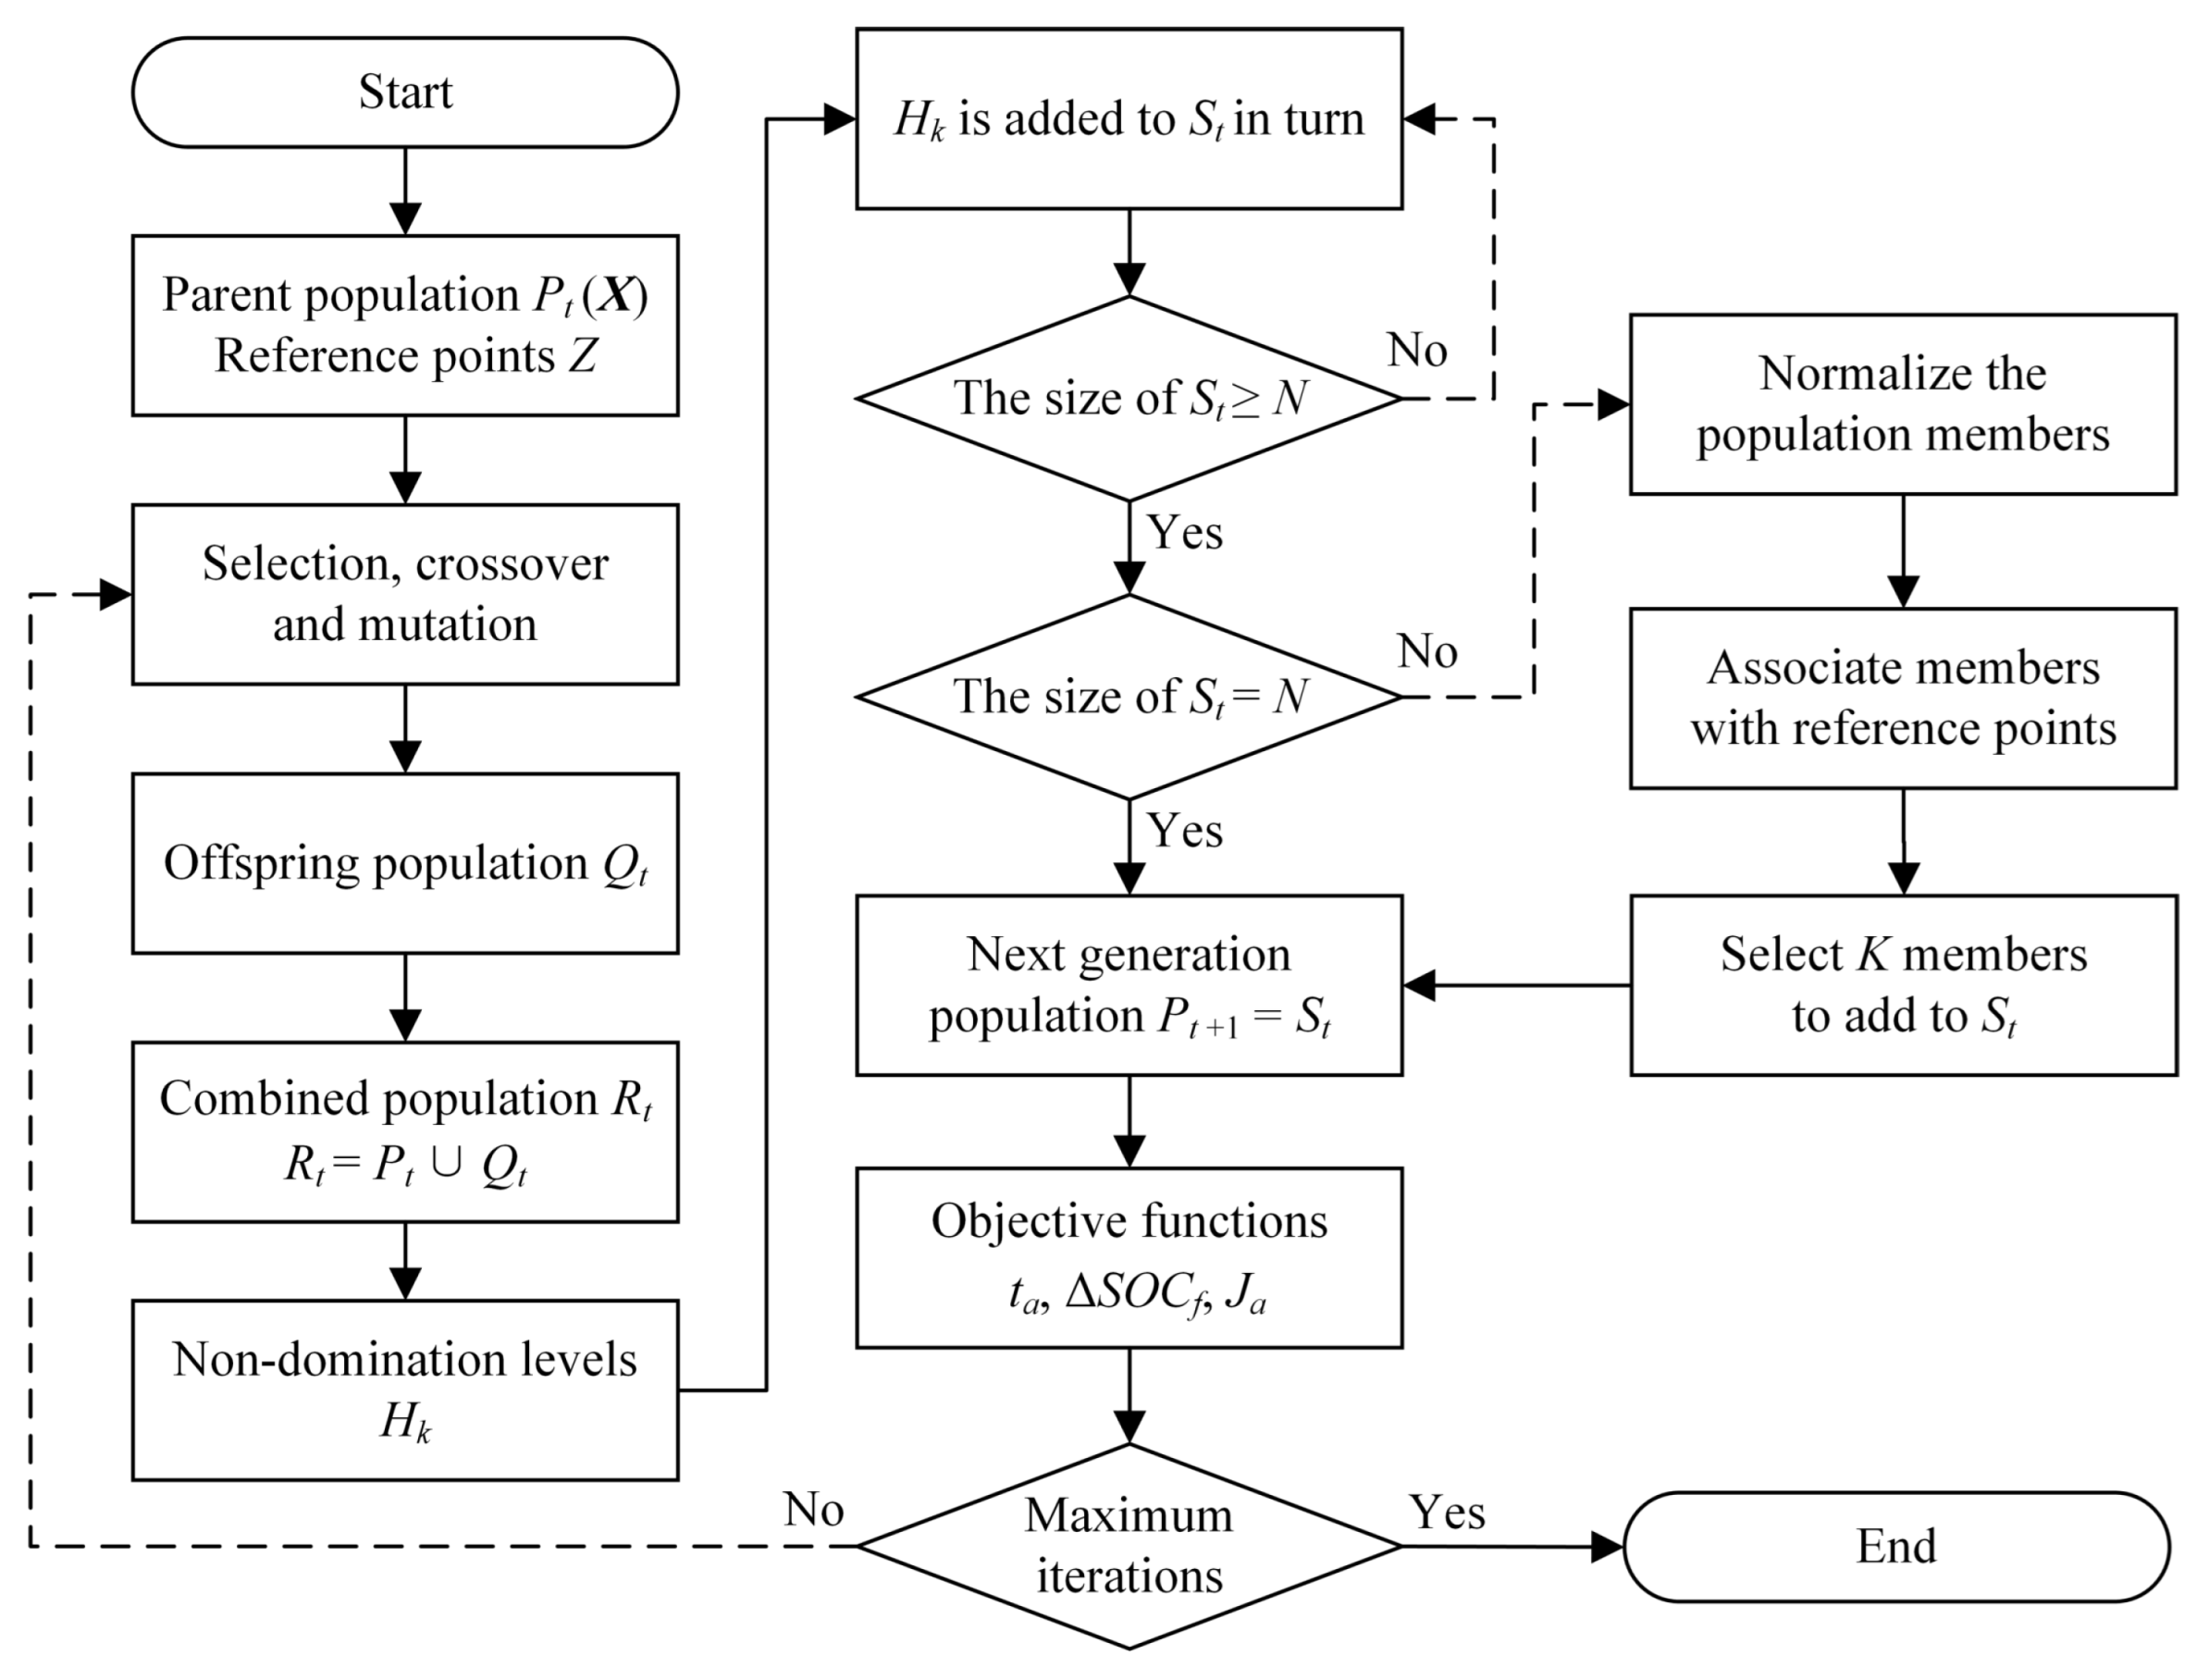
The purpose of multi-objective optimization is to balance the power, economy, and comfort of vehicles. Therefore, the solution of multi-objective optimization is usually a set of equilibrium solutions, which is called the Pareto front. The gear ratio optimization problem in this paper is solved by NSGA-III. In order to solve the multi-objective optimization problem with three or more objectives, NSGA-III adopts the method based on reference points for individual population selection on the basis of the NSGA-II framework. This method can ensure the diversity of the population members, so that the convergence and calculation accuracy are better. Compared with other multi-objective optimization algorithms, NSGA-III can solve many different types of multi-objective optimization problems with relatively low information cost, and has broad application prospects [
36]. The optimization process of gear ratios using NSGA-III is shown in
Figure 18, and the specific steps are as follows.
- 1
Predefined structured reference points Z, Randomly generate a parent population with population size N, t is the number of iterations, each population member is a three-dimensional vector .
- 2
Through selection, crossover and mutation, the offspring population is generated from the parent population , and the parent and offspring populations are combined into a combined population with population size 2N.
- 3
The combined population is sorted according to different non-domination levels , ().
- 4
Each non-dominated level is added to the new population in turn until the size of is equal to N or for the first time exceeds N.
- 5
If the size of is equal to N, then . If the size of is greater than N, proceed to step 6.
- 6.1
Adaptive normalization of population members.
- 6.2
Associate members with reference points.
- 6.3
Select the reference point associated with the least number of population members, and select the K population members closest to the reference point, , and add them to the in turn.
- 6.4
.
- 7
Calculate the objective function , and .
- 8
If the maximum number of iterations is achieved, end optimization and output the optimal result, otherwise return to step 2.
In step 7, when calculating the acceleration time and acceleration jerk, in order to ensure that the vehicle has stronger power, the dynamic shift strategy is adopted. When calculating the energy consumption, the dynamic and economic shift strategy is adopted. The shift speeds of the three objective functions are automatically generated through the gear ratio and the corresponding shift strategy, and continuously updated in the iterative process, so as to realize the dynamic optimization of the gear ratio combined with the shift strategy.
5. Optimization Results and Analysis
The multi-objective optimization of gear ratios is carried out using the MATLAB simulation platform, taking the acceleration time, energy consumption, and acceleration jerk, including the shift performance, as the objective functions (proposed method). In order to ensure the size and convergence of the population and improve the optimization efficiency, the population number
N is set to 100 and the maximum number of iterations is set to 100. As a comparison, taking the acceleration time, total energy consumption, and acceleration jerk, excluding the shift performance, as the objective functions (reference method). Therefore, in the reference method, the acceleration time only includes the acceleration time of the first gear
, second gear
, and third gear
, the total energy consumption only includes the energy consumption in gear
, and the acceleration jerk only includes the jerk of the first gear
, second gear
, and third gear
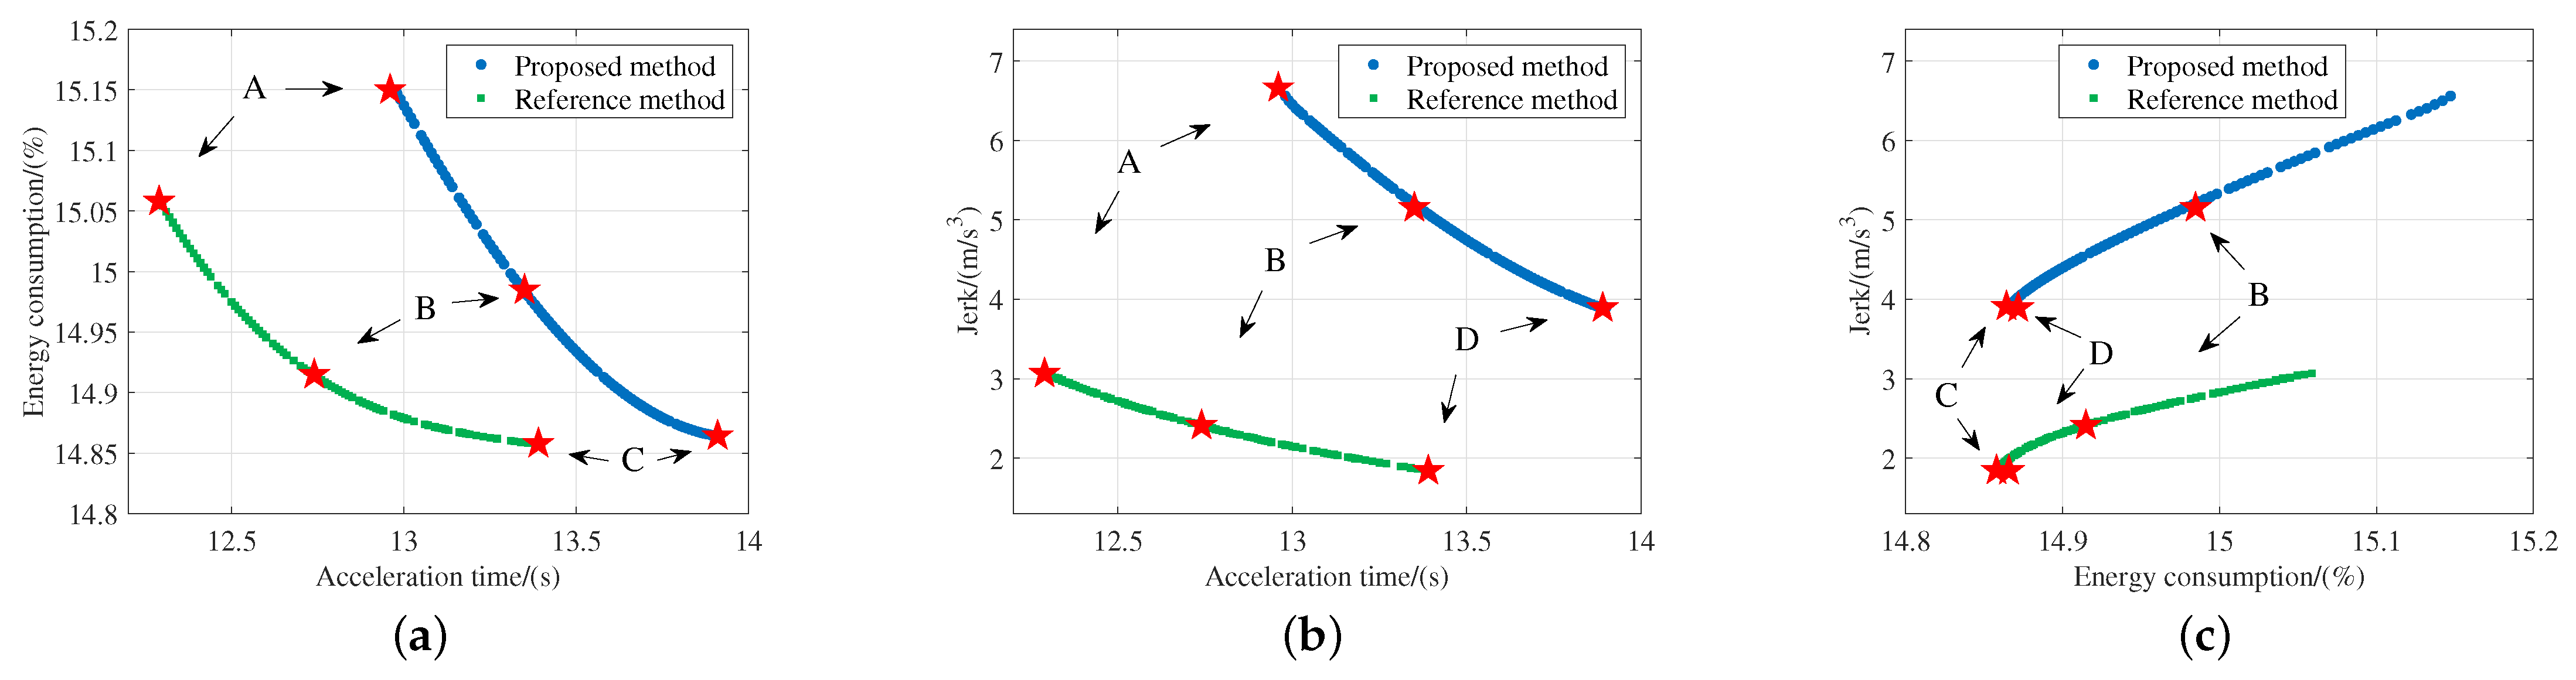
. The optimization algorithm and parameter settings are the same as the proposed method. After optimization, the multi-objective optimization results of the two methods with the best optimization results are shown in
Figure 19.
Figure 19 shows the Pareto front between acceleration time and energy consumption, acceleration time and acceleration jerk, and energy consumption and acceleration jerk, respectively. The convergence and distribution range of the Pareto fronts are good, which reflects the advantages of NSGA-III in multi-objective optimization. It can be seen from the optimization results that the overall change trend of power and economy, and power and comfort are opposite. Solution A has the strongest power, solution C has the best economy, and solution D has the best comfort. Considering the three optimization objectives, when the Pareto solution is located at B, the comprehensive performance of the vehicle is its best. The gear ratios corresponding to the four special solutions of the two optimization methods are shown in
Table 2.
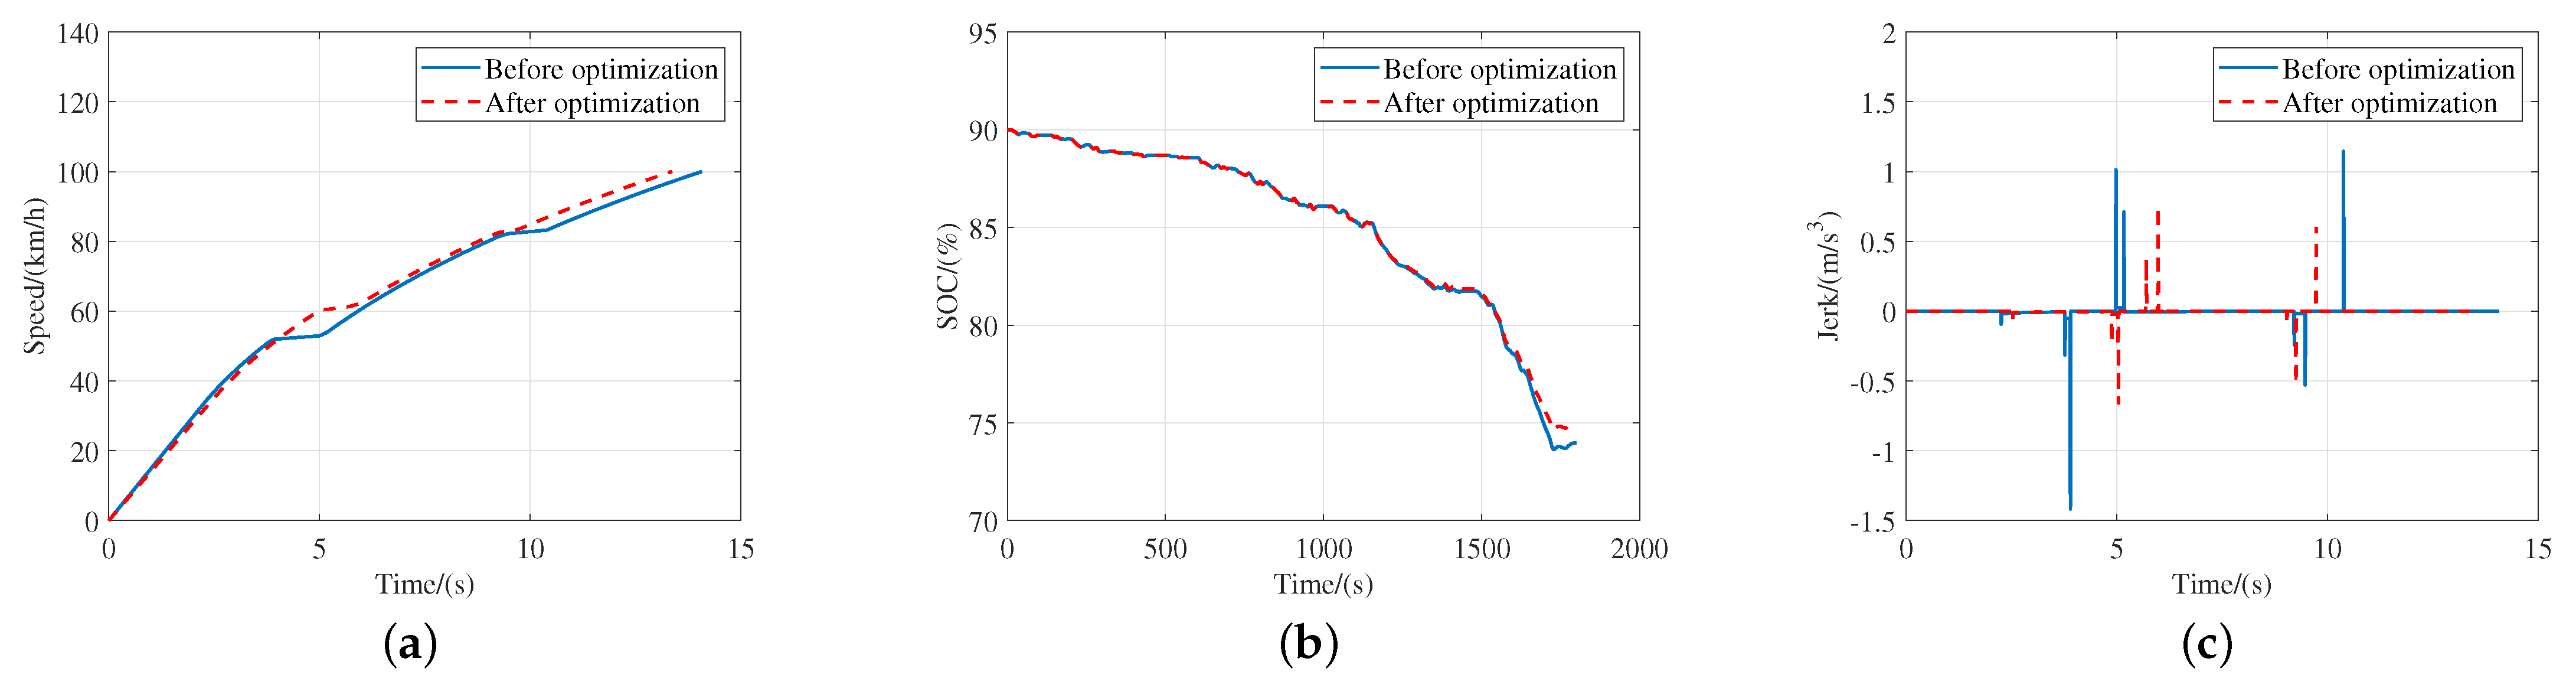
In order to verify the effectiveness of the optimization results of the proposed method, the gear ratio of solution B is selected to compare with that before optimization. The gear ratios before optimization are 2.426, 1.529, and 1.016 respectively. The vehicle performance before and after optimization is shown in
Figure 20.
As shown in
Figure 20a, the overall trend of the two acceleration curves can be roughly divided into three segments, corresponding to the acceleration process of the first gear, second gear, and third gear respectively. It can be clearly seen that the speed growth trend slows when upshifting, because the transmission output torque decreases at this time. At the same time, the vehicle speed is still increasing, indicating that a seamless gearshift is realized. The acceleration time before and after optimization is 14.18 s and 13.35 s, respectively, and the dynamic performance is improved by 5.85%. Compared with before optimization, the acceleration time of the first gear after optimization is longer and the speed increases more. The shift time after optimization is shorter, and the overall acceleration time is shorter.
Figure 20b shows the SOC of the power battery under WLTP driving cycle. Before 1200 s, the energy consumption before and after optimization approximated, and then the gap began to increase. After 1200 s, the driving cycle enters the high speed and extra high speed stages. In these two stages, the speed and acceleration change more violently, and the maximum speed is greater, so the requirements for vehicle performance are higher. The energy consumption before and after optimization was 14.98% and 16.12%, respectively, and the economic performance was improved by 7.07%.
Figure 20c shows the jerk during acceleration before and after optimization. It can be seen that the jerk mainly occurs in the shift process. The total acceleration jerk before and after optimization is 9.67
and 5.15
, respectively, and the comfort performance is improved by 46.74%. In conclusion, the power, economy, and comfort are significantly improved, and the effectiveness of the proposed method is verified.
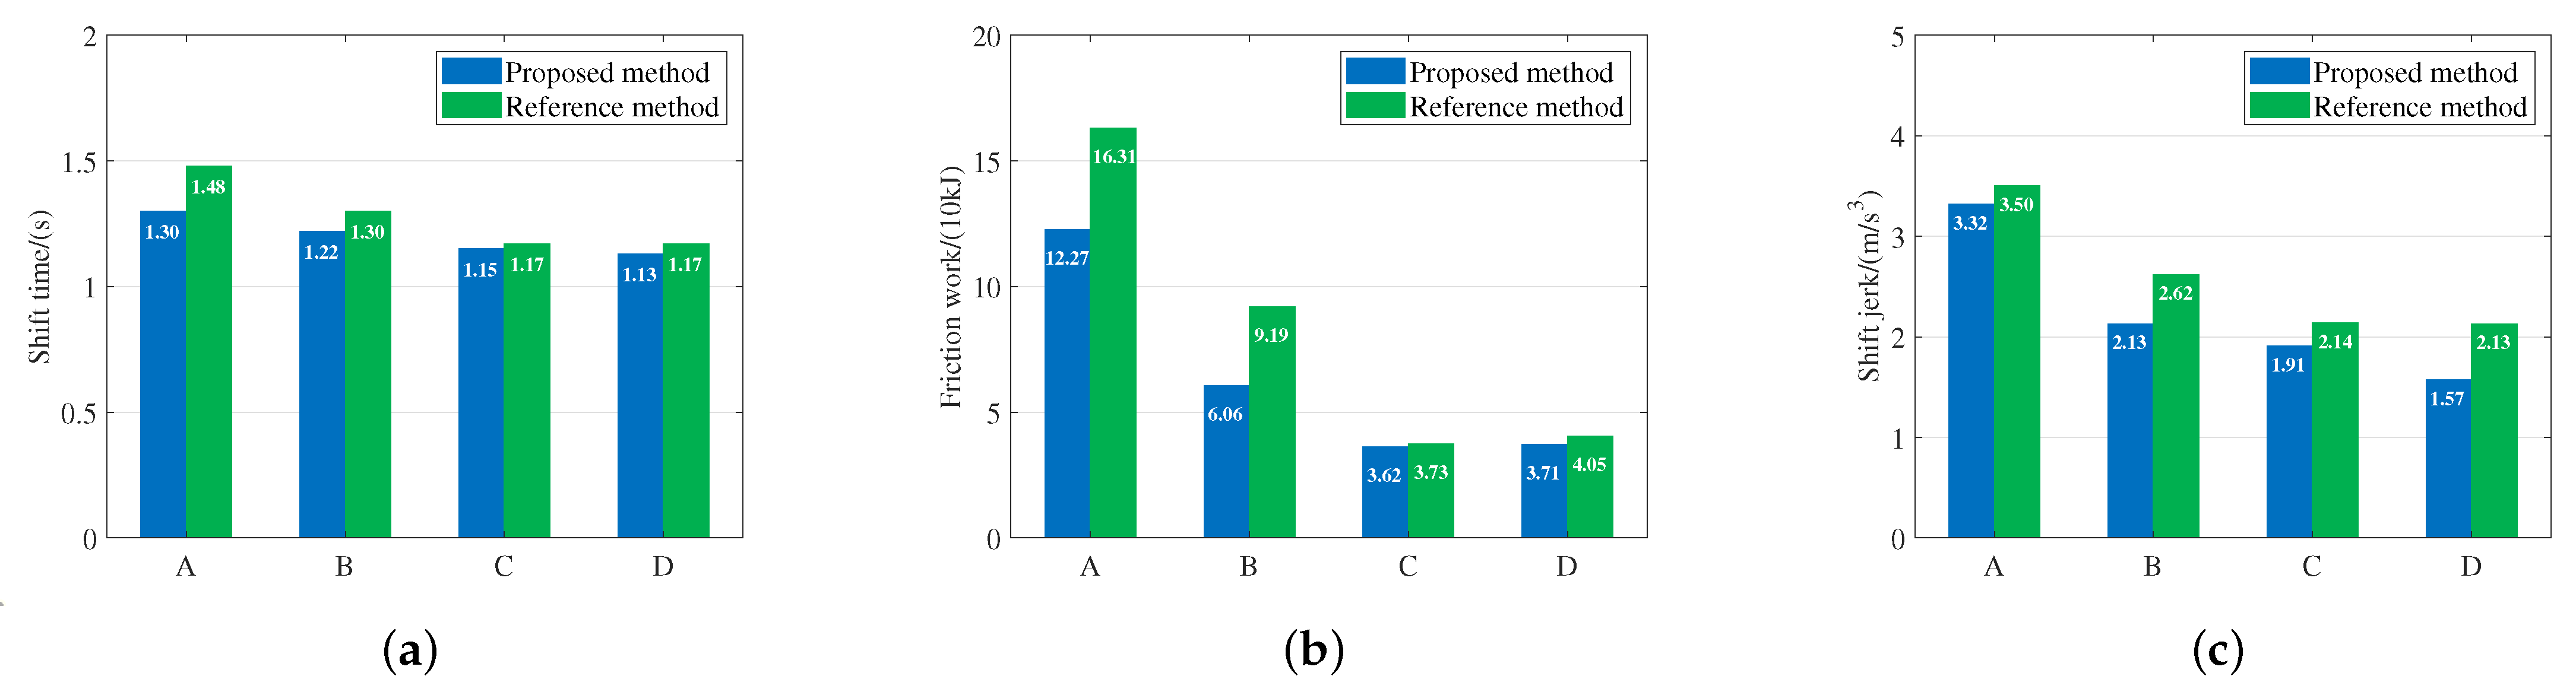
It can be seen from
Figure 19 that the values of the three objective functions of the proposed method are larger than those of the reference method, which does not mean that the proposed method is worse than the reference method, but because the objective functions of the proposed method includes the values of the shift process. Since both methods optimize the vehicle performance in gear, in order to illustrate the advantages of the proposed method, the shift performance of the two methods is compared. The shift time, friction, and shift jerk are calculated by the gear ratios corresponding to the solutions A, B, C, and D of the two methods. The results are shown in
Figure 21.
The shift time of the proposed method is generally shorter than that of the reference method. The biggest gap is in solution A, and the shifting time is reduced by 12.2%. The friction of the proposed method is generally smaller than that of the reference method, especially at solution A and solution B, which are greatly reduced by 27.7% and 34.1%. Because of the large energy consumption of A and B, the optimization effect of the proposed method is more obvious. The shift jerk of the proposed method is also smaller. The biggest gap is in solution D, and the shifting jerk is reduced by 26.3%. In summary, compared with the reference method, the proposed method optimizes the shift time, friction, and shift jerk, for superior shift performance.
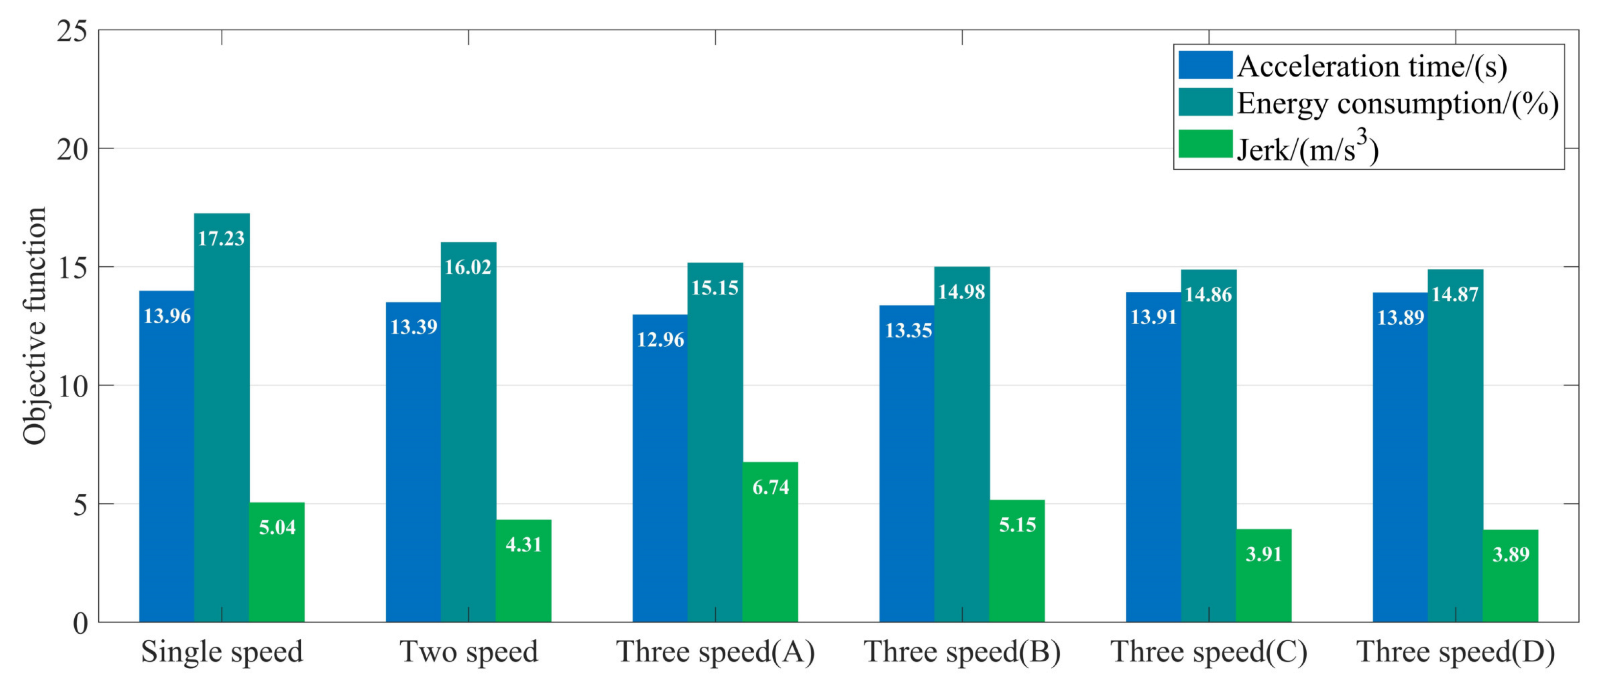
In order to study the performance of three-speed transmission compared with single-speed transmission and two-speed transmission, the power, economy, and comfort performance of the three transmissions are compared, and the results are shown in
Figure 22. It should be noted that since the single-speed transmission does not need to shift, the shift process is not included in the objective functions, and the two-speed transmission includes the shift process from the first gear to the second gear.
As shown in
Figure 22, the overall performance of the two-speed transmission is better than single-speed transmission, which is consistent with the existing research results. Compared with the other two transmissions, the three-speed AMT has the best economic performance due to its having more gears. Particularly in solution C, the energy consumption is reduced by 13.75% and 7.24%, respectively. The solutions A and B have better power performance, and the acceleration time of solution A is shortened by 7.16% and 3.21% compared with the other two transmissions. However, the two solutions have poor comfort, because the shift number of a three-speed transmission is more, resulting in greater jerk. To enhance the comfort performance, the acceleration performance needs to be properly reduced. For example, the jerk of solutions C and D are better, and the jerk decreases by 22.82% and 9.75% in solution D. To sum up, the three-speed transmission has the best economic performance compared with the single-speed and two-speed transmission, and the dynamic performance is strong (such as in solutions A and B). The price of strong power is poor comfort. In order to improve comfort, it is necessary to reduce power (such as solutions C and D).
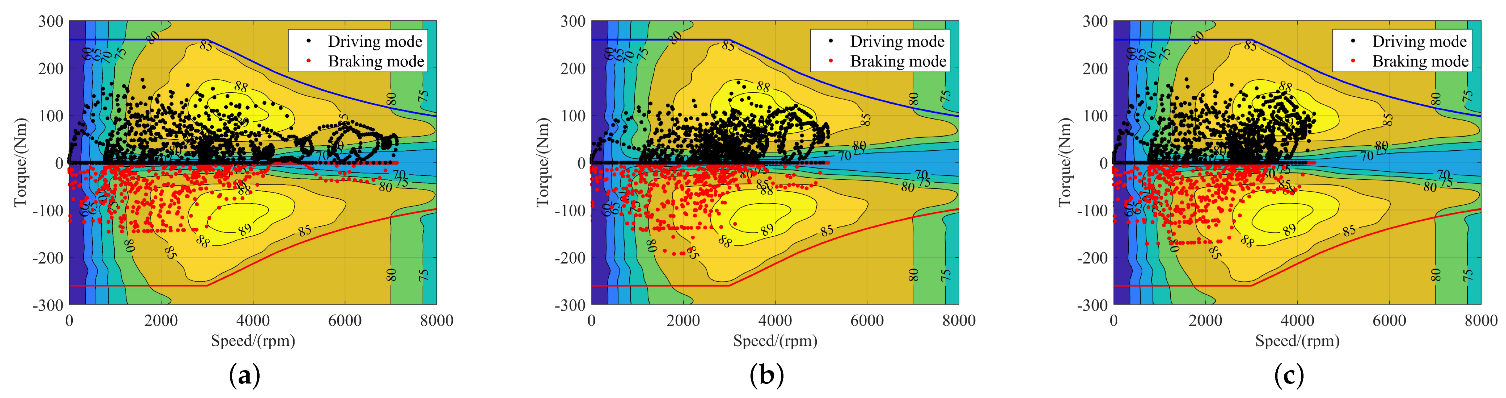
Figure 23 shows the distribution of the electric motor operating points of the three transmissions, which can directly reflect the energy consumption performance. The proportion of electric motor operating points in the high efficiency area (≥85%) of the three transmissions is 12.5% (single-speed), 20.22% (two-speed), and 22.83% (three-speed), respectively. Compared with the other two transmissions, the three-speed transmission makes the motor work more in the high efficiency area. At the same time, due to the higher gear position of the three-speed transmission, the same vehicle speed can be output at a lower electric motor speed. It can be seen that the three-speed transmission has greater advantages in adjusting the motor operating point, which makes the energy consumption lower.
6. Conclusions
In this paper, a multi-objective optimization method of gear ratios considering shift performance is proposed for a seamless gearshift in a three-speed AMT for electric vehicles. Firstly, the structure and shift process of the three-speed AMT are introduced, and the EV simulation model is established based on MATLAB/Simulink platform. Then the optimization method of gear ratios is described in detail. Finally, the Pareto front of multi-objective optimization is obtained by using the NSGA-III.
The Pareto front solved by the NSGA-III has good convergence and distribution, which proves the availability of the optimization algorithm. Compared with the gear ratio before optimization, the optimized gear ratio is significantly improved in dynamic, economic, and comfort performance. The performance of the three has been improved by 5.85%, 7.07%, and 46.74% respectively. Compared with the optimization method without shift performance, the proposed method has a great improvement in the shift time, friction of the clutch, and shift jerk. The three are reduced by at most 12.2%, 34.1%, and 26.3%, respectively. The above simulation result verifies the feasibility of the proposed method.
At the end of the article, the performances of single-speed, two-speed, and three-speed transmissions are comprehensively compared. The results show that due to the large number of gear positions, the electric motor can be adjusted to work more efficiently, such that the three-speed transmission has the best economic performance. The acceleration performance of the three-speed transmission is also outstanding, but the jerk is also large due to the large number of shifts. Therefore, a comprehensive consideration of power, economy, and comfort is necessary for gear ratio optimization.


