Article

Investment and Production Strategies of Renewable Energy Power under the Quota and Green Power Certificate System

1
School of Economics and Business Administration, Chongqing University, Chongqing 400030, China
2
School of International Business and Management, Sichuan International Studies University, Chongqing 400031, China
*
Author to whom correspondence should be addressed.
Energies 2022, 15(11), 4110; https://doi.org/10.3390/en15114110
Submission received: 27 April 2022 / Revised: 30 May 2022 / Accepted: 30 May 2022 / Published: 2 June 2022
(This article belongs to the Special Issue Advances in Renewable Energy Research and Applications)

Abstract

:
In order to study the impact of a renewable energy quota and green power certificate system on the strategies of energy suppliers, this paper constructs a multi-stage game model of renewable energy power investment and production from the renewable energy interest chain and its stakeholders. Through the calculation and solution of the model, the optimal renewable energy utilization level, pricing and production strategies of renewable energy power of energy suppliers are calculated under the scenarios of direct sale of power and purchase and sale by power grids. The results show that the quota ratio, green certificate price and investment cost are the key influencing factors of energy suppliers’ strategies, and changes in the values of the three factors will completely change the renewable energy investment, pricing and production levels of energy suppliers in equilibrium. In addition, the study found that the impact of the renewable energy quota on renewable energy utilization levels of energy suppliers depends on the relative size of investment cost and green power certificate price. At the same time, it was also found that with a change in investment cost, green power certificate price and user preference, the market share and renewable energy utilization level of traditional energy suppliers and new energy suppliers also change.

Graphical Abstract

1. Introduction

Global carbon emissions are 40 billion tons of carbon dioxide every year, 86% of which comes from the use of fossil fuels [1]. Among the total carbon emissions, activities related to energy production and consumption account for the highest proportion of carbon emissions [2]. Therefore, promoting the utilization of renewable energy is the key to achieving green and low-carbon development and the goals of carbon peak and carbon neutrality. Renewable energy power, as an important form of the utilization and development of renewable energy, has attracted extensive attention. In order to promote green and low-carbon development and achieve the goals of carbon peak and carbon neutrality, many countries have formulated corresponding policies and measures to encourage and support the investment and production of renewable energy power [3,4]. However, in the early stage of renewable energy utilization, its development is relatively slow due to its low technological maturity, high cost, unstable returns and other characteristics, leading to serious wind and solar abandonment phenomena. In order to promote the utilization of renewable energy, in the post-subsidy era where subsidies and feed-in tariffs are reduced, governments have formulated and promulgated renewable energy quotas and green power certificate systems to promote the investment and production of renewable energy power. However, how renewable energy quotas and green power certificate systems affect the investment and production of renewable energy power, and how the energy suppliers conduct their investment and production of renewable energy power under renewable energy quotas and green power certificate systems, are facing many problems in practice. Therefore, the investment and production of renewable energy power has become an important topic in both academic and practical circles.
The existing research on renewable energy power is carried out from two angles. One part is carried out from the technical perspectives of power supply [5,6], energy storage [7,8], control [9], relay protection [10], transportation inspection and dispatching [11], and the other part is carried out from the economic management perspectives of policy [12,13], costs and returns [14,15], market mechanisms and configuration [16,17]. However, compared to other aspects of renewable energy power, there is little research on the investment and production of renewable energy power. The existing mechanisms and strategies are mainly about the investment and production of traditional power, and lack the investment and production mechanisms and strategies of renewable energy. Due to the differences in technology, market and interest chain stakeholders, these traditional mechanisms and strategies are not applicable to the investment and production of renewable energy. According to the socio-technical system theory, different technology systems need to be matched to economic management systems. The different technical systems of renewable energy power and thermal power generation lead to the different markets and industrial chains [18]. Therefore, it is necessary to match the mechanisms and strategies to promote the utilization and development of renewable energy. At the same time, the stakeholder theory believes that an organization involves many stakeholders, and each stakeholder has different interest requirements. In order to promote the development of the organization, it is necessary to balance the interests of all parties [19]. Unlike thermal power, the investment and production interest chains of renewable energy power involve many stakeholders, such as the government, traditional energy suppliers, new energy suppliers, large power grids and the users, each of whom has their own interest requirements. If the sum of interest of all stakeholders in the interest chain is not balanced, the quality and efficiency of renewable energy power investment and production will be seriously affected. Therefore, corresponding mechanisms and strategies are needed to meet and balance the interests of all parties in the interest chain as to promote the investment and production of renewable energy. At the same time, compared with the external diseconomy caused by the increase in carbon emissions in traditional thermal power generation, the green and clean production of renewable energy power generation is beneficial for reducing the carbon emissions of the system, which has a high environmental protection value, social value and external economy [20]. However, this kind of external economy has the characteristics of typical public goods and externality, which can lead to market failure, resulting in the power market not being able to allocate the investment and production resources effectively and being Pareto optimal. At the beginning of the utilization of renewable energy, governments formulated measures such as subsidies and feed-in tariffs to guide and optimize the allocation of resources. However, with the changes in technology and the market environment, subsidies and feed-in tariffs have been gradually reduced. In recent years, in the post-subsidy era, governments have formulated and promulgated new measures such as renewable energy quotas and green power certificate systems to guide and support the investment and production of renewable energy power. However, how renewable energy quotas and green power certificate systems affect the investment and production of renewable energy and how the energy suppliers invest and produce renewable energy power under renewable energy quotas and green power certificate systems greatly affect the utilization and development of renewable energy. Corresponding investment and production strategies are needed under renewable energy quotas and green power certificate systems to maximize returns and promote the utilization and development of renewable energy. In order to promote the utilization and development of renewable energy, it is necessary to study the investment and production of renewable energy power under renewable energy quotas and green power certificate systems, analyze relevant influencing factors and design appropriate mechanisms and strategies to promote the utilization and development of renewable energy.
Therefore, in order to study the investment and production of renewable energy power, this paper constructs the investment and production model of renewable energy power under a renewable energy quota and green power certificate system. From the perspectives of the interest chain and stakeholders of renewable energy power, this paper constructs the investment and production model of renewable energy under the scenarios of the direct sale of power in the market and the purchase and sale by large power grids. A multi-stage game model involving the government, traditional energy suppliers, new energy suppliers, large power grids and users is constructed. The optimal investment, pricing and production of renewable energy power under the scenarios of direct power sale and purchase and sale by power grids are solved and calculated; the influences of quota, investment cost and green power certificate price on the investment and production of renewable energy are analyzed; and the relationship and changes between the utilization level of renewable energy and the market share are also analyzed in this paper. On this basis, the paper further analyzes the influences of quota and green power certificate price on the investment, production and returns of traditional energy suppliers and new energy suppliers by using numerical analysis. The analysis results of the model are of great reference significance for the optimization of a renewable energy quota and green power certificate system, and for making the investment and production strategies of renewable energy.
The rest of the paper is organized as follows. Section 2 presents the relevant literature review. Section 3 presents the nomenclature, model description, model assumptions and model establishment. Section 4 analyzes the investment and production strategies of renewable energy power under different scenarios. Section 5 presents the numerical analysis of relevant factors. Section 6 presents the corresponding discussion. Section 7 draws conclusions.

2. Literature Review

In the early stage of research on renewable energy power investment and production, the scholars mainly started from the macro and overall perspective, on the basis of analyzing the value, status quota and efficiency of the utilization of renewable energy and discussing the approaches, modes and policies of the utilization of renewable energy, as to promote the investment and production of renewable energy power. For instance, Zhang et al. [21] analyzed the development background and legislation status of renewable energy, discussed the risks and problems faced by the development of renewable energy and then looked ahead at the prospects of the utilization of renewable energy. Parker [22] studied the economic benefits of renewable energy, and proposed that the development of renewable energy can reduce the energy cost and optimize the energy structure. Banos et al. [23] analyzed the disadvantages of the development of renewable energy and the shortcomings of renewable energy itself, and then put forward the methods to optimize the utilization of renewable energy to promote the development of renewable energy. Wang et al. [24] analyzed the impact of the utilization of renewable energy on climate change mitigation, and then put forward a development path for renewable energy. Chu et al. [25] developed an outlook on the security of renewable energy. Ellabban et al. [26] analyzed the utilization status and policy orientation of renewable energy, and then put forward a development trend and model of renewable energy.
With the development of renewable energy power investment and production, the scholars mainly started from the technical perspective, studying the power generation technology, power generation systems, energy storage systems, power generation predictions, grid-connection, dispatching, relay protection and other technologies of renewable energy, as to discuss the investment and production of renewable energy power. For example, Kunjana et al. [27] studied the impact of renewable energy power generation on the load of the power system, found that renewable energy power has a significant impact on the operation of the power system and then proposed an optimization strategy for the utilization of renewable energy. Mathiesen et al. [28] studied power transmission solutions for renewable energy, and proposed that renewable energy can be used more flexibly through the development of smart energy systems. Weitemeyer et al. [29] studied the energy storage methods of renewable energy, and calculated and optimized the best combination of energy storage, wind power and photovoltaic resources in the region. Andres et al. [30] studied the power generation of renewable energy and believed that it can promote energy diversification and improve the overall economic performance of the power sector. Wang et al. [31] studied the forecasting methods of renewable energy output, aiming at improving the application value of renewable energy through accurate predictions. Dominguez-Navarro et al. [32] studied the optimization methods of storage systems of renewable energy, and found that optimal cost-effectiveness could be obtained by mixing renewable energy and storage systems. Vergara et al. [33] studied the management mechanism of renewable energy systems, and proposed a complete energy management framework for grid-connected hybrid power plants.
In recent years, under the background of carbon peak and carbon neutralization goals and the green and low-carbon transformation of energy as the utilization patterns and technology of renewable energy have developed, scholars now mainly study the investment and production of renewable energy from economic and management perspectives, such as renewable energy digestion and absorption, power transaction, power pricing, investment, medium- and long-term trading and spot trading. For example, Hustveit et al. [34] studied and discussed the operation of a green power certificate system, and believed that a green power certificate system is conducive to supporting the utilization and development of renewable energy. Alizamir et al. [35] studied the impact of the feed-in price on the investment of renewable energy, and found that the feed-in price can ensure the stability of renewable energy investment returns. Sun et al. [36] studied the calculation methods and optimization model of the digestion and absorption of renewable energy according to the output characteristics of the power generation of renewable energy, as to promote the digestion and absorption of renewable energy. Yang et al. [37] studied the impact of government subsidies on the investment of renewable energy, and found that the impact of government subsidies on the investment of renewable energy increases significantly when energy consumption intensity is greater. Zhang et al. [38] studied the renewable energy trading system, and found that the subsidy expenditure of the government can be reduced by subsidizing renewable energy suppliers through market-oriented trading of renewable energy, as to reduce the financial burden of the government. Vlachos et al. [39] studied the pricing methods of renewable energy, and found that market-oriented methods such as green power certificate trading can make up for the cost of renewable energy and reduce the price of renewable energy; thus, renewable energy can be more easily promoted and adopted by the market. Brockway et al. [40] studied the returns on the investment of renewable energy, and found that the returns of renewable energy show a declining trend over time; therefore, appropriate institutions and market-oriented methods are necessary to promote the development of renewable energy. Blaszke et al. [41] used a case study to analyze the local spatial policies and renewable energy development of different municipalities in Poland, and found that the utilization degree and investment level of renewable energy are significantly affected by local spatial policies and development plans.
We follow the trend of research development, starting from the background of the reform of the power market, to study the investment and production of renewable energy power. It is worth mentioning that the existing studies mainly start from the single perspective of renewable energy, and there is a lack of studies from the perspective of investment and production interest chains of renewable energy. However, the investment and production process of renewable energy is the process of benefit sharing and transmission, and the interests in the renewable energy project development are constantly flowing and transmitted between the four interest levels of the government, investment and production, transaction and consumption, and the five stakeholders, i.e., the government, traditional energy suppliers, new energy suppliers, power grids and users; therefore, all parties in the interest chain have significant impacts on the investment and production of renewable energy. For the technical characteristics of renewable energy and the feature of multiple stakeholders, a single perspective is helpful for a deep understanding of corresponding mechanisms, but if the investment and production polices of renewable energy fails to reflect the interest requirements of all the stakeholders and to balance the interests of all parties, the investment and production efficiency and quality of renewable energy can be seriously affected. Therefore, starting from the investment and production interest chains of renewable energy power and the balance between the interests of all parties in the interest chain, we construct the investment and production model under the scenarios of direct sale of power and purchase and sale by power grids to study the investment and production problems of renewable energy, and thus to promote the utilization and development of renewable energy.

3. Model Description and Hypothesis

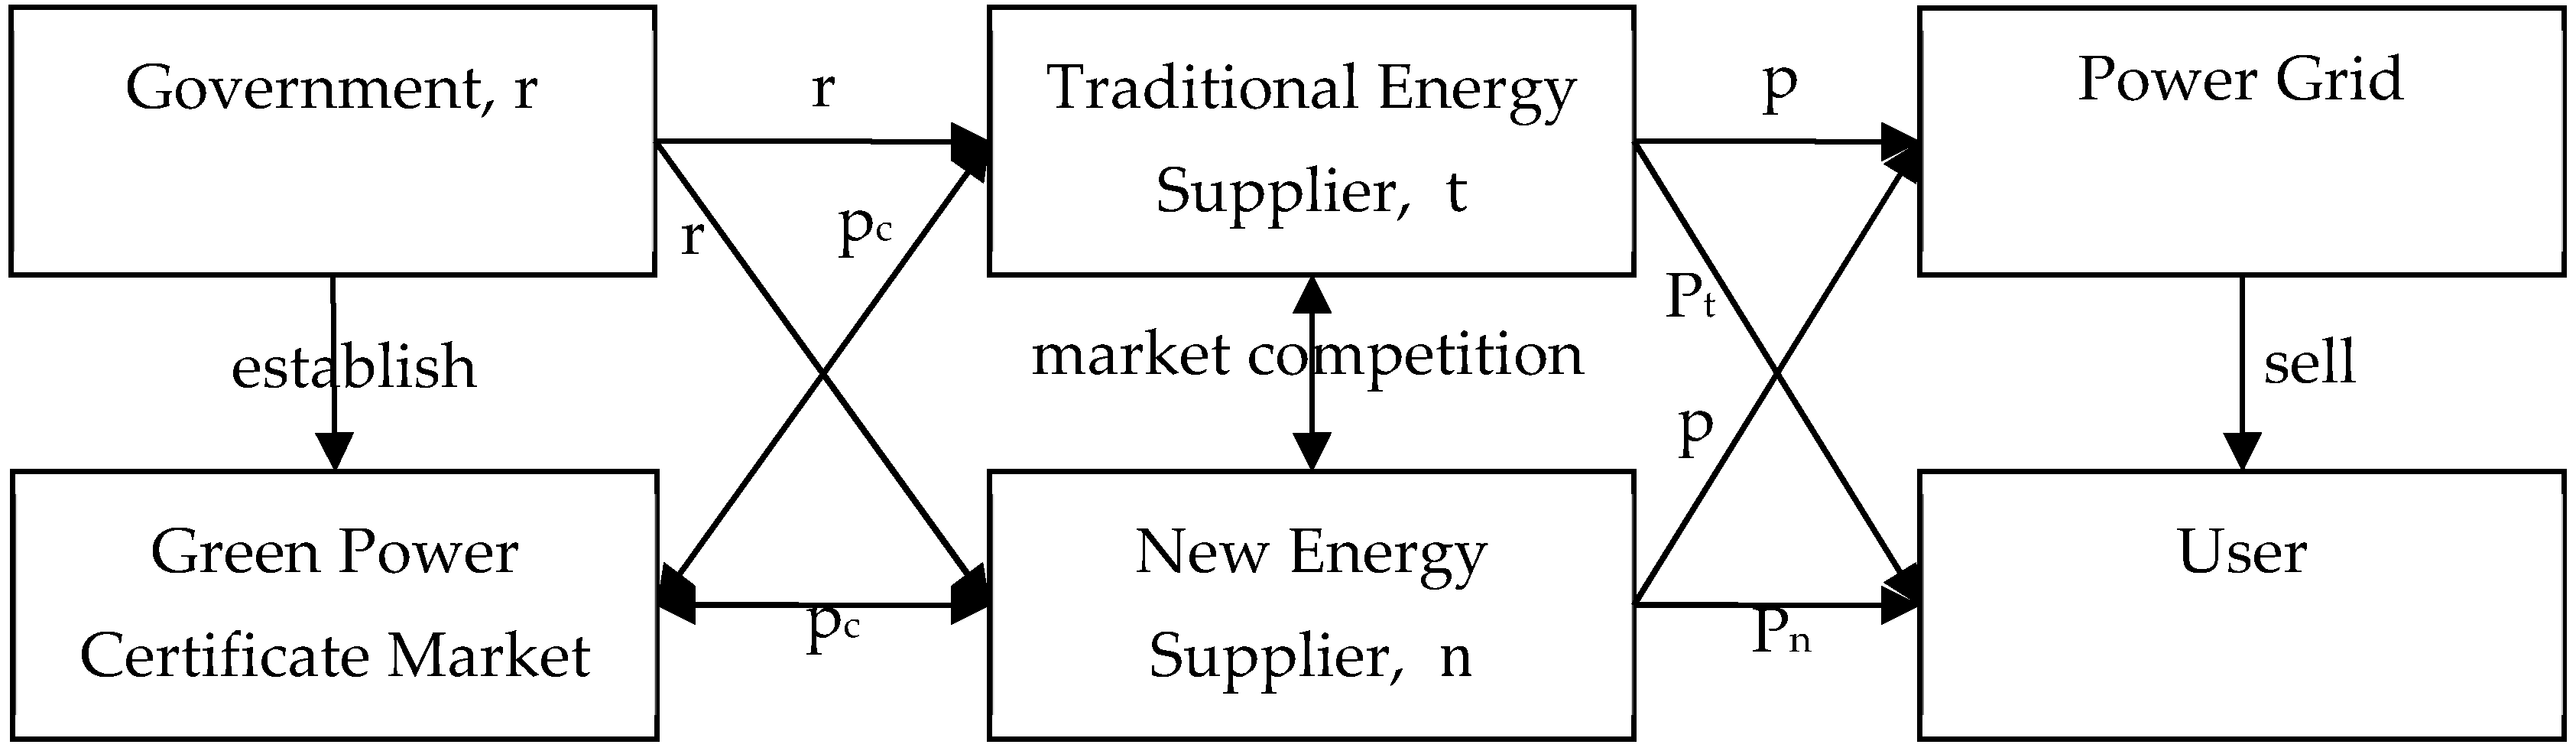
3.1. Model Description

From the perspective of the interest chain, the investment and production of renewable energy power can be divided into four levels: government, investment and production, transaction and consumption and stakeholders. The five stakeholders are the government, traditional energy suppliers, new energy suppliers, power grids and users. The interests in the investment and production of renewable energy power are constantly flowing and conducting among these four levels and five stakeholders, and there are different influences and correlative relations among various factors. Firstly, at the government level: In the case of the reduction of subsidies and feed-in tariffs, in order to improve the utilization rate of renewable energy, the government has established a corresponding renewable energy quota system to urge energy suppliers in a specific region to fulfill the corresponding renewable energy power production quota, r . At the same time, the government has established a green certificate trading system to enable all parties to trade their excess or unfinished renewable energy power in the market at the price of p c ; thus, the market-oriented way is used to compensate for the environmental protection and social value of renewable energy power and to promote the utilization of renewable energy. Secondly, at the investment and production level: Energy suppliers in the market can be divided into traditional energy suppliers and new energy suppliers. Traditional energy suppliers, t , such as China’s five major power generation companies, and national and local energy investment groups, mainly focus on thermal power generation and provide non-renewable energy power. New energy suppliers, n , such as micro-grids, wind power companies, photovoltaic power companies, etc., enter the power market under the reformed power system and through state open market access, mainly producing and providing renewable energy power. Compared with new energy suppliers, traditional energy suppliers have abundant resources, sufficient capital and strong technology in the field of power production, and they are long-established enterprises in the power market. Due to their system and mechanism attributes, their market responses are slow. Compared to their own scale and volume, their new energy businesses have developed relatively slowly. On the contrary, although new energy suppliers are small in scale and volume compared to traditional energy suppliers, their market-oriented operation mechanism is more obvious. They can quickly respond to market demand, engage in the development of new energy projects and actively develop and utilize new energy. In order to compete and gain revenue in the power market, traditional energy suppliers and new energy suppliers decide their own renewable energy technology investments,   l t   and   l n ,   under the government’s renewable energy quota, and then decide their own renewable energy prices, p t and p n , and production quantities, q t and q n . Thirdly, at the market level: traditional energy suppliers and new energy suppliers exchange their own green power certificates according to their production of renewable energy power, and sell or buy green power at the green power certificate price, p c , according to the completion of their quotas to balance the quota, obtain returns (quota exceeding) or avoid punishment (quota unfinished). Fourthly, at the consumption level: traditional energy suppliers and new energy suppliers provide power of q t and q n to users at the prices of p t and p c in the case of a direct power sale, and sell power to large power grids at the price of p in the case of the purchase and sale by large power grids according to l t , l n , q t and q n ; then, the power grids distribute and sell power to users to complete consumption. The investment and production process of renewable energy power is shown in Figure 1.
In the investment and production interest chains of renewable energy, what is the optimal renewable energy investment level, production level and pricing for traditional and new energy suppliers? How do related factors such as renewable energy quotas, investment costs and green power certificate prices affect the investment and production of renewable energy? Meanwhile, what are the problems in the scenarios of direct sale and purchase and sale by power grids? In order to solve these problems, the following model is constructed in this paper.

3.2. Model Hypothesis and Establishment

Hypothesis 1.
In order to improve the utilization of renewable energy, the government has set the renewable energy quota, r; that is, the energy suppliers are required to complete the r proportion of renewable energy power, or to obtain green power certificates of r multiplying the production (1 kW·h of renewable energy power is equal to 1 green power certificate), otherwise the quota will be considered as unfinished. If the energy suppliers cannot meet the renewable energy quota by their own production, they can purchase green power certificates on the green power certificate market to make up their quota, otherwise they will face serious penalties, F.
Hypothesis 2.
This paper assumes an oligopoly market where there are two kinds of suppliers, traditional energy suppliers, t, and new energy suppliers, n. Faced with a renewable energy quota and grid users’ environmental preferences, how do the two kinds of suppliers develop their optimal investment and production strategies, including renewable energy investment, pricing and production? Traditional energy suppliers mainly producing thermal power usually cannot meet the quota, whereas new energy suppliers mainly producing renewable energy power often exceed the quota.
Hypothesis 3.
Based on previous studies, the technology investment cost,  c i , of renewable energy utilization is set as a one-time expenditure, which can be expressed as:
c i ( l i ) = kl i 2
where, l i ( i = t , n ) is the utilization level of renewable energy of energy suppliers, that is, the level of renewable energy power produced by energy suppliers after technology investment ( l i 0 ); k represents the cost elasticity coefficient of the utilization level of renewable energy ( k > 0 ).
Hypothesis 4.
Assume that the green power certificate price is exogenous and  p c > 0 . The energy supplier’s revenue in the green power certificate market is the number of green power certificate transactions multiplied by the green power certificate price. The number of green power certificate transactions of energy suppliers is a supplier’s own renewable energy power production minus the renewable energy quota that needs to be fulfilled. Therefore, the return that energy suppliers   i ( i = t , n ) can obtain from the green power certificate transaction is:
π c ( i ) = ( l i q i rq i ) p c = ( l i r ) q i p c
where q i is the market demand of energy suppliers i ( i = t , n ) . The hidden assumption here is that ( l i r ) q i p c F . If F ( l i r ) q i p c , the penalty fee is too low, and the energy suppliers can fulfill the quota requirement only by paying a penalty fee that is relatively small compared to the returns; as a result, the quota and green power certificate system fails to achieve the effect of encouraging the energy suppliers to improve the utilization of renewable energy. Only when ( l i r ) q i p c F is the optimal choice for energy suppliers to participate in green power certificate trading to obtain green power certificates; thus, the renewable energy quota and green power certificate system can operate normally.
Hypothesis 5.
According to the definition of demand functions in economics, the demand functions of traditional and new energy suppliers can be composed of an initial market share part, price influence part and user preference influence part, which can be expressed as:
{ q t = M t b p t + s p n + b l l t s l l n q n = M n b p n + s p t + b l l n s l l t
where ( p t , p n ) and ( l t , l n ) represent the pricing of energy suppliers and the utilization levels of renewable energy, respectively; M t and M n represent the market influences of energy suppliers at the present stage and M t + M n the total market scale; b and s represent the demand elasticity coefficient and substitution elasticity coefficient of price, respectively; and b l and s l represent the demand elasticity coefficient and substitution elasticity coefficient of the utilization level of renewable energy, respectively.
Hypothesis 6.
Summing up the above, the revenue functions of traditional and new energy suppliers are composed of sales returns, green power certificate returns and the renewable energy technology investment cost, which can be expressed as:
{ π t = p t q t c t q t + ( l t r ) q t p c k l t 2 π n = p n q n c n q n + ( l n r ) q n p c k l n 2
where c t is the unit power cost.

4. Investment and Production Strategy Analysis of Renewable Energy Power under Different Scenarios

A renewable energy power system usually includes four links: power generation, power transmission and transformation, power distribution and power sale. Power generation is mainly made by energy suppliers, and large power grids are responsible for the purchase, transmission, distribution and sale of power. With the reform of power systems in recent years, the link between distribution and sale has been opened up, and market access has been granted to new suppliers. Energy suppliers and other relevant organizations or institutions are allowed to enter the links of generation, distribution and sale to directly produce and sell power, which leads to the coexistence of the direct power sale of power by energy suppliers and the purchase and sale of power by power grids in the current power market. However, the mode of direct power sale only accounts for a small part of the market, whereas the purchase and sale of power by large power grids accounts for the main part in the power distribution and sale market. Therefore, we analyze the investment and production of renewable energy power in the scenarios of direct power sale and purchase and sale by power grids.

4.1. Investment and Production Strategy Analysis of Renewable Energy Power under the Scenario of Direct Sale of Power

Under the background of the power system reform, the state has opened up market access and allowed energy suppliers to participate in power generation, distribution and sale; as a result, the direct sale of power appears. Generally, the scenario of direct sale of power includes the direct power supply for large enterprises, industrial parks and residential areas, as well as various types of micro-grid projects, energy supply projects of featured buildings, comprehensive energy projects and smart energy projects. In the scenario of direct sale of power, the decision-making process in regard to the investment and production of renewable energy power is shown below in Figure 2. Initially, the government formulates renewable energy quota, r . In the first stage of decision-making, traditional energy suppliers, t , and new energy suppliers, n , will decide their own renewable energy utilization levels, l t and l n , according to their own characteristics and planning. In the second stage of decision-making, traditional energy suppliers, t , and new energy suppliers, n , determine their own renewable energy power production, q t and q n , and prices, p t and p n , according to public information such as the levels of renewable energy utilization, l t and l n , in the market. Then, users purchase renewable energy power from energy suppliers at the prices of p t and p n , and the power grid also purchases the power of energy suppliers at a specific price p . In the third stage of decision-making, in the green power certificate trading market, traditional energy suppliers, t , and new energy suppliers, n , formulate their market trading strategies according to their own renewable energy power production, p t and p n , renewable energy quota, r , and green power certificate price, p c .
According to the equilibrium condition, in the second stage, when traditional energy suppliers and new energy suppliers are in equilibrium in a direct power sale market, the first derivative, π t p t and π n p n   are equal to 0. To solve the first derivative, and order π t p t = 0 and π n p n = 0, the value of p t and p n are obtained by solving the simultaneous equations as follows:
{ p t = 2 bM t + sM n + ( 2 bb l ss l 2 b 2 p c ) l t ( 2 bs l b l s + bsp c ) l n + 2 b 2 c t + bsc n + ( 2 b + s ) brp c 4 b 2 s 2 p n = 2 bM n + sM t + ( 2 bb l ss l 2 b 2 p c ) l n ( 2 bs l b l s + bsp c ) l t + 2 b 2 c n + bsc t + ( 2 b + s ) brp c 4 b 2 s 2
Theorem 1.
In the scenario of direct sale of power, the power price of traditional energy suppliers and new energy suppliers will decrease with the increase in their own utilization level of renewable energy. Meanwhile, the power price of traditional energy suppliers and new energy suppliers will decrease with the increase in the utilization level of renewable energy of the other.
Proof of Theorem 1.
 
Taking the derivative of the above equations of p t and p n with respect to l t and l n , the result is:
p t l n = p n l t = 2 bs l + b l s bsp c 4 b 2 s 2 < 0 ,   p t l t = p n l n = 2 bb l ss l 2 b 2 p c 4 b 2 s 2 < 0
Since the demand elasticity is usually larger than the substitution elasticity, the value of the above equation is less than 0. Thus, Theorem 1 is proved. □
When energy suppliers sell power directly in the market, at the beginning stage of the utilization of renewable energy the power price is usually high due to the immature technology, high risks and cost. It can be seen from Theorem 1 that with the improvement of the utilization level of renewable energy, the development of technology and the balance of the cost-benefit of energy suppliers, the power price will be reduced. At the same time, it can be seen from Theorem 1 that in order to gain market share, when an opponent increases its utilization level of renewable energy and lowers the price, one will be encouraged to also improve its utilization level and lower the price to a certain extent.
Then, substituting ( p t , p n ) into the demand function (3), a new demand function ( q t ,   q n ) can be obtained. Substituting the new price equation { p t ( l t , l n ) p n ( l t , l n ) and the new demand function equation { q t ( l t , l n ) q n ( l t , l n ) into the revenue function (4) of energy suppliers, a new revenue function { π t ( l t , l n ) π n ( l t , l n ) can be obtained. According to the equilibrium conditions, when the first stage is in equilibrium, the first derivative of the revenue function is equal to 0, that is, π t l t = π n l n = 0 . Therefore, the renewable energy utilization levels of traditional energy suppliers and new energy suppliers in the first stage of equilibrium can be obtained, and the following theorem can be obtained:
Theorem 2.
In the scenario of direct sale of power, when traditional energy suppliers and new energy suppliers are in equilibrium, the optimal utilization level of renewable energy is ( l t * , l n * ).
Proof of Theorem 2.
See Appendix A. □
For the specific equations of l t * and l n * , see Appendix A Equations (A5) and (A6). l t * and l n * represent the optimal utilization levels of renewable energy in the scenarios of direct power sale by traditional energy suppliers and new energy suppliers, respectively, in the market, that is, the optimal investment levels. It can also be seen from Theorem 2 and the equations of l t * and l n * that traditional energy suppliers and new energy suppliers design and plan their own renewable energy investments to carry out market competition according to the characteristics of their own demand and the user demand. In the direct power sale market, traditional energy suppliers, with their abundant resources and strong technology, can usually obtain better projects to promote their investment in renewable energy, but their own system, efficiency and other factors negatively affect the utilization level of renewable energy. Meanwhile, the high degree of marketization and rapid market response of new energy suppliers are beneficial for promoting the improvement of the utilization level of renewable energy; however, due to their own resources and technology, the lack of resources such as for operation and maintenance in the later period may seriously affect user demand and negatively affect their level of renewable energy. According to Theorem 2, the utilization level of renewable energy of the energy suppliers is not the higher the better, but there is an optimal equilibrium point. The optimal utilization level is affected by factors such as market share, investment cost, production cost, green certificate transaction and competition, and energy suppliers should take these factors into consideration when making investment strategies around renewable energy to obtain the optimal investment level and returns.
Then, substituting the equilibrium results ( l t * , l n * ) of the first stage into the price equation { p t ( l t , l n ) p n ( l t , l n ) , the demand function { q t ( l t , l n ) q n ( l t , l n ) , the optimal pricing ( p t * , p n * ) and the optimal production ( q t * , q n * ) of the energy suppliers in the second stage can be obtained. The following theorem can be obtained:
Theorem 3.
In the scenario of direct sale of power, when the competition among traditional energy suppliers and new energy suppliers reaches a balance, the optimal pricing is  ( p t * , p n * ) and the optimal production is ( q t * , q n * ) .
Proof of Theorem 3.
See Appendix B. □
For the specific equations of ( p t * , p n * ) and ( q t * , q n * ) , see Appendix B Equations (A7)–(A10). ( p t * , p n * ) and ( q t * , q n * ) represent the optimal pricing level and the optimal production level, respectively, in the scenario of direct sale of power by traditional energy suppliers and the new energy suppliers in the market. From Theorem 3 and the equations of ( p t * , p n * ) and ( q t * , q n * ) , it can be seen that traditional energy suppliers and new energy suppliers set appropriate prices and production according to their own characteristics and the characteristics of competitors to compete in their own target market and provide power to gain profits. The optimal pricing and production of energy suppliers are affected by factors such as market share, investment cost, production cost, substitution rate and green power certificate price. Energy suppliers should integrate these factors to determine the optimal price and production to carry out competitions. At the same time, it can be seen from Theorem 3 and the above equations that the larger b l is, the greater the user demand for renewable energy-related technologies. Therefore, the higher the utilization level of renewable energy of the energy suppliers, the more market demand and projects can be obtained, that is, the more renewable energy power production can be obtained. With the needs of low-carbon economic transformation and sustainable development, user demand for renewable energy will be higher and higher. Energy suppliers should improve their own utilization level of renewable energy and improve their own renewable energy power production while meeting the needs of users to obtain more benefits.

4.2. Investment and Production Strategy Analysis of Renewable Energy Power under the Scenario of Purchase and Sale by Power Grids

The traditional operation mode of the power market is that the large power grids purchase power from energy suppliers and then distribute and sell power to users. Although the reform of the power market allows relevant enterprises to enter the distribution and sale link, under the current system, it is mainly the large power grids that carry out the unified purchase, distribution and sale. As state-owned units, large power grids have strong institutional attributes and social responsibilities. In order to implement and respond to the country’s green and low-carbon transformation and promote the adjustment of the energy structure, they emphasize the priority of guaranteeing the purchase of renewable energy power when purchasing power, and some regions even emphasize the full purchase of renewable energy power. Different from emphasizing the competition on price in the direct power sale market, the power purchase by power grids emphasizes the high demand for renewable energy power, which has important impacts on the investment and production of the renewable energy of energy suppliers.
In the scenario of purchase and sale by power grids, the power purchased is a single product and there is only a single purchaser; thus, the price is the same, that is, p t = p n = p . At this time, the demand function becomes:
{ q t = M t b p + s p + b l l t s l l n q n = M n b p + s p + b l l n s l l t
The revenue function becomes:
{ π t = p q t c t q t + ( l t r ) q t p c k l t 2 π n = p q n c n q n + ( l n r ) q n p c k l n 2
Through the above analysis and hypothesis, it can be seen that in the scenario of purchase and sale by power grids, energy suppliers mainly decide the utilization level and production level of renewable energy. When the utilization level of renewable energy in the first stage is in equilibrium, the first-order conditions π t l t = 0 and π n l n = 0 are true, and when solving the revenue function with respect to the utilization levels of renewable energy l t and l n , the results are as follows:
pb l c t b l + ( M t bp + sp ) p c + 2 ( b l p c k ) l t s l p c l n b l rp c = 0
pb l c n b l + ( M n bp + sp ) p c + 2 ( b l p c k ) l n s l p c l t b l rp c = 0
Solving the above simultaneous equations can obtain:
Theorem 4.
In the scenario of purchase and sale by power grids, the optimal utilization levels of renewable energy of traditional energy suppliers and new energy suppliers are:
l t * = [ pb l c t b l + ( M t bp + sp ) p c b l rp c ] 2 ( b l p c k ) + [ pb l c n b l + ( M n bp + sp ) p c b l rp c ] s l p c s l 2 p c 2 4 ( b l p c k ) 2  
l n * = [ pb l c t b l + ( M t bp + sp ) p c b l rp c ] s l p c + [ pb l c n b l + ( M n bp + sp ) p c b l rp c ] 2 ( b l p c k ) s l 2 p c 2 4 ( b l p c k ) 2
The optimal production levels are:
q t * = M t ( b s ) p + [ pb l c t b l + ( M t bp + sp ) p c b l rp c ] [ 2 ( b l p c k ) b l s l 2 p c ] s l 2 p c 2 4 ( b l p c k ) 2 + [ pb l c n b l + ( M n bp + sp ) p c b l rp c ] ( 2 k b l s l p c ) s l 2 p c 2 4 ( b l p c k ) 2
q n * = M n ( b s ) p + [ pb l c n b l + ( M n bp + sp ) p c b l rp c ] [ 2 ( b l p c k ) b l s l 2 p c ] s l 2 p c 2 4 ( b l p c k ) 2 + [ pb l c t b l + ( M t bp + sp ) p c b l rp c ] ( 2 k b l s l p c ) s l 2 p c 2 4 ( b l p c k ) 2
Proof of Theorem 4. 
 
The optimal utilization levels of renewable energy, l t and l n , can be obtained by combining π t l t = 0 and π n l n = 0 , and q t and q n can be obtained by substituting l t and l n into the demand function. Theorem 4 is proved. □
The optimal investment levels and production levels of renewable energy of traditional energy suppliers and new energy suppliers are represented by l t and l n , and q t and q n ,   respectively ,   under the scenario of purchase and sale by power grids. It can be seen from Theorem 4 that the optimal investment and production of renewable energy for energy suppliers are affected by the renewable energy quota, power price, cost, green power certificate price and other factors. In particular, the multiple occurrences of green power certificate price in the above equations reflects its significant influence. The possible reason behind this is that the utilization and investment of renewable energy are still at the beginning stage, thus it is difficult to balance the investment risks and returns. However, government subsidies for renewable energy have declined in recent years as the government has encouraged market-oriented approaches to balance the returns. In this case, in order to balance the returns of renewable energy, the green power certificate trading can well supplement the investment cost of renewable energy for energy suppliers, which is beneficial for balancing the benefits of energy suppliers and motivating energy suppliers to invest in renewable energy. Meanwhile, in practice, wind and solar abandonment phenomena are common in some regions, and some regions even have the extreme situation that the complete use of renewable energy leads to the shutdown of all thermal power plants. It can be seen from Theorem 4 that, in the case where the large grids give priority to the purchase of renewable energy power, energy suppliers will invest and produce a large amount of renewable energy in order to maximize profits. At the same time, more investment and production are not always better. There is an optimal investment boundary for the investment and production of renewable energy. Energy suppliers should make the optimal investment level and production level of renewable energy based on the comprehensive consideration of various factors such as the renewable energy quota and green power certificate price.
Proposition 1.
In the scenario of purchase and sale by power grids, when  ( 2 b l p c + 2 k s l p c ) b l p c s l 2 p c 2 4 ( b l p c k ) 2 is less than 0, the energy suppliers will reduce the utilization level of renewable energy with the increase in the renewable energy quota; when ( 2 b l p c + 2 k s l p c ) b l p c s l 2 p c 2 4 ( b l p c k ) 2 is greater than 0, the energy suppliers will increase the utilization level of renewable energy with the increase in the renewable energy quota.
Proof of Proposition 1.
 
Taking the derivative of renewable energy utilization levels,   l t   and   l n , with respect to r, the result is:
l t r = l n r = 2 ( b l p c k ) b l p c b l p c s l p c s l 2 p c 2 4 ( b l p c k ) 2 = ( 2 b l p c + 2 k s l p c ) b l p c s l 2 p c 2 4 ( b l p c k ) 2
According to the above equation, when ( 2 b l p c + 2 k s l p c ) b l p c s l 2 p c 2 4 ( b l p c k ) 2 is less than 0, quota r is negatively correlated with the utilization levels of renewable energy l t and l n ; when ( 2 b l p c + 2 k s l p c ) b l p c s l 2 p c 2 4 ( b l p c k ) 2 is greater than 0, quota r is positively correlated with the utilization levels of renewable energy l t and l n . Proposition 1 is proved. □
It can be seen from Proposition 1 that at the beginning of the utilization of renewable energy, the investment cost, k, is high, and the green power certificate price, p c , is low. When ( 2 b l p c + 2 k s l p c ) b l p c s l 2 p c 2 4 ( b l p c k ) 2 is less than zero, the quota is negatively correlated with renewable energy; therefore, in order to promote the utilization of renewable energy, the government and relevant departments should appropriately control the renewable energy quota and green power certificate price to encourage energy suppliers to utilize renewable energy.
With the development of the utilization of renewable energy, the investment cost, k, decreases and the green power certificate price, p c , increases. When ( 2 b l p c + 2 k s l p c ) b l p c s l 2 p c 2 4 ( b l p c k ) 2 is greater than 0, the quota, r, is positively correlated with the utilization levels of renewable energy, l t and l n ; therefore, the government and relevant departments can improve the utilization and development of renewable energy by increasing the renewable energy quota and green power certificate price.
Proposition 2.
In the case that other parameters remain unchanged, with the change of the investment cost, green power certificate price and user preference, the relationship between market share difference and the utilization level difference of renewable energy is as follows:
When ( 2 b l p c 2 k + s l p c ) < 0 , ( M t M n ) is negatively correlated with ( l t l n ) ;
When ( 2 b l p c 2 k + s l p c ) > 0 , ( M t M n ) is positively correlated with ( l t l n ) ;
When ( 2 b l p c 2 k + s l p c ) = 0 , ( M t M n ) and ( l t l n ) have no direct correlation.
Proof of Proposition 2.
 
Subtracting the above π t l t = 0 and π n l n = 0 , the result is:
c t b l + c n b l + ( M t M n ) p c + ( 2 b l p c 2 k + s l p c ) ( l t l n ) = 0
When energy suppliers use the same power generation mode, their costs are approximately equal, that is, c t c n . In order to highlight the analysis of the utilization of renewable energy, the above equation can be simplified to:
( M t M n ) p c = ( 2 b l p c 2 k + s l p c ) ( l t l n )
According to the above equation, the relation between ( M t M n ) and ( l t l n ) changes as the value of ( 2 b l p c 2 k + s l p c ) changes. Proposition 2 is proved. □
It can be seen from Proposition 2 that there may be an inconsistency between the utilization level of renewable energy of energy suppliers and their market share, The utilization level of energy suppliers is mainly affected by the cost of technology investment and green power certificate price. In practice, although the market share of new energy suppliers is smaller than that of traditional energy suppliers, the utilization level of renewable energy of new energy suppliers is relatively higher than that of traditional energy suppliers. In addition to the renewable energy technology and risks, the possible reason behind this is that the traditional energy suppliers enter the market early, possessing a quality power supply and generation projects, as well as stable returns, and thus lack the incentive to invest in renewable energy, whereas to compare with the relatively saturated thermal power market, new energy companies emerging from the renewable energy power market, as new entrants in the market, have to improve the utilization of renewable energy to gain profits. Given the current cost and returns of renewable energy, it may indeed be uneconomic to make decisions from the perspective of self-interest maximization, but from the perspective of social responsibility, large enterprises should take more responsibility. It is suggested that relevant government departments should adopt corresponding strategies to encourage large enterprises to improve their own utilization level of renewable energy.
On the basis of Proposition 2, Corollary 1 is obtained to elaborate the impacts of relevant factors on the utilization of renewable energy.
Corollary 1.
When ( M t M n ) is negatively correlated with ( l t l n ) , the difference in the utilization level among energy suppliers in renewable energy, | l t l n | , will decrease with the increase in users’ preference for renewable energy, b l , and green power certificate price, p c , and will increase with the increase in the renewable energy investment cost coefficient, k.
When ( M t M n ) is positively correlated with ( l t l n ) ,the difference of the utilization level among energy suppliers in renewable energy, | l t l n | , will increase with the increase in users’ preference for renewable energy, b l , and green power certificate price, p c ,and will decrease with the increase in the renewable energy investment cost coefficient, k.
Proof of Corollary 1.
 
In order to explore the change of values, both sides of the equation of Proposition 1 are changed into absolute values, where the result is:
| M t M n | p c = | 2 b l p c 2 k + s l p c | | l t l n |
When ( M t M n ) is negatively correlated with ( l t l n ) , there is the result of ( 2 b l p c 2 k + s l p c ) < 0 . Then ,   | 2 b l p c 2 k + s l p c | will increase with the increase in b l and p c , whereas | l t l n | will decrease to ensure Equation (18) holds; | 2 b l p c 2 k + s l p c | will decrease with the increase in k, whereas | l t l n | will increase. At this time, the effect of price p c is less than the effect of the cost k and the | M t M n | market share difference changes in the opposite direction.
When ( M t M n ) is positively correlated with ( l t l n ) , there is the result of ( 2 b l p c 2 k + s l p c ) > 0 . This   means   that   | 2 b l p c 2 k + s l p c | will decrease with the increase in b l   and p c , whereas | l t l n | will increase to ensure the Equation (18) holds; | 2 b l p c 2 k + s l p c | will increase with the increase in k, whereas | l t l n | will decrease. At this time, the effect of price p c is greater than the effect of the cost k and the | M t M n | market share difference changes in the same direction. Corollary 1 is proved. □
According to Corollary 1, in the early stage of the utilization of renewable energy, when ( M t M n ) is negatively correlated with ( l t l n ) , the impact of green power certificate price p c is less than the impact of the technology investment cost k ; that is, the impact of return acquisition is less than the impact of balancing the cost of development risks. In the early stage of the utilization of renewable energy, if more relevant policies are inclined to the utilization of renewable energy, traditional energy suppliers will also increase their investment in renewable energy, thus expanding the market share gap ( M t M n ) . If green power certificate price p c is high, the cost of purchasing green power certificates will increase, which will also encourage traditional energy suppliers to increase their investment in renewable energy, expand their market share and reduce their own cost. At this point, if the investment cost of renewable energy is low, traditional energy suppliers have more incentive to invest than new energy suppliers, thus expanding the market share gap ( M t M n ) .
With the development of the utilization of renewable energy, when ( M t M n ) is positively correlated with ( l t l n ) , the impact of green power certificate price p c is greater than the impact of the technology investment cost k; that is, the impact of increasing returns is greater than the impact of balancing cost. With the development of renewable energy, if more relevant policies are inclined to the utilization of renewable energy, new energy suppliers will increase their investment in renewable energy, thus narrowing the market share gap ( M t M n ) . If green power certificate price p c is high, the return of selling green power certificates will increase, which will also encourage new suppliers to increase their investment in renewable energy, expand their market share and increase their own return. At this point, if the investment cost of renewable energy is low, new energy suppliers have more incentive to invest than traditional energy suppliers, thus narrowing the market share ( M t M n ) .

5. Numerical Analysis

Assume that there are five stakeholders in the regional power market: the government, traditional energy suppliers, new energy suppliers, power grids and users. Under the scenario of direct sale of power, the initial market shares of traditional energy suppliers, t, and new energy suppliers, n, are M t = 20   and   M n = 10 , respectively; under the scenario of purchase and sale by large power grids, their initial market shares are M t = 35   and   M n = 10 ,   respectively , and their costs are c t = 3.5   and   c n = 4 , respectively. In addition, assume that the elasticity coefficient of cost, price demand, price substitution, preference demand and preference substitution of the utilization of renewable energy are k = 2 , b = 1 , s = 2 , b l = 2 and s l = 0.5 , respectively, that the initial quota, green power certificate price and purchase price of large power grids are r = 1.5, p c = 1 and p = 4, respectively, that the value of the quota, r, changes between 0.1 and 0.9 and that the value of the green power certificate price changes between 0.1 and 0.5 in order to analyze the impact of the changes of the quota and green power certificate price. Numerical calculations are carried out based on the above formula and MATLAB, and the specific numerical calculation results are shown in the following charts and figures. Next, this paper will further analyze the impact of different factors on the investment and production of renewable energy.

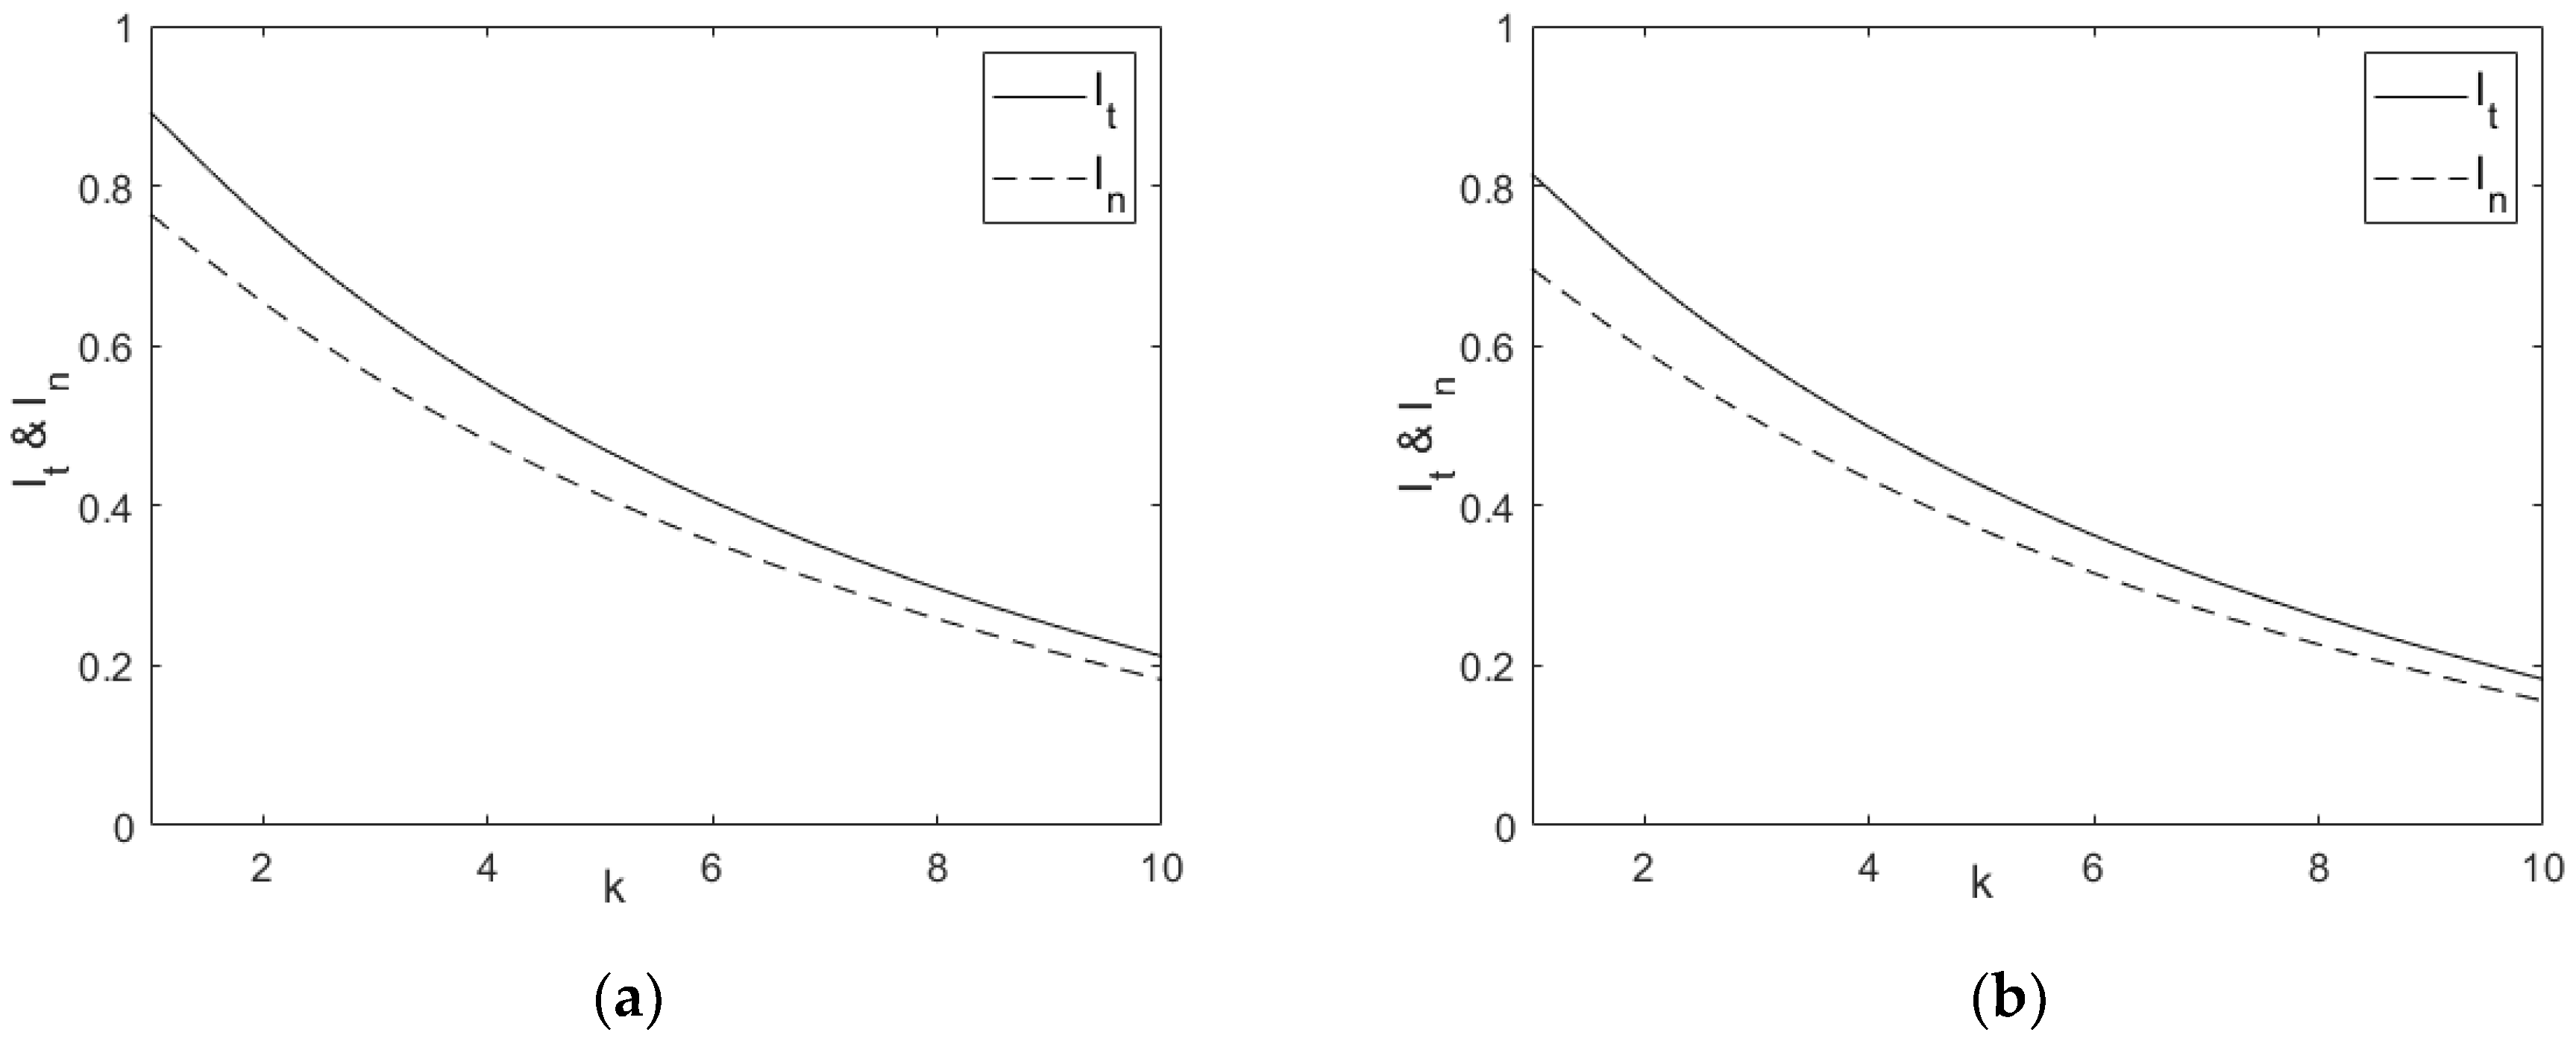
5.1. Impact of Quota Changes on the Investment and Production of Renewable Energy

In order to further analyze the impact of quota changes on the investment and production of renewable energy, Table 1 was determined by using MATLAB based on the above formulas and initial values. As Table 1 shows, the utilization levels of renewable energy, l t and l n , increase with the increase in the quota, which shows that the quota has a positive role in promoting the utilization levels of renewable energy of energy suppliers. It can also be seen from Table 2 that although the renewable energy utilization level of traditional energy suppliers l t has increased, it has not reached a high proportion. The possible reason behind this is that newly-added renewable energy is mainly an incremental part of the power market, and the newly-added market scale is relatively limited compared to the existing traditional power market scale; therefore, the proportion of renewable energy is relatively small. Unless the existing market scale is transformed and replaced by renewable energy, the development of renewable energy will be relatively limited. However, the transformation and replacement of the existing market scale will bring great economic efficiency loss and cost, and thus it is necessary to trade off comprehensively. The power prices, p t and p n , decrease with the increase in the quota. The possible reason behind this is that the increase in the quota results from the development of technology, which affects the decline in p t   and   p n .The power quantities ,   q t   and   q n , increase with the increase in the quota. The possible reason behind this is that energy suppliers will increase the investment in renewable energy to meet the quota, leading to production growth. With the increase in the quota, π t rises first and then falls. The possible reason behind this is that at the beginning stage of the increase in the quota, traditional energy suppliers can accomplish certain quota requirements; therefore, they can still gain profits despite the fact that the price falls with the increase in production. However, when the quota increases to a certain extent, traditional energy suppliers cannot complete the quota requirements; as a result, the profits decrease under the penalties or the huge cost of buying green power certificates to make up for the quota. It can be seen that the quota has an optimal boundary for traditional energy suppliers. Therefore, in order to achieve the optimal interests of all parties, the government should adjust the quota according to the circumstances. With the increase in the quota, π n keeps increasing and the speed keeps getting faster. The possible reason behind this is that the output increases with the increase in the quota, and the bigger the quota is, the more benefits new energy suppliers can obtain in the green power certificate market, which further improves their profits. Table 1 also indicates that the impact of the quota changes on the scenario of purchase and sale by large power grids is greater than that on the scenario of direct power sale. The possible reason behind this is that large power grids are generally state-owned units with strong system attributes, and quotas are the means of government regulation; therefore, compared with the market, they will be more positive at promoting the utilization of renewable energy in order to respond to and complete the government’s requirements. In addition, it also shows that with the increase in the quota and renewable energy, the gap between the scale of direct power sale q t + q n   and the scale of purchase and sale by large power grids q t + q n is also relatively narrowed, which is also the result of the adjustment of the energy structure and the reform of the power system. As can be seen from the above, the quota has a significant impact on the price, production and revenue of energy suppliers. From the perspective of energy suppliers, in order to obtain benefits and long-term development, energy suppliers should timely adjust their strategies according to the changes of government quota policies. From the perspective of the government, in order to improve the utilization of renewable energy, appropriate quota policies should be formulated according to the market conditions to promote the structural adjustment of the energy system and the green and low-carbon transition.

5.2. Impact of Green Power Certificate Price on the Investment and Production of Renewable Energy

In order to further analyze the impact of the green power certificate price on the investment and production of renewable energy, Table 2 was determined by using MATLAB based on the above formulas and the values of parameters. Table 2 shows that the utilization levels of renewable energy, l t and l n ,   increase with the increase in the green power certificate price, which shows that the transaction price of the green power certificate has a positive relationship with the level of renewable energy utilization. The renewable energy utilization level of traditional energy suppliers l t increases slowly at first and then fast. The possible reason behind this is that when the green power certificate price is lower than the cost, compared with self-production, it is more economical for traditional energy suppliers to buy the green power certificate; when the price is higher than the cost, it is more economical to produce by themselves. The possible reason why l n increases relatively fast is that the increase in the green power certificate price can bring more interests, thus promoting new energy suppliers to increase the investment and production of renewable energy. With the increase in the green power certificate price, p t and p n decrease, but p n decreases more. The reason is that with the increase in the green power certificate price, new energy suppliers obtain more benefits from the green power certificate market to subsidize the cost and expense of their investment, which is conducive to their price reduction. With the increase in the green power certificate price, q t and q n increase, but q n grows faster. The possible reason is that the benefits brought by the increase in the green power certificate price encourage new energy suppliers to increase their investment and production of renewable energy. With the increase in the green power certificate price, π t rises first and then falls. The possible reason is that with the increase in the green power certificate price, traditional energy suppliers increase the production of renewable energy at the beginning, but when the green power certificate price reaches a certain level, in order to fulfill the quota requirements, they need to purchase a large number of green power certificates from the market, leading to the decline in benefits. With the increase in the green power certificate price, π n keeps increasing because of the interests gained from the increasing production of renewable energy and from the green power certificate market. Table 2 also indicates that the impact of the green power certificate price on the scenario of direct power sale is greater than that on the scenario of purchase and sale by large power grids. The possible reason is that the green power certificate system, as a market-oriented system, directly affects the market behaviors of energy suppliers; thus, its impact is greater in the scenario of direct power sale. With the increase in the green power certificate price, the gap between the scale of direct power sale q t + q n and the scale of purchase and sale by large power grids q t + q n is also relatively narrowed. The reason is that the green power certificate, as an important means of power market reform, has a significant impact on the power market and is conducive to promoting the development of renewable energy utilization. As can be seen from the above, the green power certificate transaction has a significant impact on the renewable energy utilization level, price and production of energy suppliers. From the perspective of energy suppliers, in order to balance the costs and benefits of renewable energy project development, they can actively participate in the transaction of green power certificates. From the perspective of the government, the cost and risk of renewable energy utilization can be compensated in a market-oriented way through the construction and promotion of the green power certificate trading market that promotes the development of renewable energy utilization and reduces the subsidy burden of government renewable energy. By comparing Table 1 and Table 2, it can be seen that compared with the green power certificate price, the impact of the quota on the investment and production of renewable energy is greater than that of the green power certificate. The possible reason is that the quota, as a required indicator of the government, has a greater impact on energy suppliers than the market-oriented characteristics of the green power certificate.

5.3. Impact of Technology Cost and User Preference on the Investment and Production of Renewable Energy

In order to further analyze the impact of the technology cost of renewable energy and user preference on the investment and production of renewable energy, Figure 3 and Figure 4 were drawn based on the above formulas and values. As Figure 3 shows, l t and l n increase with the decline in the technology cost coefficient k, and when k drops to a certain degree, l t and l n increase faster. The possible reason is that at the initial stage, the technological level of renewable energy is low whereas the cost is high. The increase in the technological level and the decrease in the cost can improve the investment of energy suppliers in renewable energy to a certain extent. It can be seen from the above that the technology cost of renewable energy on the supply side directly affects the utilization level of renewable energy. Therefore, when the technological level of renewable energy develops to a certain stage and the technology cost decreases to a certain degree, the energy suppliers investing in renewable energy face less risk and cost, leading energy suppliers to further increase investment in the utilization and production of renewable energy. Therefore, it is necessary to consider the technological level and cost of renewable energy when formulating policies to promote renewable energy, otherwise the policy effect will not be satisfactory and will not be carried out smoothly, and it may bring profit losses to energy suppliers. Figure 4 shows that the utilization levels of renewable energy l t and l n increase with the increase in user preference. The l t and l n increase at an accelerated rate in the scenario of direct power sale while increasing at a decelerating rate in the scenario of purchase and sale by large power grids. The possible reason is that in the scenario of purchase and sale by large power grids, a unified purchase and sale can cause a large number of energy suppliers to make a centralized decision and cause a rapid response; therefore, rapid changes can be witnessed in the initial stage. Due to the relatively decentralized decision-making of energy suppliers in the scenario of direct power sale, the initial impact is smaller than that of the purchase and sale by large power grids. With the increase in user preferences, the scope and depth of the impact on energy suppliers will be deepened, which will accelerate the improvement of renewable energy utilization levels of energy suppliers in the scenario of direct power sale. It can be seen from the above that the user preference on the demand side has a positive impact on the utilization of renewable energy. Therefore, in the background of the power system reform, in order to improve the utilization level of renewable energy it is necessary not only to improve the technological level of renewable energy utilization and reduce the technology cost, but also to enhance the publicity and guidance according to the circumstances to cultivate the user preference for renewable energy and to promote the development of renewable energy.

6. Discussion

In order to study how the renewable energy quota and green power certificate system affect the behavior and strategies of energy suppliers, this paper was carried out by constructing a multi-stage game model. Through the calculation of the model, the market competition strategies of traditional energy suppliers and new energy suppliers in equilibrium were obtained. Through the derivation and analysis of the model, the impact of the renewable energy quota, investment cost, green power certificate price and user preference on renewable energy power investment and production of energy suppliers was analyzed. At the same time, numerical analysis was used to analyze the impact of the changes of the renewable energy quota, technology cost, green power certificate price and user preference on the price, production and revenue of energy suppliers.
Previous studies from the perspective of technology mainly focused on the investment and production technology of renewable energy power [27,28]. Previous studies from the perspective of the economy and management mainly focused on the impact of individual policies on renewable energy power investment and production [34,35,36,37,38,39]. Compared with previous studies focusing on technology and individual policies, this paper started from the renewable energy interest chain and stakeholders. It was conducive to analyze the behavior of stakeholders in the renewable energy interest chain and balance the benefits of all stakeholders. At the same time, the paper better analyzed the impact of the renewable energy quota and green power certificate system on the price, production, revenue and renewable energy utilization level of energy suppliers. It was not only conducive to explore the effects of policies and the behavior of energy suppliers, but also conducive to analyze the changes of the energy structure and energy market share.
The multi-stage game model based on the renewable energy interest chain and stakeholders was conducive to analyze the interaction and relationship among government policy, the green power certificate market and energy suppliers’ strategies from an overall perspective. However, because the model involves multiple decision-making stages and multiple stakeholders, it was not conducive to a more detailed analysis of the behavior of a single stakeholder and the impact of a single policy. It can be seen that the in-depth and comprehensive research on individual stakeholders and individual policies is also very valuable.

7. Conclusions

This paper has discussed the investment and production of renewable energy under the quota and green power certificate system, and has drawn some interesting conclusions. Firstly, this paper proposed that the government, traditional energy suppliers, new energy suppliers, power grid companies and users are the main participants in the renewable energy interest chain, and analyzed their respective characteristics and interest requirements. Secondly, based on the demand function, revenue function and cost function of each party, this paper calculated and analyzed the renewable energy utilization level of traditional energy suppliers and new energy suppliers in equilibrium under the scenario of direct power sale and the scenario of purchase and sale by power grids, and calculated and analyzed the optimal pricing, optimal production and income of each party at this time. It was found that the quota, green power certificate price, technology cost coefficient and elasticity coefficients have an important impact on the utilization level, pricing, investment and production of renewable energy. Then, it was analyzed and proved that the utilization level of renewable energy is negatively correlated with pricing; the positive correlation between the quota and the utilization level of renewable energy is affected by relevant conditions; and the changes in the technology cost of renewable energy and green power certificate price affect the change in the relationship between the market share difference and the utilization level difference of renewable energy. It was found that in the initial stage of renewable energy utilization, compared with their market share and scale, traditional energy suppliers have a low utilization level of renewable energy and lack of enthusiasm. Therefore, it is suggested that the government should take corresponding measures to urge large enterprises to take more social responsibilities. In the later stages of renewable energy utilization, the decrease in the cost and the development of the green power certificate market will promote the investment and production of renewable energy to a higher equilibrium level. In the end, we further analyzed the effects of the quota, green power certificate price, technology cost and user preference on the investment and production of renewable energy through numerical analysis. It was found that the renewable energy quota plays a positive role in promoting the utilization of renewable energy. At the same time, the quota of renewable energy has an optimal boundary, which is affected by the scale of the incremental market and the traditional market. The transaction price of the green power certificate also has a positive impact on the utilization of renewable energy. There is also an optimal boundary of green power certificate price, which is affected by the power cost. Therefore, in order to promote the development of renewable energy utilization under the background of power market reform, it is necessary to formulate an appropriate quota and green power certificate trading scheme according to relevant factors. At the same time, it was also found that the reduction in technology cost has a direct impact on the improvement of the utilization level of renewable energy, and the rise of user preference has a positive impact on the utilization of renewable energy. Therefore, in order to promote the development of renewable energy, attention should be paid to improving the technological level of renewable energy and reducing the technology cost of renewable energy, and publicity and guidance should be enhanced to cultivate user preference for renewable energy. These findings provide important references for decisions and actions of all parties in the renewable energy interest chain.

Author Contributions

Conceptualization, M.S. and Y.W.; methodology, Y.L.; software, M.S.; validation, M.S., Y.W. and Y.L.; formal analysis, Y.W.; investigation, M.S.; resources, Y.W.; data curation, M.S.; writing—original draft preparation, Y.W.; writing—review and editing, M.S.; visualization, M.S.; supervision, M.S.; project administration, Y.W.; funding acquisition, Y.L. All authors have read and agreed to the published version of the manuscript.

Funding

This research was funded by The National Social Science Fund of China, grant number 17ZDA065.

Conflicts of Interest

The authors declare no conflict of interest.

Nomenclature

Abbreviations and acronyms
r Renewable energy quota
F Penalty fee for not fulfilling the quota
t Traditional energy supplier
n New energy supplier
Functions and variables
l t Utilization level of renewable energy of traditional energy supplier
l n Utilization level of renewable energy of new energy supplier
q t Market demand of traditional energy supplier (100 billion kW·h)
q n Market demand of new energy supplier (100 billion kW·h)
p t Price of traditional energy supplier (0.1 CNY/kW·h)
p n Price of new energy supplier (0.1 CNY/kW·h)
p Purchase price of power grid (0.1 CNY/kW·h)
p c Green power certificate price (0.1 CNY/kW·h)
c t Cost of traditional energy supplier (0.1 CNY/kW·h)
c n Cost of new energy supplier (0.1 CNY/kW·h)
M t Market influences of traditional energy supplier (100 billion kW·h)
M n Market influences of new energy supplier (100 billion kW·h)
π t Revenue of traditional energy supplier (10 billion CNY)
π n Revenue of new energy supplier (10 billion CNY)
Parameters
k Cost elasticity coefficient of the utilization level of renewable energy
b Demand elasticity coefficient of price
s Substitution elasticity coefficient of price
b l Demand elasticity coefficient of the utilization level of renewable energy
s l Substitution elasticity coefficient of the utilization level of renewable energy

Appendix A. Proof of Theorem 2

By substituting Equation (5), ( p t , p n ) , into the demand function (3), the new demand function is gained as follows:
{ q t = 2 b 2 M t + b s M n + b 2 b b 1 s s 1 + 2 b 2 p c s 2 p c l t + b 2 b s 1 + b 1 s b s p c l n 2 b 2 s 2 b c t + b 2 s c n ( b s ) ( 2 b + s ) b r p c 4 b 2 s 2 q n = 2 b 2 M n + b s M t + b 2 b b 1 s s 1 + 2 b 2 p c s 2 p c l n + b 2 b 1 + b 1 s b s p c l t 2 b 2 s 2 b c n + b 2 s c t ( b s ) ( 2 b + s ) b r p c 4 b 2 s 2
In order to solve the utilization level of renewable energy in the first stage where traditional energy suppliers and new energy suppliers are in equilibrium, substitute { p t ( l t , l n ) p n ( l t , l n ) and { q t ( l t , l n ) q n ( l t , l n ) into the revenue function (4) of energy suppliers to solve the optimal investment strategies. It can be obtained from the equilibrium condition that in the first stage of equilibrium, π t l t = π n l n = 0 , thus the result can be gained by solving the revenue function:
{ π t l t = p t l t q t + p t q t l t c t q t l t + q t p c + ( l t r ) p c q t l t 2 k l t = 0 π n l n = p n l n q n + p n q n l n c n q n l n + q n p c + ( l n r ) p c q n l n 2 k l n = 0
Substituting { p t ( l t , l n ) p n ( l t , l n ) and { q t ( l t , l n ) q n ( l t , l n ) into the above equations, we can obtain π t l t = π n l n = 0 , which can be respectively expressed as:
2 b 2 M t + bsM n + b ( 2 bb l ss l + 2 b 2 p c s 2 p c ) l t + b ( 2 bs l + b l s bsp c ) l n ( 2 b 2 s 2 ) bc t + b 2 sc n ( b s ) ( 2 b + s ) brp c 4 b 2 s 2      2 2 bb l ss l + 2 b 2 p c s 2 p c 4 b 2 s 2 2 kl t = 0
2 b 2 M n + bsM t + b ( 2 bb l ss l + 2 b 2 p c s 2 p c ) l n + b ( 2 bs l + b l s bsp c ) l t ( 2 b 2 s 2 ) bc n + b 2 sc t ( b s ) ( 2 b + s ) brp c 4 b 2 s 2      2 2 bb l ss l + 2 b 2 p c s 2 p c 4 b 2 s 2 2 kl n = 0
Solving the above equations, we can obtain:
l t * = 2 bb 1 ss l + 2 b 2 p c s 2 p c 2 b 4 b 2 s 2 k 2 bb 1 ss l + 2 b 2 p c s 2 p c 2 b 2 M t + bsM n 2 b 2 s 2 bc t + b 2 sc n ( b s ) ( 2 b + s ) brp c 2 bb 1 ss l + 2 b 2 p c s 2 p c 2 b 4 b 2 s 2 k 2 2 bb 1 ss 1 + 2 b 2 p c s 2 p c 2 b 2 2 bs l + b 1 s bsp c 2 + ( 2 bb l ss l + 2 b 2 p c s 2 p c ) 2 b ( 2 bs l + b l s bsp c ) [ 2 b 2 M n + bsM t ( 2 b 2 s 2 ) bc n + b 2 sc t ( b s ) ( 2 b + s ) brp c ] [ ( 2 bb l ss l + 2 b 2 p c s 2 p c ) 2 b ( 4 b 2 s 2 ) k ] 2 ( 2 bb l ss l + 2 b 2 p c s 2 p c ) 2 b 2 ( 2 bs l + b l s bsp c ) 2
l n * = [ ( 2 bb l ss l + 2 b 2 p c s 2 p c ) 2 b ( 4 b 2 s 2 ) k ] ( 2 bb l ss l + 2 b 2 p c s 2 p c ) [ 2 b 2 M n + bsM t ( 2 b 2 s 2 ) bc n + b 2 sc t ( b s ) ( 2 b + s ) brp c ] [ ( 2 bb l ss l + 2 b 2 p c s 2 p c ) 2 b ( 4 b 2 s 2 ) k ] 2 ( 2 bb l ss l + 2 b 2 p c s 2 p c ) 2 b 2 ( 2 bs l + b l s bsp c ) 2 + ( 2 bb l ss l + 2 b 2 p c s 2 p c ) 2 b ( 2 bs l + b l s bsp c ) [ 2 b 2 M t + bsM n ( 2 b 2 s 2 ) bc t + b 2 sc n ( b s ) ( 2 b + s ) brp c ] [ ( 2 bb l ss l + 2 b 2 p c s 2 p c ) 2 b ( 4 b 2 s 2 ) k ] 2 ( 2 bb l ss l + 2 b 2 p c s 2 p c ) 2 b 2 ( 2 bs l + b l s bsp c ) 2
The optimal renewable energy utilization levels l t * and l n * of traditional energy suppliers and new energy suppliers are obtained. Theorem 2 is proved.

Appendix B. Proof of Theorem 3

By substituting the optimal utilization level of renewable energy ( l t * , l n * ) of the energy suppliers in the first stage into the price Equation (5) and demand function (3), the equilibrium pricing ( p t * , p n * ) and production ( q t * , q n * ) of the energy suppliers in the second stage can be obtained as follows:
The optimal pricing is:
p t * = 2 bM t + sM n + 2 b 2 c t + bsc n + ( 2 b + s ) brp c 4 b 2 s 2 + ( 2 bb l ss l + 2 b 2 p c s 2 p c ) [ 2 b 2 M t + bsM n ( 2 b 2 s 2 ) bc t + b 2 sc n ( b s ) ( 2 b + s ) brp c ] [ ( 2 bb l ss l + 2 b 2 p c s 2 p c ) 2 b ( 4 b 2 s 2 ) k ] 2 ( 2 bb l ss l + 2 b 2 p c s 2 p c ) 2 b 2 ( 2 bs l + b l s bsp c ) 2 ( 2 bb l ss l 2 b 2 p c ) [ ( 2 bb l ss l + 2 b 2 p c s 2 p c ) 2 b + ( 4 b 2 s 2 ) k ] + ( 2 bb l ss l + 2 b 2 p c s 2 p c ) b ( 2 bs l + b l s bsp c ) 2 4 b 2 s 2 + ( 2 bb l ss l + 2 b 2 p c s 2 p c ) ( 2 bs l + b l s bsp c ) [ 2 b 2 M n + bsM t ( 2 b 2 s 2 ) bc n + b 2 sc t ( b s ) ( 2 b + s ) brp c ] [ k ( 2 bb l ss l + 2 b 2 p c s 2 p c ) bp c ] [ ( 2 bb l ss l + 2 b 2 p c s 2 p c ) 2 b ( 4 b 2 s 2 ) k ] 2 ( 2 bb l ss l + 2 b 2 p c s 2 p c ) 2 b 2 ( 2 bs l + b l s bsp c ) 2 .
p n * = 2 bM n + sM t + 2 b 2 c n + bsc t + ( 2 b + s ) brp c 4 b 2 s 2 + ( 2 bb l ss l + 2 b 2 p c s 2 p c ) [ 2 b 2 M n + bsM t ( 2 b 2 s 2 ) bc n + b 2 sc t ( b s ) ( 2 b + s ) brp c ] [ ( 2 bb l ss l + 2 b 2 p c s 2 p c ) 2 b ( 4 b 2 s 2 ) k ] 2 ( 2 bb l ss l + 2 b 2 p c s 2 p c ) 2 b 2 ( 2 bs l + b l s bsp c ) 2 ( 2 bb l ss l 2 b 2 p c ) [ ( 2 bb l ss l + 2 b 2 p c s 2 p c ) 2 b + ( 4 b 2 s 2 ) k ] + ( 2 bb l ss l + 2 b 2 p c s 2 p c ) b ( 2 bs l + b l s bsp c ) 2 4 b 2 s 2 + ( 2 bb l ss l + 2 b 2 p c s 2 p c ) * ( 2 bs l + b l s bsp c ) [ 2 b 2 M t + bsM n ( 2 b 2 s 2 ) bc t + b 2 sc n ( b s ) ( 2 b + s ) brp c ] [ k ( 2 bb l ss l + 2 b 2 p c s 2 p c ) bp c ] [ ( 2 bb l ss l + 2 b 2 p c s 2 p c ) 2 b ( 4 b 2 s 2 ) k ] 2 ( 2 bb l ss l + 2 b 2 p c s 2 p c ) 2 b 2 ( 2 bs l + b l s bsp c ) 2 .
The optimal production is:
q t * = 2 b 2 M t + bsM n ( 2 b 2 s 2 ) bc t + b 2 sc n ( b s ) ( 2 b + s ) brp c 4 b 2 s 2 + ( 2 bb l ss l + 2 b 2 p c s 2 p c ) 2 b [ 2 b 2 M t + bsM n ( 2 b 2 s 2 ) bc t + b 2 sc n ( b s ) ( 2 b + s ) brp c ] [ ( 2 bb l ss l + 2 b 2 p c s 2 p c ) 2 b ( 4 b 2 s 2 ) k ] 2 ( 2 bb l ss l + 2 b 2 p c s 2 p c ) 2 b 2 ( 2 bs l + b l s bsp c ) 2 ( 2 bb l ss l + 2 b 2 p c s 2 p c ) 2 b + ( 4 b 2 s 2 ) k + ( 2 bs l + b l s bsp c ) 2 b 4 b 2 s 2 + ( 2 bb l ss l + 2 b 2 p c s 2 p c ) b ( 2 bs l + b l s bsp c ) [ 2 b 2 M n + bsM t ( 2 b 2 s 2 ) bc n + b 2 sc t ( b s ) ( 2 b + s ) brp c ] k [ ( 2 bb l ss l + 2 b 2 p c s 2 p c ) 2 b ( 4 b 2 s 2 ) k ] 2 ( 2 bb l ss l + 2 b 2 p c s 2 p c ) 2 b 2 ( 2 bs l + b l s bsp c ) 2 .
q n * = 2 b 2 M n + bsM t ( 2 b 2 s 2 ) bc n + b 2 sc t ( b s ) ( 2 b + s ) brp c 4 b 2 s 2 + ( 2 bb l ss l + 2 b 2 p c s 2 p c ) 2 b [ 2 b 2 M n + bsM t ( 2 b 2 s 2 ) bc n + b 2 sc t ( b s ) ( 2 b + s ) brp c ] [ ( 2 bb l ss l + 2 b 2 p c s 2 p c ) 2 b ( 4 b 2 s 2 ) k ] 2 ( 2 bb l ss l + 2 b 2 p c s 2 p c ) 2 b 2 ( 2 bs l + b l s bsp c ) 2 ( 2 bb l ss l + 2 b 2 p c s 2 p c ) 2 b + ( 4 b 2 s 2 ) k + ( 2 bs l + b l s bsp c ) 2 b 4 b 2 s 2 + ( 2 bb l ss l + 2 b 2 p c s 2 p c ) b ( 2 bs l + b l s bsp c ) [ 2 b 2 M t + bsM n ( 2 b 2 s 2 ) bc t + b 2 sc n ( b s ) ( 2 b + s ) brp c ] k [ ( 2 bb l ss l + 2 b 2 p c s 2 p c ) 2 b ( 4 b 2 s 2 ) k ] 2 ( 2 bb l ss l + 2 b 2 p c s 2 p c ) 2 b 2 ( 2 bs l + b l s bsp c ) 2 .
The optimal pricing ( p t , p n ) and optimal production ( q t * , q n * ) of traditional energy suppliers and new energy suppliers are obtained. Theorem 3 is proved.

References

  1. Ding, Z.L. Research on China’s “Carbon Neutral” Framework Route. Available online: https://wenhui.whb.cn/third/baidu/202105/30/407093.html (accessed on 30 May 2021).
  2. National Development and Reform Commission of China; National Energy Board of China. 14th Five-Year Modern Energy System Planning. Available online: http://zfxxgk.nea.gov.cn/2022-01/29/c_1310524241.htm (accessed on 22 March 2022).
  3. National Development and Reform Commission of China; National Energy Board of China. Opinions on Improving the Institutional Mechanism and Policy Measures for Energy Green and Low-Carbon Transformation. Available online: http://zfxxgk.nea.gov.cn/2022-01/30/c_1310464313.htm (accessed on 10 February 2022).
  4. European Parliament and Council. The Promotion of the Use of Energy from Renewable Sources. Available online: https://eur-lex.europa.eu/eli/dir/2018/2001/oj (accessed on 11 December 2018).
  5. Sgouridis, S.; Carbajales, M.; Csala, D. Comparative net energy analysis of renewable electricity and carbon capture and storage. Nat. Energy 2019, 4, 456–465. [Google Scholar] [CrossRef] [Green Version]
  6. Hansen, K.; Breyer, C.; Lund, H. Status and perspectives on 100% renewable energy systems. Energy 2019, 175, 471–480. [Google Scholar] [CrossRef]
  7. Nagaraju, G.; Sekhar, S.C.; Ramulu, B. An Integrated Approach Toward Renewable Energy Storage Using Rechargeable Hybrid Supercapacitors. Small 2019, 15, 1805418. [Google Scholar] [CrossRef] [PubMed]
  8. Talluri, G.; Lozito, G.M.; Grasso, F.; Iturrino Garcia, C.; Luchetta, A. Optimal Battery Energy Storage System Scheduling within Renewable Energy Communities. Energies 2021, 14, 8480. [Google Scholar] [CrossRef]
  9. Mehrasa, M.; Pouresmaeil, E.; Sepehr, A. Control technique for the operation of grid-tied converters with high penetration of renewable energy resources. Electr. Power Syst. Res. 2019, 166, 18–28. [Google Scholar] [CrossRef]
  10. Tang, Z.G.; Yang, Y.H.; Blaabjerg, F. An Inter linking Converter for Renewable Energy Integration into Hybrid Grids. IEEE. T. Power. Electr. 2021, 36, 2499–2504. [Google Scholar] [CrossRef]
  11. Li, L.L.; Wen, S.Y.; Tseng, M.L. Renewable energy prediction: A novel short-term prediction model of photovoltaic output power. J. Clean. Prod. 2019, 228, 359–375. [Google Scholar] [CrossRef]
  12. Lund, P.D. Effects of energy policies on industry expansion in renewable energy. Renew. Energy 2008, 34, 53–64. [Google Scholar] [CrossRef]
  13. Nowak, M.J.; James, V.U.; Golubchikov, O. The Role of Spatial Policy Tools in Renewable Energy Investment. Energies 2022, 15, 2393. [Google Scholar] [CrossRef]
  14. De, F.R.A.; Vogel, E.P.; Korzenowski, A.L.; Oliveira, R.L.A. Stochastic model to aid decision making on investments in renewable energy generation: Portfolio diffusion and investor risk aversion. Renew. Energy 2020, 162, 1161–1176. [Google Scholar]
  15. Milone, D.; Curto, D.; Franzitta, V.; Guercio, A.; Cirrincione, M.; Mohammadi, A. An Economic Approach to Size of a Renewable Energy Mix in Small Islands. Energies 2022, 15, 2005. [Google Scholar] [CrossRef]
  16. Elkadeem, M.R.; Wang, S.R.; Sharshir, S.W. Feasibility analysis and techno-economic design of grid-isolated hybrid renewable energy system for electrification of agriculture and irrigation area: A case study in Dongola, Sudan. Energy Convers. Manag. 2019, 196, 1453–1478. [Google Scholar] [CrossRef]
  17. Lund, P.D.; Lindgren, J.; Mikkola, J. Review of energy system flexibility measures to enable high levels of variable renewable electricity. Renew. Sustain. Energy Rev. 2015, 45, 785–807. [Google Scholar] [CrossRef] [Green Version]
  18. Long, Y.; Wang, Y.; Pan, C. Auction Mechanism of Micro-Grid Project Transfer. Sustainability 2017, 9, 1895. [Google Scholar] [CrossRef] [Green Version]
  19. Long, Y.; Wang, Y.; Pan, C. Incentive Mechanism of Micro-grid Project Development. Sustainability 2018, 10, 163. [Google Scholar] [CrossRef] [Green Version]
  20. Long, Y.; Pan, C.; Wang, Y. Research on a Microgrid Subsidy Strategy Based on Operational Efficiency of the Industry Chain. Sustainability 2018, 10, 1519. [Google Scholar] [CrossRef] [Green Version]
  21. Zhang, X.L.; Wang, R.S.; Huo, M.L. A study of the role played by renewable energies in China’s sustainable energy supply. Energy 2009, 35, 4392–4399. [Google Scholar] [CrossRef]
  22. Parker, T. Sustainable energy: Cutting science’s electricity bill. Nature 2011, 480, 315–316. [Google Scholar] [CrossRef]
  23. Banos, R.; Manzano-Agugliaro, F.; Montoya, F.G. Optimization methods applied to renewable and sustainable energy: A review. Renew. Sustain. Energy Rev. 2011, 15, 1753–1766. [Google Scholar] [CrossRef]
  24. Wang, J.H.; Conejo, A.J.; Wang, C.S.; Yan, J.Y. Smart grids, renewable energy integration, and climate change mitigation—Future electric energy systems. Appl. Energy 2012, 96, 1–3. [Google Scholar] [CrossRef]
  25. Chu, S.; Majumdar, A. Opportunities and challenges for a sustainable energy future. Nature 2012, 488, 294–303. [Google Scholar] [CrossRef]
  26. Ellabban, O.; Abu-Rub, H.; Blaabjerg, F. Renewable energy resources: Current status, future prospects and their enabling technology. Renew. Sustain. Energy Rev. 2014, 39, 748–764. [Google Scholar] [CrossRef]
  27. Kunjana, C.; Somboon, N. Impact assessment of renewable generation on electricity demand characteristics. Renew. Sustain. Energy Rev. 2014, 39, 995–1004. [Google Scholar]
  28. Mathiesen, B.V.; Lund, H.; Connolly, D. Smart Energy Systems for coherent 100% renewable energy and transport solutions. Appl. Energy 2015, 145, 139–154. [Google Scholar] [CrossRef]
  29. Weitemeyer, S.; Kleinhans, D.; Vogt, T. Integration of Renewable Energy Sources in future power systems: The role of storage. Renew. Energy 2015, 75, 14–20. [Google Scholar] [CrossRef] [Green Version]
  30. Andrés, I.; Rodrigo, M.; Alejandro, B.; Hugh, R. CVaR constrained planning of renewable generation with consideration of system inertial response, reserve services and demand participation. Energy Econ. 2016, 59, 104–117. [Google Scholar]
  31. Wang, H.Z.; Lei, Z.X.; Zhang, X. A review of deep learning for renewable energy forecasting. Energy Convers. Manag. 2019, 198, 111799. [Google Scholar] [CrossRef]
  32. Dominguez-Navarro, J.A.; Dufo-Lopez, R.; Yusta-Loyo, J.M. Design of an electric vehicle fast-charging station with integration of renewable energy and storage systems. Int. J. Elec. Power 2019, 105, 46–58. [Google Scholar] [CrossRef]
  33. Vergara-Dietrich, J.D.; Morato, M.M.; Mendes, P.R.C. Advanced chance-constrained predictive control for the efficient energy management of renewable power systems. J. Process. Contr. 2019, 74, 120–132. [Google Scholar] [CrossRef]
  34. Hustveit, M.; Forgner, J.S.; Fleten, S.E. Tradable green certificates for renewable support: The role of expectations and uncertainty. Energy 2017, 141, 1717–1727. [Google Scholar] [CrossRef]
  35. Alizamir, S.; de Véricourt, F.; Sun, P. Efficient feed-in-tariff policies for renewable energy technologies. Rairo-Oper. Res. 2016, 64, 52–66. [Google Scholar] [CrossRef] [Green Version]
  36. Sun, J.; Li, M.; Zhang, Z.; Xu, T.; He, J.; Wang, H.; Li, G. Renewable Energy Transmission by HVDC Across the Continent: System Challenges and Opportunities. CSEE. J. Power Energy 2017, 3, 353–364. [Google Scholar] [CrossRef]
  37. Yang, X.L.; He, L.Y.; Xia, Y.F.; Chen, Y.F. Effect of government subsidies on renewable energy investments: The threshold effect. Energy Policy 2019, 132, 156–166. [Google Scholar] [CrossRef]
  38. Zhang, Q.; Wang, G.; Li, Y. Substitution effect of renewable portfolio standards and renewable energy certificate trading for feed-in tariff. Appl. Energy 2018, 227, 426–435. [Google Scholar] [CrossRef] [Green Version]
  39. Vlachos, A.G.; Biskas, P.N. Embedding renewable energy pricing policies in day-ahead electricity market clearing. Electr. Power Syst. Res. 2014, 116, 311–321. [Google Scholar] [CrossRef]
  40. Brockway, P.E.; Owen, A.; Brand-Correa, L.I. Estimation of global final-stage energy-return-on-investment for fossil fuels with comparison to renewable energy sources. Nat. Energy 2019, 4, 612–621. [Google Scholar] [CrossRef] [Green Version]
  41. Blaszke, M.; Nowak, M.; Śleszyński, P.; Mickiewicz, B. Investments in Renewable Energy Sources in the Concepts of Local Spatial Policy: The Case of Poland. Energies 2021, 14, 7902. [Google Scholar] [CrossRef]
Figure 1. Renewable energy investment and production model.
Energies 15 04110 g001
Figure 2. Timeline of renewable energy investment and production decisions.
Energies 15 04110 g002
Figure 3. Impact of technology cost elasticity coefficient on the investment and production of renewable energy: (a) the scenario of direct sale of power; (b) the scenario of purchase and sale by large power grids.
Energies 15 04110 g003
Figure 4. Impact of user preference on the investment and production of renewable energy: (a) the scenario of direct sale of power; (b) the scenario of purchase and sale by large power grids.
Energies 15 04110 g004
Table 1. Impact of quota on the investment and production of renewable energy.
The Scenario of Direct Sale of Power
r l t * l n * p t * p n * q t * q n * π t π n
0.10.0910.5625.4835.98323.23512.88552.62224.422
0.30.2430.6535.3355.71424.49613.55353.52325.083
0.50.3460.7445.2185.52225.15314.20554.44125.770
0.70.4240.8355.1115.33526.28514.79553.58626.445
0.90.4870.9265.0335.27426.51515.12652.78727.265
The Scenario of Purchase and Sale by Large Power Grids
r l t * l n * p t * = p p n * = p q t * q n * π t π n
0.10.0930.573--36.74512.64535.7456.322
0.30.2420.669--38.47313.32336.4786.915
0.50.3750.765--40.05513.81537.9557.665
0.70.4740.861--40.82714.10535.2028.285
0.90.5430.958--41.26514.26834.3658.891
Table 2. Impact of green power certificate price on the investment and production of renewable energy.
The Scenario of Direct Sale of Power
P c l t * l n * p t * p n * q t * q n * π t π n
0.10.0850.5335.4595.78322.91513.12543.11824.266
0.20.1130.6095.2955.59523.83814.03144.46225.167
0.30.1510.6855.1775.44424.58515.18445.63326.017
0.40.2120.7615.0865.35825.07216.20344.89726.978
0.50.2760.8395.0245.28925.32817.54543.95127.863
The Scenario of Purchase and Sale by Large Power Grids
P c l t * l n * p t * = p p n * = p q t * q n * π t π n
0.10.0930.514--36.78512.56521.5984.164
0.20.1180.553--38.27313.16122.4744.336
0.30.1470.608--39.34513.86923.3324.689
0.40.1920.886--40.17213.72722.3445.213
0.50.2580.778--40.59515.85521.2925.890
Publisher’s Note: MDPI stays neutral with regard to jurisdictional claims in published maps and institutional affiliations.

