1. Introduction
Energy is an important source of a country’s economic and social development [
1,
2,
3]. Electric energy storage is an imperative component of future electricity infrastructure. It can improve the reliability and resilience of the whole energy system, integrate more RES [
4], and help reduce environmental impacts [
5,
6]. Depending on the type of technology selected to meet the application’s requirement, many benefits can be obtained from ESS [
7]. The importance and attractiveness of ESS as an integral part of the electricity supply and transmission and distribution systems are receiving increasing attention for creating a “
smart energy system”; however, ESS at the national level, meeting a set of applications and optimizing the transmission and distribution (T&D) system has been limited, due to the lack of studies defining the most suitable cost-effective options. Large PHES facilities dominate electricity storage, primarily for daily load shifting and different applications [
4,
8]. In many markets, storage is classified as a load-modifying source, or in some cases, classified as a generation asset and as a load source [
8]. Numerous benefits can be achieved through the integration of energy storage for utility applications, such as reduced financial losses due to poor power quality and power outages, energy price arbitrage involving charging with low-priced “off-peak” energy for later use when energy cost and the price is high, and ancillary utility services, among others [
9,
10]. Over the last two decades, many other potential benefits from ESS have been proposed, evaluated, and demonstrated [
11].
The application and use of energy storage techniques are valued today as a highly efficient way to overcome the problems of timely power supply volatility, minimize the rate of energy losses and low cost of electricity supply, and contribute to ensuring security supply [
12]. ESS refers to converting electrical energy from a power source, in an easily stored way, at the desired period, for converting back to electrical energy when needed during peak hours [
13,
14,
15,
16,
17]. This process enables electricity to be produced at off-peak hours, with low generation cost, or renewable energy sources (RES). Electric energy time-shift comprises purchasing inexpensive electric energy, available when prices or marginal system costs are low, to recharge the storage system so that the stored energy can be used or sold later when profits are higher [
18,
19,
20]. Alternatively, storage can provide similar time-shift flexibility by storing excess energy production from RES such as wind or photovoltaic (PV) systems which otherwise be lost [
21,
22]. The storage techniques have been applied so far in many countries such as Germany (i.e., Huntorf Power Plant with a turbine capacity of 390 MW), the USA (i.e., 110 MW of installed turbine capacity), China, Japan, Denmark, and many other countries. For instance, according to Lund, Salgi, Elmegaard and Andersen [
12], compressed air energy storage (CAES) technologies can be used for load leveling in the electricity supply and are therefore often considered for future energy systems with a high share of fluctuating renewable energy sources, such as wind power and PV. Many studies highlight the economic impact of similar energy storage facilities compared with performance and cost [
23]. Evans, et al. [
24] highlight some major constraints for increasing penetration of renewable energy sources, such as their availability and intermittency, that can be overcome through energy storage and energy use. This study reviews the energy storage technologies and gives a comparative summary of the performance parameters of the major energy storage options. The parameters compared in Evans, Strezov and Evans [
24] include efficiency, energy capacity, energy density, run time, capital investment costs, response time, a lifetime in years and cycles, discharge, and maturity of each energy storage option. The choice of storage system depends on individual requirements. It may even incorporate more than one energy storage system to increase the energy storage capacity and improve energy security.
In the study of Yekini Suberu, Wazir Mustafa and Bashir [
11], the advantages and disadvantages of the various technologies are also presented. The variability in the RES supply coupled with conditional changes in the level of energy consumption concerning time has brought into focus the necessity for energy storage systems (ESSs). In the study of Mancarella [
9], a comprehensive and critical overview of the latest models and assessment techniques that are currently available to analyze multi-energy systems (MES) and, in particular, distributed multi-generation (DMG) systems, including, for instance, concepts such as energy hubs, microgrids, and virtual power plants (VPPs), as well as various approaches and criteria for energy, environmental, and techno-economic assessment, are given.
Transmission congestion occurs when available; least-cost energy cannot be delivered to all or some loads because transmission fittings cannot deliver that energy at the desired time [
12]. When transmission capacity additions or upgrades do not keep pace with the growth in peak electric demand, the transmission systems become congested. Thus, during periods of peak demand, the need and cost for more transmission capacity increases along with transmission access charges. Transmission congestion may also increase congestion costs or locational marginal pricing (LMP) for wholesale electricity at certain transmission nodes. Perhaps most importantly, storage may reduce fossil fuel use and/or reduce air emissions from central generation [
11]. Thus, depending on how it is used and where it is located, electricity storage could reduce the need for additional generation, transmission, or distribution facilities and the land on which they would be built.
Furthermore, if storage is located at or near loads, energy losses associated with T&D can be reduced [
25]. In the study of Antweiler [
26], models of electricity storage identify critical magnitudes for profitability; the profitability of energy arbitrage depends on local price volatility, and the quality of price forecasting and trading off demand-side storage against transmission capacity appears promising. This study highlights the advantages of integrating energy storage technologies (ESS) into the Albanian energy system. Such systems will support the large-scale integration of RES and also avoid congestion and investment in the transmission electricity networks. In other words, the security of supply, rational use of energy resources in the country, diversification of the energy sector nationwide, the increase in competitiveness, energy market liberalization, as well as environmental protection, are some of the main benefits of integrating energy storage systems (ESS) into the existing and future national energy system. The assessment and the possibility of ESS integration within the central or bulk generation chain will be fully in place with the country’s physical, technical, economic, and environmental aspects. The Albanian power system is dominated by hydropower, representing more than 95% of the country’s installed capacity with 2506 MW installed. The majority of the installed capacity (1448 MW), 58%, is owned by the Albanian Power Corporation (KESH). The rest, 42%, belongs to the private producers (1058 MW) [
27,
28] (i.e., where the installed capacity of independent producers is 436 MW, whereas 622 MW belongs to the producers with priority). The installed hydropower capacity comprises mainly large installations (i.e., above 10 MW in size) constituting 1904 MW [
29]. Small hydropower installations consist of 192 MW. Given these figures at the national level, energy losses occur in HPPs, especially those of Run of River type, which does not have water storing capacity. Under these conditions, to increase the security of investments in other RES capacities in the future, such as wind or PV, ESS is the only alternative way for the optimal use of energy sources.
Moreover, referring to the KESH [
30] and Law No. 7/2017 “Promoting the Use of Energy from Renewable Sources”, with the main purpose of identifying the right form and type of ESS as an inevitable step to increase the security of investments in the field of RES, thus enabling Albania to achieve the targets set in the country for a sustainable, flexible energy system, Albania aims to achieve 42% domestic RES share by the end of 2030 [
30]. ESSs are not a new and unknown concept for energy systems. They have always been, and continue to be, an integral part of electricity generation, transmission, and distribution systems [
25,
31,
32]. Modern energy systems move away from traditional electricity systems based on fossil fuels; the main focus is large-scale RES integration, such as wind and PV [
15,
21].
Therefore, this study’s main goal is to analyze the integration of ESS into the existing transmission system using multiple-choice criteria based on the chosen application’s list level in Albania. Hence, two important aspects must be considered.
First, from a technical point of view, which ESS technologies can we suggest that better meet the applications list? What is unique and profoundly important about the ESSs’ integration into the existing energy system based on HPP is its flexibility to produce multiple benefits from a single device and help introduce large shares of RES in the future.
Furthermore, the methodology section below is given to meet the ALCM (application list, location cost, and maturity) criteria. Regardless of the currently available technologies, the existing national energy strategy 2018–2030 and most regulatory frameworks in Albania either do not consider or reflect the role or the value that energy storage can provide; therefore, we believe that solution-oriented findings resulting from this study would help policy-makers and decision-makers to re-frame more effective measures to support sustainable energy transition.
2. Study Case
To assess the benefits of different storage solutions, we consider Drin River Cascade HPP as a study case (
Figure 1).
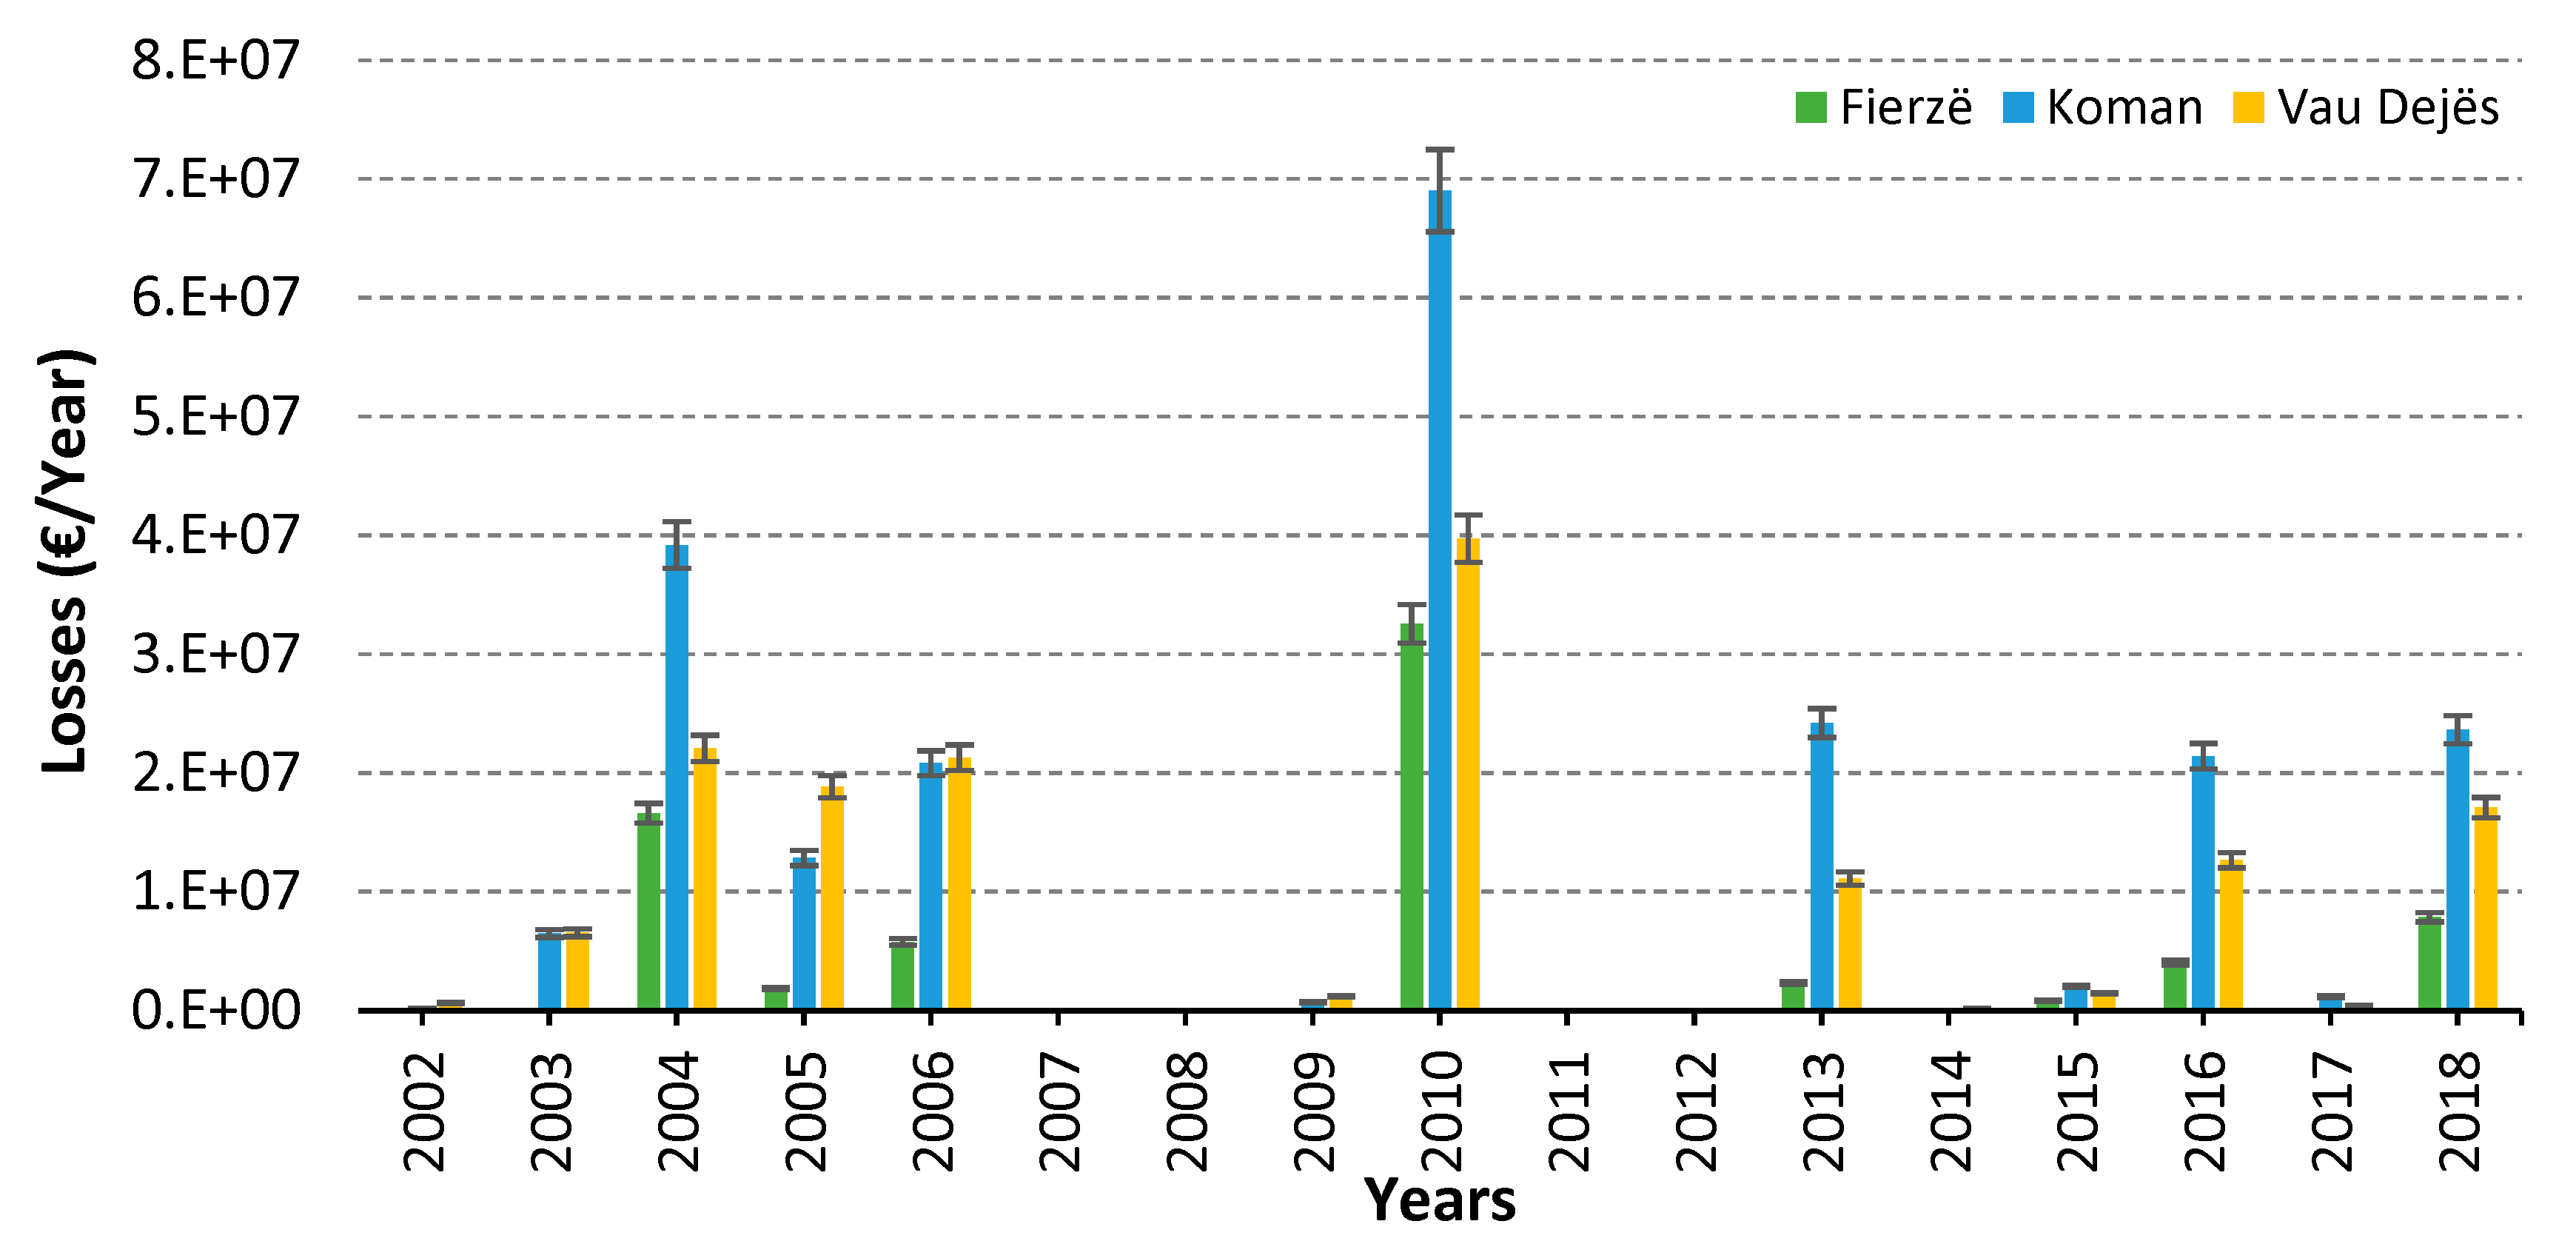
Based on the above studies and the water discharges in the Drin River cascade HPPs, (Fierzë HPP, Koman HPP, and Vau Dejës HPP),
Figure 2 shows the real losses (EUR/Year) for three HPPs. Statistically, once in five years, the energy generation system in Albania has the potential to fulfill the whole electricity demand due to good weather conditions [
33]. The total installed capacity of HPPs in the Drin River cascade is ≈1350 MW, and the yearly level of water discharges, referring to the 2018 results, is 4111 million m
3. The total head (H) of the HPP varies from 115.5 m up to 161.5 m. The specific water consumption (m
3/kWh) generates 1 kWh of electricity, resulting in the range of 4.07 (Fierzë), 4.2 (Koman), and 8.59 (Vau Dejës). Based on 2010 water discharge rates of (i.e., 11,287 million m
3) and specific water consumption, the potential of saving reaches around 0.8 up to 2.08 TWh of electricity, accounting for 30% of total annual electricity demand in Albania. As shown in
Figure 2, considering an electricity export rate of EUR 50/MWh up to EUR 70/MWh (i.e., off-peak energy or excess), it can bring a considerable monetary benefit to KESH. Hence, electricity storage can be used to avoid congestion-related costs and charges, especially if the costs become onerous due to significant transmission system congestion. In this application service, storage systems would be installed at locations electrically downstream from the congested portion of the transmission system. Energy would be stored when there is no transmission congestion. It would be released (i.e., during on-peak demand periods) to reduce peak transmission capacity requirements.
The storage is recharged when the feeder load reduces in the late evening. Alternatively, the storage can be recharged late at night. As long as it is available to serve the peak load, the transformer will likely see the following day (s). Transmission upgrade deferral involves delaying—and in some cases avoiding entirely—utility investments in transmission system upgrades by using relatively small amounts of storage. Notably, for most nodes within a transmission system, the highest loads occur on just a few days per year, for just a few hours per year [
15,
32]. The highest annual load frequently occurs on one day, with a somewhat higher peak than any other day. One important implication is that storage used for this application can provide significant benefits with limited or no need to discharge.
3. Methodology
The methodology for selecting the appropriate type of ESS depends on the model, which must necessarily include the possibility of integrating different forms and types of storage technologies into the energy system, including generation, transmission, distribution, as well as final consumers [
34]. Comparing and then choosing the right energy storage systems is a very complicated procedure as it is closely related to a wide variety of operational and business factors such as differences in deliverable power, efficiency, discharge time, life cycle, the number of applications that the systems can be applied to, financial parameters, and the ability to monetize multi-application benefits; hence, the Energy Storage Select software (ES-Select™) is a decision-support tool that helps users identify the most feasible energy storage technology options, considering the chosen country context. ES-Select™ is a sophisticated, highly interactive model that offers a means to carefully analyze the many interrelated factors that influence the overall feasibility scores of ESSs given in a graphical presentation. It ranks them for the selected application (s) chosen. The model uses a Monte Carlo-based analysis to handle uncertainties in cost, benefit, life cycle, efficiency, discharge duration, and other influenced parameters. The model also enables the users to change energy storage and application data. The methodology followed in the evaluation is explained in detail in the flow diagram (
Figure 3).
The commercial availability, benefits, real requirements, barriers, and limitations of (ESS) applications concerning two important sections, namely: basic generation, transmission, and distribution, are assessed in the country context [
12,
22]. The following section summarizes the key requirements for each selected application and how specific ESS technologies can meet them. The focus is on technical and economic requirements as well. The selection strategy considers the price and cost of components according to their normal distribution, evaluating all possible ESS options, which identifies and selects one or several optimal alternatives. The selection of the application location is of particular importance as it directly affects three critical factors such as:
Installation cost;
Availability/applicability of integration of energy storage and storage systems, and
Expected storage capacity.
Based on a detailed technical analysis of the power system in the country, information provided by reliable international institutes/agencies [
8,
35] in the field of energy issues, and objectives set out in strategic documents and specific laws, especially in the sector of electricity (i.e., referring to the national energy strategy 2018–2030) [
30], six main services listed and ranked in the model according to each application’s priorities and importance in the electricity sector in Albania were carefully selected (
Table 1).
Once the six basic functions of the ESS are selected from the model, the appropriate forms and types of energy storage are calculated.
Table 1 shows the various applications for the analysis and their priority in the respective ESSs for the selected location. Since the use of renewable energy is still in an early stage in the region, the parameters associated with it have a lower priority for the time being. Importance was given to present aspects to provide transmission congestion relief and upgrade deferral at 10% in the most cost-effective way. Fully in compliance with the main objectives given by KESH [
30], this study focuses on creating a sustainable, safe and flexible energy model in time in Albania. The ES-Select model [
7] calculates the average score, meeting the application criteria to combine multiple feasibility results. The model performs this selection procedure based on: feasibility score, discharge duration, and maturity.
Figure 4 presents the two-step process that the ES-Select model first uses to evaluate each storage option for multiple applications and then average them for different criteria enabling the combined feasibility result of each ESS.
The construction of a model with a high degree of reliability, influenced by the number of parameters taken into analysis, is used. The high number of variables used in the ESS feasibility analysis will generate a promising and reliable model. Electricity storage and storage techniques are evaluated as an effective approach of practical engineering methodologies concerning the process of optimization of transmission networks and the possibility of realizing the delay of energy, influenced by the demand for safe and high-quality energy for end consumers, promotion and large-scale integration of renewable energies, mainly from wind and solar. The basic role of energy conservation is the same in all engineering applications. It serves to absorb the energy generated at a certain point in time and distribute it at a later time when the benefit is also greater; however, the choice of energy storage system for each specific function strongly depends on the value of energy required, loading or unloading process time, response time, installation cost, maintenance costs, favorable conditions, implementation barriers, and the repayment period. Two different ways to calculate the average scores of ESS, arithmetic and geometric, can be used (Equations (1) and (2)):
where
S1,
S2, and
S3 represent the average feasibility scores and “
n” is their number. The main difference between the two methods is that lower numbers have a higher impact on reducing the geometric mean than the arithmetic mean. For example, a single “zero” result may lower the arithmetic mean slightly, but the geometric mean leads to zero. When a storage option calculates zero points for any of the feasibility criteria, then this means that the ESS cannot provide the list of services; therefore, it may not be an acceptable technical solution, and this shortcoming should be reflected in the combined feasibility score. As a result, the geometric mean is preferred for combining multiple feasibility results. ES-Select uses the following geometric mean Equation, Equation (3) [
7].
where
a is the weight of the result
S1,
b is the weight of the result
S2, and
c is the weight of the result
S3.
Economic Analysis
Economic analysis was conducted using “Absolute analysis” by evaluating whether the costs are higher or lower than the benefits or “Relative analysis,”, especially for ESS projects such as defining the rank of the proposed ESS in terms of costs and benefits.
A discount rate r of 5–11% was used, and investment is considered to be paid 100% by equity. The analysis also assumes an annual loss of efficiency of 3.0% for the batteries. It is assumed that the system need not be replaced during the project’s life span and that batteries need to be replaced every ten years, losing 3.0% efficiency every year until it reaches 80% of its capacity in the 10th year.
Cost-benefit analysis: A period is chosen, and the sum of all costs and benefits is determined. The net benefit is determined by subtracting total benefits and total costs, as shown in Equation (4).
Benefit to cost ratio (BCR): A period is chosen then the sum of all costs and benefits in that period is determined. The ratio of benefit to cost gives the benefit to cost ratio, as shown in Equation (5).
Simple payback period (SPB): This indicator represents one of the most common ways of finding the economic value of an energy project. Payback considers the initial investment costs and the resulting annual cash flow. The payback period represents the time needed to recoup the initial investment, as shown in Equation (6).
However, the payback does not account for savings after the initial investment is paid back from the profits (cash flow) generated by the investment (project). This method is a “first cut” analysis to evaluate the viability of the investment. It does not include anything about the longevity of the system.
Initial rate of return: This is the opposite of a simple payback period, as shown in Equation (7).
The initial rate of return acts as a minimum threshold indicator for assessing the feasibility of the investment. If the internal rate of return is below this minimum threshold, the investment is not feasible.
Levelized cost of energy (LCOE): All the costs are added during a selected period divided by units of energy. Firstly, a net present value (NPV) analysis is performed. For the value of the chosen LCOE, the project’s NPV becomes zero. This means that the LCOE is the minimum price for energy to be sold for an energy project to break even, as shown in Equation (8).
Cash flow analysis: One of the most flexible and powerful ways to analyze an energy investment is cash-flow analysis. This technique easily complicates fuel escalation, tax-deductible interest, depreciation, periodic maintenance costs, and disposal or value of the equipment’s salvage at the end of its lifetime. The results of a cash flow analysis are computed numerically using a spreadsheet rather than increasingly complex formulas to characterize these factors, as shown in Equation (9).
where
n is the number of years of operation from the start of system operation.
Discounted cash flow (DCF): DCF considers future free cash flow projections and discounts them to reach a present value, then evaluates investment feasibility. Suppose the value obtained through DCF analysis is higher than the current investment cost. In that case, the opportunity may be a good one. DCF analysis aims to estimate the money one would receive from an investment and adjust for money’s time value, as shown in Equation (10).
r is the discount rate; it represents the interest rate used in computing the present value of future cash flows and
n the years when the system starts operation. The present worth factor in the above Equation is 1/(1 +
r)
n. The value chosen for
r shows that it “weights” the decision towards one option, so the basis for choosing the discount rate value must be carefully evaluated. The discount rate depends on the cost of capital, including the balance between debt-financing and equity financing. An assessment of the financial risk must be applied.
Net present value (NPV): NPV compares the value of, e.g., a dollar today to the value of that same dollar in the future, considering the inflation and returns into account. If the NPV of a prospective project is positive, then that project’s investment is considered feasible. In contrast, if NPV is negative, the project should be rejected because cash flows will also be negative. To calculate NPV, the project period and the sum of all the discounted cash flows should be chosen. The net present value is computed by taking the first annual payment and dividing it by (1 +
r). The next payment is then divided by (1 +
r)
2, the third payment by (1 +
r)
3, and the n
th payment by (1 +
r)
n, as given in Equation (11).
P1, P2, P3 … Pn represents net cash inflow–outflows during a single period n, r—represents the discount rate of return made on another investment, and n—represents the number of years or a given period.
4. Results
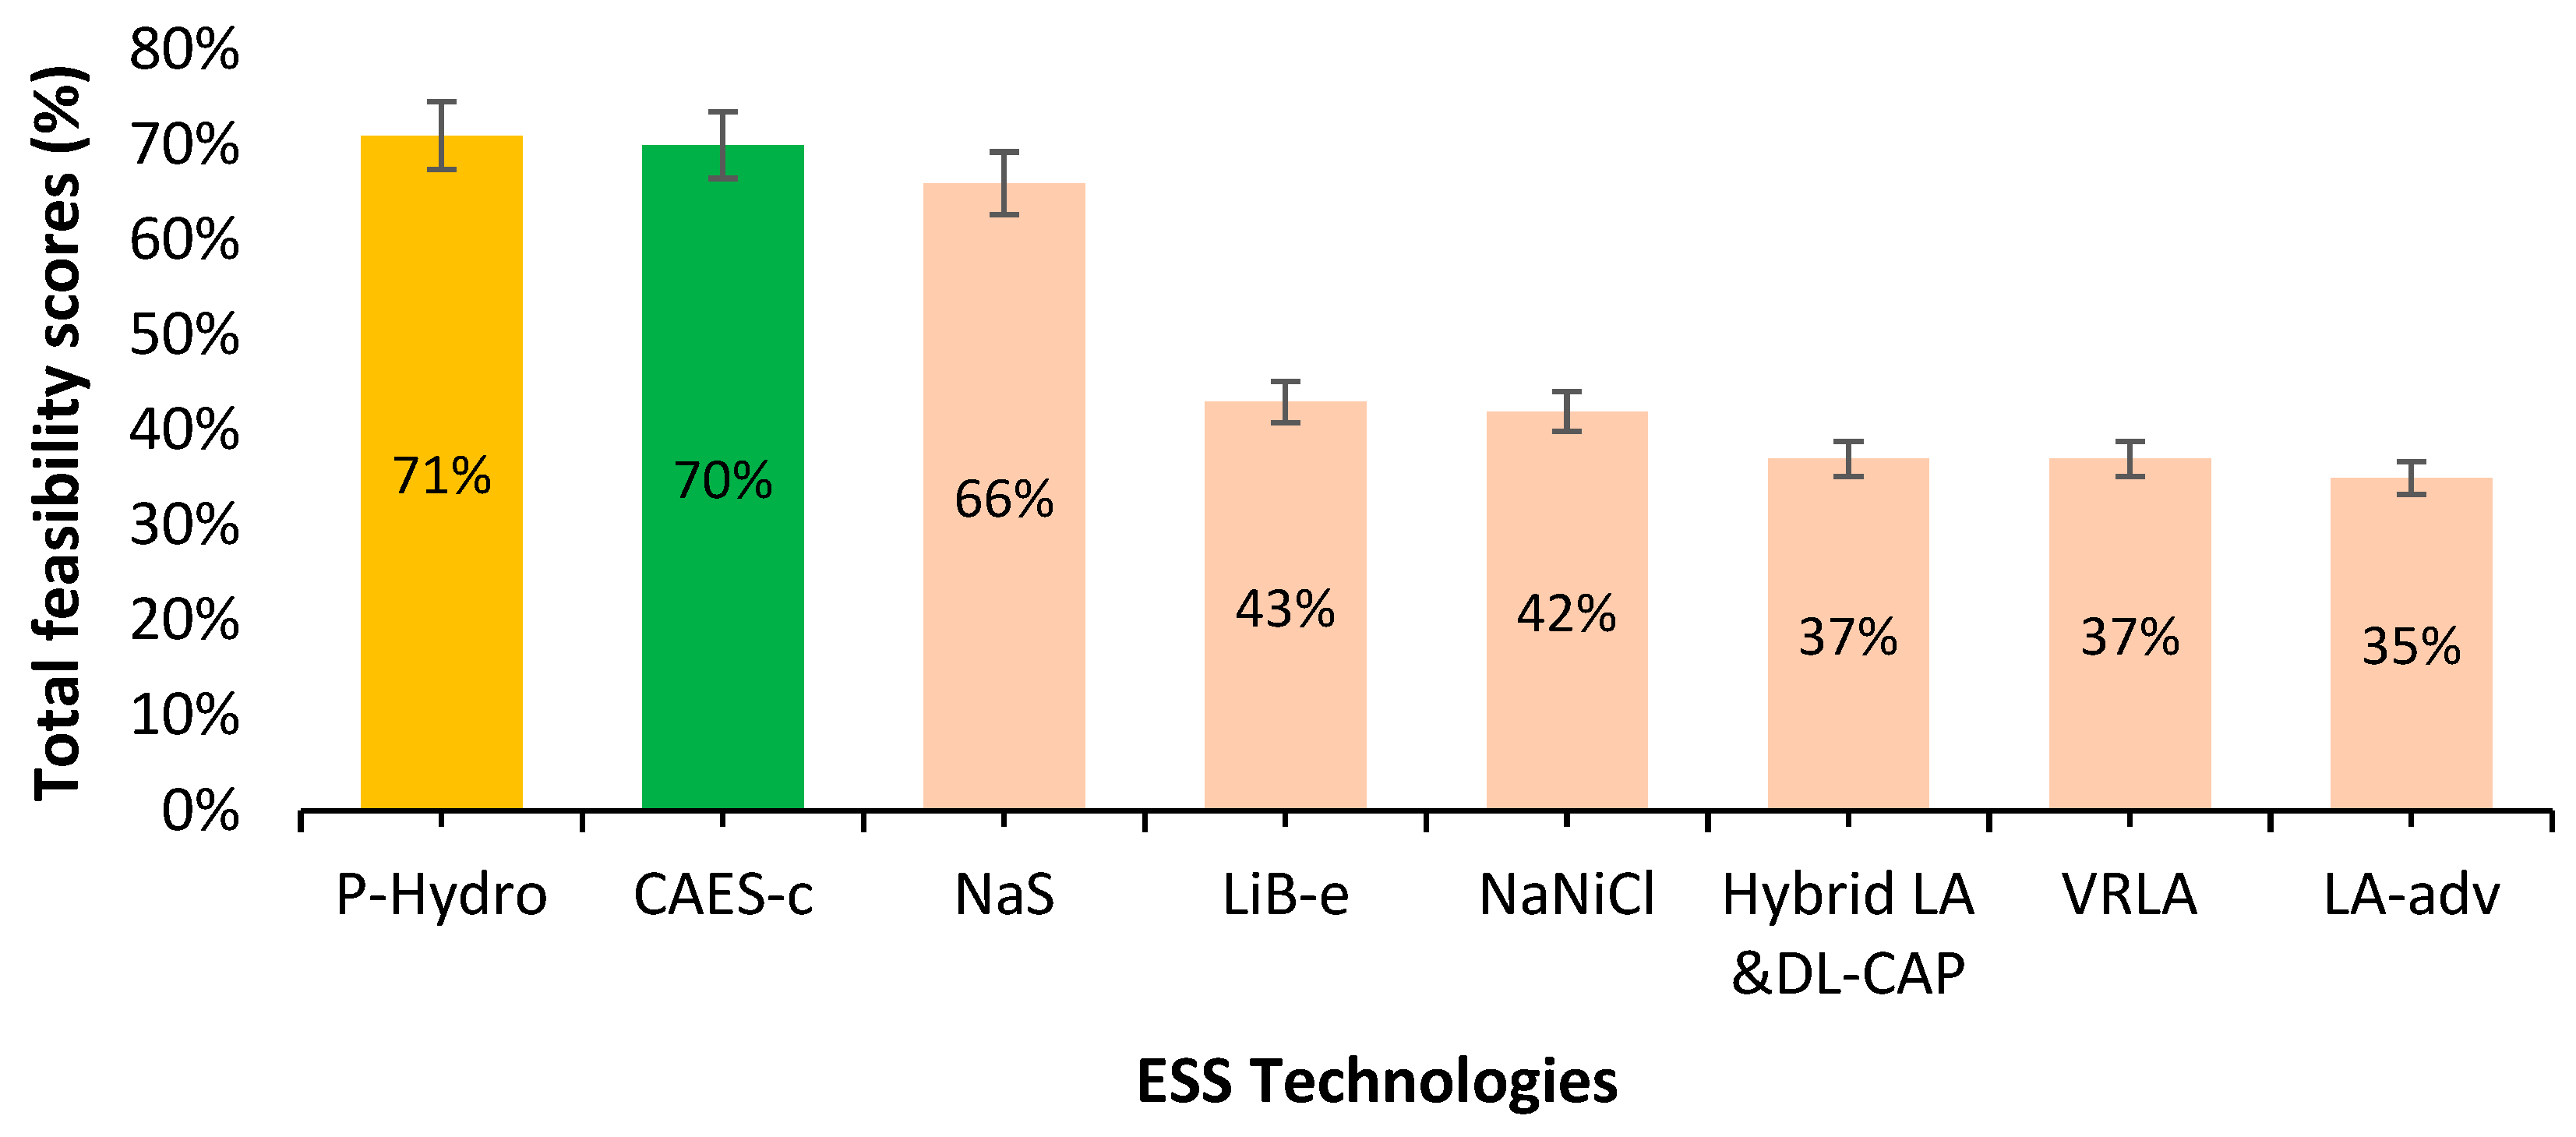
Figure 5 shows the storage options sorted by total feasibility scores considering the specific weight factor 1 meeting the four requirements: scores for the meeting application, scores for meeting location requirement, scores regarding total installation cost at a given location, and scores for commercial maturity (ALCM). The results show that in terms of the applicability of ESS technologies at the central or bulk generation system, E-Select suggests an installed capacity of over 50 MW. From the simulation in the model, it is clearly shown that mechanical ESS form of PHES type ranks first, gathering 71% of total feasibility scores, followed by CAES-c of cavern type or underground storage tank summing up 70% and third ranks electrochemical NaS (battery type) collecting up to 66% of total feasibility scores. The other options rely on the battery type and stand at the same level, amassing a total feasibility score varying between 35% to 43%. Nevertheless, this assessment needs further information regarding the specificities of the national energy system, which the designer must analyze step by step, referring to the country’s context, the real possibility of installation, associated costs, and other limiting factors. Other influencing factors will be specifically addressed following the total feasibility analysis. This ranking of total feasibility points refers to and takes into account the total unit cost (USD/kW) of investment for a possible ESS applicable at the bulk generation or transmission systems calculated by using the ES-Select energy model.
Suppose different specific weight factors are applied in the system. Different results are expected to incur in terms of total feasibility scores collected by each ESS technology suggested by the model. In the case of choosing a weight factor of 1.5 that meets service applications, as given in
Table 1, the total feasibility scores change to 70% for PHES and CAES-c. NaS collect 69% and 68%, respectively. The other technologies survive a slight increase of 2%. In the case when the weight of the factor of meeting applications in the requirements list, installation location, and total cost (USD/kW) increases from 1 to 1.5 and considering factor 1 for the maturity requirement, then higher feasibility scores are given to the mechanical storage form piling up equal scores of 69% (CAES-c) (PHES). Na-S reaches 64%, while the other batteries get values ranging from 32% to 42%.
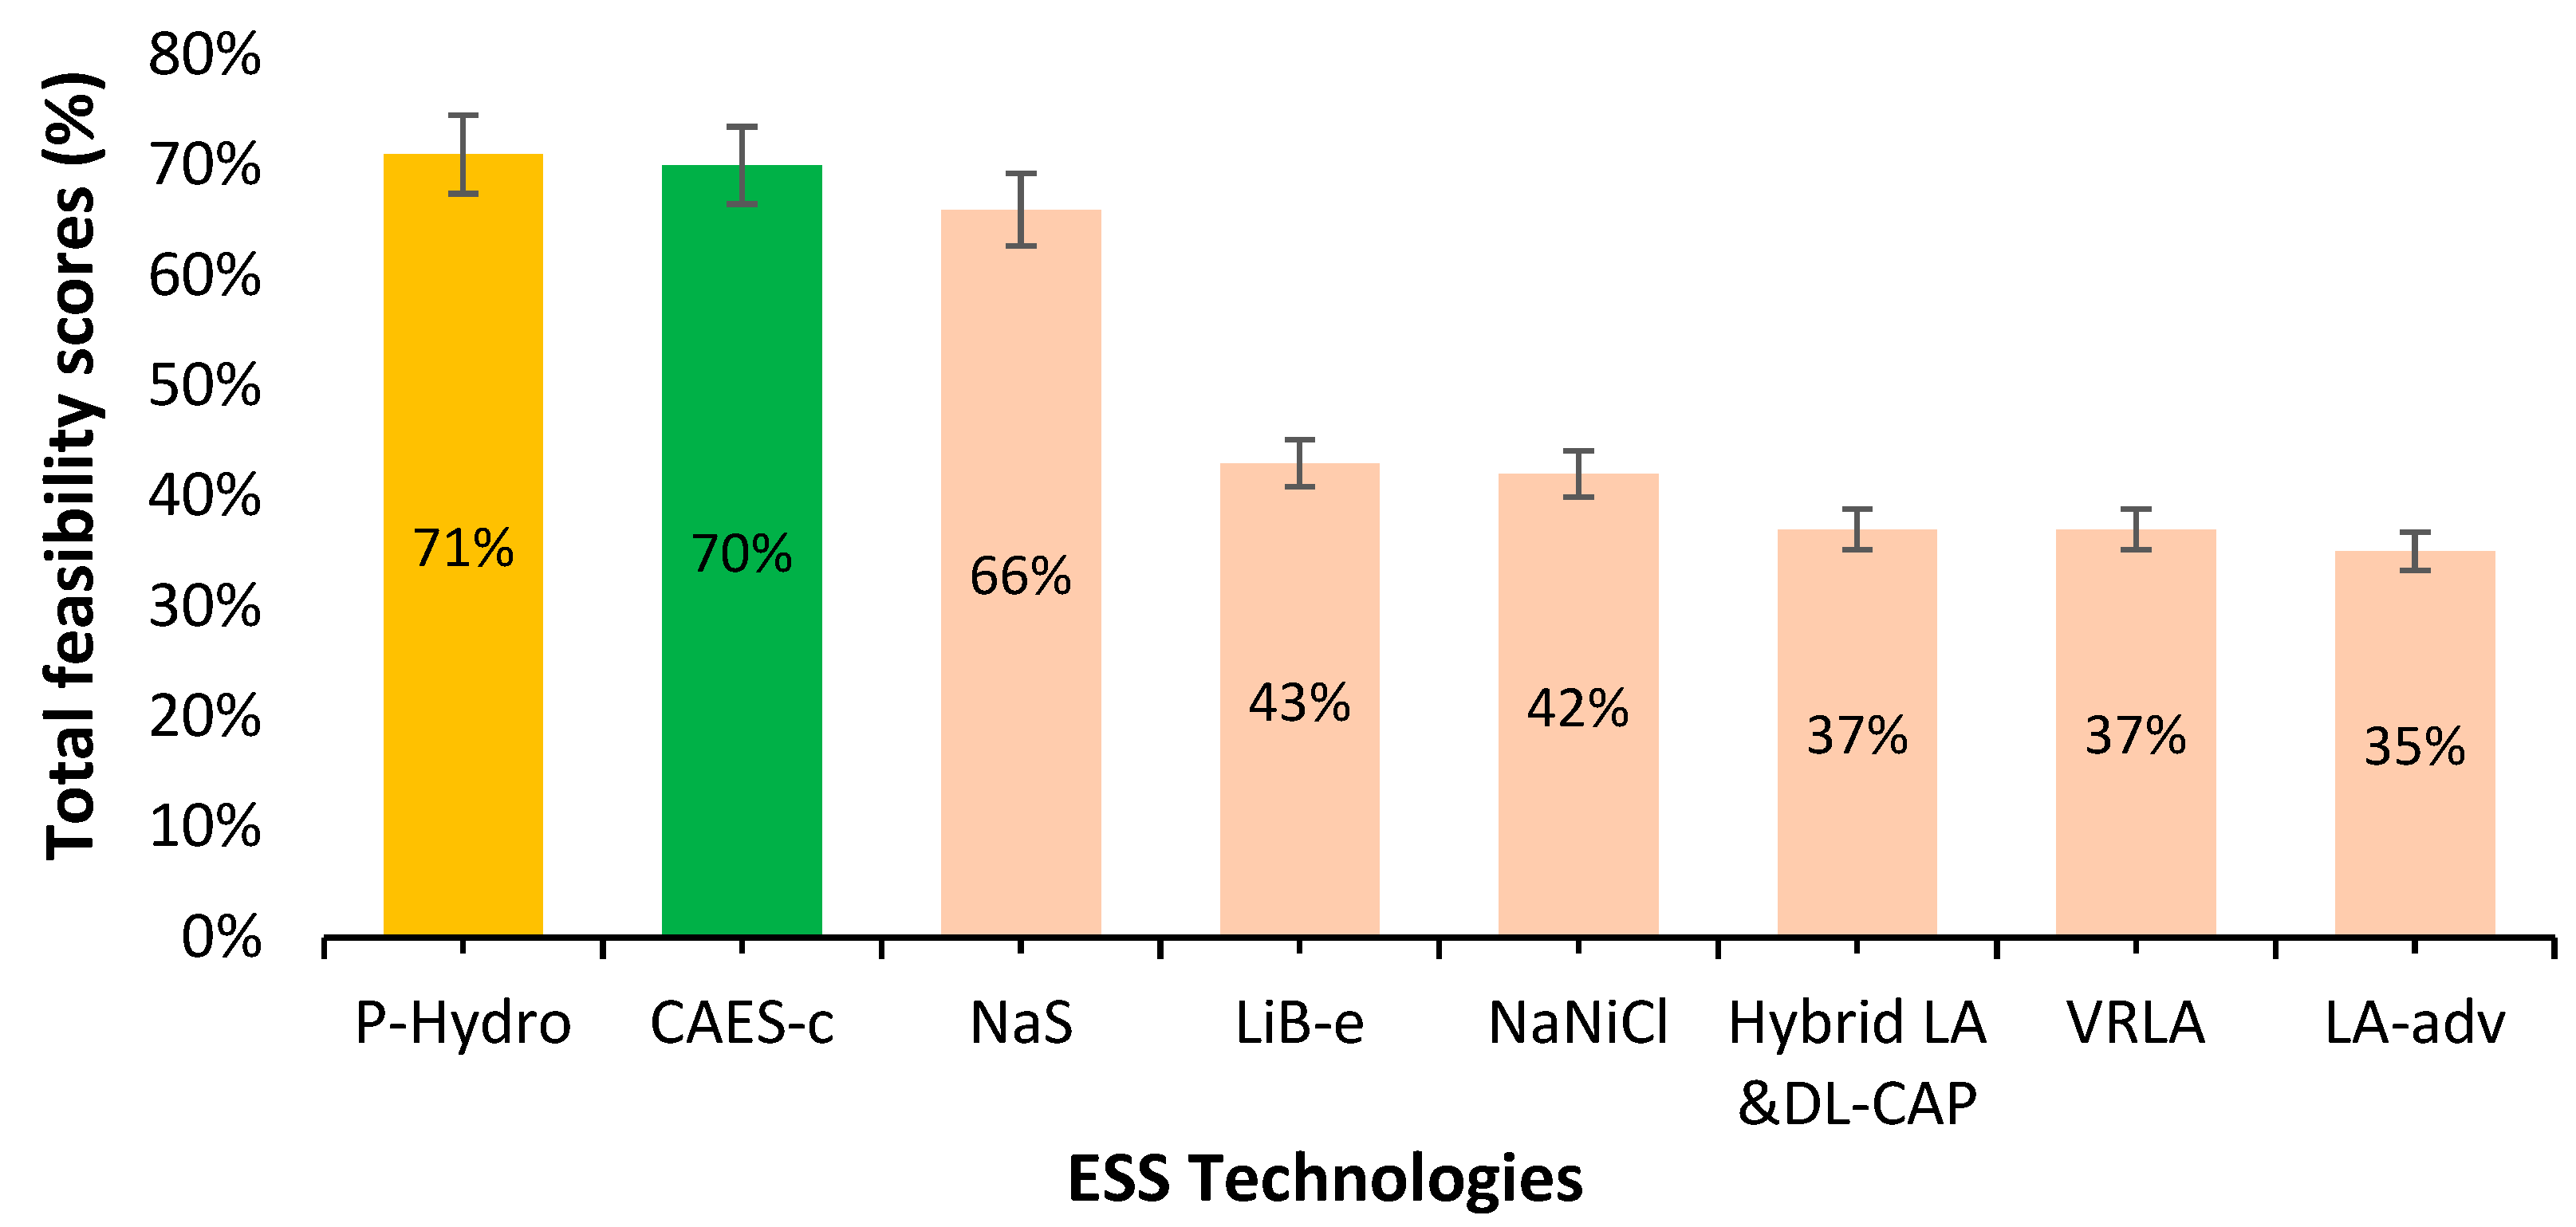
Figure 6 shows the total feasibility scores for the ALCM criteria.
From the simulation results as depicted in the graph in
Figure 6, the feasibility scores meeting only the application requirements listed in
Table 1 stay unchangeable to the results given in the graph in
Figure 5. The model suggests that the best ESS is of mechanical form, PHES, and CAES-c types, respectively, due to the amount of energy they can store over time. The electrochemical ESS group (battery group), such as Na-S, may be an option for reaching 66% of the total feasibility score. The remainder of the group does not support the application list; hence they are excluded from the calculation.
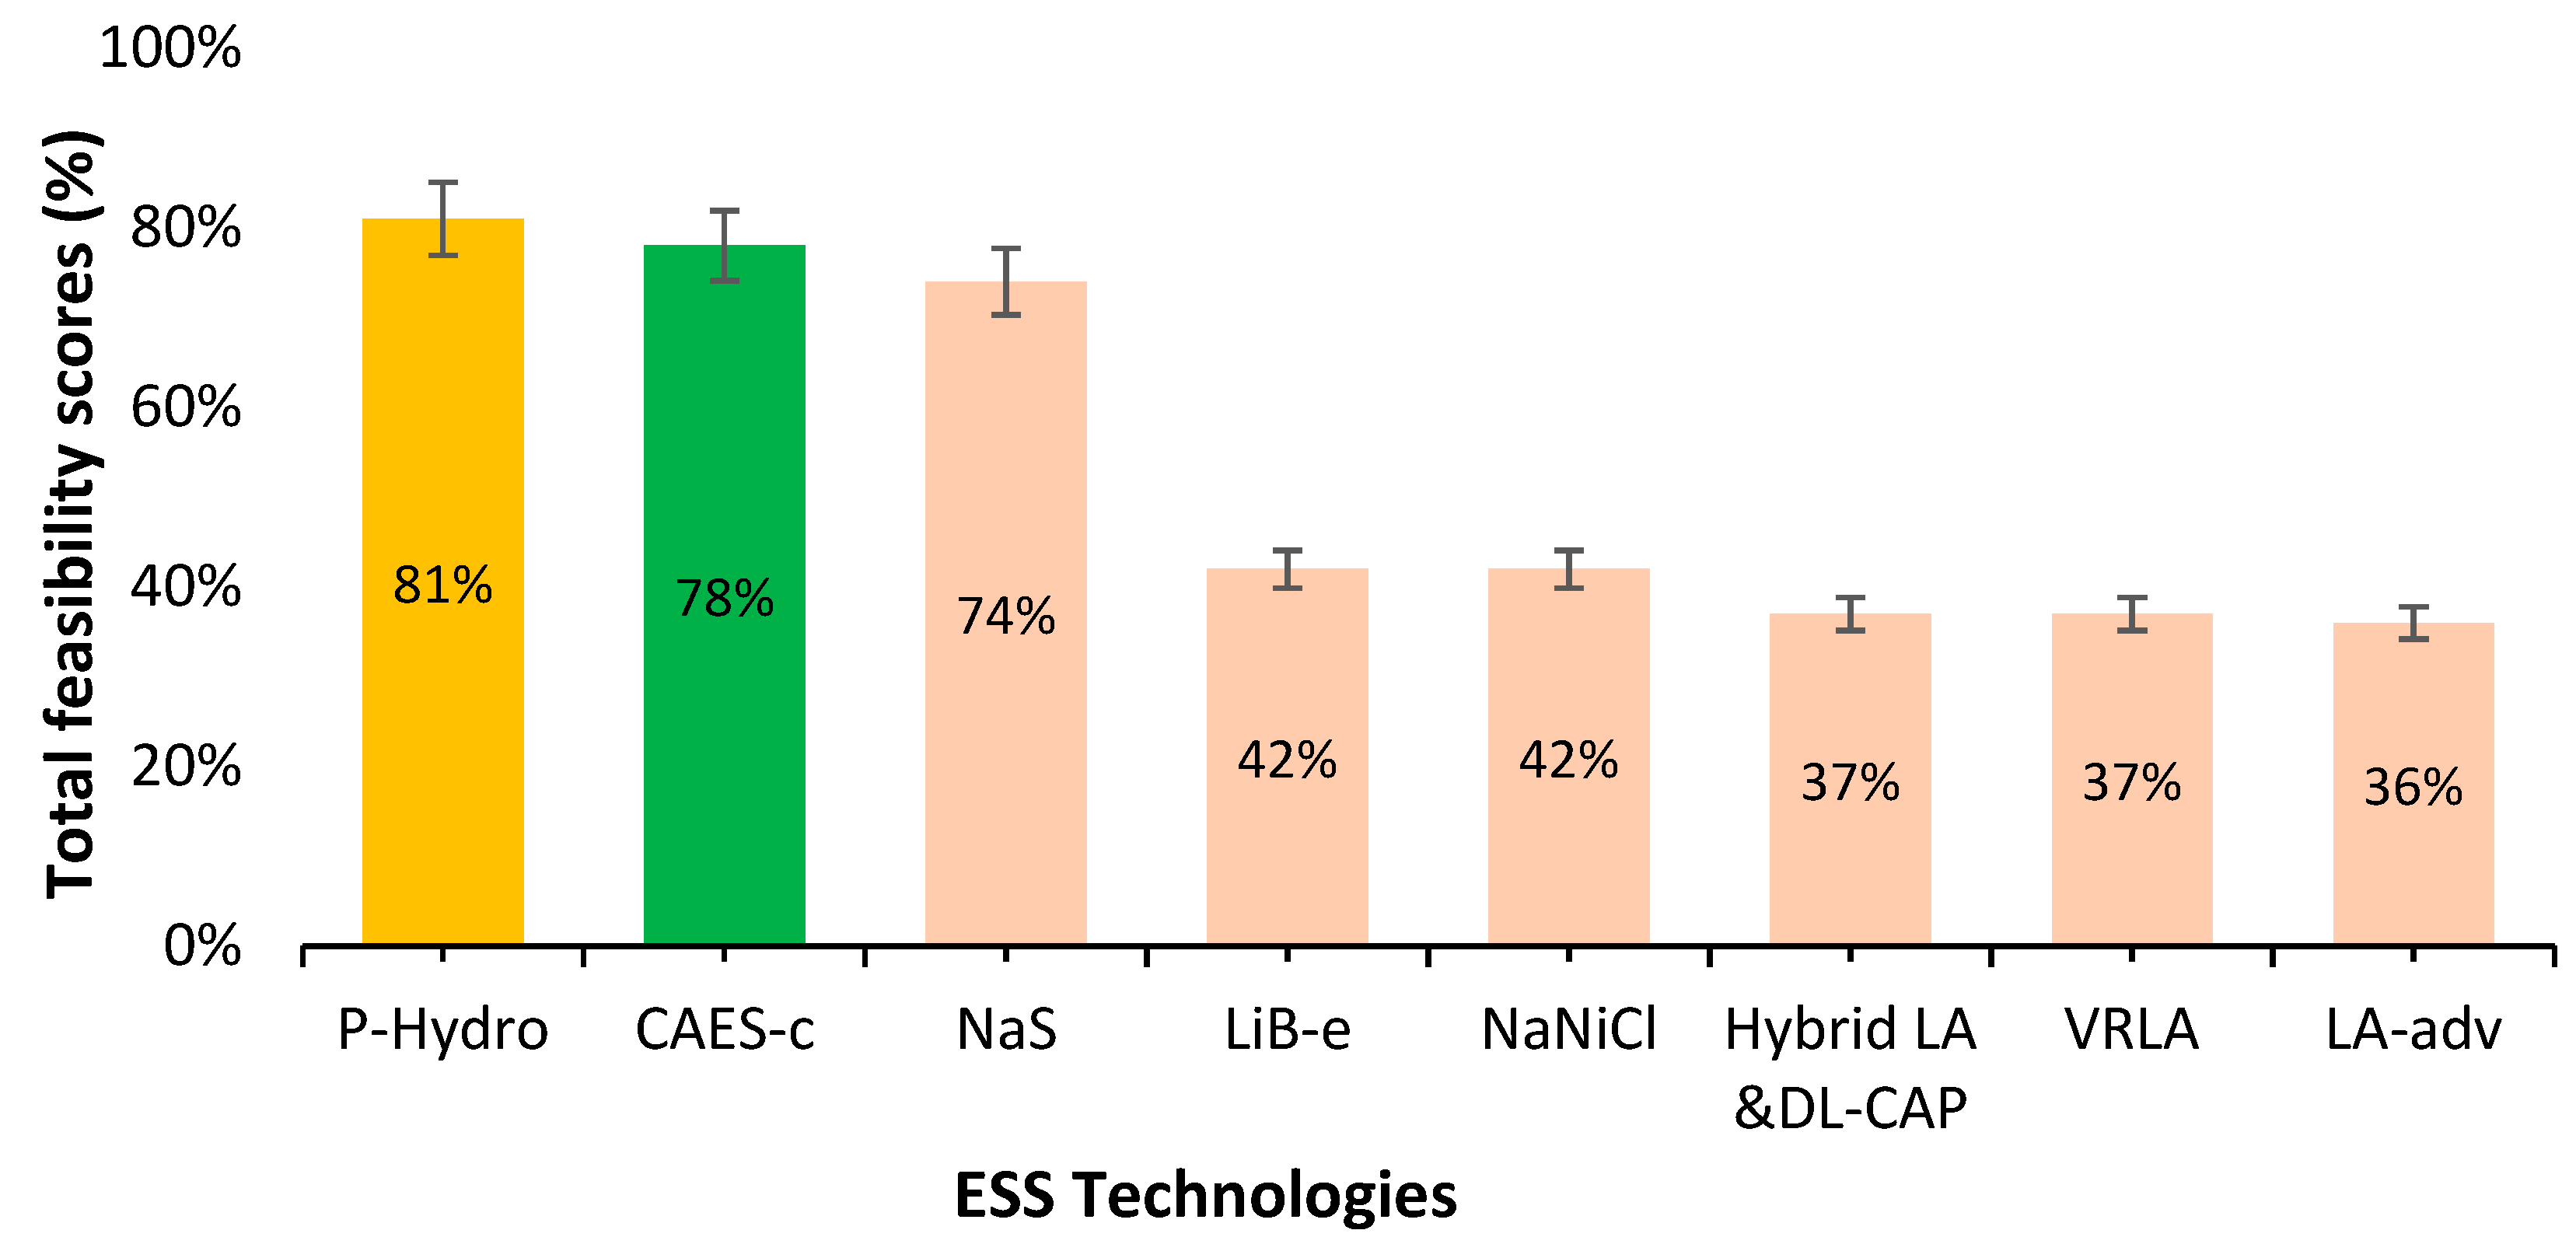
Figure 7 shows that the specific weight factor is accepted at 1 for the feasibility analysis based on the total ESS assessment suitable for meeting the applications list (
Table 1), ALCM criteria, and total installation cost.
As it can be seen from the results of the analysis, in terms of the requirement of the application choosing a central or bulk generation system with an installed capacity of over 50MW, the PHES storage system ranks first with 81%, followed by the CAES-c system with an underground storage cavern of 78%, as well as NaS batteries which are estimated at 74%. Other possible ESS options can be battery-type, and they stand at the same total feasibility points (36–42%). This assessment does not consider the specificities of the national energy system, which the designer must analyze step by step, referring to the country’s context, the real possibility of installation, associated costs, and other limiting factors, which will be addressed in detail below. This ranking of total feasibility points considers the total unit cost expressed in energy generation (USD/kWh) for different energy storage systems applied at the selected location in the grid and calculated in the ES-Select model. If the location points factor increases to 1.5, then the total technology points decrease by 2% for PHES and 3% for CAES-c; other technologies increase by 1% for NaS and 2% for the rest. In the case when the weight factor of applications increases from 1 to 1.5, considering a weight factor of 1 for the maturity criterion, as a function of points accumulated according to the total cost of unit generation (USD/kWh) from the simulation results ranking of storage technologies for applications selected is: PHES at 79%; CAES-c at 77%; NaS at 73%, and other batteries range from (33–41%).
The desirable features of NaS batteries comprise relatively high energy densities (150–300 Wh/L), almost zero daily self-discharge, and a higher rated capacity than other types of batteries (up to 244.8 MWh) high pulse power capability. The battery uses inexpensive, non-toxic materials, leading to high recyclability (99%); however, the limitations are high annual operating costs (USD80/kW/year) and an extra system required to ensure operation. Energy density by volume for NaS batteries is 170 kWh/m, and by weight, it is 117 kWh/ton. The NaS batteries are estimated to have a life cycle of 4500 cycles, approximately a calendar life of 15 years, for a rated discharge capacity of 6 MWh per MW installation [
15,
18].
The analysis shows that the PHES system presents the best solution for storing energy for the chosen application list given in
Table 1. PHES physical faces real constraints as it requires considerable land area for storage reservoirs, which should be no more than 10 km from the generator [
36]. The NaS battery system poses technical risks during the operation and is associated with high costs. The CAES-c system is the most suitable system for a chosen list of applications; however, the “Cash Flow” analysis will be decisive for the form and type of energy storage and storage system for the application package (App1→App6), thus respecting the four criteria (ALCM).
Figure 8 presents the energy efficiency (%) as u function of installation cost (USD/kW).
From
Figure 8, it is shown that the CAES-c technology provides lower efficiency (≈70%) compared with other technologies internally selected from the simulation performed in the ES-Select model. More detailed information about the economic analysis for each scenario (Application) considering different discount rates is given in
Figures S1–S6. The maximum efficiency is achieved by Li-ion battery storage systems (≈91–92%); PHES-type storage systems can do this efficiently (≈80–85%). However, the CAES-c system, compared with other technologies, has a higher installation cost in the given location requirement, ranging from USD 300/kW up to USD 800/kW; nevertheless, this system does not require a large installation area. The combined feasibility analysis considers using existing underground caves, tunnels, and exploited natural gas wells as they make up 40% of the total cost.
As the growth and evolution of the existing and new ESSs become increasingly significant, the task arises to examine different technologies and compare their costs and performance on equal equity. The cost projections provided in
Figure 9 present an initial attempt at accurately defining and capturing the entire cost structure of these storage systems, which were set in the model in the initial stage cost window for each ESS taken from IRENA [
15], IEA [
37], and costs of systems procured at sites across the world to accurately capturing the cost structure of various ESS in Albanian context. CAES-c has the lowest round trip efficiency, varying from 60% to 70%. The total installation cost at selected locations starts from USD 300 to USD 800 per kW of ESS plant capacity. The lifetime throughput energy at 80% depth of discharge (dod) (MWh/kW) comparison for each energy storage technology as a function of their energy efficiency (%) meeting the application list (
Table 1) is given in
Figure 9.
Mechanical ESS technologies (PHES and CAES-c) generally show a higher (MWh/kW) ratio at 80% of other battery storage. Comparing the results of the technologies that support the selected applications shows that battery technologies are less economical when a storage technology is chosen for a large energy capacity rather than energy. Unfortunately, today’s energy storage and storage systems industry has different definitions for the real concept of a “cycle.” In commercial documents, “one cycle” is calculated through the energy flow. This procedure matches the energy entering/leaving the battery and divides the total energy flow by capacity. Although this is a relatively simple calculation, it only expresses the number of “Equivalent Complete Cycles” or (EFCs) “Equivalent Full Cycles”.
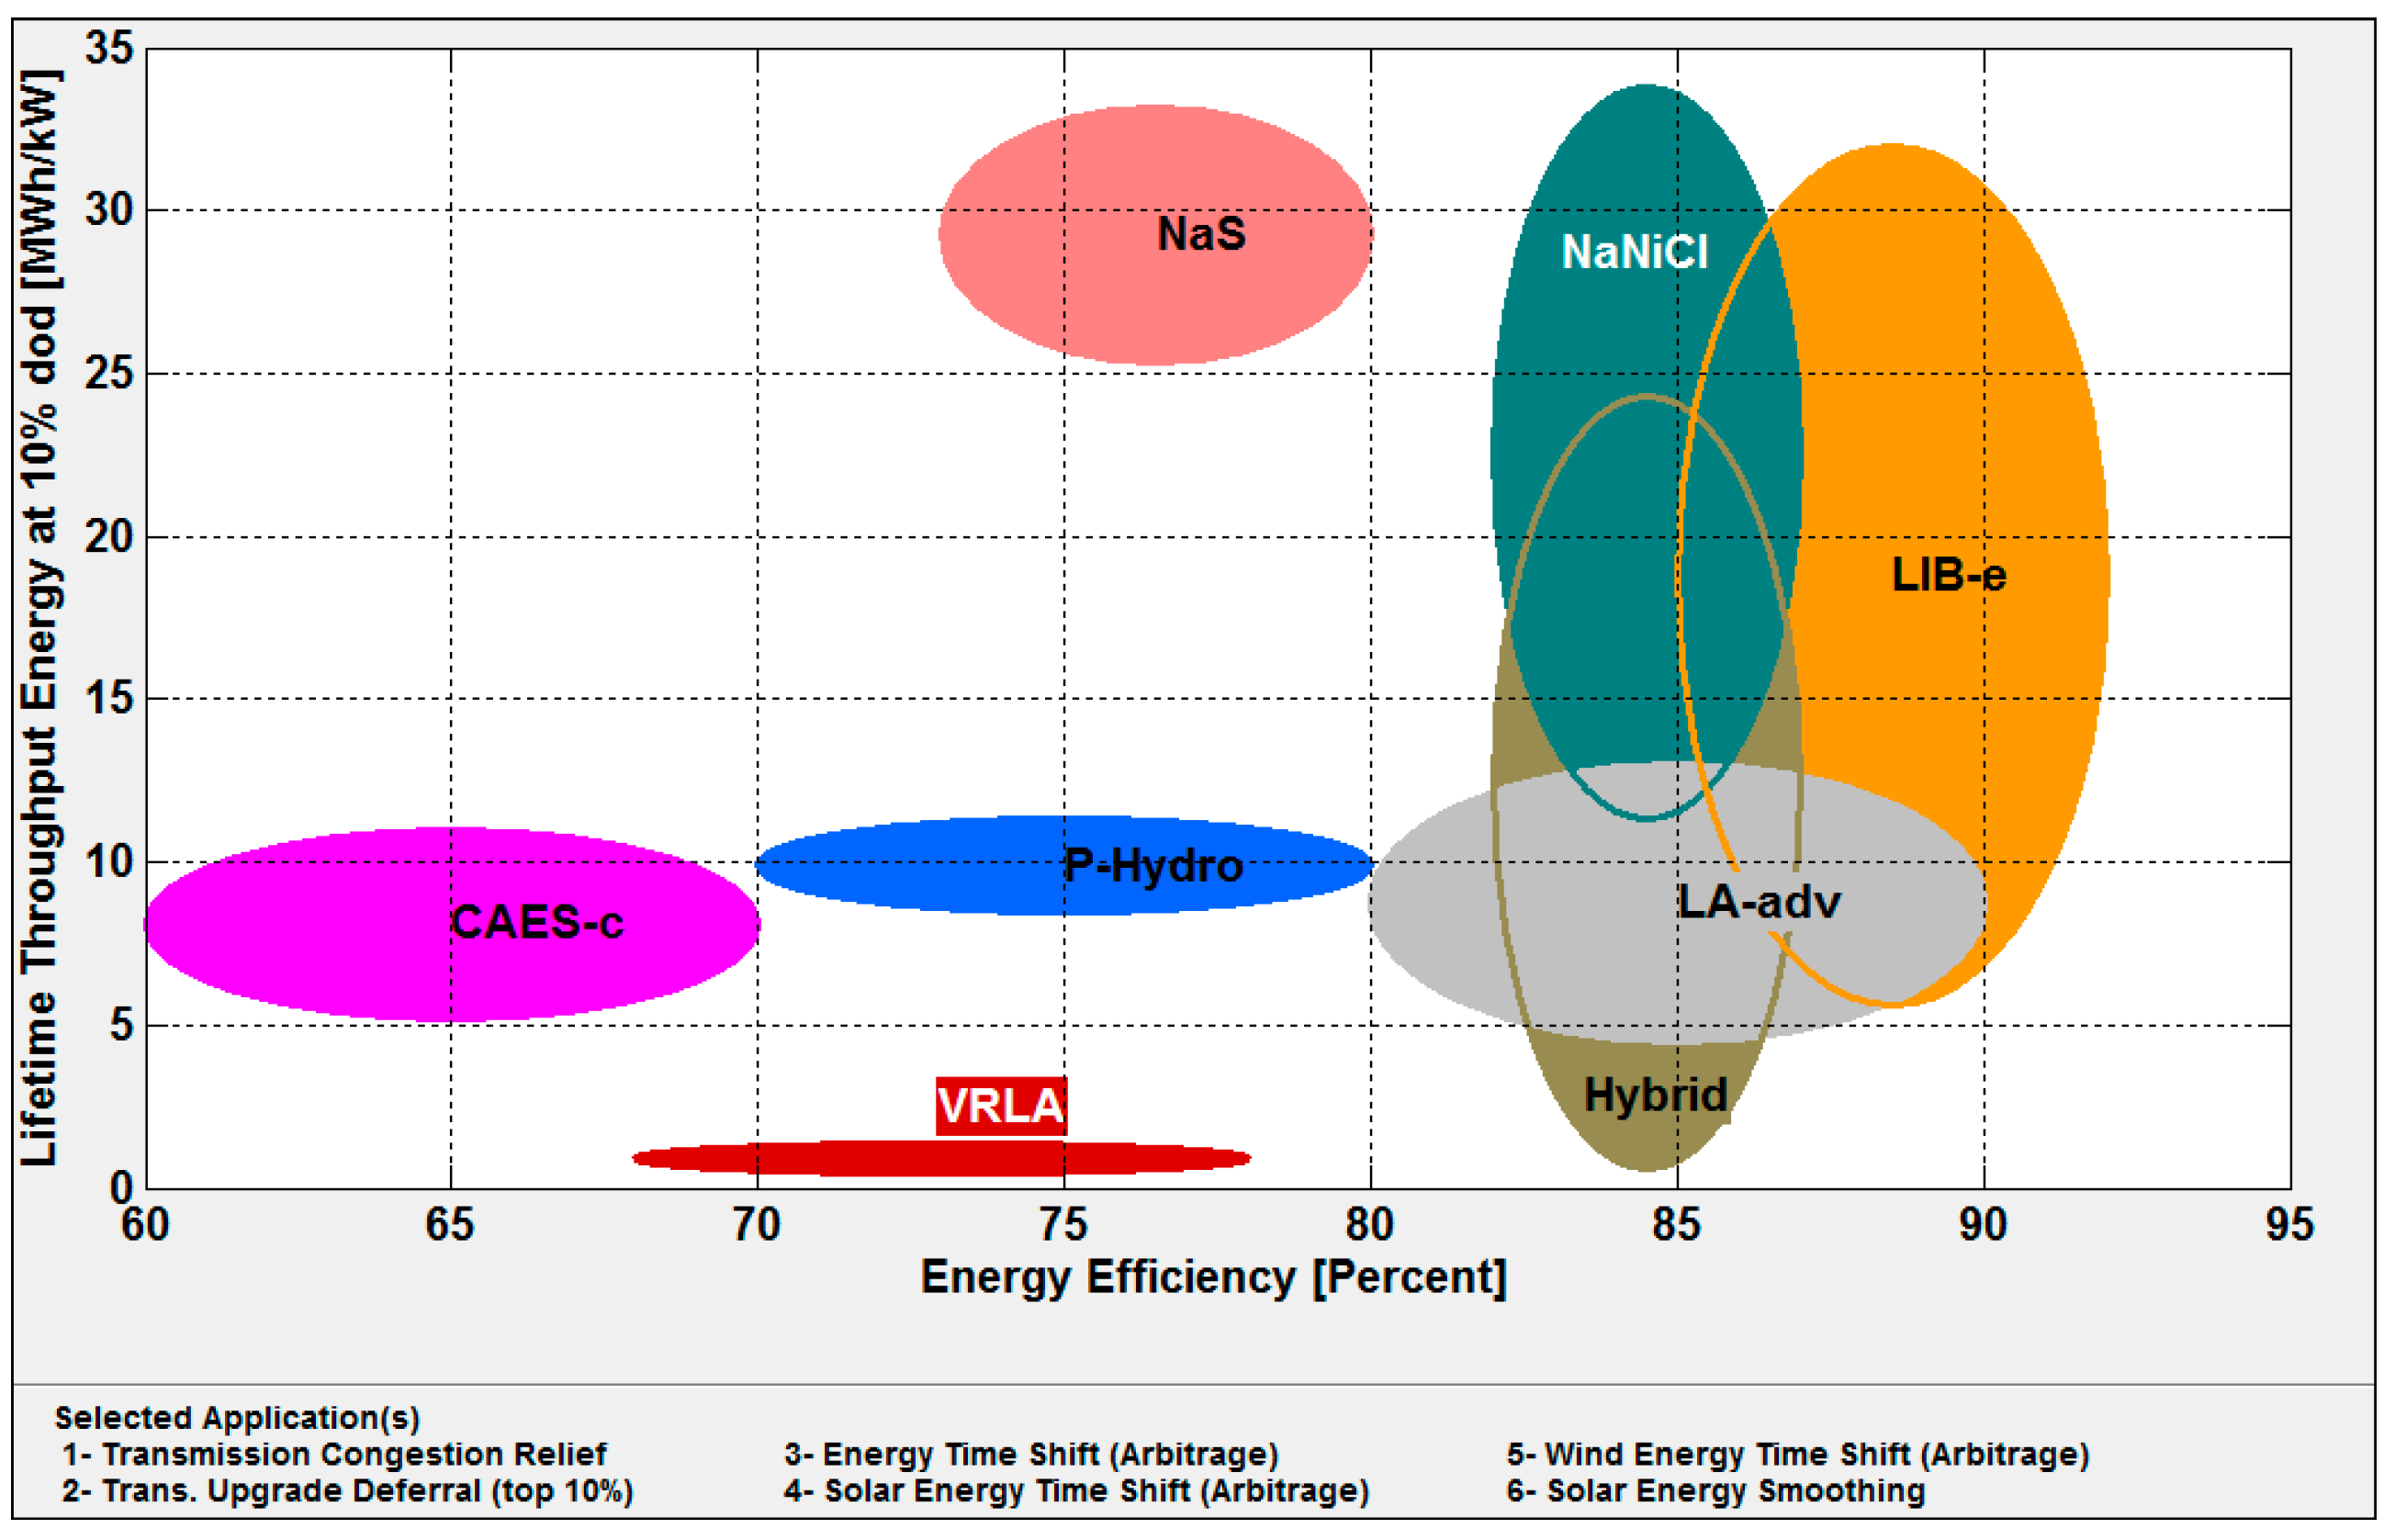
The more often a battery is charged and discharged, the shorter its lifespan. Complete (100%) discharge of batteries is generally not recommended. From engineering practice and studies by various authors in the field, it is shown that complete discharge rapidly degrades the energy conservation system, reducing its lifespan [
21]. It is usually preferred to have this carried out to a certain extent, as recommended by their manufacturers. From
Figure 10, it is shown that the mechanical ESS of CAES-c and PHES types can provide lower lifetime throughput energy at 10% dod (MWh/kW). At the same time, the electrochemical ESS group (battery), such as NaNiCl and LIB-e, has higher efficiency.
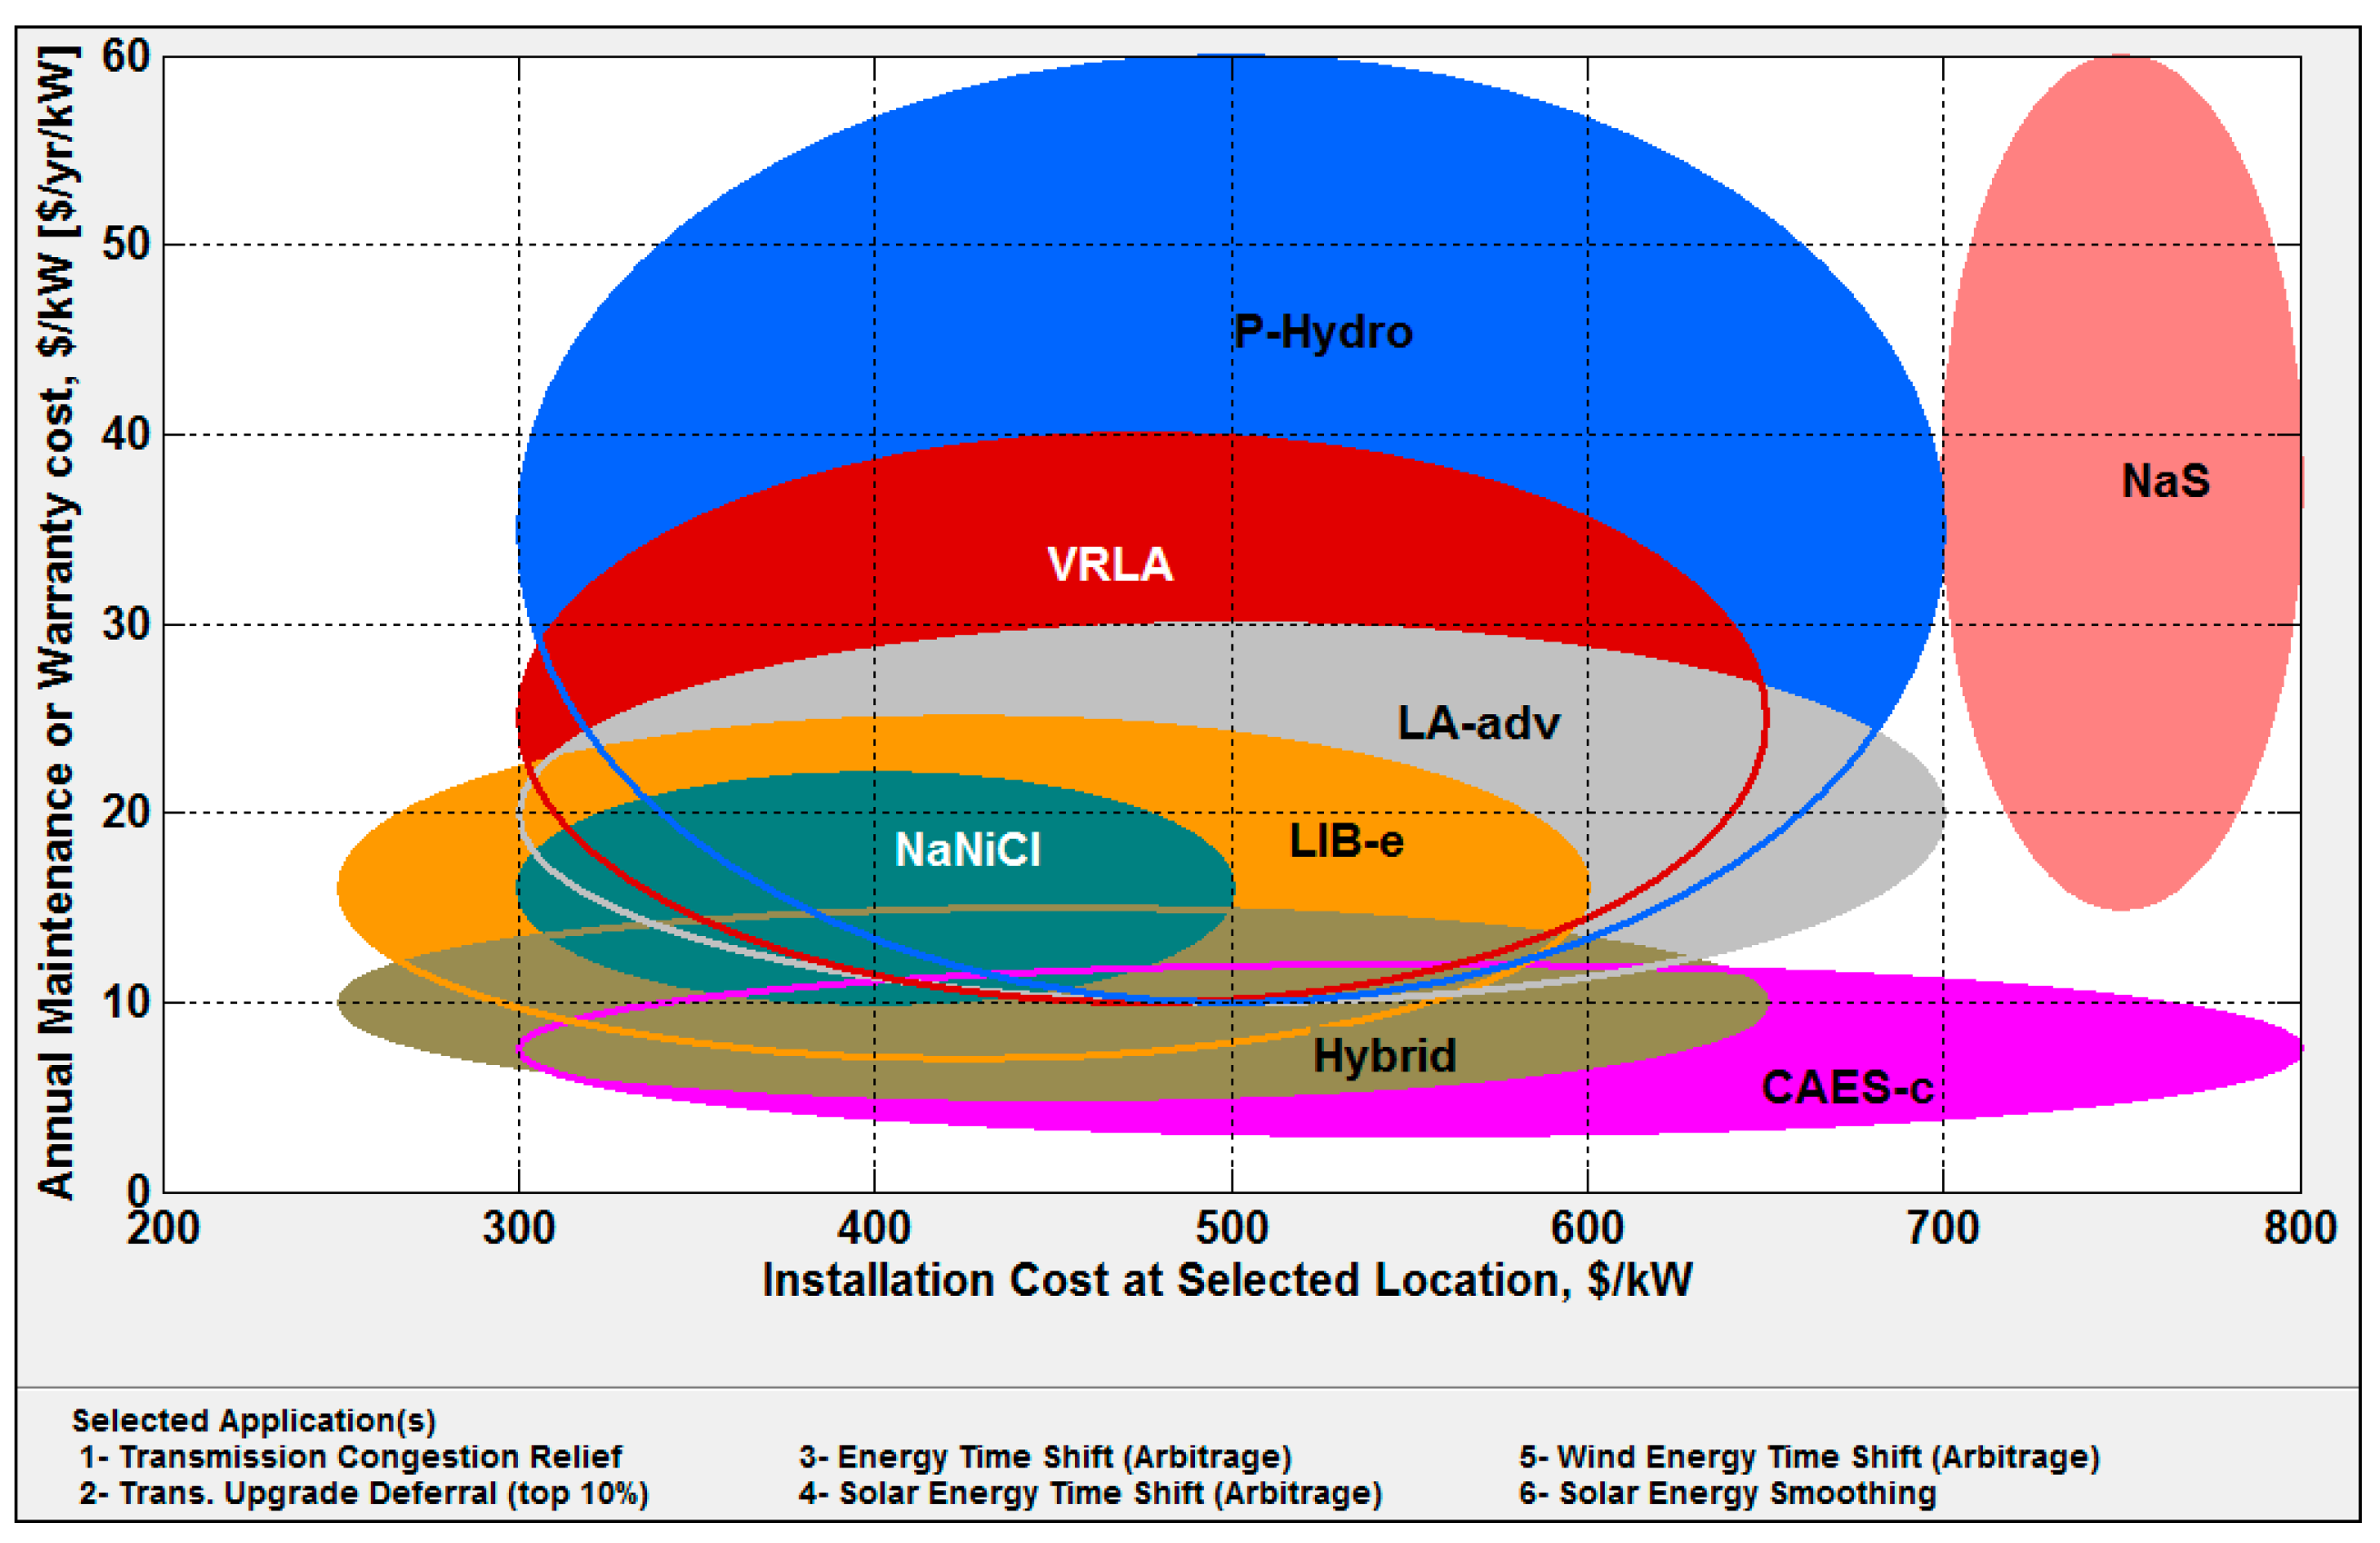
The VRLA battery storage type provides the lowest value, followed by the CAES-c storage system. Although NaS, NaNicL, and LIB-type batteries have a high productivity rate at 10% dod, from
Figure 11, the mechanical energy storage system of type CAES-c has the lowest maintenance unit costs, as reflected in the cash flow analyses. This system’s significant net present value (NPV) (USD/kW) result.
As shown in
Figure 12, the CAES system provides higher NPV values for the given application list. Moreover, hybrid battery systems can provide comparable NPV values versus CAES-c systems. At the same time, the PHES system and NaNiCl batteries have an NPV that falls at an uncertainty zone that varies from negative to positive values. Although all other technologies fell into a negative area, these technologies are not competitive and are excluded from the calculations.
Figure 13 shows the Net Present Value (NPV) as the payback at 20-years of financial analysis. The CAES system assures the return on investment within 5–6 years from the simulation results. Finally, the results of cash flow analysis show that (CAES-c) meets the requirements of the applications list given in
Table 1 (App1→App6) and 4 ALCM criteria, too.
The simulation, estimated benefits, and associated costs of various ESS for the chosen application list meeting ALMC criteria have shown very meaningful results. The most suitable ESS result is CAES-c. The range of possible outcomes for the various assumed parameters can be calculated using sensitivity analysis. Sensitivity analysis is very important to check the potential benefits of the chosen ESS.
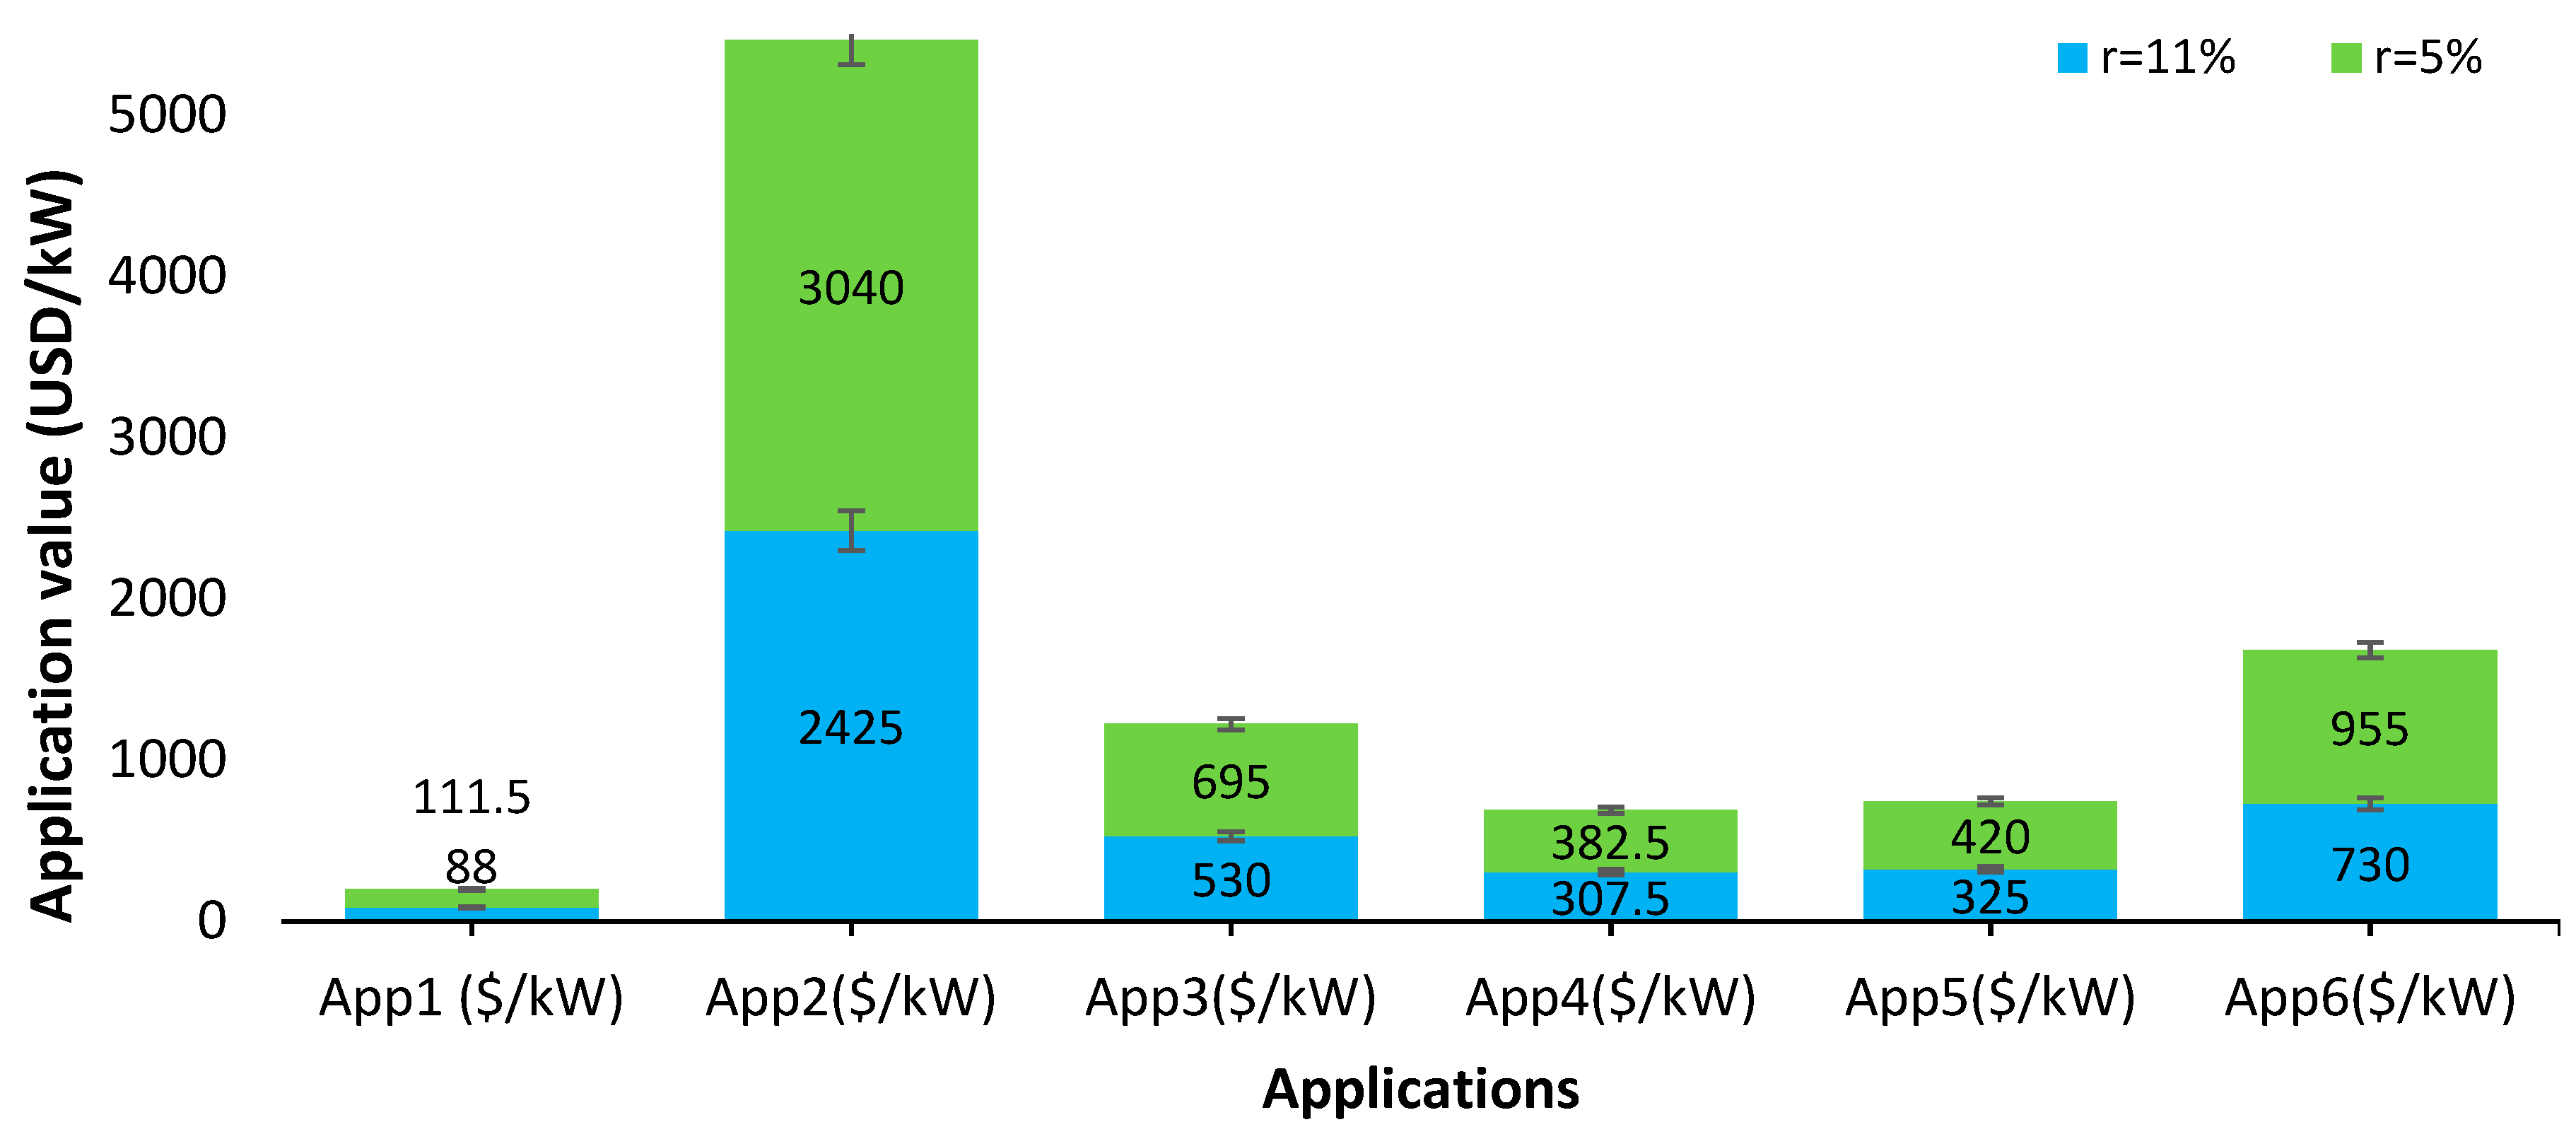
Figure 14 shows the application value (USD/kW) of the CAES-c application from the list of chosen services (
Table 1) at a discount rate of 5% and 11%. App2 application provides high benefit values of (USD 3040/kW) followed by App6 (USD 955/kW) and App3 (USD 695/kW). The simulation results show that ESS contribution is significant, especially if applied to the central or bulk generation. The value of the overall application makes the CAES-c systems incredibly flexible in terms of grid compatibility and profitability at the same time.
Figure 15 shows that by reducing the discount rate, the value of each application increases on average by 7%; however, to assess better the effect of the benefit value of each application, a broader analysis needs to be performed if long-term strategic investments in the field are proposed.
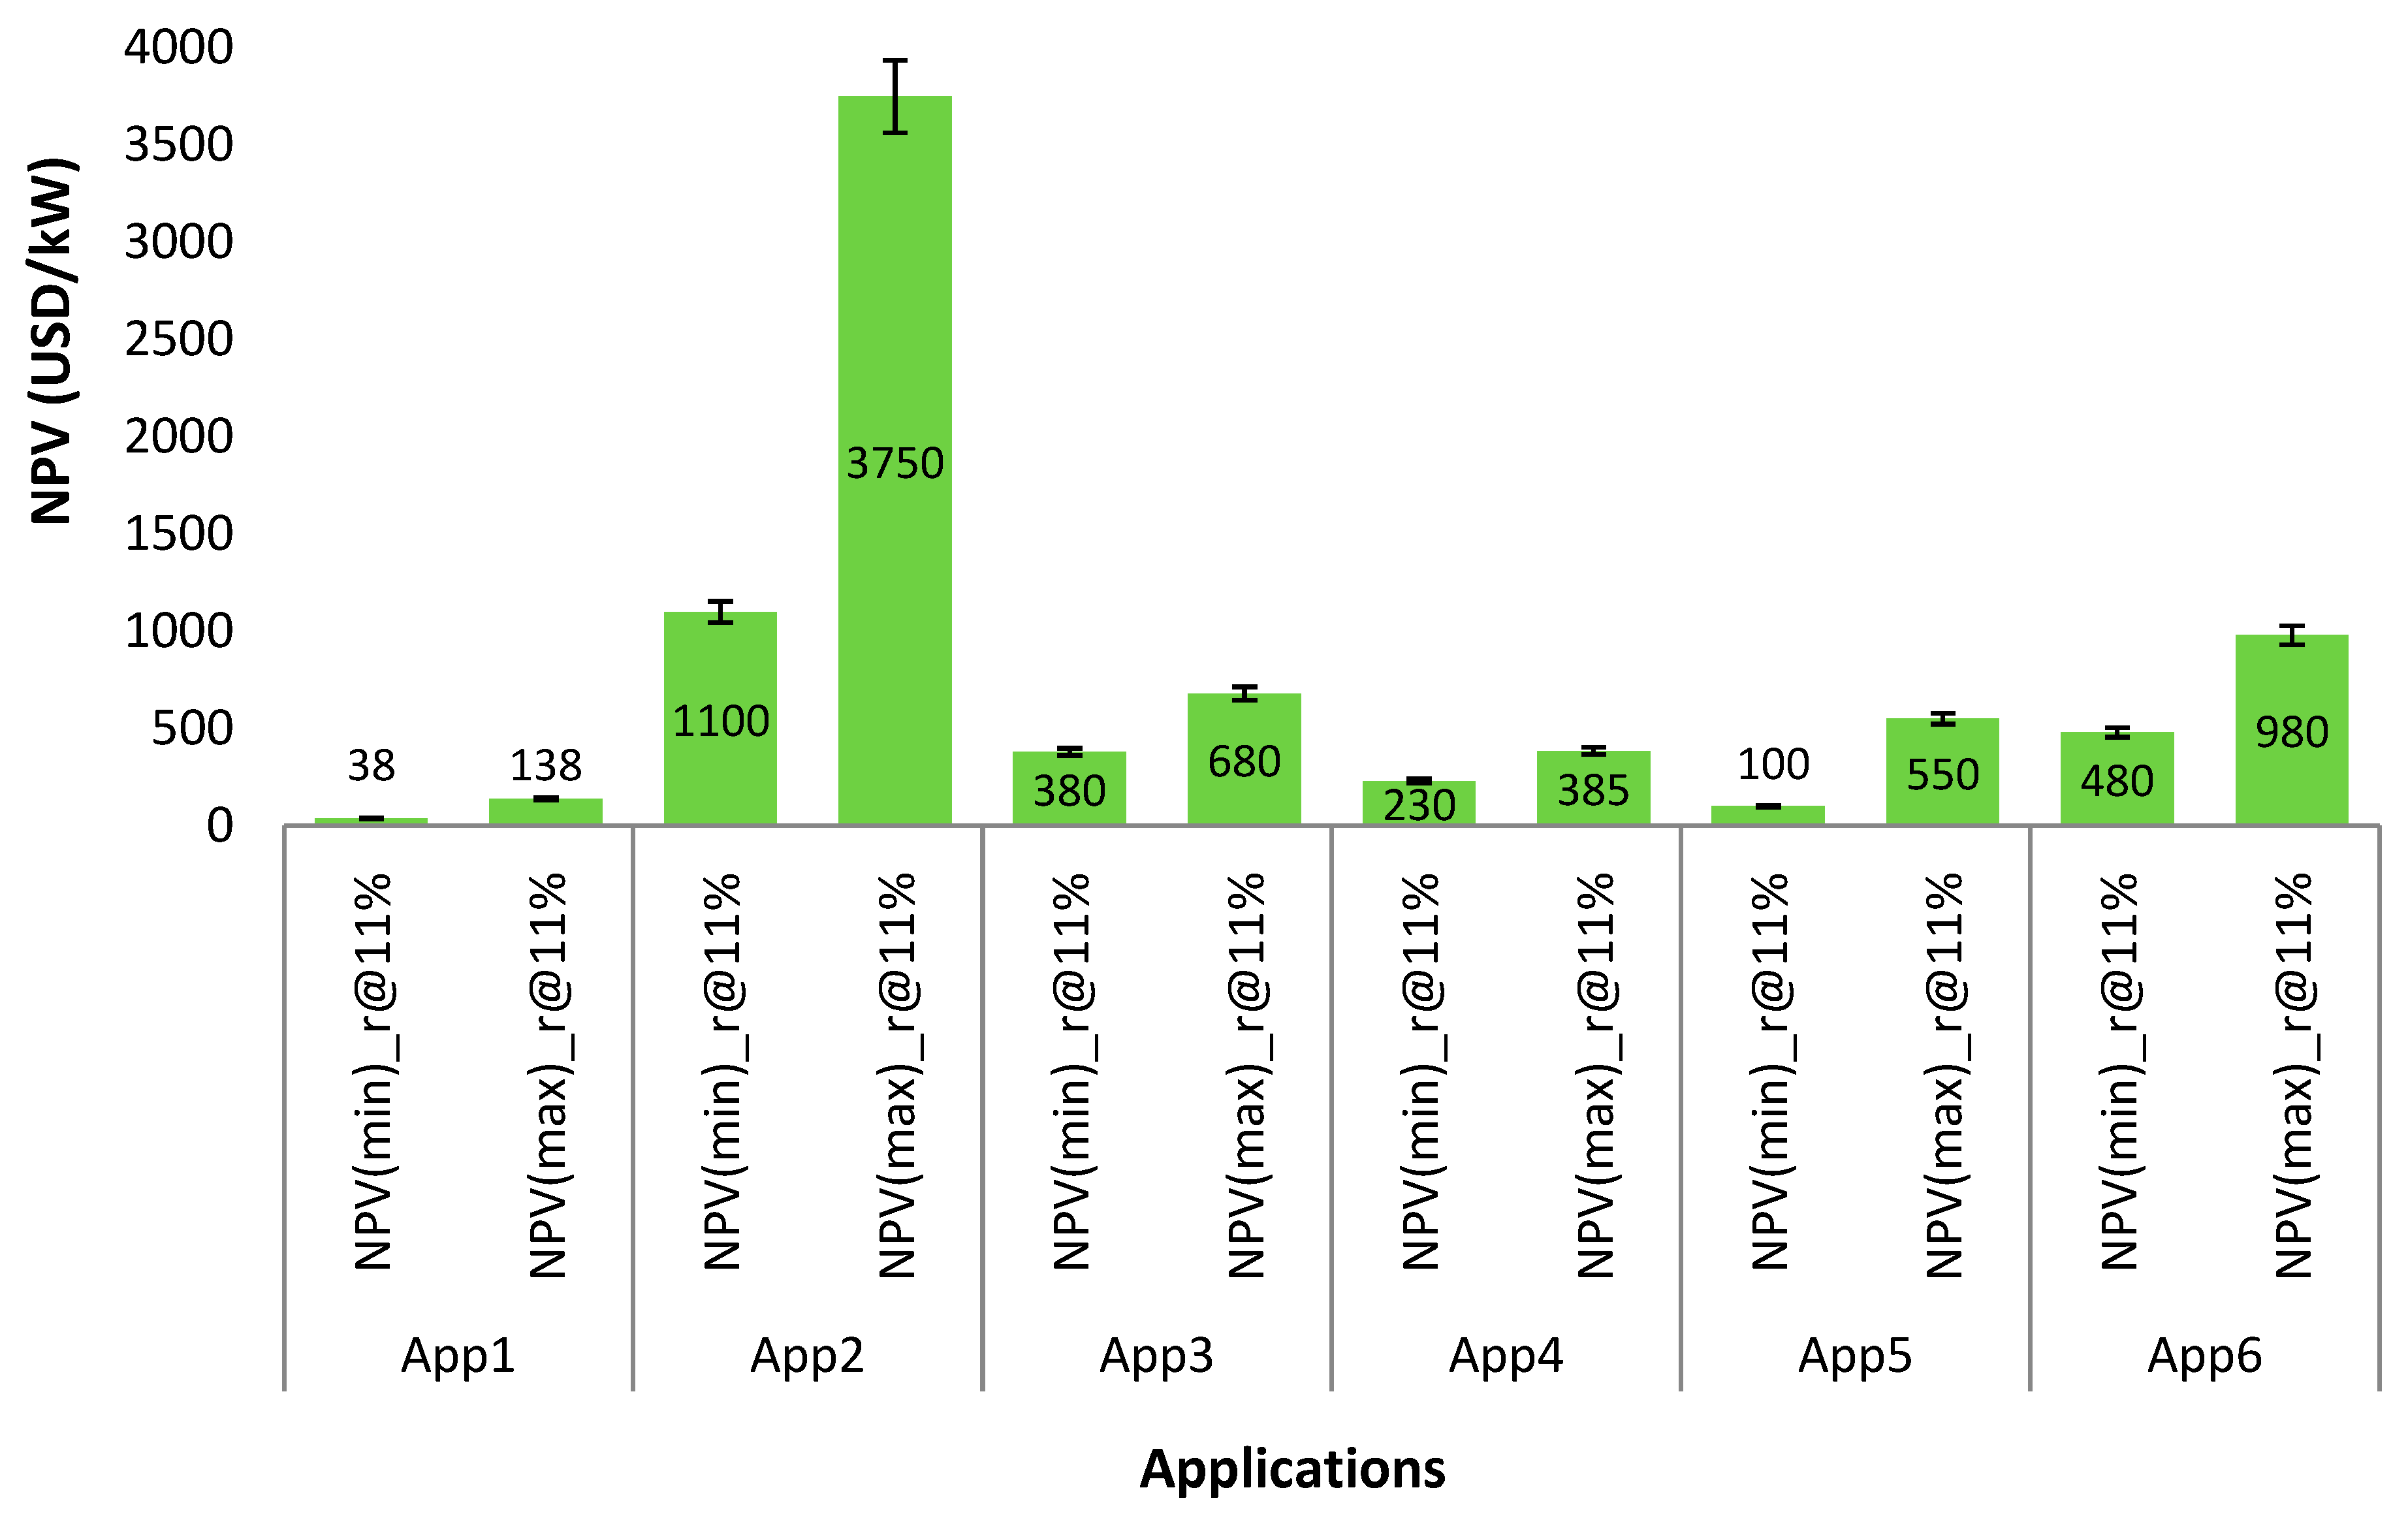
Figure 16 shows the correlation of NPV for each application required at a discount rate of 11% and 5%; as the discount rate decreases, the NPV for each application from the list increases; however, to check the effect of each application value, considering the changes in the price of purchasing electricity (max. and min.) is always necessary. The purchasing price of electricity in the model environment is considered at USD 30/MWh up to USD 50/MWh. The CAES-c can store surplus generated energy during rapidly decreasing demand. This application is particularly beneficial when hydro or fossil-based generation is available at very low prices during off-peak periods.
This study established a framework for estimating the costs and benefits of specific applications, defined in detail. Collecting information on commercial ESS, their development and deployment status, the capacity and size of the system to meet the relevant applications, specific costs, benefit assessments, and relevant references was carried out responsibly. This study assesses the potential benefits and costs of energy conservation at the Drini River cascade HPP, considering other functionalities such as PV and wind penetration in the region. It provides a framework of “options” comparative for the list of applications (
Table 1 and
Figure 4). The deployment of PHES requires suitable terrains with a significant elevation difference between the two reservoirs; hence, it is excluded from the application even if it prevails in terms of total points. The construction of a PHES station typically takes many years, sometimes over a decade. At the same time, CAES-c, if cavern exists, can be introduced in a very short time.
5. Discussion
The study confirms the capabilities, limitations, costs, and benefits of the main storage technologies available, such as PHES, CAES, and various batteries (i.e., NaS, Li-ion, and ZEBRA, among others) potential integration into Albania’s power system. Each technology is listed according to a compatibility algorithm for the list of related applications by performing a comparative procedure between optional systems in the ES-Select model database [
7].
Deferral of investments in the transmission network involves partial or total diversions in investments to renovate the transmission system, using relatively small amounts of storage. Installing a CAES-c storage system, referring to the transmission input node in the “nearly overloaded,” can defer the need for investment over several years [
10,
38]. To defer a possible upgrade within a period, the generating capacity of the ESS must be equal to the expected load increase during the following period.
In these conditions, the presence of ESS in the transmission network drives the need for large investments in the electricity transmission line, improving the use of existing assets in time, allowing the use of investment for other projects, and reducing the financial risk associated with big investments [
21]. The “peak” load in the data occurs historically at specific hours and days of a calendar year, so the integration of CAES-c into the national power system would favor creating a flexible system with the minimal possible losses in the transmission network [
22,
31,
35]. Transmission upgrades to relieve congestion can be expensive in terms of installation costs. ESS installation can provide a smart solution that enables device discharges during peak hours to cater to line stability and possibly defer transmission system upgrades.
Although the primary transmission congestion relief (TCR) application, the CAES-c energy storage system operates under optimal transmission system conditions and indirectly contributes to increasing the lifespan of the components of the transmission system: power lines, power stations, and substations. Energy time-shifting (ETSH) can be implemented as a general system optimization strategy, especially at the central or bulk generation level. Its value depends on marginal factors (i.e., avoidance of new generation capacities), location (generation distance-load), and time (i.e., peak demand occurs only in short periods). In conclusion, referring to the baseline scenario, CAES-c storage systems and hybrid batteries have a high probability of reaching SPP in the first 5–6 years of plant operation, whereas PHES plants and NaS batteries have a lower probability of having the payback period; hence, both technologies are excluded as a possible option [
25,
34]. The analysis of the investment repayment period shows that the CAES-c storage system has the shortest simple payback period (SPP) and the lowest maintenance cost compared with other technologies listed in the model [
8,
25].
NPV change is significant for discount rate values greater than 11%. Although, in other storage technologies, NPV at a discount rate above 7% exceeds the lifespan of the ESS. More specifically, the contribution of CAES is significant, especially in applications with multiple services. From the results of the financial analysis, the value of the Transmission Upgrade Deferral (TUD) application realizes high benefit values (USD 3040/kW), followed by Solar Energy Smoothing (SES) (USD 955/kW) and Energy Time Shift (Arbitrage) ETSH (USD 695/kW), respectively. The value of the applications listed in
Table 1 makes CAES-c systems highly efficient in simultaneously focusing on grid compatibility and profitability. From the baseline scenario results, it is shown that the total benefit of the market potential within a ten-year time frame of plant operation at a given discount rate (%) is as follows: Transmission Congestion Relief (TCR), USD 3.1 billion; Transmission Upgrade Deferral, TUD-USD 17.5 billion; Energy Time Shift (Arbitrage), ETSH-USD 9.5 billion; Solar Energy Time Shift, SESTSH-USD 10.5 billion; Wind Energy Time Shift, WETSH-USD 10.3 billion; and Solar Energy Smoothing, SES-USD 0.13 billion, respectively.
Regarding the cost of preservation, the underground geological formations of the exhausted gas and the aboveground tunnels constitute a technical and cost-effective solution. Knowledge of the construction structure, the characteristics of the geological formation in the layers, their volumes, and their physical condition require modest investments as caverns share approximately 40% of the installation cost [
15]. By 2030, it is expected that cost could decline to USD 44/kWh from USD 53/kWh in 2016 [
15]. CAES systems can reach lifetime cycles of up to 100,000 equivalent full cycles but with fairly poor depth of discharge potential. In Albania, many mines, caverns, and exploited gas wells can be used to store secondary energy in the form of compressed air [
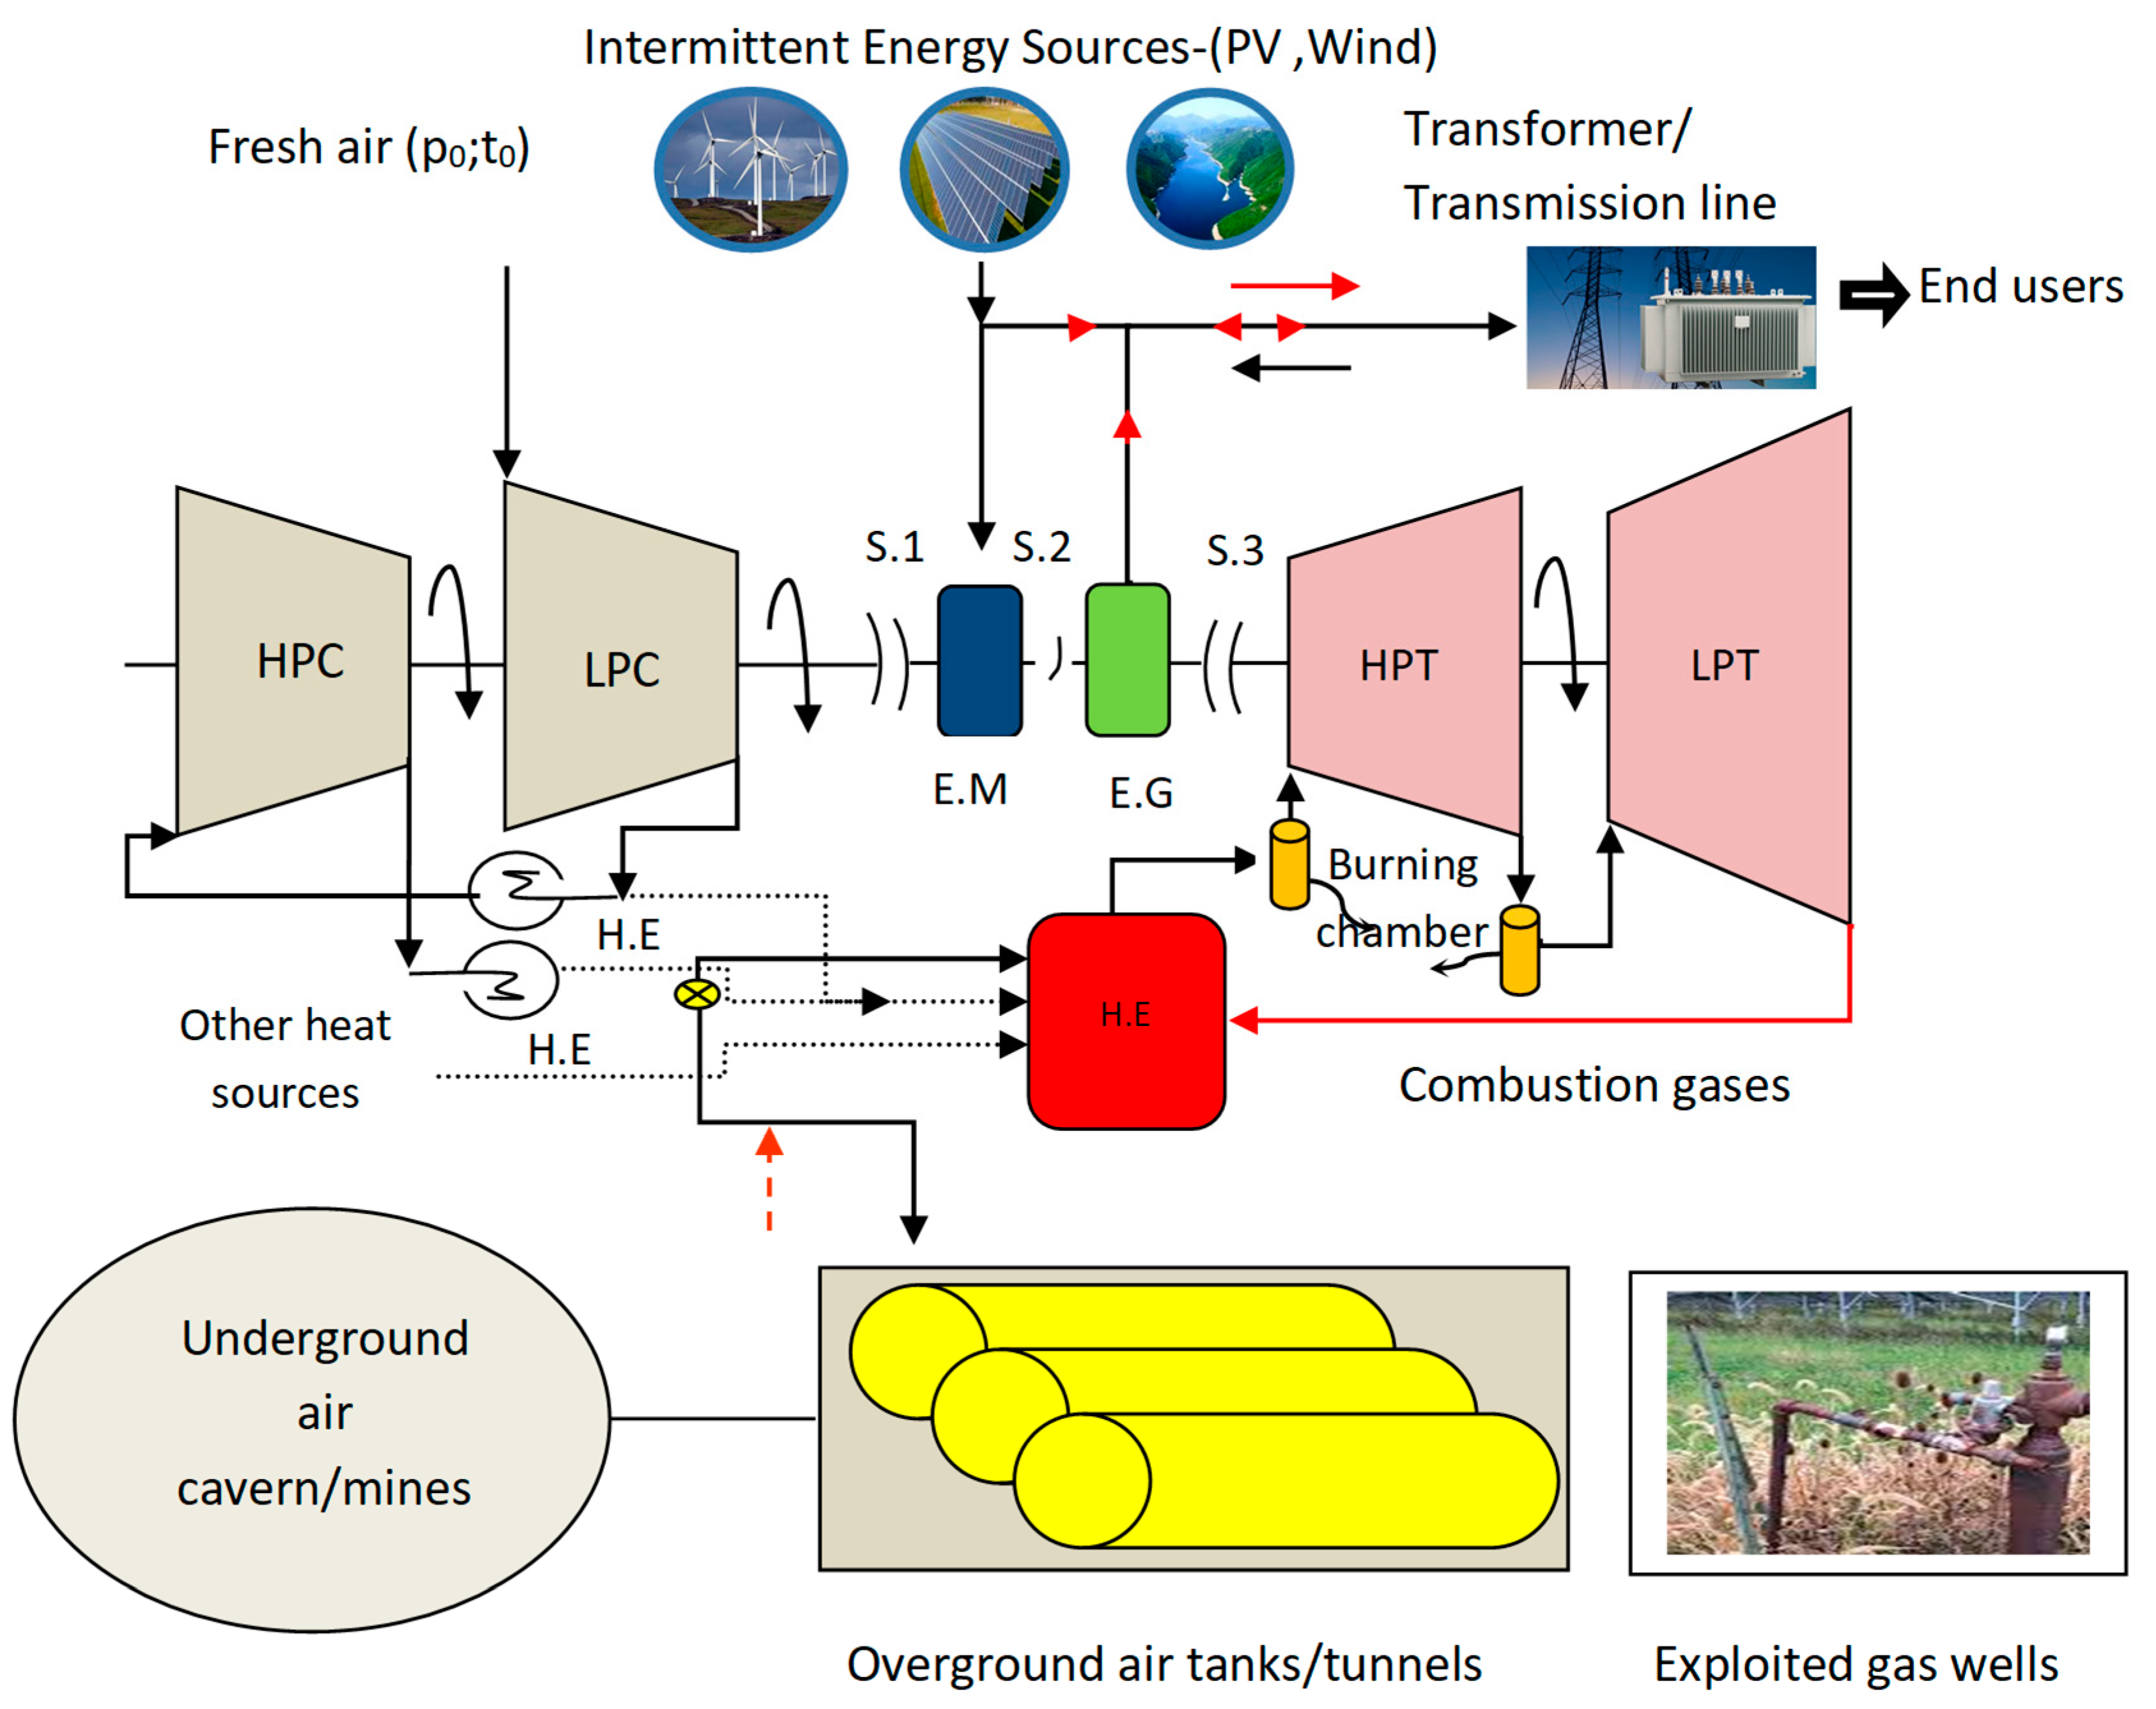
39], as shown in the schematic diagram in
Figure 17.
During the periods of low power demand, the surplus electricity can be used to drive a reversible motor/generator unit, which, in turn, can run a train of coaxial compressors to put air into a deposit, which is either an underground cavern, gas well, mine tunnel or overground tank. When the power generation cannot meet the load demand, the stored compressed air is given and heated by passing into heat exchangers (H.E) devices, a heat source that can be provided from fossil fuel combustion, or the heat recovered from the heat the compression process. The waste heat from the exhaust can be recycled by a recuperator unit (i.e., red box H.E). The compressed air energy is then captured by the turbines producing back electricity. Although CAES systems’ case, the compression and expansion phases are decoupled instead of simultaneous, CAES systems work under similar principles as conventional gas turbines. The energy is stored in high-pressure air, typically at a pressure of between 40 (bar) to 80 (bar).
In a CAES plant, 1 kWh worth of natural gas will be required for every 3-kWh generated from a normal CAES system [
40]. This is predominantly challenging if fossil fuels are used to generate extra heat. Referring to the post-COVID energy situation and natural gas prices increase, the cost of CAES, which is marginal, could fail. The detailed study of energy conservation alternatives within the electricity sector in Albania is the main pillar of this research, which provides for the integration of the ESS in the “central or bulk generation” chain, as the sector’s problems are evident.
Electricity storage can avoid congestion-related costs and charges, especially if the costs are considerably high due to substantial transmission system congestion. In this service, storage systems would be installed at locations electrically downstream from the congested portion of the transmission system. Thus, in countries such as Albania, which have an energy system highly dependent on HPP and other RESs, integration of ESSs has a profound role in supporting the diversification of the energy system.
6. Conclusions
The portfolio of ESSs’ integration into Albania’s existing and future power system provides a range of services mainly to support the electricity transmission lines and large-scale integration of RES.
ES-select software, a highly interactive model that offers a means to carefully analyze the many interrelated factors that influence the overall feasibility scores of various ESSs that meet the application list, is chosen. Our findings suggest that ESSs can reduce or eliminate the need for high-cost investments in T&D facilities and accommodate more RES, leading to a diversified, flexible, and smart energy system.
At the end of this study, it is suggested to install a CAES-c plant with an output capacity of 135 MWe using exploited/abandoned gas wells or existing tunnels/mines near the installation site. By compression of 115 (kg/s) at 8 h/day, the total investment cost can be approximately USD l54 m up to USD l67.5 m. This should be considered if an A-CAES-c (adiabatic) has an additional cost of 5%, up to 7%, of the total investment.
The study results are also positioned around their power, energy relationship, and benefits in 10 years. From the financial analysis, considering CAES-c, the value of the Transmission Upgrade Deferral (TUD) application shows high benefit values (USD 3040/kW), followed by Solar Energy Smoothing (SES) with (USD 955/kW) and Energy Time Shift (Arbitrage) ETSH (USD 695/kW), respectively. The value of the applications listed in
Table 1 makes CAES-c systems highly efficient in simultaneously focusing on grid compatibility and profitability. From the baseline scenario results, it is shown that the total benefit of the market potential within a ten-year time frame of plant operation at a given discount rate (%) is as follows: Transmission Congestion Relief (TCR), USD 3.1 billion; Transmission Upgrade Deferral, TUD-USD 17.5 billion; Energy Time Shift (Arbitrage), ETSH-USD 9.5 billion; Solar Energy Time Shift, SESTSH-USD 10.5 billion; Wind Energy Time Shift, WETSH-USD 10.3 billion and Solar Energy Smoothing, SES-USD 0.13 billion, respectively.
In Albania, rapid response in terms of ESS integration, and multiple functions in the bulk or transmission system optimization, has been limited due to the lack of research initiatives and cooperation between key actors in the country; therefore, it is extremely difficult for a developer to tackle the energy sector’s challenges alone on the path to achieving 2030 to 2050 energy goals without the features above.


