
Optimization of Multidimensional Energy Security: An Index Based Assessment

 ,
,  and
and
Abstract
:1. Introduction
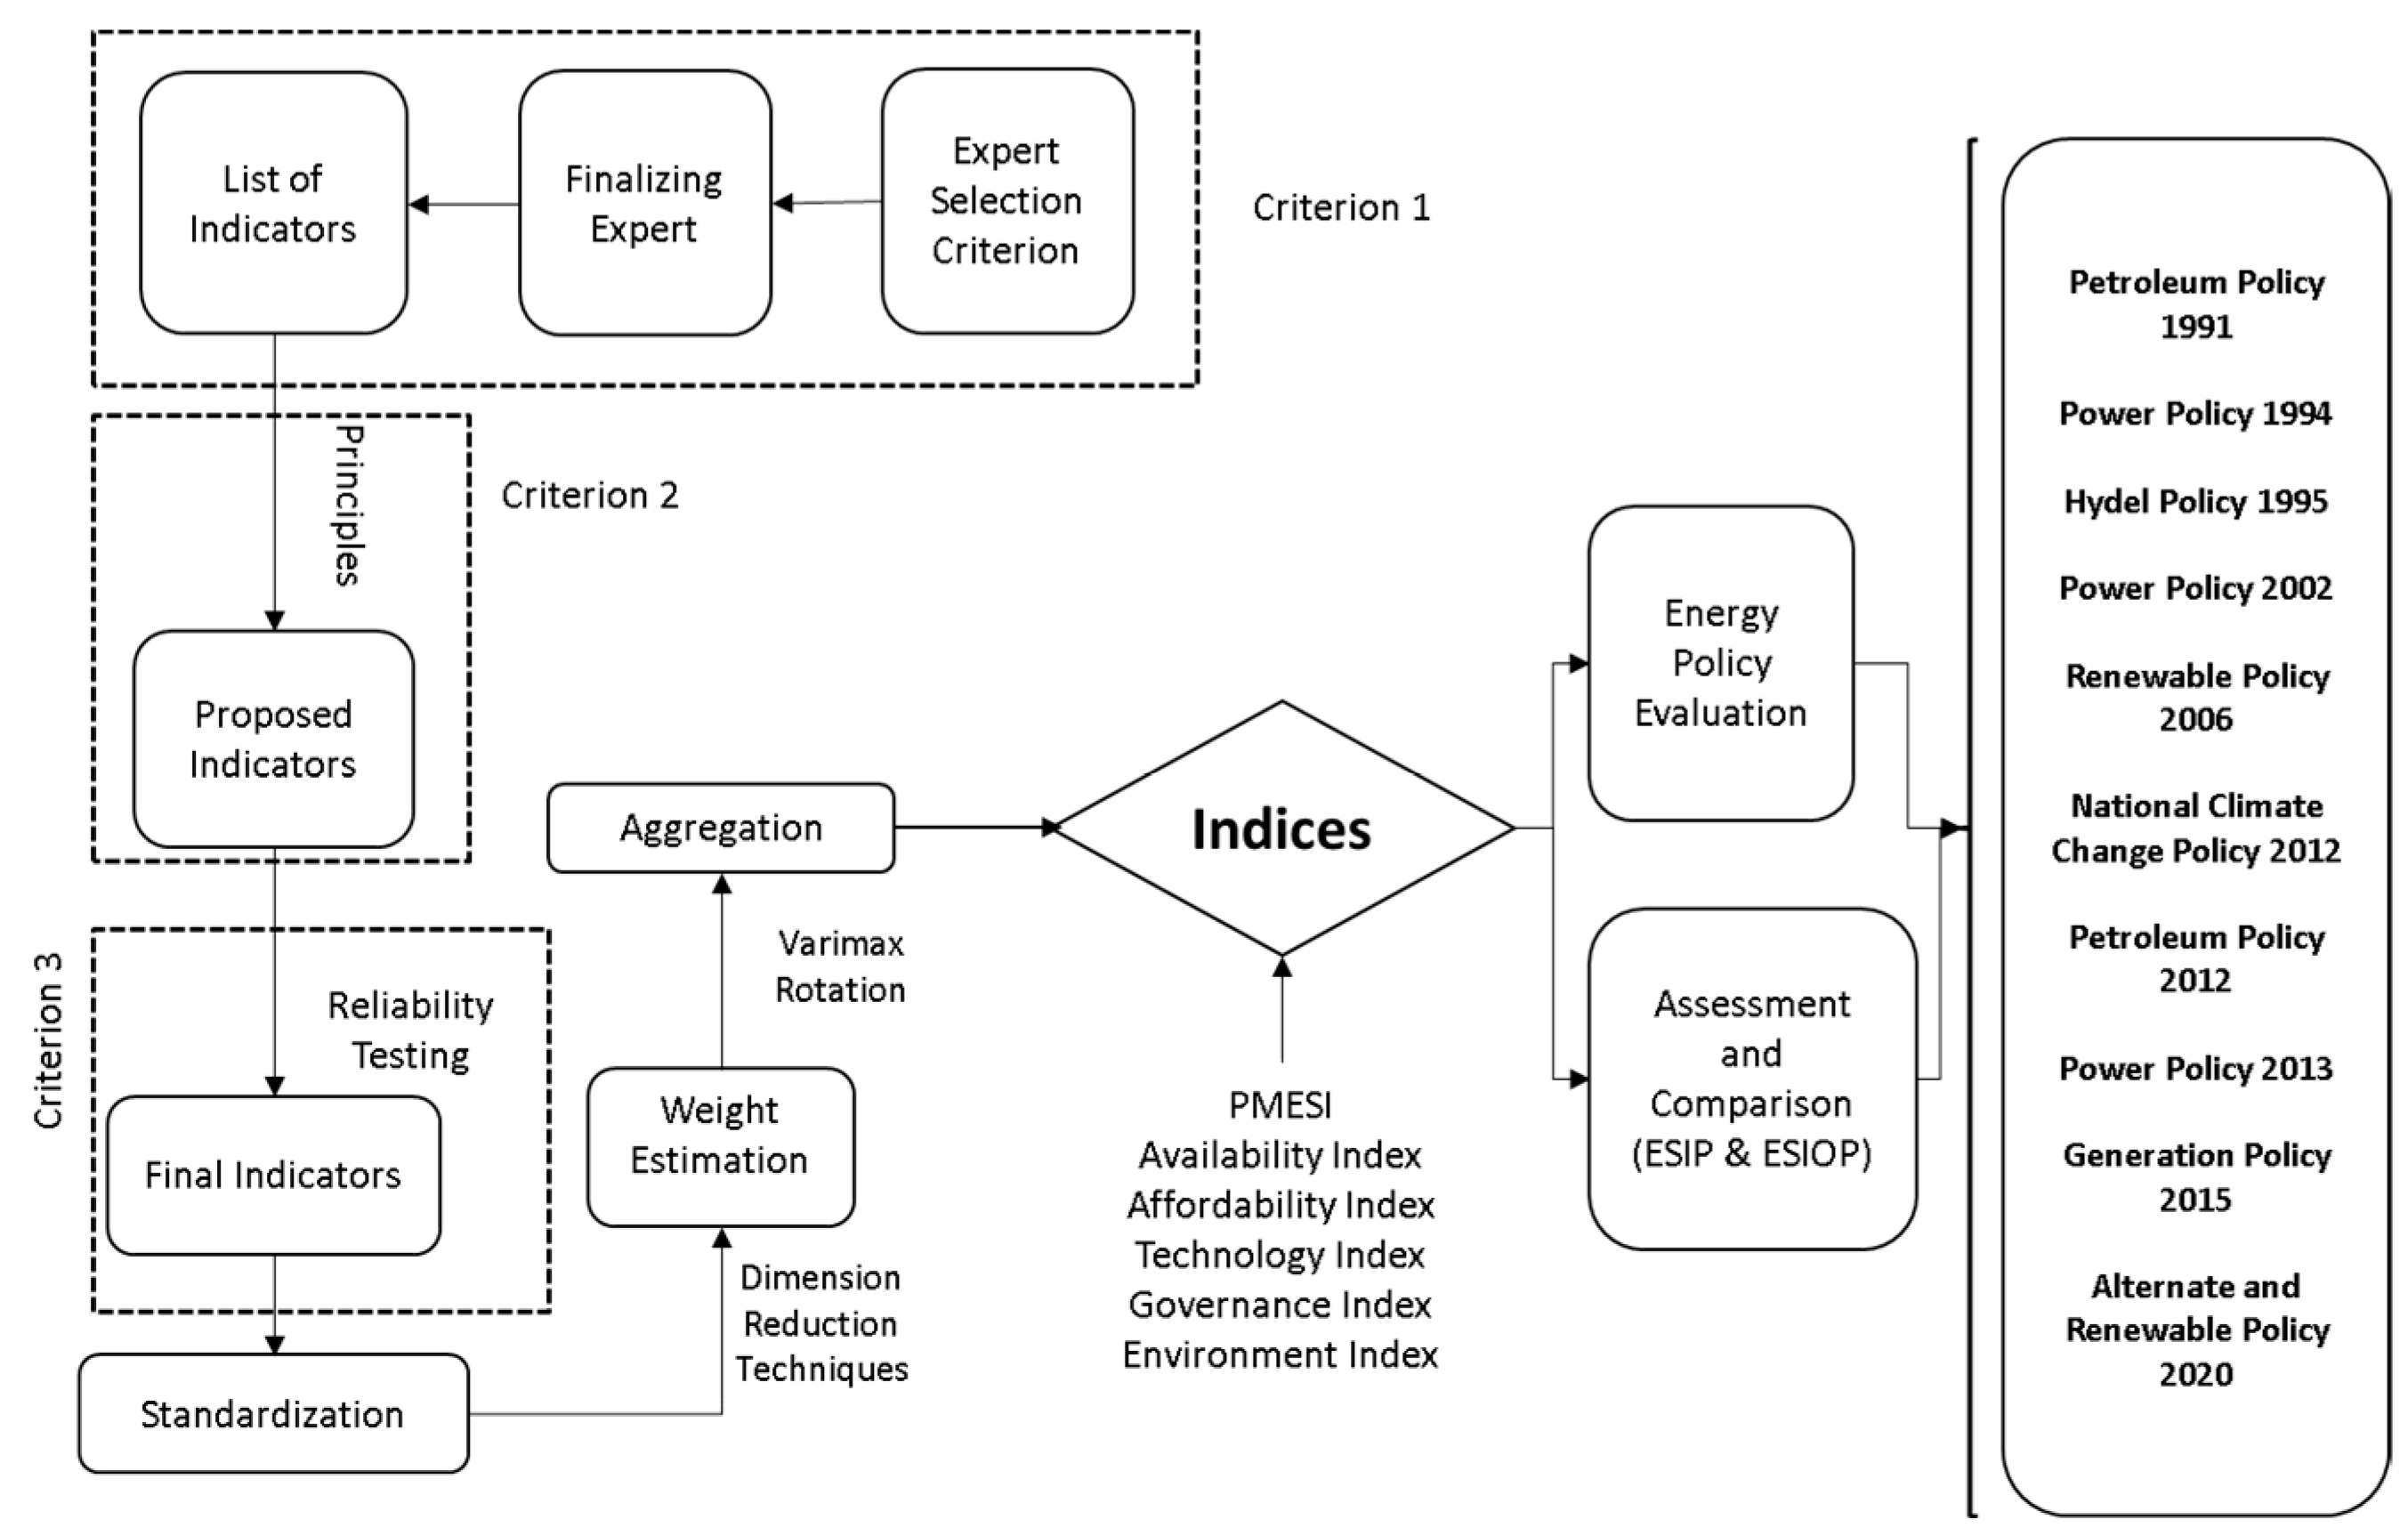
2. Materials and Methods
- where is relative indicator i of year j, Xij and is value of the positive indicator i of year j, is maximum value of indicator i, and i is indicator i.
- where is group index ‘k’ of year j, is the relative positive and negative indicator i of year j; also, m is the number of indicators in each group.
- where is the Aggregated Indicator of year j, is group index ‘k’ of year j, and is weighting factor of group index ‘k’.

| Dimension | ||||
|---|---|---|---|---|
| Component | ||||
| % of Variance | Cumulative % | Weight | ||
| AV | 1 | 59.557 | 59.557 | W1 = 59.557/90.918 = 0.655 |
| 2 | 31.361 | 90.918 | W2 = 31.361/90.918 = 0.344 | |
| AFF | 1 | 51.171 | 51.171 | W1 = 51.171/83.085 = 0.615 |
| 2 | 31.915 | 83.085 | W2 = 31.915/83.085 = 0.384 | |
| TE | 1 | 57.940 | 57.940 | W1 = 57.940/87.815 = 0.659 |
| 2 | 29.876 | 87.815 | W2 = 29.876/57.940 = 0.340 | |
| GR | 1 | 41.589 | 41.589 | W1 = 41.589/80.194 = 0.518 |
| 2 | 38.606 | 80.194 | W2 = 38.606/80.194 = 0.481 | |
| ES | 1 | 82.851 | 82.851 | No need for weight as one group was extracted |
| Year | AV Ind | AF Ind | TE Ind | GR Ind | ES Ind | PMESI | ESIP | ESIOP |
|---|---|---|---|---|---|---|---|---|
| 1991 | 6.42 | 2.84 | 7.11 | 0.22 | 4.14 | 4.98 | 8.36 | 7.94 |
| 1992 | 6.81 | 1.20 | 7.59 | 0.28 | 3.90 | 4.47 | 8.38 | 7.04 |
| 1993 | 3.98 | 0.86 | 2.66 | 0.24 | 3.68 | 2.96 | 8.16 | 6.69 |
| 1994 | 5.35 | 2.03 | 2.57 | 0.42 | 3.40 | 3.91 | 8.32 | 6.44 |
| 1995 | 3.20 | 0.76 | 2.44 | 0.13 | 3.62 | 2.53 | 8.04 | 6.12 |
| 1996 | 2.50 | 0.84 | 2.15 | 0.16 | 2.86 | 2.41 | 7.89 | 5.89 |
| 1997 | 2.61 | 0.82 | 4.15 | 0.18 | 2.58 | 2.73 | 7.79 | 5.79 |
| 1998 | 2.62 | 0.81 | 4.84 | 0.17 | 2.00 | 3.00 | 7.74 | 5.75 |
| 1999 | 3.96 | 0.83 | 4.46 | 0.39 | 2.23 | 3.49 | 7.59 | 5.50 |
| 2000 | 5.21 | 1.37 | 5.58 | 0.43 | 1.89 | 3.73 | 7.68 | 5.78 |
| 2001 | 3.99 | 1.09 | 4.50 | 0.28 | 1.69 | 3.00 | 7.70 | 5.66 |
| 2002 | 3.00 | 1.40 | 2.90 | 0.32 | 4.31 | 3.69 | 7.85 | 5.67 |
| 2003 | 2.98 | 1.24 | 1.18 | 0.44 | 1.06 | 2.87 | 7.95 | 6.06 |
| 2004 | 4.68 | 1.21 | 2.06 | 0.21 | 1.93 | 2.00 | 7.74 | 5.82 |
| 2005 | 1.62 | 1.79 | 1.90 | 0.41 | 1.67 | 1.98 | 7.95 | 5.85 |
| 2006 | 1.47 | 3.19 | 3.20 | 0.29 | 3.93 | 2.89 | 8.04 | 5.54 |
| 2007 | 2.79 | 4.71 | 2.08 | 0.41 | 0.88 | 2.91 | 7.80 | 5.43 |
| 2008 | 3.60 | 3.67 | 1.27 | 0.30 | 2.45 | 2.80 | 7.91 | 5.33 |
| 2009 | 3.15 | 2.10 | 1.72 | 0.25 | 3.31 | 2.45 | 7.89 | 5.32 |
| 2010 | 1.64 | 2.84 | 2.01 | 0.20 | 4.49 | 3.75 | 8.01 | 5.21 |
| 2011 | 4.72 | 3.01 | 3.79 | 0.25 | 2.44 | 3.66 | 7.87 | 5.24 |
| 2012 | 4.40 | 0.64 | 3.47 | 0.22 | 4.96 | 3.69 | 7.92 | 5.31 |
| 2013 | 3.06 | 0.55 | 2.80 | 0.30 | 6.62 | 4.22 | 8.09 | 5.37 |
| 2014 | 3.35 | 0.64 | 2.69 | 0.39 | 2.76 | 4.94 | 8.11 | 5.26 |
| 2015 | 6.20 | 1.33 | 2.52 | 0.45 | 3.10 | 4.40 | 8.22 | 5.43 |
| 2016 | 8.35 | 0.93 | 4.81 | 0.53 | 3.08 | 5.41 | 8.29 | 5.59 |
| 2017 | 9.47 | 0.83 | 5.29 | 0.44 | 3.40 | 5.56 | 8.24 | 5.70 |
| 2018 | 4.67 | 1.88 | 2.50 | 0.19 | 3.66 | 3.40 | 8.29 | 5.14 |
| 2019 | 5.08 | 3.19 | 2.82 | 0.21 | 3.92 | 3.87 | - | 5.14 |
| 2020 | 5.47 | 5.89 | 3.43 | 0.44 | 4.23 | 5.11 | - | 5.14 |
3. Results
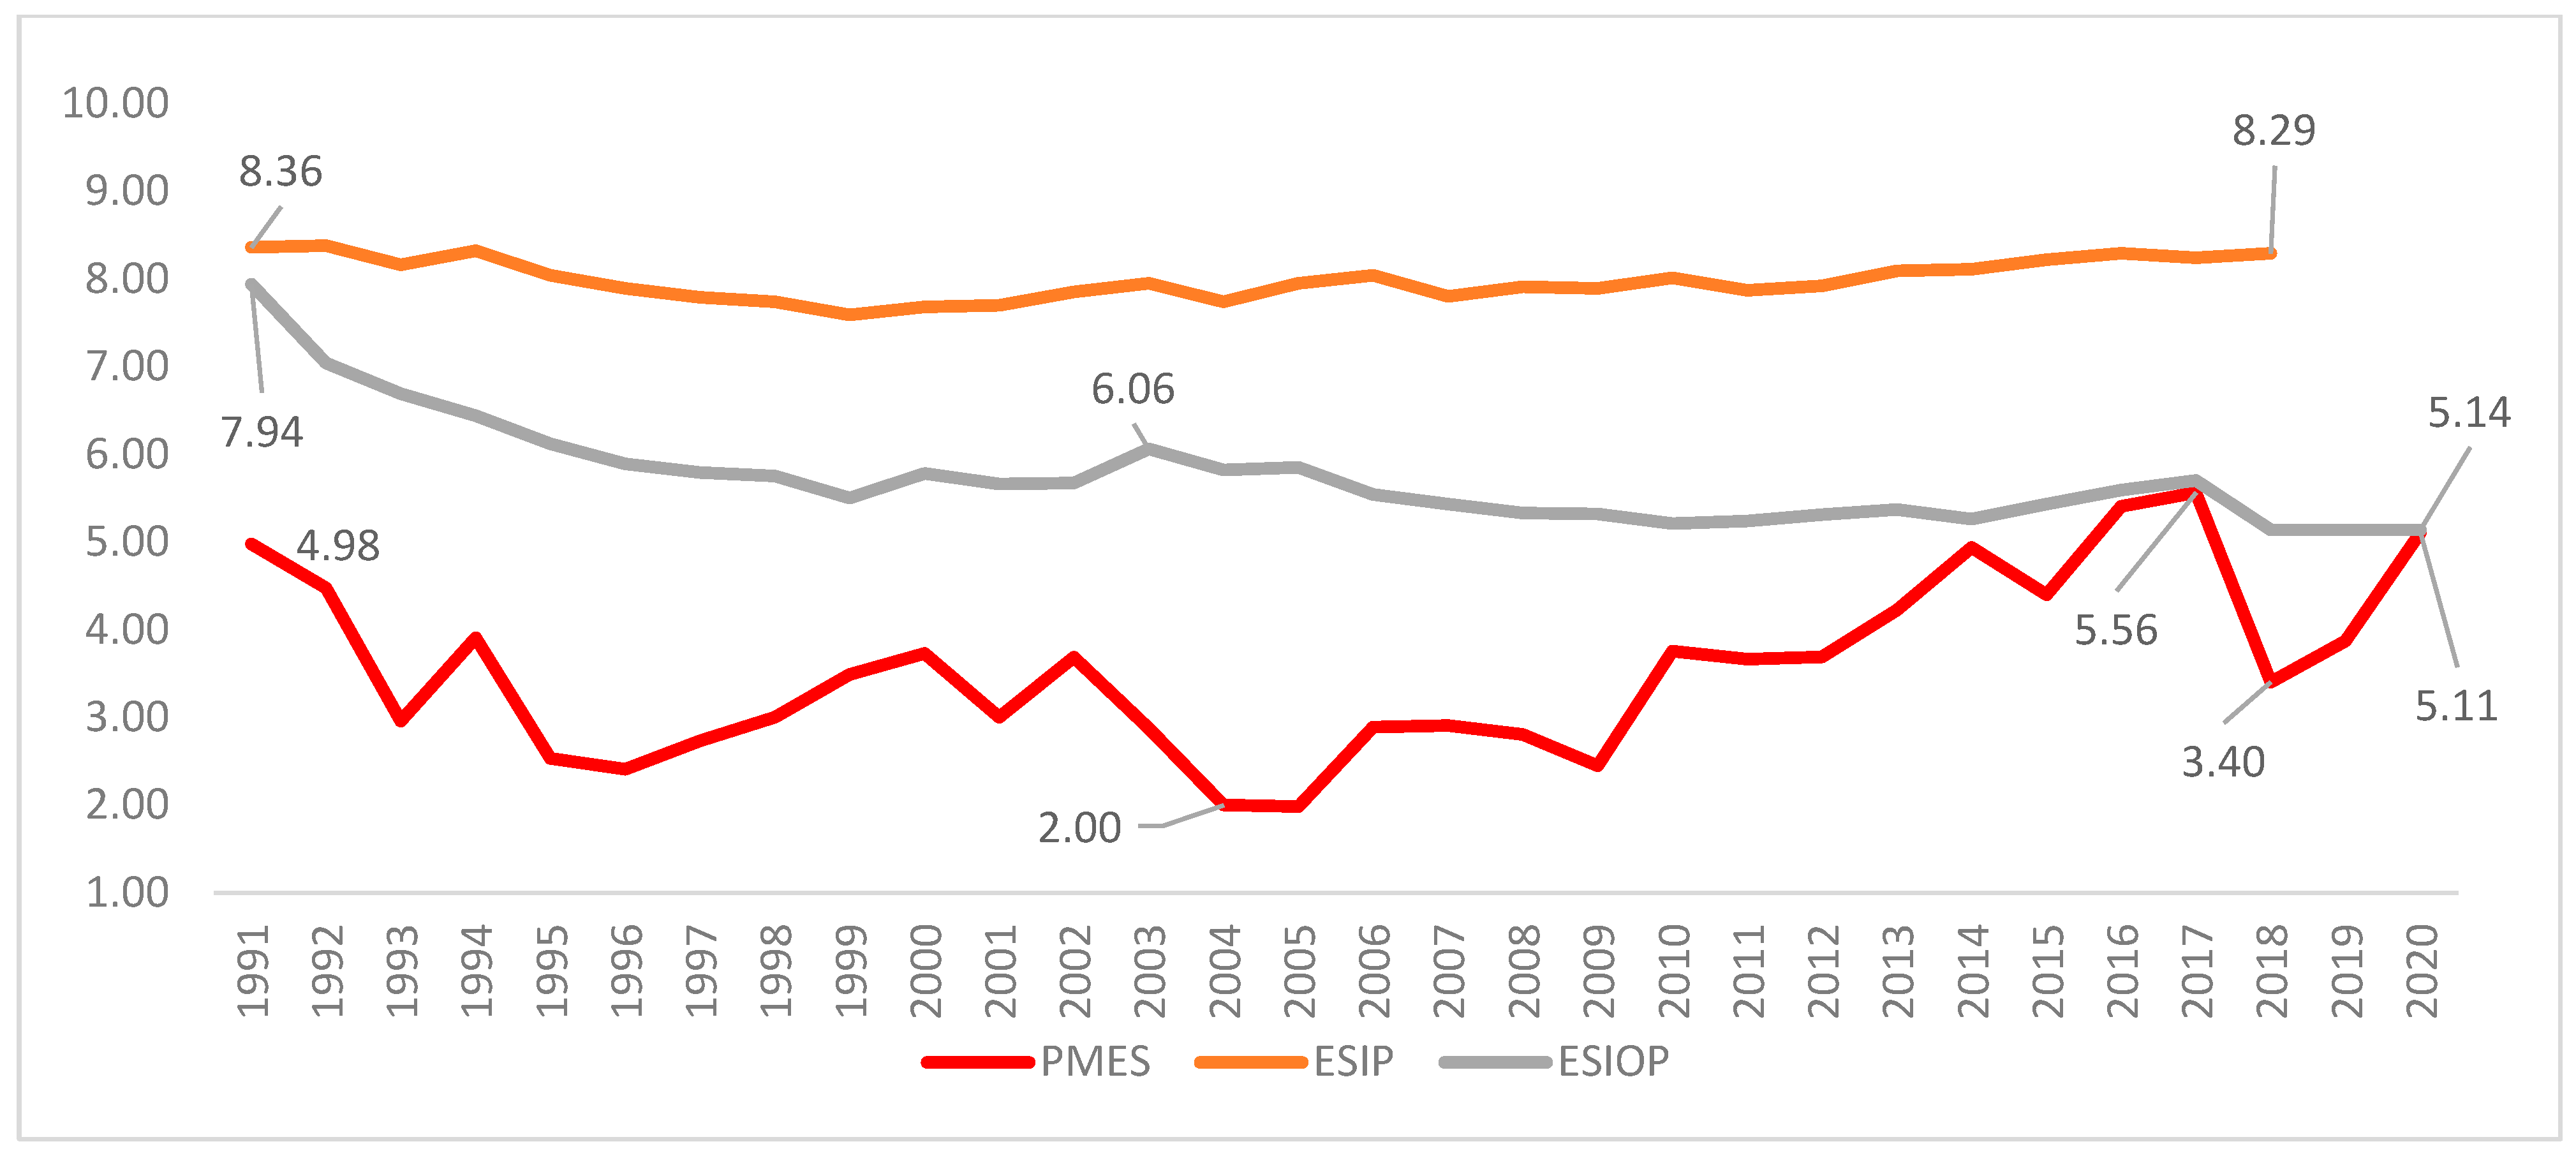
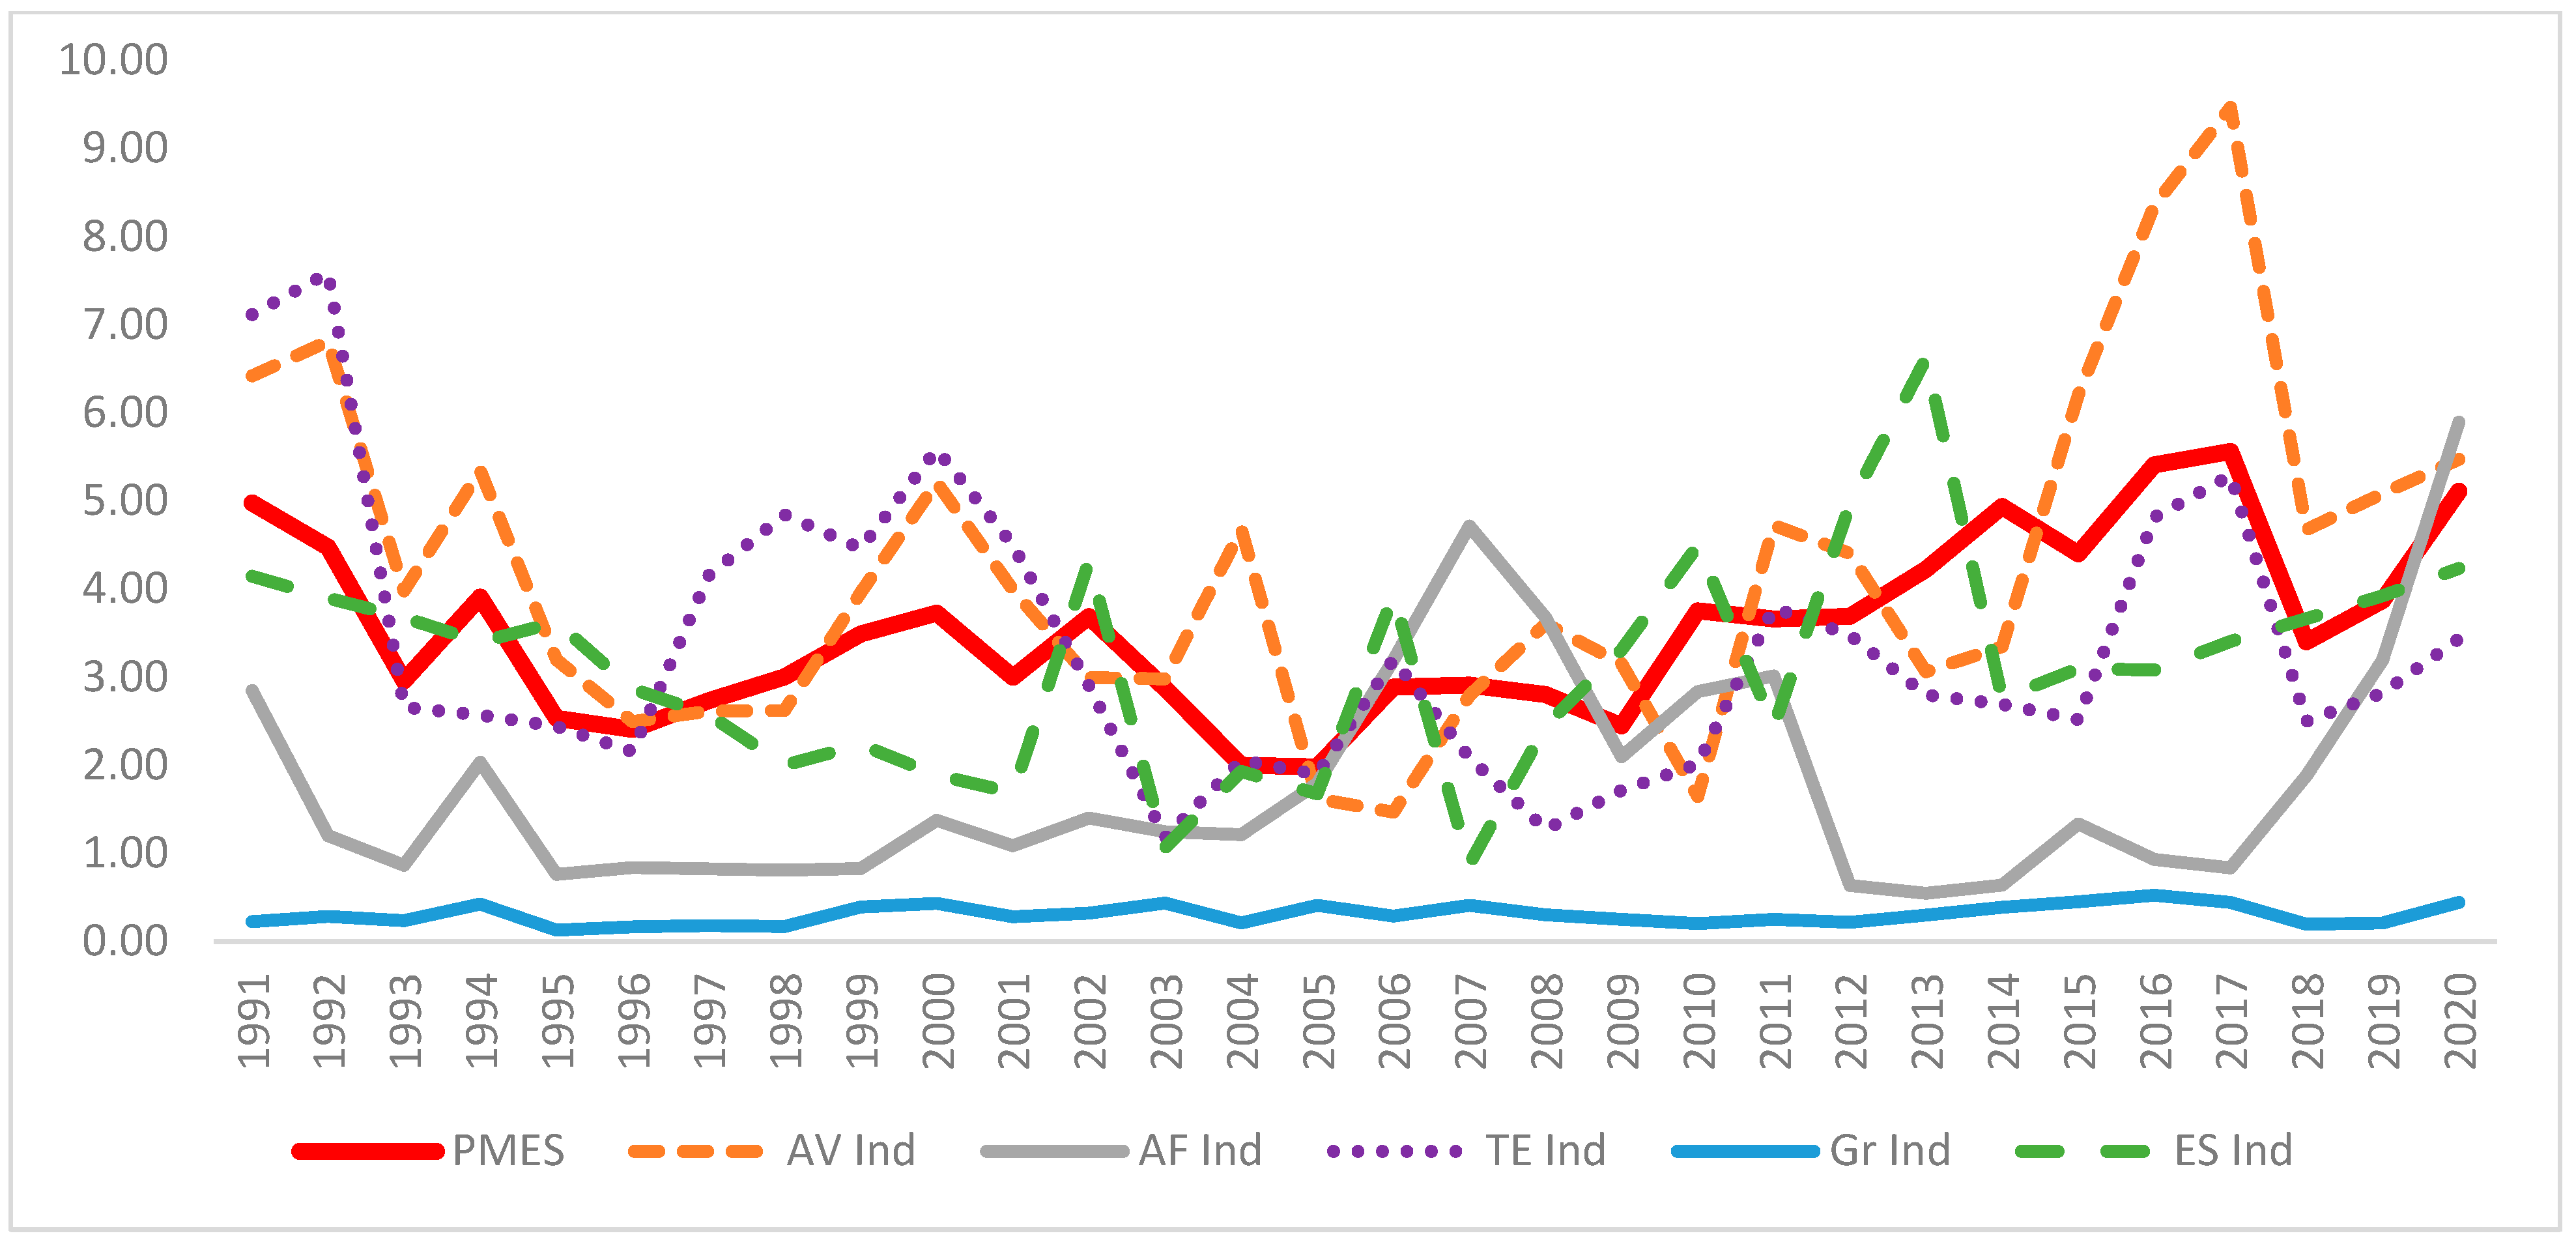
3.1. Pakistan’s Multidimensional Energy Security Index (PMESI)
- During the study period, two indicators in the availability dimension, “FEC/Capita” and “R/P Ratio,” influenced the PMESI. For example, consumption increased by 11% between 1991 and 2000, followed by a 20% increase between 2001 and 2010, and a further 13% increase between 2011 and 2020. Its impact on PMESI could be seen between 1991 and 2015, when PMESI declined by 12%;
- PMESI demonstrates that “power-policy (1994)”, “power-policy (2002)”, “power-policy (2004)”, and “power-policy (2013)” all failed in terms of execution. These techniques sought to reduce energy consumption by increasing conservation and efficiency. Despite the fact that almost every power strategy stressed development plans, the country faced a 5000 MW energy shortfall [47]. A measure termed “Electricity/Capita (KWh)” increased by 36% over the study period, which could support the argument;
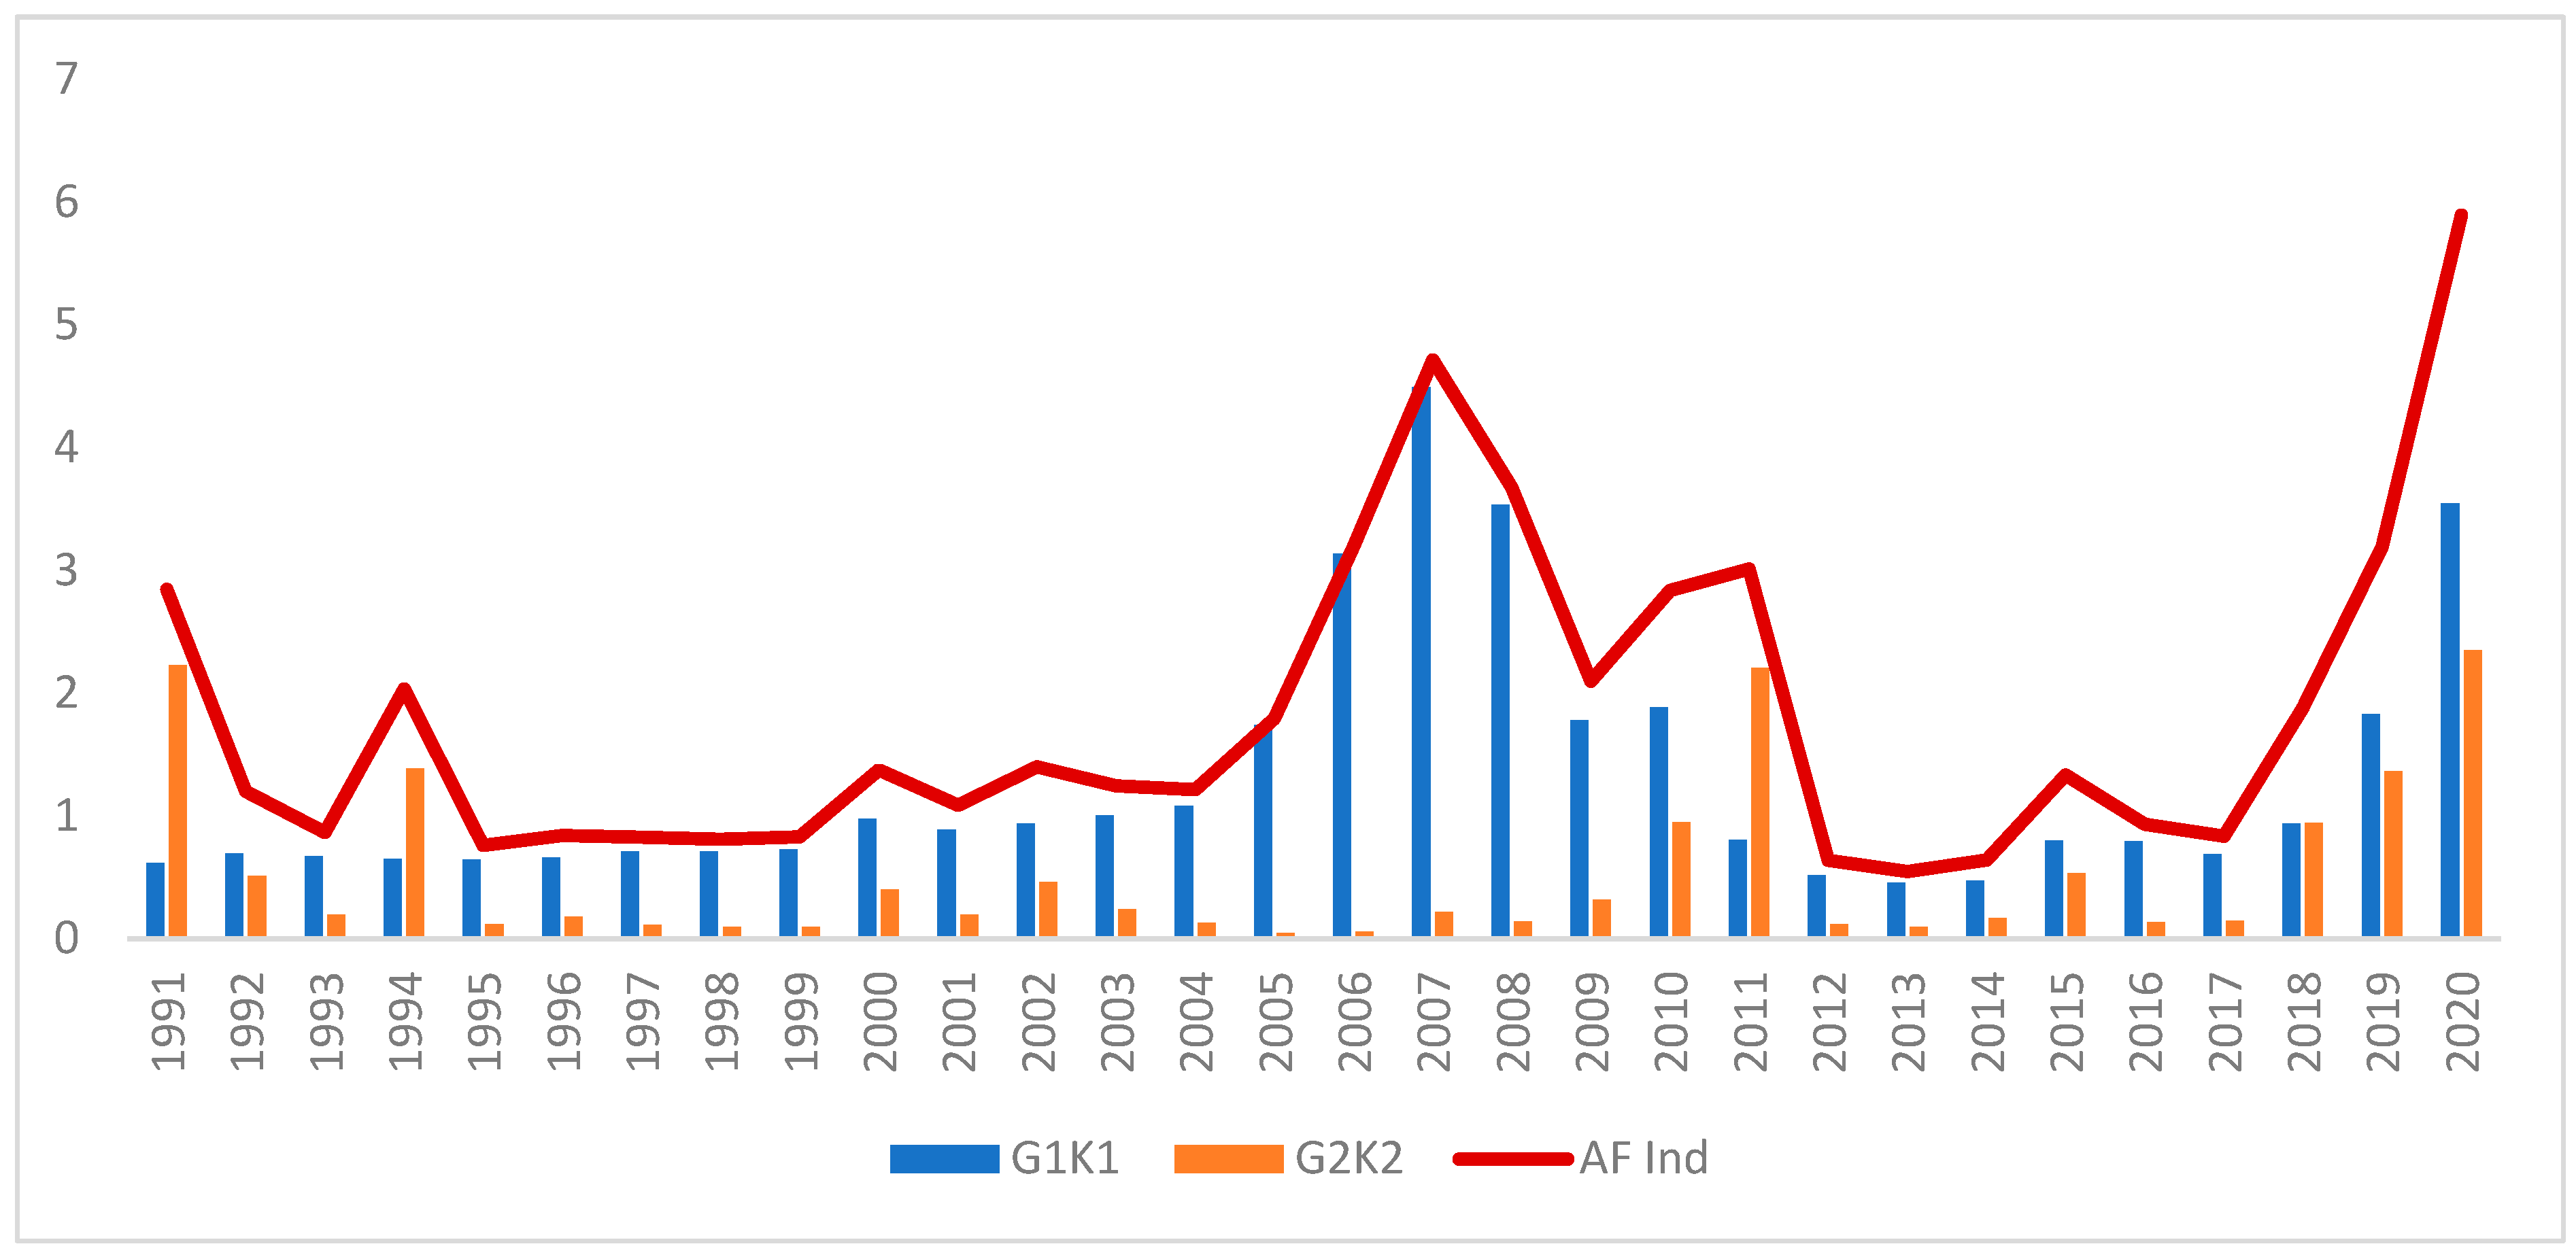
- Pakistan’s governments have been restructuring the energy industry and focusing on keeping energy prices as low as achievable. However, the World Bank believes that reforms must have gone beyond simply liberalizing energy pricing in order to address numerous aspects of energy sector distortions, such as prioritizing fuel allocation for efficient energy generation and implementing tariff mechanisms that incentivize performance [48]. As previously identified, system inefficiencies result in an unreasonably high cost during the research period. In the affordability aspects, the indicators observed were “Gasoline Price/Litre” and “Diesel Price/Litre.” Both gasoline and diesel grew by 60% between 1991 and 2000, increased by 65% between 2001 and 2010, and increased by another 28% between 2011 and 2020. It had a significant influence on PMESI between 1991 and 2010, when it fell by 24%;
- During the study period, two of the indicators played a significant role in the technological dimensions. Both “T&D losses” and “Utilization” fluctuated significantly throughout. “T&D Losses”, for example, increased by 22% between 1991 and 2002, then by 31% between 2003 and 2010. In 2011, an increase of 11% was observed, followed by a gradual reduction of 15% between 2012 and 2020. Similarly, “Utilization” fell by 28% between 1999 and 2000; however, it improved by 16% in 2006. From 2007 to 2020, variations occurred, with a minor improvement of 2% recorded. Its impact could be seen between 2003 and 2012, when the PMESI experienced significant fluctuations (Figure 3);
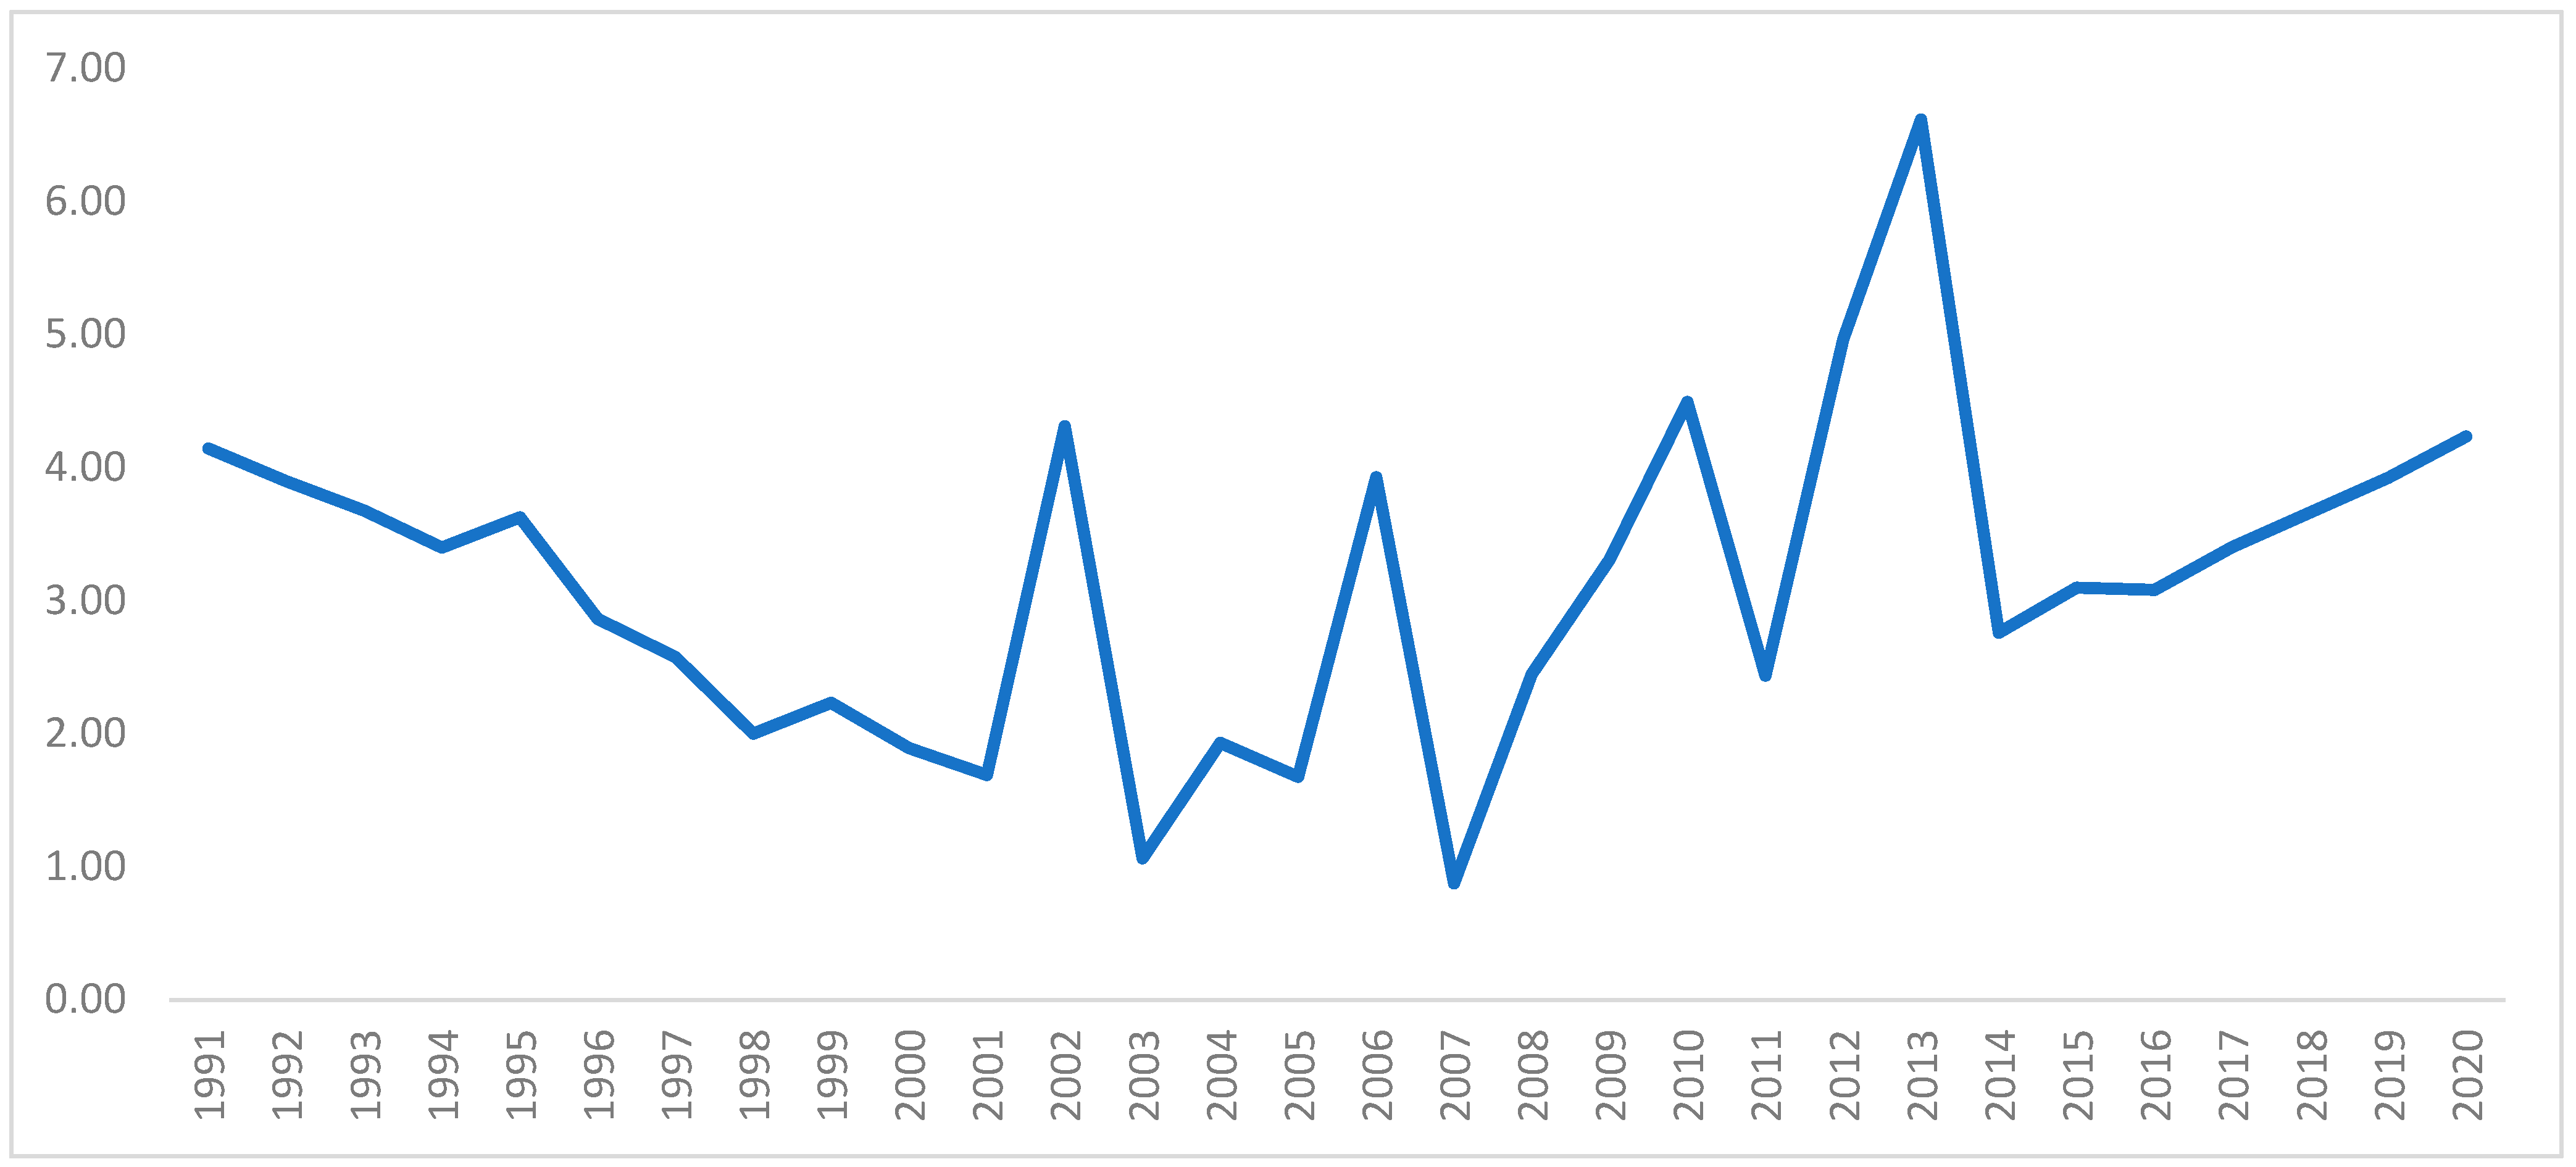
- The energy sector is governed by a number of institutions. The Ministry of Water and Power, for example, has 19 sub-agencies, and the Planning Commission and the Ministry of Petroleum and Natural Resources each have 16 [49,50]. According to the research, Pakistan’s energy sector has been plagued by corruption and vested interests [28,49]. As previously stated, the rating grew substantially between 2003 and 2020. During that time, the ranking dropped by about 45%. Not only did corruption have an impact on the PMESI, but other variables also played a role in the poor performance of the governance index. For example, the “Governance effectiveness index” fell by 28% between 2006 and 2020, whereas the indicator “Stock” fell by 55% between 1992 and 2020 (Supplementary File). As a result, the PMESI remained low throughout the study period;
- The “industrial” and “commercial intensities” increased by 2% and 33%, respectively (Supplemental File), implying that the energy production and conservation targets stressed in “petroleum-policy (1991)”, “electricity-policy (2010)”, and “power-policy (2013)” had no effect. As a result, the affordability index remained between 1 and 3 during the study period, pushing the PMESI below 5;
- The international wind and solar sector is still to grow and become more inexpensive [50]. However, the use of renewable energy sources other than hydro, such as wind and solar, did not become widespread until 2013, at which point another 1500 MW of wind, solar, and bagasse facilities had been completed, with plans to extend this to 3500 MW by 2025. As a result, from 1991 to 2020, the “Renewable share/FEC” averaged 6.9%, leading the PMESI to fall below average;
- The international wind and solar market has yet to be expanded and made affordable [50]. However, the usage of renewable energy sources other than hydro, such as wind and solar, did not become prevalent until 2013, and, by that time, another 1500 MW of wind, solar, and bagasse (a biowaste) facilities had been completed, with plans to increase this to 3500 MW by 2025. As a result, the “Renewable share/FEC” averaged 6.9% from 1991 to 2020, causing the PMESI to fall below average;
- PMESI was influenced by all four indicators in the environment domain. Notably, all reduced during the course of the study. While “CO2/TPES” reduced by 12%, “CO2/Capita” increased by 26% during the study period. Likewise, “SO2/Capita” grew by 78% while “Forest Area” declined by 50% (Supplementary File). As a result, these two indicators influenced PMESI more than the other two, particularly between 2003 and 2020.
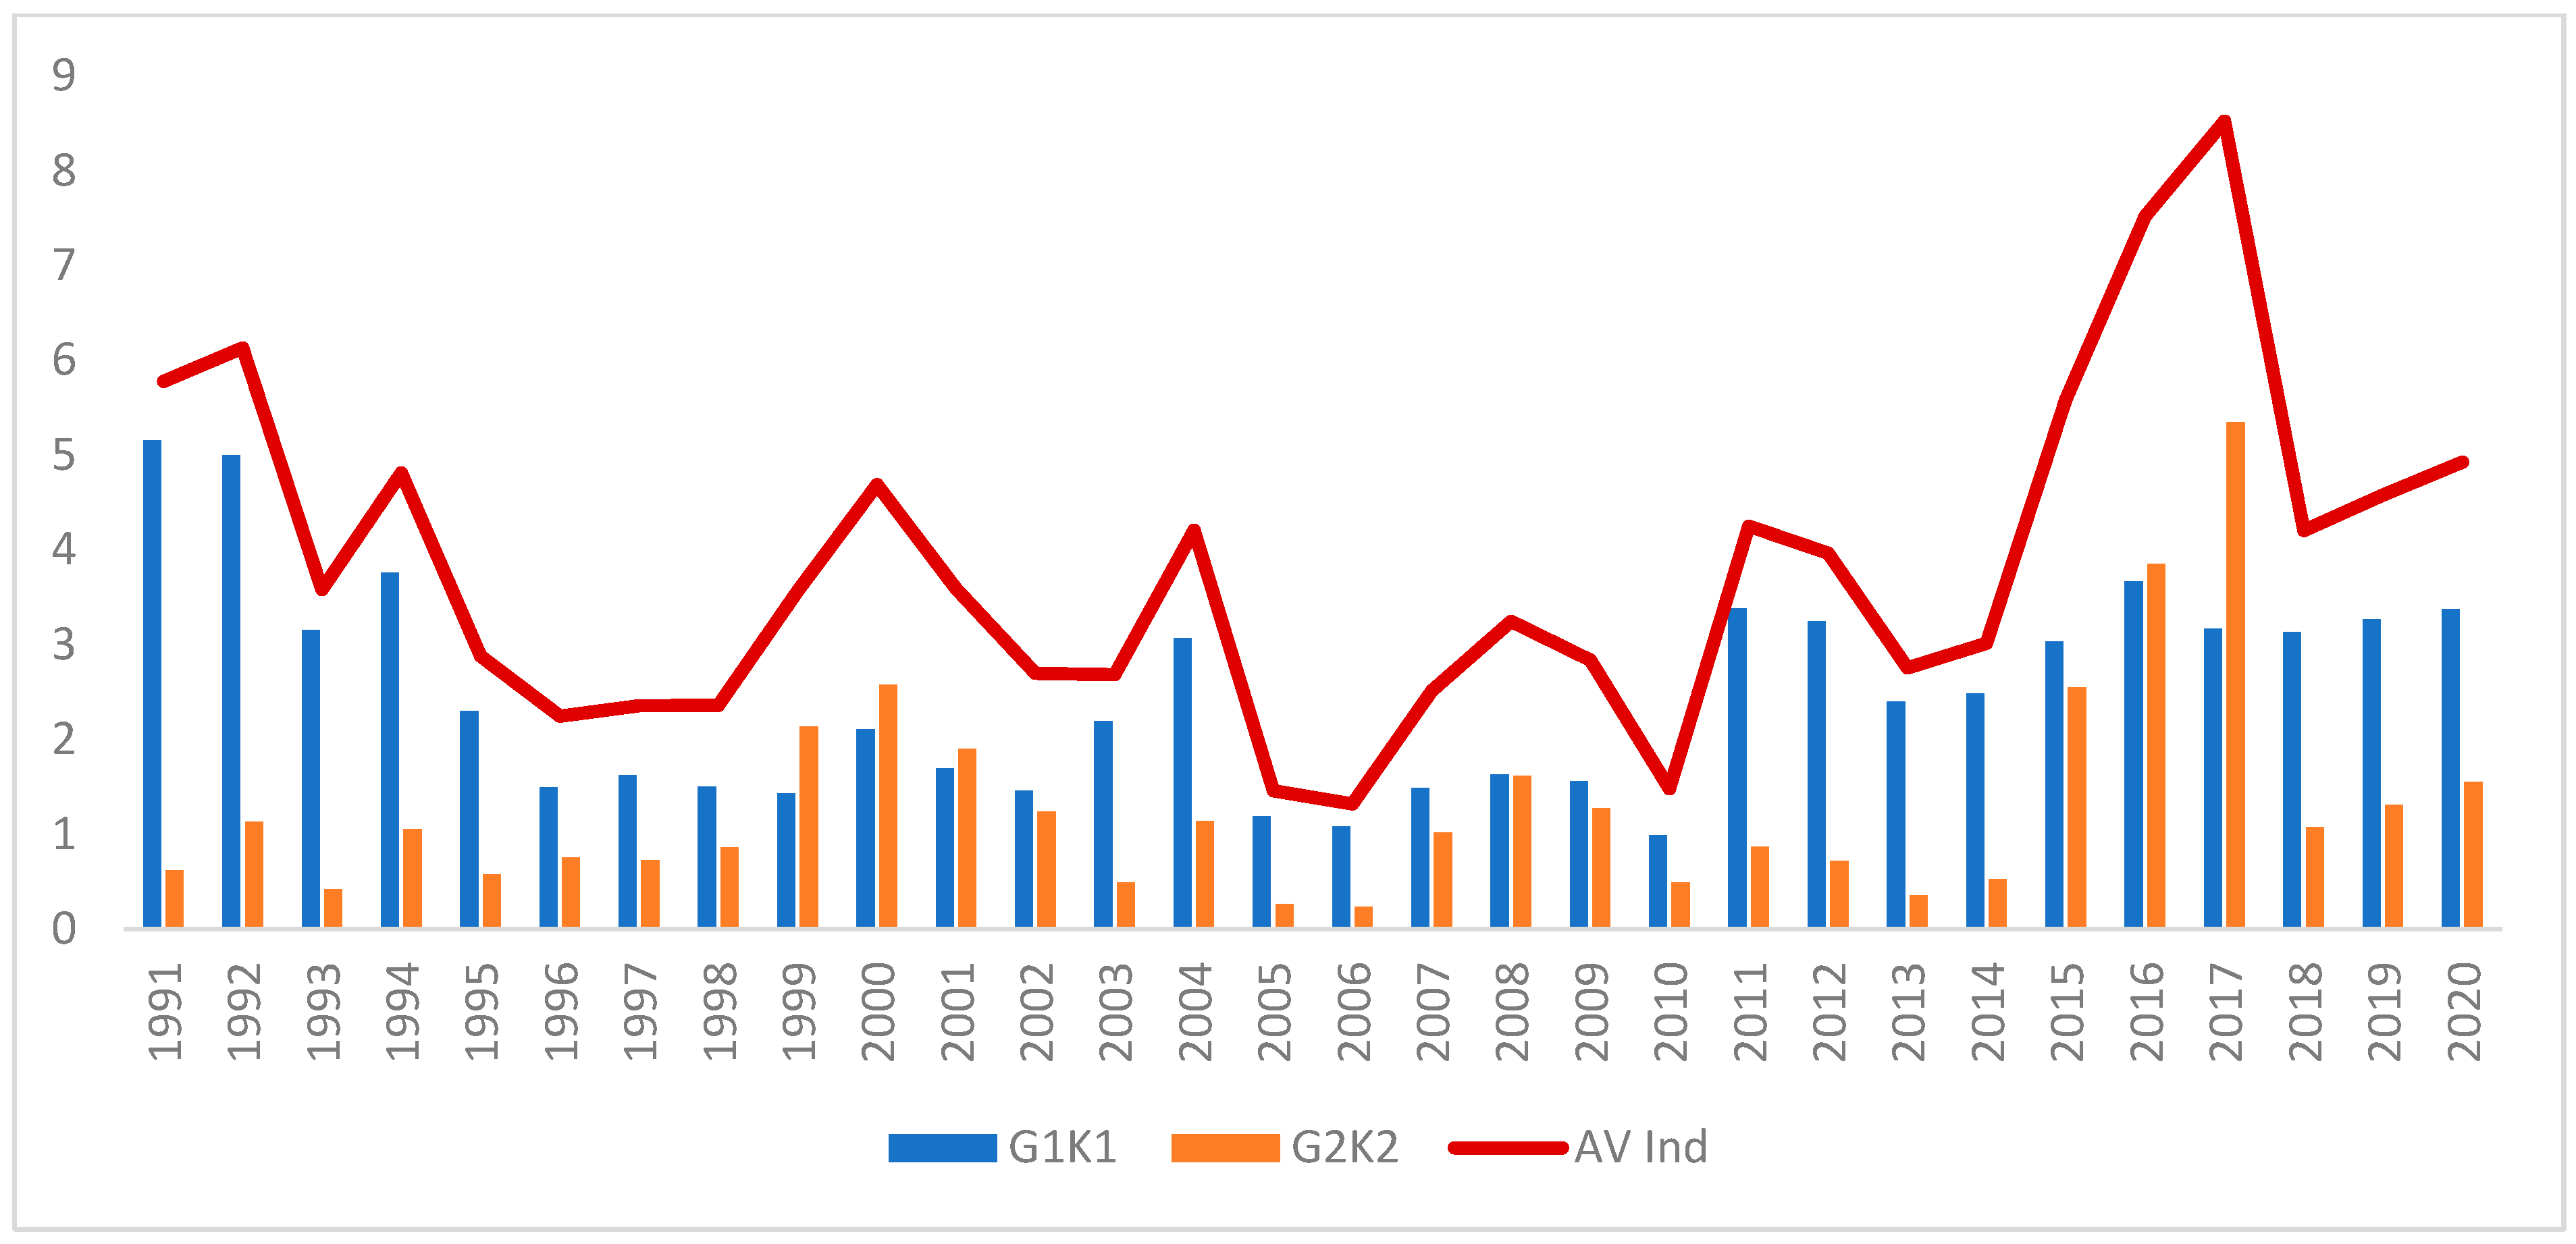
3.2. Availability Dimension
3.3. Affordability Dimension
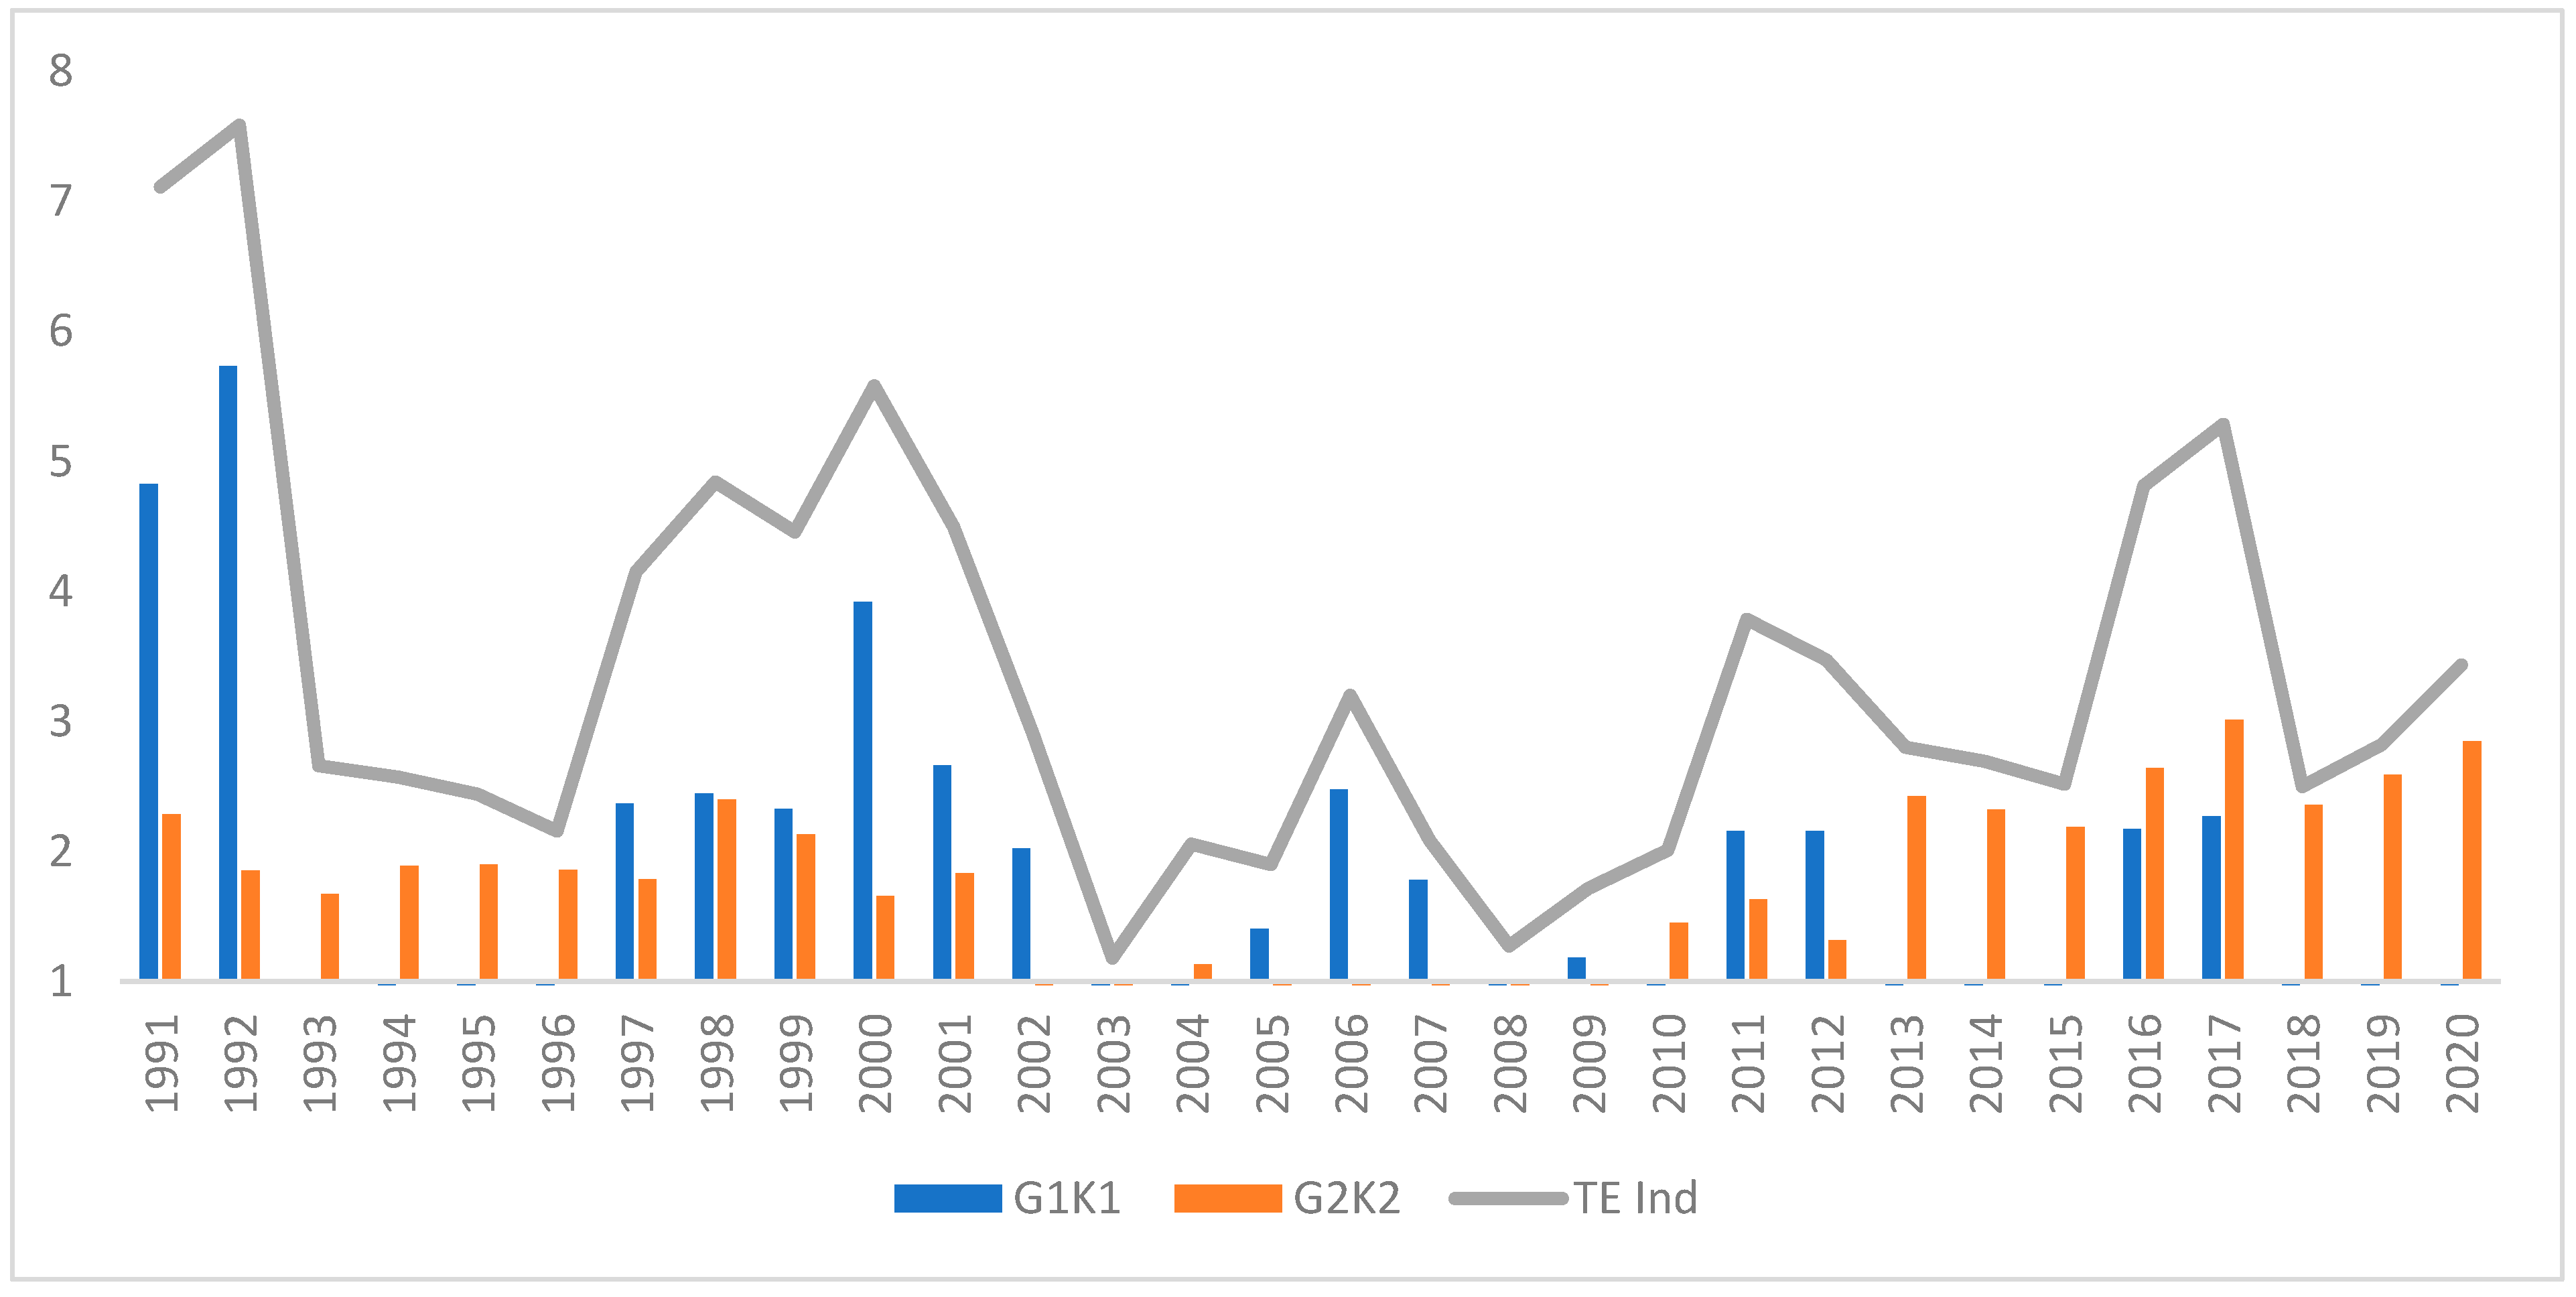
3.4. Technology and Efficiency Dimension
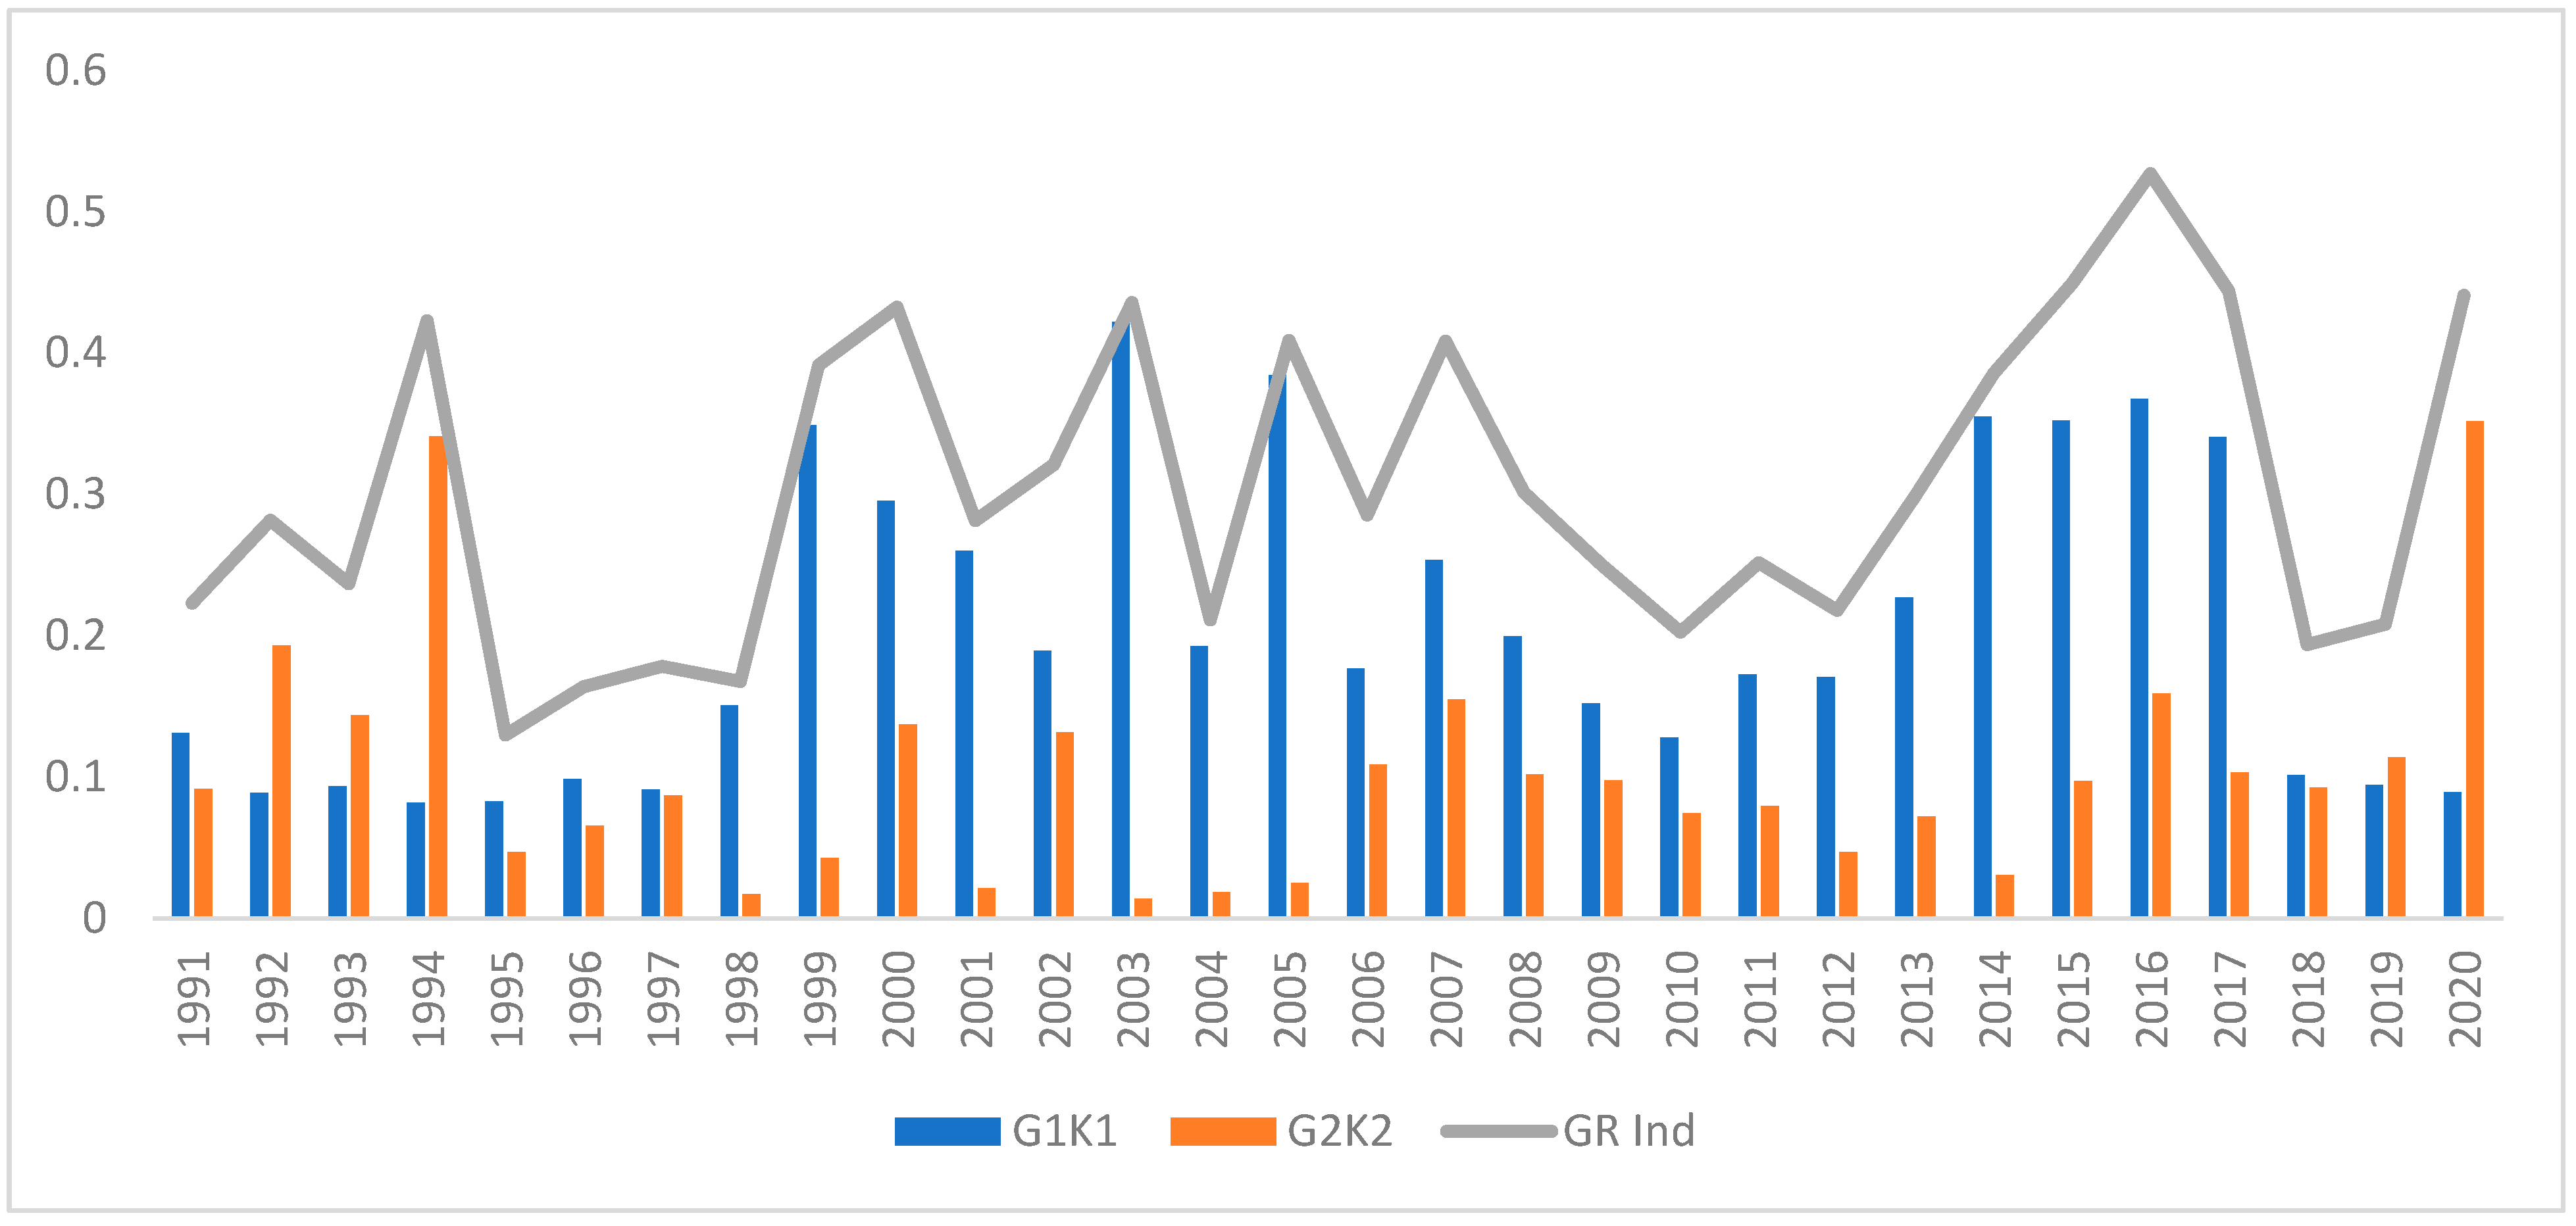
3.5. Governance and Regulation Dimension
3.6. Environment and Sustainability Dimension
4. Discussion
5. Conclusions
Supplementary Materials
Author Contributions
Funding
Institutional Review Board Statement
Informed Consent Statement
Data Availability Statement
Acknowledgments
Conflicts of Interest
Abbreviations
| FEC | Final Energy Consumption |
| TPES | Total Primary Energy Supply |
| Kgoe | Kilogram of Oil Equivalent |
| NEID | Net Energy Import Dependency |
| KWh | Kilo Watt Hour |
| Kg | Kilogram |
References
- Kalicki, J.H.; Goldwyn, D.L. Energy & Security: Strategies for a World in Transition, 2nd ed.; Woodrow Wilson Center Press: Washington, DC, USA; Johns Hopkins University Press: Baltimore, MD, USA, 2013; ISBN 978-1-4214-1186-6. [Google Scholar]
- Cherp, A.; Jewell, J. The concept of energy security: Beyond the four as. Energy Policy 2014, 75, 415–421. [Google Scholar] [CrossRef] [Green Version]
- Sovacool, B.; Brown, M. Competing Dimensions of Energy Security: An International Perspective. Annu. Rev. Environ. Resour. 2010, 35, 77–108. [Google Scholar] [CrossRef] [Green Version]
- Vivoda, V. Evaluating energy security in the Asia-Pacific region: A novel methodological approach. Energy Policy 2010, 38, 5258–5263. [Google Scholar] [CrossRef] [Green Version]
- Chester, L. Conceptualising energy security and making explicit its polysemic nature. Energy Policy 2010, 38, 887–895. [Google Scholar] [CrossRef]
- Sovacool, B.K. An international assessment of energy security performance. Ecol. Econ. 2013, 88, 148–158. [Google Scholar] [CrossRef]
- Zhang, L.; Yu, J.; Sovacool, B.K.; Ren, J. Measuring energy security performance within China: Toward an inter-provincial prospective. Energy 2017, 125, 825–836. [Google Scholar] [CrossRef]
- Narula, K. Is sustainable energy security of India increasing or decreasing? Int. J. Sustain. Energy 2014, 33, 1054–1075. [Google Scholar] [CrossRef]
- Narula, K.; Sudhakara Reddy, B.; Pachauri, S. Sustainable Energy Security for India: An assessment of energy demand sub-system. Appl. Energy 2017, 186, 126–139. [Google Scholar] [CrossRef]
- Martchamadol, J.; Kumar, S. The Aggregated Energy Security Performance Indicator (AESPI) at national and provincial level. Appl. Energy 2014, 127, 219–238. [Google Scholar] [CrossRef]
- Shadman, S.; Hanafiah, M.M.; Chin, C.M.M.; Yap, E.H.; Sakundarini, N. Conceptualising the sustainable energy security dimensions of malaysia: A thematic analysis through stakeholder engagement to draw policy implications. Sustainability 2021, 13, 12027. [Google Scholar] [CrossRef]
- Erahman, Q.F.; Purwanto, W.W.; Sudibandriyo, M.; Hidayatno, A. An assessment of Indonesia’s energy security index and comparison with seventy countries. Energy 2016, 111, 364–376. [Google Scholar] [CrossRef]
- Tongsopit, S.; Kittner, N.; Chang, Y.; Aksornkij, A.; Wangjiraniran, W. Energy security in ASEAN: A quantitative approach for sustainable energy policy. Energy Policy 2016, 90, 60–72. [Google Scholar] [CrossRef]
- Gasser, P. A review on energy security indices to compare country performances. Energy Policy 2020, 139, 111339. [Google Scholar] [CrossRef]
- Ammari, C.; Belatrache, D.; Touhami, B.; Makhloufi, S. Sizing, optimization, control and energy management of hybrid renewable energy system—A review. Energy Built Environ. 2021, 23, 1–5. [Google Scholar] [CrossRef]
- Guo, S.; Liu, Q.; Sun, J.; Jin, H. A review on the utilization of hybrid renewable energy. Renew. Sustain. Energy Rev. 2018, 91, 1121–1147. [Google Scholar] [CrossRef]
- Asif, M.; Muneer, T. Energy supply, its demand and security issues for developed and emerging economies. Renew. Sustain. Energy Rev. 2007, 11, 1388–1413. [Google Scholar] [CrossRef]
- Ministry of Finance. Chapter—14 Energy. In Economic Survey of Pakistan 2020-21; Government of Pakistan: Islamabad, Pakistan, 2021; Volume 100. [Google Scholar]
- Ministry of Finance. Economic Survey of Pakistan 2019-20; Government of Pakistan: Islamabad, Pakistan, 2020.
- Mirjat, N.H.; Uqaili, M.A.; Harijan, K.; Das Walasai, G.; Mondal, M.A.H.; Sahin, H. Long-term electricity demand forecast and supply side scenarios for Pakistan (2015–2050): A LEAP model application for policy analysis. Energy 2018, 165, 512–526. [Google Scholar] [CrossRef]
- Kessides, I.N. Chaos in power: Pakistan’s electricity crisis. Energy Policy 2013, 55, 271–285. [Google Scholar] [CrossRef]
- Ministry of Finance. Economic Survey of Pakistan 2018-19; Government of Pakistan: Islamabad, Pakistan, 2019.
- Mustafa, K.; 6500 MW Power Shortfall Leads to Loadshedding. Daw News 2021. Available online: https://www.thenews.com.pk/print/847076-6500-mw-power-shortfall-leads-to-loadshedding (accessed on 10 June 2021).
- Abdullah, F.B.; Iqbal, R.; Irfan, S.; Jawaid, M. Energy security indicators for Pakistan: An integrated approach. Renew. Sustain. Energy Rev. 2020, 133, 110122. [Google Scholar] [CrossRef]
- Abdullah, F.B.; Iqbal, R.; Jawaid, M.; Memon, I.; Mughal, S.; Memon, F.S.; Ali Rizvi, S.S. Energy security index of Pakistan (ESIOP). Energy Strateg. Rev. 2021, 38, 100710. [Google Scholar] [CrossRef]
- Malik, S.; Qasim, M.; Saeed, H.; Change, Y.; Hesary, F.T. Energy Security in Pakistan: A Quantitative Approach to a Sustainable Energy Policy; Asian Development Bank: Mandaluyong, Philippines, 2019. [Google Scholar]
- Abdullah, F.B.; Iqbal, R.; Ahmad, S.; El-affendi, M.A. An Empirical Analysis of Sustainable Energy Security for Energy Policy Recommendations. Sustainability 2022, 14, 6099. [Google Scholar] [CrossRef]
- Akhtar, A. Pakistan’s Energy Development: The Road Ahead; Royal Book Company: Karachi, Pakistan, 2010; ISBN 978-969-407-375-0. [Google Scholar]
- World Bank GDP Growth (Annual %)—Pakistan. Available online: https://data.worldbank.org/indicator/NY.GDP.MKTP.KD.ZG?locations=PK (accessed on 10 March 2020).
- Shah, S.A.A.; Zhou, P.; Walasai, G.D.; Mohsin, M. Energy security and environmental sustainability index of South Asian countries: A composite index approach. Ecol. Indic. 2019, 106, 105507. [Google Scholar] [CrossRef]
- Anwar, J. Analysis of energy security, environmental emission and fuel import costs under energy import reduction targets: A case of Pakistan. Renew. Sustain. Energy Rev. 2016, 65, 1065–1078. [Google Scholar] [CrossRef]
- Sovacool, B.K. The methodological challenges of creating a comprehensive energy security index. Energy Policy 2012, 48, 835–840. [Google Scholar] [CrossRef]
- Krishna, V.R.; Paramesh, V.; Arunachalam, V.; Das, B.; Elansary, H.O.; Parab, A.; Reddy, D.D.; Shashidhar, K.S.; El-Ansary, D.O.; Mahmoud, E.A.; et al. Assessment of sustainability and priorities for development of indian west coast region: An application of sustainable livelihood security indicators. Sustainability 2020, 12, 8716. [Google Scholar] [CrossRef]
- Ang, B.W.; Choong, W.L.; Ng, T.S. A framework for evaluating Singapore’s energy security. Appl. Energy 2015, 148, 314–325. [Google Scholar] [CrossRef]
- Ligus, M.; Peternek, P. The sustainable energy development index—An application for european union member states. Energies 2021, 14, 1117. [Google Scholar] [CrossRef]
- Abdullah, F.B.; Hyder, S.I.; Iqbal, R. A Model for Strategizing Energy Security Dimensions and Indicators Selection for Pakistan. Int. J. Renew. Energy Res. 2020, 10, 558–569. [Google Scholar]
- Šprajc, P.; Bjegović, M.; Vasić, B. Energy security in decision making and governance—Methodological analysis of energy trilemma index. Renew. Sustain. Energy Rev. 2019, 114, 109341. [Google Scholar] [CrossRef]
- Cronbach, L.J. Coefficient alpha and the internal structure of tests. Psychometrika 1951, 16, 297–334. [Google Scholar] [CrossRef] [Green Version]
- Ministry of Finance. Economic Survey of Pakistan 2013-14; Government of Pakistan: Islamabad, Pakistan, 2014.
- HDIP. Pakistan Energy Yearbook 2018; Hydrocarbon Development Institute of Pakistan, Government of Pakistan: Islamabad, Pakistan, 2019.
- Energy Information Administration (EIA). Annual Energy Outlook 2018 with Projections to 2050; U.S. Department of Energy: Washington, DC, USA, 2018. Available online: https://www.eia.gov/outlooks/archive/aeo18/pdf/AEO2018.pdf (accessed on 5 March 2022).
- Planning Commission of Pakistan. Annual Plan 2020-21; Government of Pakistan: Islamabad, Pakistan, 2020.
- Medina-Ross, J.A.; Mata-Sandoval, J.C.; López-Pérez, R. Indicators for sustainable energy development in Mexico. Nat. Resour. Forum 2005, 29, 308–321. [Google Scholar] [CrossRef]
- Fang, D.; Shi, S.; Yu, Q. Evaluation of sustainable energy security and an empirical analysis of China. Sustainability 2018, 10, 1685. [Google Scholar] [CrossRef] [Green Version]
- Van Der Maaten, L.J.P.; Postma, E.O.; Van Den Herik, H.J. Dimensionality Reduction: A Comparative Review. J. Mach. Learn. Res. 2009, 10, 1–41. [Google Scholar] [CrossRef]
- Martchamadol, J.; Kumar, S. An aggregated energy security performance indicator. Appl. Energy 2013, 103, 653–670. [Google Scholar] [CrossRef]
- Ministry of Finance. Economic Survey of Pakistan 2017-18; Government of Pakistan: Islamabad, Pakistan, 2018.
- World Bank Power Sector Distortions Cost Pakistan Billions. Available online: https://www.worldbank.org/en/news/press-release/2018/12/11/power-sector-distortions-cost-pakistan-billions (accessed on 28 April 2022).
- Asif, M. Sustainable energy options for Pakistan. Renew. Sustain. Energy Rev. 2009, 13, 903–909. [Google Scholar] [CrossRef]
- Akhtar, A. Issues in Energy Policy; Royal Book Company: Karachi, Pakistan, 2011; Volume 1, ISBN 9781466224599. [Google Scholar]
- GoP. Renewable Energy Policy 2006; Government of Pakistan: Islamabad, Pakistan, 2006.
- GoP. Power Policy 1994; Government of Pakistan: Islamabad, Pakistan, 1994.
- GoP. Exploration and Production Policy 2012; Government of Pakistan: Islamabad, Pakistan, 2012.
- Planning Commission of Pakistan. Annual Plan 2015-16; Government of Pakistan: Islamabad, Pakistan, 2015.
- International Atomic Energy Agency (IAEA). Energy Indicators for Sustainable Development: Country Studies; International Atomic Energy Agency (IAEA): Vienna, Autria, 2007. [Google Scholar]
- Lodhi, I.A. 4. Pakistan’s Energy Crisis: Challenges and Opportunities. In The Geopolitics of Energy in South Asia; Lall, M., Ed.; ISEAS Publishing: Singapore, 2008; pp. 83–93. [Google Scholar]
- HDIP. Pakistan Energy Yearbook 2020; Hydrocarbon Development Institute of Pakistan; Government of Pakistan: Islamabad, Pakistan, 2020.
- GoP. Power Generation Policy 2015; Government of Pakistan: Islamabad, Pakistan, 2015. [Google Scholar]
- Khan, S.; Ashraf, H.F. Analysis of Pakistan’s Electric Power Sector; Department of Electrical Engineering, Blekinge Institute of Technology: Karlskrona, Sweden, 2015; pp. 1–45. [Google Scholar]
- International Business Publications. Pakistan Energy Policy, Laws and Regulations Handbook Volume 1 Strategic Information and Basic Laws; World Business and Investment Library (Lulu.com): Washington, DC, USA, 2015; ISBN 9781329048546. [Google Scholar]
- Asif, M. Energy Crisis in Pakistan: Origins, Challenges, and Sustainable Solutions, 1st ed.; Oxford University Press: Oxford, UK, 2006; ISBN 978-0195478761. [Google Scholar]
- NEPRA. State of Industry Report 2007; National Electric Power Regulatory Authority, Government of Pakistan: Islamabad, Pakistan, 2008.
- Aized, T.; Shahid, M.; Bhatti, A.A.; Saleem, M.; Anandarajah, G. Energy security and renewable energy policy analysis of Pakistan. Renew. Sustain. Energy Rev. 2018, 84, 155–169. [Google Scholar] [CrossRef]
- GoP. National Climate Change Policy 2012; Government of Pakistan: Islamabad, Pakistan, 2012.
- Lin, B.; Ahmad, I. Energy substitution effect on transport sector of Pakistan based on trans-log production function. Renew. Sustain. Energy Rev. 2016, 56, 1182–1193. [Google Scholar] [CrossRef]
- HDIP. Pakistan Energy Yearbook 2007; Hydrocarbon Development Institute of Pakistan, Government of Pakistan: Islamabad, Pakistan, 2007.
- Zameer, H.; Wang, Y. Energy production system optimization: Evidence from Pakistan. Renew. Sustain. Energy Rev. 2018, 82, 886–893. [Google Scholar] [CrossRef]
- Mirjat, N.H.; Uqaili, M.A.; Harijan, K.; Das Valasai, G.; Shaikh, F.; Waris, M. A review of energy and power planning and policies of Pakistan. Renew. Sustain. Energy Rev. 2017, 79, 110–127. [Google Scholar] [CrossRef] [Green Version]
- Qazi, U.; Jahanzaib, M.; Ahmad, W.; Hussain, S. An institutional framework for the development of sustainable and competitive power market in Pakistan. Renew. Sustain. Energy Rev. 2017, 70, 83–95. [Google Scholar] [CrossRef]
- Wakeel, M.; Chen, B.; Jahangir, S. Overview of energy portfolio in Pakistan. Energy Procedia 2016, 88, 71–75. [Google Scholar] [CrossRef] [Green Version]
- Rauf, O.; Wang, S.; Yuan, P.; Tan, J. An overview of energy status and development in Pakistan. Renew. Sustain. Energy Rev. 2015, 48, 892–931. [Google Scholar] [CrossRef]
- Ahmed, S.; Mahmood, A.; Hasan, A.; Sidhu, G.A.S.; Butt, M.F.U. A comparative review of China, India and Pakistan renewable energy sectors and sharing opportunities. Renew. Sustain. Energy Rev. 2016, 57, 216–225. [Google Scholar] [CrossRef]
- Ullah, K.; Raza, M.S.; Mirza, F.M. Barriers to hydro-power resource utilization in Pakistan: A mixed approach. Energy Policy 2019, 132, 723–735. [Google Scholar] [CrossRef]
- Aqeeq, M.A.; Hyder, S.I.; Shehzad, F.; Tahir, M.A. On the competitiveness of grid-tied residential photovoltaic generation systems in Pakistan: Panacea or paradox? Energy Policy 2018, 119, 704–722. [Google Scholar] [CrossRef]
- Qazi, U.; Jahanzaib, M. An integrated sectoral framework for the development of sustainable power sector in Pakistan. Energy Rep. 2018, 4, 376–392. [Google Scholar] [CrossRef]
- Rana, M.I.; Rana, S. Reforming the Energy Sector of Pakistan: The Case of Punjab; Centre for Public Policy and Governance, USAID: Lahore, Pakistan, 2014.
- Perwez, U.; Sohail, A.; Hassan, S.F.; Zia, U. The long-term forecast of Pakistan’s electricity supply and demand: An application of long range energy alternatives planning. Energy 2015, 93, 2423–2435. [Google Scholar] [CrossRef]
- Mengal, A.; Mirjat, N.H.; DasWalasai, G.; Khatri, S.A.; Harijan, K.; Uqaili, M.A. Modeling of future electricity generation and emissions assessment for Pakistan. Processes 2019, 7, 212. [Google Scholar] [CrossRef] [Green Version]
- Kugelman, M. Easing an Energy Crisis That Won’t End. In Pakistan’s Interminable Energy Cris. Is There Any W. Out; Wilson Center: Washington, DC, USA, 2015; pp. 1–22. [Google Scholar]
- Ishaque, H. Is it wise to compromise renewable energy future for the sake of expediency? An analysis of Pakistan’s long-term electricity generation pathways. Energy Strateg. Rev. 2017, 17, 6–18. [Google Scholar] [CrossRef]
- Lin, B.; Raza, M.Y. Analysis of energy related CO2 emissions in Pakistan. J. Clean. Prod. 2019, 219, 981–993. [Google Scholar] [CrossRef]
- GoP. National Forest Policy; Government of Pakistan: Islamabad, Pakistan, 2015.
- Abdullah, F. Bin Effects of CO2 Emission on Health & Environment: Evidence from fuel ssources in Pakistani Industry. Pakistan J. Eng. Technol. Sci. 2016, 5, 1–20. [Google Scholar]
- Shi, X. The future of ASEAN energy mix: A SWOT analysis. Renew. Sustain. Energy Rev. 2016, 53, 672–680. [Google Scholar] [CrossRef]
- Sharifuddin, S. Methodology for quantitatively assessing the energy security of malaysia and other southeast asian countries. Energy Policy 2014, 65, 574–582. [Google Scholar] [CrossRef]
- Sovacool, B.K. Energy security: Challenges and needs. Wiley Interdiscip. Rev. Energy Environ. 2012, 1, 51–59. [Google Scholar] [CrossRef]
- Ang, B.W.; Choong, W.L.; Ng, T.S. Energy security: Definitions, dimensions and indexes. Renew. Sustain. Energy Rev. 2015, 42, 1077–1093. [Google Scholar] [CrossRef]
- Sovacool, B.K. Evaluating energy security in the Asia pacific: Towards a more comprehensive approach. Energy Policy 2011, 39, 7472–7479. [Google Scholar] [CrossRef]
- Nardo, M.; Saisana, M.; Saltelli, A.; Tarantola, S. Handbook of Contructing Compsoite Indicators: Methodology and User Guide; OECD Publication: Paris, France, 2008; ISBN 9789264043459. [Google Scholar]
- Augutis, J.; Krikštolaitis, R.; Martišauskas, L.; Pečiulytė, S.; Žutautaitė, I. Integrated energy security assessment. Energy 2017, 138, 890–901. [Google Scholar] [CrossRef]


| Dimension | Indicator | Abbreviation | E1 | E2 | E3 | E4 | E5 | Score | Decision |
|---|---|---|---|---|---|---|---|---|---|
| Availability | Electricity/Capita (KWh/Capita) | AV1 | ✓ | ✓ | ✓ | ✓ | ✓ | 5 | Selected |
| Transport consumption/FEC (%) | AV2 | ✓ | ✓ | 2 | Rejected | ||||
| Access to Energy (%) | AV3 | ✓ | ✓ | ✓ | ✓ | 4 | Rejected | ||
| R/P Ratio (Years) | AV4 | ✓ | ✓ | ✓ | ✓ | ✓ | 5 | Selected | |
| R/P Oil | AV5 | ✓ | ✓ | 2 | Rejected | ||||
| R/P Gas | AV6 | ✓ | ✓ | 2 | Rejected | ||||
| TPES/Capita (Kgoe/Capita) | AV7 | ✓ | ✓ | ✓ | ✓ | 4 | Selected | ||
| FEC/Capita (Kgoe/Capita) | AV8 | ✓ | ✓ | ✓ | ✓ | 4 | Selected | ||
| Renewable Share/FEC (%) | AV9 | ✓ | ✓ | ✓ | ✓ | ✓ | 5 | Selected | |
| SWI | AV10 | ✓ | ✓ | ✓ | 3 | Selected | |||
| Transport Consumption/Capita (Kgoe/Capita) | AV11 | ✓ | 1 | Rejected | |||||
| Electricity Consumed/FEC (%) | AV12 | ✓ | ✓ | 2 | Rejected | ||||
| Household Energy/Capita (Kgoe/Capita) | AV13 | ✓ | ✓ | 2 | Rejected | ||||
| Residential Energy/Household (Kgoe/Houses) | AV14 | ✓ | ✓ | 2 | Rejected | ||||
| Electricity/Household (KWh/House) | AV15 | ✓ | ✓ | 2 | Rejected | ||||
| Renewable Potential (KWh/Capita) | AV16 | ✓ | ✓ | 2 | Rejected | ||||
| Indigenous/TPES (%) | AV17 | ✓ | ✓ | ✓ | ✓ | 4 | Selected | ||
| Oil Use In Transport% of Oil Consumption (%) | AV18 | ✓ | 1 | Rejected | |||||
| Access w/o Electricity (%) | AV19 | ✓ | ✓ | 2 | Rejected | ||||
| Share of Non- Carbon Carbon/TPES (%) | AV20 | ✓ | ✓ | 2 | Rejected | ||||
| Affordability | Net Energy Import Dependency (NEID) | AF1 | ✓ | ✓ | 2 | Rejected | |||
| TPES/GDP (1000 Kgoe/USD) | AF2 | ✓ | ✓ | 2 | Rejected | ||||
| Gasoline Price/Litre (2010 USD/L) | AF3 | ✓ | ✓ | ✓ | ✓ | ✓ | 5 | Selected | |
| Diesel Price (2010 USD/L) | AF4 | ✓ | ✓ | ✓ | ✓ | 4 | Selected | ||
| Energy Imports/TPES (%) | AF5 | ✓ | ✓ | ✓ | ✓ | ✓ | 5 | Selected | |
| Net Energy Import Ratio (NEIR) (%) | AF6 | ✓ | 1 | Rejected | |||||
| Energy Imports/FEC (%) | AF7 | ✓ | ✓ | 2 | Rejected | ||||
| Transport Intensity (1000 Kgoe/USD) | AF8 | ✓ | ✓ | ✓ | ✓ | 4 | Selected | ||
| Industrial Intensity (1000 Kgoe/USD) | AF9 | ✓ | ✓ | ✓ | ✓ | ✓ | 5 | Selected | |
| Commercial Intensity (1000 Kgoe/USD) | AF10 | ✓ | ✓ | ✓ | ✓ | ✓ | 4 | Selected | |
| Agricultural Intensity (1000 Kgoe/USD) | AF11 | ✓ | ✓ | 2 | Rejected | ||||
| USDGDP/Capita (2010) | AF12 | ✓ | 1 | Rejected | |||||
| % of Income towards energy | AF13 | ✓ | ✓ | 2 | Rejected | ||||
| Imported Oil Consumption (%) | AF14 | ✓ | ✓ | 2 | Rejected | ||||
| Imported Gas Consumption (%) | AF15 | ✓ | ✓ | 2 | Rejected | ||||
| Technology and Efficiency | T&D Losses (%) | TE1 | ✓ | ✓ | ✓ | ✓ | ✓ | 5 | Selected |
| TPES-FEC/FEC (%) | TE2 | ✓ | ✓ | 2 | Rejected | ||||
| Electricity Utilization | TE3 | ✓ | ✓ | ✓ | ✓ | 4 | Selected | ||
| Demand Met Locally in Oil & Gas (%) | TE4 | ✓ | ✓ | 2 | Rejected | ||||
| Oil & Well Exploration | TE5 | ✓ | ✓ | ✓ | 3 | Selected | |||
| Renewable Share/Electricity (%)-Non Hydro | TE6 | ✓ | ✓ | 2 | Rejected | ||||
| Nuclear Share/Electricity (%) | TE7 | ✓ | ✓ | ✓ | ✓ | ✓ | 5 | Selected | |
| Self Sufficiency FEC/TPES (%) | TE8 | ✓ | ✓ | 2 | Rejected | ||||
| RE Share (Hydro)/Electricity (%) | TE9 | ✓ | ✓ | 2 | Rejected | ||||
| Non-Carbon Fuel Portfolio (%) | TE10 | ✓ | 1 | Rejected | |||||
| Access to Clean Fuels (%) | TE11 | ✓ | ✓ | ✓ | ✓ | 4 | Selected | ||
| Governance and Regulation | Losses/TPES (%) | GR1 | ✓ | ✓ | 2 | Rejected | |||
| Corruption Ranking | GR2 | ✓ | ✓ | ✓ | ✓ | ✓ | 5 | Selected | |
| Governance Effectiveness Index | GR3 | ✓ | ✓ | ✓ | ✓ | ✓ | 5 | Selected | |
| Oil Rent (% of GDP) | GR4 | ✓ | ✓ | 2 | Rejected | ||||
| Oil Stock/ Oil FEC (Days) | GR5 | ✓ | ✓ | ✓ | ✓ | ✓ | 5 | Selected | |
| Oil Stock (% of Imports) | GR6 | ✓ | ✓ | 2 | Rejected | ||||
| Resilience (Net Reserves/FEC) (%) | GR7 | ✓ | ✓ | ✓ | ✓ | 4 | Selected | ||
| Environment and Sustainability | CO2/TPES (Kg/Kgoe) | ES1 | ✓ | ✓ | ✓ | ✓ | ✓ | 5 | Selected |
| CO2/Capita (Tons/Capita) | ES2 | ✓ | ✓ | ✓ | ✓ | ✓ | 5 | Selected | |
| CO2/Electricity (%) | ES3 | ✓ | ✓ | 2 | Rejected | ||||
| CO2/Household (tons/houses) | ES4 | ✓ | ✓ | 2 | Rejected | ||||
| SO2/Capita (Kg/Capita) | ES5 | ✓ | ✓ | ✓ | ✓ | 4 | Selected | ||
| Forest Area/Land Area (%) | ES6 | ✓ | ✓ | ✓ | ✓ | 4 | Selected | ||
| CO2/GDP (Kg/USD) | ES7 | ✓ | ✓ | 2 | Rejected |
| Cronbach’s Alpha: 0.712 | N of Items: 27 | ||
|---|---|---|---|
| Sno | Indicators | Corrected Item-Total Correlation | Cronbach’s Alpha if Item Deleted |
| 1 | Electricity/Capita | 0.976 | 0.713 |
| 2 | Access to Energy | 0.790 | 0.711 |
| 3 | R/P Ratio | −0.868 | 0.730 |
| 4 | TPES/Capita | 0.990 | 0.568 |
| 5 | FEC/Capita | 0.964 | 0.585 |
| 6 | Renewable Share/FEC | −0.719 | 0.717 |
| 7 | SWI | 0.667 | 0.713 |
| 8 | Indigenous/TPES | −0.359 | 0.718 |
| 9 | Gasoline Price/Litre | 0.883 | 0.712 |
| 10 | Diesel Price | 0.831 | 0.711 |
| 11 | Energy Imports/TPES | −0.084 | 0.717 |
| 12 | Transport Energy Intensity | −0.462 | 0.723 |
| 13 | Industrial Energy Intensity | 0.178 | 0.709 |
| 14 | Commercial Energy Intensity | 0.943 | 0.709 |
| 15 | T&D Losses | −0.699 | 0.714 |
| 16 | Electricity Utilization | 0.071 | 0.713 |
| 17 | Oil & Well Exploration | 0.624 | 0.681 |
| 18 | Nuclear Share/Electricity | 0.812 | 0.691 |
| 19 | Access to Clean Fuels | 0.891 | 0.676 |
| 20 | Corruption Ranking | 0.868 | 0.606 |
| 21 | Governance Effectiveness Index | 0.293 | 0.704 |
| 22 | Oil Stock/ Oil FEC | −0.660 | 0.726 |
| 23 | Resilience (Net Reserves/FEC) | −0.702 | 0.726 |
| 24 | CO2/TPES | −0.709 | 0.714 |
| 25 | CO2/Capita | 0.967 | 0.713 |
| 26 | SO2/Capita | 0.836 | 0.701 |
| 27 | Forest Area/Land Area Ratio | −0.949 | 0.716 |
| Rotated Component Matrix Availability Dimension | |||||
|---|---|---|---|---|---|
| Component | |||||
| 1 | 2 | ||||
| AV7 | 0.904 | ||||
| AV9 | −0.899 | ||||
| AV1 | 0.897 | ||||
| AV8 | 0.863 | ||||
| AV3 | 0.853 | ||||
| AV4 | −0.808 | ||||
| AV17 | −0.994 | ||||
| AV10 | 0.862 | ||||
| AF4 | 0.986 | ||||
| AF3 | 0.984 | ||||
| AF10 | 0.912 | ||||
| AF5 | 0.868 | ||||
| AF9 | −0.760 | ||||
| AF8 | 0.708 | ||||
| Rotated Component Matrix Technology and Efficiency Dimension | |||||
| Component | |||||
| 1 | 2 | ||||
| TE11 | 0.962 | ||||
| TE7 | 0.940 | ||||
| TE5 | 0.824 | ||||
| TE3 | 0.976 | ||||
| TE1 | −0.679 | ||||
| Rotated Component Matrix Governance and Regulation Dimension | |||||
| Component | |||||
| 1 | 2 | ||||
| GR7 | 0.907 | ||||
| GR2 | −0.735 | ||||
| GR3 | 0.910 | ||||
| GR5 | −0.669 | ||||
| Rotated Component Matrix SESi | |||||
| Component | |||||
| 1 | 2 | 3 | 4 | 5 | |
| AV4 | −0.928 | ||||
| ES5 | 0.923 | ||||
| TE11 | 0.897 | ||||
| AF4 | 0.884 | ||||
| TE5 | 0.876 | ||||
| GR7 | −0.875 | ||||
| AF3 | 0.865 | ||||
| ES6 | −0.862 | ||||
| TE7 | 0.806 | ||||
| ES1 | −0.800 | ||||
| AV3 | 0.786 | ||||
| AV10 | 0.768 | ||||
| AV8 | 0.752 | ||||
| AV7 | 0.752 | ||||
| AV1 | 0.724 | ||||
| AF10 | 0.652 | ||||
| AV17 | −0.617 | ||||
| AV9 | −0.806 | ||||
| GR5 | −0.794 | ||||
| ES2 | 0.714 | ||||
| GR2 | 0.667 | ||||
| TE3 | 0.925 | ||||
| AF9 | 0.750 | ||||
| TE1 | −0.584 | ||||
| AF5 | 0.897 | ||||
| AF8 | 0.854 | ||||
| GR3 | 0.909 | ||||
Publisher’s Note: MDPI stays neutral with regard to jurisdictional claims in published maps and institutional affiliations. |
© 2022 by the authors. Licensee MDPI, Basel, Switzerland. This article is an open access article distributed under the terms and conditions of the Creative Commons Attribution (CC BY) license (https://creativecommons.org/licenses/by/4.0/).
Share and Cite
Abdullah, F.B.; Iqbal, R.; Ahmad, S.; El-Affendi, M.A.; Kumar, P. Optimization of Multidimensional Energy Security: An Index Based Assessment. Energies 2022, 15, 3929. https://doi.org/10.3390/en15113929
Abdullah FB, Iqbal R, Ahmad S, El-Affendi MA, Kumar P. Optimization of Multidimensional Energy Security: An Index Based Assessment. Energies. 2022; 15(11):3929. https://doi.org/10.3390/en15113929
Chicago/Turabian StyleAbdullah, Fahad Bin, Rizwan Iqbal, Sadique Ahmad, Mohammed A. El-Affendi, and Pardeep Kumar. 2022. "Optimization of Multidimensional Energy Security: An Index Based Assessment" Energies 15, no. 11: 3929. https://doi.org/10.3390/en15113929
APA StyleAbdullah, F. B., Iqbal, R., Ahmad, S., El-Affendi, M. A., & Kumar, P. (2022). Optimization of Multidimensional Energy Security: An Index Based Assessment. Energies, 15(11), 3929. https://doi.org/10.3390/en15113929