Article

Acoustic Energy Harvesting of Piezoelectric Ceramic Composites

by
Jose Figueroa, Jr.
1 and
Margo Staruch
2,*
1
Department of Physics and Environmental Science, St. Mary’s University, One Camino Santa Maria, San Antonio, TX 78228, USA
2
US Naval Research Laboratory, Washington, DC 20375, USA
*
Author to whom correspondence should be addressed.
Energies 2022, 15(10), 3734; https://doi.org/10.3390/en15103734
Submission received: 15 April 2022 / Revised: 17 May 2022 / Accepted: 18 May 2022 / Published: 19 May 2022

Abstract

:
Acoustic energy is an often overlooked but increasingly prevalent source of ambient energy that could be scavenged to power a wide range of devices. Piezoelectric materials are often used, but the tradeoff between acoustic impedance matching and the amount of ceramic piezoelectric material as the active material has not previously been investigated. In this work, commercially available 1–3 dice and fill composites with various fill factors (25%, 45%, and 65% of Pb(Zr,Ti)O3) and different acoustic impedance values were tested using an impedance tube and then modeled using a KLM equivalent circuit model. As expected, a higher amount of ceramic material resulted in a higher acoustic absorption coefficient. Experimentally, the highest fill factor with the highest piezoelectric coefficient also resulted in larger output power at all dB levels, reaching a maximum of 115 nW (84 nW/cm3) at 111 dBSPL for the 65% fill sample. In the model, the 25% fill factor with the best acoustic impedance matching shows the highest expected output power instead, but this discrepancy is most likely due to a lowered piezoelectric coefficient during testing due to the clamping conditions.

1. Introduction

With the proliferation of portable, smart, and wireless electronic devices as we move towards the realization of the Internet of Things, an increased need for power has resulted in an intensified interest in energy harvesting or scavenging from various external stimuli. Compared to other sources of ambient power, there has been considerably less focus on acoustic energy, even though this energy is prevalent and mostly wasted. Piezoelectric materials are commonly used in acoustic energy harvesters (AEHs) due to their innate ability to convert pressure into an electric field, as quantified by the piezoelectric coefficient [1,2]. Due to this transduction, there is the potential to provide enhanced passive noise cancelation, or these devices could be used for self-powered active noise cancelation as well. Piezoelectric materials are already well known to provide noise and vibration reduction when incorporated into passive or active structures [3,4,5,6], and it may be that the piezoelectric phase itself imparts some additional noise attenuation.
Most current AEHs are Helmholtz resonators, acoustic tube resonators [7,8,9,10,11,12,13], or sonic crystals [14,15], all of which can only efficiently convert energy in a narrow frequency band around the resonance frequency. Recent efforts have also focused on membranes such as PVDF [16] or other nanostructured energy harvesters generally based on the triboelectric effect [17,18,19]. However, there are few reports of efficiency [9] or of how much acoustic energy is reflected or dissipated into heat energy at the interface. Intuitively, impedance matched materials would maximize the efficiency but would also modify the sound absorption, reflection, and transmission coefficients, and materials with a higher mismatch are therefore expected to dissipate more acoustic energy at the interface. The balance between these factors, while well understood for transduction, has not been studied for AEH systems.
An equivalent circuit for the one-dimensional analysis of piezoelectric resonators was first derived by Mason [20], allowing for an analytical solution that models the piezoelectric with one electrical port coupled with two acoustic ports. Later, Krimholtz, Leedom, and Matthae [21] published another equivalent circuit (now known as the KLM model) similar to the Mason model but which did not feature a negative capacitance term at the electrical port that was considered to be non-physical. The Mason and KLM models, while more frequently used for the design of acoustic transducers [22,23,24], can also describe the dynamics of piezoelectric energy harvesters by inputting the signal over one of the acoustic ports [25,26,27]. These models can be an important tool to study the effects of acoustic impedance and the piezoelectric properties on the power that can be converted in AEHs.
In this work, to understand the sound absorption and the power harvested for samples with different acoustic impedances, the absorption coefficient, acoustic impedance, and power generated of 1–3 piezoelectric composites with varying PZT fill factors were characterized in a low frequency range (below 2000 Hz) corresponding to typical background noise. We also used the KLM model to simplify the piezoelectric materials into electric, acoustic, and electromechanical components of an equivalent circuit. The simulated values of voltage and power matched the experimental data well, validating the model.

2. Materials and Methods

A homebuilt 2″ diameter acoustic impedance tube was used for measurements. Further details of the design of the impedance tube including the materials and design parameters are included in the Supplementary Materials.

2.1. Absorption Coefficient Measurement

Two microphones were incorporated, and the transfer method was used to calculate the sound absorption [28,29] through a custom Python script. Each microphone was powered by a DC power supply (HP E3611A) with 3.3 V of DC current. Gain was adjusted to the lowest setting. Signals from the microphone were collected with an HDO4052A oscilloscope. A sine wave output was put through a 100–3000 Hz bandpass filter using the SRS 570 current preamplifier and then connected to an ND65–8 speaker (Dayton Audio).

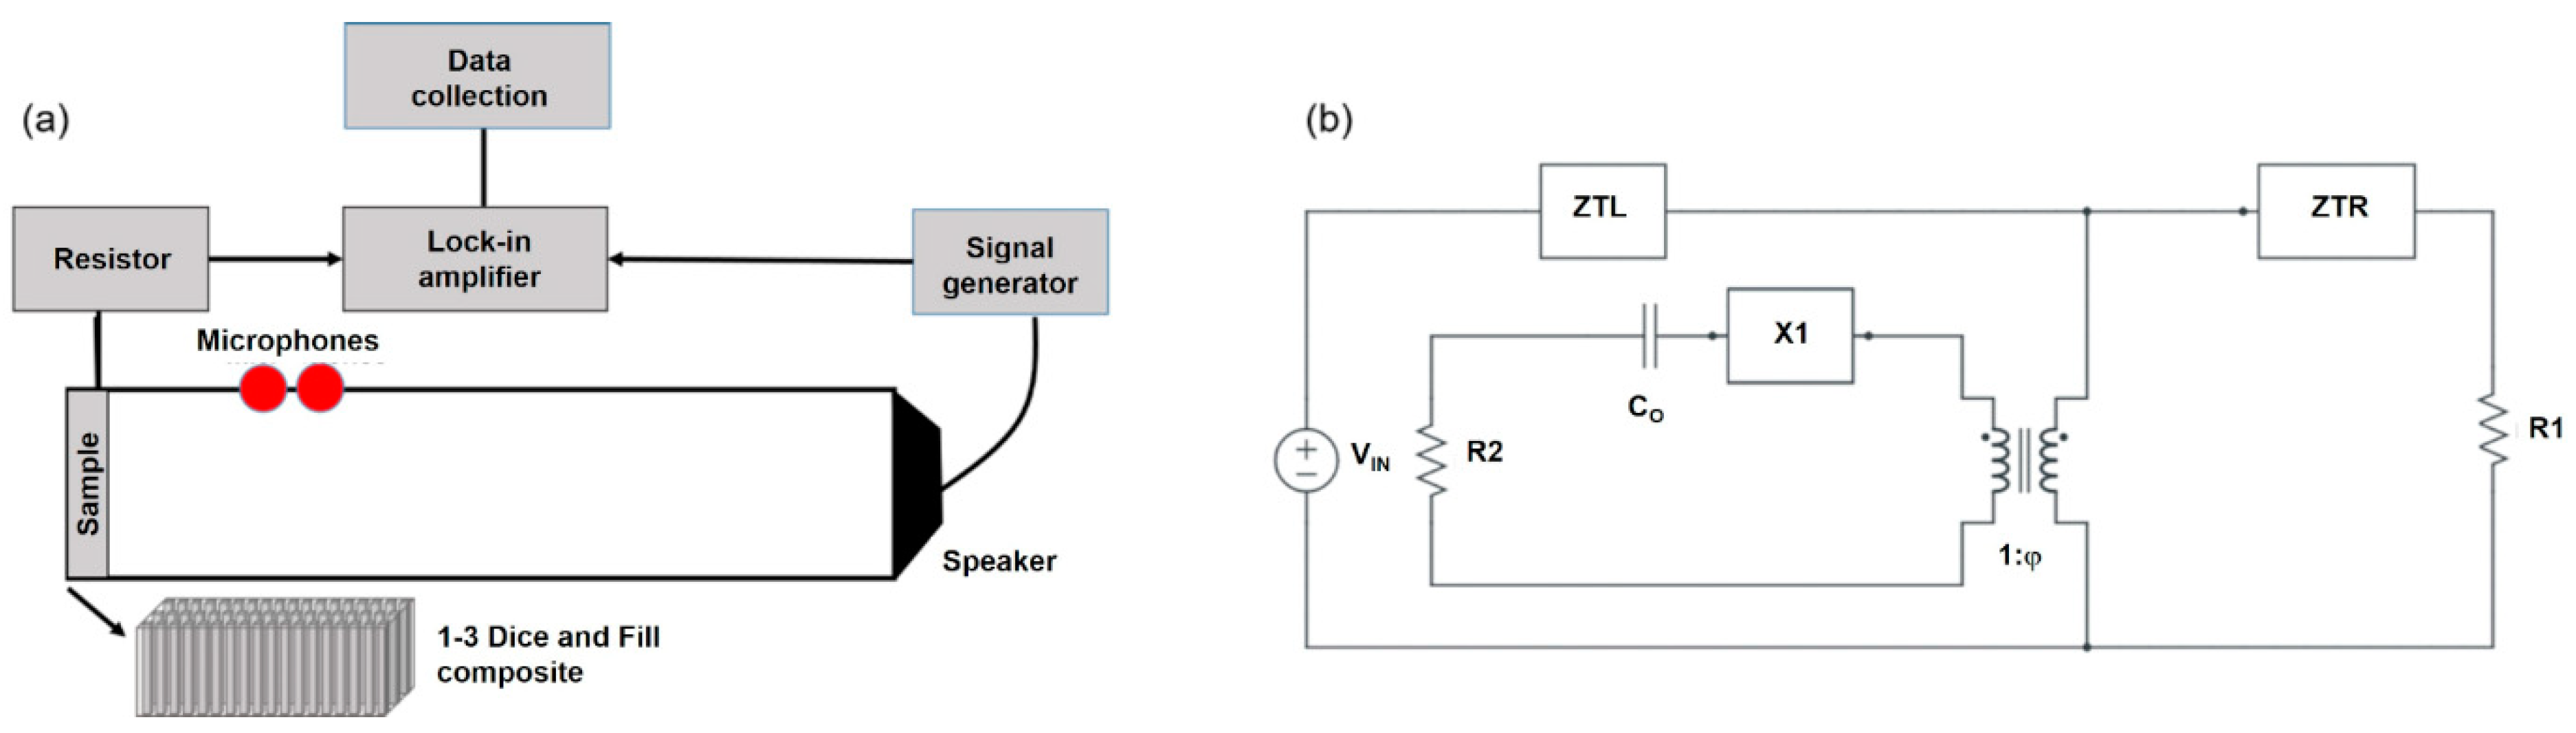
2.2. Power Generation Measurement

For voltage generation measurements, the signal used was a 100–5000 Hz frequency sweep for 49 s and with a 10 Hz sample frequency. Rather than an oscilloscope for voltage measurements, a lock-in amplifier and prewritten LabVIEW software were used for data collection. During data collection, the recorded signal was monitored for clipping. If this occurred, sensitivity was adjusted and recorded to properly scale the data during data processing. For each material, the voltages generated during the signal sweep were recorded across 0.510, 1, 1.5, 2, 4.7, and 10 kΩ resistors. The power across each resistor versus frequency was calculated to examine the optimal conditions for maximum power generation. Once the optimal conditions were determined, the materials’ power as a function of the sound pressure level was found.

2.3. Sample Details

1–3 PbZr1–xTixO3 dice and fill composites were purchased from Smart Materials. To examine the relationship between the voltage generated and the sound absorption for varying amounts of PZT, samples with a 25%, 45%, and 65% PZT fill factor were selected. All samples were coated with CuSn (copper-tin) electrodes and then poled. Wires were then attached to each side of a material with conductive silver paste and copper tape.

2.4. Model Details/Equivalent Circuit Design

Figure 1b gives a schematic of the equivalent circuit used for the model. Across one of the acoustic ports, a voltage would be added to represent the force of the acoustic wave that impacts the PZT composite (VIN). On the other acoustic port, a resistor R1 is added so we can tune the boundary conditions as the composite is clamped at the edge but free in the middle. The electrical port is connected with a resistor R2, which represented the load resistor across which we measured the voltage in our experimental data.
The experimental input parameters that were required for the model were capacitance (C0), density of the PZT/polymer composite (ρcomposite), piezoelectric coefficient d33, area A, and thickness t. The d33 values were measured in the laboratory using a Berlincourt measurement system. C0, ρPZT, and ρpolymer were given by the materials’ specification sheets from the manufacturer. Constants ρcopper, vPZT, vpolymer, and vcopper were given by the NDT Resource Center [30]. To calculate the density and longitudinal sound velocity in the piezoelectric composites, we used a weighted average for the different fill factors (e.g., for 25% fill factor, 0.25 ∗ ρPZT + 0.75 ∗ ρpolymer = ρcomposite).

3. Results

3.1. Absorption Coefficient of PZT Ceramics

Figure 2 shows the absorption coefficients using the two microphone measurements, as calculated using the custom written data analysis software. The tube was validated prior to study of the piezoelectric composite samples by comparing the absorption coefficients of the empty tube to a polyurethane acoustic foam. Differences in the absorption coefficient are mainly seen in the 0–750 Hz range for the PZT composites. The 25% sample is clearly less absorptive when compared to the higher amounts of PZT in the sample. Due to the higher amounts of polymer (which has an acoustic impedance closer to that of air), there is a better impedance match between the material and air, resulting in better transmission of the pressure wave through the material, which results in reflection off the rigid back plate. The samples with 45% and 65% show very similar absorption coefficient spectrums, with the 65% PZT being slightly lower. From 750 to 2000 Hz, all samples had similar absorption coefficient values. Although the homebuilt tube may introduce noise into these measurements, the relative values and trends for the different fill factors are not expected to be affected.

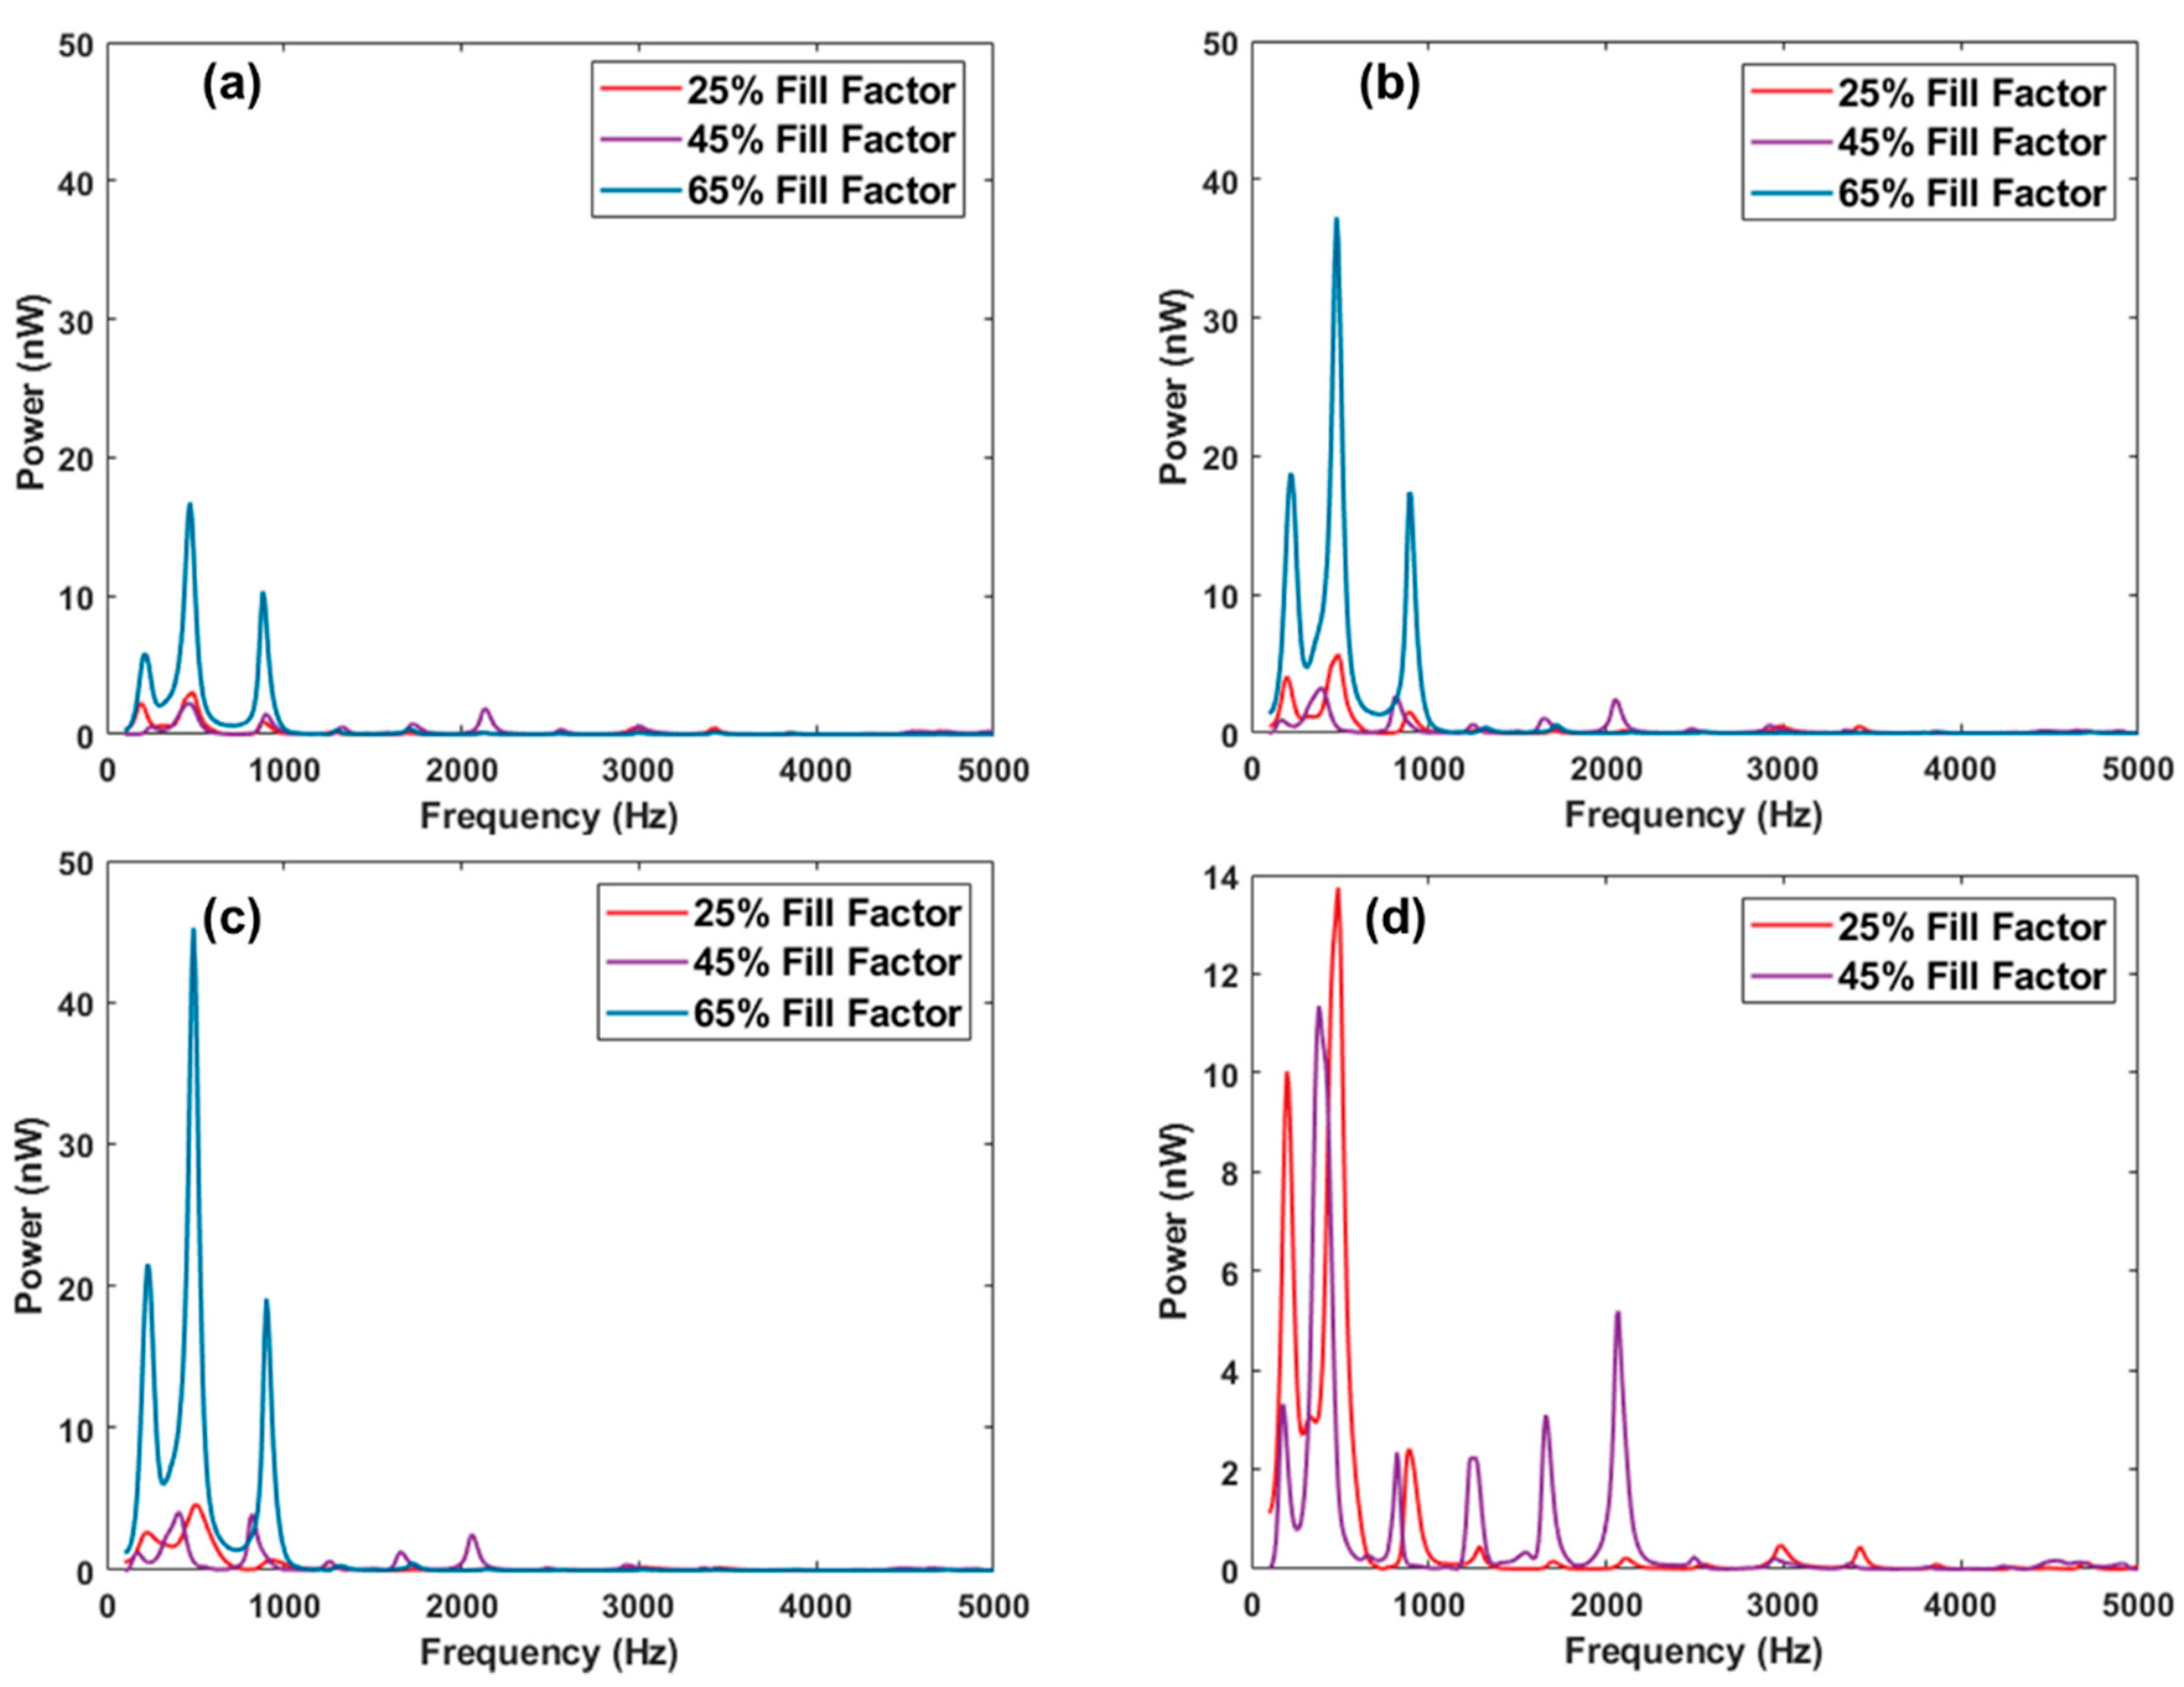
3.2. Power Generated

From the plots in Figure 3, the conditions for optimal power generation were found by varying the load resistor and looking at the frequency spectrum in the range of interest. These conditions are shown in Table 1. The frequency of the peak in the power values is consistent for all samples and roughly correlates to the fundamental standing wave frequency of the tube (L = 40 cm, giving f0 ~430 Hz).
Figure 4 shows the peak values of power generated by the PZT composites as a function of sound pressure levels (SPL, in dB). A deviation from linear behavior is observed, but when plotted on a log–log scale (not presented), a linear relationship between electric and acoustic power is observed. Higher amounts of PZT clearly lead to significantly higher amounts of power generation. At 111 dB, the power of the 65% fill sample is approximately three times that of the 45% fill and six times that of the 25% fill. This also correlates to an increase in the piezoelectric coefficient (d33), which was measured for the composite samples. This indicates that a high piezoelectric coefficient (and therefore a higher amount of piezo-active material) is more important than acoustic impedance matching in optimizing the power harvested.

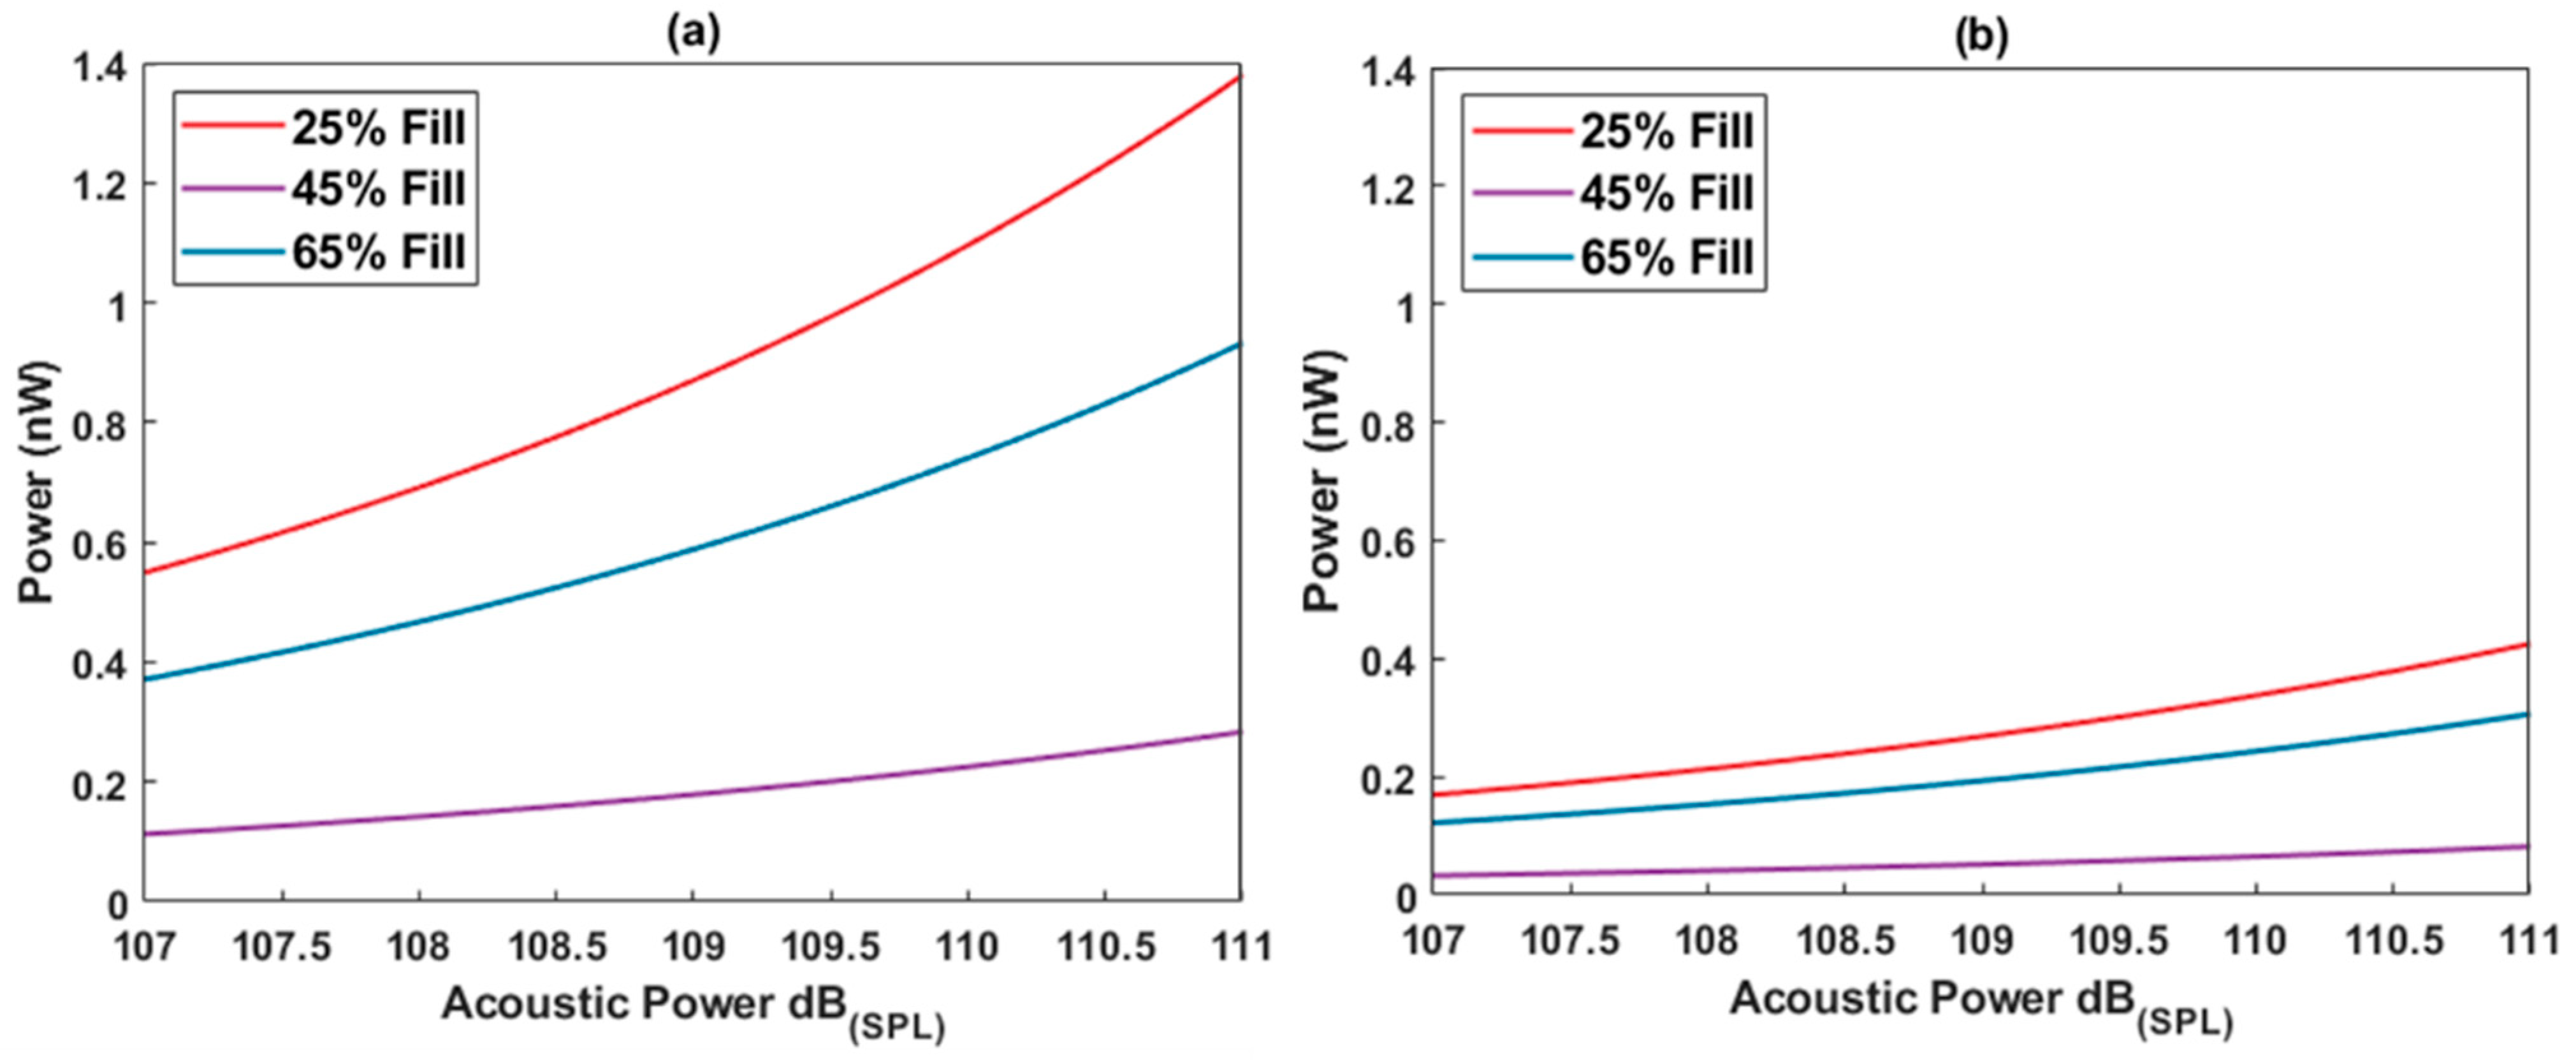
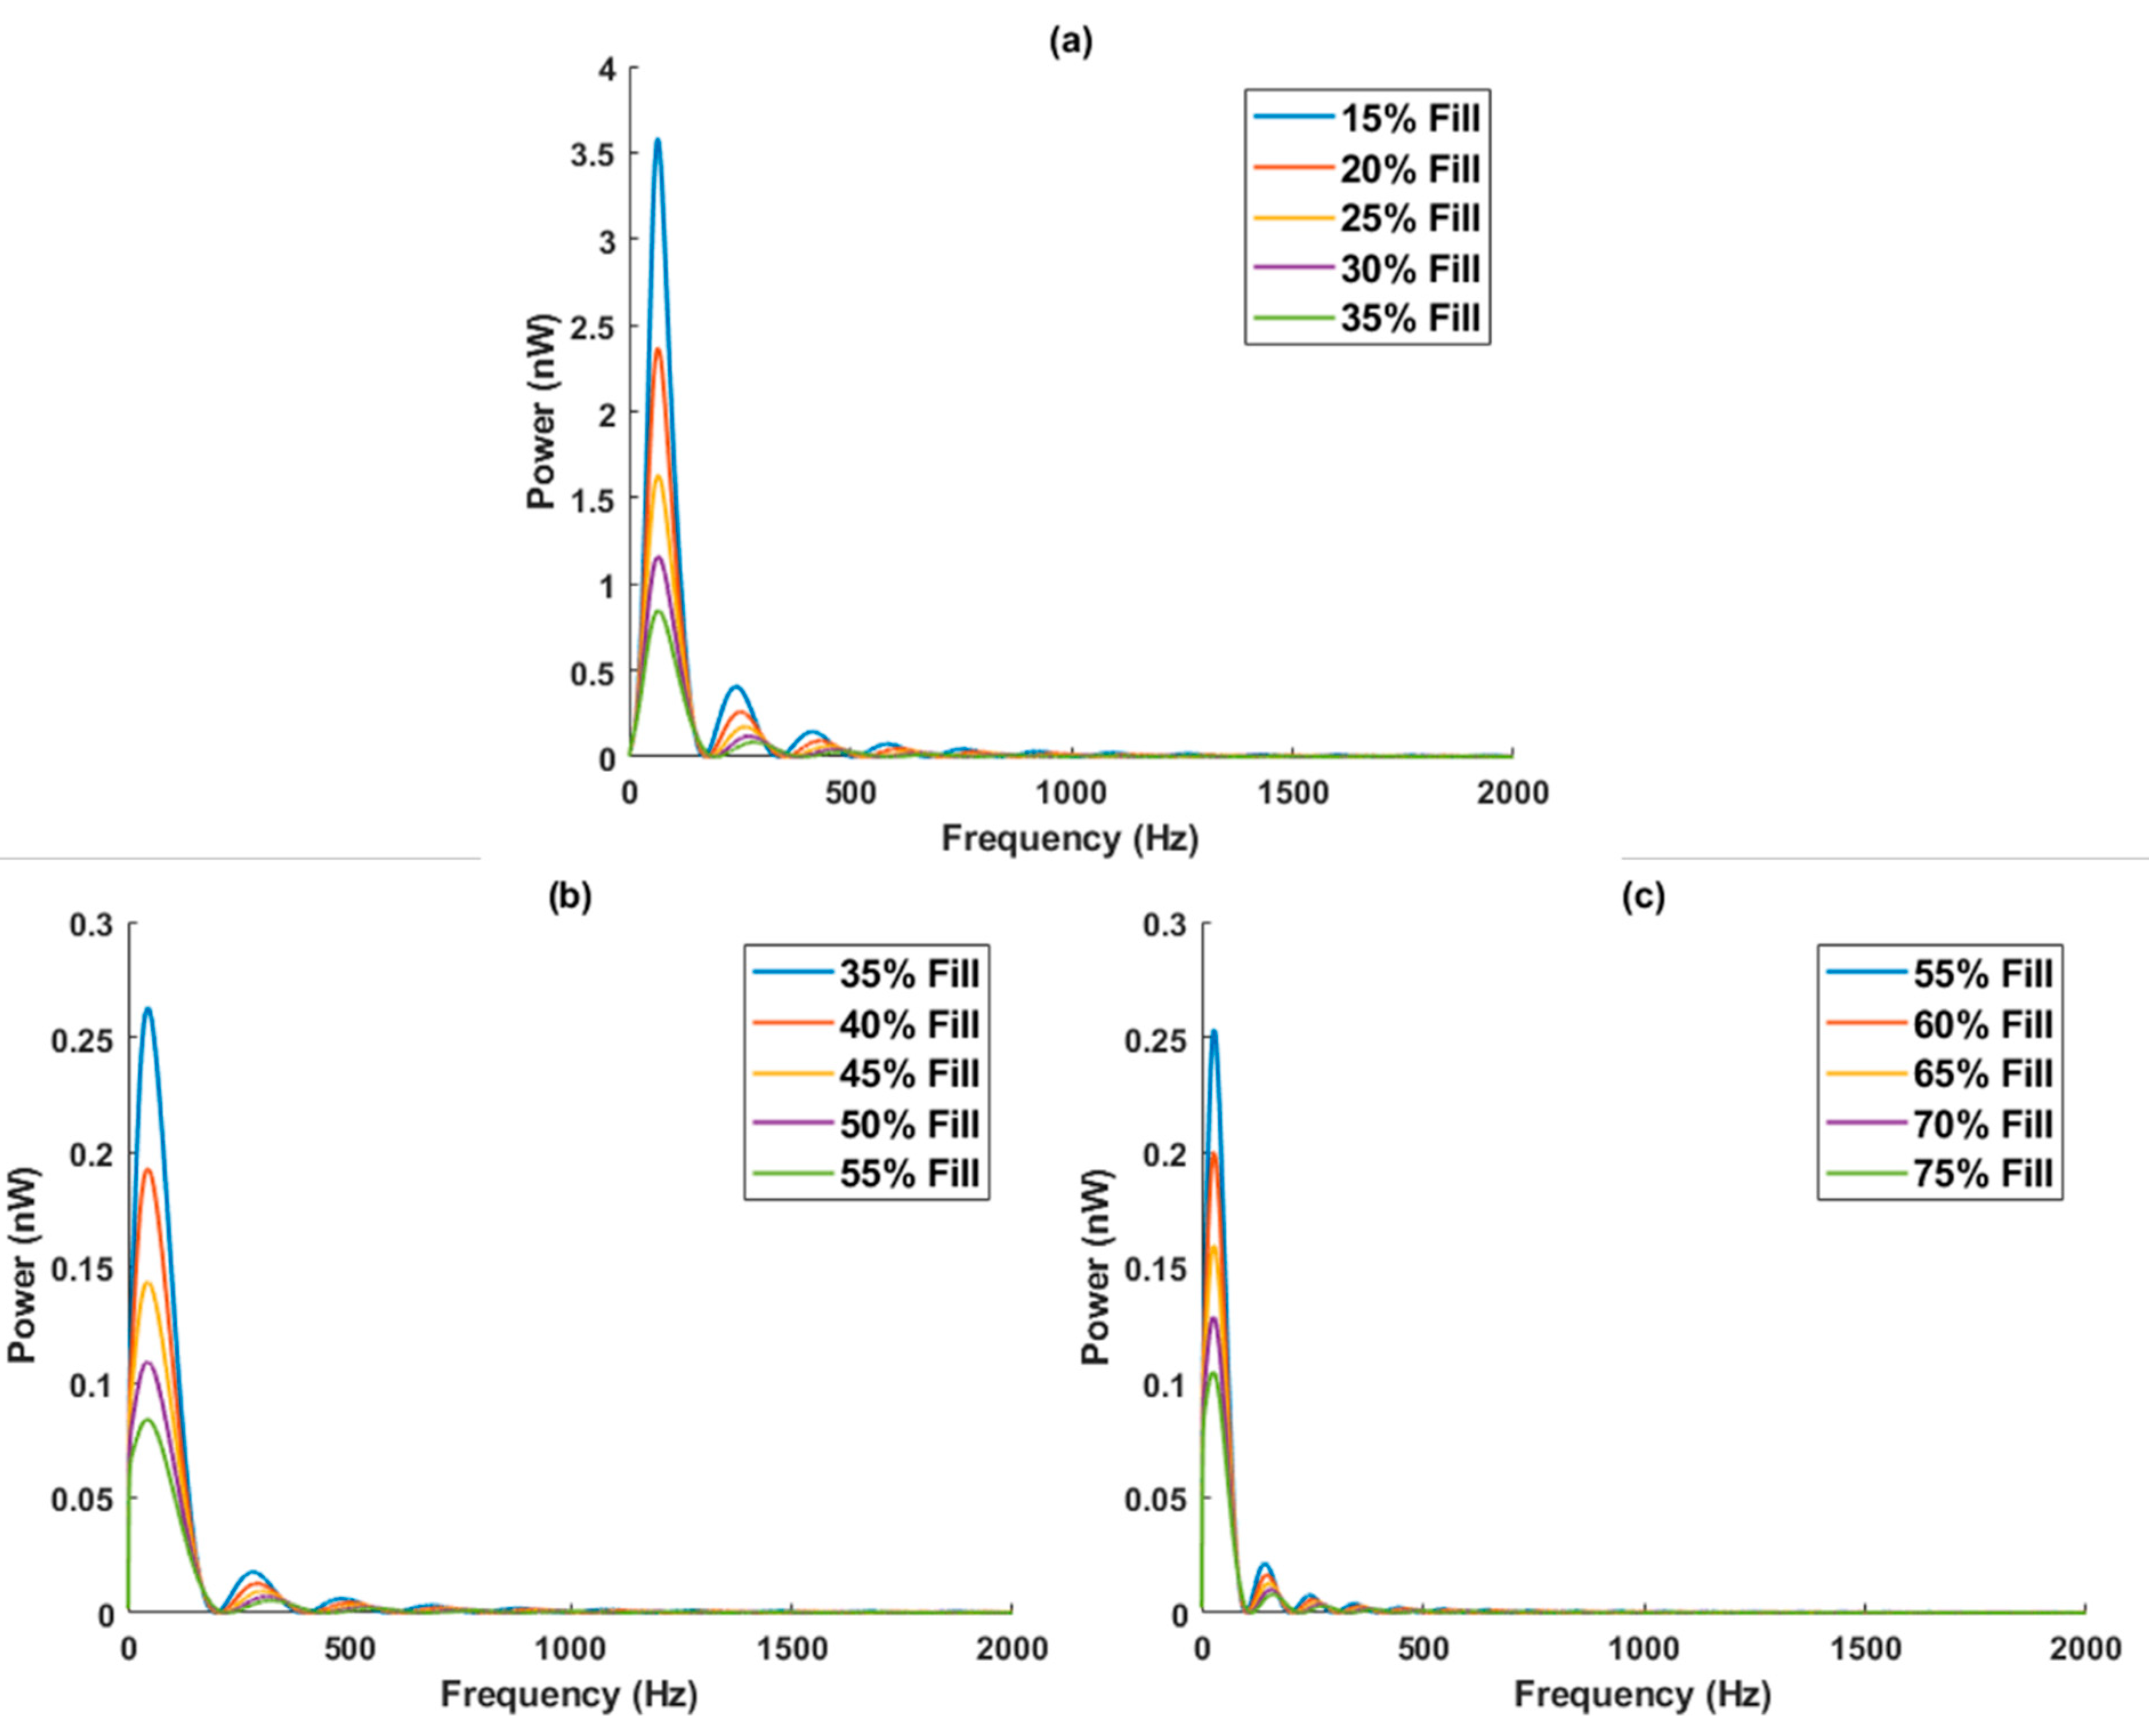
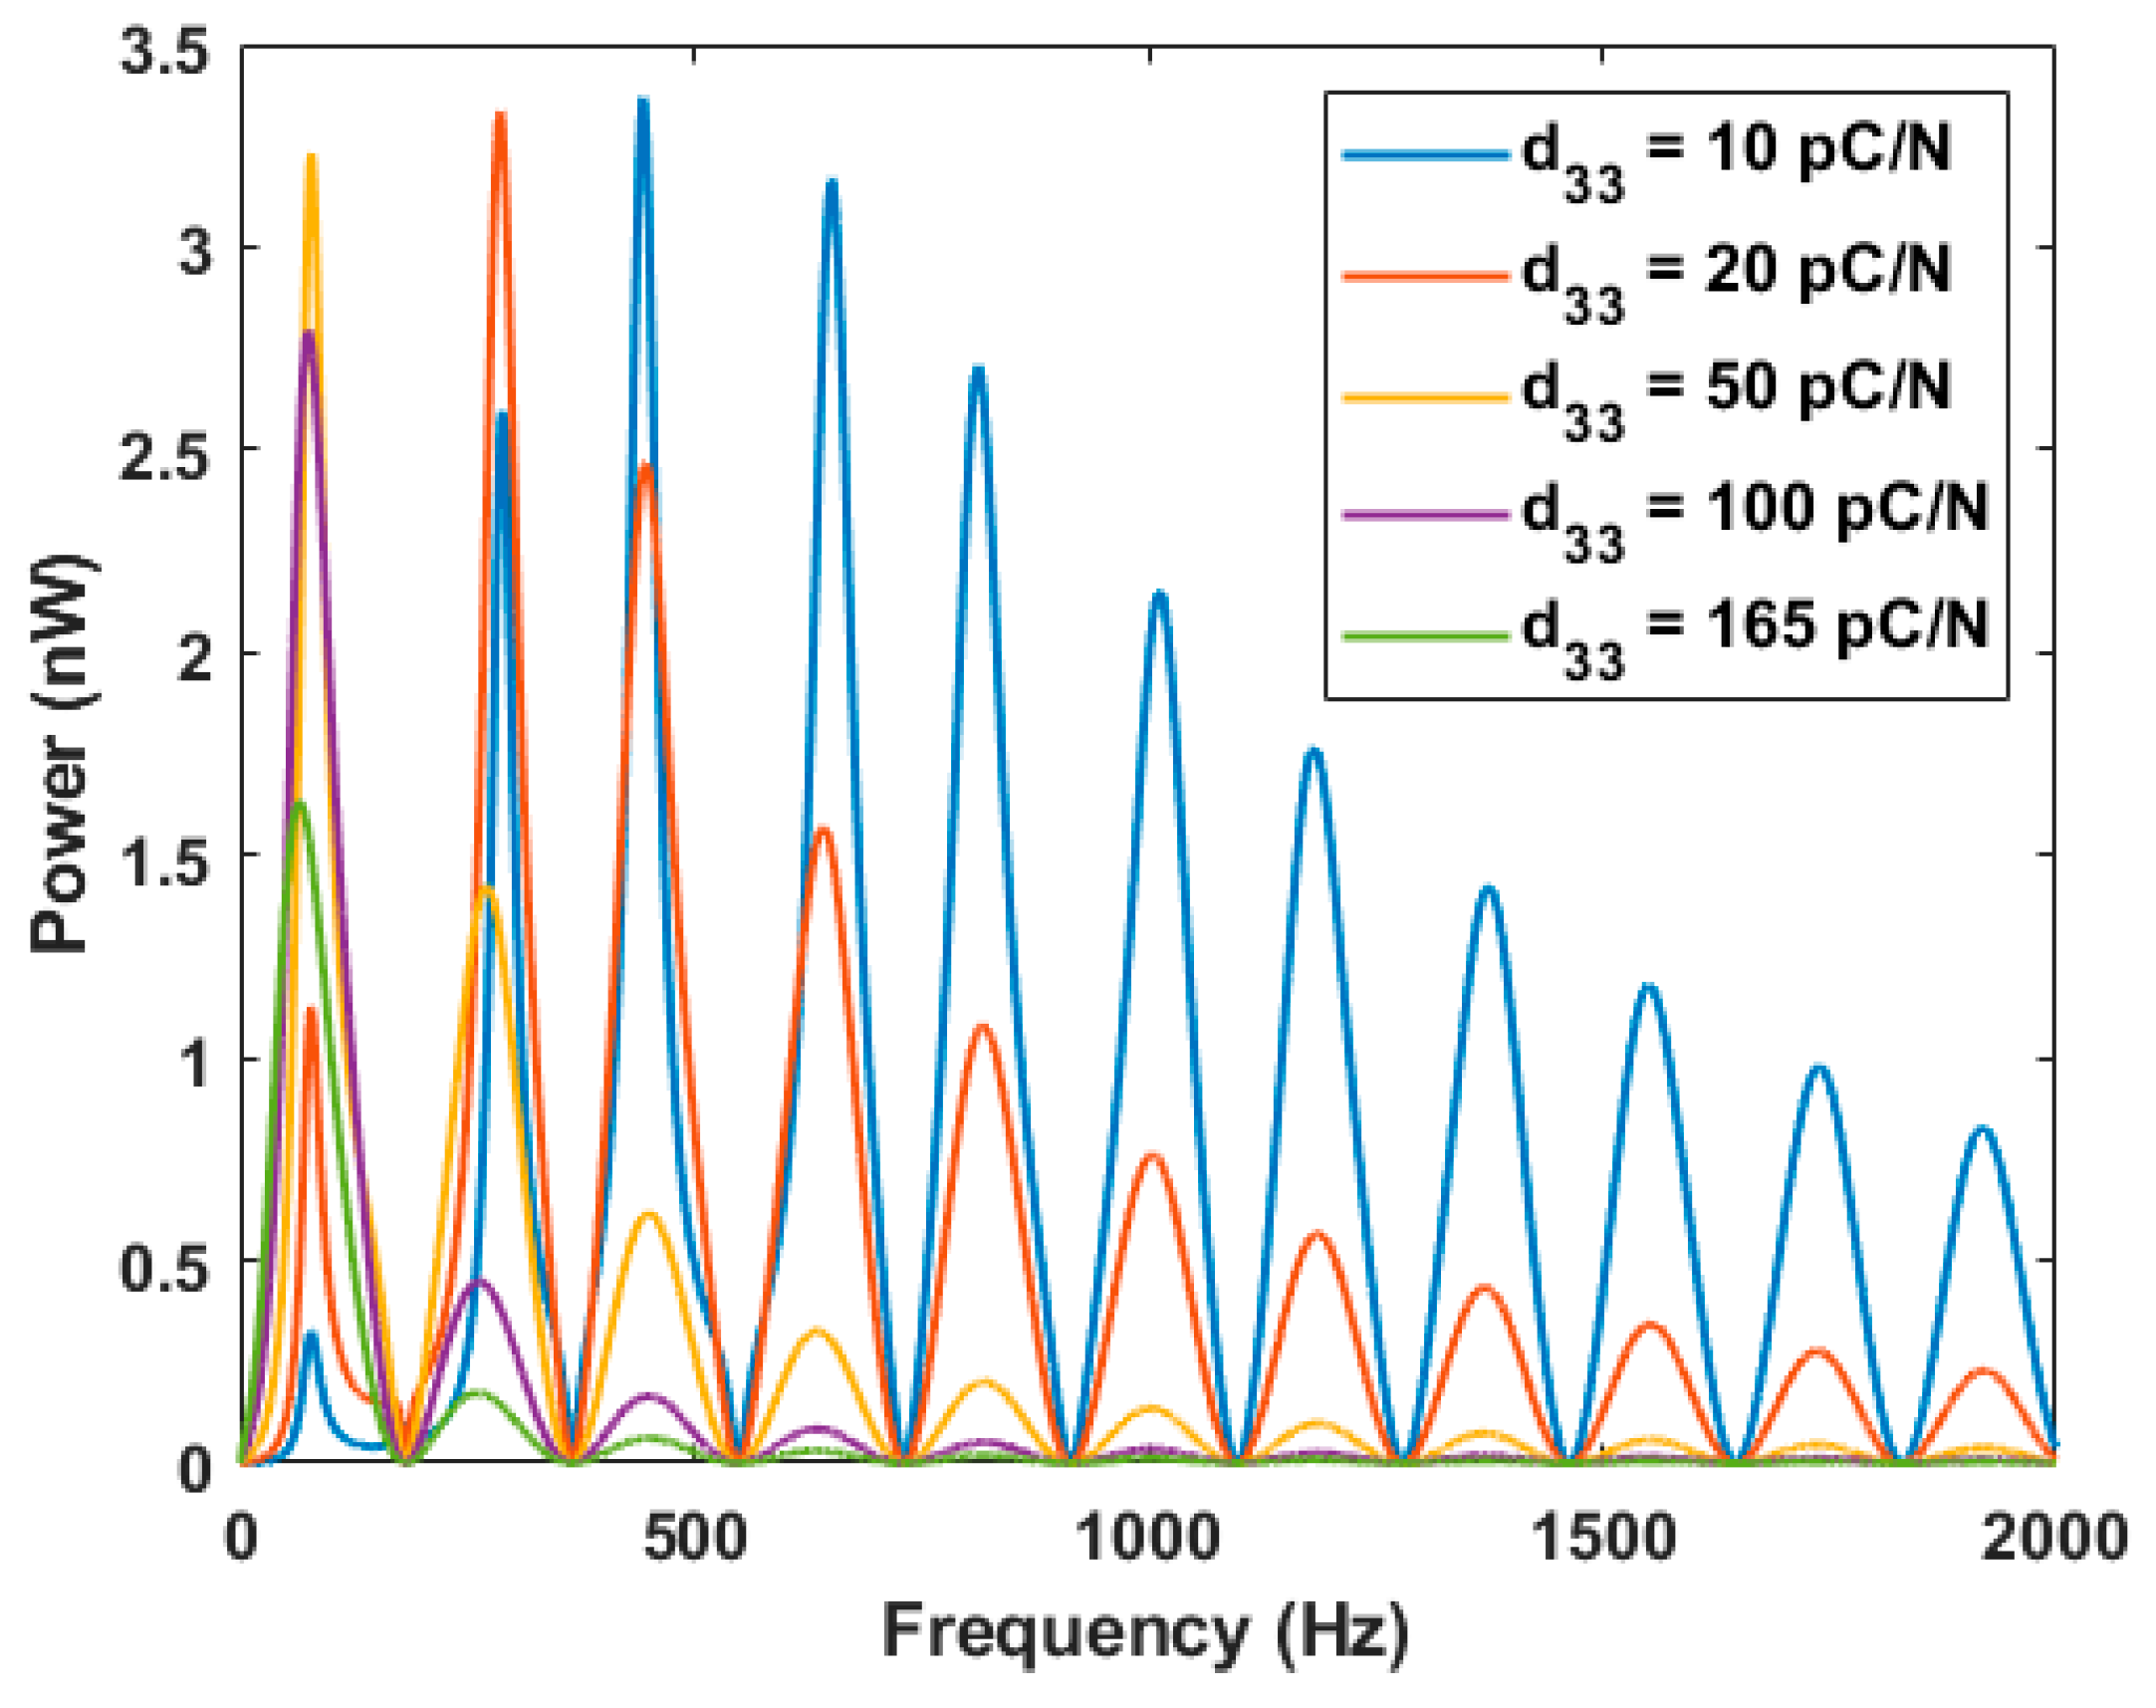
3.3. KLM Model Results

The modeling results showing the peak power generated for the three different composites versus the input acoustic pressure is plotted in Figure 5. There are quite a few differences to note between the simulated data and the experimental data. The first is that, by inputting the measured materials parameters, the power generated is an order of magnitude lower than what we experimentally measured. We also observed the opposite trend in how the fill factor of PZT affects the power. Experimentally, in Figure 4, we see that more of the active material corresponded to more power (i.e., 65% fill factor had the highest values for all dB levels). However, in the simulations, the 25% fill yielded the most power, followed by the 65% fill and the 45% fill.
To examine this further, the impact of adjusting the parameters within experimental error was investigated. Firstly, for impedance matched conditions, there is a difference in peak power of over 3× between open and short acoustic boundary conditions. The open condition corresponds to the AEH being clamped (i.e., not free to resonate), whereas the short condition corresponds to the AEH being mechanically unrestricted. The piezoelectric composites were placed against a metal flange but were not completely restricted and are likely somewhere in between the two. This can be adjusted through the addition of a resistive term R1 in the series with the boundary and through tuning the output voltage and power between the open and short conditions (not shown). However, this correction factor should be the same for all three samples. Secondly, there is up to ±10% variability in the fill factors, as quoted by the supplier. This would lead to a large difference in the acoustic velocity of the material. We see in Figure 6 that the peak output power is systematically lowered as the fill factor is increased. For the 25% fill factor sample, the maximum 10% tolerance factor translates to a +100% or −50% change in the peak output power. This variance is roughly the same for the 45% and 65% samples around their tolerance factor as well. However, almost an order of magnitude of difference still exists between some of the samples, so the acoustic velocity alone would still not be enough to account for the discrepancy in the theoretical and experimental results.
Lastly, the piezoelectric coefficient d33 was varied, as shown for the 25% fill factor sample in Figure 7. Other than the fill factor, this parameter was shown experimentally to have the highest value of experimental error and is expected to dramatically alter the energy produced for a given set of conditions. For higher values of the piezoelectric coefficient (50 pC/N or higher), the output extinguishes with higher modes, as expected, but for lower values of d33, the power output is lower at the first peak and then goes up and reaches a maximum value at what is most likely a second or third harmonic before being extinguished. In fact, the output for d33 = 20 pC/N most closely matches our experimental results for the 25% fill sample, as this behavior with the maximum power at the secondary peak is observed, as seen in Figure 3. This is despite the measured value of 165 pm/V, which shows maximum power at the first peak that is inconsistent with the results. The frequencies of the peaks in the power are also similar to the measured values (350 Hz and 460 Hz, respectively, for the 25% fill sample). This suggests that the piezoelectric coefficient is most likely lower than that initially measured. Repeated testing after measurements did not show a significant discrepancy in the values of d33, suggesting that the samples are not depoling or otherwise affected by the measurements. Another alternative is that it is a result of the partial clamping of the samples. The electrode area is higher for the 25% fill sample (6400 vs. 5625 mm2), making the possibility of clamping conditions having more of an impact on this sample than the others highly likely.

4. Discussion

The initial assumptions by the authors were that there may be a tradeoff in performance due to the acoustic impedance mismatch with air, decreasing with higher amounts of active ceramic material. Rather, the experimental results indicate that the higher amount of piezoelectric material results in a higher power harvested from the acoustic energy, which also is a reasonable assumption. Although the results of the KLM model would suggest that a lower density and corresponding acoustic velocity is the primary factor that drives high power, this discrepancy is most likely due to the clamping of the samples impacting the effective piezoelectric coefficient. Working towards a more comprehensive study that varies the density and the piezoelectric response of composite materials is also planned based on these encouraging results, and this should help to more fully understand the impact of acoustic impedance and piezoelectric properties. Revising the model to add impedance matching layers, similar to the methods used in enhancing the radiated power of a transducer, could also provide additional insight.

5. Conclusions

In summary, 1–3 dice and fill piezoelectric-polymer composites were investigated both experimentally and through a KLM model as a passive sound cancellation layer and as potential acoustic energy harvesters. The absorption coefficient was higher as the amount of PZT ceramic material was increased, corresponding to an increased acoustic impedance. Experimentally, the power generated was increased with the higher amount of piezoelectric material as well. However, using the KLM 1D equivalent model, the 25% fill factor sample is predicted to show a higher output power for the same acoustic input power, but this is most likely due to discrepancies in the piezoelectric coefficient that would play an important role in the power output. With a maximum peak power of 115 nW, these 1–3 composites are promising for acoustic energy harvesting applications.

Supplementary Materials

The following supporting information can be downloaded at: https://www.mdpi.com/article/10.3390/en15103734/s1, Figure S1: Tube Design Schematic, Figure S2: fully fabricated impedance tube, Table S1: Materials used for impedance tube fabrication, Table S2: Specifications of PZT composite materials. References [31,32] are cited in the supplementary materials.

Author Contributions

J.F.J. designed and fabricated the testing setup, J.F.J. and M.S. performed the experiments, J.F.J. calculated the KLM results, J.F.J. and M.S. analyzed the results and prepared the manuscript. All authors have read and agreed to the published version of the manuscript.

Funding

This work was supported by the Office of Naval Research through the Naval Research Laboratory’s Basic Research Program.

Data Availability Statement

Data are available upon reasonable request to the authors.

Conflicts of Interest

The authors declare no conflict of interest.

References

  1. Yuan, M.; Cao, Z.; Luo, J.; Chou, X. Recent Developments of Acoustic Energy Harvesting: A Review. Micromachines 2019, 10, 48. [Google Scholar] [CrossRef] [PubMed] [Green Version]
  2. Khan, F.U. Izhar State of the art in acoustic energy harvesting. J. Micromech. Microeng. 2015, 25, 023001. [Google Scholar] [CrossRef]
  3. Marakakis, K.; Tairidis, G.K.; Koutsianitis, P.; Stavroulakis, G.E. Shunt piezoelectric systems for noise and vibration control: A review. Front. Built Environ. 2019, 5, 64. [Google Scholar] [CrossRef]
  4. Makihara, K.; Miyakawa, T.; Onoda, J.; Minesug, K.I. Fuselage panel noise attenuation by piezoelectric switching control. Smart Mater. Struct. 2010, 19, 085022. [Google Scholar] [CrossRef]
  5. Larbi, W.; Deu, J.-F.; Ohayon, R. Finite element reduced order model for noise and vibration reduction of double sandwich panels using shunted piezoelectric patches. Appl. Acoust. 2016, 108, 40–49. [Google Scholar] [CrossRef]
  6. Hui-ye, Y.; Yang, L.; Chong, D.; Yi-Fan, Q.; Jin-Chao, M.; Tian-Yu, Z. Study on Electrical Parameter Matching of Piezoelectric Stack Periodic Strut for Helicopter Cabin Noise Control. Shock. Vib. 2022, 2022, 8952217. [Google Scholar] [CrossRef]
  7. Liu, F.; Phipps, A.; Horowitz, S.; Ngo, K.; Cattafesta, L.; Nishida, T.; Sheplak, M. Acoustic energy harvesting using an electromechanical Helmholtz resonator. J. Acoust. Soc. Am. 2008, 123, 1983–1990. [Google Scholar] [CrossRef]
  8. Horowitz, S.B.; Sheplak, M.; Cattafesta, L.N.; Nishida, T. A MEMS acoustic energy harvester. J. Micromech. Microeng. 2006, 16, S174–S181. [Google Scholar] [CrossRef]
  9. Liu, G.-S.; Peng, Y.-Y.; Liu, M.-H.; Zou, X.-Y.; Cheng, J.-C. Broadband acoustic energy harvesting metasurface with coupled Helmholtz resonators. Appl. Phys. Lett. 2018, 113, 153503. [Google Scholar] [CrossRef] [Green Version]
  10. Li, H.Y.; Choi, B. A multilayer PVDF composite cantilever in the Helmholtz resonator for energy harvesting from sound pressure. Smart Mater. Struct. 2013, 22, 115025. [Google Scholar]
  11. Li, B.; You, J.H.; Kim, Y.-J. Low frequency acoustic energy harvesting using PZT piezoelectric plates in a straight tube resonator. Smart Mater. Struct. 2013, 22, 055013. [Google Scholar] [CrossRef]
  12. Yuan, M.; Cao, Z.; Luo, J.; Zhang, J.; Cheng, C. An efficient low-frequency acoustic energy harvester. Sens. Actuators A 2017, 264, 84–89. [Google Scholar] [CrossRef]
  13. Qi, S.; Oudich, M.; Li, Y.; Assouar, B. Acoustic energy harvesting based on a planar acoustic metamaterial. Appl. Phys. Lett. 2016, 108, 263501. [Google Scholar] [CrossRef]
  14. Wu, L.-Y.; Chen, L.-W.; Liu, C.-M. Acoustic energy harvesting using resonant cavity of a sonic crystal. Appl. Phys. Lett. 2009, 95, 013506. [Google Scholar] [CrossRef]
  15. Wang, W.-C.; Wu, L.-Y.; Chen, L.-W.; Liu, C.-M. Acoustic energy harvesting by piezoelectric curved beams in the cavity of a sonic crystal. Smart Mater. Struct. 2010, 19, 045016. [Google Scholar] [CrossRef]
  16. Wang, Y.; Zhu, X.; Zhang, T.; Bano, S.; Pan, H.; Qi, L.; Zhang, Z.; Yuan, Y. A renewable low-frequency acoustic energy harvesting noise barrier for high-speed railways using a Helmholtz resonator and a PVDF film. Appl. Energy 2018, 230, 52–61. [Google Scholar] [CrossRef]
  17. Yang, J.; Chen, J.; Liu, Y.; Yang, W.; Su, Y.; Wang, Z.L. Triboelectrification-Based Organic Film Nanogenerator for Acoustic Energy Harvesting and Self-Powered Active Acoustic Sensing. ACS Nano 2014, 8, 2649–2657. [Google Scholar] [CrossRef]
  18. Fan, X.; Chen, J.; Yang, J.; Bai, P.; Li, Z.; Wang, Z.L. Ultrathin, rollable, paper-based triboelectric nanogenerator for acoustic energy harvesting and self-powered sound recording. ACS Nano 2015, 9, 4236. [Google Scholar] [CrossRef]
  19. Chen, F.; Wu, Y.; Ding, Z.; Xia, X.; Li, S.; Zheng, H.; Diao, C.; Yue, G.; Zi, Y. A novel triboelectric nanogenerator based on electrospun polyvinylidene fluoride nanofibers for effective acoustic energy harvesting and self-powered multifunctional sensing. Nano Energy 2019, 56, 241. [Google Scholar] [CrossRef]
  20. Mason, W.P. Electromechanical Transducers and Wave Filters; Van Nostrand: New York, NY, USA, 1948; pp. 201–209. [Google Scholar]
  21. Krimholtz, R.; Leedom, D.A.; Matthaei, G.L. New equivalent circuits for elementary piezoelectric transducers. Electron. Lett. 1970, 6, 398–399. [Google Scholar] [CrossRef]
  22. Sherrit, S.; Leary, S.P.; Dolgin, B.P.; Bar-Cohen, Y. Comparison of the Mason and KLM equivalent circuits for piezoelectric resonators in the thickness mode. In Proceedings of the 1999 IEEE Ultrasonics Symposium. Proceedings. International Symposium (Cat. No.99CH37027), Caesars Tahoe, NV, USA, 17–20 October 1999; Volume 2, pp. 921–926. [Google Scholar]
  23. Coates, R.; Maguire, P.T. Multiple-mode acoustic transducer calculations. IEEE Trans. Ultrason. Ferroelectr. Freq. Control 1989, 36, 471–473. [Google Scholar] [CrossRef] [PubMed]
  24. Brown, L.F.; Carlson, D.L. Ultrasound transducer models for piezoelectric polymer films. IEEE Trans. Ultrason. Ferroelectr. Freq. Control 1989, 36, 313–318. [Google Scholar] [CrossRef] [PubMed]
  25. Arnold, F.; Goncalves, M.S.; Bravo-Roger, L.L.; Muhlen, S.S. Electric Impedance of Piezoelectric Ceramics under Acoustic Loads. ECTI Trans. Electr. Eng. Electron. Commun. 2015, 12, 48–54. [Google Scholar]
  26. Sherrit, S. The physical acoustics of energy harvesting. In Proceedings of the 2008 IEEE Ultrasonics Symposium, Beijing, China, 2–5 November 2008; pp. 1046–1055. [Google Scholar]
  27. Liang, J.; Liao, W.-H. Impedance Modeling and Analysis for Piezoelectric Energy Harvesting Systems. IEEE/ASME Trans. Mechatron. 2012, 17, 1145–1157. [Google Scholar] [CrossRef]
  28. Chung, J.Y.; Blaser, D.A. Transfer function method of measuring in-duct acoustic properties. I. Theory. J. Acoust. Soc. Am. 1980, 68, 907–913. [Google Scholar] [CrossRef]
  29. Vengala, K.C. Building a Modified Impedance Tube for Measurement of Sound Transmission Loss and Absorption Coefficients of Polymer Cross-Linked Aerogel Core Composites. Master’s Thesis, Oklahoma State University, Stillwater, OK, USA, 2009. [Google Scholar]
  30. Center, N.E.R. Materials Property Table. Available online: https://www.nde-ed.org/GeneralResources/MaterialProperties/UT/ut_matlprop_piezoelectrics.htm (accessed on 8 June 2020).
  31. Deshpande, S.P.; Rao, M.D. Development of a low-cost impedance tube to measure acoustic absorption and transmission loss of materials. In Proceedings of the 2014 ASEE Annual Conference & Exposition, Indianapolis, IN, USA, 15–18 June 2014. [Google Scholar]
  32. ASTM. Standard Test Method for Impedance and Absorption of Acoustical Materials Using a Tube, Two Microphones and a Digital Frequency Analysis System; American Society for Testing of Materials: West Conshohocken, PA, USA, 1990; pp. 1–12. [Google Scholar] [CrossRef]
Figure 1. (a) Schematic of the experimental setup including the impedance tube and the 1–3 dice and fill composite. (b) KLM equivalent circuit for the present acoustic energy harvesting setup. ZTL and ZTR are the impedance values for the left and right acoustic ports, respectively.
Energies 15 03734 g001
Figure 2. Plots of the absorption coefficients for the composite materials with different fill factors.
Energies 15 03734 g002
Figure 3. Power generated by the PZT samples for a load resistance of (a) 510 Ω, (b) 1 kΩ, (c) 1.5 kΩ, and (d) 2 kΩ.
Energies 15 03734 g003
Figure 4. Peak power generation for the samples with different fill factors as a function of sound pressure (dBSPL).
Energies 15 03734 g004
Figure 5. Power generation as a function of the sound pressure level for (a) an open boundary condition and (b) a shorted boundary condition.
Energies 15 03734 g005
Figure 6. The projected power versus frequency for variations in the fill factor of ±10% of the nominal value, with other parameters held constant for the (a) 25%, (b) 45%, and (c) 65% samples.
Energies 15 03734 g006
Figure 7. The projected power versus frequency for the 25% fill factor sample with various piezoelectric coefficients.
Energies 15 03734 g007
Table 1. Optimal power generation conditions for the composites.
PZT Fill FactorPiezoelectric Coefficient d33 (pC/N)Frequency
(Hz)
Load Resistance
(Ω)
25%1254802000
45%3634802000
65%4094701500
Publisher’s Note: MDPI stays neutral with regard to jurisdictional claims in published maps and institutional affiliations.

