Article

Fault Tracking Method for Relay Protection Devices

Key Laboratory of Power System Intelligent Dispatch and Control of Ministry of Education, Shandong University, Jinan 250061, China
*
Author to whom correspondence should be addressed.
Energies 2021, 14(9), 2723; https://doi.org/10.3390/en14092723
Submission received: 12 April 2021 / Revised: 26 April 2021 / Accepted: 6 May 2021 / Published: 10 May 2021

Abstract

:
A method of fault tracking for relay protection devices is presented in this paper. Fault tracking means that after the failure of relay protection devices, the anomalies and warning information are obtained through data-mining technology, and then, the fault tracking algorithm is used to find the cause of failure. Let us take microcomputer protection as an example: Firstly, the common failure symptoms and the prior probability of failure causes can be collected through empirical field data. Then, the concept of an event set is proposed; thus, the causes set and the symptoms set of failure can be created. According to the causal relationship between the causes set of failure and symptoms set of failure, the reasoning chain and the corresponding Bayesian network model are built. Then, the probability of failure causes can be obtained through backward reasoning to continue the tracking analysis of failure causes for relay protection devices. Since the data used in modeling are all from statistics, this method has strong applicability and represents a simple and reliable method for the timely determination and elimination of failure in a power system.

1. Introduction

When a power system fails, the corresponding circuit breaker should be tripped to cut off the fault, to reduce power outages. However, if the protection or circuit breaker itself fails, the result is a refuse-operation or maloperation, which is likely to expand the failure range. At present, the mainstream ideas of fault diagnosis of power systems are concerned with the accuracy of protection and circuit breakers. Some fault diagnosis methods can further determine whether the failure is caused by refuse-operation or maloperation, but these methods are unable to identify the internal causes of failure. Therefore, in order to rapidly find the cause and promptly eliminate it when failure occurs, this paper puts forward a concept of fault tracking to solve the problem. Fault tracking [1] refers to the process of using data-mining technology to classify and extract the alarm data inside substations, so as to determine the internal causes of failures. That is, after failure of the known device, the warning information can be used to traceback and find internal causes of its failure. Logically, this method is contrary to the traditional fault diagnosis methods. This method aims at making full use of various information sources in a power system to extend the function of the fault diagnosis algorithm. At the same time, this idea improves the concept of fault diagnosis. The notion of fault tracking means that fault diagnosis is no longer restricted to condition monitoring or fault feature recognition and enables it to go deeper into the device to determine the causes of failure. Through fault tracking, the internal causes of power system failure can be diagnosed, from shallow to deep levels. This method is based on alarm data inside substations, so it can provide a reference for what monitoring information needs to be added. In this paper, the analysis of various fault types of relay protection devices also provides an important guidance for the maintenance, design and improvement of devices.
In this study, the failure of a relay protection device was taken as an example to construct a fault tracking model. The algorithm of fault tracking for relay protection devices was utilized on the basis of the model. Relay protection devices provide a guarantee for proper operation of an entire power system. This is essential for the reliable, stable and economic operation of a power system to ensure its consistent operation and function. At present, most of the research on the failure of relay protection devices focuses on condition-based maintenance [2,3], failure detection [4,5,6] and the diagnosis of hidden failures [7]. There are still few studies on the failures caused by internal faults of relay protection devices. Some only focus on one or two specific cases, such as separate research and analysis of the secondary circuit problem [8,9]. Others include too few fault types with insufficiently detailed analysis [10,11].
In view of the above analysis, this paper puts forward a fault tracking method for relay protection devices. By utilizing the received abnormal and warning signals, a fault tracking model for relay protection devices can be constructed on the basis of the combination of reasoning chain and Bayesian theory. The reverse reasoning ability of the Bayesian network is used to find causes of failure. This model contains the vast majority of fault types of relay protection devices. Based on related alarm and monitoring information, this method determines which monitoring information should be included. At the same time, the analysis of various fault types and their causes in this paper provides an important reference for the maintenance, design and improvement of relay protection devices.

2. Microcomputer Protection

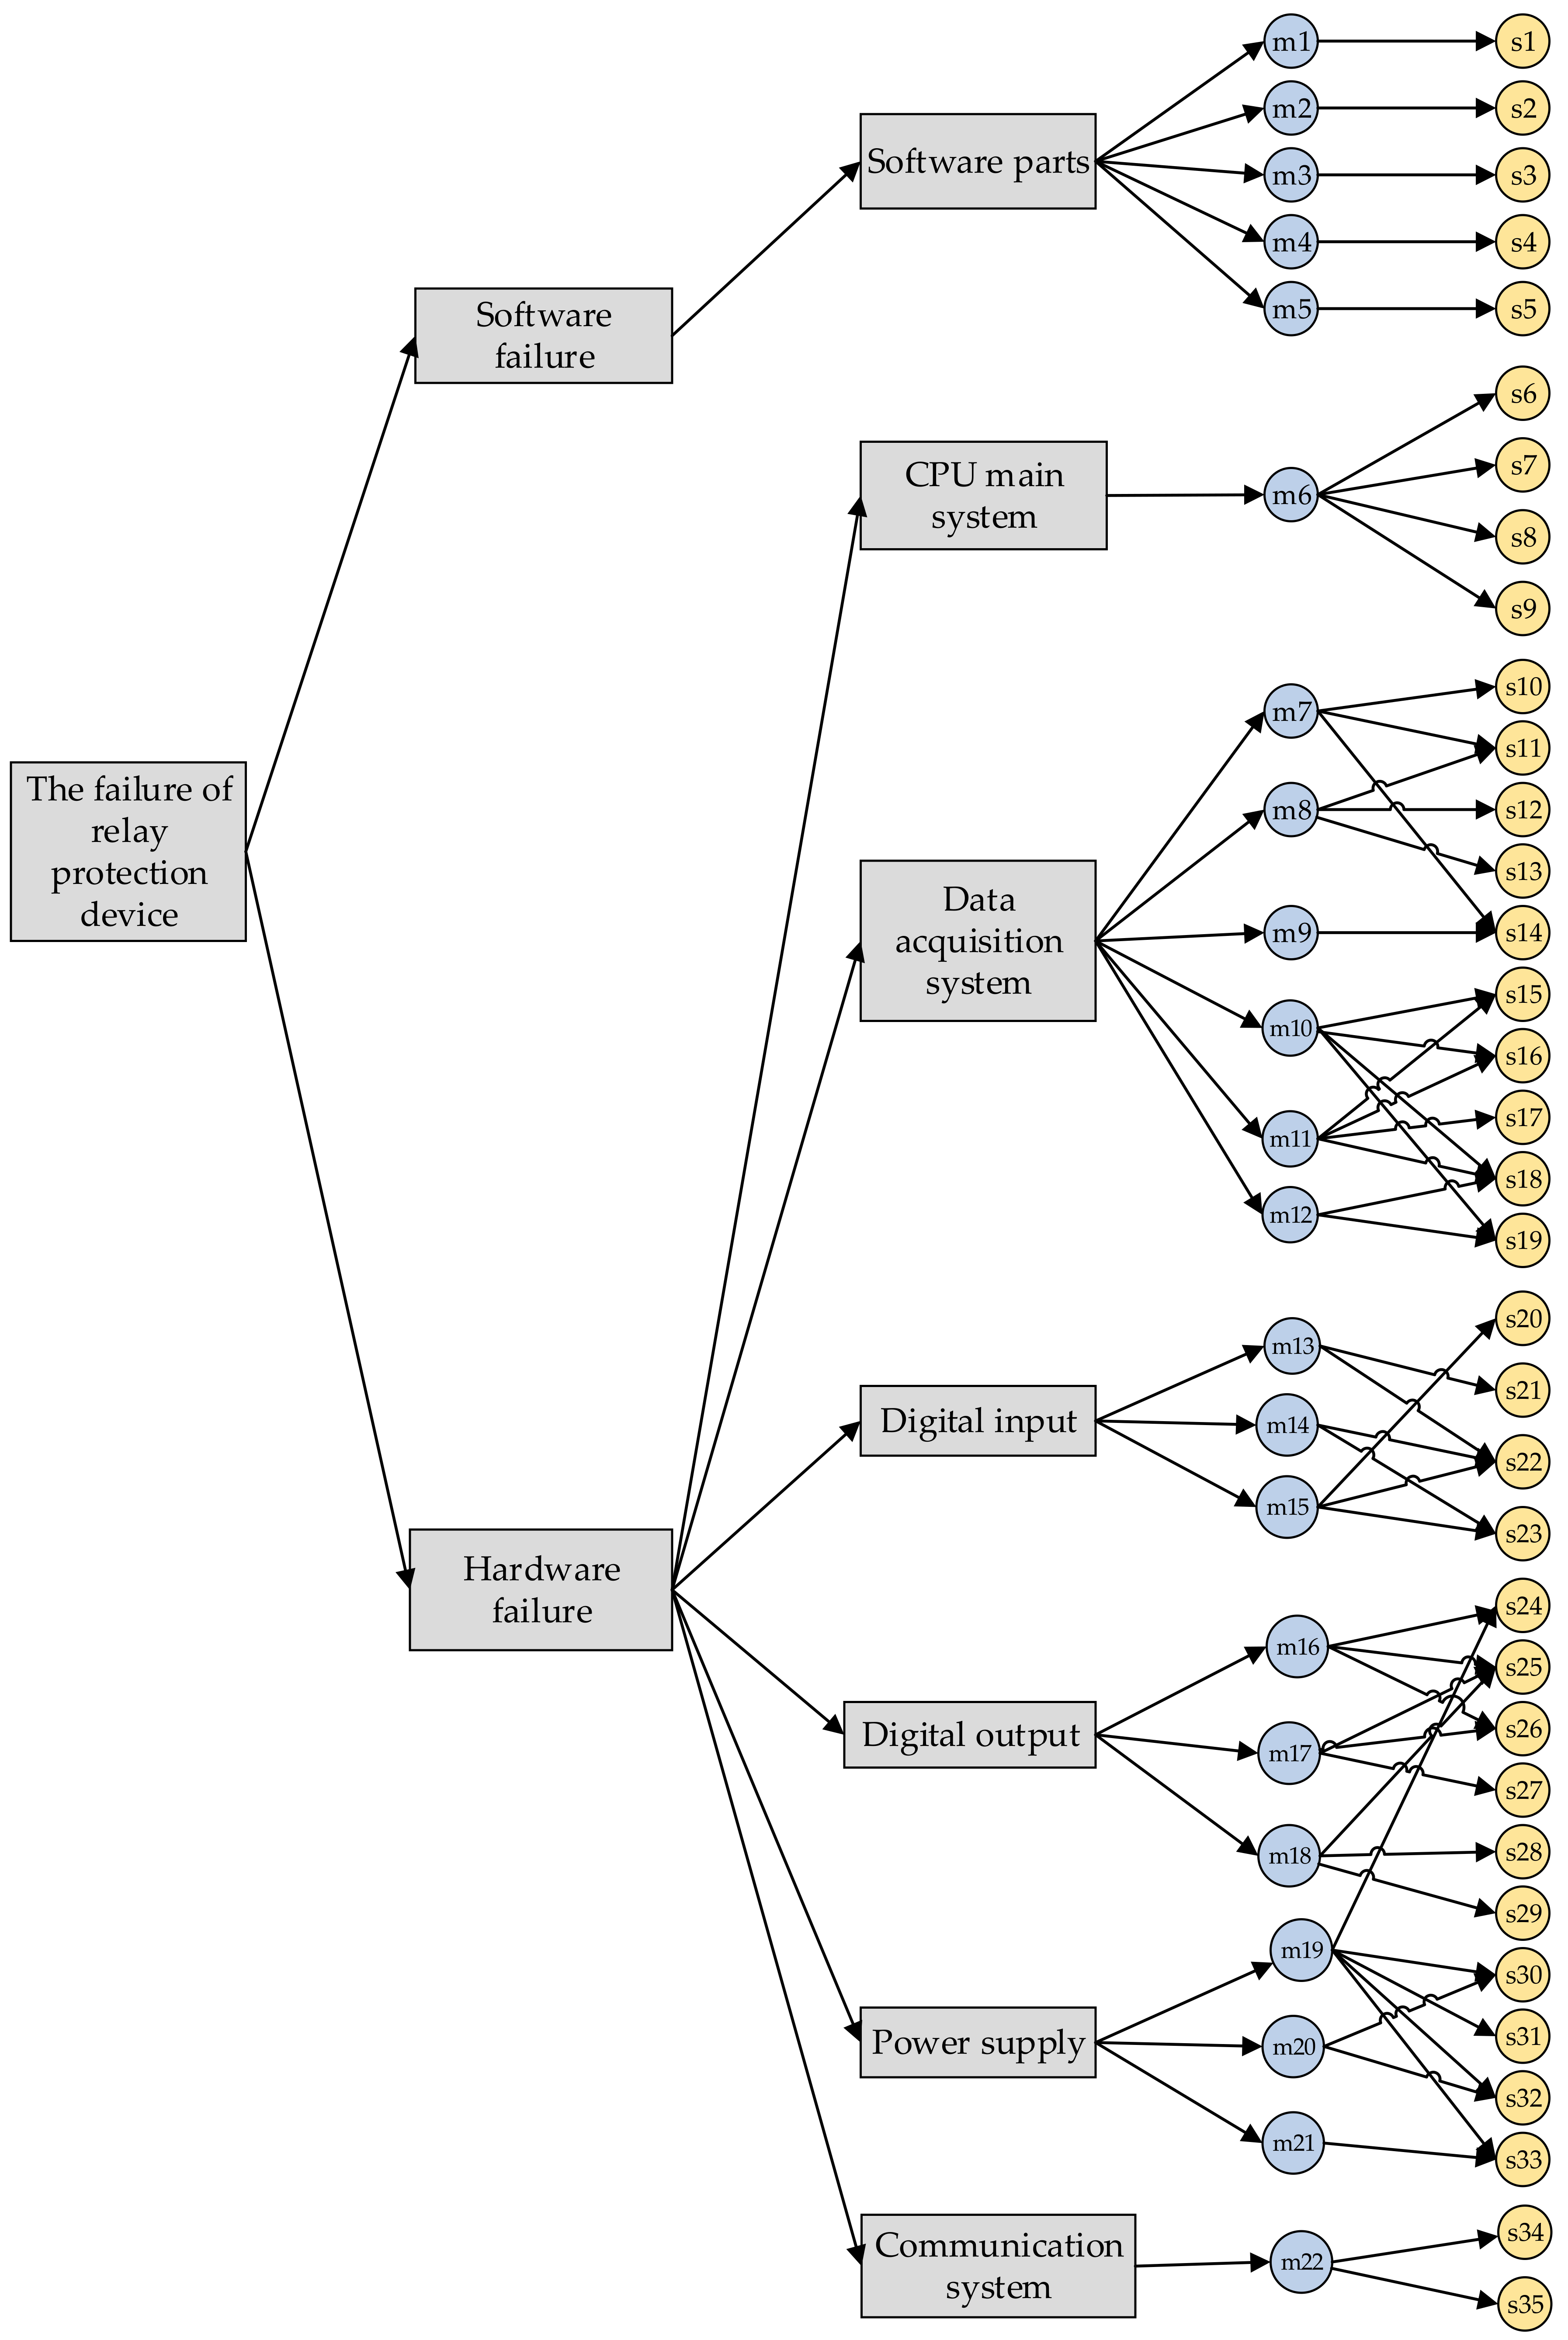
2.1. Composition of Microcomputer Relay Protection

The microcomputer relay protection of a power system refers to a relay protection device based on digital signal processing technology with a microcomputer and microcontroller as the core components. With the progress of computer science, microcomputer relay protection has become a mainstream aspect of relay protection, which is mainly achieved through hardware and software [3,12].
  • Hardware: The hardware of a microcomputer protection device mainly includes the analog input (AI), digital input (DI), central processing unit main system (CPU), digital output (DO), man–machine conversation interface (MMI), communication interface (CI) and power supplement unit (PSU). Among them, analog input is responsible for voltage and current analog acquisition and signal discretization. The digital input is responsible for collecting the contact information from the switchblade, the protection plate and other devices. The CPU main system includes the microprocessor CPU, data memory, program memory, timer, parallel interface and serial interface, which is responsible for the measurement, logic and control functions of relay protection. The digital output is composed of a photoelectric coupler and relay, which is responsible for protection against tripping and warning signal output. The power supply circuit provides DC regulated power for the whole device to ensure reliable power supply.
  • Software: The software of a microcomputer protection device mainly includes the data acquisition, digital signal processing, protection discrimination logic, human–computer interaction program, self-checking program, communication interface program and operating system.

2.2. Fault Analysis of Microcomputer Protection Device

The failure of a relay protection device is mainly divided into two categories: refuse-operation and maloperation. Refuse-operation refers to the failure of the protection function module in the relay device to detect the fault, or the failure of the transmission or execution of the tripping signal issued by the relay in the tripping circuit and the breaker control circuit and operation mechanism. When the protection device sends out the tripping signal, if there is no short circuit in the protected range, or if there is a short circuit in the adjacent lower-level equipment and its protection device does not refuse to operate, then this is referred to as protection maloperation [4].
We mainly studied the causes of refuse-operation or maloperation due to the problems of the protection device itself and its secondary circuit. Firstly, the reasons were divided into two categories caused by software settings and hardware problems. The main reasons for refuse-operation and maloperation due to software problems include setting errors or setting value errors. The fault causes in the hardware can be classified by modules, such as the failure of components in the CPU main system and the loss or distortion of analog acquisition data in the data acquisition system. Among them, most of failures in the man–machine conversation interface are caused by human errors and so are not taken into account. Through the analysis of the accident causes of the protection device and consulting the relevant literature [6,10,13,14], common causes that may directly lead to refuse-operation or maloperation of the protection device were obtained. All the failure causes were put into the causes set of failure and named M, M = {m1, m2…m22}, as shown in Table 1. The prior probability p is the probability of the occurrence of the causes, that is, the ratio of the occurrence times of the corresponding failure cause to the total fault times of the protection device, obtained based on References [13,15].
Before and after the failure occurs, the substation receives a large number of abnormal and warning signals. These data are recorded by the fault oscillograph. Through data-mining technology, the useful information related to protection can be sorted and screened out, and then the symptoms of failure related to causes are obtained. Let all the selected symptoms of failure constitute the symptoms set of failure, named S, S = {s1, s2...... s35}, as shown in Table 2. When there are enough failure samples, the corresponding relationship between causes and symptoms of failure can be found. We can describe it using probability statistics in order to qualitatively and quantitatively conduct fault diagnosis or fault tracking. Table 1 and Table 2 cover the common causes and symptoms of failure in the current microcomputer protection devices. If other causes or symptoms of failure not in the table appear in practical applications, they can also be added into the table according to the category. With the completion of Table 2, the accuracy of fault tracking is improved. Assuming that the required information was obtained through data-mining technology, this study did not involve specific methods of data mining.

3. Reasoning Chain and Bayesian Network

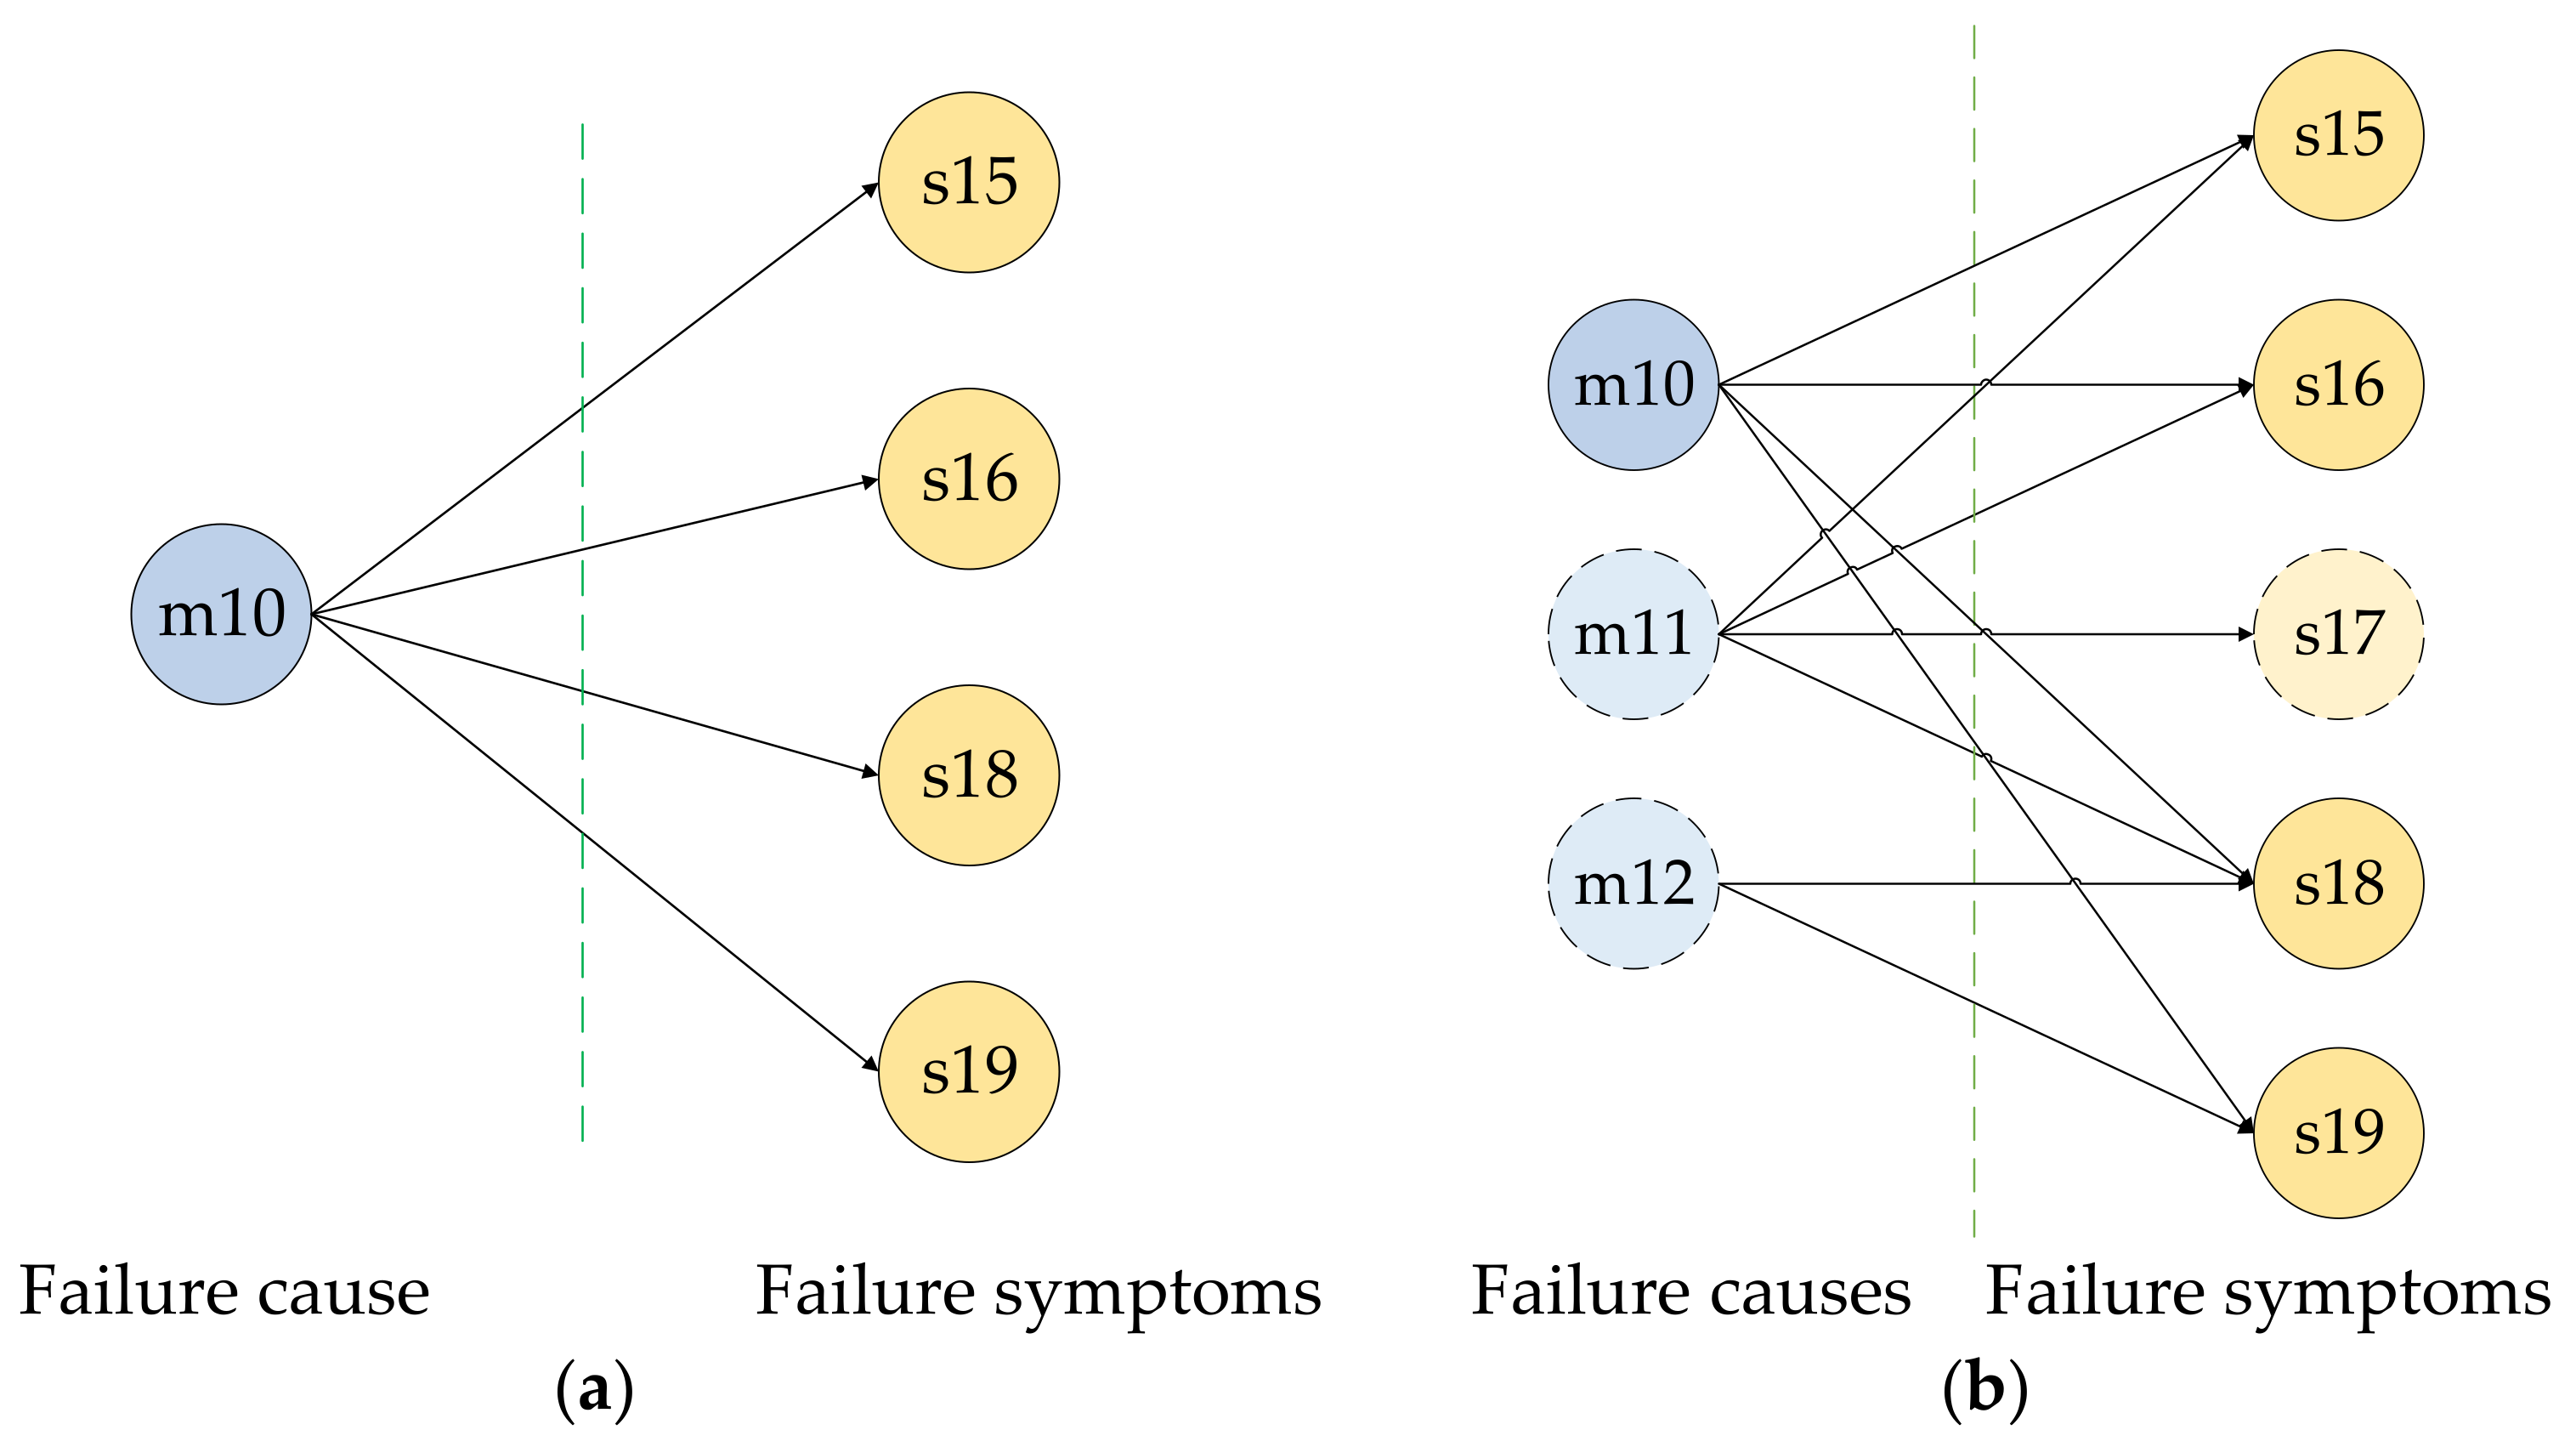
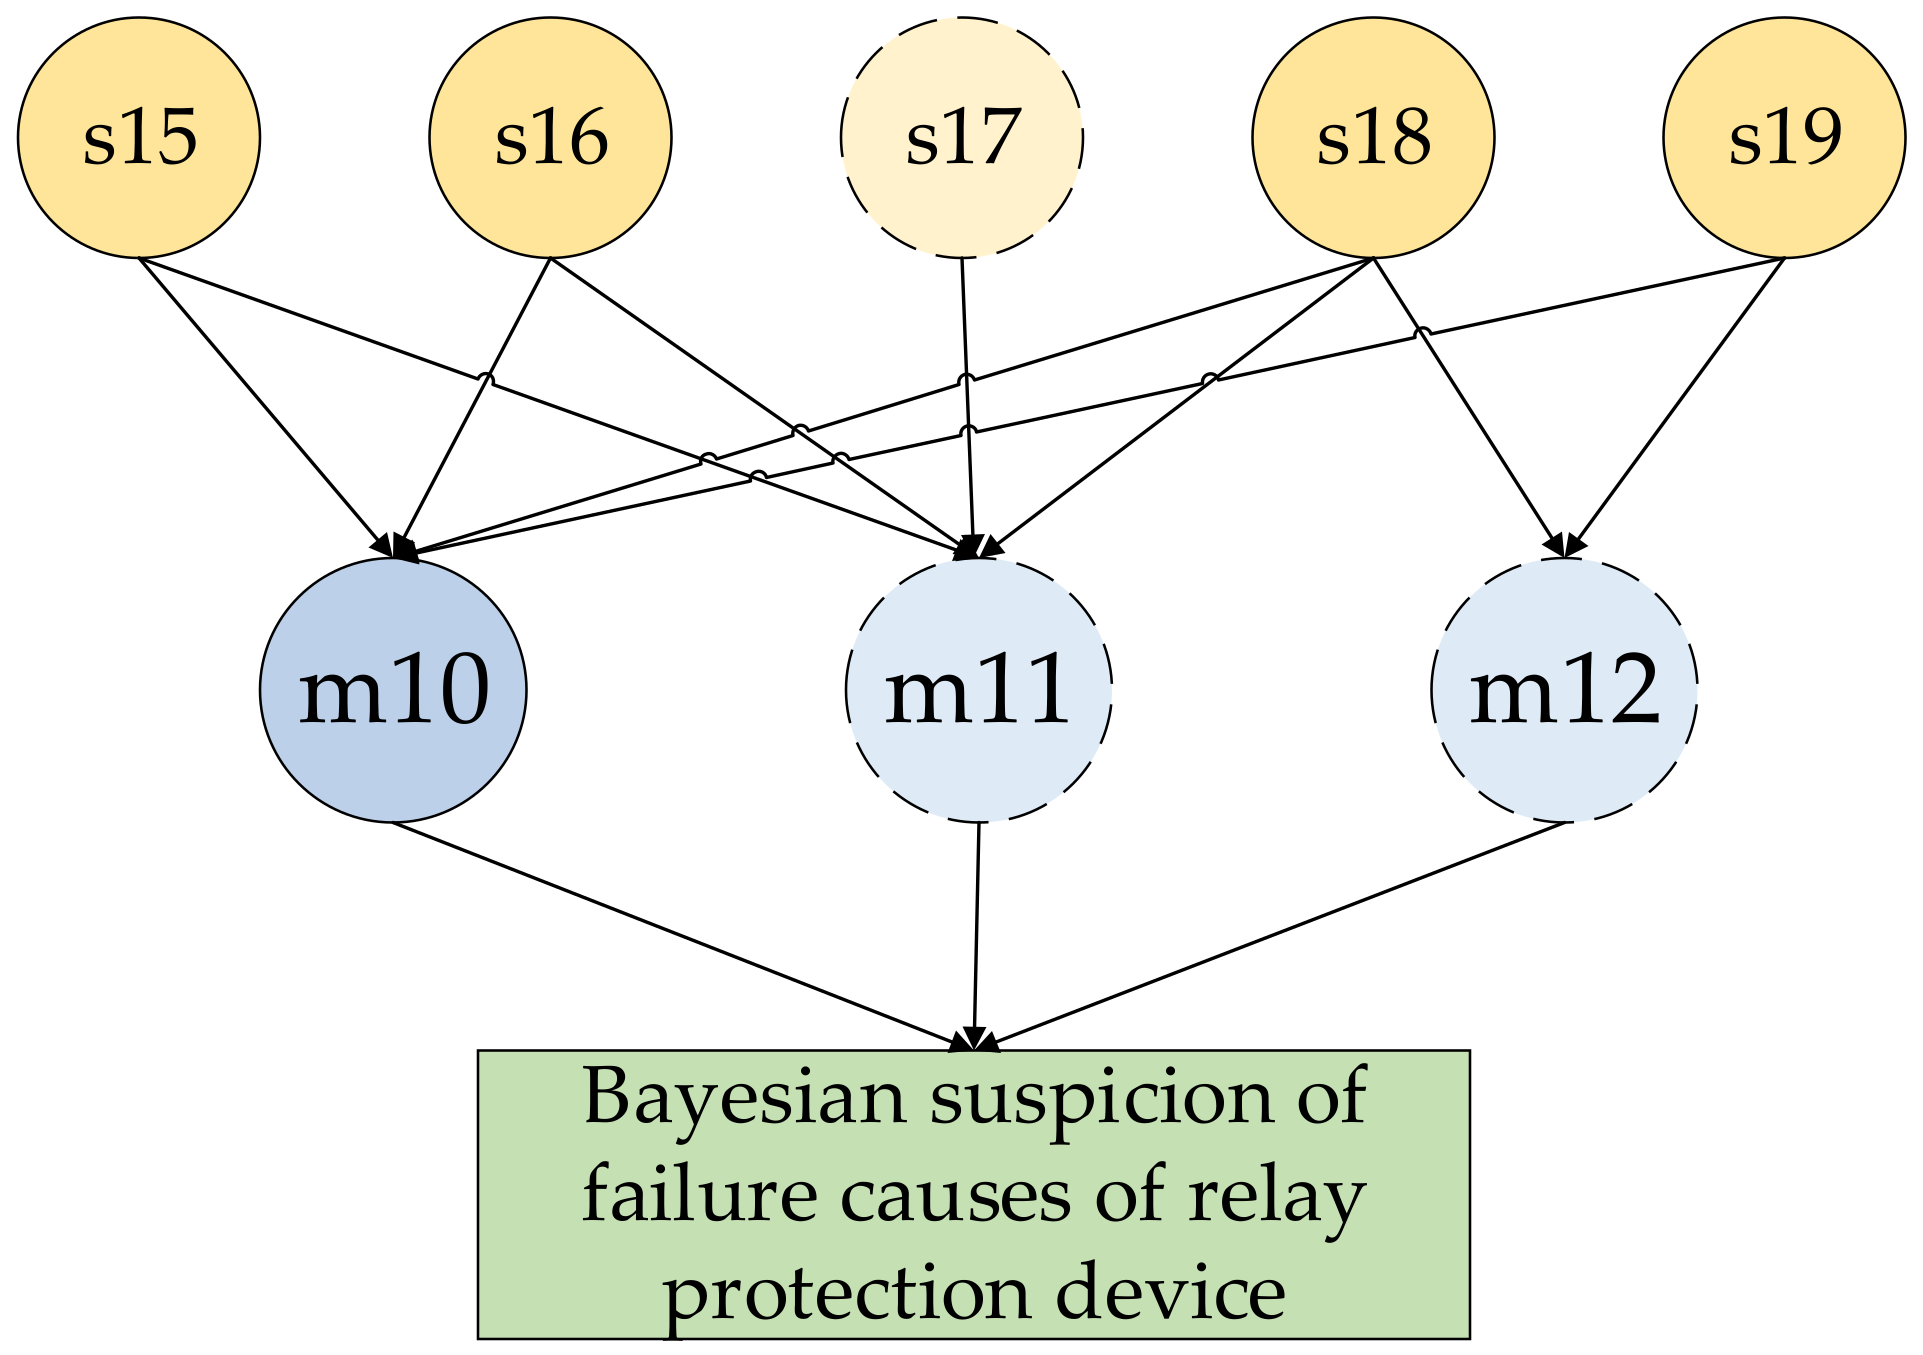
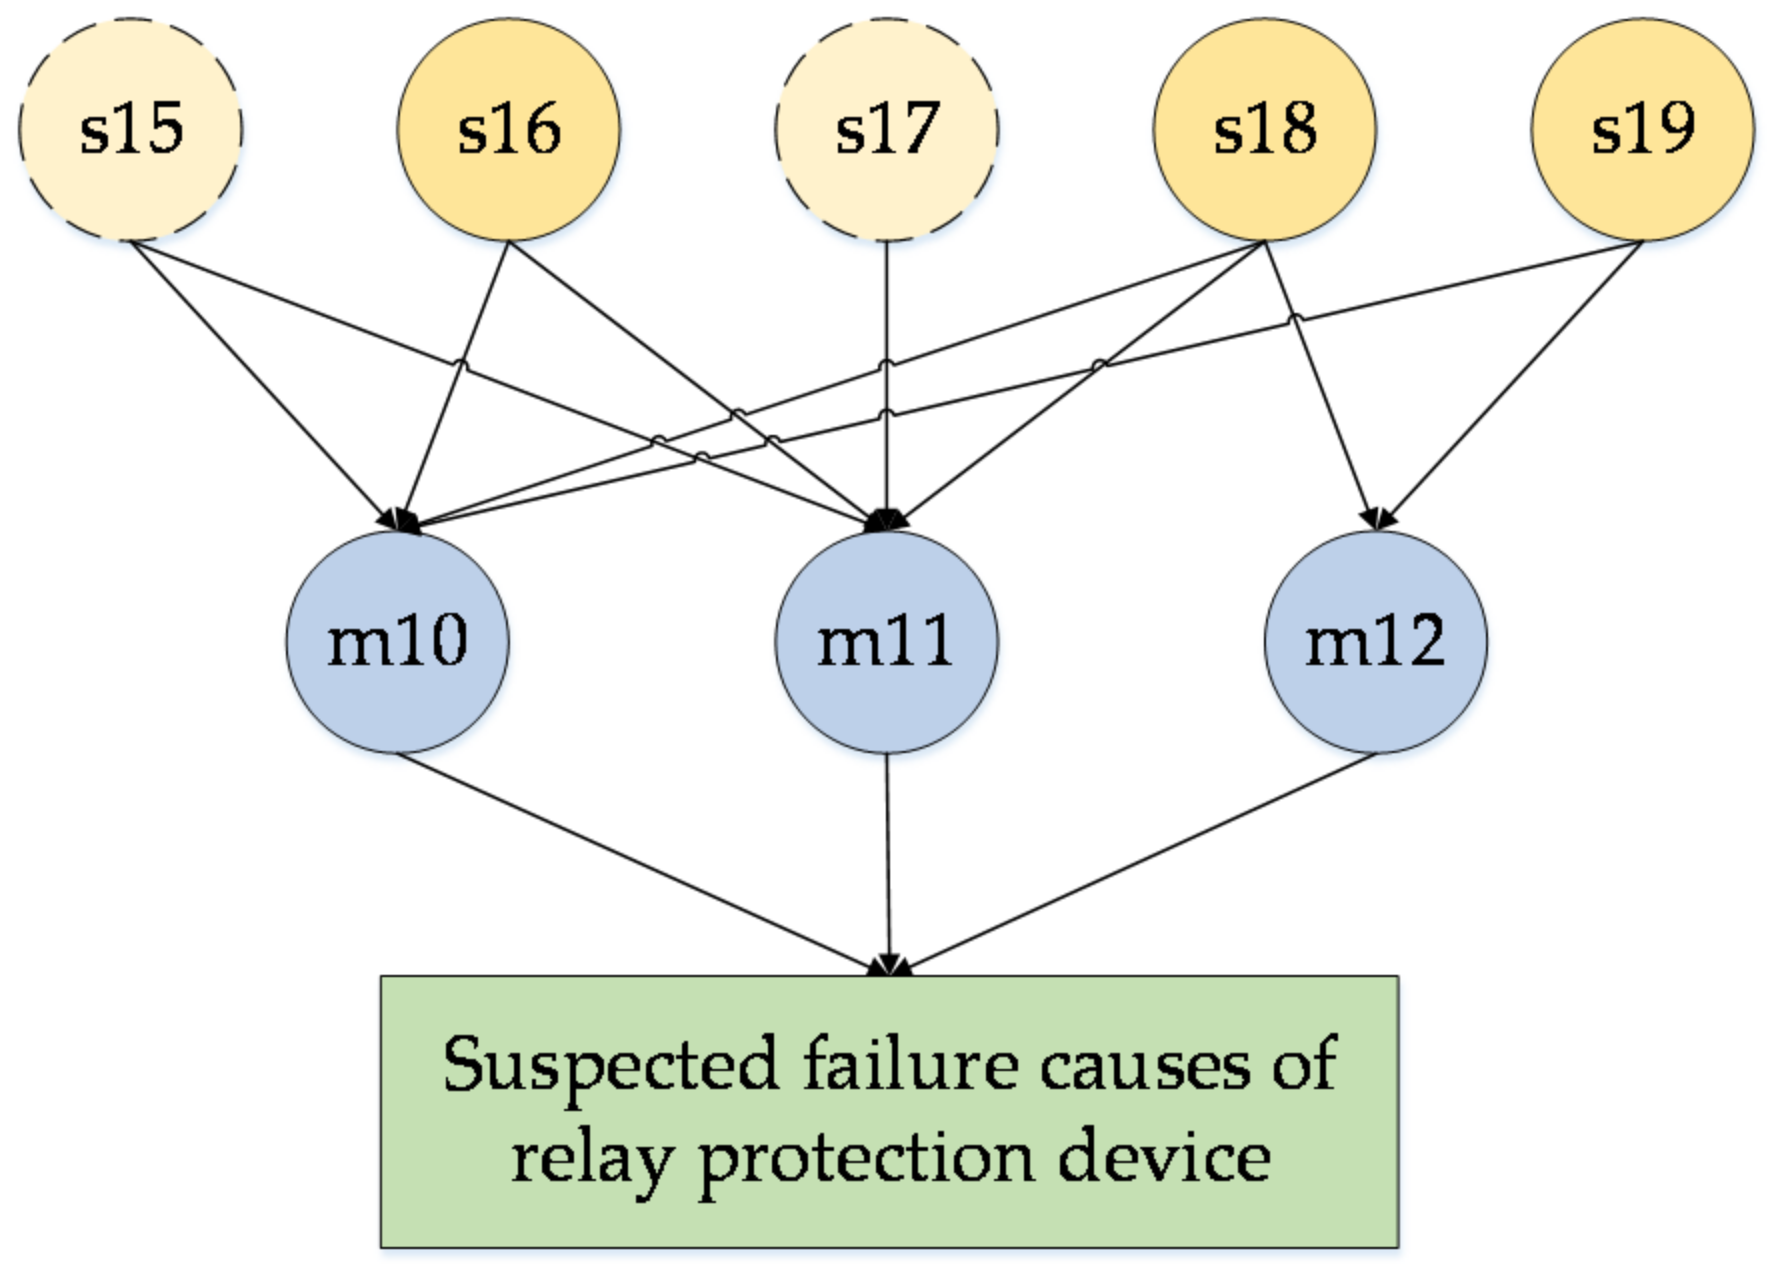
3.1. Reasoning Chain

A chain is a dynamic data structure. It consists of nodes that contain event information and points to relationships between nodes. The chain organizes and manages these nodes to form a new data structure that can achieve specific functions while avoiding a ring network. The reasoning chain shows the causality between events clearly and visually. Reason nodes at the front of the reasoning chain are used to characterize causes of the event [16,17]. The reasoning chain also meets the principle of reverse reasoning, the reason node information can be inferred according to the subsequent nodes. The simplest form of reasoning chain is denoted by AB, meaning ‘if A, then B’.
For the failure of a relay protection device, these nodes can be divided into causes of failure nodes and symptoms of failure nodes according to the causal relationship. Then, the reasoning chain from the causes set of failure to symptoms set of failure can be constructed. For example, if the current transformer is saturated, then the distorted current waveform is obtained, that is m9s14.

3.2. Bayesian Network

A Bayesian network is a probabilistic network that combines the Bayesian probability method with graph theory. At the qualitative level, it uses a directed acyclic graph to show the relationship between the nodes more intuitively. At the quantitative level, the Bayesian network better expresses the correlation between symptom nodes and cause nodes through conditional probability distribution. Prior probability and posterior probability are two key factors of Bayes’ theorem. The prior probability can be obtained from existing data statistics and calculations. The posterior probability is calculated by prior information and sample data.
In the fault tracking of a relay protection device, ‘m’ represents the suspected failure causes, namely the hypothesis in Bayesian theory; ‘s’ represents failure symptoms, that is, the argument supporting the assumption. The Bayesian formula [18] is shown in (1):
p m i | s j   =   p s j | m i     p m i k = 1 l p s j | m k     p m k
In Formula (1):
In this paper, l = 22, namely, the total number of failure causes in Table 1;
p m i : The prior probability of suspected failure causes m i is true;
p s j | m i : The probability of inducing failure symptom s j when m i occurs, which is conditional probability;
p m i | s j : The probability that the failure causes m i is true when the failure symptom s j is true, which is posterior probability.
Through the analysis of the Bayesian formula, it can be seen that, when predicting an uncertainty phenomenon, it is necessary to generate a prior probability by combining the existing information and statistical data systematically. The adjustment of the probability prediction of unknown events in the process of collecting new information and accumulating experience must also be realized, so as to improve the accuracy of the prediction results. When dealing with failure of relay protection devices, the internal faults of the protection device are causes, and the failure symptoms are results. Fault tracking in this paper refers to the process of finding causes by reverse reasoning when the result of the event is known. To be specific, the purpose is to track the causes of failure according to the known symptom information. When the symptoms of failure occur, the probability of each suspected failure cause is calculated, and then the most likely cause of relay protection device rejection or maloperation can be inferred. Since there are often multiple symptoms in a failure, Formula (2) can be used to calculate the Bayesian suspicion B m i of possible causes corresponding to multiple symptoms [19]. Usually, the cause with the largest Bayesian suspicion is the most likely cause of failure. ‘Sx’ represents the possible symptoms set corresponding to the cause of failure.
B m i   =   s S x p m i | s j k = 1 l s S x p m k | s j
The prior probability of failure causes of relay protection devices is given in Table 1. By consulting a large number of data and actual failure cases, the incidence relation of causes and symptoms of failure can be obtained through analysis and calculation, as shown in Table in the Appendix A. The values in the table represent the conditional probability p s j | m i of the failure symptom s j when the cause m i occurs, that is, the ratio between the frequency of the failure symptom s j and the total number of the failure cause m i .

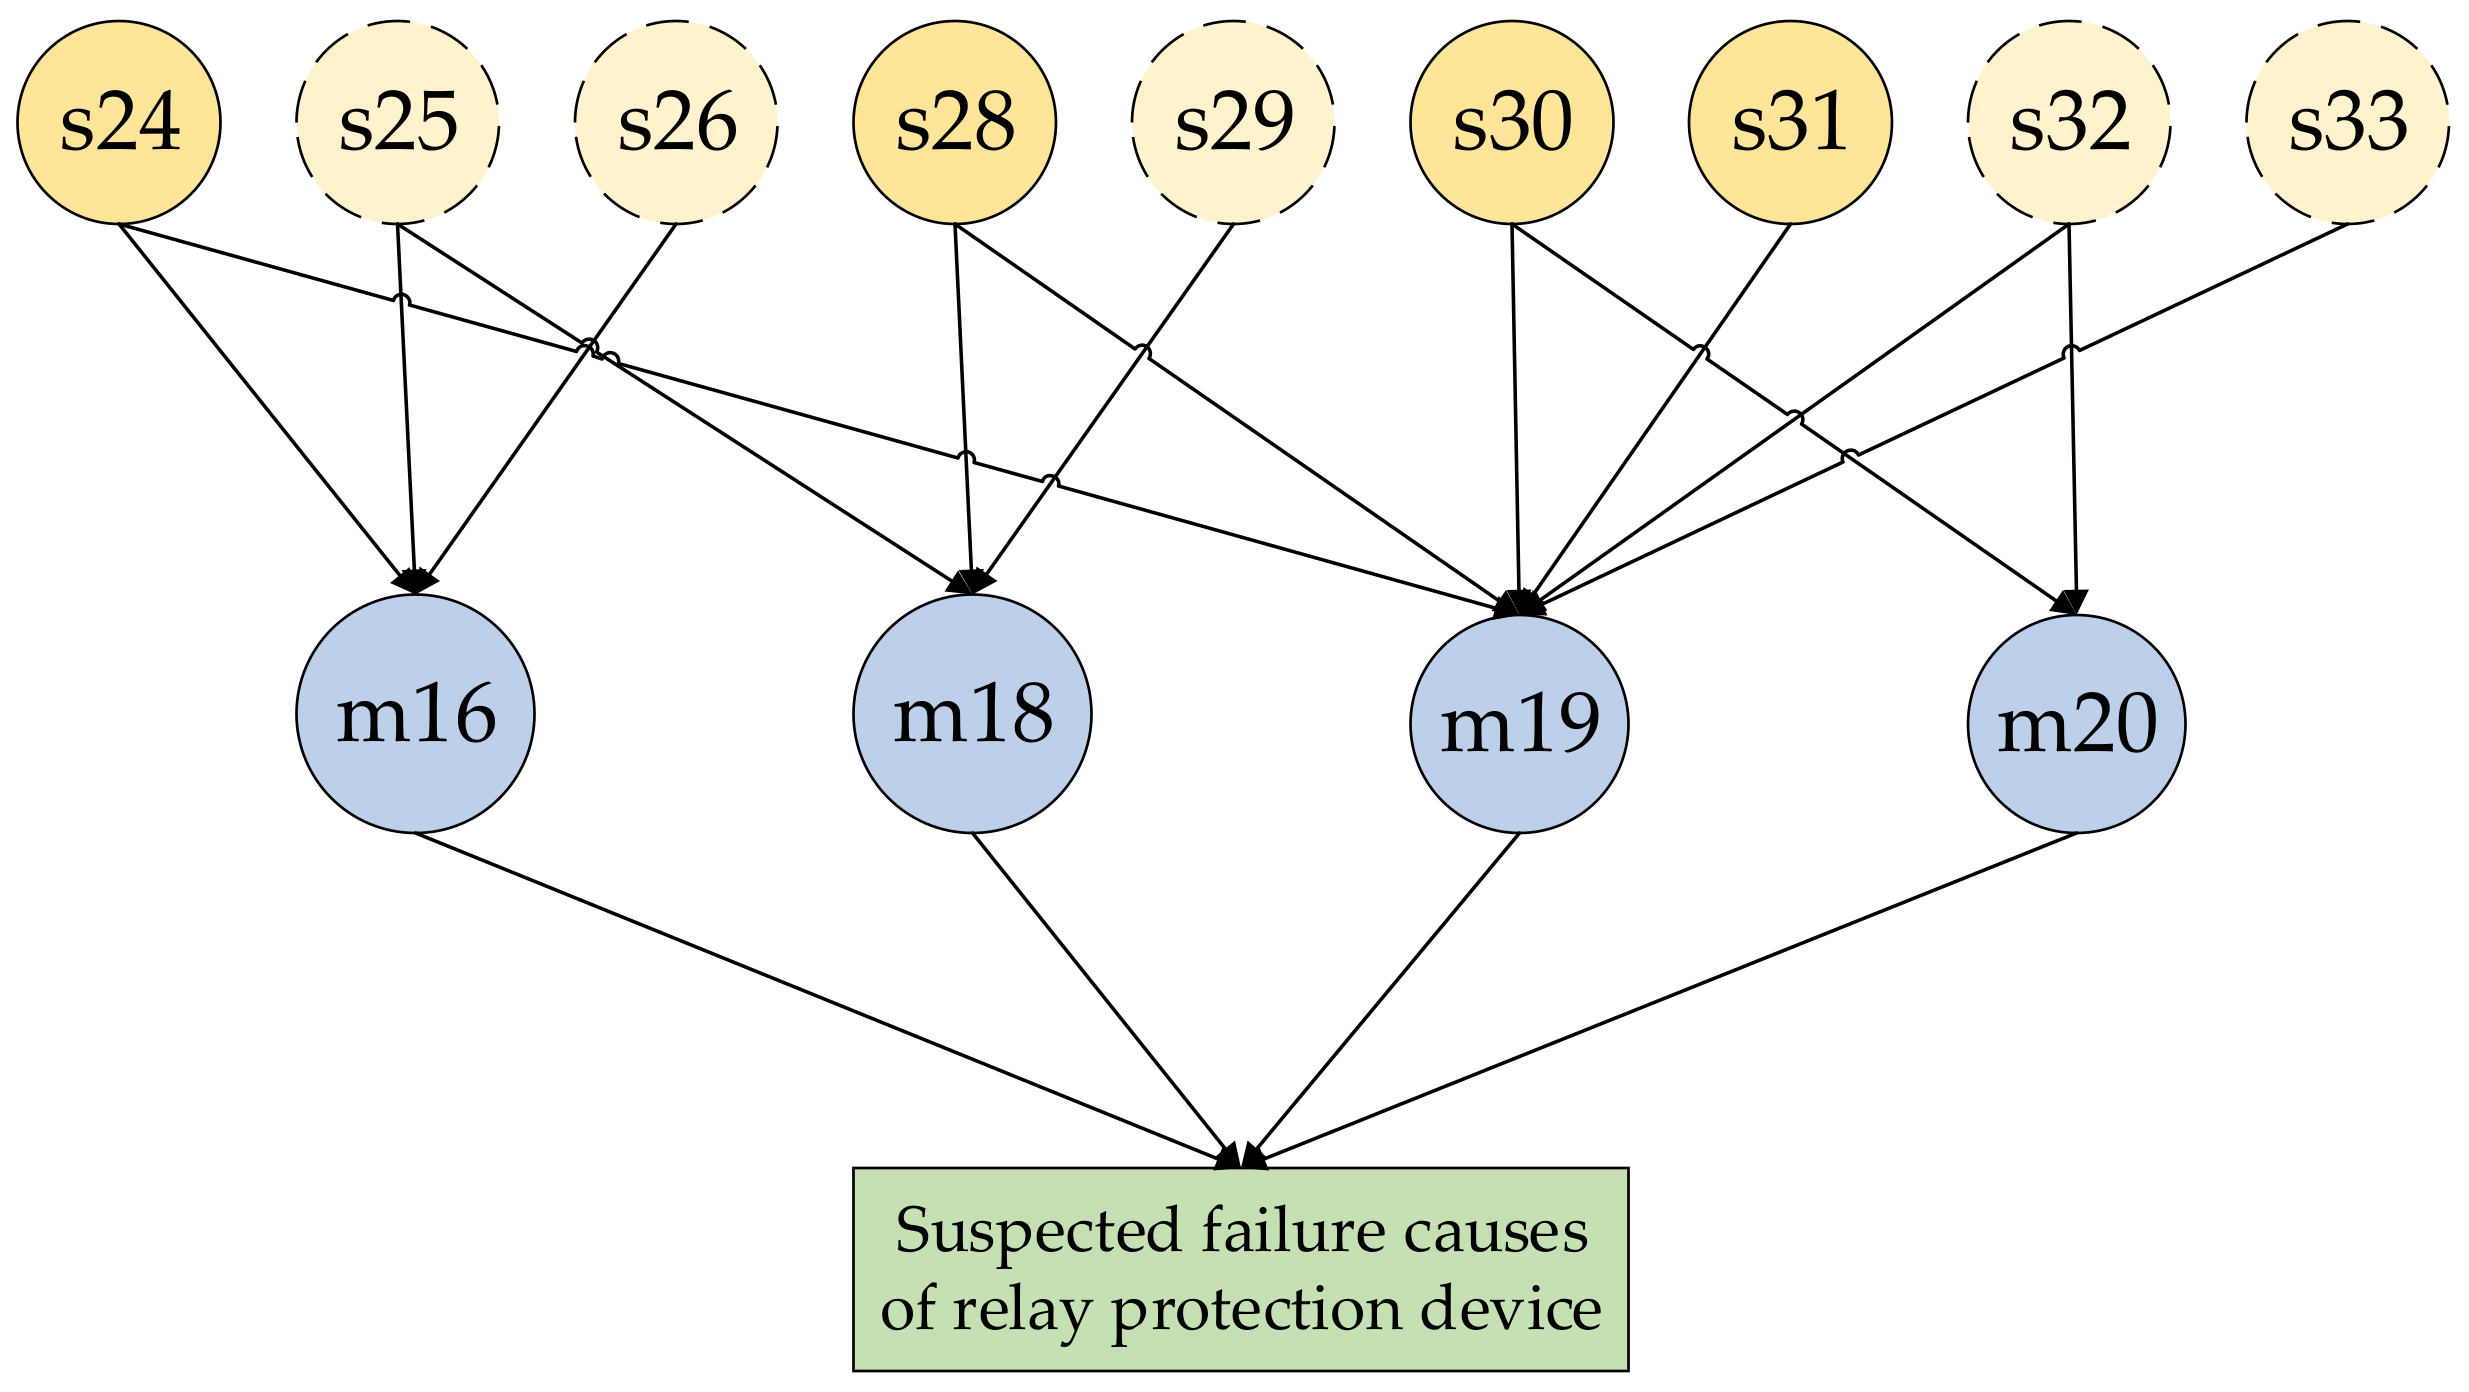
4. Construction of Fault Tracking Model

4.1. Construction of Reasoning Chain

According to the connection relationship shown in Table in Appendix A, the reasoning chain model can be established as shown in Figure in the Appendix B. In practice, after incorrect action of the protection device, only part of the failure symptoms in Table 2 can be obtained by data-mining technology. For example, the failure of a relay protection device caused by TV secondary circuit multipoint grounding can be seen from four possible failure symptoms: (1) voltage sampling being zero, (2) the abnormal/invalid alarm of voltage sampling data, (3) three-phase voltage drift and (4) voltage waveform distortion. Therefore, the failure cause is m 10 , and the failure symptoms are s 15 , s 16 , s 18 and s 19 . A smaller reasoning chain can be obtained, as shown in Figure 1a.
Since different causes may lead to the same symptom of failure, all the obtained symptom information is classified as a symptoms subset of failure in this paper, named Sx, and all the causes (suspected causes of failure) related to the elements in this subset are classified as a causes subset of failure, named Mx. Taking the TV secondary circuit multipoint grounding failure m 10 as an example, when the symptoms are s 15 , s 16 , s 18 and s 19 , the corresponding causes subset of failure Mx = { m 10 , m 11 , m 12 }. According to Table in Appendix A, there are still failure symptoms s 17 connected to the causes in Mx. In order to prevent the error of fault tracking results caused by data loss, the symptoms subset of failure Sx = { s 15 , s 16 , s 17 , s 18 , s 19 } is set. The reasoning chain is shown in Figure 1b. Therefore, in the actual fault tracking calculation, we can establish a simplified reasoning chain model based on the obtained failure symptoms, which helps to reduce the complexity of the network and simplify the calculation.

4.2. Construction of Bayesian Networks

From the complete reasoning chain model diagram, it can be seen that a cause may have multiple failure symptoms, and the same symptom also corresponds to more than one failure cause. Therefore, the next step is to use the Bayesian network to conduct reverse reasoning according to the known failure symptoms to determine the most likely failure cause. According to the reasoning chain in Figure 1b, a Bayesian network model can be constructed, as shown in Figure 2.
The Bayesian network model is conducive to obtaining fault tracking results conveniently and quickly. In addition, the model takes into account the partial loss of data during transmission. For example, if the s 19 data are lost during the transmission, only s 15 , s 16 and s 18 are obtained at the station, and the simplified reasoning chain model and the Bayesian network model can still be obtained according to the above three failure symptoms, which contain both the lost data s 19 and the unrealized failure symptom s 17 . In the calculation of Bayesian suspicion, it is unknown whether the failure symptoms s 17 and s 19 do not occur, or the data of these two symptoms are lost. Therefore, it is necessary to consider the possibility of data loss and also reduce the interference of unrealized failure symptoms on the results. In this paper, the corresponding posterior probabilities of the failure symptoms ( s 17 and s 19 ) not obtained in the model are multiplied by 0.1 and then substituted into Formula (2) for calculation. They are therefore taken into account in the calculation, but their influence on the results is reduced.
In addition, for a complex situation where multiple parts have faults at the same time, multiple simple reasoning chains and Bayesian network diagrams can be constructed after the obtained symptoms of failure are classified. Different diagrams do not affect each other, and they are calculated individually to obtain multiple possible causes at the same time. If a certain part of the equipment has multiple failures, maintenance work can also be carried out in accordance with the size of Bayesian suspicion in order to make the maintenance content clearer.

4.3. Fault Tracking Process

The fault tracking process of a relay protection device is as follows:
After the relevant warning information of relay protection device failure is obtained by using data-mining technology, the symptoms subset of failure is established, and the corresponding causes subset of failure is also obtained according to the causal relationship in Figure in Appendix B.
If all the events in the two subsets are connected by causality in a graph, that is, only a connected graph is formed, then only a reasoning chain model is constructed. On the contrary, if the causes and symptoms of failure belong to various modules, then various independent reasoning chain models are constructed, and the causes subset and symptoms subset of failure are also be split into several corresponding groups.
The next step is to build a corresponding Bayesian network model according to the reasoning chain. The probability of each suspected failure cause is calculated by Bayesian reverse reasoning and output in order of size. The probability of all possible causes is listed in the results, and the cause with the maximum probability is the most likely cause. Multiple models can obtain multiple causes. The on-site maintenance of relay protection devices can be used in combination with this approach. In case of time emergency, the field personnel can firstly check the most likely cause of failure, which can decrease maintenance time significantly and improve the efficiency of the on-site staff.

5. Case Studies

5.1. Fault Case 1 (Simple Fault)

When an AC double phase-to-ground metal fault occurs at the outlet of a 110 kV incoming line (No.151) in a 110 kV substation, the protection device returns after starting and refuses to operate [9]. After the accident, the substation shows that it has received abnormal voltage sampling data warning signals. When viewing the wave recording file, it can be seen that the AC phase voltage is not zero, the amplitude and phase of the three-phase voltage are offset and the input voltage of the protection device is distorted. During the insulation inspection of the voltage circuit, it can be found that there are still earthing points after switching off the earthing point in the control room. After inspection, the secondary circuit of TV secondary winding in the 110 kV TV terminal box is grounded by a zinc oxide arrester, which has been broken down and has caused two-point grounding of TV secondary circuit. Therefore, when the grounding short-circuit fault occurs in the primary system, the electric potential difference between the two points is formed, which causes the measurement voltage value of the detection circuit of the protection device to be incorrect and waveform distortion, leading to the incorrect action of the directional element and causing the protection to refuse to operate.
Through postaccident inspection, we can obtain the symptoms of failure: s 16 (abnormal data/invalid warning of voltage sampling), s 18 (three-phase voltage ripple) and s 19 (voltage waveform distortion). The associated causes subset of failure is Mx = { m 10 , m 11 , m 12 }; that is, one of the most likely causes of protection device failure is m 10 (multipoint grounding in the secondary circuit of TV), m 11 (poor contact or the abruption of the secondary circuit of TV) or m 12 (a voltage transformer wiring error). It can be seen from Figure in Appendix B that the symptoms subset of failure connected with the causes subset Mx is Sx = { s 15 , s 16 , s 17 , s 18 , s 19 }. Symptoms s 15 and s 17 do not appear in the postaccident inspection, possibly because data are lost or these two symptoms do not occur. Therefore, the reasoning chain model can be established, as shown in Figure 1b. Due to the lack of the two failure symptoms s 15 and s 17 , it is impossible to determine whether the data are lost, meaning in the Bayesian network model, s 15 and s 17 in Figure 3 are represented by virtual lines.
Through Table 1 and Table in Appendix A, the prior probability of elements in the causes subset Mx and the conditional probability between symptoms and possible causes of failure are obtained, as shown in Table 3.
The posterior probabilities can be obtained by substituting the data in Table 3 to Formula (1), as shown in Table 4.
Substituting the posterior probability into Formula (2), since the symptoms s 15 and s 17 are not received, the posterior probabilities p m 10 | s 15 , p m 11 | s 15 and p m 11 | s 17 of s 15 and s 17 are multiplied by 0.1 in substitution. The purpose of taking s 15 and s 17 into account in the calculation is to consider the possibility of data loss and reduce error. Multiplying 0.1 can reduce its proportion in the results and prevent the unrealized failure symptoms from having a great impact on the results. Through calculation, the results of Bayesian suspicion of each suspected failure cause are as follows: B m 10 = 0.709 , B m 11 = 0.205 and B m 12 = 0.086 . Therefore, it can be concluded that the most likely cause of the failure is m 10 (multipoint grounding in the secondary circuit of TV), which is consistent with the actual situation. A small amount of data loss does not affect the accuracy of the results, so this method can achieve a certain degree of resistance to data loss.

5.2. Fault Case 2 (Complex Faults)

If the alarm and abnormal information of other modules are found simultaneously in the former case, it indicates that the relay protection device is likely to be responsible for more than one part of the problem. In addition to the failure symptoms listed in the previous example, there are still s 24 (switch indicator light is not on), s 28 (protection-switching relay power failure), s 30 (DC power supply fault warning) and s 31 (DC protection disappears). Therefore, the symptoms subset Sx of failure is Sx = { s 24 , s 25 , s 26 , s 28 , s 29 , s 30 , s 31 , s 32 , s 33 }, and the causes subset Mx of failure is Mx = { m 16 , m 18 , m 19 , m 20 }. Another Bayesian network model was created as shown in Figure 4.
The prior and conditional probabilities in Table 1 and Table 3 were substituted to Formulas (1) and (2) to obtain Bayesian suspicions for each possible cause of failure as follows: B m 19 = 0.612 , B m 18 = 0.199 , B m 16 = 0.114 and B m 20 = 0.075 . It can be inferred that the most possible causes of failure are m 19 (the power supply cannot work properly) and m 10 (multipoint grounding in the secondary circuit of TV) calculated from the previous case. In other words, for a complex situation where multiple parts of the device fail at the same time, multiple causes can be obtained by establishing multiple reasoning chains and Bayesian models for calculation, which proves that this method is still effective for complex failure cases.

6. Conclusions

Taking the relay protection devices as an example, this paper puts forward a fault tracking method, which proposes a new approach to the identification of the causes of equipment failure. Firstly, based on obtaining failure symptom information, the possible causes subset of failure can be constructed. According to the relationship between the two subsets from the statistics, the corresponding reasoning chain is constructed. Then, the Bayesian network is used for reverse reasoning, and the Bayesian suspicion of possible failure causes can be calculated so as to obtain the reason for the failure of the relay protection device. The functions of the reasoning chain and Bayesian network are complementary. On the one hand, the reasoning chain is used to realize the reduction of knowledge and the simplification of failure characteristics to establish the minimum event sets, which can simplify the network structure and contribute to the establishment of a more optimized and intuitive Bayesian network model. On the other hand, using the Bayesian network to deal with causal reasoning can give consideration to the error or lack of alarm signals in the transmission process and has higher accuracy for dealing with uncertainty problems. This method combines a Bayesian network with a reasoning chain to achieve efficient and rapid fault tracking and diagnosis. It is simple, effective and easy to implement.
This method is based on empirical data and probability theory. The key to this method is the construction of Table 1 and Table 2, which can be obtained through practice accumulation and related experiments. This is also a limitation of the method. The integrity of the two tables has a significant impact on the accuracy of this method. When failure occurs, accurate and complete records of symptoms and causes are needed. With the continuous progress of monitoring and detection methods, the failure information contained in Table 1 and Table 2 is more abundant and accurate, which provides a more solid foundation for the realization of this method and the accuracy of device fault tracking and diagnosis. On the contrary, if there are only a few statistics to refer to, or if there are omissions in recording the data, it seriously affects the accuracy of the results. With sufficient data, the effectiveness and accuracy are proven by example analysis. In view of the fact that there are almost no existing studies on fault tracking at present, this method creatively deduces the fault cause from fault symptoms. Therefore, this method has strong application value and can be used to determine failure causes quickly, conveniently and accurately. In addition to relay protection devices, this method can also be applied to fault tracking of circuit breakers, communication interfaces and other equipment.

Author Contributions

Conceptualization, Q.C. and X.Z. (Xiaotong Zhou); data curation, X.Z. (Xiaotong Zhou) and M.S.; formal analysis, Q.C., M.S. and X.Z. (Xiaotong Zhang); funding acquisition, Q.C.; methodology, Q.C., X.Z. (Xiaotong Zhou) and M.S.; project administration, Q.C.; software, X.Z. (Xiaotong Zhang); validation, Q.C. and X.Z. (Xiaotong Zhou); visualization, Q.C.; writing—original draft, X.Z. (Xiaotong Zhou) and M.S.; writing—review and editing, Q.C., X.Z. (Xiaotong Zhou) and X.Z. (Xiaotong Zhang). All authors have read and agreed to the published version of the manuscript.

Funding

This work was supported by the National Natural Science Foundation of China (No. 5187070349).

Data Availability Statement

The data presented in this study are available in the article.

Conflicts of Interest

The authors declare no conflict of interest. The funders had no role in the design of the study; in the collection, analyses, or interpretation of data; in the writing of the manuscript or in the decision to publish the results.

Appendix A

Table A1. (a,b) The incidence relation of failure causes and failure symptoms.
(a)
(a)
Numbers1s2s3s4s5s6s7s8s9s10s11s12s13s14s15s16s17s18s19
m11
m2 1
m3 1
m4 0.9
m5 0.9
m6 0.10.350.40.15
m7 0.750.75 0.5
m8 0.5510.95
m9 0.95
m10 0.050.75 0.550.7
m11 0.950.5510.2
m12 0.40.3
(b)
(b)
Numbers20s21s22s23s24s25s26s27s28s29s30s31s32s33s34s35
m130.60.850.15
m14 0.750.1
m150.5 0.150.9
m16 0.90.550.5
m17 0.450.50.95
m18 0.45 0.90.4
m19 0.75 0.55 0.90.60.40.15
m20 0.65 0.9
m21 0.95
m22 0.70.95

Appendix B

Figure A1. Complete schematic diagram of reasoning chain for relay protection device fault tracing.
Energies 14 02723 g0a1

References

  1. Wang, L.; Chen, Q.; Gao, H.; Ma, Z.; Zhang, Y.; He, D. Framework of fault trace for smart substation based on big data mining technology. Electr. Power Syst. Res. 2017, 42, 84–90. [Google Scholar]
  2. Xia, Y. Study on the method of condition-based maintenance of relay protection. Master’s Thesis, Chongqing University, Chongqing, China, 2010. [Google Scholar]
  3. Jiang, T. Research on practical appliance for condition-based maintenance of protective relays. Master’s Thesis, Zhejiang University, Hangzhou, China, 2008. [Google Scholar]
  4. Chen, S. Research on failure detection and maintenance strategies of relay protection. Ph.D. Thesis, North China Electric Power University, Beijing, China, 2016. [Google Scholar]
  5. Shen, Z. Probability of relay protection failure and its impact on operational reliability of power transmission system. Ph.D. Thesis, Chongqing University, Chongqing, China, 2008. [Google Scholar]
  6. Long, P. Research of failure model and online operation maintenance method for relay protection in smart substation. Master’s Thesis, South China University of Technology, Guangzhou, China, 2017. [Google Scholar]
  7. Zhang, W. On-line monitoring and diagnosis technology of hidden failure of protection system. Master’s Thesis, Tianjin University, Tianjin, China, 2014. [Google Scholar]
  8. Ye, Y.; Sun, Y.; Huang, T.; Guo, M.; Huang, Y. Online state detection and fault diagnosis technology of relay protection secondary circuits in smart substation. Power Syst. Prot. Control 2016, 44, 148–153. [Google Scholar]
  9. Shi, N.; Dai, H.; Tian, H. Analysis and countermeasures on transformer’s secondary circuit two-point earthing. Hebei Electr. Power 2010, 29, 28–30. [Google Scholar]
  10. Sun, W.; Teng, X.; Ma, N. Fault Diagnosis of Relay Protection Device Based on Fuzzy Bp Neutral Network Model. In Proceedings of the 13th IEEE Joint International Computer Science and Information Technology Conference (JICSIT), Chongqing, China, 1–8 January 2011. [Google Scholar]
  11. Qu, Z.; Wang, Y. Failure Analysis of Relay Protection in Digital Substation Based on Fault Tree. In Proceedings of the 2012 China International Conference on Electricity Distribution (CICED 2012), Shanghai, China, 10–14 September 2012. [Google Scholar]
  12. Zhao, J.; Fu, Z. Microcomputer Protection of Power System; Machinery Industry Press: Beijing, China, 2016. [Google Scholar]
  13. Chen, L. Practical Technology for Maintenance of Microcomputer Protection Devices of 110 kV and Below; China Electric Power Press: Beijing, China, 2014. [Google Scholar]
  14. Liu, Z. Failure analysis of relay protection switching power supply. China Electr. Power 2012, 8, 14–16. [Google Scholar] [CrossRef]
  15. Wu, X.; Guo, C. Power System Fault Diagnosis Approach Based on Bayesian Network. Proc. Electr. Power Syst. Autom. 2005, 17, 11–15. [Google Scholar]
  16. Zhang, Y. Creating a reasoning chain determinately. Comput. Sci. Appl. 2016, 6, 545–550. [Google Scholar]
  17. Zhang, N.; Feng, L.; Yang, J.; Wang, J. Transmission grid fault diagnosis based on reasoning chain. Autom. Electr. Power Syst. 2014, 38, 78–84. [Google Scholar]
  18. Negnevitsky, M. Uncertainty management in rule—Based expert system. In Artificial Lntelligence: A Guide to Lntelligent Systems; Mechanical Industry Press: Beijing, China, 2012; Volume 3, pp. 39–46. [Google Scholar]
  19. Ma, X. Fault diagnosis for transmission network based on timing Bayesian suspected degree. Master’s Thesis, Shandong University, Jinan, China, 2016. [Google Scholar]
Figure 1. Schematic diagram of reasoning chain for relay protection device TV secondary circuit multipoint grounding fault tracing.
Energies 14 02723 g001
Figure 2. Schematic diagram of Bayesian network for relay protection device fault tracing.
Energies 14 02723 g002
Figure 3. Bayesian network of simple fault case study.
Energies 14 02723 g003
Figure 4. Bayesian network of complex fault case study.
Energies 14 02723 g004
Table 1. Causes set of failure.
Failure LocationNumberFailure CausesPrior Probability p/%
Software partsm1Setting value area change1.98
m2TA ratio compensation coefficient change2.40
m3Resistance values of distance protection change2.70
m4Fixed-value-setting error1.21
m5Software setting problem0.56
CPU main systemm6CPU component faults2.26
Data acquisition systemm7Multi-point grounding in the secondary circuit of TA14.22
m8Poor contact or abruption of secondary circuit of TA8.25
m9TA saturation7.33
m10Multipoint grounding in the secondary circuit of TV12.63
m11Poor contact or abruption of secondary circuit of TV7.74
m12Voltage transformer wiring error3.93
Digital inputm13Virtual connection or abruption in digital input4.47
m14Short circuit faults in digital input3.59
m15Protection plate fault in digital input3.85
Digital outputm16Virtual connection or abruption in digital output4.10
m17Short circuit faults in digital output3.33
m18Relay fault of digital output5.26
Power supplement unitm19Power supply cannot work properly3.21
m20Poor performance of voltage regulator circuit components1.68
m21Excessive starting current of power supply1.33
Communication interfacem22Communication interface fault2.23
Table 2. Symptoms set of failure.
NumberFailure SymptomsNumberFailure Symptoms
s1Setting value check inconsistencys19Voltage waveform distortion
s2Current differential setting value verification inaccuracys20A function plate cannot input
s3Distance protection setting value verification inaccuracys21Protection device cannot reset
s4Fixed value error alarms22Unable to reclose breaker
s5Protective soft-clamp not put into operation or control word set zeros23Inputting another protection plate when inputting a hard plate
s6RAM fault alarms24Switch indicator light is not on
s7A/D protection fault alarms25Protection output fault warning
s8Digital signal processor fault alarms26Unable to manually switch
s9Content damage alarm of fixed value areas27Switch jumps off soon after switch closing
s10AB/BC/AC phase diffluent of current samplings28Protection-switching relay power failure
s11Abnormal data/invalid warning of current samplings29Protection-switching relay switch on at the same time
s12TA protection break line warnings30DC power supply fault warning
s13Current sampling is zeros31DC protection disappears
s14Current waveform distortions32Abnormal output power of power supply
s15Voltage sampling is zeros33Power overload alarm
s16Abnormal data/invalid warning of voltage samplings34Communication interruption
s17TV protection break-line warnings35Communication channel anomaly
s18Three-phase voltage ripple
Table 3. The prior probability and conditional probability in the simple fault case.
Failure CausePrior
Probability
Conditional Probability
s15s16s17s18s19
m1012.630.050.50.550.7
m117.740.950.510.2
m123.930.40.3
Table 4. The posterior probability in the simple fault case.
Failure CausePosterior Probability
s15s16s17s18s19
m100.0790.690.690.882
m110.9210.3110.154
m120.1560.118
Publisher’s Note: MDPI stays neutral with regard to jurisdictional claims in published maps and institutional affiliations.

