Article

Effects of Oxygen and Steam Equivalence Ratios on Updraft Gasification of Biomass

Energy Technologies Department, ENEA, ss Ionica 106, 75026 Rotondella, Italy
*
Author to whom correspondence should be addressed.
Energies 2021, 14(9), 2675; https://doi.org/10.3390/en14092675
Submission received: 30 March 2021 / Revised: 23 April 2021 / Accepted: 27 April 2021 / Published: 6 May 2021

Abstract

:
Several experimental datasets available on the gasification of different lignocellulosic feedstocks were used to correlate the flow of gasifying agents with the performance of updraft gasification in an autothermic 200 kWth pilot plant. The feedstocks used included eucalyptus wood chips, torrefied eucalyptus and spruce chips, lignin rich residues from biorefined straw and reed, shells of almond and hazelnut, which were gasified in flows of air, air and steam, oxygen, oxygen and steam. Thermal profiles inside the gasifier and gas quality in terms of incondensable gas and tar content were recorded and used to calculate the energy efficiency of converting solid feedstock into gaseous and liquid carriers. Common behaviors and parametric functionalities were identified to better understand the process and the most efficient tools to achieve the desired products. In analyzing data, the ratio steam to biomass was reported in terms of the equivalence ratio, ER(H2O) i.e., the fraction of the stoichiometric quantity required to convert the feedstock into H2 and CO2. The use of steam was useful to stabilize the process and to tune the H2/CO ratio in the syngas which reached the value of 2.08 in the case of oxy-steam gasification of lignin rich residues at ER(H2O) of 0.25. Larger use of steam depressed the process by lowering the average temperature of the bed, which instead increased steadily with ER(O2). The production of tar depends on the biomass type and a substantial reduction can be achieved with the torrefaction pretreatment. The same effect was observed increasing the residence time of the syngas in the reactor, typically achieved using oxygen instead of air as main gasification flow or reducing the ER(H2O). Oxy-steam gasification of torrefied wood led to the best results in terms of cold gas efficiency and low heating value when carried out in the ranger 0.23–0.27 of both the ERs.

1. Introduction

Gasification technologies can be used to process carbonaceous feedstock and obtain gaseous mix of H2, CO, CO2 which is a more flexible and cleaner vector for energetic and synthetic application. According to the Global Syngas Technologies Council (https://www.globalsyngas.org/ (accessed on 24 April 2021)) there are more than 272 operating gasification plants worldwide with 686 gasifiers; coal is by far the dominant feedstock and chemicals the main products. Biomass and waste account for only 0.5% of total syngas capacity but this feedstock category is expected to grow in the future both as a power and heat source because of the suitable integration of small scale gasifiers in smart grids or as power units in regions lacking centralized power supply [1,2]. The analysis of the statistics provided by the International Energy Agency (IEA) [3] confirms a down scaling trend regarding the size of biomass gasifiers to meet this market niche. Fixed bed gasifiers are more robust and flexible toward the feedstock and generally simpler to operate compared to fluidized gasifiers, for example in starting up and shutting down procedure. In agreement with this, the number of fixed bed gasifiers under implementation is double in number than fluidized beds. In order to improve the efficiency of this technology it is pivotal to understand and modelling the gasifier. Fixed bed gasification has been traditionally divided into four stages: drying, pyrolysis, gasification and oxidation, which provided a first level approximation to model updraft (countercurrent) and downdraft (concurrent) gasifiers. Such an ideal segregation allows the use of rigorous heat and mass transport laws that, coupled with reliable stoichiometry and kinetic constants, can provide good agreement with real thermal profile and gas composition [4,5]. Comprehensive reviews are available on the various attempts to reconcile thermodynamics, kinetics and fluid-dynamics with experimental data [6,7,8]. Most of the proposed models use empirical correction factors to overcome the complexity of the system, particularly for the pyrolysis step where unknown reactions and non-equilibrium systems predominate. In the case of complex or mixed feedstocks the equilibrium reactor model can be used to simulate the gasifier. In this case the elemental composition of the feedstock and the final temperature can be used as input to calculate the ideal process yields by minimizing the Gibbs free energy. Successful modeling of fixed bed gasification is also reported in the case of wood gasified using high temperature steam [9] and of mix of beechwood and RDF gasified with air [10]. Beside its contribution to the mass balance closure, tar is rarely considered in gasification models, though its effect on permanent gas composition has been well demonstrated [11,12]. This is a recurrent shortcoming of modelling fixed bed gasifiers where tar and condensable organics in general constitute significant products. Experimental parametric investigations have been proposed to predict performance of fixed bed gasifiers. Gasification temperatures and air flow rate [13], air flow and biomass type [14], air and air-steam flow [15], moisture content and particle size [16], and recirculation of pyrolysis gas [17,18] are example of parameters tested in autothermal and continuous mode. The dependence of syngas heating value, permanent gas composition, tar content, energy efficiencies were in each case reported. However, a systemic investigation based on different feedstocks and oxidants flow is still lacking. In particular, the effect of steam on the gasification stoichiometry has not been fully studied, especially in the case of autothermal gasifiers, wich are those of practical interest. In recent years our research group investigated updraft gasification with air, air and steam oxygen and oxygen of several feedstocks, including eucalyptus and spruce wood chips, torrified wood chips, almond shells, hazelnut shells, lignin rich residues of straw and wood biorefining [19,20,21,22]. Moreover, we have introduced a steam Equivalence Ratio, ER (H2O) analogous to the oxygen Equivalence Ratio ER (O2) to have more insight in the steam reactions. The goals of this paper are:
(1)
Reworking and integrating available experimental data obtained from different feedstock at similar gasification conditions;
(2)
To draw generalized correlation relationships between Equivalent Ratios and plant performances for gasification of generic lignocellulosic biomass. These relationships appear not sufficiently investigated, especially for auto thermal fixed bed gasifiers.

2. Materials and Methods

2.1. Feedstock

The tested biomasses included wood (eucalyptus), torrefied wood (from eucalyptus and spruce), biorefinery industrial residues (lignin from straw and reed), agro-industrial residues (shells of almond and hazelnut). The main chemical and physical properties of the used feedstocks are reported in Table 1, Table 2, Table 3 and Table 4. The eucalyptus wood was produced by chopping branches of different sizes in particles of about 4–5 cm in length with leaning fibers, resulting in a bulk density of 188 kg/m3 (as dry matter). The torrefied correspondent eucalyptus particles retained the original shape and due to the loss of the leaning parts appeared smoother with a size on average 1/3 smaller than the original chips and a higher bed density of 274 kg/m3. The torrefied spruce consisted of small particles, and 75% of them with a diameter of 3.35 mm and a bed density lower than spruce wood (173 kg/m3) [19]. Hazelnut shells consisted of roughly hemispherical particles 1 mm thick and with 1.5 cm of diameter and bulk density of 299 kg/m3. The average size of almond shells was 2.5–3.0 cm in length, 2–3 mm in thickness with a bed density of 417 kg/m3 [22]. The hydrolytic lignin was the byproduct stream of enzymatic hydrolysis of straw or cane. The residue was dried and then broken down in small pieces of about 4 cm with a bulk density of 372 kg/m3; compared to the other feedstock lignin has a very high ash content (9%) [21]. More details on the analytical methods were previously reported [20,21,22].

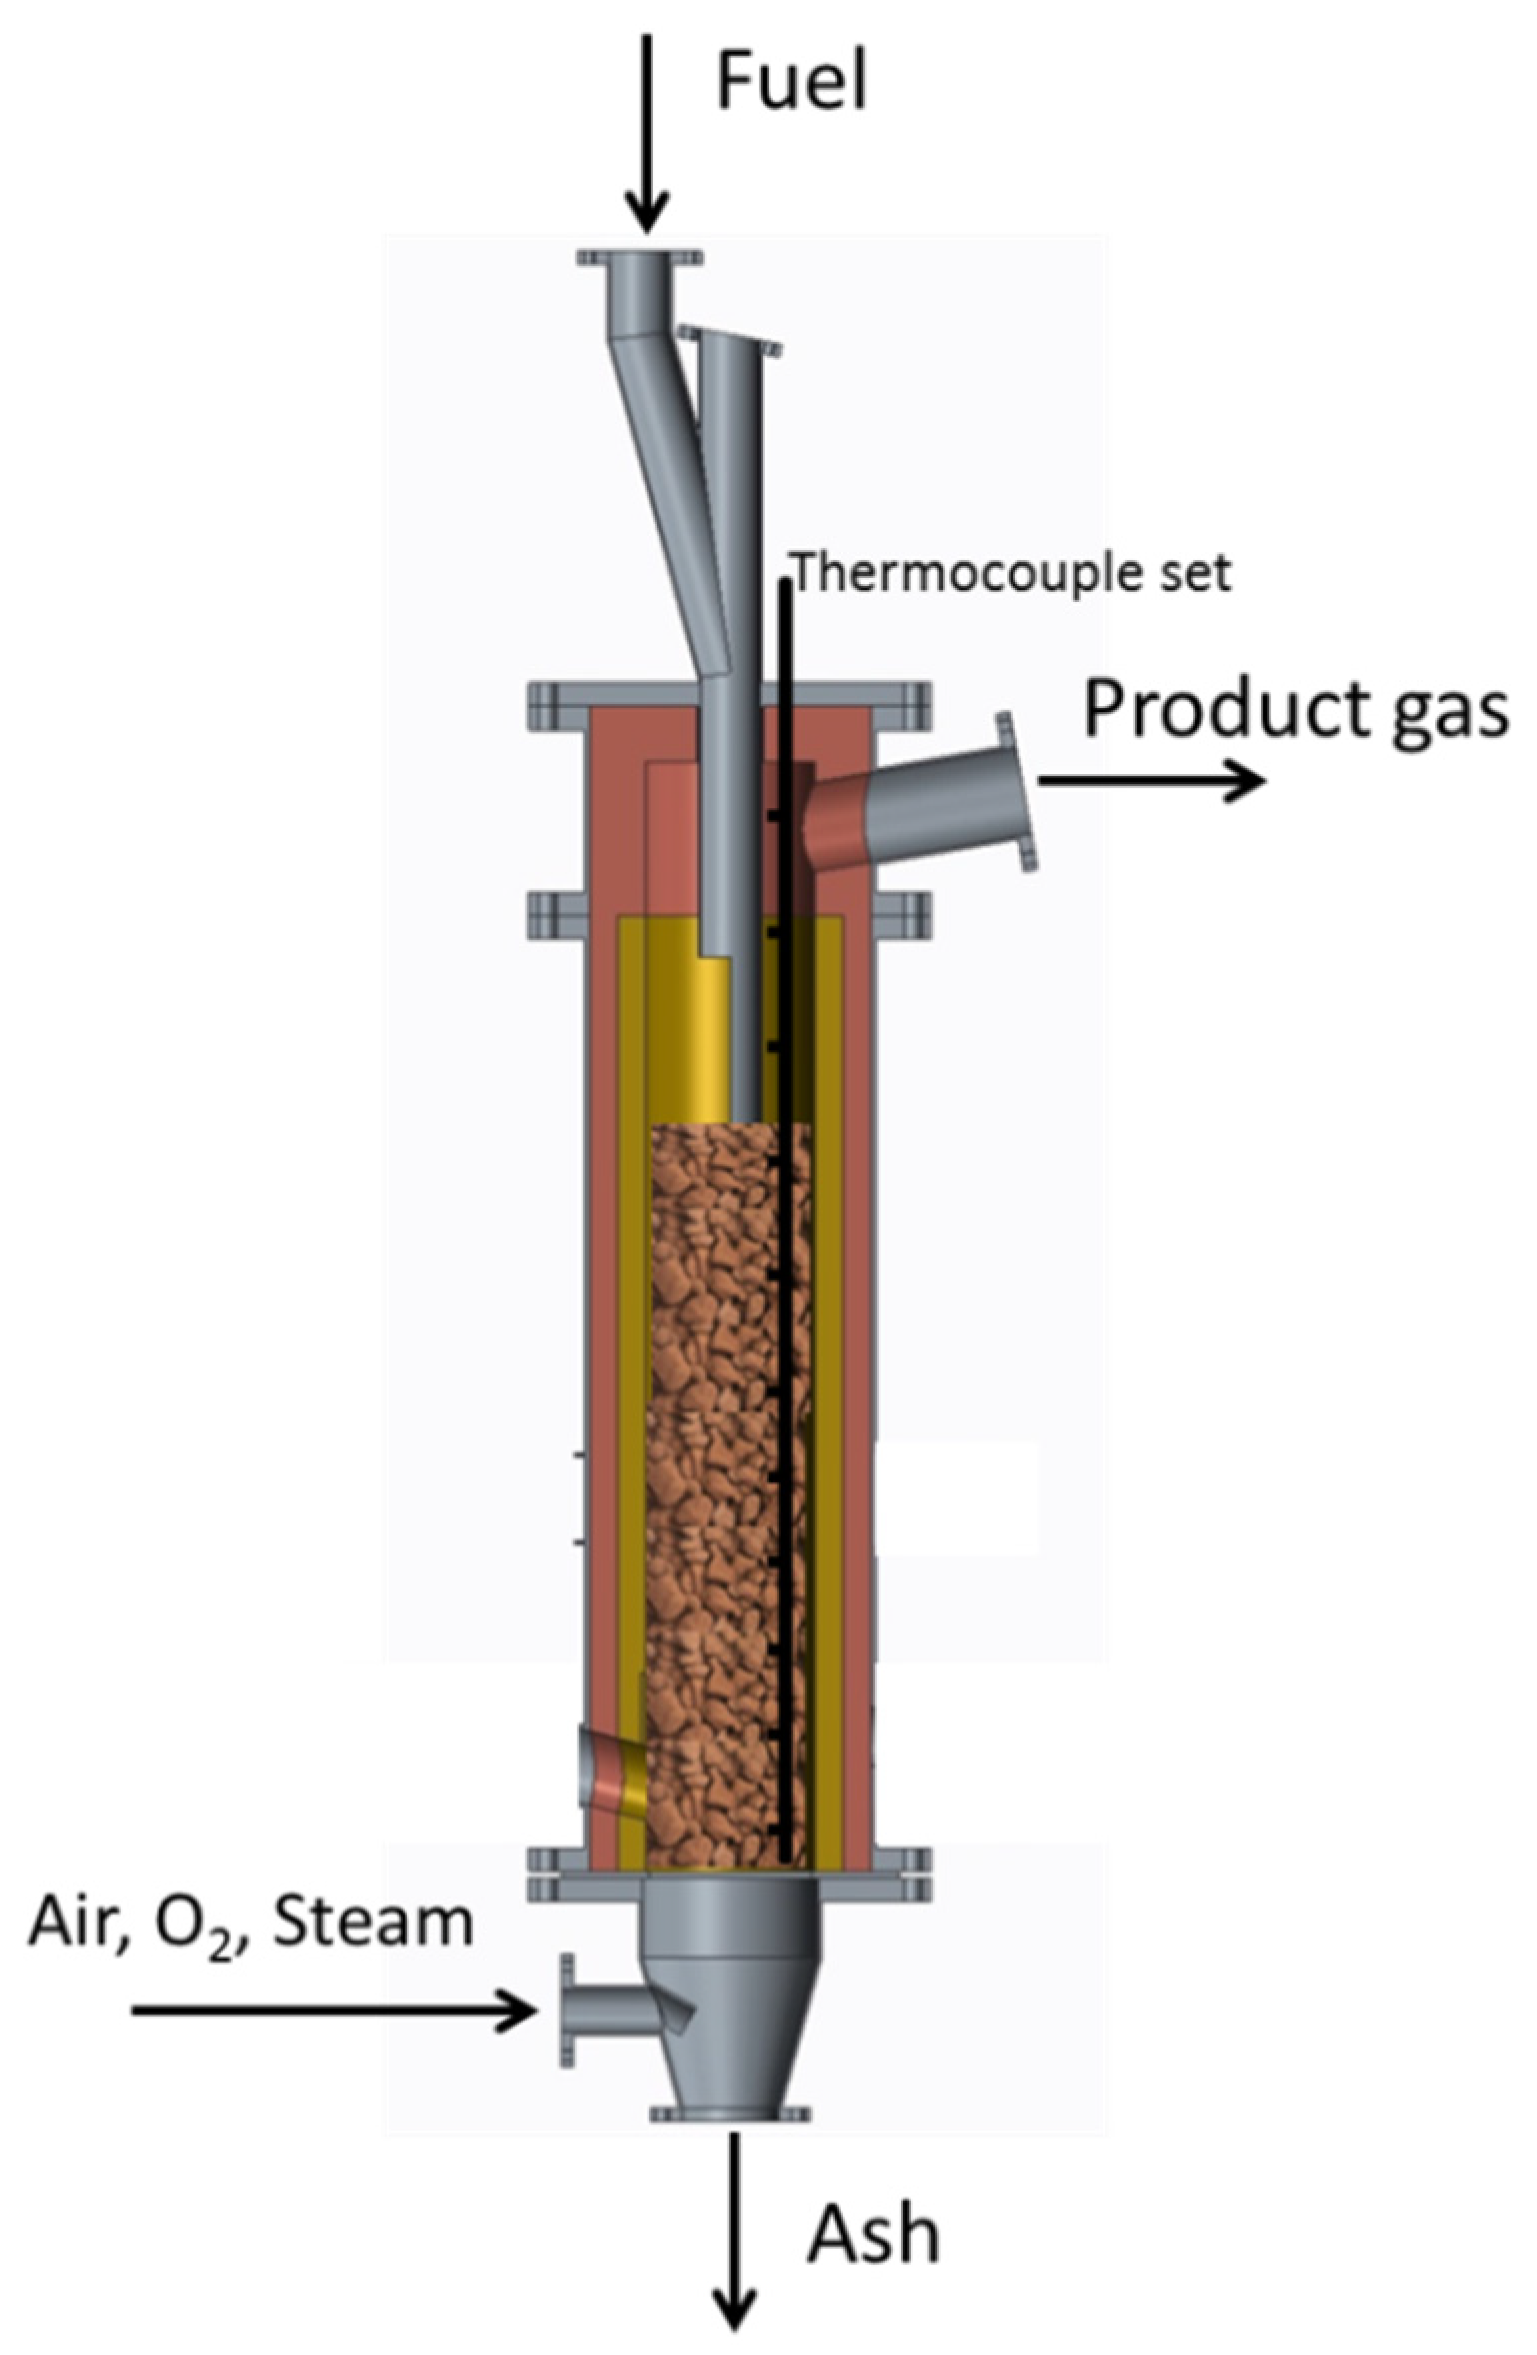
2.2. Description of the Plant and Procedures

The gasification tests were carried out in a pilot plant built at the ENEA Research Center of Trisaia. The core of the plant is an updraft autothermal gasifier operated slightly above atmospheric conditions which can treat 20–30 kg/h of feedstock. The gasifier is a steel cylinder 2.4 m high above the grate and 0.5 m large (external diameter), with an inner layer of insulating material of 0.1 m and thus an internal diameter of 0.3 m. The lower part is shaped as a cone to collect and discharge the ash produced in the process through a steel grate positioned at 0.7 m from the bottom. Air, oxygen or mixtures of these with steam can be used as gasifying agents and are introduced from the bottom zone, under the grate which supports the biomass bed. Three infrared lamps above the grate are used to ignite the biomass at the beginning of the process. The temperature profile along the gasifier is measured by a set of 11 thermocouples placed inside a steel protective tube (Figure 1). The feeding system is constituted by two screw feeders and one collecting chamber at the top of the gasifier from which the biomass falls down by gravity inside the reactor. A calibration procedure was carried out for each feedstock before gasification tests to determine the feeding rate of the reactor. The steam is supplied by an external boiler that produces superheated steam at 160 °C and 1.2 bar. The producer gas leaves the reactor from the top and is sent to a cleaning and a cooling section composed of a biodiesel scrubber and two coalescer filters and then to an upgrading section [20]. The facility is equipped with probes to monitor and control temperatures, pressures, mass flows and liquid levels. A supervision system allows to remote control of the entire process. The process starts by heating up the biomass inside the reactor by turning on the infrared lamps. After ignition, the bed is raised to the optimal height of 1.3 m from the grate by introducing new biomass; the level is maintained constant during the gasification with a variation of ±5%. Therefore, the biomass is batch-fed by the screw feeders and the intermediate chamber that limit the duration of the procedure to few seconds. More details about the plant and the procedures are described elsewhere [20,21,22,23].

2.3. Chemical Analysis

The proximate analysis was carried following the ASTM D3175 method by complete combustion of the sample at 900 °C. The ultimate analysis was performed with the PerkinElmer analyzer and calculating by difference the content of oxygen. The high heating value (HHV) was determined by using benzoic acid as a reference and using the calorimeter IKCA model C4000. The low heating value (LHV) was calculated by subtracting the condensation heat of the water produced in the combustion and gravimetrically determined. The PRAGA plant was equipped with a GC apparatus (HP model 6890, Molsieve 5Å and Poraplot U separation columns) equipped with a thermal conductivity detector to mine H2, CO, CO2, CH4, O2, N2 at the exit of the scrubber, this is done online with delay of 5 min owing to the run time of each analysis. The carrier gas in GC was argon at 25 mL/min the heating rate were 45 °C for 5 min, then 12 °C/min up to 120 °C kept this temperature for 2 min. The content of organic volatilizes, including low weight molecules and tar, and water were determined following the CEN/TS 15439 method. The average standard deviations of these determinations, carried out in triplicate, were respectively 2% and 5%. The instrumental error on mass-gas flows and steam were less than 1%. Data concerning gas are reported to the standard conditions (STP) of 273.15 K and 105 Pa. Other experimental details are provided elsewhere [19,20,21,22].

3. Results and Discussion

Gasification is a process for thermochemical conversion which progresses through multiple reactions and pathways in the solid and in the gas phases and at the interface between them. The main reactions are shown in Table 5. Since the gasification of biomass is a complex chemical system that in most of the cases does not reach the thermodynamic equilibrium, the quantity and composition of the product gas, char and condensable organics, strongly depend on key operating parameters of gasification, including type of feedstock, reactor design, gasification temperature and pressure, gasification agent, flow rate of biomass and oxidizing agents [24,25].
In this work, the autothermal gasification of different types of lignocellulosic materials was investigated in order to understand the effects of different equivalence ratios ER(O2) and ER(H2O) on the syngas quality and energy conversion efficiency. The aim was to extrapolate general principles from experimental data and to identify common factors that could be used for the optimization of biomass thermochemical conversion. The gasification tests were carried out in a pilot updraft plant powered by about 30 kg/h of different feedstocks, including wood (eucalyptus), torrefied wood (from eucalyptus and spruce), biorefinery industrial residues (lignin of straw and reed), agro-industrial residues (shells of almond and hazelnut). The experiments were performed using air, oxygen and mixtures of them with steam as gasifying agents (Table 6). The updraft countercurrent gasification of these feedstocks was performed by varying the flows of O2 and H2O (as overheated steam) that affect the equivalence ratios ER(O2) and ER(H2O) as main operating conditions (Table 7). The equivalence ratio of combustion, ER(O2), represents the actual air-to-biomass ratio with respect to the stoichiometric amount for a complete conversion of the biomass [26]. For an effective gasification, the optimum values of ER(O2) are in the range of 0.19–0.43 [27]; in the case of fluid bed gasification of wet feedstock values up to 0.5 have been reported [28]. With an equivalence ratio ER(O2) near 1, the process approaches the conditions of full oxidation; while a value next to 0 shifts the process to the pyrolysis:
ER O 2 = feed   O 2   kg / h flow   of   O 2   for   complete   combustion   kg / h
In the steam gasification, oxygen is provided by the water and the equivalence ratio can similarly be defined as follows:
ER H 2 O = feed   of   H 2 O   as   steam   kg / h flow   of   H 2 O   for   complete   gasification   kg / h
These ratios can be derived from the stoichiometry of biomass oxidation by oxygen and water, respectively:
C X   H Y O Z + X + Y 4 Z 2 O 2 = XCO 2 + Y 2 H 2 O
C X   H Y O Z + 2 X Z H 2 O = XCO 2 + Y 2 + 2 X Z H 2
The use of ER(H2O) instead of the more common steam to biomass ratio (S/B) allows to define a more specific interaction between steam and a specific feedstock because it is based on the elemental composition. This detail can provide more insights on the process, especially when comparing the gasification of different feedstocks.
The variation of flow rates affects the chemistry and fluid dynamic of the process and can be derived directly from the corresponding changes in the thermal conditions and in the gas composition, including yields of end products. In the autothermal gasification the operating parameters are more strictly related to the process yields than in the allothermal mode where the temperature is kept constant by an external source of power [29,30]. In the autothermal gasification, the exothermic combustion reactions provide the heat to dry the feedstock, to drive endothermic reactions, and to compensate heat loss [31]; therefore, the operating parameters can be varied in a narrow range to meet the energy balance and steady conditions. In spite of this limit, autothermal processes are more useful to scale up and testing real gasification processes. For the gasification tests presented here, the ER(O2) was varied from 0.18 to 0.28 while the ER(H2O) from 0 to 0.41 as reported in Table 6. The gasification tests were carried out successfully with all feedstocks and the process resulted regular and reproducible. The attainment of steady temperature profiles inside the bed reflected steady conditions of the process, while minor oscillations in the freeboard indicated the cyclic feeding of the biomass. Table 6 shows the experimental conditions and parameters as well the codes assigned to each test: the use of air as main gasifier agent is indicated by the letter A, the use of oxygen by O and the use of air only by AS. The numeric code of the test correspond to different ER(O2) and ER(H2O) values, respectively, for example LA(22/41) corresponds to the test of hydrolytic lignin carried out with air at ER(O2) 0.22 and ER(H2O) 0.41.
To evaluate the energy conversion efficiency of biomass with different equivalence ratios, the cold gas efficiency (CGE) and the cold liquid efficiency (CLE) were calculated. Indeed, during the gasification process, the biomass decomposes into a permanent gas, a solid phase (ash and char) and liquid tar. Char and tar are the results of its incomplete conversion [31]. The ratio of these components depends on the gasification technologies, operational conditions and on the feedstock properties. Updraft gasification presents high conversion into gas and liquid, while recovered ash contains very low residual carbon because of the long residence time of the particles inside the reactor. The CGE and CLE measure the energy fraction converted from biomass to gaseous and liquid products, they are respectively defined as follows:
CGE ,   % = LHV   of   clean   gas   MJ / h LHV   of   feedstock   MJ / h · 100
CLE ,   % = LHV   of   condensed   organic   volatiles   MJ / h LHV   of   feedstock   MJ / h · 100
For the LHV of the condensable molecules we used the value of 16 MJ/kg reported for the anhydrous part of bio-oil obtained from slow pyrolysis [32]. The net values of CGE and CLE take into account the energy required to produce steam when it is used as co-gasification stream:
net   CGE ,   % = LHV   of   clean   gas   MJ / h LHV   of   feedstock   MJ / h   +   Δ   entahlpy   water   to   steam   MJ / h
net   CLE ,   % = LHV   of   condensed   organic   volatiles   MJ / h LHV   of   feedstock   MJ / h   +   Δ   entahlpy   water   to   steam   MJ / h   · 100
The upgrading and exploitation of the condensed organic volatiles is a fundamental aspect of the updraft gasification. According to recent reports, this liquid stream can be considered not a waste but a co-product to obtain liquid biofuels and valuable chemicals [33].

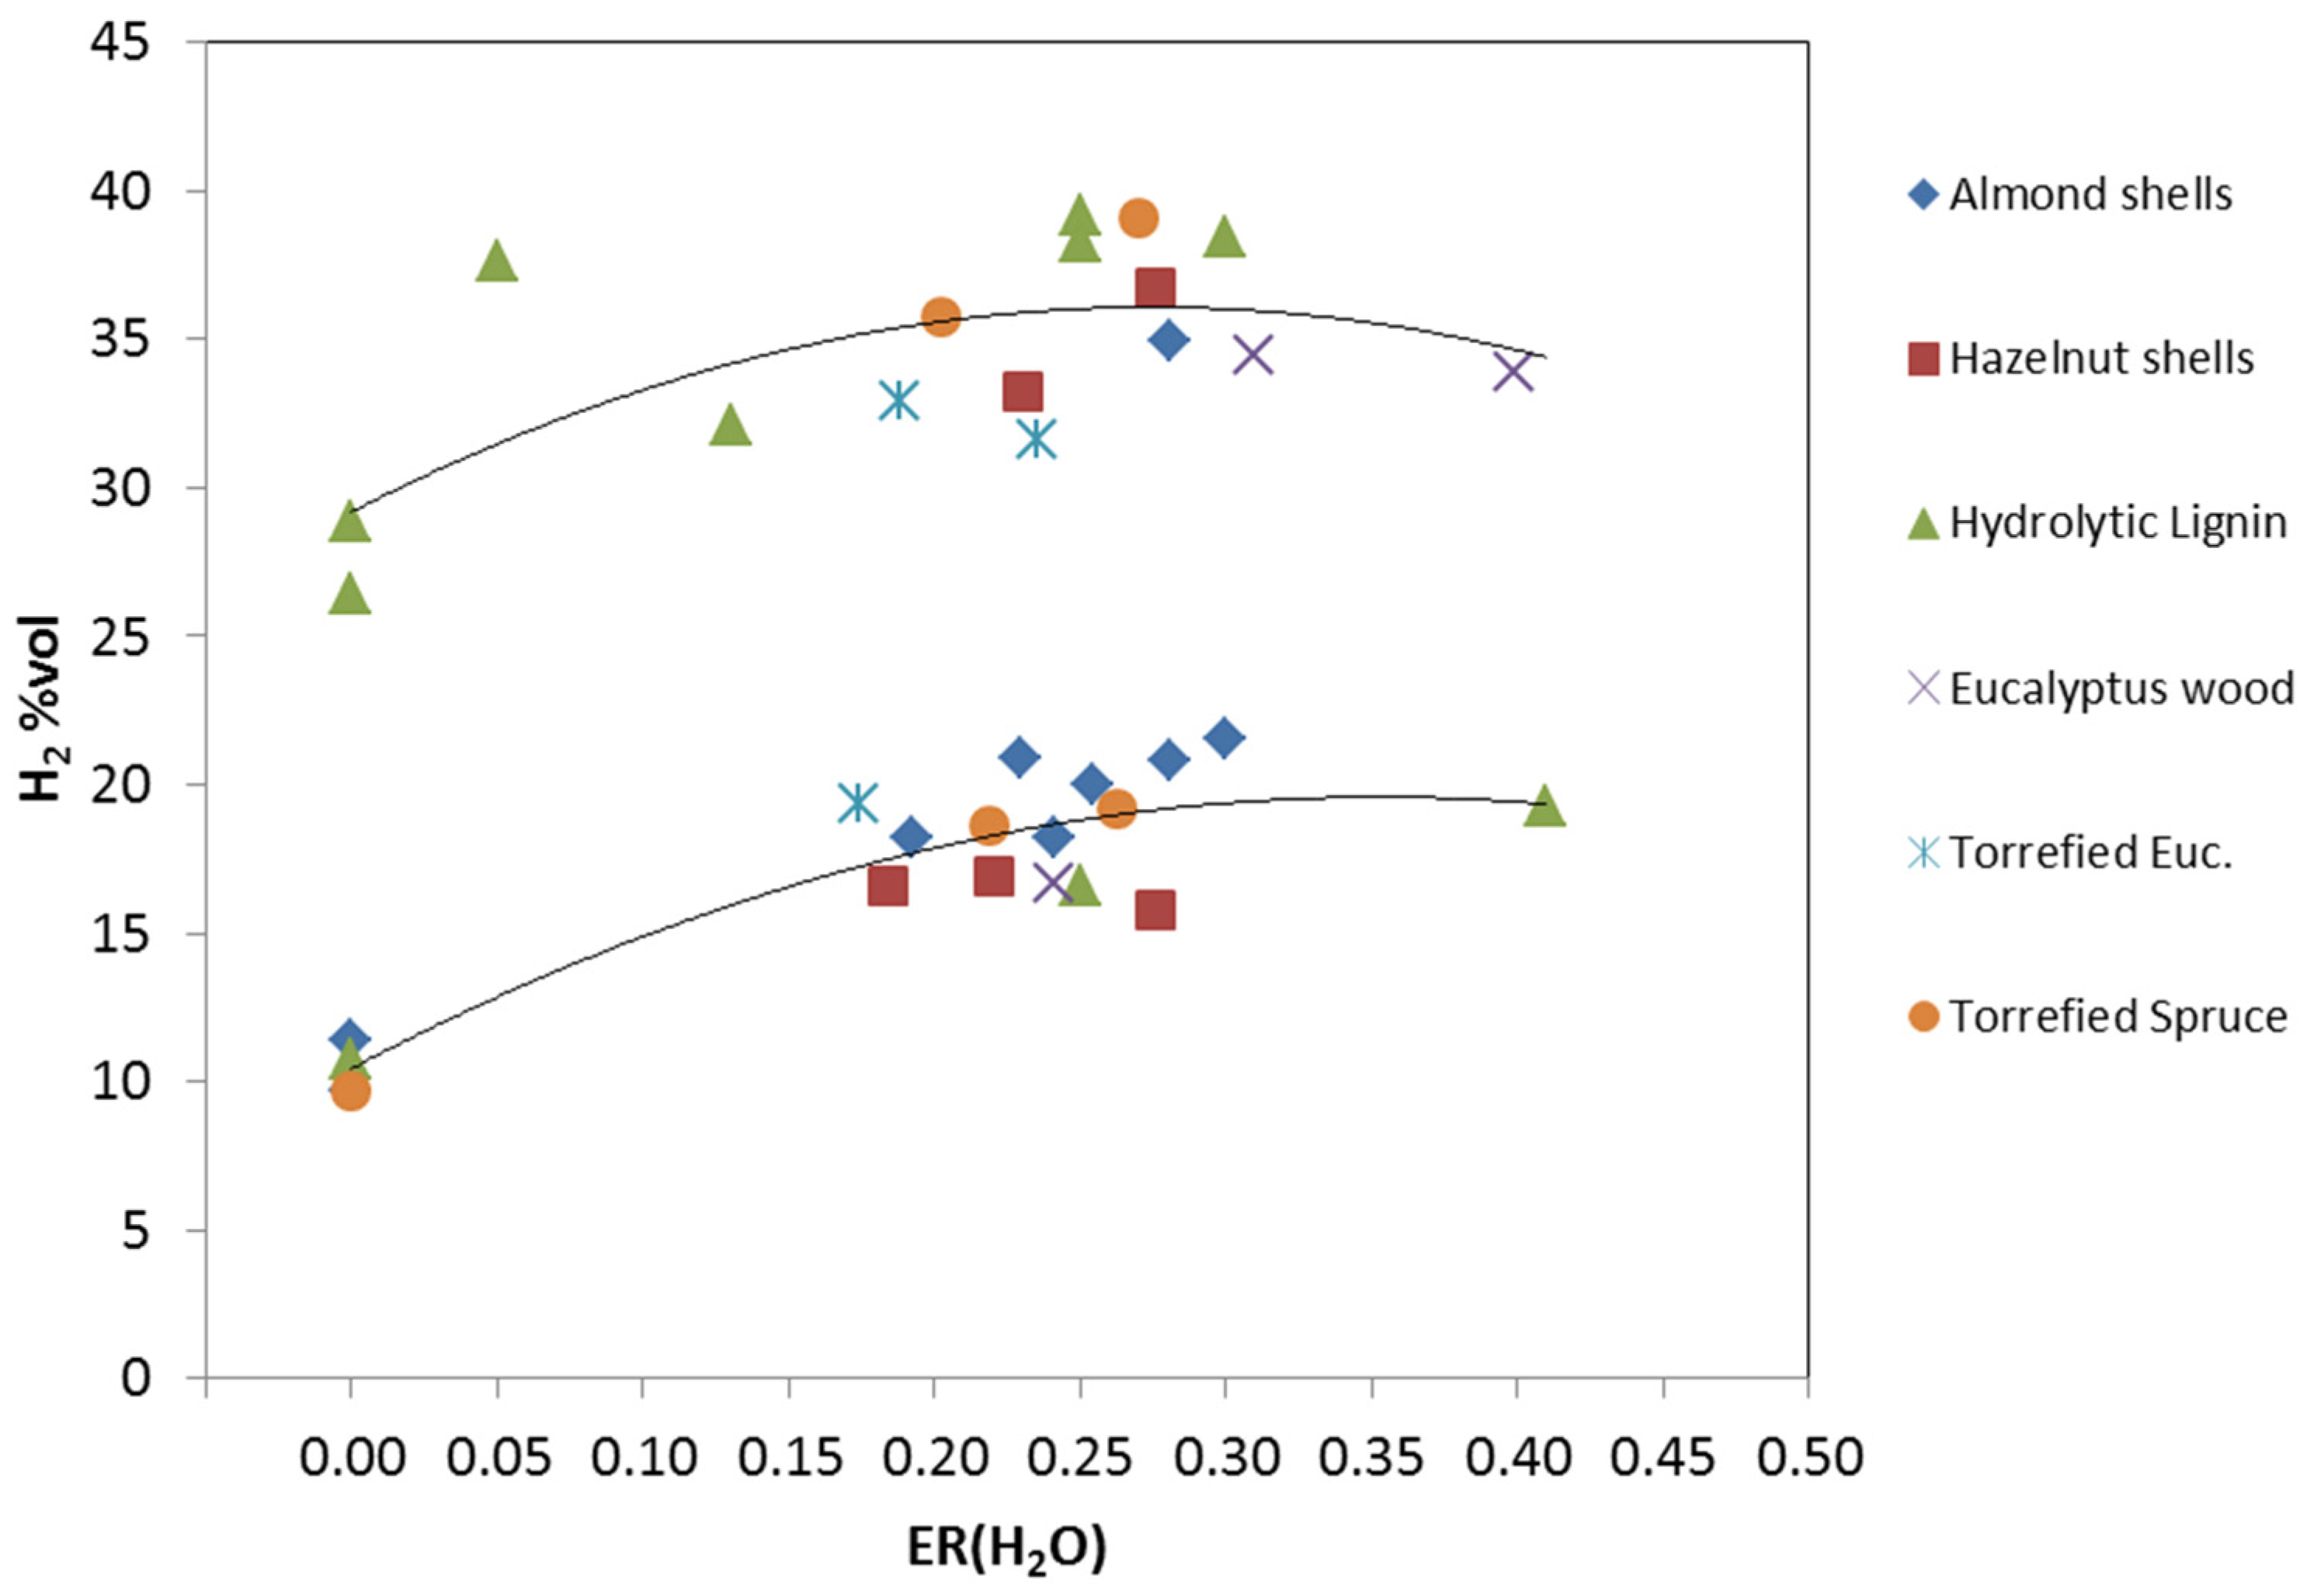
3.1. Effects of Different Values of ER(H2O) on Syngas Quality and Yield

The countercurrent fixed bed gasification at pilot scale was investigated to compare the gasification characteristics of several biomasses at different steam flow rates (or ER(H2O)).
Supplying steam as a gasification agent led to increased H2 production. This is due to the increase of the H2O partial pressure inside the gasifier which favors the water gas and the water gas shift reactions [34]. Figure 2 shows a higher H2 concentration in the syngas with the fed steam both in the case of air and oxygen gasification, for all residues, confirming the strong influence of the equivalence ratio ER(H2O). During air gasification, the H2 content was in the range 9.7–11.4%; with the addition of steam the values increased from 15.8% to 21.6%. In the case of gasification with only oxygen, the H2 concentration ranged from 26.4% to 28.9%, whereas with steam it increased to 31.6–39.2%. However, the curve interpolating the experimental data clearly shows that an excess of steam negatively affected the H2 production. Indeed, the steam temperature supplied to the reactor is lower than the gasification temperature and this causes a cooling of the gasifier bed as a significant amount of heat is needed to raise the steam temperature. When using air as gasification agent the hydrogen content in the syngas was lower than when using pure oxygen because of the diluting effect from N2, as indicated in Figure 2 (top line). Also, the process yields showed generally higher values (Table 4). The strong effect of ER(H2O) was clearly observed comparing the tests carried out at fixed ER(O2) and varying ER(H2O) from 0 to 0.41 (Table 8). In these tests the H2 and CO2 content increased while the CO content decreased with increasing values of ER(H2O), because the water gas shift and the water gas reactions become successively more favored. Consequently, the H2/CO molar ratio increased from 0.34–0.66 in air gasification to 0.80–2.08 in air/oxy-steam gasification, showing the predominance of water gas shift reaction with the addition of steam. In the case of lignin, the obtained H2/CO molar ratio by using steam was significantly higher than wood and other biomasses: it increased from 0.43 in air gasification to 1.21 in air-steam gasification (test LAS(22) versus LA1(22/41)); moreover, using oxygen the ratio was 0.49 and reached the highest value of 2.08 adding 0.32 kg of steam/kg of biomass (test LOS1(22) versus LO1(22/30)) [21].
From a qualitative point of view, the effects of the ER(H2O) on the gasification process were the same for all feedstocks. An increase in ER(H2O) caused a rapid raise of organic condensable species yields in all tested biomasses, as shown in Figure 3.
At fixed ER(O2), the addition of steam resulted in a higher production of syngas which in turn shortened the residence time of the syngas in the bed and led to a larger production of tar. Figure 4 shows this correlation: a longer residence time allowed volatiles molecules to undergo thermal cracking cycles and this resulted in lighter incondensable hydrocarbons and hydrogen according to a consecutives scheme of reactions:
Tar → CnHm → H2
The increasing production of CnHm and H2 as function of the residence time supports the proposed scheme. Moreover, the feeding steam temperature (160 °C) was lower than the one near the grate (1000 °C) and this resulted in a decrease in the average bed temperature up to 15%, favoring a higher tar production. As an example, in the eucalyptus wood gasification, with an increase of ER(H2O) from 0.19 to 0.24, the average bed temperature decreased from 688 °C to 642 °C and the tar yields increased from 29.53 to 45.48 g/kg (TE2(23/19) versus TE3(23/24)) [19]. The use of steam as co-gasification agent allowed to better control the temperature avoiding superheated spots within the ash layer near the grate of the gasifier, which is one of the most common problems in thermal conversion of biomass. In all tests carried out at ER(H2O) > 0.2, the lower part of the bed was kept between 850 °C–950 °C ensuring favorable kinetics and equilibria of the endothermic water gas and Boudouard reactions.
The addition of steam also affected the heating value of the syngas. At fixed ER(O2), the LHV decreased from 3% to 17% by varying the steam flow rate in the range of 1 kg/h–5.5 kg/h, both with air and oxygen as gasification medium. Indeed, lower temperatures and shorter residence times led to higher tar production and lower conversion into gas.
The fraction of energy transferred from the solid feedstock to the clean and dry gas (CGE) showed a positive correlation with the ER(H2O). The addition of steam generally corresponded to an increase of the CGE; however, an excess of it negatively affected CGE as reported in the tests MAS1(24), MA4(24/25) and MA2(24/28). In these cases, with an increase of ER(H2O) from 0 to 0.25, the CGE increased from 0.57 to 0.69, whereas it decreased to 0.64 at ER(H2O) of 0.28. The use of oxygen instead of air generally improved the efficiency of energy conversion from solid to gas and liquid carriers. The CLE was proportional to the tar yield and increased with ER(H2O) (Table 7). The net efficiencies followed the same trends but with lower values of 1–6.6% when using 0.06–0.45 kg of steam/kg of biomass because the production of steam required 3.9% of the LHV available in the fed biomass. Even with this energetic cost, the use of steam significantly increased the H2 production and the H2/C ratio, allowed a quick tuning of the thermal profile inside the gasifier so preventing local hot spots and ash melting.

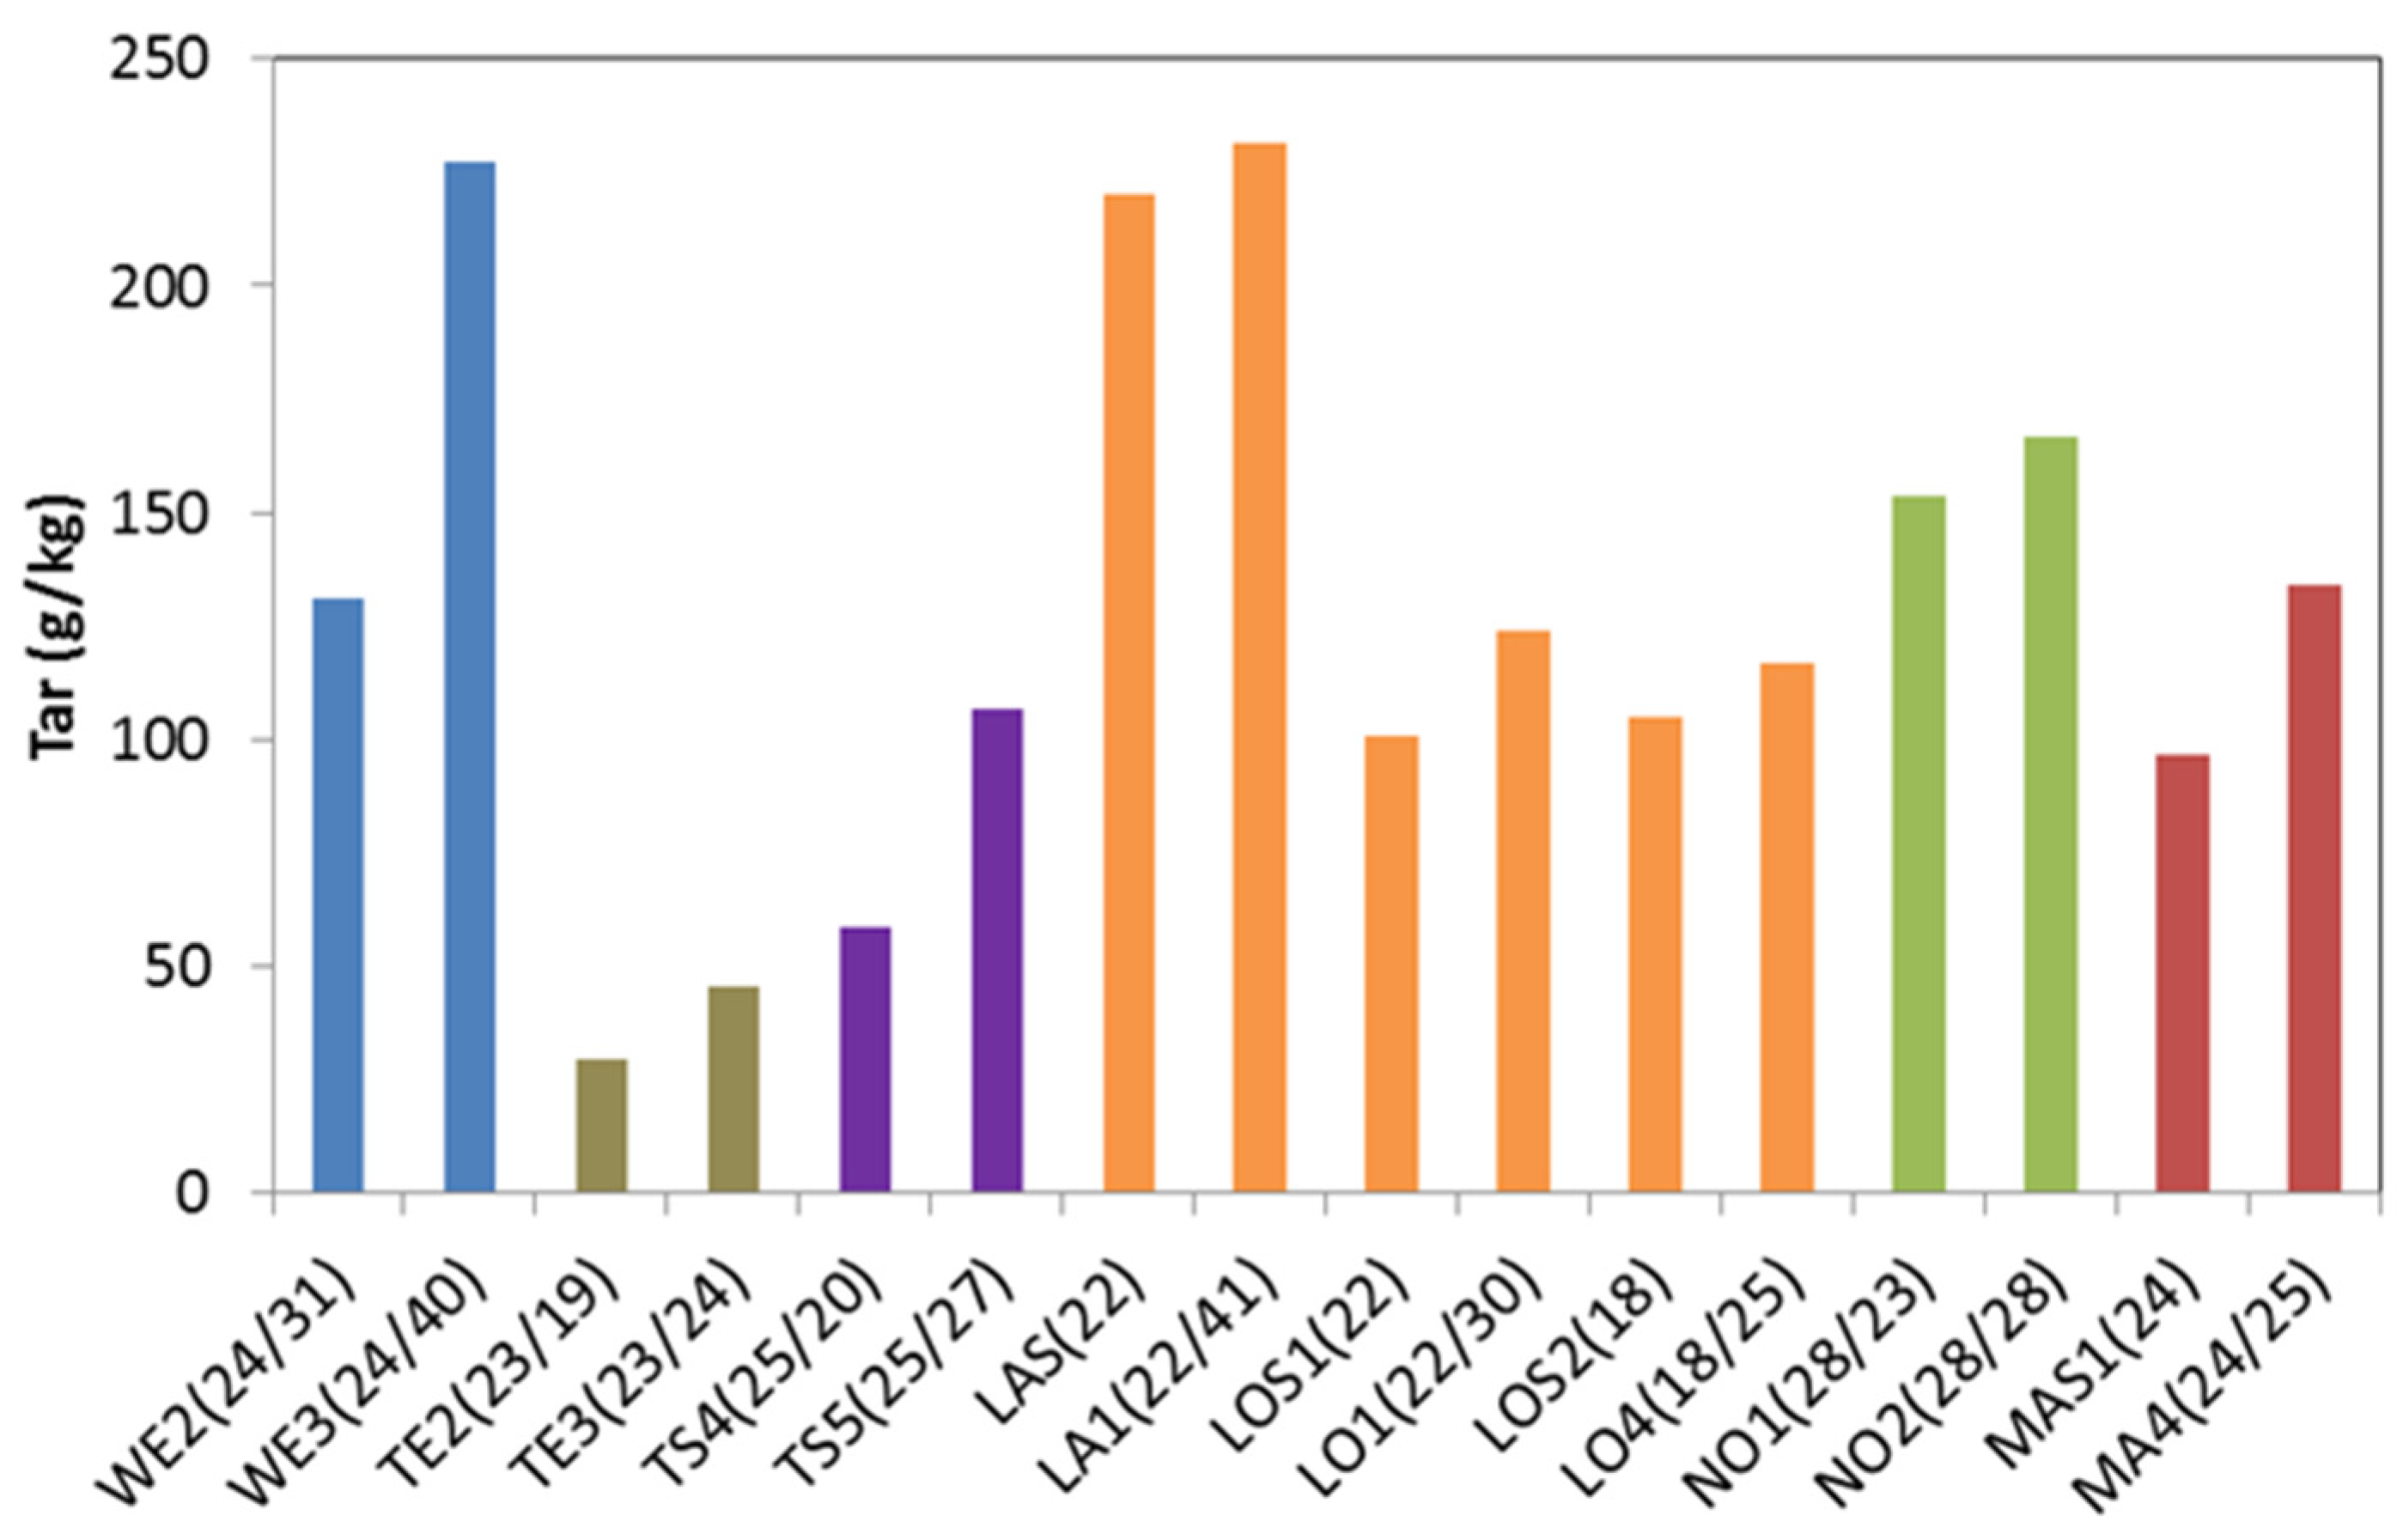
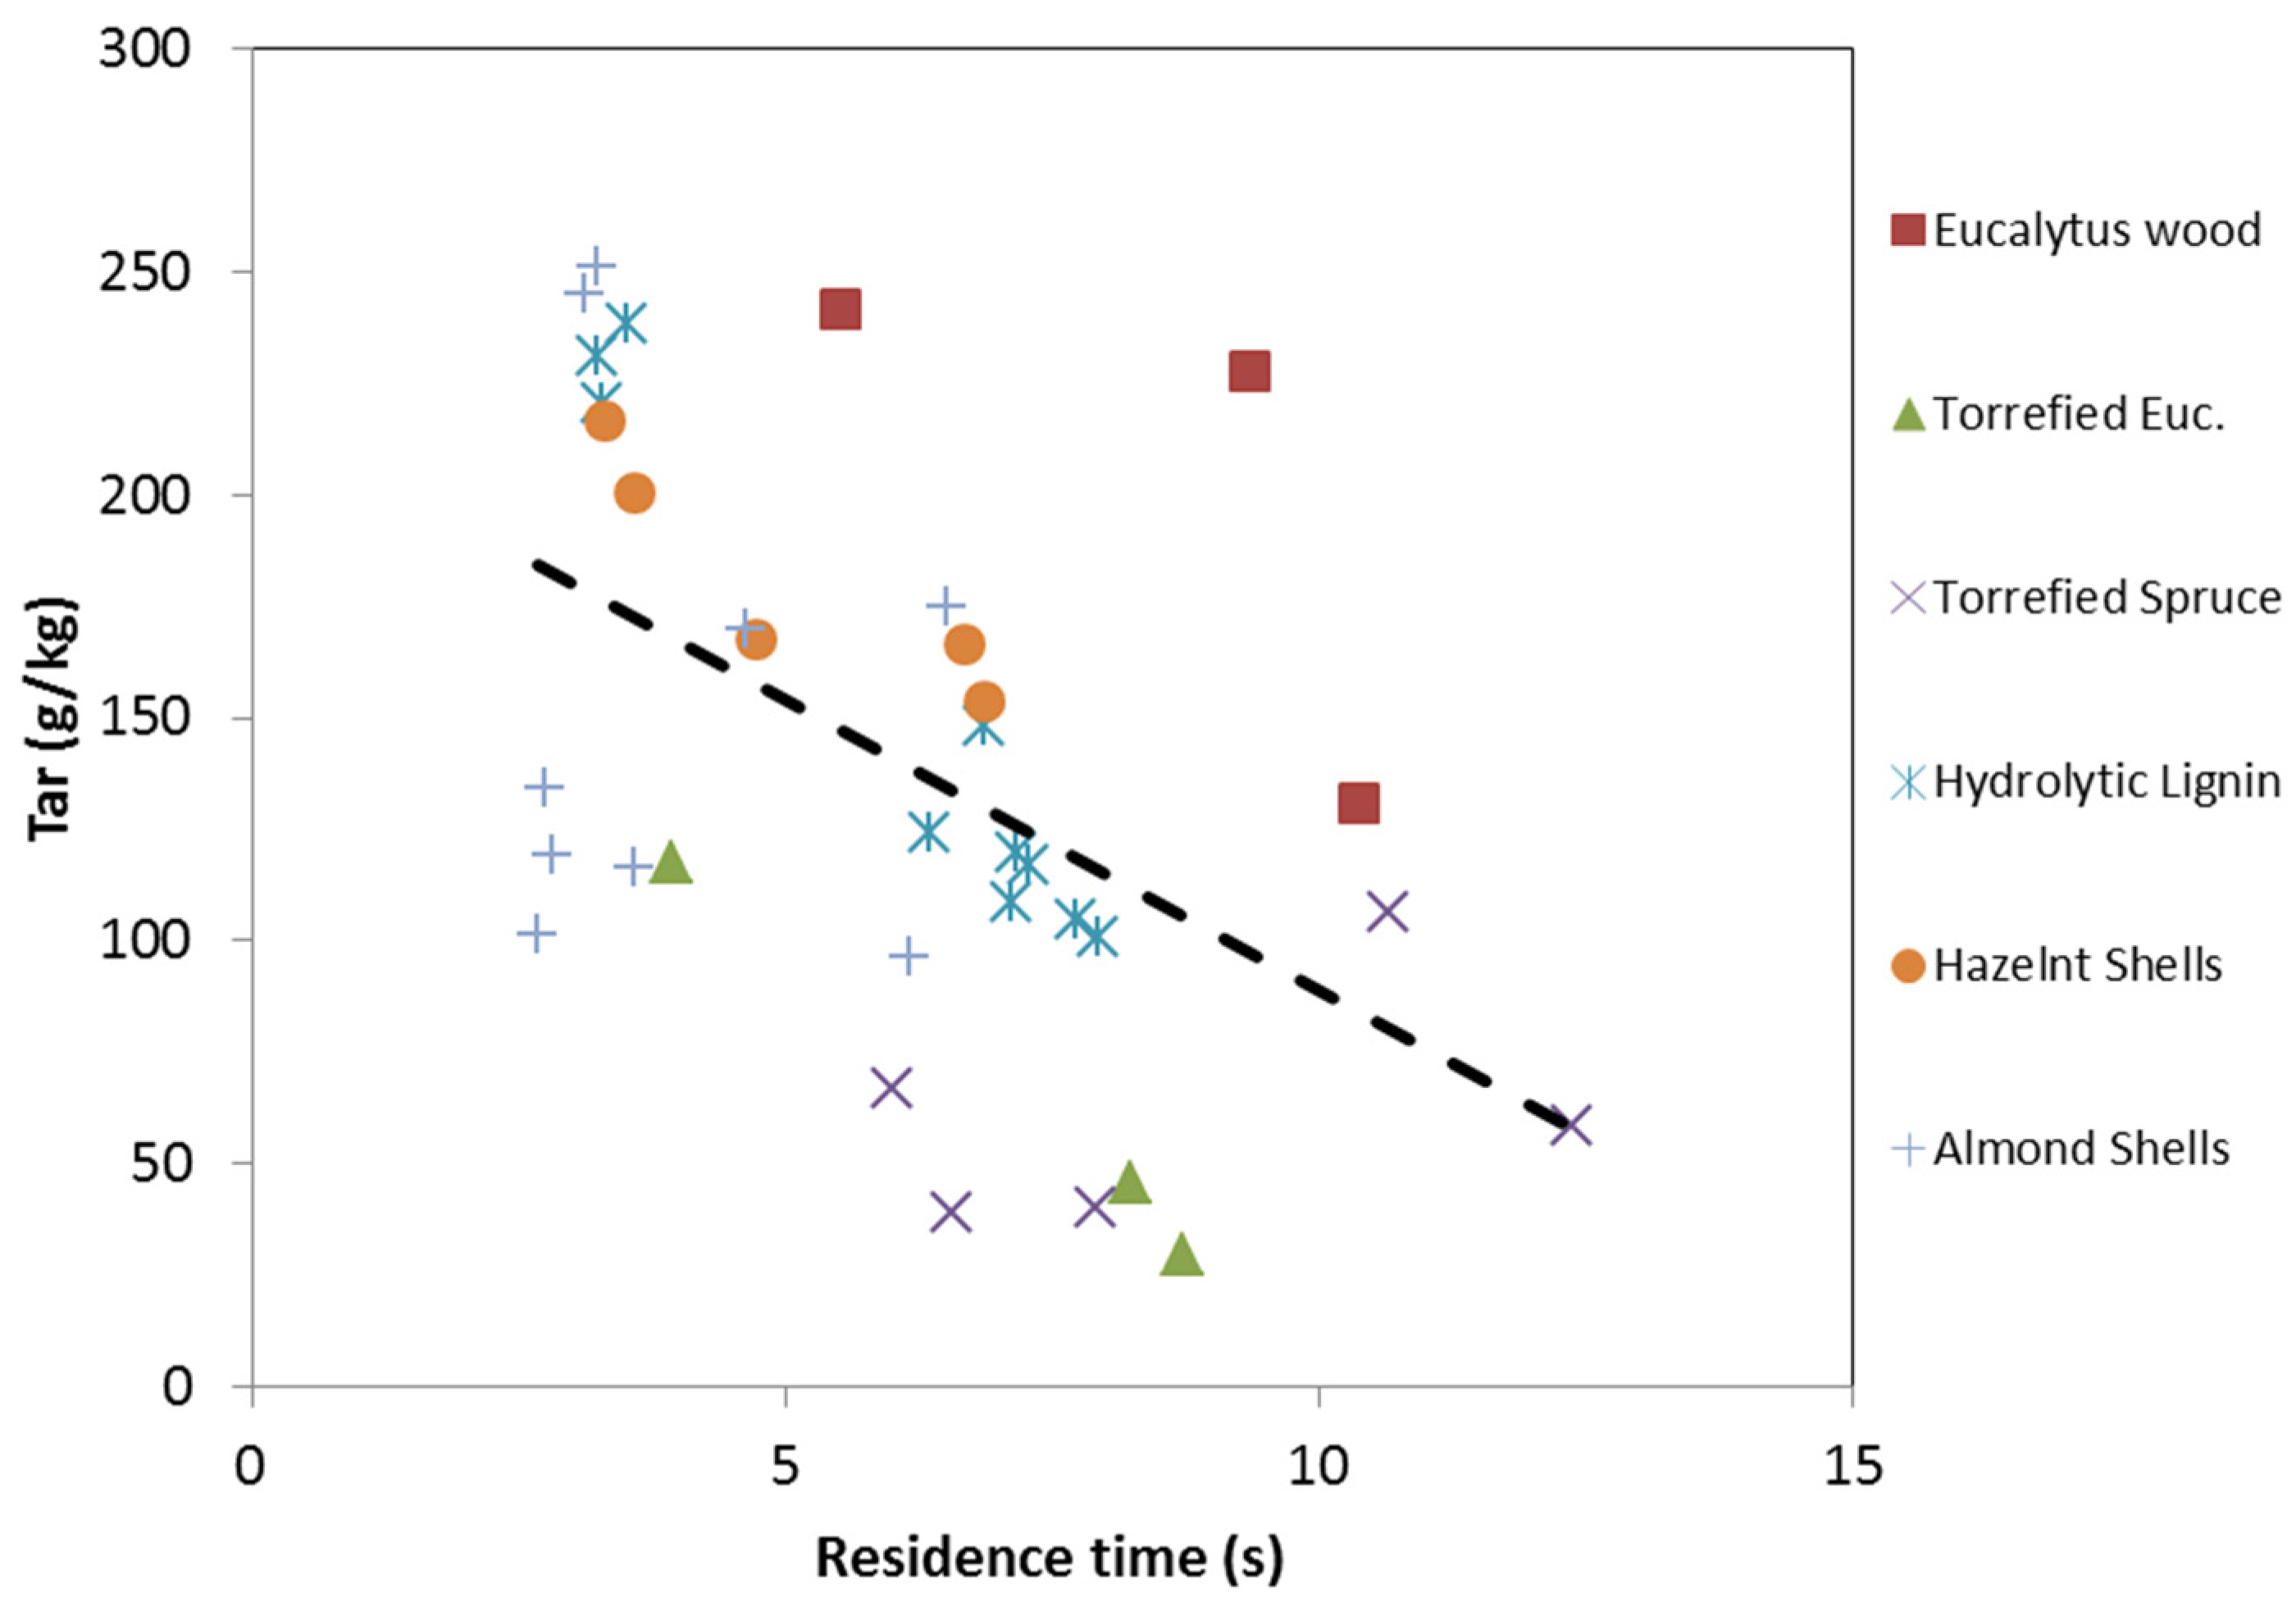
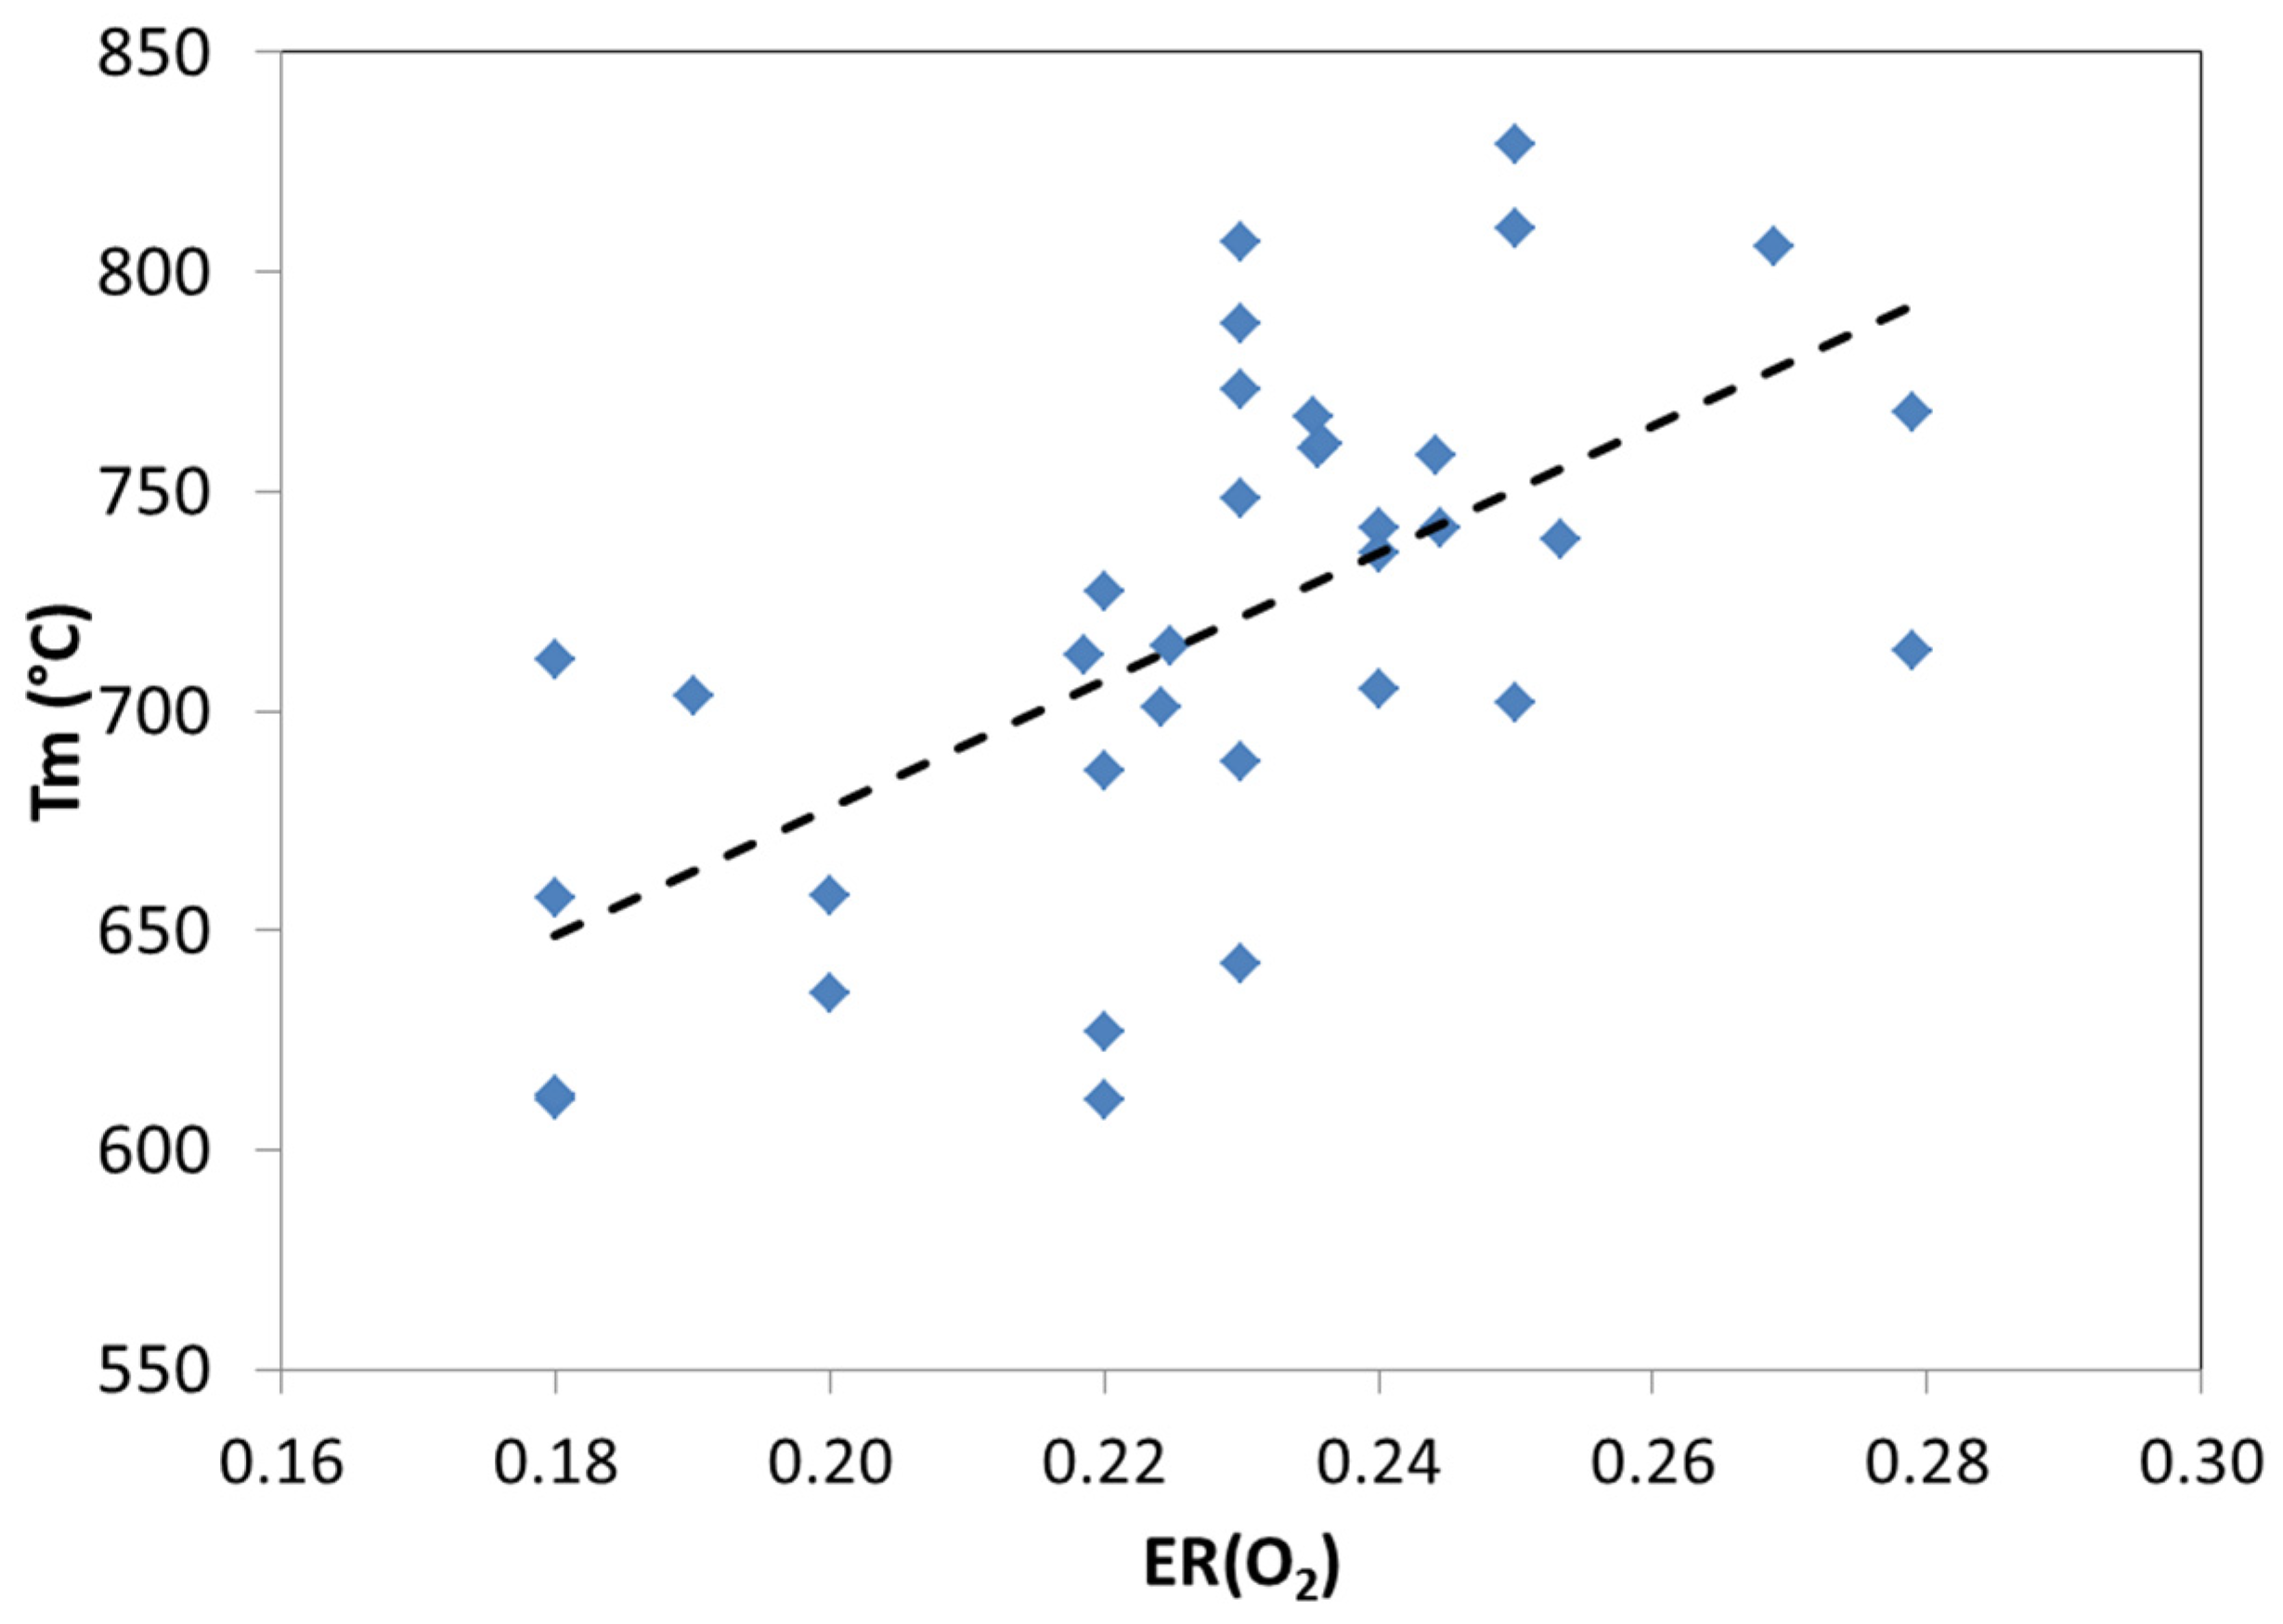
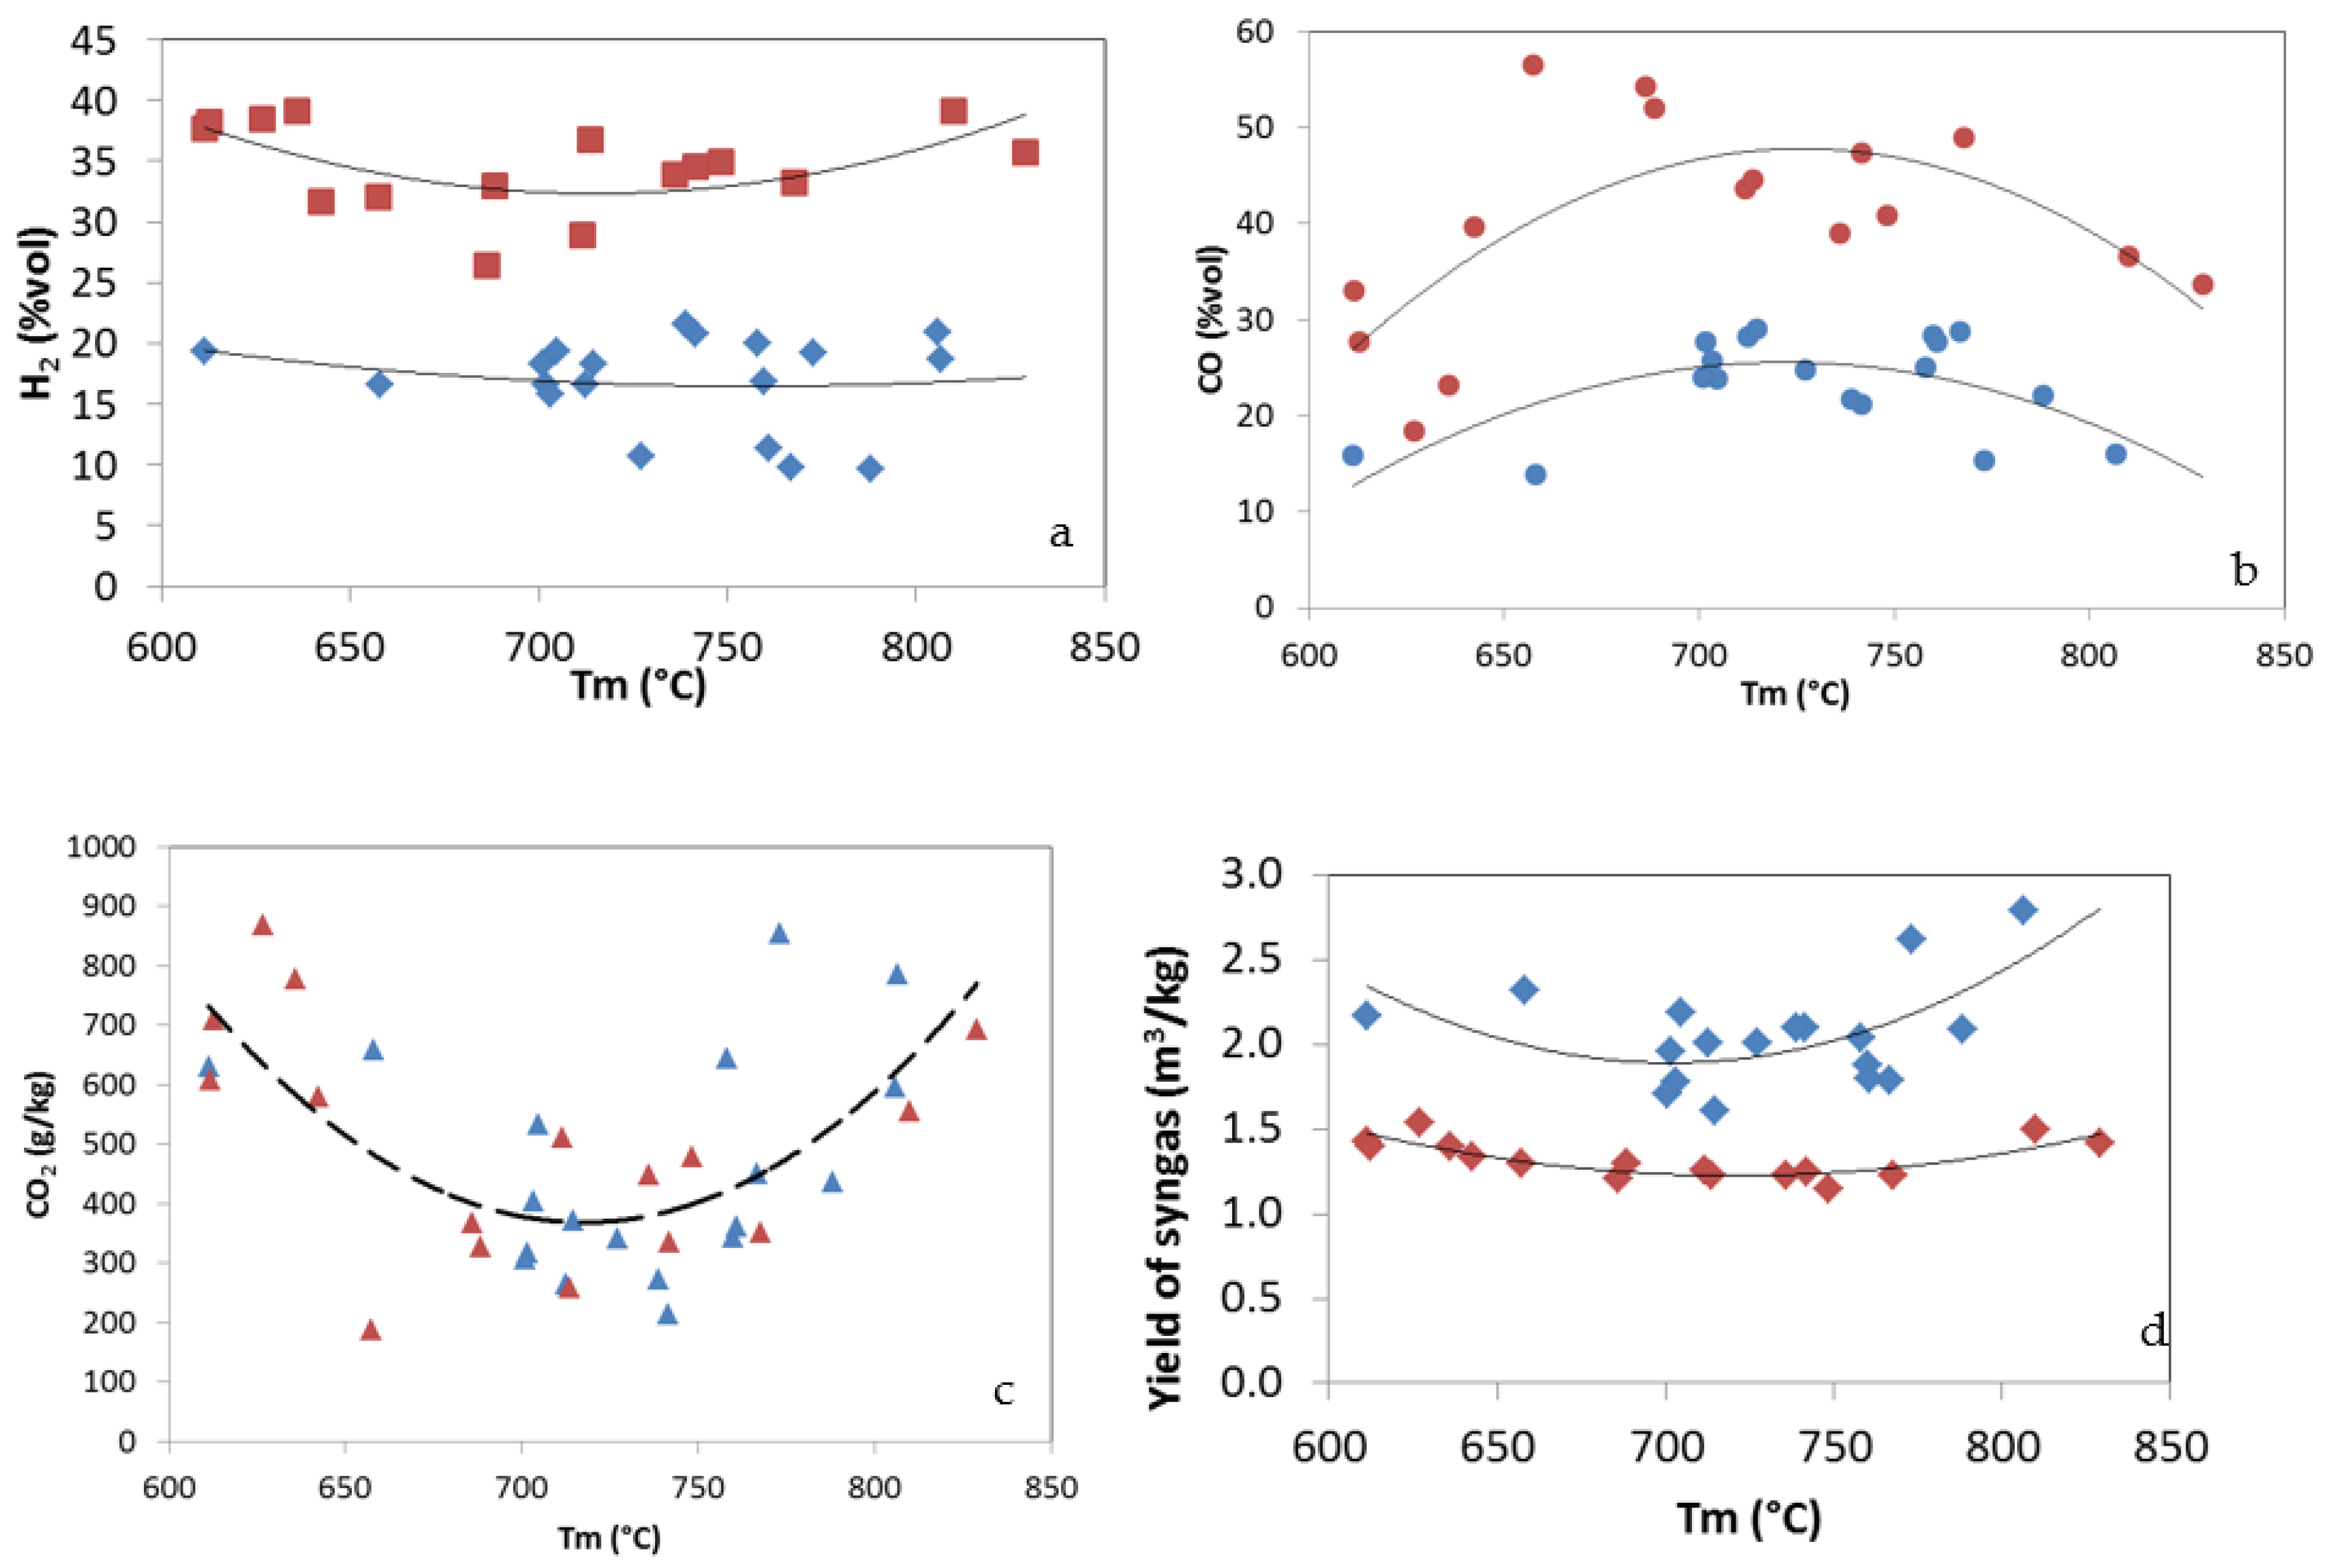
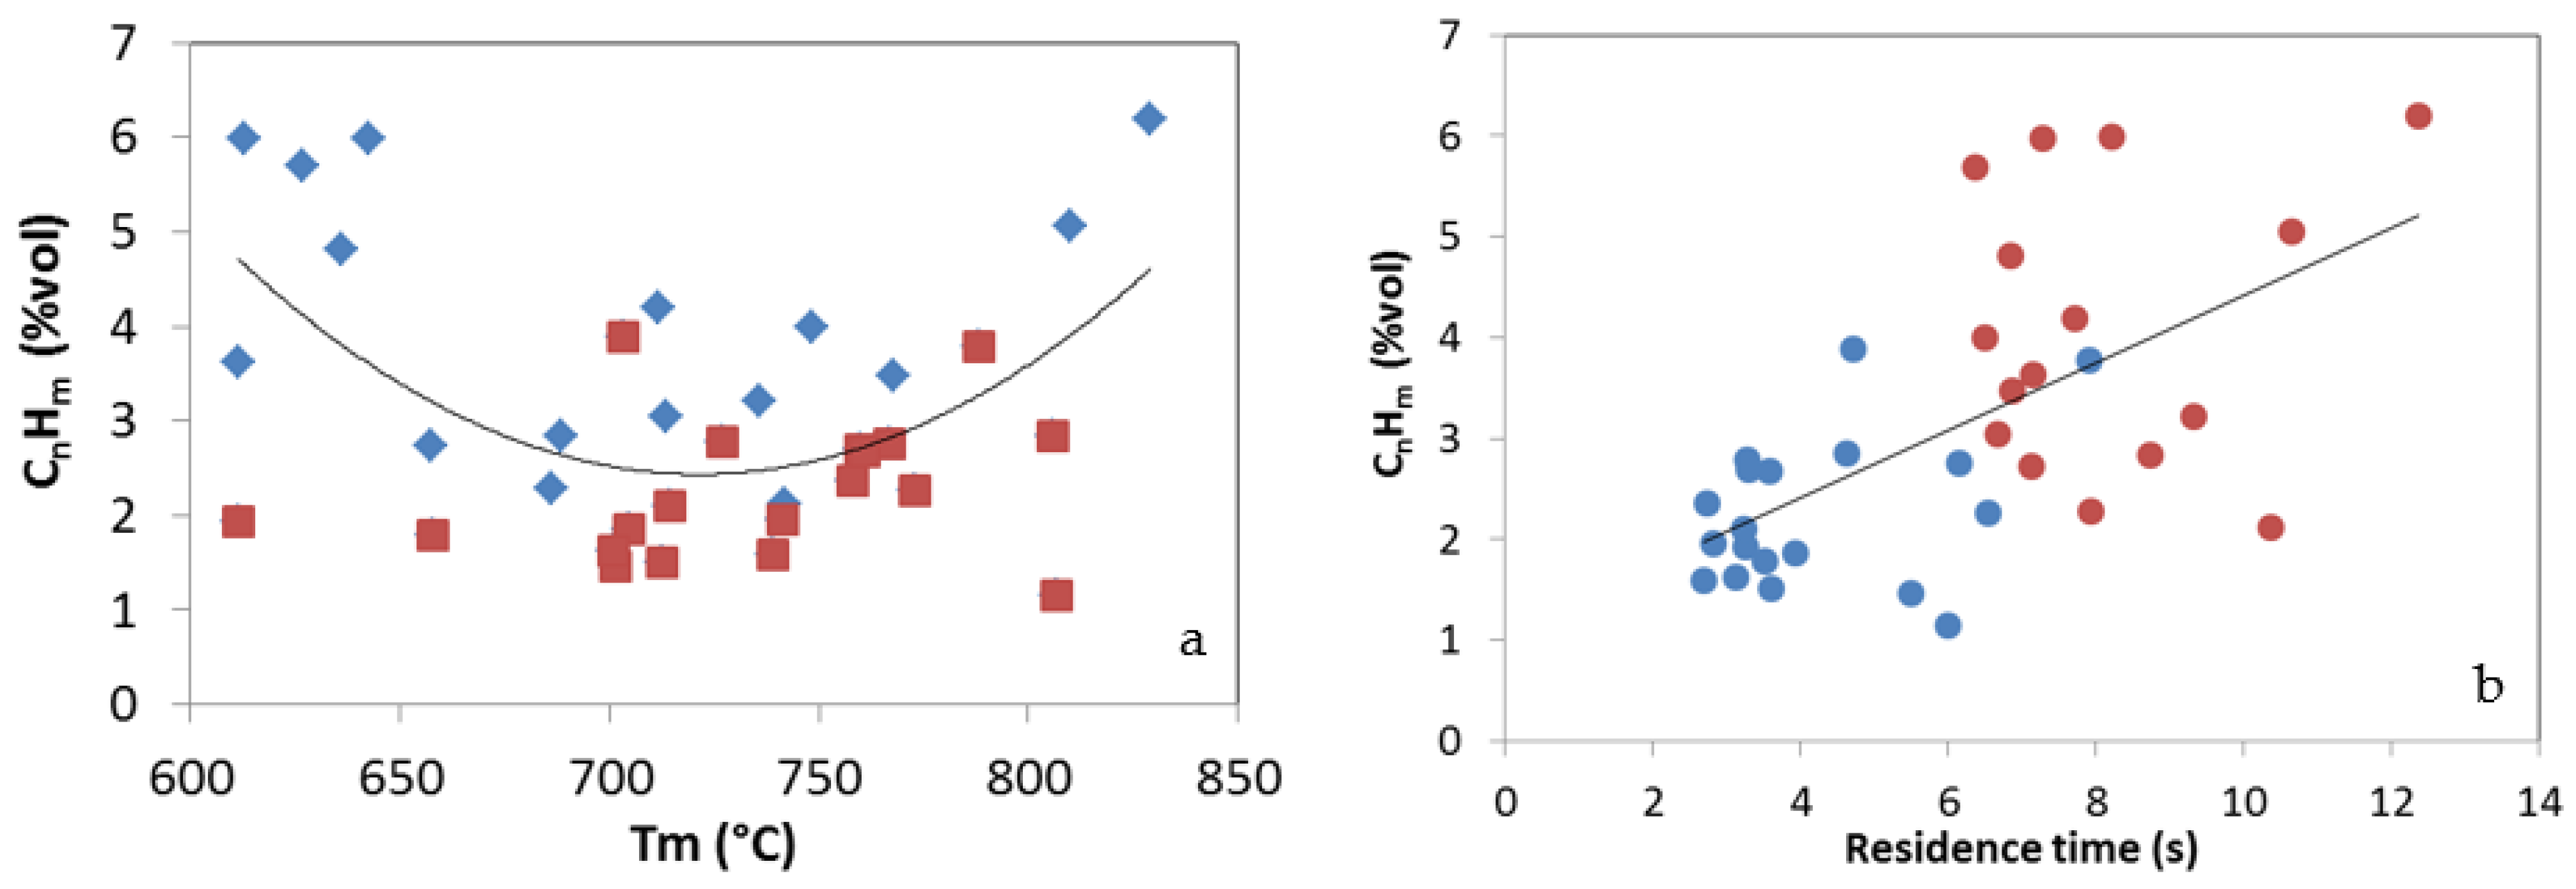
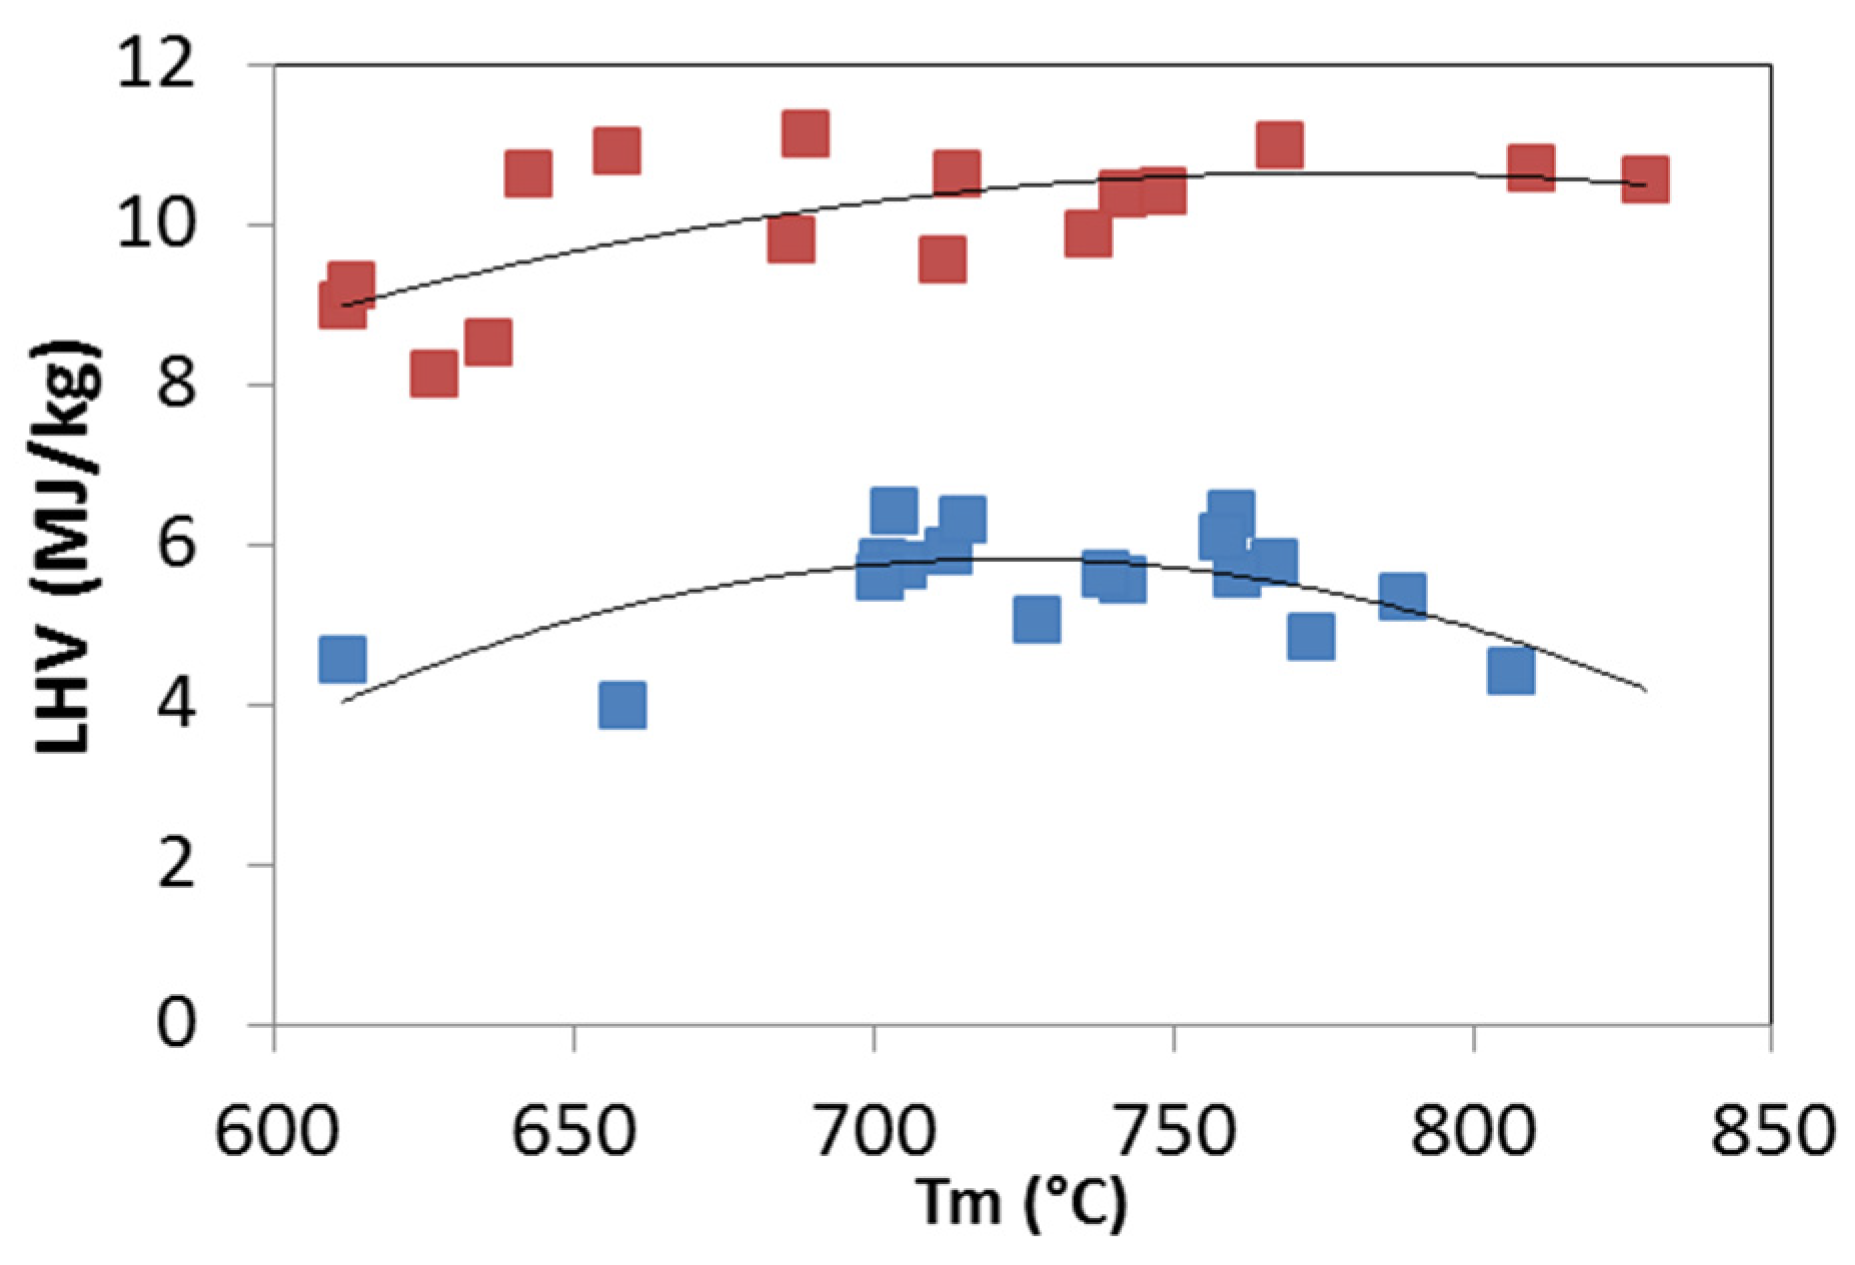
3.2. Effects of Different Values of ER(O2) on Syngas Quality and Yield

The equivalence ratio of combustion ER(O2) plays a key role in biomass gasification [26]. In this study, the countercurrent gasification of several types of biomass was carried out exploring the influence of different air flow rates on temperature profiles, gas composition and yield of ends products. The air flow supplies the O2 required for partial or full combustion of the biomass, including the conversion rate which primarily affects the temperature of the reactive bed gasifier as reported in Figure 5. There are a few interconnected factors that influence the overall process: the temperature factor, the chemical factor (the availability of oxidizing agent) and the fluid dynamic factor (molar and volumetric flow). In particular, as the steady temperature profiles and gas composition are strictly related, the influence of the air flow rate on the gas composition can be derived directly from the corresponding changes in the thermal conditions [35]. Figure 6a shows an initial decrease of H2 content with increasing temperature, or ER(O2), up to 720–730 °C then the H2 content increased gradually, both in the case of air and oxygen gasification. The production of CO showed an opposite trend: it increased to its maximum values at a temperature of 720–730 °C and then decreased (Figure 6b). The H2 and CO production was significantly higher in the tests with oxygen than with air primarily because of the absence of the dilution effect from N2. The yields of the process confirmed these trends (Table 7). Higher ER(O2) favored the combustion and CO2 production which increased with the bed temperature from 730 °C (Figure 6c), however the WGS reaction also contributed to it. Indeed, it is worth to point out how the trend of H2, CO2 and CO appeared complementary according to the predominance of the WGS reaction in the examined range when steam is used as co-gasification medium. The gas yield showed a positive correlation with ER(O2), increasing with the average bed temperature from 710 °C, both in the case of air and oxygen gasification (Figure 6d). The gas yield was in the range of 1.1 m3/kg–1.5 m3/kg during the oxy-gasification with and without the addition of steam, whereas it increased from 1.6 m3/kg to 2.8 m3/kg when using air with and without steam. High temperatures result in high carbon conversion rates thus favoring high gas yields [36]. More specifically, as the air flow rate is increased the gasification process improved because of the more favorable thermal conditions and the larger amounts of CO2. At high air flow more feedstock is burnt and temperature rises, which leads to higher rates of heat transfer, pyrolysis and gasification [35]. For all the tested feedstocks, the tar production showed a complementary trend respect to the yields of gas. This is in agreement with the mass balance as the gasification process chemistry provides only two products, syngas and tar, in addition to the ash. Furthermore, it is well-known that the high operating temperatures promote thermal decomposition of tar which ultimately reduces the tar content and produces more combustible gas. The experimental data showed the negative correlation between tar and incondensable hydrocarbons, like the gas yields (Figure 7). High flow of air inside the gasifier increased the syngas production and reduced the residence time of condensable molecules in the reactive bed. The longer residence time of organic compounds favors cracking and reforming reactions to H2 and incondensable hydrocarbons according to Equation (9). The yield of the organic condensable compounds is an inverse function of residence time and clearly exhibits an opposite trend compared to the production of incondensable hydrocarbons in all the experimental tests performed (Figure 4 vs. Figure 7b). Moreover, the tar content decreased significantly of about 10% for each second of residence in the reactive bed, in the examined ranges, as observed from the equation of the curve interpolating the data in Figure 4. At high ER(O2), the temperatures in the bed increased above 1000 °C, both using air and oxygen as gasifying agents, increasing the risk of ash sintering and agglomeration that can obstruct the gasifier. In the oxy-gasification, the highest temperatures were registered close to the grate, where oxygen was introduced, while using air the highest temperature was measured at about 25 cm above the grate. The addition of steam allowed not only to decrease the temperature but also to shift the highest temperature of the reactive bed at about 30 cm from the grate, in a zone where ash is more dispersed in the char and more difficult to coalesce. From a thermal point of view, the behavior of all tested feedstock appeared complex. The temperature profile along the vertical axis is the result of multiple endothermic and exothermic reactions and depends on heat and mass transfers. The effect of the ER(O2), on the LHV is the same for all feedstocks (Figure 8) using either air or O2. It initially increased with the temperature up to about 730 °C, due to an improvement in char gasification with an increase in CO formation and a reduction in the CO2, then decreased because a bigger amount of the biomass energy is converted in heat of combustion. In the air gasification, with or without steam, the LHV values of syngas were in the range of 4.0 MJ/kg–6.4 MJ/kg. The change of oxidant from air to oxygen increased LHV from 8.13 MJ/kg to 11.1 MJ/kg. The conversion efficiency of energy from solid biomass to gaseous carrier was calculated from experimental data and showed a positive dependence with ER(O2) in the examined range. The gasification with oxygen led to CGE higher than those obtained using air (Table 7).
This finding can be correlated with the lower tar production and lower heat loss in the output stream. The lowest conversion efficiency was observed for air gasification of hydrolytic lignin residues (0.51 in test LA2(20/25)), whereas the oxy-gasification allowed to reach the highest value up to 0.78 (LO5(18/13)). The use of pure oxygen has an added energetic cost even if it is a more suitable gasifying agent to obtain a high gas quality with a greater concentration of H2 and CO and lower tar content. With the available technologies, the current work demand is 0.79 MJ/kg of oxygen [37]. However, even taking this into account, the CGEs result in a reduction of 0.007–0.011, which is relatively low.

4. Conclusions

A thorough survey of the scientific literature clearly revealed an increasing diffusion of fixed bed gasifiers whose characteristics well adapt to integrate these plant in smart grids as power and heat sources, especially in areas rich of lignocellulosic feedstock. Still the knowledge of these systems and their adaptation to the subsequent stages of syngas conversion is not complete. Updraft gasification is far from the equilibrium because of the relatively low temperature in the upper part of the bed and small changes can have dramatic effect on the performances. The data reported in this paper confirm the large ranges of syngas composition and plant performances available even using the same gasifier. The observed variability depended mainly on the type of feedstock and operational parameters. The introduction of steam inside the reactive bed is an efficient way to control the process both in terms of thermal stability and to increase hydrogen production. In the air gasification, with or without steam, the LHV values of syngas were in the range of 4.0 MJ/kg–6.4 MJ/kg. The change of oxidant from air to oxygen increased LHV from 8.13 MJ/kg to 11.1 MJ/kg. The lowest conversion efficiency was observed for air gasification of hydrolytic lignin residues (0.51), whereas the oxy-gasification allowed to reach the highest value up to 0.78. The use of the Equivalence Ratio, ER(H2O), analogous to the well assessed Equivalence Ratio used to describe air and oxy- gasification, ER(O2), can provide a specific tool to gain more insight and better description of the process. Tar production can drastically be reduced below 50 g/kg of feedstock using pretreated (torrefied) biomass, but fluid dynamic also resulted a key parameter to control tar production because in all the examined cases increasing the residence time of the organic molecules in the bed led to tar reduction by cracking and reforming.

Author Contributions

N.C. and F.Z. equally contributed to the paper. All authors have read and agreed to the published version of the manuscript.

Funding

The work has received funding from the European Union’s Horizon 2020 research and innovation programme under grant agreement No 731101.

Institutional Review Board Statement

Not applicable.

Informed Consent Statement

Not applicable.

Data Availability Statement

Table 1, Table 2, Table 3, Table 4, Table 6 and Table 7 and Figure 4 adapted with permission from ref [19]. Energy & Fuels, Copyright (2016) American Chemical Society; ref [21]. Fuel Process. Technol. Copyright (2017) Elsevier; ref [22]. Energies Copyright (2018) MDPI.

Acknowledgments

The authors thank Colomba Di Blasi of the University of Naples for the useful discussion of the experimental data.

Conflicts of Interest

The authors declare no conflict of interest.

References

  1. Segurado, R.; Pereira, S.; Correia, D.; Costa, M. Techno-economic analysis of a trigeneration system based on biomass gasification. Renew. Sustain. Energy Rev. 2019, 103, 501–514. [Google Scholar] [CrossRef]
  2. Kozlov, A.N.; Tomin, N.V.; Sidorov, D.N.; Lora, E.E.S.; Kurbatsky, V.G. Optimal Operation Control of PV-Biomass Gasifier-Diesel-Hybrid Systems Using Reinforcement Learning Techniques. Energies 2020, 13, 2632. [Google Scholar] [CrossRef]
  3. Kozlov, A.; Marchenko, O.; Solomin, S. The Modern State of Wood Biomass Gasification Technologies and Their Economic Efficiency. Energy Procedia 2019, 158, 1004–1008. Available online: http://creativecommons.org/licenses/by-nc-nd/4.0 (accessed on 24 April 2021). [CrossRef]
  4. Di Blasi, C. Modeling wood gasification in a countercurrent fixed-bed reactor. AIChE J. 2004, 50, 2306–2319. [Google Scholar] [CrossRef] [Green Version]
  5. Mandl, C.; Obernberger, I.; Biedermann, F. Modelling of an updraft fixed-bed gasifier operated with softwood pellets. Fuel 2010, 89, 3795–3806. [Google Scholar] [CrossRef]
  6. Ferreira, S.; Monteiro, E.; Brito, P.; Vilarinho, C. A Holistic Review on Biomass Gasification Modified Equilibrium Models. Energies 2019, 12, 160. [Google Scholar] [CrossRef] [Green Version]
  7. Nowicki, L.; Siuta, D.; Markowski, M. Pyrolysis of Rapeseed Oil Press Cake and Steam Gasification of Solid Residues. Energies 2020, 13, 4472. [Google Scholar] [CrossRef]
  8. Nowicki, L.; Siuta, D.; Markowski, M. Carbon Dioxide Gasification Kinetics of Char from Rapeseed Oil Press Cake. Energies 2020, 13, 2318. [Google Scholar] [CrossRef]
  9. Umeki, K.; Namioka, T.; Yoshikawa, K. Analysis of an updraft biomass gasifier with high temperature steam using a numerical model. Appl. Energy 2012, 90, 38–45. [Google Scholar] [CrossRef]
  10. Kardaś, D.; Kluska, J.; Kazimierski, P. The course and effects of syngas production from beechwood and RDF in updraft reactor in the light of experimental tests and numerical calculations. Therm. Sci. Eng. Prog. 2018, 8, 136–144. [Google Scholar] [CrossRef]
  11. Barman, N.S.; Ghosh, S.; De, S. Gasification of biomass in a fixed bed downdraft gasifier—A realistic model including tar. Bioresour. Technol. 2012, 107, 505–511. [Google Scholar] [CrossRef]
  12. Manera, C.; Perondi, D.; Barcellos, T.; & Godinho, M. CO2 gasification of elephant grass: Effect of Ni/mayenite catalyst on dry reforming of tar. Biomass Bioenergy 2020, 143, 105829. [Google Scholar] [CrossRef]
  13. Ismail, T.M.; El-Salam, M.A. Parametric studies on biomass gasification process on updraft gasifier high temperature air gasification. Appl. Therm. Eng. 2017, 112, 1460–1473. [Google Scholar] [CrossRef]
  14. James, A.M.; Yuan, W.; Boyette, M.D.; Wang, D. The effect of air flow rate and biomass type on the performance of an updraft biomass gasifier. BioResources 2015, 10, 3615–3624. [Google Scholar] [CrossRef]
  15. Kihedu, J.H.; Yoshiie, R.; Naruse, I. Performance indicators for air and air–steam auto-thermal updraft gasification of biomass in packed bed reactor. Fuel Process. Technol. 2016, 141, 93–98. [Google Scholar] [CrossRef]
  16. Oveisi, E.; Sokhansanj, S.; Lau, A.; Lim, J.; Bi, X.; Preto, F.; Mui, C. Characterization of Recycled Wood Chips, Syngas Yield, and Tar Formation in an Industrial Updraft Gasifier. Environ. 2018, 5, 84. [Google Scholar] [CrossRef] [Green Version]
  17. Vidian, F.; Surjosatyo, A.; Nugroho, Y.S. Thermodynamic Model for Updraft Gasifier with External Recirculation of Pyrolysis Gas. J. Combust. 2016, 2016, 1–6. [Google Scholar] [CrossRef]
  18. Paulauskas, R.; Zakarauskas, K.; Striūgas, N. An Intensification of Biomass and Waste Char Gasification in a Gasifier. Energies 2021, 14, 1983. [Google Scholar] [CrossRef]
  19. Cerone, N.; Zimbardi, F.; Villone, A.; Strjiugas, N.; Kiyikci, E.G. Gasification of Wood and Torrefied Wood with Air, Oxygen, and Steam in a Fixed-Bed Pilot Plant. Energy Fuels 2016, 30, 4034–4043. [Google Scholar] [CrossRef]
  20. Cerone, N.; Zimbardi, F.; Contuzzi, L.; Alvino, E.; Carnevale, M.O.; Valerio, V. Updraft Gasification at Pilot Scale of Hydrolytic Lignin Residue. Energy Fuels 2014, 28, 3948–3956. [Google Scholar] [CrossRef]
  21. Cerone, N.; Zimbardi, F.; Contuzzi, L.; Prestipino, M.; Carnevale, M.O.; Valerio, V. Air-steam and oxy-steam gasification of hydrolytic residues from biorefinery. Fuel Process. Technol. 2017, 167, 451–461. [Google Scholar] [CrossRef]
  22. Cerone, N.; Zimbardi, F. Gasification of Agroresidues for Syngas Production. Energies 2018, 11, 1280. [Google Scholar] [CrossRef] [Green Version]
  23. Liakakou, E.; Vreugdenhil, B.; Cerone, N.; Zimbardi, F.; Pinto, F.; André, R.; Marques, P.; Mata, R.; Girio, F. Gasification of lignin-rich residues for the production of biofuels via syngas fermentation: Comparison of gasification technologies. Fuel 2019, 251, 580–592. [Google Scholar] [CrossRef]
  24. Sansaniwal, S.; Rosen, M.; Tyagi, S. Global challenges in the sustainable development of biomass gasification: An overview. Renew. Sustain. Energy Rev. 2017, 80, 23–43. [Google Scholar] [CrossRef]
  25. Ahmad, A.A.; Zawawi, N.A.; Kasim, F.H.; Inayat, A.; Khasri, A. Assessing the gasification performance of biomass: A review on biomass gasification process conditions, optimization and economic evaluation. Renew. Sustain. Energy Rev. 2016, 53, 1333–1347. [Google Scholar] [CrossRef]
  26. Sikarwar, V.S.; Zhao, M.; Fennell, P.S.; Shah, N.; Anthony, E.J. Progress in biofuel production from gasification. Prog. Energy Combust. Sci. 2017, 61, 189–248. [Google Scholar] [CrossRef]
  27. Saravanakumar, A.; Haridasan, T.; Reed, T.B.; Bai, R.K. Experimental investigation and modelling study of long stick wood gasification in a top lit updraft fixed bed gasifier. Fuel 2007, 86, 2846–2856. [Google Scholar] [CrossRef]
  28. Arena, U. Process and technological aspects of municipal solid waste gasification. A review. Waste Manag. 2012, 32, 625–639. [Google Scholar] [CrossRef] [PubMed]
  29. Narváez, I.; Orío, A.; Aznar, M.P.; Corella, J. Biomass Gasification with Air in an Atmospheric Bubbling Fluidized Bed. Effect of Six Operational Variables on the Quality of the Produced Raw Gas. Ind. Eng. Chem. Res. 1996, 35, 2110–2120. [Google Scholar] [CrossRef]
  30. Seggiani, M.; Vitolo, S.; Puccini, M.; Bellini, A. Cogasification of sewage sludge in an updraft gasifier. Fuel 2012, 93, 486–491. [Google Scholar] [CrossRef]
  31. Wang, L.; Weller, C.L.; Jones, D.D.; Hanna, M.A. Contemporary issues in thermal gasification of biomass and its application to electricity and fuel production. Biomass Bioenergy 2008, 32, 573–581. [Google Scholar] [CrossRef]
  32. Czernik, S.; Bridgwater, A.V. Overview of Applications of Biomass Fast Pyrolysis Oil. Energy Fuels 2004, 18, 590–598. [Google Scholar] [CrossRef]
  33. Lindfors, C.; Paasikallio, V.; Kuoppala, E.; Reinikainen, M.; Oasmaa, A.; Solantausta, Y. Co-processing of Dry Bio-oil, Catalytic Pyrolysis Oil, and Hydrotreated Bio-oil in a Micro Activity Test Unit. Energy Fuels 2015, 29, 3707–3714. [Google Scholar] [CrossRef]
  34. Kumar, A.; Jones, D.D.; Hanna, M.A. Thermochemical Biomass Gasification: A Review of the Current Status of the Technology. Energies 2009, 2, 556–581. [Google Scholar] [CrossRef] [Green Version]
  35. Di Blasi, C.; Signorelli, A.G.; Portoricco, G. Countercurrent Fixed-Bed Gasification of Biomass at Laboratory Scale. Ind. Eng. Chem. Res. 1999, 38, 2571–2581. [Google Scholar] [CrossRef]
  36. Gao, N.; Li, A.; Quan, C.; Gao, F. Hydrogen-rich gas production from biomass steam gasification in an updraft fixed-bed gasifier combined with a porous ceramic reformer. Int. J. Hydrogen Energy 2008, 33, 5430–5438. [Google Scholar] [CrossRef]
  37. Hashim, S.; Mohamed, A.; Bhatia, S. Oxygen separation from air using ceramic-based membrane technology for sustainable fuel production and power generation. Renew. Sustain. Energy Rev. 2011, 15, 1284–1293. [Google Scholar] [CrossRef]
Figure 1. Scheme of the updraft gasifier.
Energies 14 02675 g001
Figure 2. H2 content in the syngas produced from the various feedstocks as function of the equivalence ratio ER(H2O), in the upper part of the plot are reported the experimental data of the oxy-gasification; in the lower part those of the air-gasification.
Energies 14 02675 g002
Figure 3. Yield of tar as function of the equivalence ratio ER(H2O).
Energies 14 02675 g003
Figure 4. Yield of tar as function of residence time of the syngas in the bed.
Energies 14 02675 g004
Figure 5. Average temperature in the reactive bed as function of the equivalence ratio ER(O2).
Energies 14 02675 g005
Figure 6. Content of H2 (a), CO (b) and CO2 (c) in the syngas and yield of syngas (d) as function of average temperature in the reactive bed. Red symbols correspond to the experimental data of the oxy-gasification; blue symbols data of the air-gasification.
Energies 14 02675 g006
Figure 7. Incondensable hydrocarbons content of syngas as function of the bed average temperature Tm (a) and of the residence time of the syngas in the bed (b). (CnHm is the sum of CH4, C2H6, C3H8). Red symbols correspond to the experimental data of the oxy-gasification; blue symbols data of the air-gasification.
Energies 14 02675 g007
Figure 8. Low heating value of the syngas as function of the average temperature in the bed. Red symbols correspond to the experimental data of the oxy-gasification; blue symbols data of the air-gasification.
Energies 14 02675 g008
Table 1. Elemental composition of the feedstocks (% mass) [19,21,22].
BiomassC%H%N%O% *
Wood Eucalyptus (WE)48.16.30.341.7
Torriefied Eucalyptus (TE)51.75.90.337.6
Torriefied Spruce (TS)54.86.31.037.5
Hydrolytic Lignin (L)49.56.061.234.0
Almond shells (A)47.96.30.3645.4
Hazelnut shells (N)50.56.641.740.0
* by difference = 100 − (C% + H% + N% + ash).
Table 2. Biochemical composition of the feedstocks (% dry weight) [19,21,22].
BiomassHexosans%Pentosans%Lignin (Klason)%Lignin (Klason) ac. sol.%
Wood Eucalyptus (WE)37.528.328.0nd
Torriefied Eucalyptus (TE)32.99.9646.6nd
Torriefied Spruce (TS)44.61.1444.8nd
Hydrolytic Lignin (L)36.74.047.52.45
Almond shells (A)31.228.030.21.98
Hazelnut shells (N)22.212.240.91.30
Table 3. Physical characteristics and proximate analysis [19,21,22].
BiomassDensity (kg/m3)Moisture%Volatile%Fix Carbon%Ash%LHV (MJ/kg)HHV (MJ/kg)
Wood Eucalyptus (WE)18813.9888.43.616.818.2
Torriefied Eucalyptus (TE)2746.179.715.15.218.820.2
Torriefied Spruce (TS)1736.576.6230.418.920.6
Hydrolytic Lignin (L)3725.866.123.110.818.118.9
Almond shells (A)41711.880.618.21.218.119.5
Hazelnut shells (N)2995.078.020.91.117.819.4
Table 4. Gasification properties of residues [19,21,22].
BiomassO2 for Combustion kg/kgAir for Combustion kg/kgH2O for Oxidation kg/kg
Wood Eucalyptus (WE)1.124.860.502
Torriefied Eucalyptus (TE)1.255.420.721
Torriefied Spruce (TS)1.596.870.80
Hydrolytic Lignin (L)1.476.381.11
Almond shells (A)1.335.750.93
Hazelnut shells (N)1.406.081.06
Table 5. Main reactions of gasification.
PhaseReactionStoichiometryEnthalpy
PyrolysisCHxOy ↔ H2 + CO + CH4 + CO2 + H2O + Tar + Cgraphite
ReductionBouduard reactionC(graphite) + CO2 ↔ 2CO∆H = 172.6 kJ/mol
Water gas reactionC(grafite) + H2O ↔ CO + H2∆H = 131.4 kJ/mol
Water Gas ShiftCO + H2O ↔ CO2 + H2∆H = −41.2 kJ/mol
C-MethanationC + 2H2 ↔ CH4∆H = −78.84 kJ/mol
Steam reformingCH4 + H2O ↔ CO2 + 3H2∆H = 206 kJ/mol
CO-MethanationCO + 3 H2 ↔ CH4 + H2O∆H = −206 kJ/mol
CO2-MethanationCO2 + 4 H2 ↔ CH4 + 2 H2O∆H = −165 kJ/mol
OxydationCombustionC(graphite) + O2 ↔ CO2∆H = −393.5 kJ/mol
Partial combustionC(graphite) + ½ O2 ↔ CO∆H = −110.5 kJ/mol
Tar decompositionReformingCnHx + mH2O ↔ nCO +(m + x/2)H2
Thermal crackingCnHx ↔ nC + (x/2)H2for n = 1, ∆H = 74.9 kJ/mol
Table 6. Experimental matrix and gasification parameters [19,21,22].
Experiment Code aBiomassOxidantFeeding Rate kg (dry)/hParticle Residence Time, hAir kg/hO2 kg/hER (O2) kg/kgSteam kg/hER (H2O) kg/kgAverage T in Bed, °CGas Residence Time b, s
WE1(25/24)Eucal. woodAir and steam15.00.8918.00.00.253.50.247025.51
WE2(24/31)Eucal. woodOxygen and steam15.00.890.04.00.244.50.3174210.4
WE3(24/40)Eucal. woodOxygen and steam15.00.890.04.00.245.80.407369.34
TE1(24/17)Torrefied Eucal. Air and steam18.81.0924.00.00.243.70.177053.93
TE2(23/19)Torrefied Eucal.Oxygen and steam18.81.090.05.50.234.00.196888.73
TE3(23/24)Torrefied Eucal. Oxygen and steam18.81.090.05.50.235.00.246428.22
TS1(23)Torrefied SpruceAir 9.41.4314.00.00.230.00.007887.92
TS2(23/22)Torrefied SpruceAir and steam9.41.4314.00.00.232.50.228076.00
TS3(23/26)Torrefied SpruceAir and steam9.41.4314.00.00.233.00.267736.55
TS4(25/20)Torrefied SpruceOxygen and steam12.21.100.04.00.253.00.2082912.4
TS5(25/27)Torrefied SpruceOxygen and steam12.21.100.04.00.254.00.2781010.7
LA1(22/41)LigninAir and steam18.81.6626.50.00.228.50.416113.2
LA2(20/25)LigninAir and steam14.72.12190.00.204.00.256583.5
LAS(22)LigninAir 18.01.7325.50.00.22007273.3
LO1(22/30)LigninOxygen and steam17.01.830.05.50.225.50.306276.4
LO2(20/25)LigninOxygen and steam17.01.830.04.00.204.50.256366.9
LOS1(22)LigninOxygen17.01.830.05.50.22006867.9
LO3(18/5)LigninOxygen and steam17.01.830.04.50.181.00.056127.2
LOS2(18)LigninOxygen 17.01.830.04.50.18007127.7
LO4(18/25)LigninOxygen and steam17.01.830.04.50.184.50.256137.3
LO5(18/13)LigninOxygen and steam171.804.50.182.50.136577.1
NA1(19/28)Hazelnut shellsAir and steam16.31.5218.90.00.194.800.287034.72
NA2(24/22)Hazelnut shellsAir and steam20.41.2229.30.00.244.800.227603.31
NA3(22/18)Hazelnut shellsAir and steam20.41.2227.10.00.224.000.187133.60
NO1(28/23)Hazelnut shellsOxygen and steam20.41.220.08.00.285.000.237686.86
NO2(28/28)Hazelnut shellsOxygen and steam20.41.220.08.00.286.000.287146.67
MAS1(24)Almond shellsAir 12.42.8116.70.00.240.000.007676.16
MAS2(24)Almond shellsAir 21.21.6428.80.00.240.000.007613.59
MA1(22/24)Almond shellsAir and steam22.41.5728.90.00.225.000.247013.12
MA2(24/28)Almond shellsAir and steam21.21.5729.80.00.245.500.287412.82
MA3(22/19)Almond shellsAir and steam22.41.5429.00.00.224.000.197153.24
MA4(24/25)Almond shellsAir and steam22.11.5731.00.00.245.200.257582.74
MA5(25/30)Almond shellsAir and steam21.61.4831.50.00.256.000.307392.68
MO1(23/28)Almond shellsOxygen and steam21.21.640.06.50.235.500.287486.50
MAO(27/23)Almond shellsEnriched air and steam21.21.649.15.50.274.500.238064.63
a WE1(25/24) means that test 1 of Eucalyptus wood gasification was carried out with air at ER(O2) 0.25 and ER(H2O) 0.24; b Calculated from the average temperature of the bed, the true density of lignocellulosic of 1530 kg/m3 and its void fraction (see data of Table 1), and the average molar flow (see Table 4).
Table 7. Process yields per kg of dry feedstock and plant performances [19,21,22].
Experiment CodeH2 g/kgCO g/kgCO2 g/kgCnHm g/kgSyngas a STP m3/kgLHW MJ/m3Density kg/STPm3CGE%Net CGE%CLE%Net CLE%Plant Power b kWth
WE1(25/24)24.356531819.11.965.791.125755292847.3
WE2(24/31)35.668433518.51.2510.40.967269161553.9
WE3(24/40)29.948144928.71.239.891.025956272650.6
TE1(24/17)37.564853331.32.195.751.116766141465.9
TE2(23/19)40.389232631.91.311.10.9582804375.7
TE3(23/24)37.465857962.11.3410.61.0276735574.3
TS1(23)20.265043674.02.095.351.1967674429.1
TS2(23/22)52.462878628.62.794.421.1274727732.0
TS3(23/26)51.557685454.12.624.841.1278754432.9
TS4(25/20)46.761469375.71.4210.50.9982806650.6
TS5(25/27)51.367155558.81.510.70.928481111154.1
LA1(22/41)3540262932.22.174.541.060.540.510.200.1951
LA2(20/25)3237265733.32.324.001.090.510.480.210.2038
LAS(22)1857834143.52.005.081.100.560.560.190.1951
LO1(22/30)4933086865.41.548.130.950.690.660.110.1059
LO2(20/25)4537777853.11.408.530.940.660.630.130.1256
LOS1(22)2676136619.41.219.820.980.650.650.090.0956
LO3(18/5)4555060738.01.438.970.910.710.700.110.1061
LOS2(18)3162951038.61.259.560.990.640.640.090.0955
LO4(18/25)4445070960.11.409.220.920.710.680.100.1061
LO5(18/13)3584218728.71.3010.90.90.780.770.100.0967
NA1(19/28)24.856440355.081.776.431.140.640.610.190.1852
NA2(24/22)25.867334238.661.886.370.950.660.640.250.2468
NA3(22/18)29.469926524.032.015.901.090.660.640.230.2267
NO1(28/23)36.174435232.961.2311.00.920.760.730.170.1777
NO2(28/28)39.767525727.781.2210.61.100.730.700.190.1874
MAS1(24)15.363545140.41.785.760.980.570.570.110.1135
MAS2(24)18.161536033.91.795.621.110.560.560.130.1359
MA1(22/24)27.650830622.21.715.591.190.530.510.270.2759
MA2(24/28)38.554821328.62.095.561.050.640.620.130.1368
MA3(22/19)25.957737123.81.616.321.180.560.550.280.2763
MA4(24/25)35.963064334.02.036.101.110.690.660.150.1476
MA5(25/30)40.056427325.62.105.621.090.650.630.110.1171
MO1(23/28)35.558047936.81.1510.411.100.660.640.200.1970
MAO(27/23)25.770459531.31.398.461.100.650.630.190.1869
a Clean and dry. b As thermal output in clean syngas.
Table 8. Yields of H2, CO and CO2 per kg of dry feedstock as function of the equivalence ratio ER(H2O).
ER (O2)ER (H2O)H2 g/kgCO g/kgCO2 g/kgSyngas m3/kg H2/CO
TS10.230206504362.090.44
TS30.230.26525768542.621.25
LAS(22)0.220185783412.000.43
LA1(22/41)0.220.41354026292.171.21
LOS1(22)0.220267613661.210.49
LO1(22/30)0.220.30493308681.542.08
LOS2(18)0.180316295101.250.66
LO4(18/25)0.180.25444507091.401.38
MAS1(24)0.240156354511.780.34
MA4(24/25)0.240.25366306432.030.80
Publisher’s Note: MDPI stays neutral with regard to jurisdictional claims in published maps and institutional affiliations.

