Article

Modeling, Control System Design and Preliminary Experimental Verification of a Hybrid Power Unit Suitable for Multirotor UAVs

1
Department of Robotics and Production System Automation, Faculty of Mechanical Engineering and Naval Architecture, University of Zagreb, 10000 Zagreb, Croatia
2
Department of Technology, Faculty of Mechanical Engineering and Naval Architecture, University of Zagreb, 10000 Zagreb, Croatia
3
Department of Mechanical Engineering, Karlovac University of Applied Sciences, 47000 Karlovac, Croatia
*
Author to whom correspondence should be addressed.
Energies 2021, 14(9), 2669; https://doi.org/10.3390/en14092669
Submission received: 27 February 2021 / Revised: 3 April 2021 / Accepted: 30 April 2021 / Published: 6 May 2021
(This article belongs to the Special Issue Modeling and Control of Hybrid Electric Vehicles)

Abstract

:
A key drawback of multirotor unmanned aerial vehicles (UAVs) with energy sources based solely on electrochemical batteries is related to the available on-board energy. Flight autonomy is typically limited to 15–30 min, with a flight duration upper limit of 90 min currently being achieved by high-performance battery-powered multirotor UAVs. Therefore, propulsion systems that utilize two or more different energy sources (hybrid power systems) may be considered as an alternative in order to increase the flight duration while retaining key performance benefits of battery energy storage use. The research presented in this work considers a multirotor UAV power unit, based on the internal combustion engine (ICE) powering an electricity generator (EG) connected to the common direct current (DC) bus in parallel with the lithium-polymer (LiPo) battery, and the respective modeling and identification of individual power unit subsystem, along with the dedicated control system design. Experimental verification of the proposed hybrid power unit control system has been carried out on the custom-build power unit prototype. The results show that the proposed control system combines the two power sources in a straightforward and effective way, with subsequent analysis showing that a two-fold energy density increase can be achieved with a hybrid energy source, consequently making it possible to achieve higher flight autonomy of the prospective multirotor (hover load around 1000–1400 W) equipped with such a hybrid system.

Graphical Abstract

1. Introduction

Advances in electronics, materials, and production techniques have allowed for the manufacture of powerful and compact electric motors, high power electrochemical batteries, integrated sensor arrays, and versatile flight controllers suitable for multirotor unmanned aerial vehicle (UAV) applications. However, the key downside of multirotor UAVs is their inherently limited flight endurance and useful range which are directly related to the aircraft take-off mass (aircraft and payload mass combined) and battery charge and energy capacity. A fully electric multirotor powered by batteries, currently being the most widespread multirotor design, is typically characterized by a flight autonomy between 15 and 30 min, with a flight duration of 90 min currently being achieved by high-performance battery-powered multirotor UAVs.
The initial motivation of this research was to alleviate the aforementioned drawbacks of energy sources based purely on electrochemical batteries, by utilizing an alternative propulsion system combining an internal combustion engine (ICE) coupled with the electricity generator (EG) and augmented with a lithium-polymer (LiPo) battery, thus forming a hybrid power unit suitable for multirotor UAV use. Due to the specific energy density of gasoline fuel (about 12 kWh/kg) being practically two orders of magnitude greater than the specific energy density currently available with state-of-the-art lithium polymer (LiPo) batteries (ranging about 0.2–0.5 kWh/kg) [1], it is expected that the use of a hybrid power unit can facilitate considerable improvements in flight endurance and useful range of such multirotor UAV.
Hybrid propulsion is nowadays typically found in road vehicles and rail transport, as shown by analyses presented in [2,3] Since land-based vehicle motion is two dimensional, with gravity-related constraints being much less emphasized compared to those of aerial vehicles, hybrid propulsion system implementation for multirotor-based UAVs would pose a significantly greater challenge, which represents an additional motivation to investigate the proposed research topic.
Hence, the problem of multirotor UAV flight autonomy is actively investigated field and different power system configurations are currently being researched with the aim of satisfying low power consumption, low mass, and high output power density requirements. In a majority of cases, hybrid propulsion system research is conducted for standard fixed-wing and vertical takeoff and landing (VTOL) fixed-wing hybrid [4,5], and some other types such as dirigible UAV [6,7]. A detailed analysis of synergetic effects for various classes of UAVs is given in [8] by applying the multi-objective optimization, where results have shown that hybrid-electric configuration has the potential to give a strong contribution to aircraft performance. Moreover, by investigating the behavior of different power sources within the UAV hybrid-electric propulsion system through simulations in order to predict the hybrid electric power system behavior using bench tests, the feasibility and efficiency of the onboard UAV power system can be assessed before the final flight test phase [9]. Also, a comparison of five different UAV power-train options has been investigated in [9] using simulations. These alternatives included (i) a free-piston engine with integrated linear EG, (ii) advanced lithium-ion batteries, (iii) ICE with the embedded rotary EG, (iv) a parallel hybrid power-train configuration with ICE, and (v) the proton exchange membrane fuel cell.
Hybrid-electric propulsion system using an ICE has been researched in [10], with reference [11] further analyzing some realistic challenges related to ICE use in hybrid-electric propulsion systems. These included acoustic noise and associated mechanical vibrations, engine cooling issues, and their implications to the operation of a compact power unit comprising a small–scale ICE equipped with suitably sized EG. In particular, it has been shown that for such a small ICE, a powerful and complex vibration pattern can be obtained, and it cannot be easily related to engine crankshaft rotation or linear piston motion.
Reference [12] investigates the potential of hydrogen fuel cell stacks as an alternative power source to ICE in small UAVs. The investigation was based on the commercial “Aeropack” hybrid power supply consisting of a fuel cell stack and a battery pack. The functionality of such a fuel-cell battery hybrid power system has been successfully demonstrated during a flight test of the target prototype UAV.
References [13,14] show that photovoltaic power is mostly suitable for fixed-wing UAVs, primarily as an auxiliary power source.
Additionally, UAV hybrid power source research and development efforts have resulted in several patents [15,16,17], which, unfortunately, do not present detailed information about control system design, which is crucial for the implementation of such hybrid power sources. Some other literature sources, such as reference [18], present the development of a 1 kW hybrid electric power train along with its characterization and performance testing. An interesting approach is given in reference [19], dealing with a dual power design concept, where UAV motion control is performed through commonly used brushless motors driving a set of auxiliary propellers, while the major portion of UAV lifting power is provided by a gasoline engine-powered main propeller system.
Taking into account the above issues related to specific energy density, mass, ease of operation and performance, and price and availability, hybrid propulsion of multirotor UAV’s based on an ICE coupled to an EG and utilizing a battery energy storage system as auxiliary power supply should provide many attractive research challenges in the field, while simultaneously opening new research frontiers which might ultimately improve knowledge levels in multiple research sub-areas [20].
Even though internal combustion engines are frequently used for light model aircraft propulsion, their controls are not a frequently discussed topic in the more recent research literature. In order to model the highly nonlinear nature of the internal combustion engine dynamics, the so-called mean-value engine model (MVEM) is typically used as a basis for engine speed controller design, wherein PI and PID controllers can be optimized for different engine speed-torque operating points [21].
For example, in [22] a PI controller with feed-forward load compensator is considered for engine speed control within the UAV hybrid propulsion, which may utilize available generator-based measurements (current and voltage) to establish a speed-sensorless feedback loop, or, alternatively, the readily available low-precision Hall-sensor position measurements can be used for that purpose [23], with Kalman filtering used in both cases to provide a relatively smooth and precise engine speed estimate.
In reference [24] the three different hybrid-electric power-plant configurations are considered and dynamic models are derived, with flight dynamics performance testing carried out on a UAV prototype.
A good review of current hybrid-electric propulsion systems (HEPS) for fixed-wing aircraft can be found in [25]. A generic hybrid propulsion system based on DC-AC inverter plus PMSM machine has been presented and modeled in reference [26], wherein a BLDC generator plus active front end rectifier has been considered as a viable alternative to electric power source hybrid-propulsion UAV in [27]. In the latter case, using PI and PID controllers has shown favorable engine speed and DC bus voltage control system performance.
An alternative to active rectification of speed-dependent generator voltage has been researched in [28], wherein a parallelized array of low-cost DC/DC power converters and battery energy storage have been used in conjunction with passive diode rectifier to maintain the fixed voltage at the common DC bus within the UAV.
In order to determine the optimal hybrid power-train configuration and required hybrid propulsion system components, a parameter matching method has been proposed in [29] wherein the correlation between rotor-based propulsion power demands and the hybrid power system requirements have been identified, with test results confirming the accuracy of the proposed parameter matching method.
Having the aforementioned in mind, this paper proposes a straightforward approach to modeling, identification, and control system design for multirotor UAV power unit system based on ICE coupled with the EG and augmented with the LiPo battery energy storage system. To validate the proposed approach, the custom-built hybrid power unit prototype with dedicated control unit has been built and used to conduct both the process model identification and control system verification.
The paper is organized as follows: Section 2 gives an overview of the proposed hybrid propulsion system topology, along with the corresponding mathematical models of individual subsystems, in particular, the battery energy storage system, the ICE, and the EG set with a full-wave rectifier. Section 3 presents the control system design for the ICE-EG set based on the so-called damping optimum criterion, along with key simulation results. Section 4 presents the results of comprehensive experimental validation of the proposed hybrid propulsion system design. Discussion of key findings presented in the paper and the comparative assessment of hybrid vs. purely electrical propulsion system benefits is presented in Section 5, whereas concluding remarks are presented in Section 6.

2. Hybrid Power Unit System

2.1. Overview

The UAV power unit must balance two opposing requirements: (i) the need for sustained power production (i.e., energy capacity) in order to achieve flight endurance, and (ii) the need for peak load leveling to achieve satisfactory in-flight dynamic performance (in terms of maneuvering capability). Purely electrical propulsion, which is commonly used in multirotor UAVs employs an electrochemical battery for energy storage and power production [30], and has the advantages of a fast load compensation (response time within milliseconds), whereas the electrical propulsion using electric motors coupled to propellers offer a distinct advantage of very precise and highly dynamic thrust control. This represents the key motivation for retaining the battery energy storage within the hybrid power unit and electrical power transmission system using a common DC bus for power distribution, with electrical motors powering the propellers.
The hybrid power system considered herein surpasses the key drawbacks of the pure electro-chemical power source (using battery only) by using the energy of ICE and EG set, supplying the bulk of energy to the common DC bus via appropriate AC to DC rectifier, thus maintaining the DC bus operating voltage level. The battery now represents an auxiliary power source connected in parallel to the common DC bus and is used primarily for peak load shaving during load transients, and load leveling at very high hybrid power-train loads. In the former case (peak load shaving role) battery surpasses the engine-generator load response speed by several orders of magnitude, thus it can quickly take over and sustain peak load power delivery until the ICE-EG set can take oversupplying the common DC bus. The main advantage of such a hybrid power unit with an electrical energy storage system (battery or possibly ultracapacitors) is the ability to support the common DC bus voltage under highly dynamic loading conditions, and therefore fully utilize the fast response capability of the propellers electric motor drives, which is the key pre-requirement for high performance of the overall UAV flight control system, whereas simultaneously exploit the rather large energy capacity of the fuel, thus achieving enhanced flight endurance [20,21,22,23,30,31,32].
The analyzed configuration of a hybrid propulsion system (shown in Figure 1) is suitable for any multirotor UAV, comprising four or six propeller drives in a conventional configuration. The following assumptions have been made with respect to the hybrid power unit under examination:
  • ICE drives the brushless permanent magnet synchronous (BPMS) machine, used as an EG which provides for quasi-steady-state load power supply (i.e., to cover power demands needed for hovering and light maneuvering), while the battery unit is used for peak load shaving;
  • The energy recovery system is not used within hybrid power unit, thus simplifying power train topology, meaning that the battery energy storage is only charged prior to the flying mission;
  • ICE angular speed is controlled by a throttle servo actuator based on a small DC servomotor which positions the throttle valve according to the output of the engine-based DC bus voltage controller requiring a suitable DC bus voltage reference target and DC bus voltage measurement-based feedback.
Figure 1 shows the hybrid power unit topology with the ICE being directly connected to the EG shaft supplying the common DC bus through a three-phase full-wave diode rectifier, thus acting as the DC bus power supply, that is controlled by the engine throttle command. A battery with suitable charge capacity and terminal voltage range matching the target DC bus voltage range is connected to the common DC bus through a blocking diode used for preventing uncontrolled battery charging from the DC bus, and related battery current and voltage overloads.
When the DC bus voltage is lowered below the battery terminal voltage due to the engine-generator set slow dynamics in covering the sudden DC bus load change, the blocking diode can become forward biased, thus allowing the battery to be discharged and to supply the DC bus, with typical discharge rates of 50 Amperes becoming available within a few milliseconds. In order to facilitate the engine-generator set taking over after the initial DC bus voltage drop, the DC bus voltage control system is based on the engine-generator set throttle command equipped with the modified proportional-integral-derivative (PID) voltage controller, thus being able to match the ICE mechanical load imposed by the electrical torque demand (load) from the EG.

2.2. Battery Model

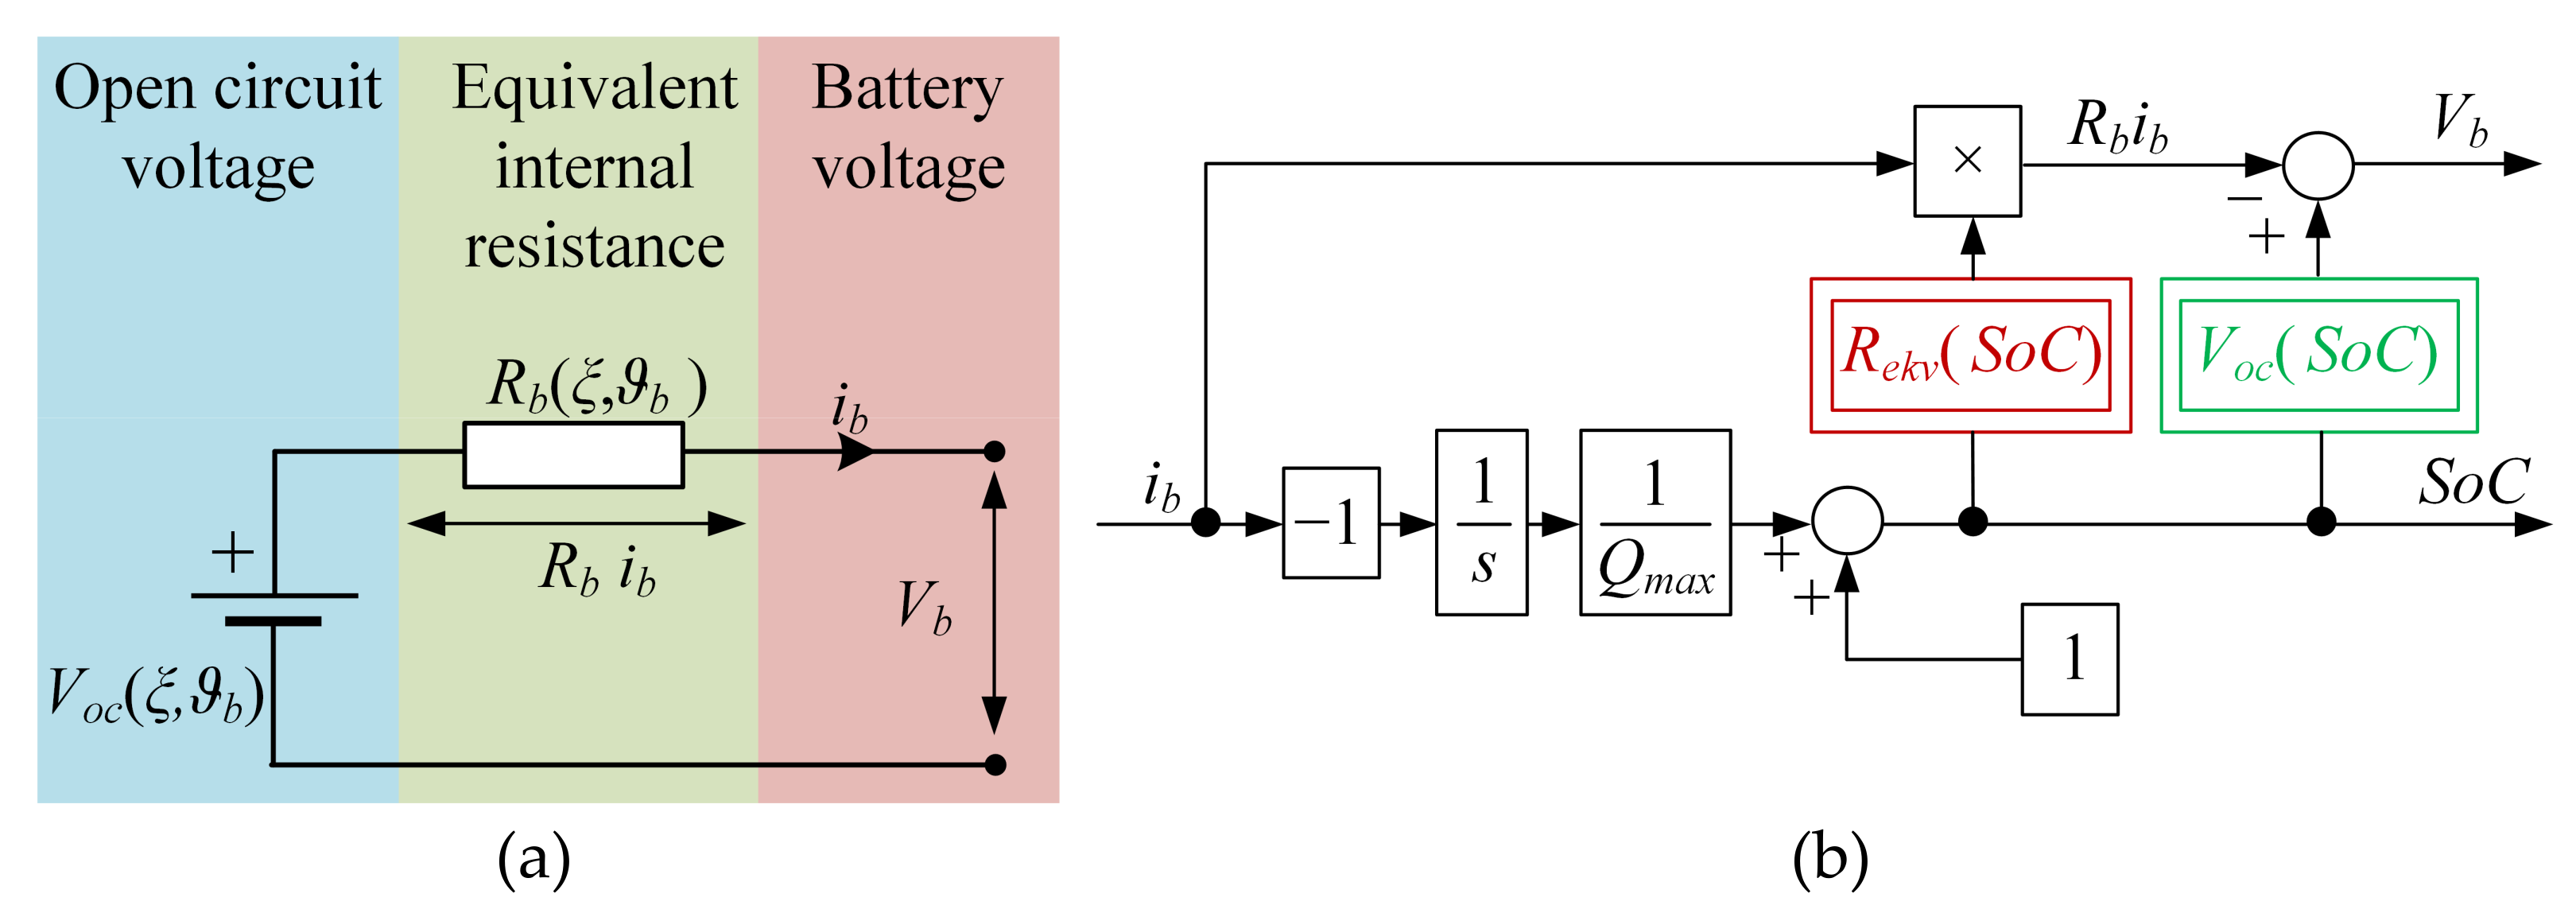
The modeling approach used herein is based on the model precision requirements and other factors as simulation speed and others. The approach based on the quasi-static Thevenin model [33,34] (see Figure 2a) used herein to characterize the key aspects of battery operation, i.e., quasi-steady-state terminal voltage and overall inner resistance corresponding to heat power losses.
In the equivalent circuit shown in Figure 2a, the ideal voltage source denotes the battery open-circuit voltage (OCV). Both the internal resistance R b and the open-circuit voltage V o c are dependent on the battery state of charge (SOC) ξ , state of health (SOH) and temperature ϑ b and define the terminal voltage V b . Load current i b is positive-valued at discharging and negative-valued at charging:
V b = V o c ξ , ϑ b R b ξ , ϑ b i b
Battery state–of–charge is defined in the following manner [34] (see Figure 2b):
ξ = 1 Δ Q b Q m a x
where Δ Q b = i b d t is the discharged battery charge and Q m a x is the battery charge capacity (which may also be dependent on the discharge current rate and battery temperature).
It should be noted that the above battery model may also include the effects of battery electrolyte polarization, which are manifested as additional first-order lag dynamics in the battery voltage response under loading conditions [33,34]. Normally, these effects are visible only after a certain amount of time, with polarization voltage time constants typically in the range of tens of seconds, and with voltage transient due to polarization effects typically lasting up to several minutes [34]. Since in this work the battery is primarily used as a power buffer that takes on short-duration load peaks, these battery polarization voltages transient effects are far less emphasized when compared with the internal resistance-related voltage drops which occur during these load peak shaving events. Thus, the presented quasi-static Thevenin model should capture the dominant battery voltage effects for the considered peak load shaving operating regimes.
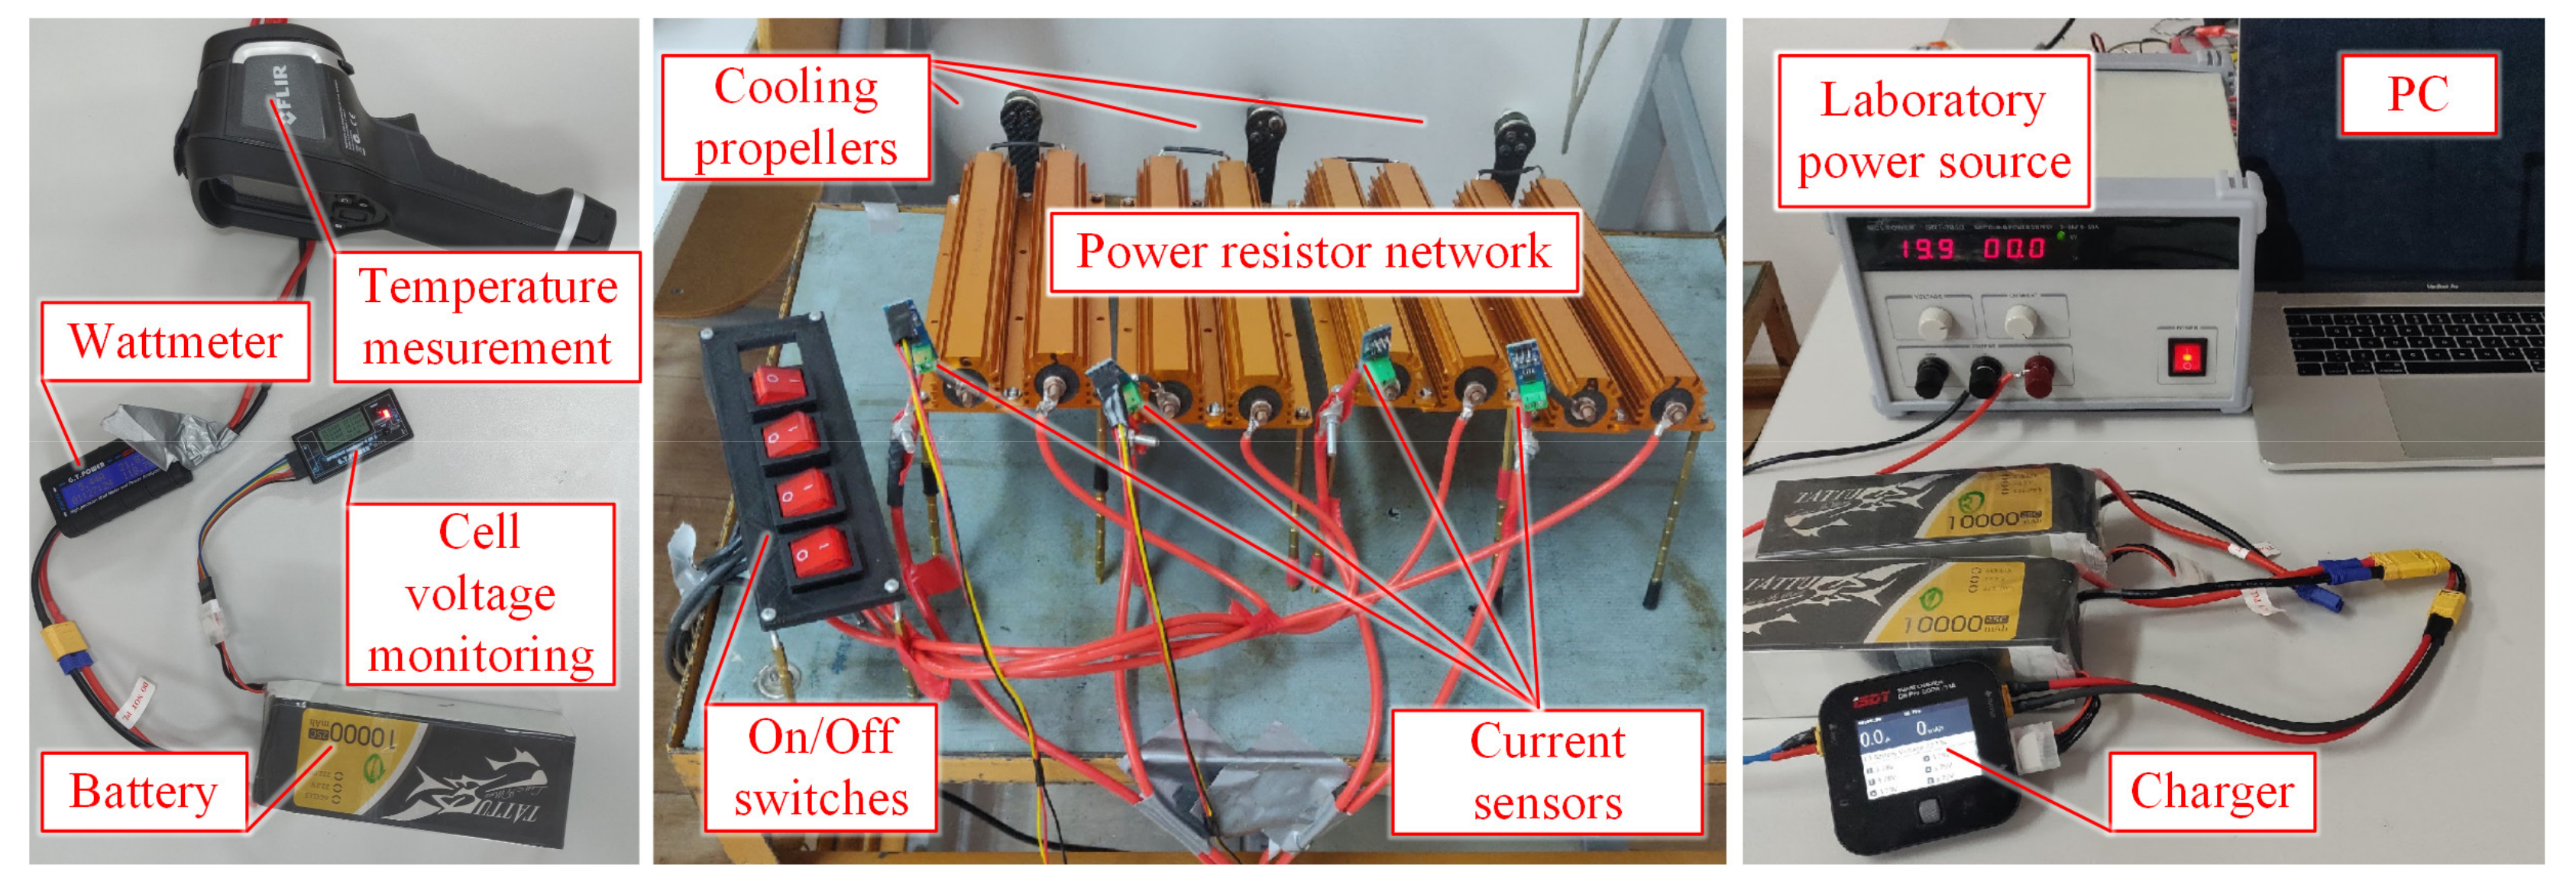
The experimental characterization procedure consists of two phases: (i) the initial intermittent discharge test intended for OCV vs. SOC curve identification, and (ii) the continuous discharge test used for the recording of the battery equivalent circuit series resistance vs. SOC characteristic over a wide range of battery state of charge values. Measurements were conducted on a developed test bench, consisting of appropriate sensors, data acquisition, and load with cooling propellers (see Figure 3). A network of parallel dissipation resistors (with 4 Ω in a single parallel branch) is used as a battery load, thus obtaining the required battery discharge current profiles, while honoring the safe range of battery operating voltage.
OCV is defined as the battery terminal voltage at idle state, i.e., the battery is neither charged, nor discharged (so-called open–circuit condition). After the battery has been charged or discharged, the battery terminal voltage eventually settles to a steady-state value after a certain amount of time has passed in the open–circuit condition (typically one hour or more).
Subsequently, after chemical stabilization of the battery has been achieved (enough time has passed after charging or discharging), the battery terminal voltage is equal to the OCV, which is directly related to the amount of charge currently stored in the battery (i.e., it also corresponds to battery SOC) [34].
To relate the OCV with the battery SoC, an intermittent discharge test was conducted consisting of the following steps:
  • Initial full charging of the battery cells to achieve 4.15 V per cell, followed by voltage stabilization (settling) to achieve electrochemical and temperature equilibrium;
  • Partial battery discharging for a short period of time (i.e., 10 min);
  • Allowing the battery to rest in the open–circuit condition for 3 h, in order to achieve the terminal voltage steady-state;
  • Repeating the intermittent discharging steps until OCV per cell is approximately 3.4–3.5 V (which corresponds to a fully discharged battery state).
By charging the battery with different current rates (0.25, 0.5 and 1 C), the maximum battery charge, related to the change from 3.5 V per cell to 4.15 V per cell (all after stabilization) is estimated to be 9800 mAh, and this defines 100% SOC value. The intermittent discharging steps were repeated until OCV per cell has reached about 3.4–3.5 V (which corresponds to the fully discharged charge state of the cell, or 0% SoC per cell).
The internal resistance characterization test relies on the gradual (very slow) change in battery current while discharging under the constant load (Figure 4), i.e., that there are no sudden changes in the current magnitude. Thus, it follows that changes in battery polarization voltage are primarily dependent on the polarization resistance (polarization capacitance does not affect the polarization voltage variations), thus justifying the aforementioned choice of the quasi-static Thevenin model of the battery.
Figure 4 shows the identification results obtained at constant ambient temperature (30 °C). These results point out a highly-nonlinear OCV vs. SoC dependence, as shown in Figure 4a, and a relatively mild trend of battery internal resistance increase with the battery state-of-discharge (1−SoC), as shown in Figure 4c. The latter result is obtained by combining the battery voltage and current responses in Figure 4b with the battery OCV vs. SoC over the time that discharging test in Figure 4b has been performed.

2.3. ICE Model

A nonlinear mean–value engine model (MVEM) described in detail in [35,36] is used as a basis for the modeling of a two-stroke engine for simulation studies and control system design, because it covers static characteristics and dominant (low frequency) dynamic phenomena within the engine, whereas it does not include the high-frequency (fast) dynamics of cyclic/reciprocating piston operation, but it does include the associated torque development delay, i.e., the engine torque being unable to respond immediately to an increase in the manifold pressure.
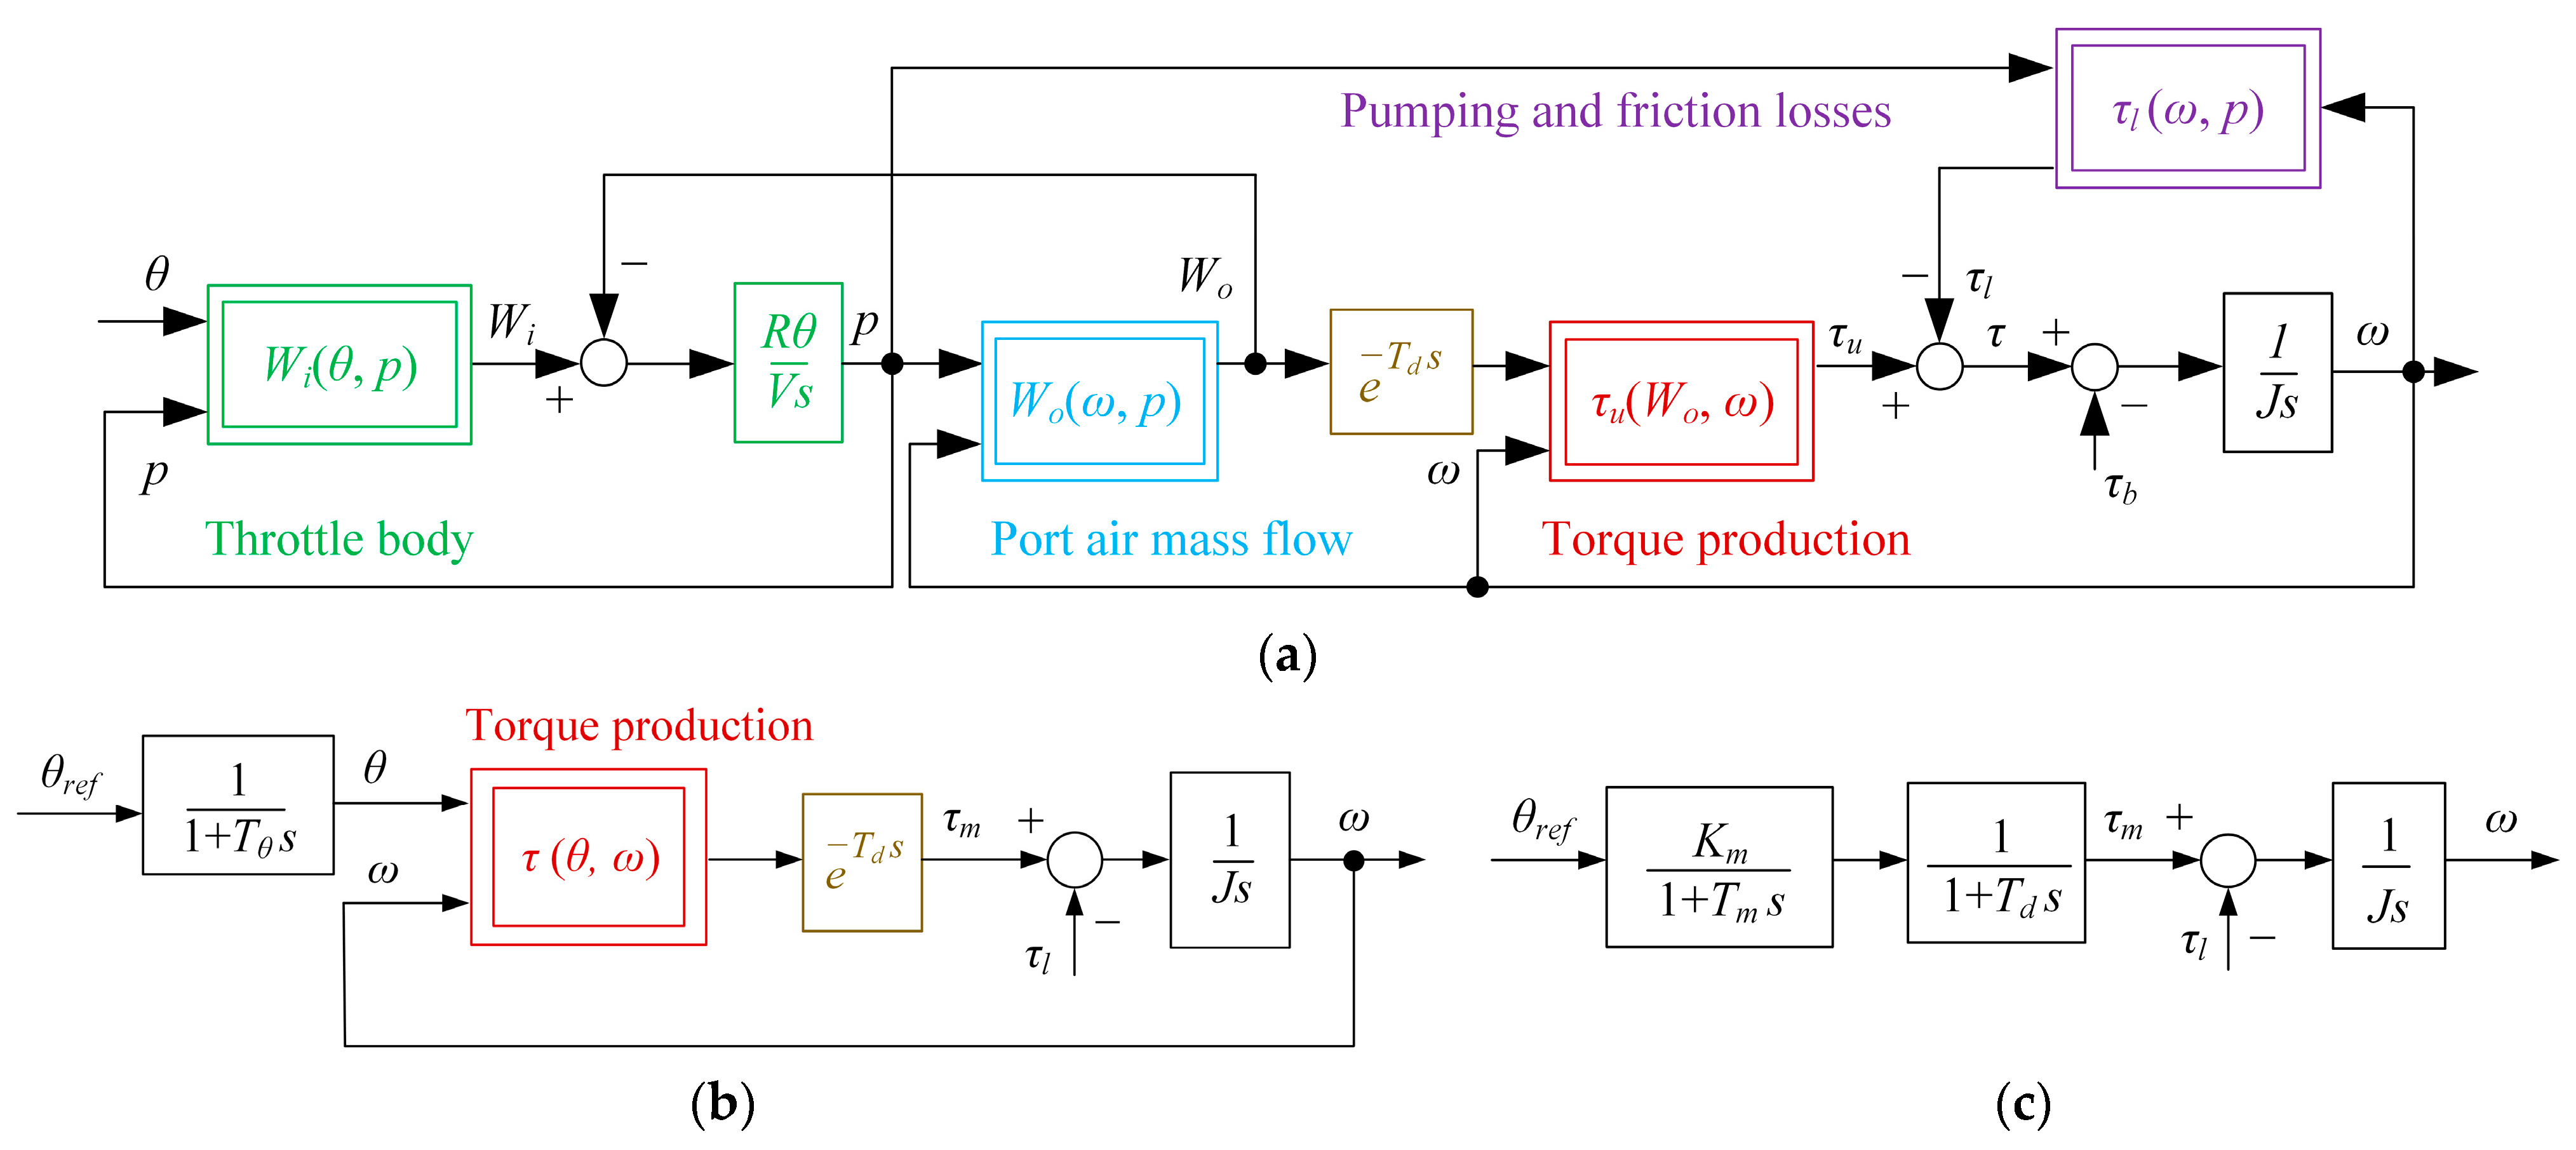
The considered mean value engine model possesses only two state variables: intake manifold pressure p and the engine angular speed ω , whereas all other effects are modeled by means of three–dimensional static maps. Figure 5a shows the block diagram of a mean value engine model according to reference [35].
In the case of a small-volume intake manifold, typically valid for a small, low-power engine, intake manifold air filling dynamics would be very fast, and, thus may be neglected. Thus, the MVEM model can be simplified to a first-order model, and it should still be valid for engine control applications if the bandwidth of a control system is relatively low [36]. By neglecting the intake manifold dynamics, a simplified model (with throttle dynamics) is shown in Figure 5b.
The dynamics of the thus-simplified first-order model consists of just one state variable, i.e., engine speed:
J ω ˙ = τ M τ l
where τ M = f θ , ω is net torque after losses, described by a static map. Such map can be obtained from test bench measurements, i.e., by gradually increasing and subsequently decreasing the throttle angle, and recording the net torque τ M quasi-steady state values, which corresponds to the imposed load (e.g., from the generator coupled to the engine shaft). Therefore, for each throttle angle, there is an engine speed with maximum torque output [36].
The simplified model represented by the block diagram in Figure 5b includes several subsystems that correspond to individual engine parts, i.e., throttle servo–valve, rotational dynamics, and the aforementioned torque development dead time (delay)   T d For the purpose of control system design, the above nonlinear first-order model is linearized in the vicinity of the engine operating point corresponding to steady-state values of throttle angle and speed for the case of maximum engine torque output.
The torque development dead time T d can be approximated by the first two terms of the Taylor series expansion of the exponential term [35]:
e T d S 1 T d s + 1  
provided that the control system closed-loop dynamics are much slower compared to the torque response. Namely, under such conditions, the engine torque response is expected to be gradual, thus justifying the above simple approximation of the torque development dead-time. This dead time represents the mean time between mixture ignitions within cylinders. For a two-stroke engine, combustion occurs at every full rotation of the crankshaft, so the dead time can be approximated as follows [20]:
T d 2 π n π 30 = 60 n  
where n is revolutions per minute of the crankshaft.
Finally, the throttle actuator dynamics are approximated by a first-order lag system, as suggested in [20,21]. The final linearized process model used in subsequent control system design is shown in Figure 5c.
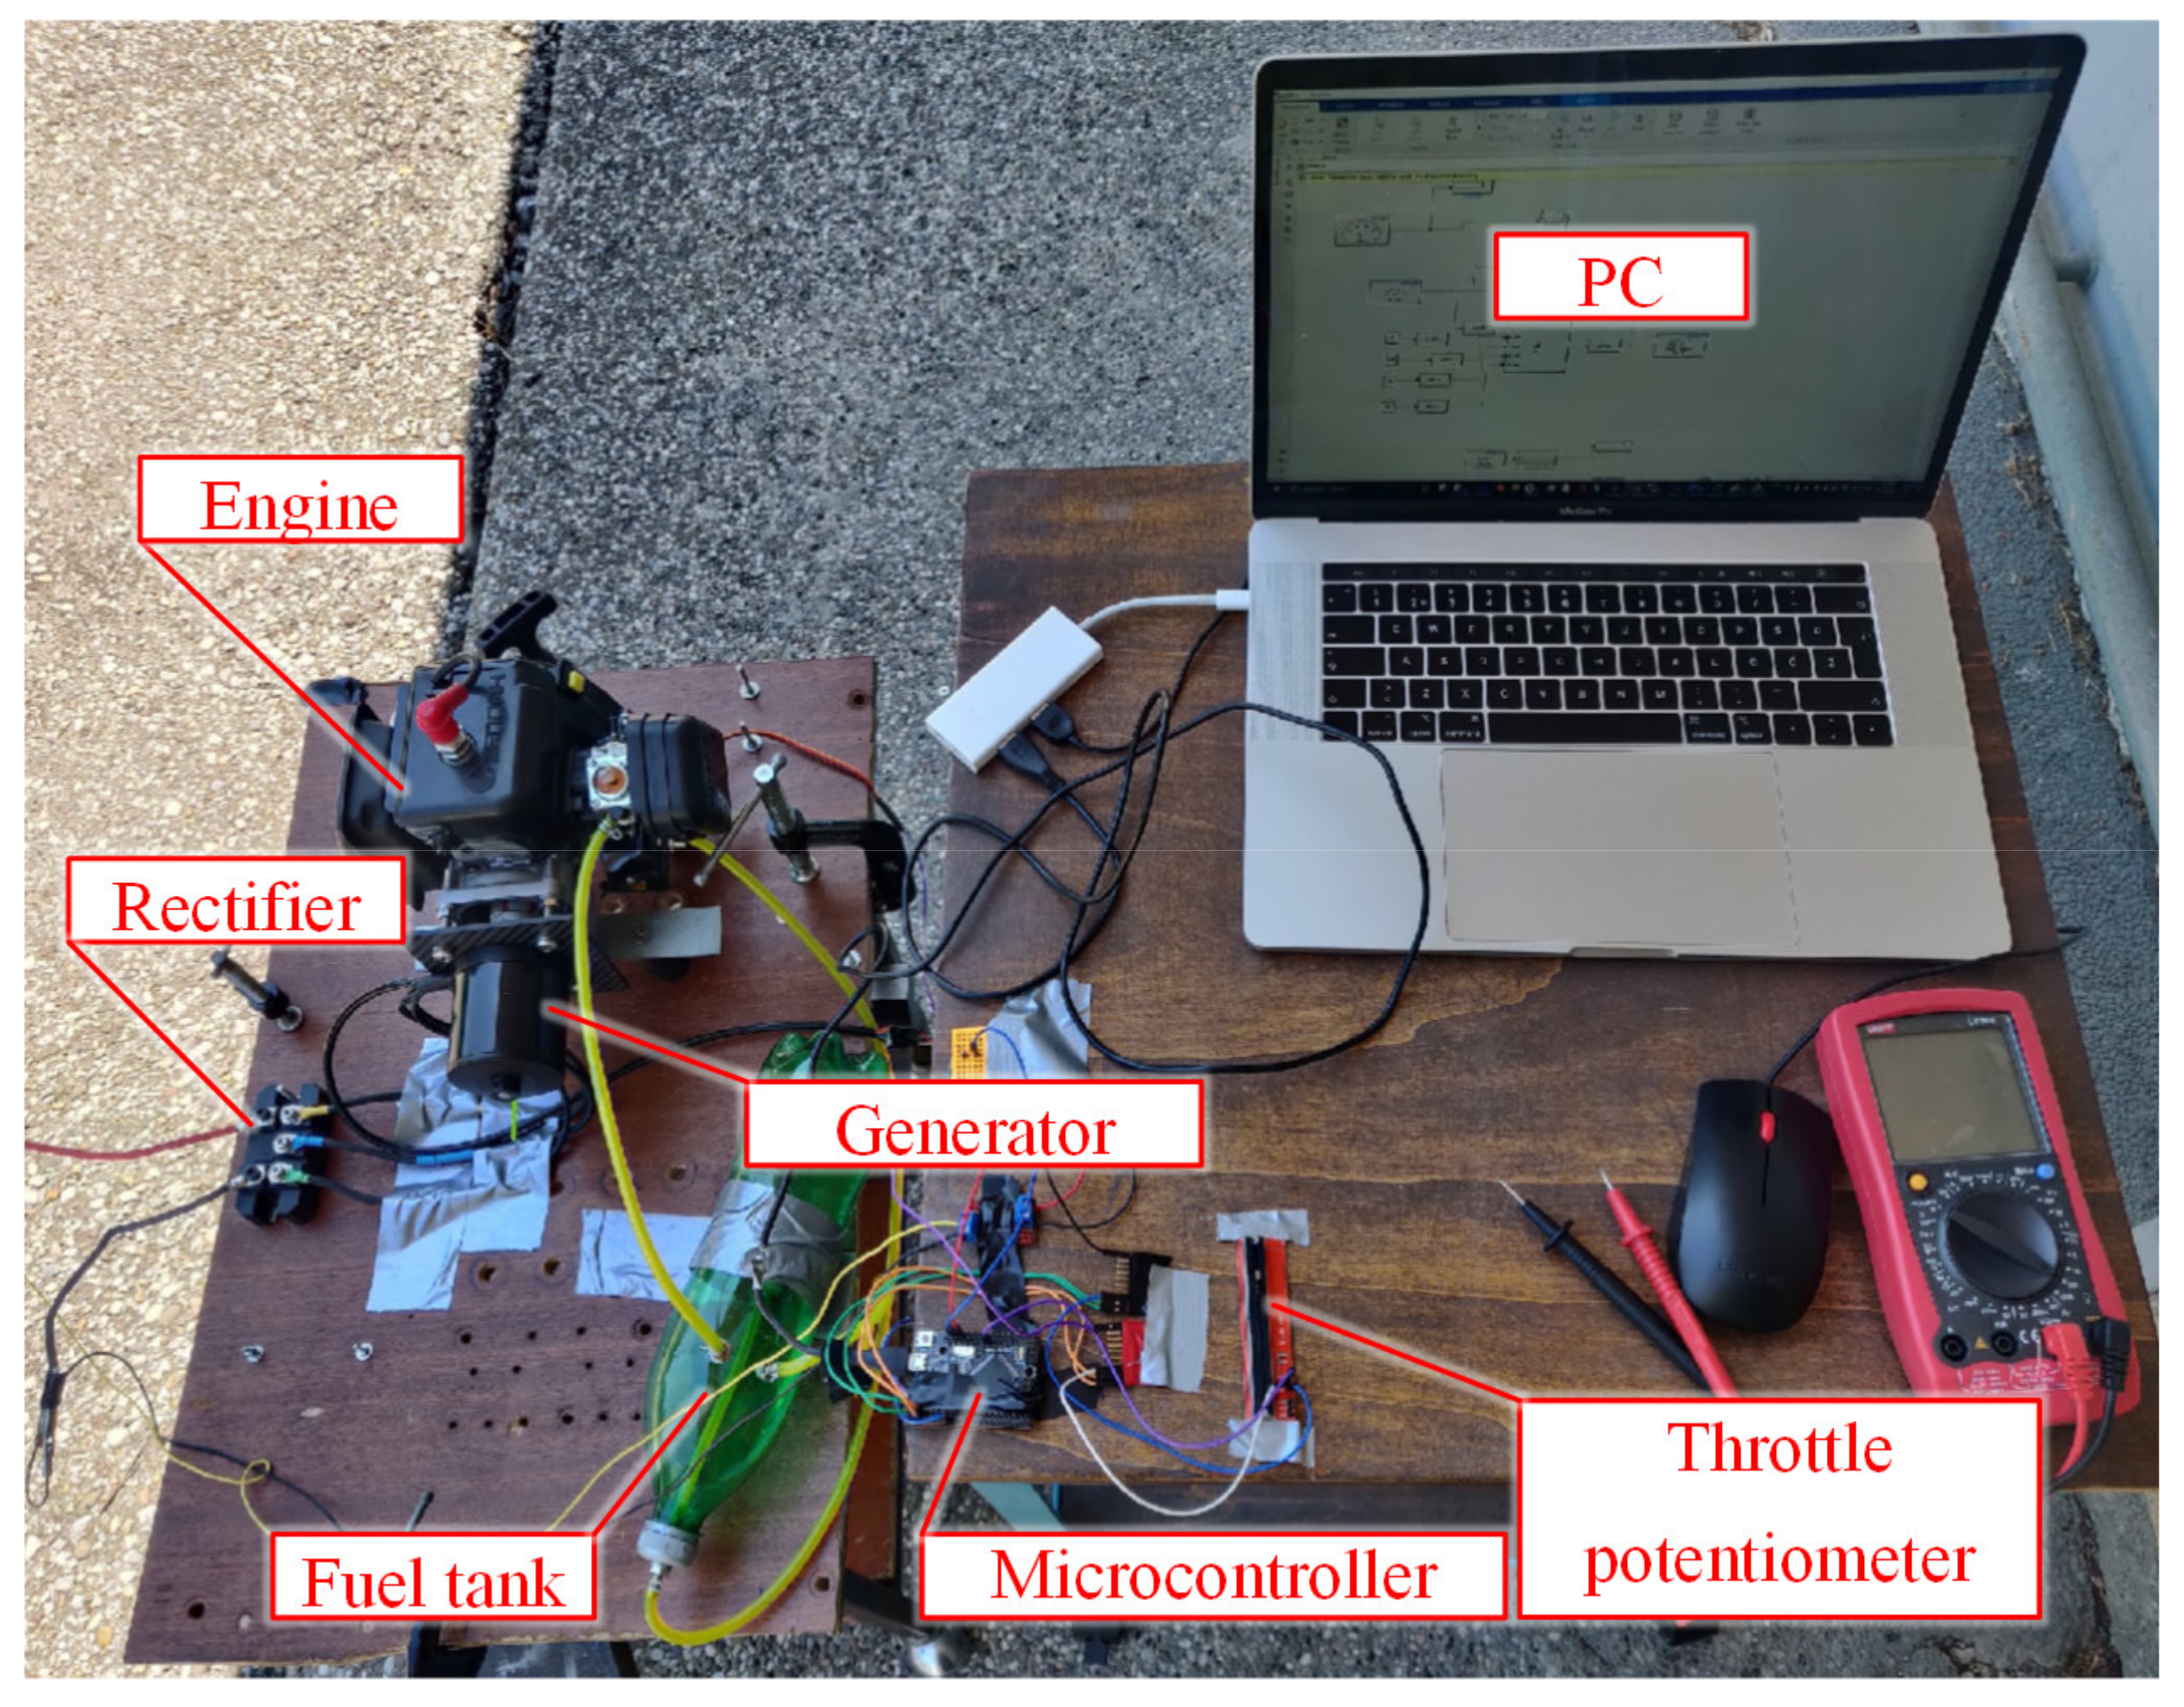
ICE-EG set test bench is shown in Figure 6, while technical parameters given by the manufacturer are given in Table 1.
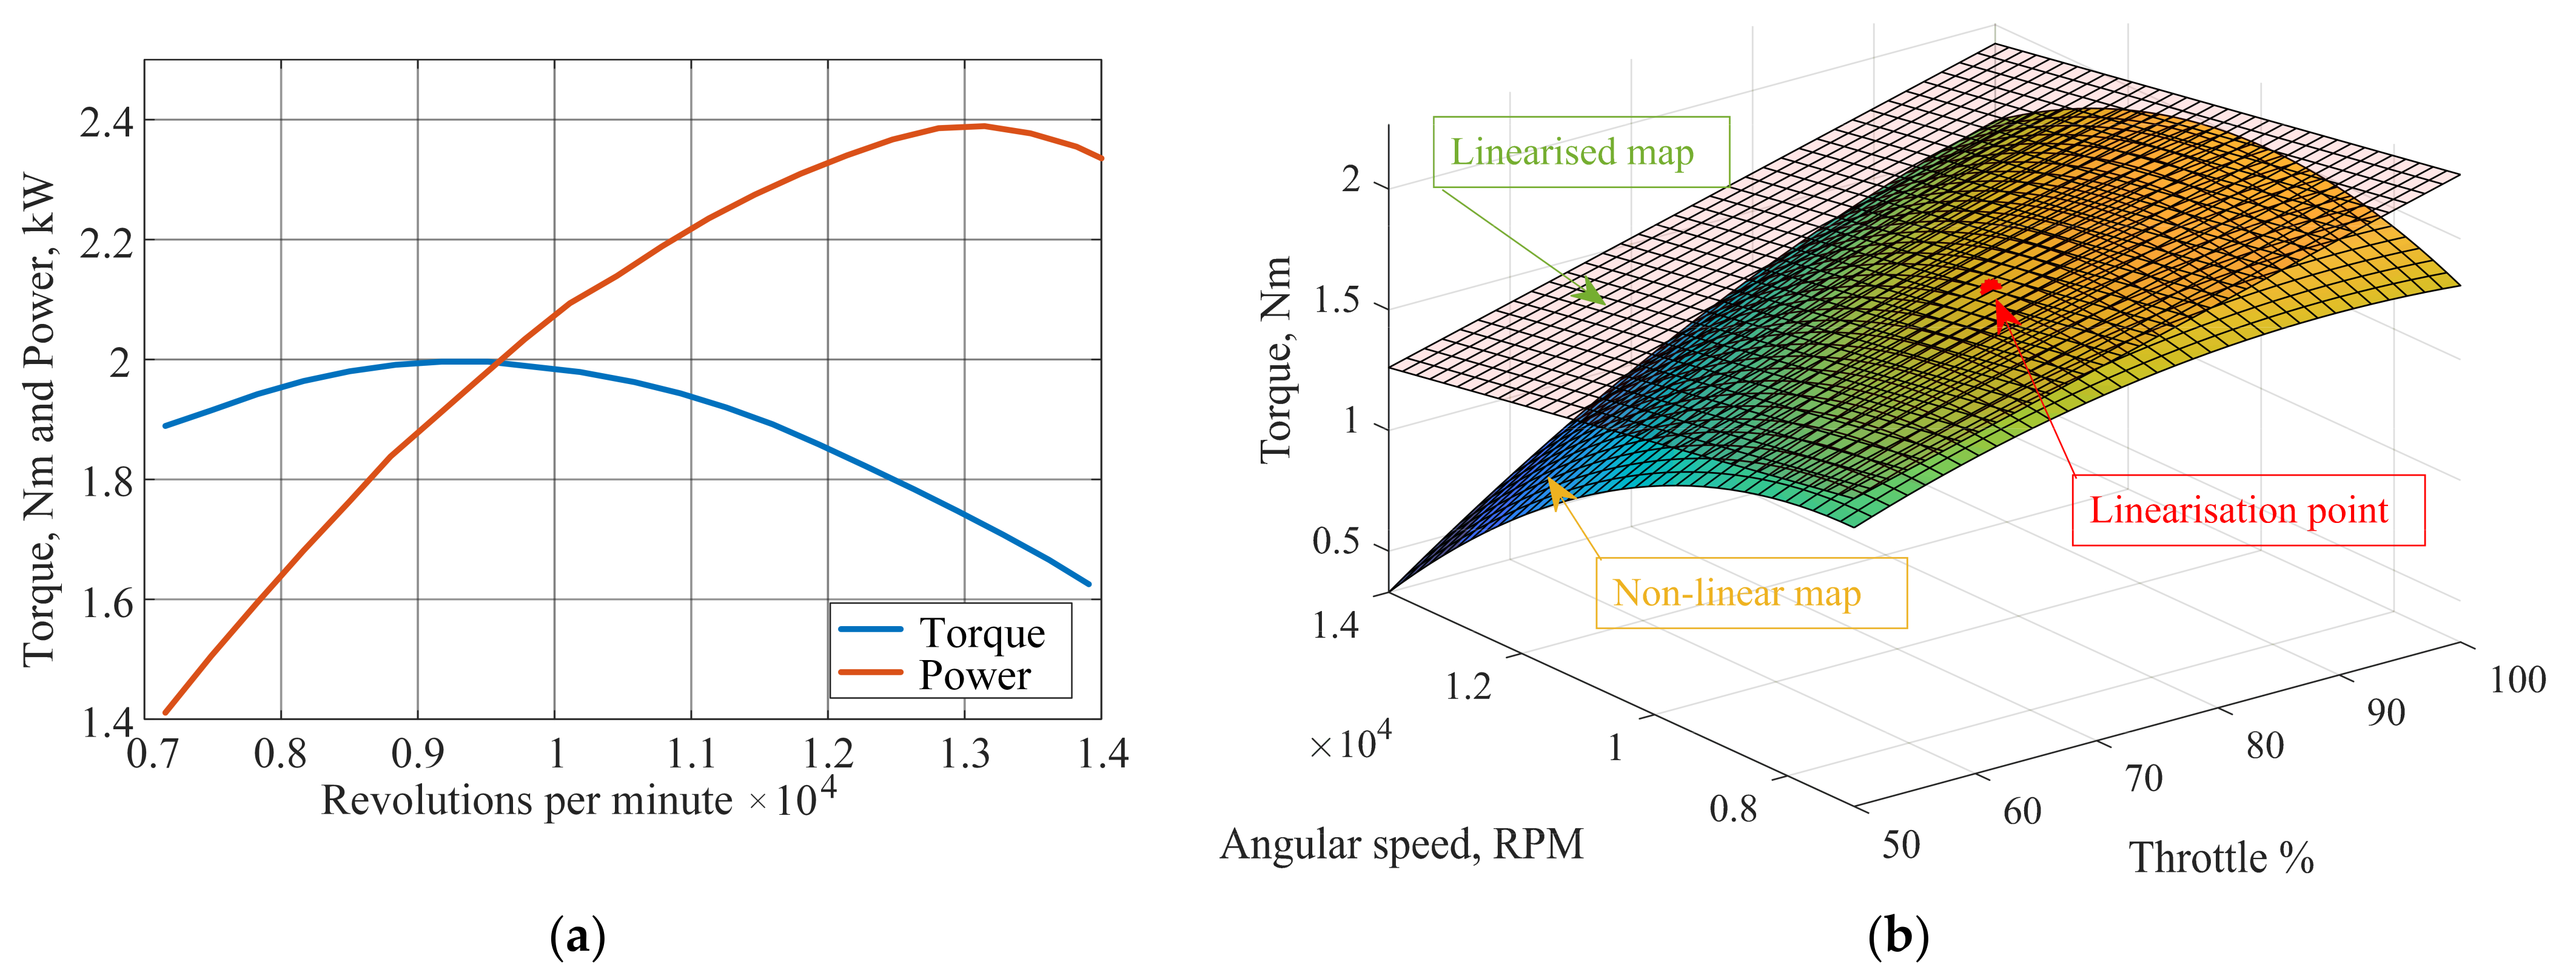
Single torque–throttle–rpm map is obtained from breaking torque/power curve provided by the manufacturer (Figure 7a) and suitable sizing methodology, i.e., as shown in [37]. The moment of inertia is estimated by using CAD models. Nonlinear map torque-rpm-throttle has been linearized (see Figure 7b) in the vicinity of the anticipated engine operating point, characterized by the throttle opening of approximately 70% opening of the full scale, and engine speed of 9500 rpm, by using related numerical tools within. MATLAB/Simulink™ software.
It is generally recognized that the internal combustion engine within a hybrid powertrain should be predominantly operated in the region of its highest fuel efficiency, which is typically characterized by a narrow range of engine speeds and torques. When a hybrid drive has a constraint of the lowest overall mass possible, it is of interest to attain as much current from the generator as possible, because it effectively determines the DC bus charging rate. This is achieved at the point of maximum torque developed by the ICE, since the motor torque is reflected as a current in the generator (maximum of blue line on power/torque characteristics, Figure 7a), subject to the requirement that the DC bus voltage should be closely matched to the engine speed at the particular maximum-torque operating point.
In this work, the particular engine has shown the best torque performance around the engine speed of 9500 rpm [20], so the model derivation and subsequent testing have been carried out for this particular operating point.

2.4. Electrical Generator and Rectifier Model

The brushless permanent magnet synchronous (BPMS) generator consists of the rotor shaft with attached rotor permanent magnets, stator case with stator windings, optional Hall sensors (logic level Hall probes) for rotor angle detection, and stator winding phase connections [38].
According to the design that defines the shape of the electromotive force, these machines can differ as trapezoidal shape back electromotive force (BEMF) machines referred to as a brushless direct current (BLDC) and sinusoidal BEMF machines referred to as permanent magnet synchronous machine (PMSM), as elaborated in [39]. The main differences between these two designs are related to the winding spatial distribution within stator slots, magnetic design (i.e., airgap and rotor tooth/slot geometry), the physical shape of rotor magnets, and their magnetization profile [39,40].
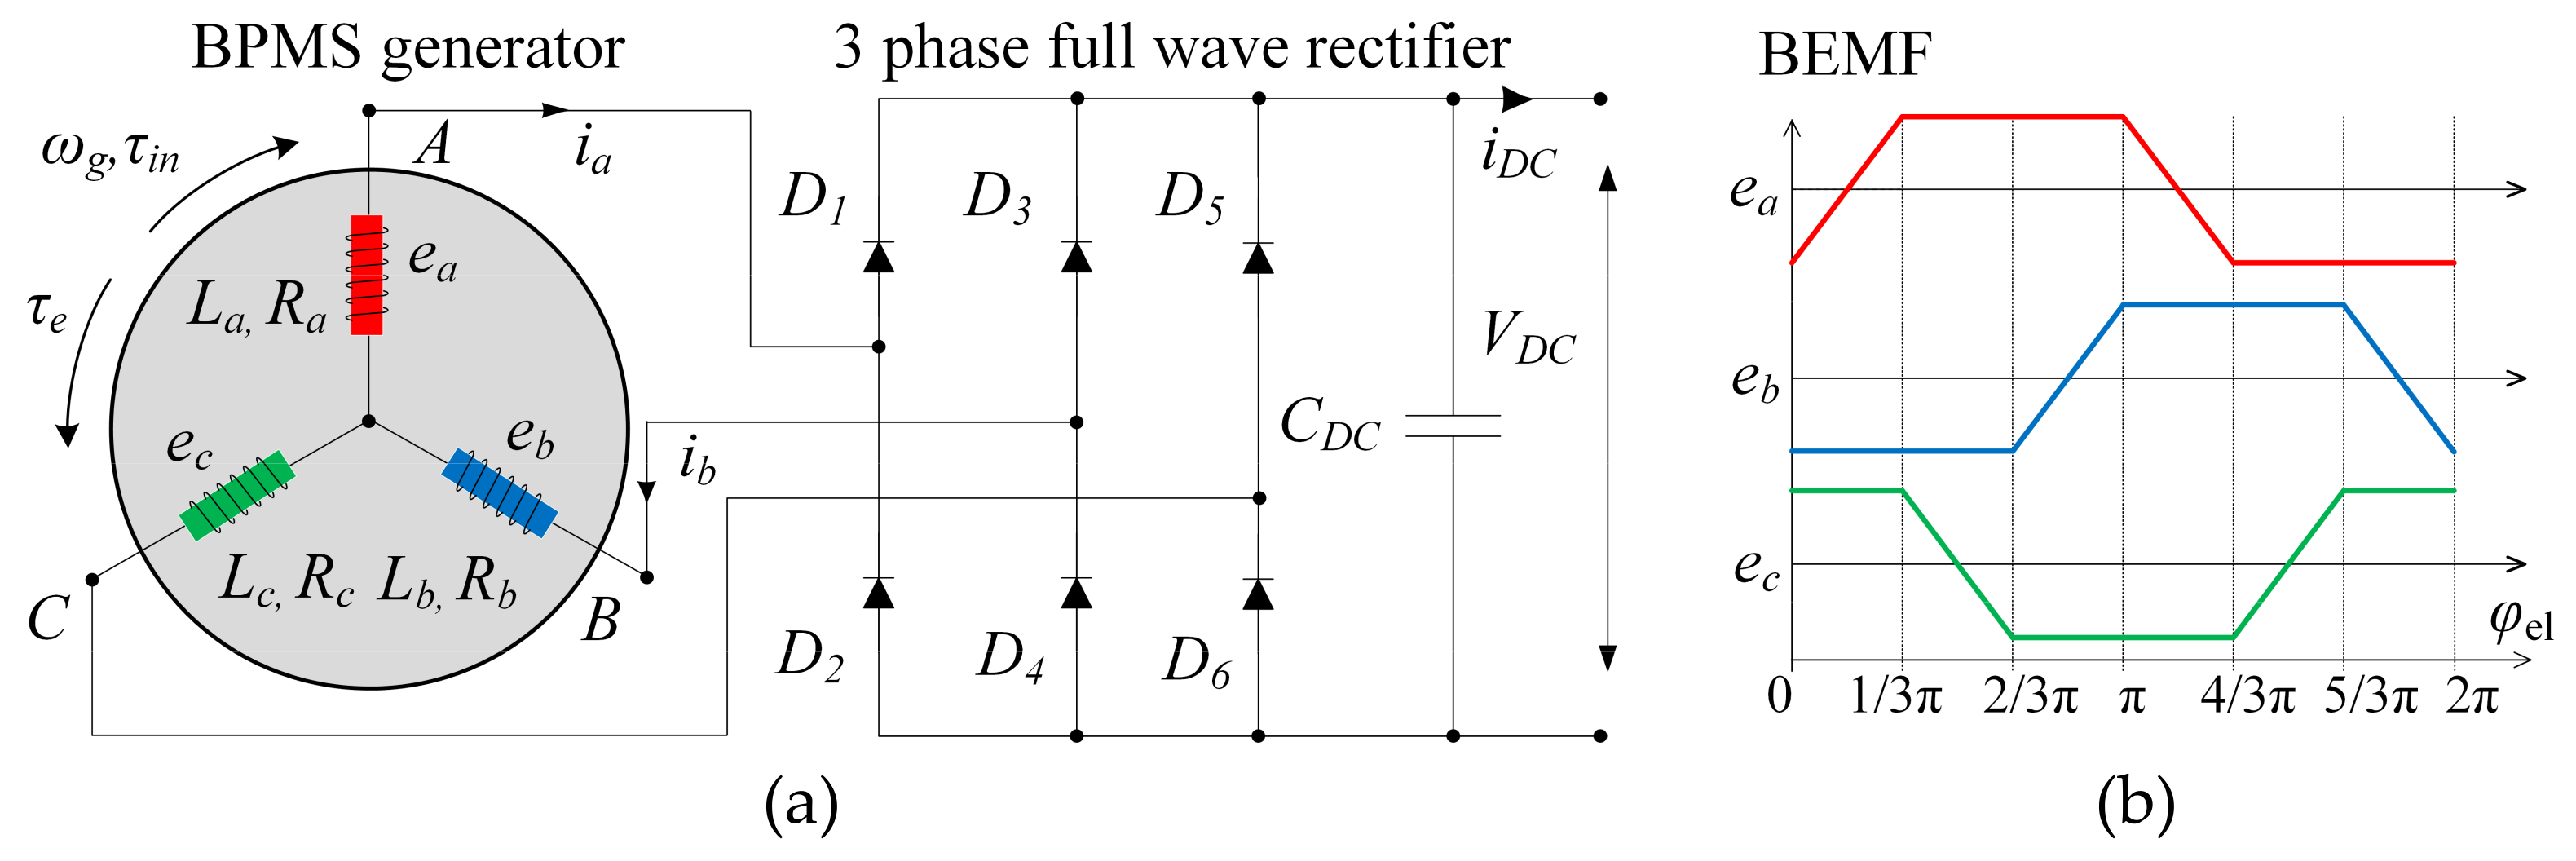
Figure 8a shows the simplified electrical circuit of the three-phase BPMS EG with rotor permanent magnets and its connection to the three-phase full-wave diode rectifier, whereas Figure 8b shows the trapezoidal back-emf waveforms of individual EG phases.
Each stator phase winding is characterized by its respective internal resistance and inductance parameters R p h and L p h , and the induced EMF per phase (Figure 8b), which is dependent on rotor speed ω g and rotor magnetic flux spatial distribution φ m [41,42]:
  e l = K e ω g φ m p α g 2 π l 1 / 3    
where l = 1 ,   2 ,   3 being the phase number, p being the number of EG pole pairs, and α g = ω g d t is the BPMS machine rotor position (mechanical angle). On the other hand, the total electromagnetic torque of the BPMS machine due to individual phase currents il can be calculated as:
τ g = K e l = 1 3 φ m p α g 2 π l 1 / 3 i l  
According to Figure 8a,b, during each commutation sequence one of the three phases of the trapezoidal back-emf BPMS EG is non-conducting, whereas the two remaining phases are connected to the DC bus through the rectifier diodes when conditions for their conduction are established (i.e., their total BEMF is higher than the DC bus capacitor voltage, augmented by double diode forward biasing voltage). Therefore, for the case of phases 1 and 2 conducting with respect to the DC bus,   i 1 = i 2 = i e q is valid (based on the notation in Figure 8a).
In the above case the BPMS machine may be regarded as a DC machine from the standpoint of the DC bus, with equivalent inductances and resistances given as follows:
L e q = 2 L p h ,     R e q = 2 R p h + 2 r d  
where the double value of dynamic resistance r d is added to account for semiconductor switching element (i.e., diode) conduction losses.
Similarly, the equivalent DC model electromotive force and torque gains are defined as double phase values ( K e q = 2 K e , l i n e ) for approximately square rotor flux spatial distribution, resulting in the following EMF and EG torque equations [41]:
e e q = K e q ω g = 2 K e ω g ,     τ g = K e q i e q = 2 K e i e q   ,
where i e q is the previously defined instantaneous BLDC EG line current.
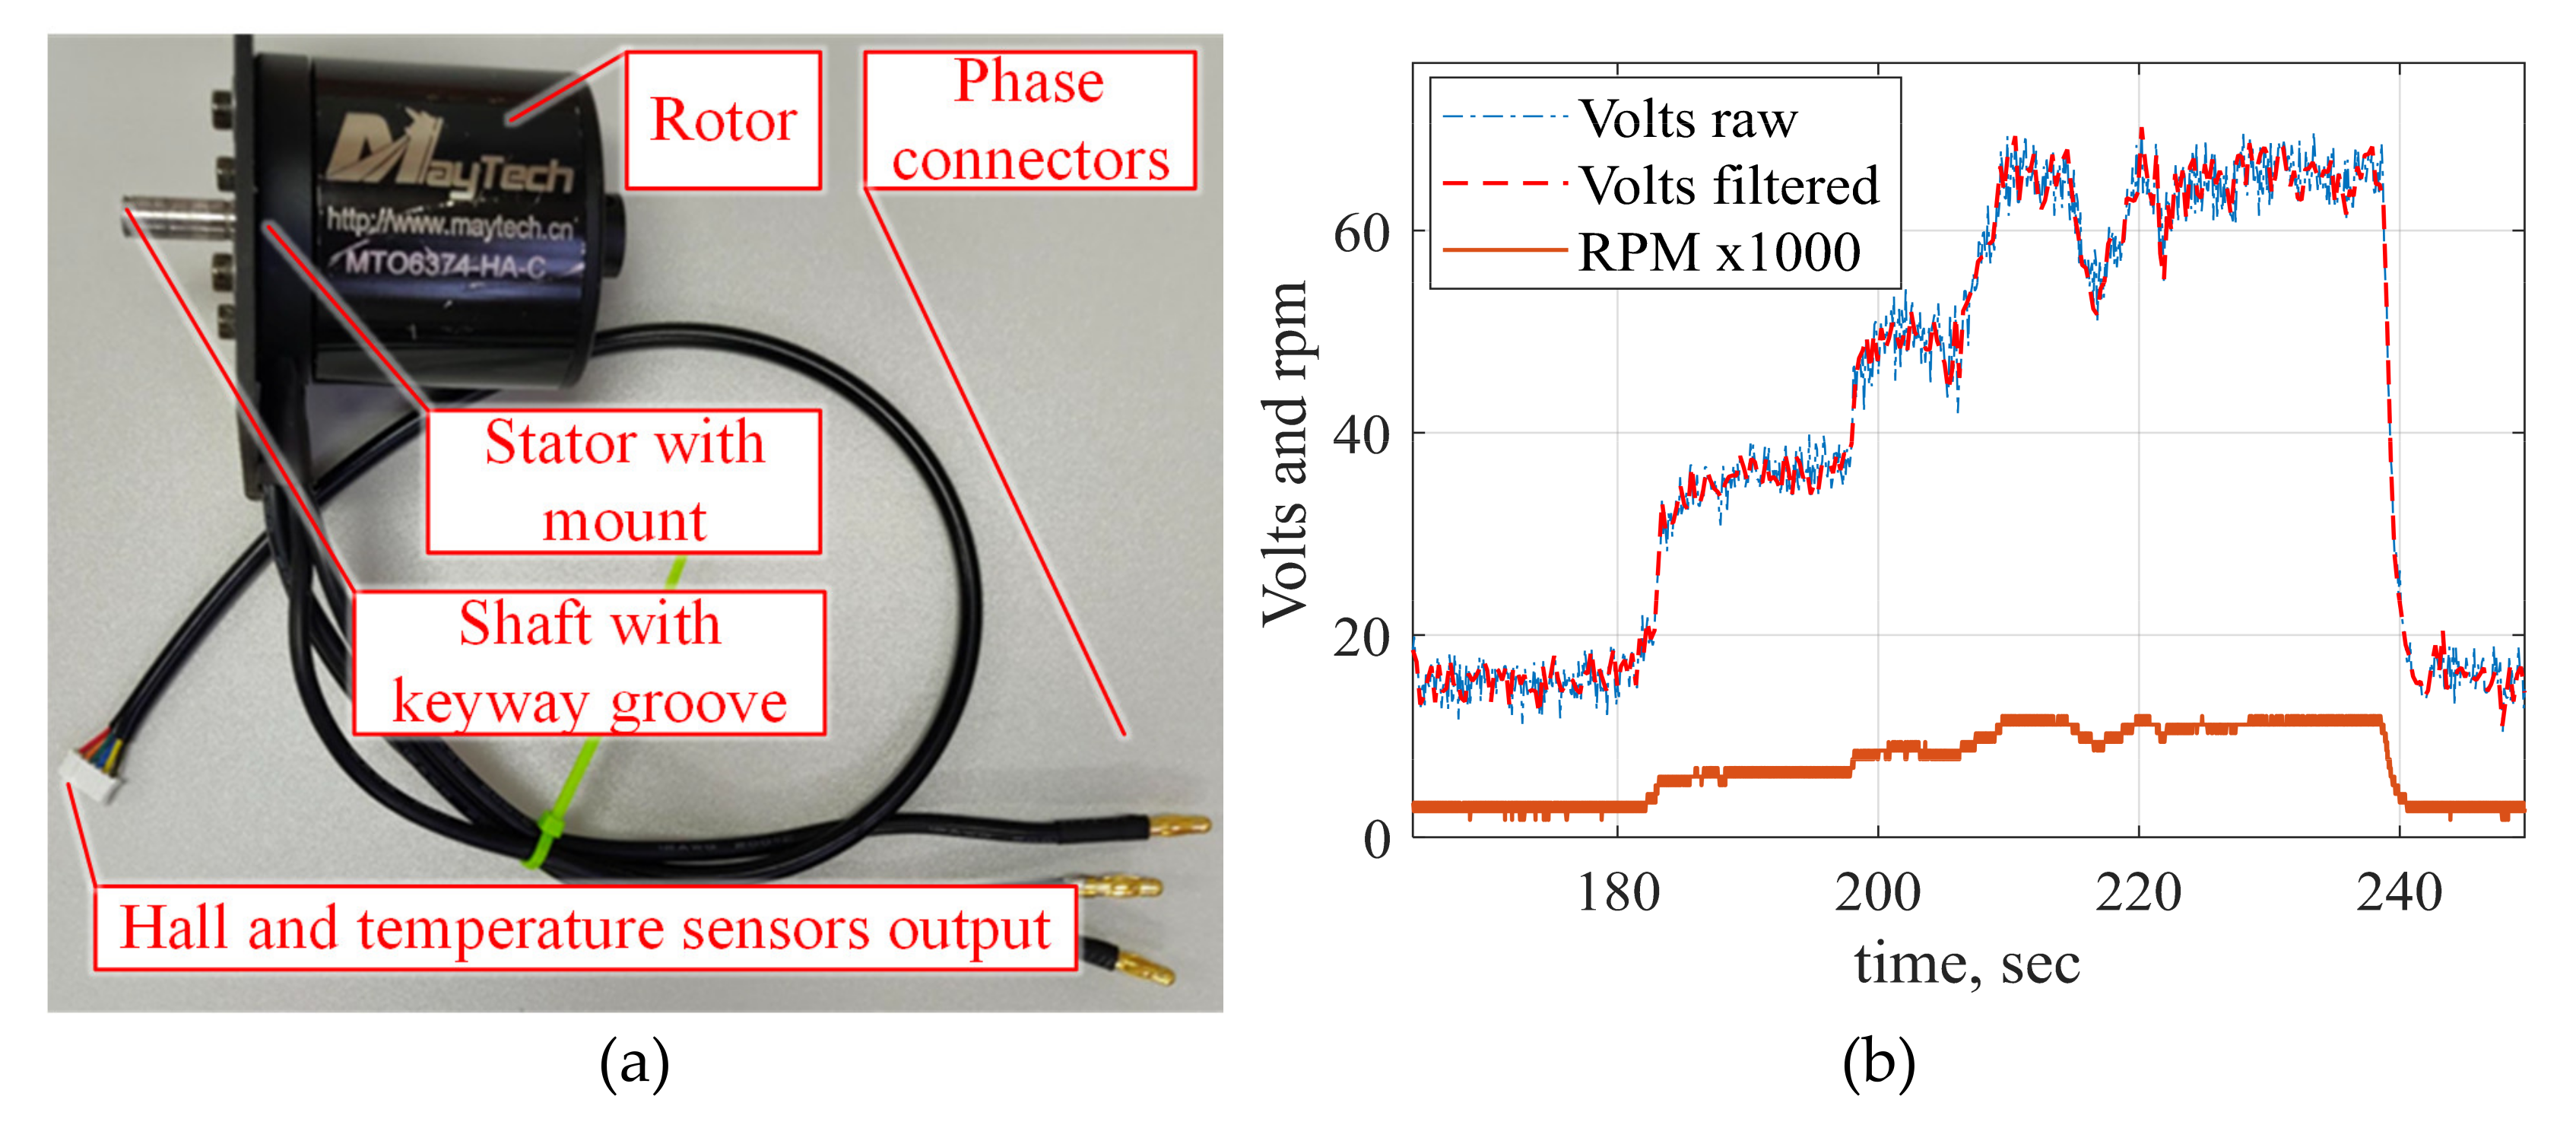
A lightweight, high power outrunner brushless electrical motor (type 6374 from Maytech) is used as an electricity generator within the hybrid power unit setup (see Figure 9a), featuring embedded current/rpm sensors and characterized by 170 KV EMF constant (170 rpm per 1 volt of induced electromotive force). The chosen generator specifications are listed in Table 2.
The aforementioned motor constant is confirmed by measurements based on the ramping of the voltage throttle command from zero to maximum and recording the rotational speed (rpm) and phase voltage profiles (Figure 9b). Measurements were conducted on the ICE-EG set test bed (Figure 6), with a mechanically coupled EG and ICE as a prime mover, with speed measurement based on Hall–effect sensors, and armature voltage measurements based on a suitable resistor divider network and analog–to–digital converter embedded on the microcontroller unit used for data acquisition. Electrical machine winding resistance and inductance are measured utilizing a precise laboratory LCR meter. Phase–to–phase quantities are measured for each possible phase–to–phase combination and the phase impedance components (resistance R p h and inductance L p h ) are calculated as average values obtained by measurements.

3. DC bus Voltage Feedback Control

This section presents the control system design featuring an ICE-EG set voltage control (DC-bus voltage) system utilizing a proportional-integral-derivative (PID) feedback controller, with the controller tuning relying on the damping optimum criterion.

3.1. Damping Optimum Criterion

The control system design herein is based on the so-called damping optimum criterion, which belongs to the category of practical optima for linear dynamic systems. More precisely, this is a pole-placement-like analytical method of design of linear continuous-time closed-loop systems, which results in analytical relationships for precise tuning of closed-loop damping (see i.e., [43,44]). The tuning procedure is based on the following closed-loop characteristic polynomial:
A s = D 2 n 1   D 3 n 2 D n   T e n   s n + + D 2   T e 2   s 2 + T e s + 1    
where T e is the closed-loop system equivalent time constant, and D 2 , D 3 , , D n are the so-called characteristic ratios.
In the so-called “optimal” case D i = 0.5 ,   i = 2 , ,   n the closed-loop system of any order n has a quasi-aperiodic step response characterized by an overshoot of approximately 6% (resembling a second-order system with damping ratio ζ = 0.707 ) and the approximate rise time 1.8     2.1   T e . For larger T e value choices, the dominant closed-loop modes are characterized by slower response and generally improved control system robustness and noise suppression ability.
The aforementioned equivalent closed-loop system time constant represents the dominant dynamics of the closed-loop system tuned for a well-damped response. Hence, the closed-loop system can be approximated by the equivalent first-order lag term with the time constant T e which can simplify the design of the superimposed (upper-level) controller:
G e s = 1 T e s + 1  

3.2. DC Bus Voltage Feedback Control through ICE Throttle Command

DC bus voltage control is facilitated by means of indirect ICE engine speed control based on the DC bus voltage feedback for the dedicated PID controller commanding the engine throttle drive (i.e., providing the throttle unit angle reference).
Figure 10 shows the proposed model layout including the linearized engine model from Figure 5c, coupled with a fixed transmission ratio i g to the electricity generator characterized by its equivalent DC model, which is in turn coupled to the common DC bus characterized by the capacitance parameter C d c . For the sake of simplicity of control system design, the throttle unit delay and torque production dynamics can be lumped into a single time constant T Σ I C E , which may also incorporate the sampling delay T A D in the case of discrete-time (digital) controller [21,44], as shown below:
T Σ I C E     = T θ + T I C  
T I C = T M + T D + T A D
This simplification is used to form the following input-output transfer function model of the engine-generator set connected to the common DC bus
  G p s = K M T K P V   s 1 + T Σ I C E s     1 + T P V   s + T P V   T E Q s 2    
where the transfer function model parameters are:
T P V     = J C D C R E Q K P V   K E Q * ,   T E Q     = L E Q R E Q ,   K E Q * = i 1 K E Q
The above process model is of the fourth order, which would result in a fifth-order closed-loop system when using the proportional-integral-derivative (PID) controller. However, if the process model could be simplified to a third-order system, then it would be possible to derive explicit analytical expressions for the PID controller parameters, as shown in reference [44]. More precisely, if the second-order term:
T P V   T E Q s 2 + T P V   s + 1 = Ω 2   s 2 + 2 ζ Ω 1   s + 1
would be characterized by T P V > > T E Q   then it could be approximated by the first-order lag dynamic term, valid if the damping ratio ζ is greater than 0.707:
1 1 + T P V   s + T P V   T E Q s 2 1 1 + T P V s
Figure 11 shows the block diagram representation of the DC bus voltage feedback control system with a PID feedback controller implemented in the so-called I + ID modified form (see [44]). By equating the coefficients of the characteristic polynomial of the closed-loop system with the equivalent coefficients of the “prototype” damping optimum characteristic polynomial of the fourth order, the following explicit analytical expressions are obtained for the PID controller parameters:
T E = T I = 1 D 2 D 3 D 4 T P V T Σ I C E   T P V + T Σ I C E  
T D = D 2 T E 1 D 2 D 3 T E T P V + T Σ I C E    
K R = K P V K M T T P V + T Σ I C E   D 2 2 D 3 T E 2
K P V = 1 i g 1 K E G J + i g 2 K E G 2 C D C   ,   T P V = J C D C R E Q K E Q * K P V  
It is assumed that the torque gain of the linearized internal combustion engine model is subject to additive errors Δ K m t and Δ T m from their nominal values K m t   and T m used in engine speed control system design, so that the actual gain and time constant K m t *   and T m * are given as K m t * = K m t + Δ K m t and T m t * = T m t + Δ t m t .
The total inertia J , throttle lag T θ , DC bus capacitance C d c and generator resistance and inductance parameters R e q and L e q can be regarded as constant during the engine operation, and engine torque development lag (dead-time) can be calculated online based on speed measurement (estimation), as indicated above.
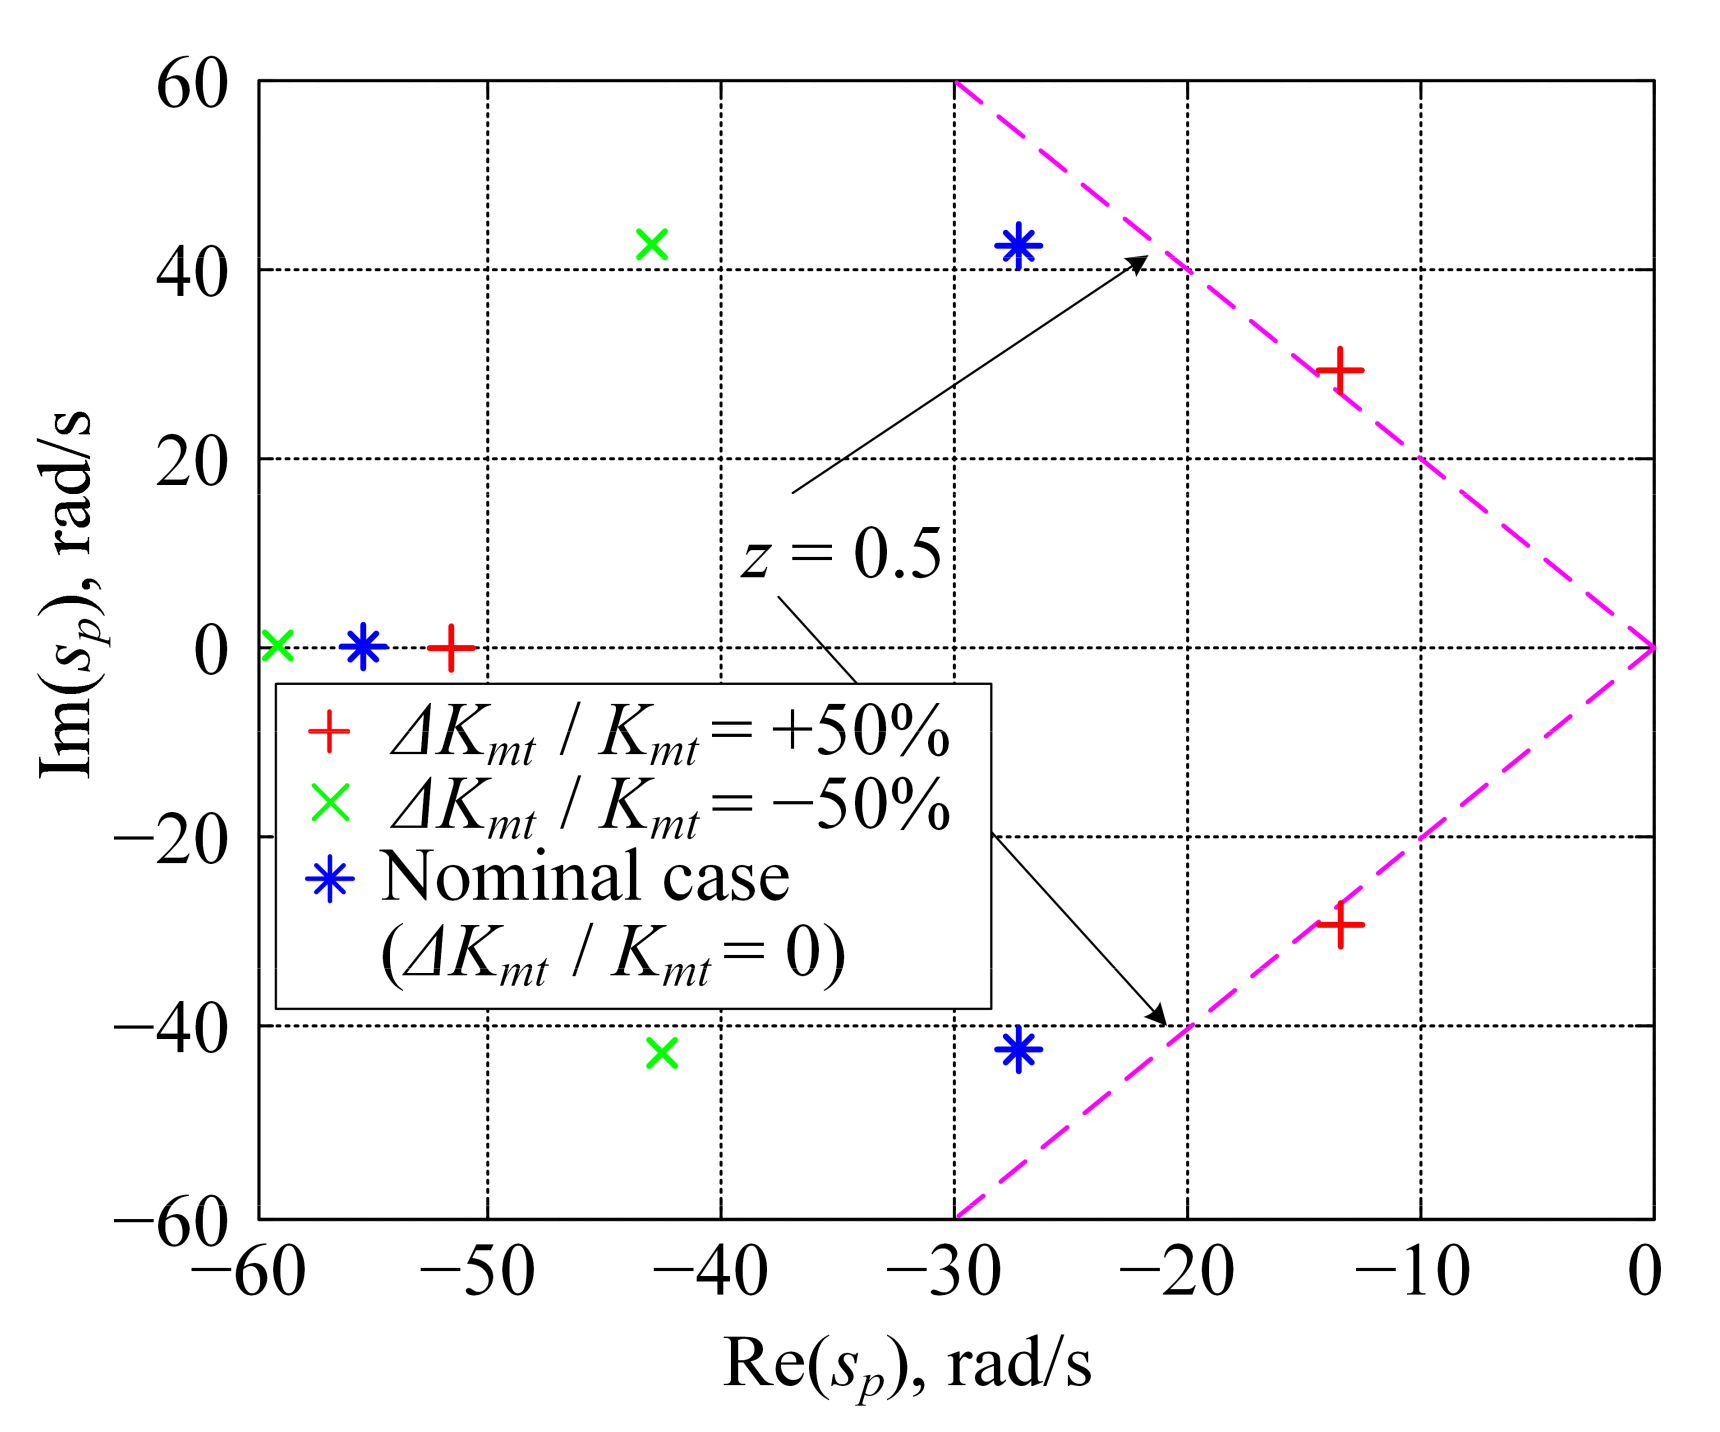
The closed-loop poles of the control system subject to torque gain variations according to the definition above are shown in Figure 12 for two characteristic scenarios, corresponding to gain K m t   relative errors of ±50% with respect to the nominal case (also shown in Figure 12), characterized by the nominal tuning of the DC bus PID controller with nominal K m t gain value. The results in Figure 12 show that the torque gain error shifts the dominant conjugate-complex towards the imaginary axis of the s-plane, but the closed-loop pole damping is still favorable, i.e., it is still ζ   0.5 or better, which indicates that the proposed PID controller tuning is characterized by favorable robustness to torque gain modeling errors.
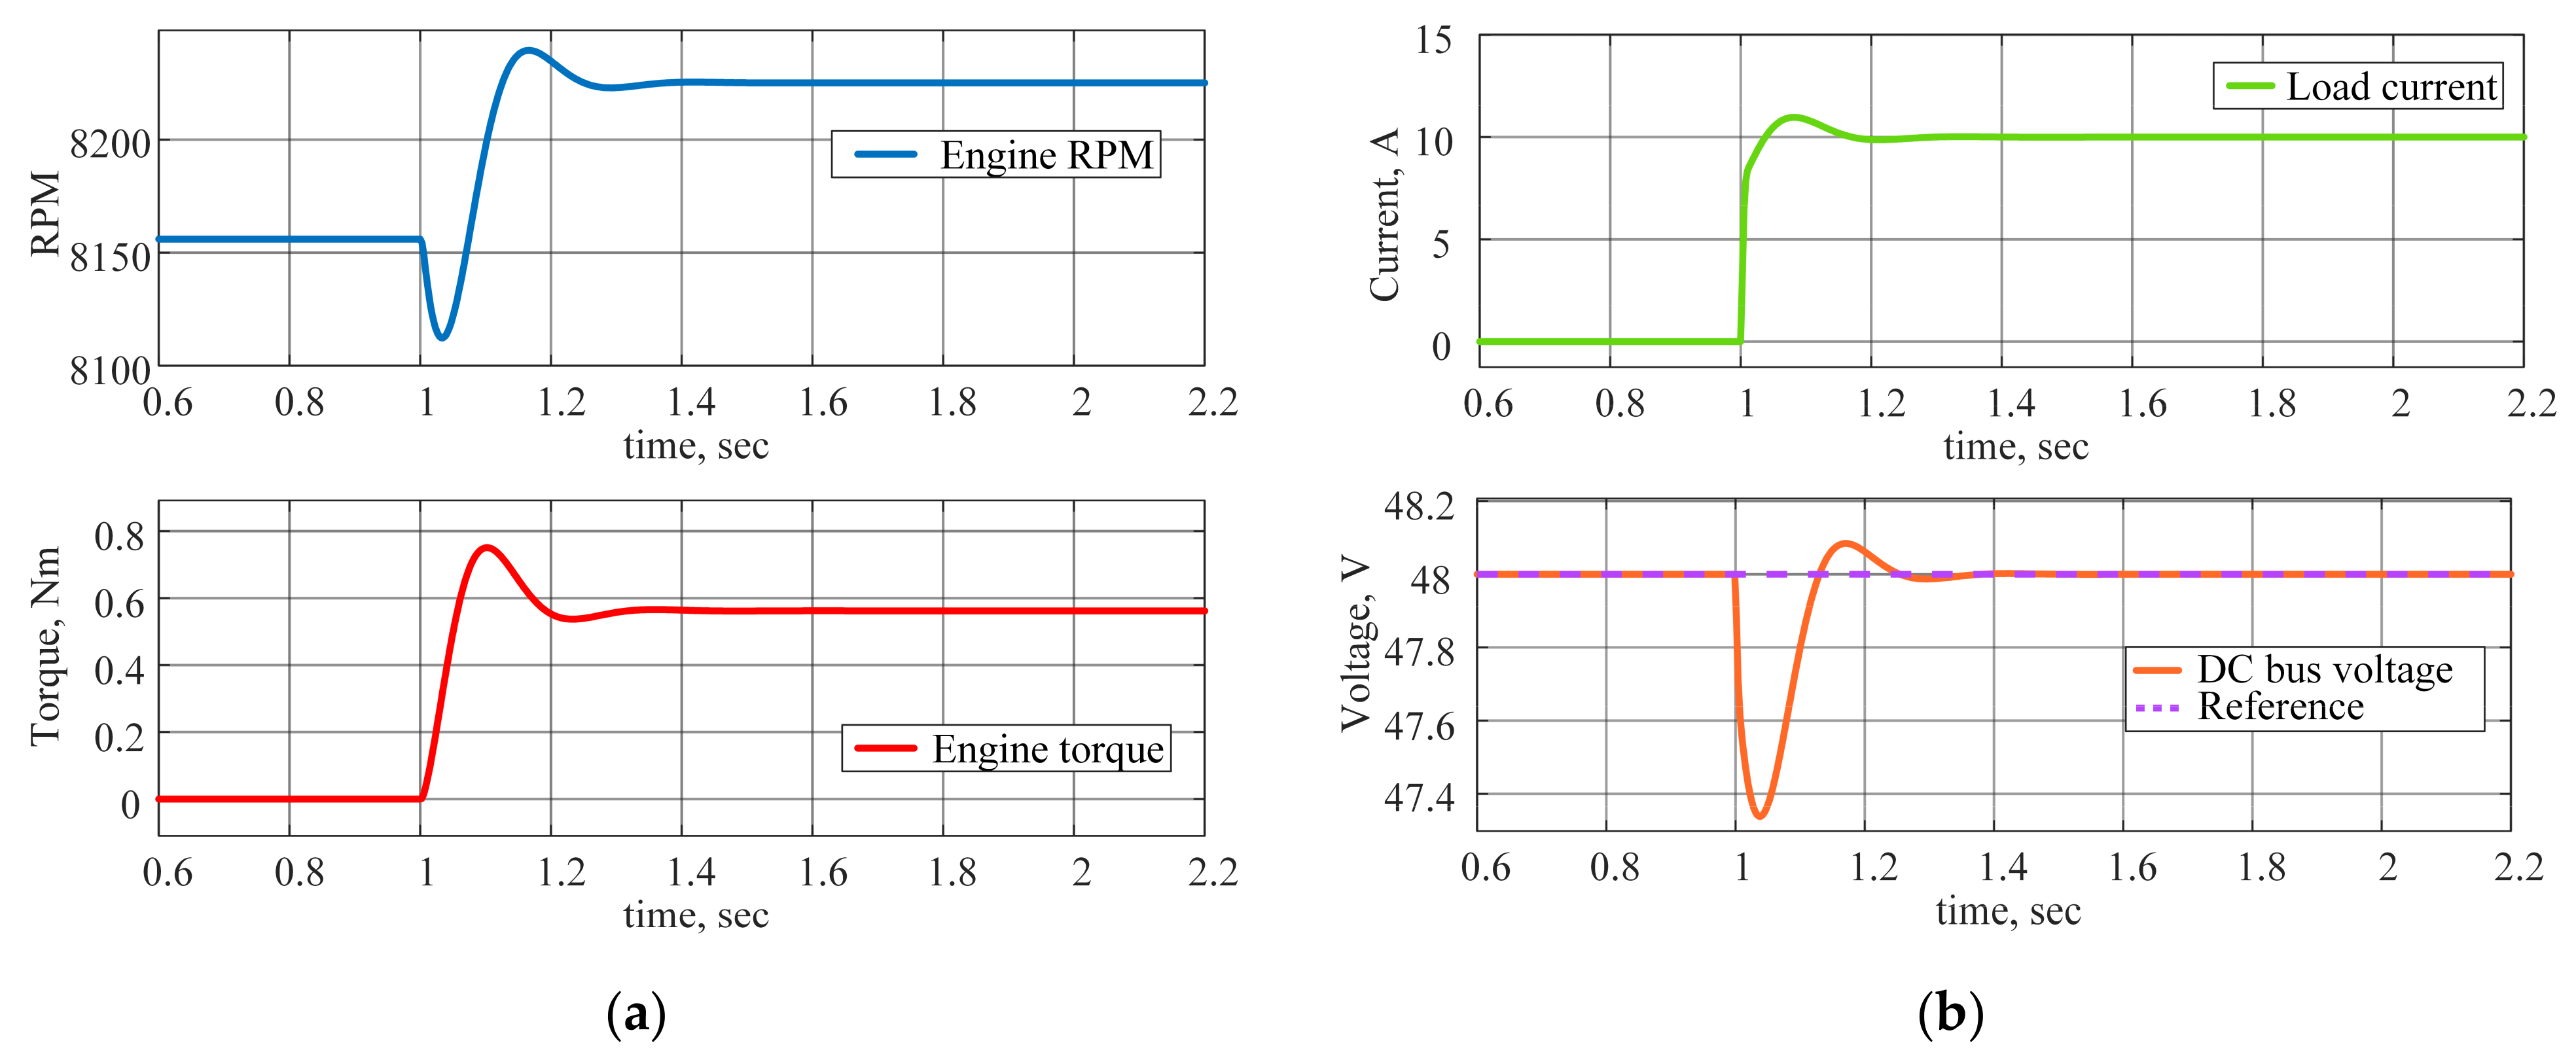
The effectiveness of such a PID controller tuning approach is illustrated by simulation results shown in Figure 13, for the case of the simplified MVEM model of the ICE used within the DC bus closed-loop control system model in Figure 11. Simulation is carried out for the DC bus load stepwise change from 0 A to 10 A and steady-state voltage reference of 48 Volts used as PID controller setpoint.
The ICE responses show that the DC bus voltage control system featuring a PID feedback controller is characterized by a rather fast response: a speed drop after the disturbance is about 45 rpm and overall engine speed recovery lasts 0.4 s. Similarly, the DC bus voltage response is characterized by a short transient with the maximum voltage drop (of about 0.6 V, and the overall load transient) lasting about 0.25 s. Such favorable closed-loop system performance is mainly due to the fast action of the derivative term within the PID feedback controller.

4. Experimental Verification of DC Bus Voltage Feedback Control System

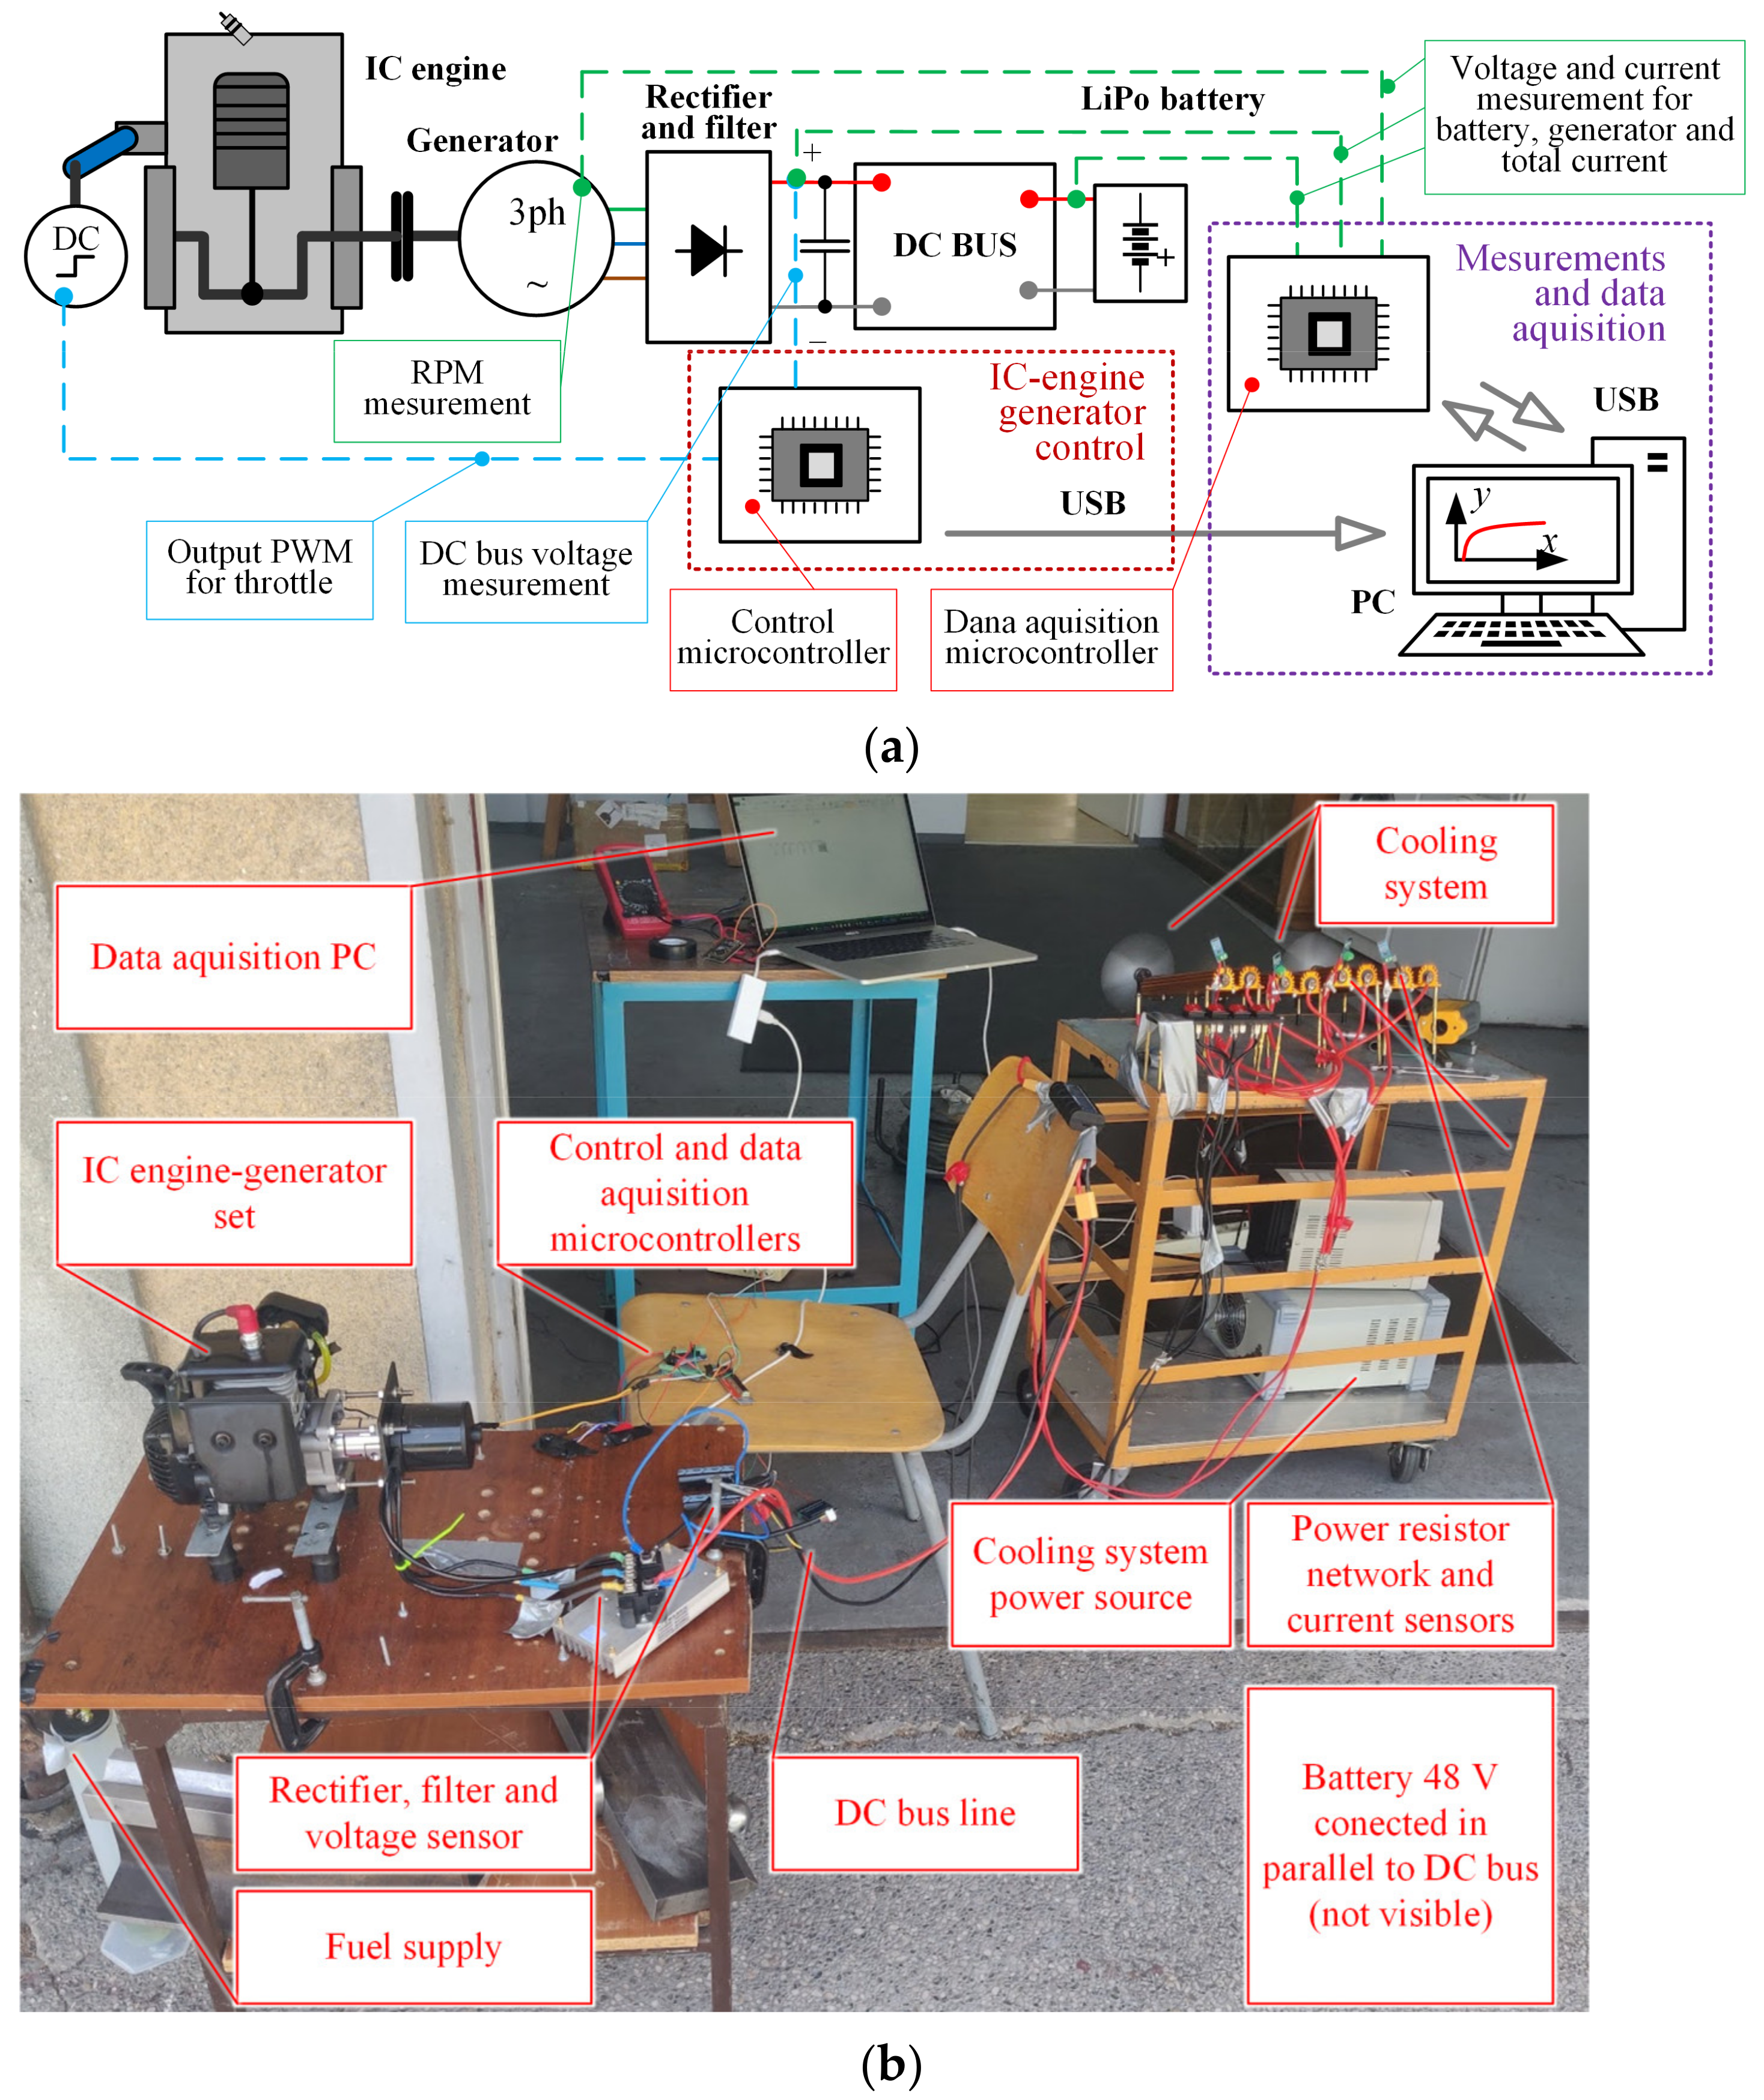
This section presents the design and development of the proposed hybrid propulsion system experimental setup (schematically shown in Figure 14a) which was subsequently tested under realistic DC bus electrical load conditions to verify its functionality and validate the simulation model.

4.1. Experimental Hybrid Power Unit Realization

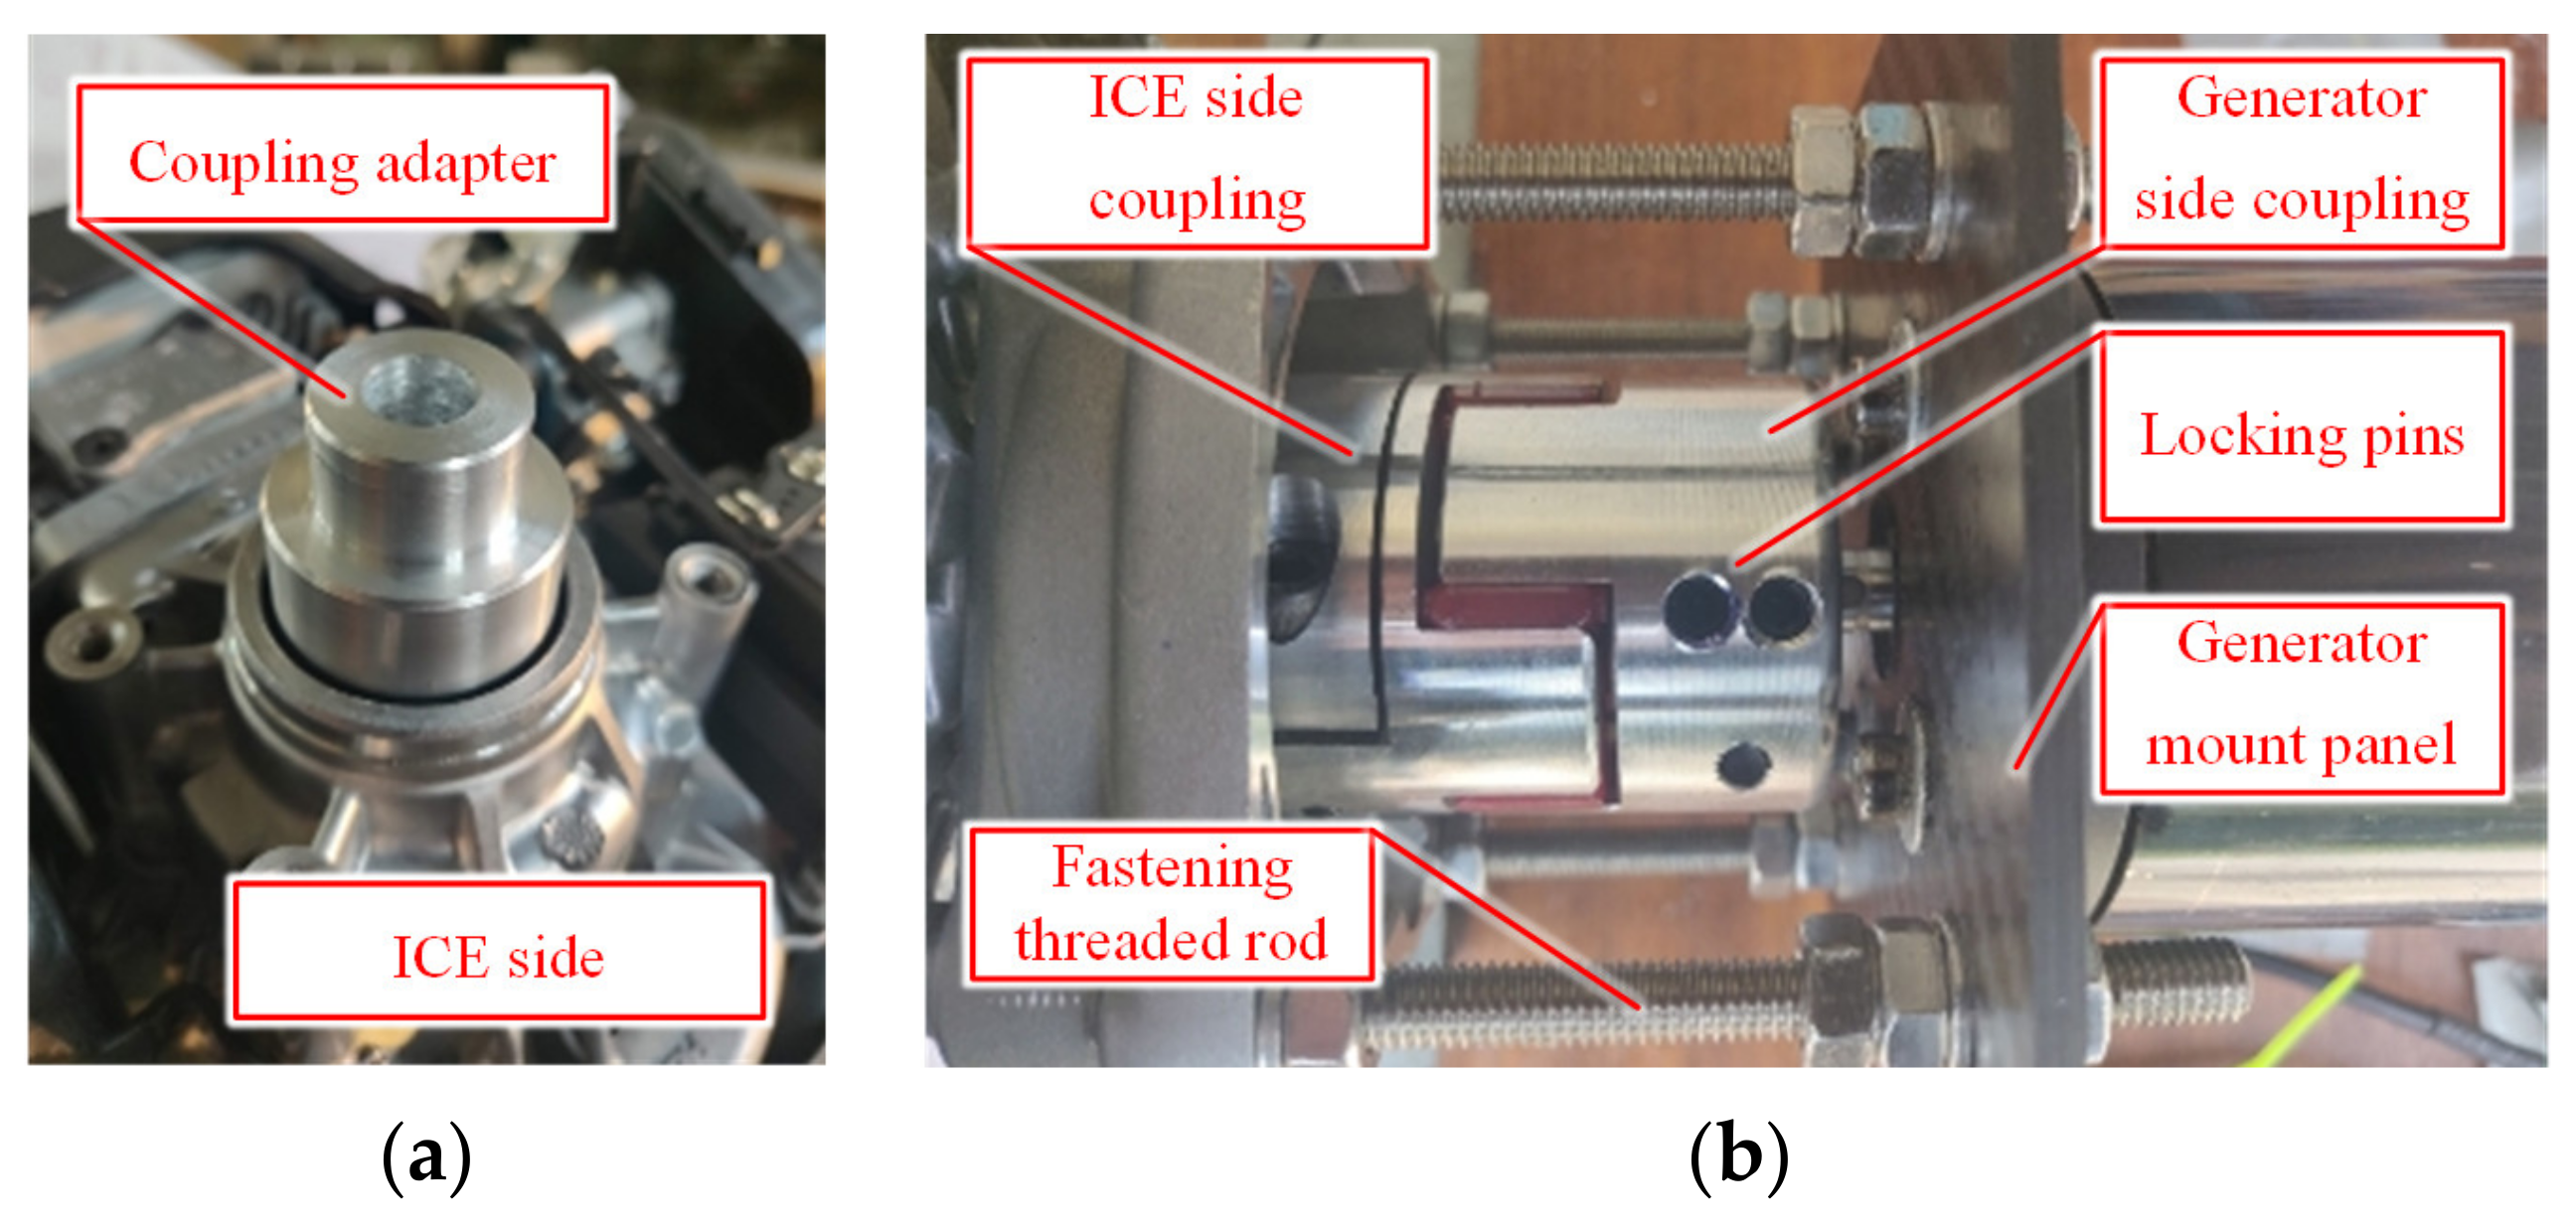
The experimental setup (a photograph is shown in Figure 14b) consists of the frame that holds all components together, the ICE-EG set that is connected to the common axle using a claw coupling and equipped with mechanical dampeners and springs, a LiPo battery, graduated cylinder tank with the capacity of 0.5 L, and various electronic circuitry including the two microcontroller boards. Separate microcontrollers are used for the ICE throttle control and data acquisition/telemetry tasks in order to avoid possible data acquisition and code execution bottlenecks. Both microcontrollers are programmed and monitored through a host portable computer running MATLAB/Simulink™ software environment. Table 3 lists the key parameters of individual components used in the setup, along with brief descriptions of these components.
The microcontroller running the PID control algorithm is equipped with a DC bus voltage sensor connected to the appropriate analog-to-digital converter input, this providing the DC voltage measurement needed to establish the feedback loop for the PID controller (as elaborated in the previous chapter). Moreover, this microcontroller also provides the actuator reference for the ICE throttle valve actuator (in the form of a suitable PWM signal). Thus, when DC bus voltage excursion due to electrical load change is detected through the change of feedback signal, the PID controller adjusts the ICE throttle PWM reference, consequently correcting the engine rotational speed and torque, i.e., the overall power output of the engine-generator set feeding the common DC bus.
Any load excess that cannot be compensated for by the DC bus voltage PID con-troller is taken over by the battery (see Figure 1), whose discharging is mandated by the perceptible DC bus voltage drop sufficient to forward bias the blocking diode. In this way, straightforward passive energy management is implemented, which is desirable from the standpoint of overall control system robustness and redundancy.
The second microcontroller used solely for data acquisition only is equipped with current sensors for the EG current, battery current, DC bus total current, rpm hall sensor, and DC bus voltage sensor. Data acquisition is executed within the MATLAB/Simulink™ software environment, using the so-called simulation model “external mode” execution thus facilitating real-time telemetry.
In order to have a safe and reliable connection between the ICE and EG, a claw coupling of sufficient torque rating is used. It is secured using an appropriate adapter with a conical hole on the engine side to connect it to the engine shaft (Figure 15a). On the EG side, the coupling must be fixed using a screw characterized by sufficient strength to withstand the load torque variations due to the stroke-based operation of the ICE (see locking pins in Figure 15b).
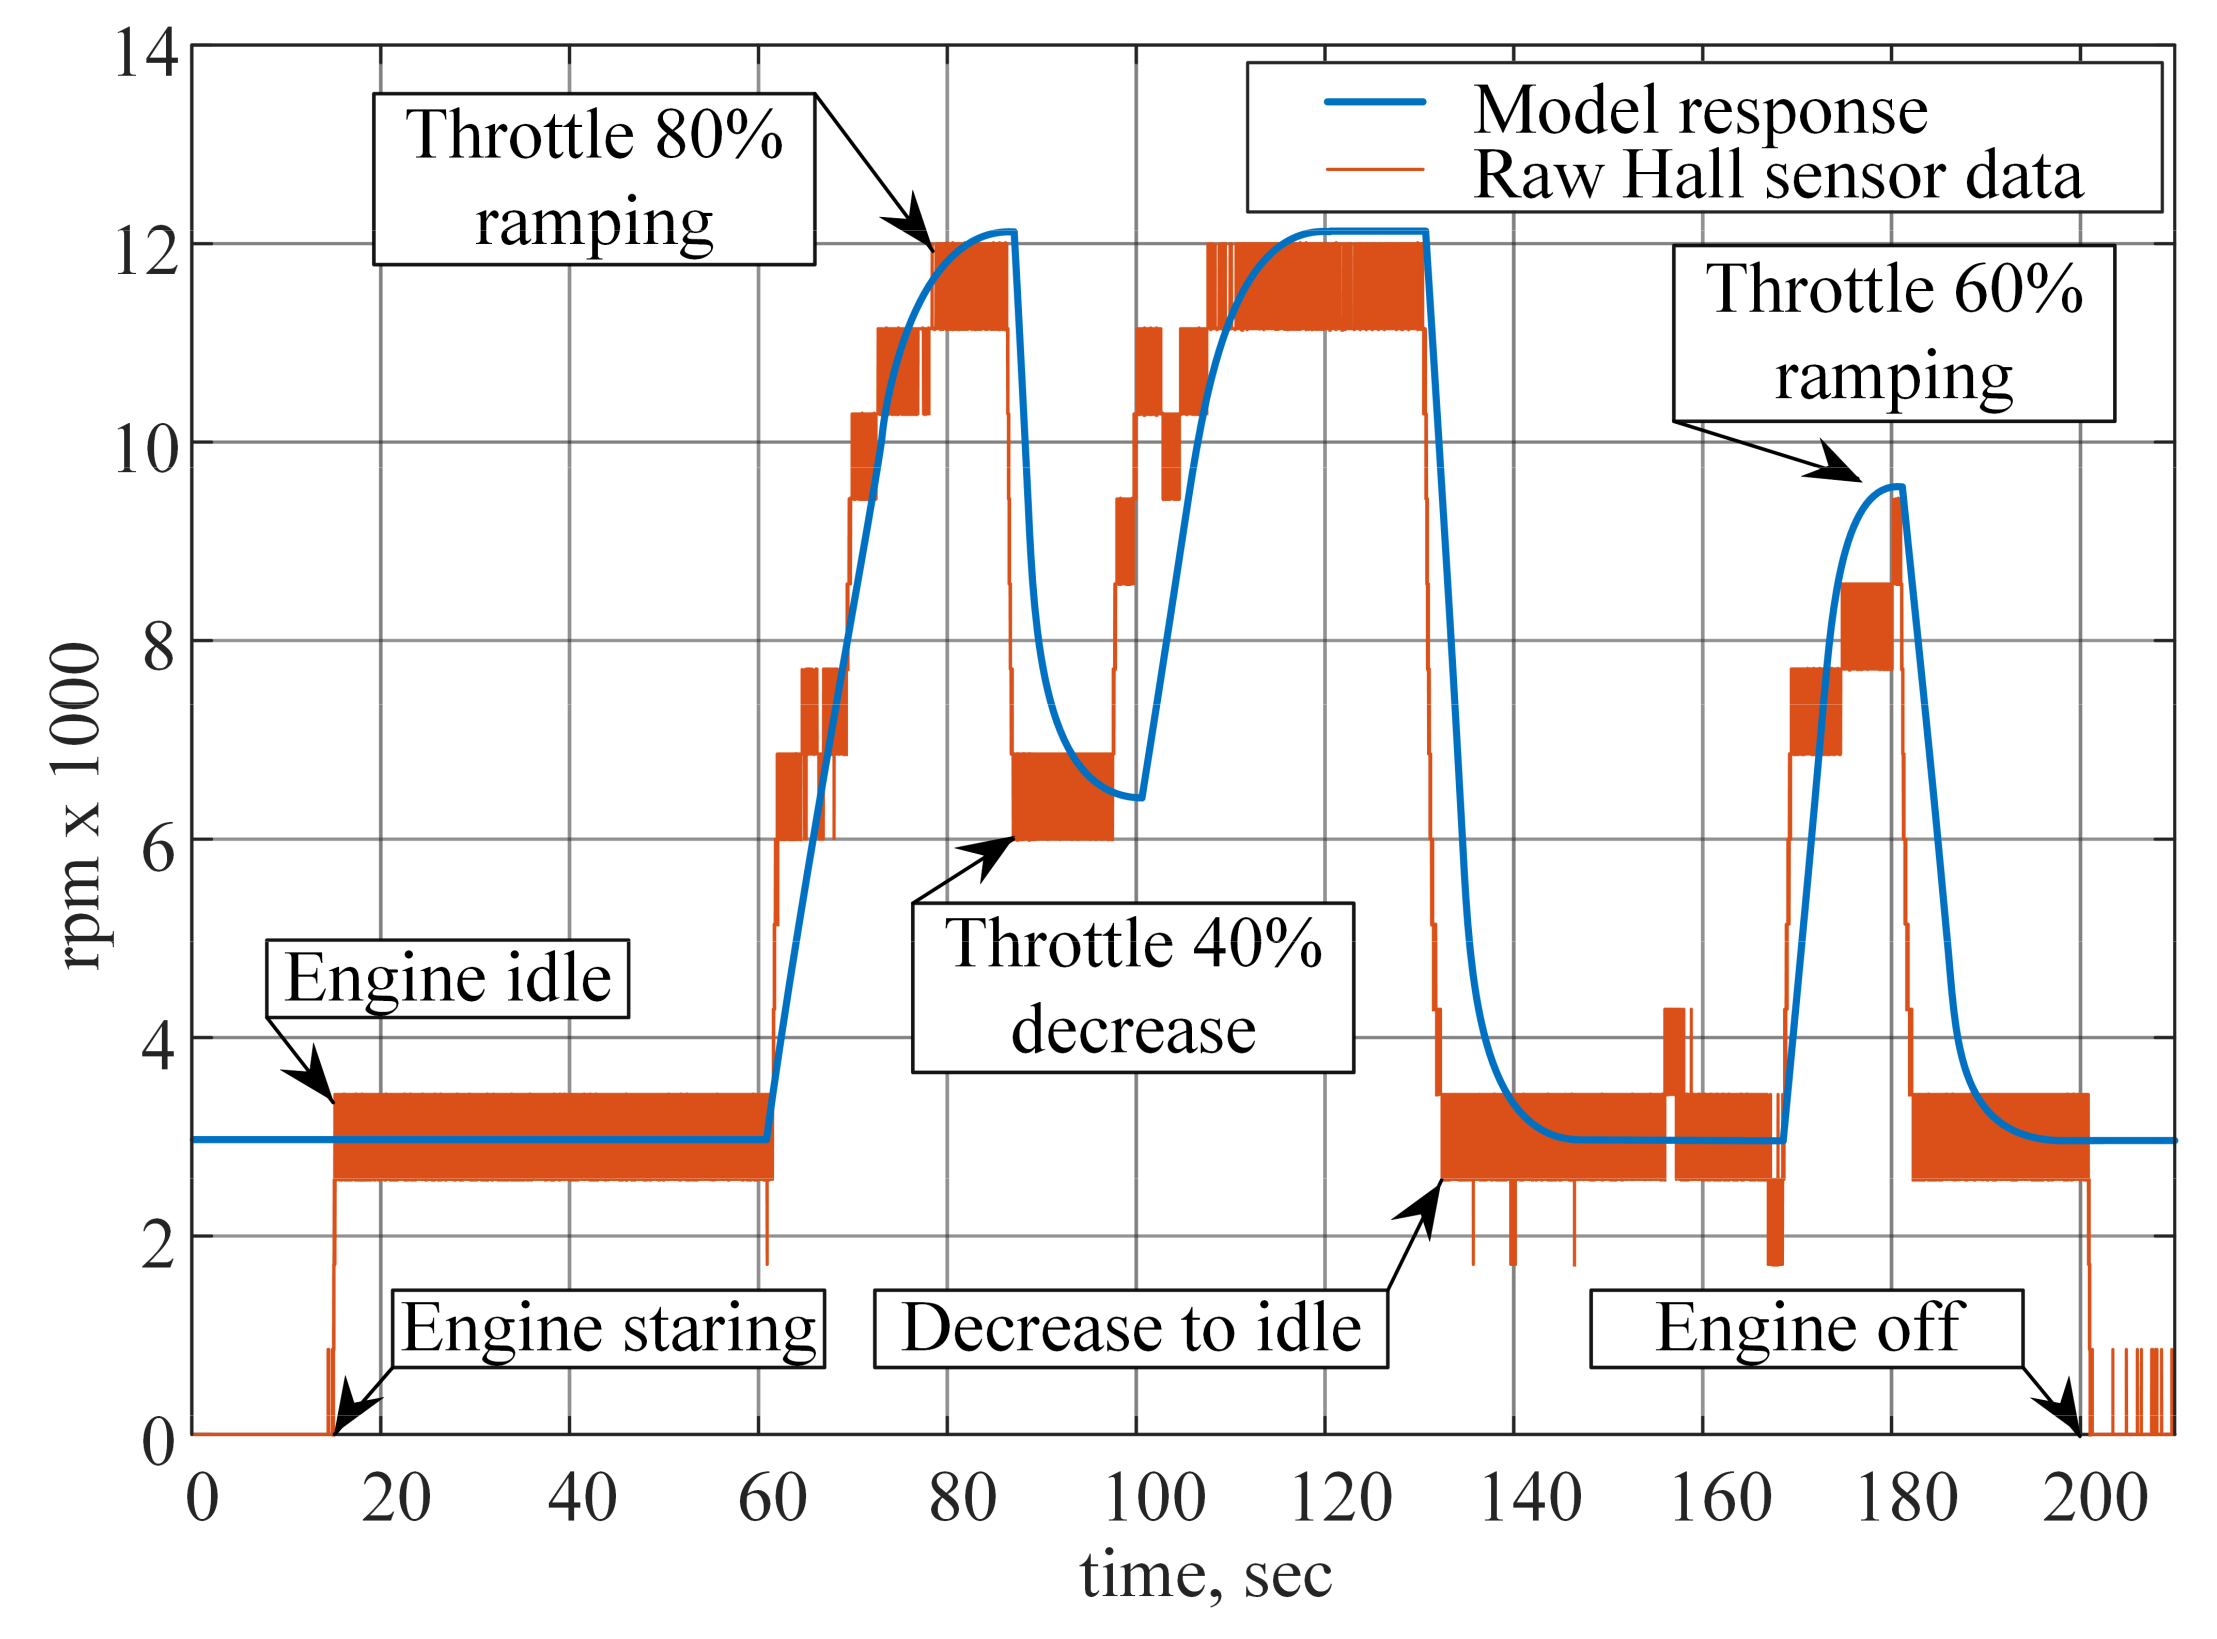
Figure 16 represents the validation of the drive simulation model shown in Section 2.3. Different modes of hybrid drive operation were considered, from the idle throttle, acceleration, and deceleration of the engine. It is shown that the proposed simulation model captures all of the dominant engine-generator system modes quite well, and as such can be used for the synthesis of the DC bus voltage control system.

4.2. Engine Fuel Consumption

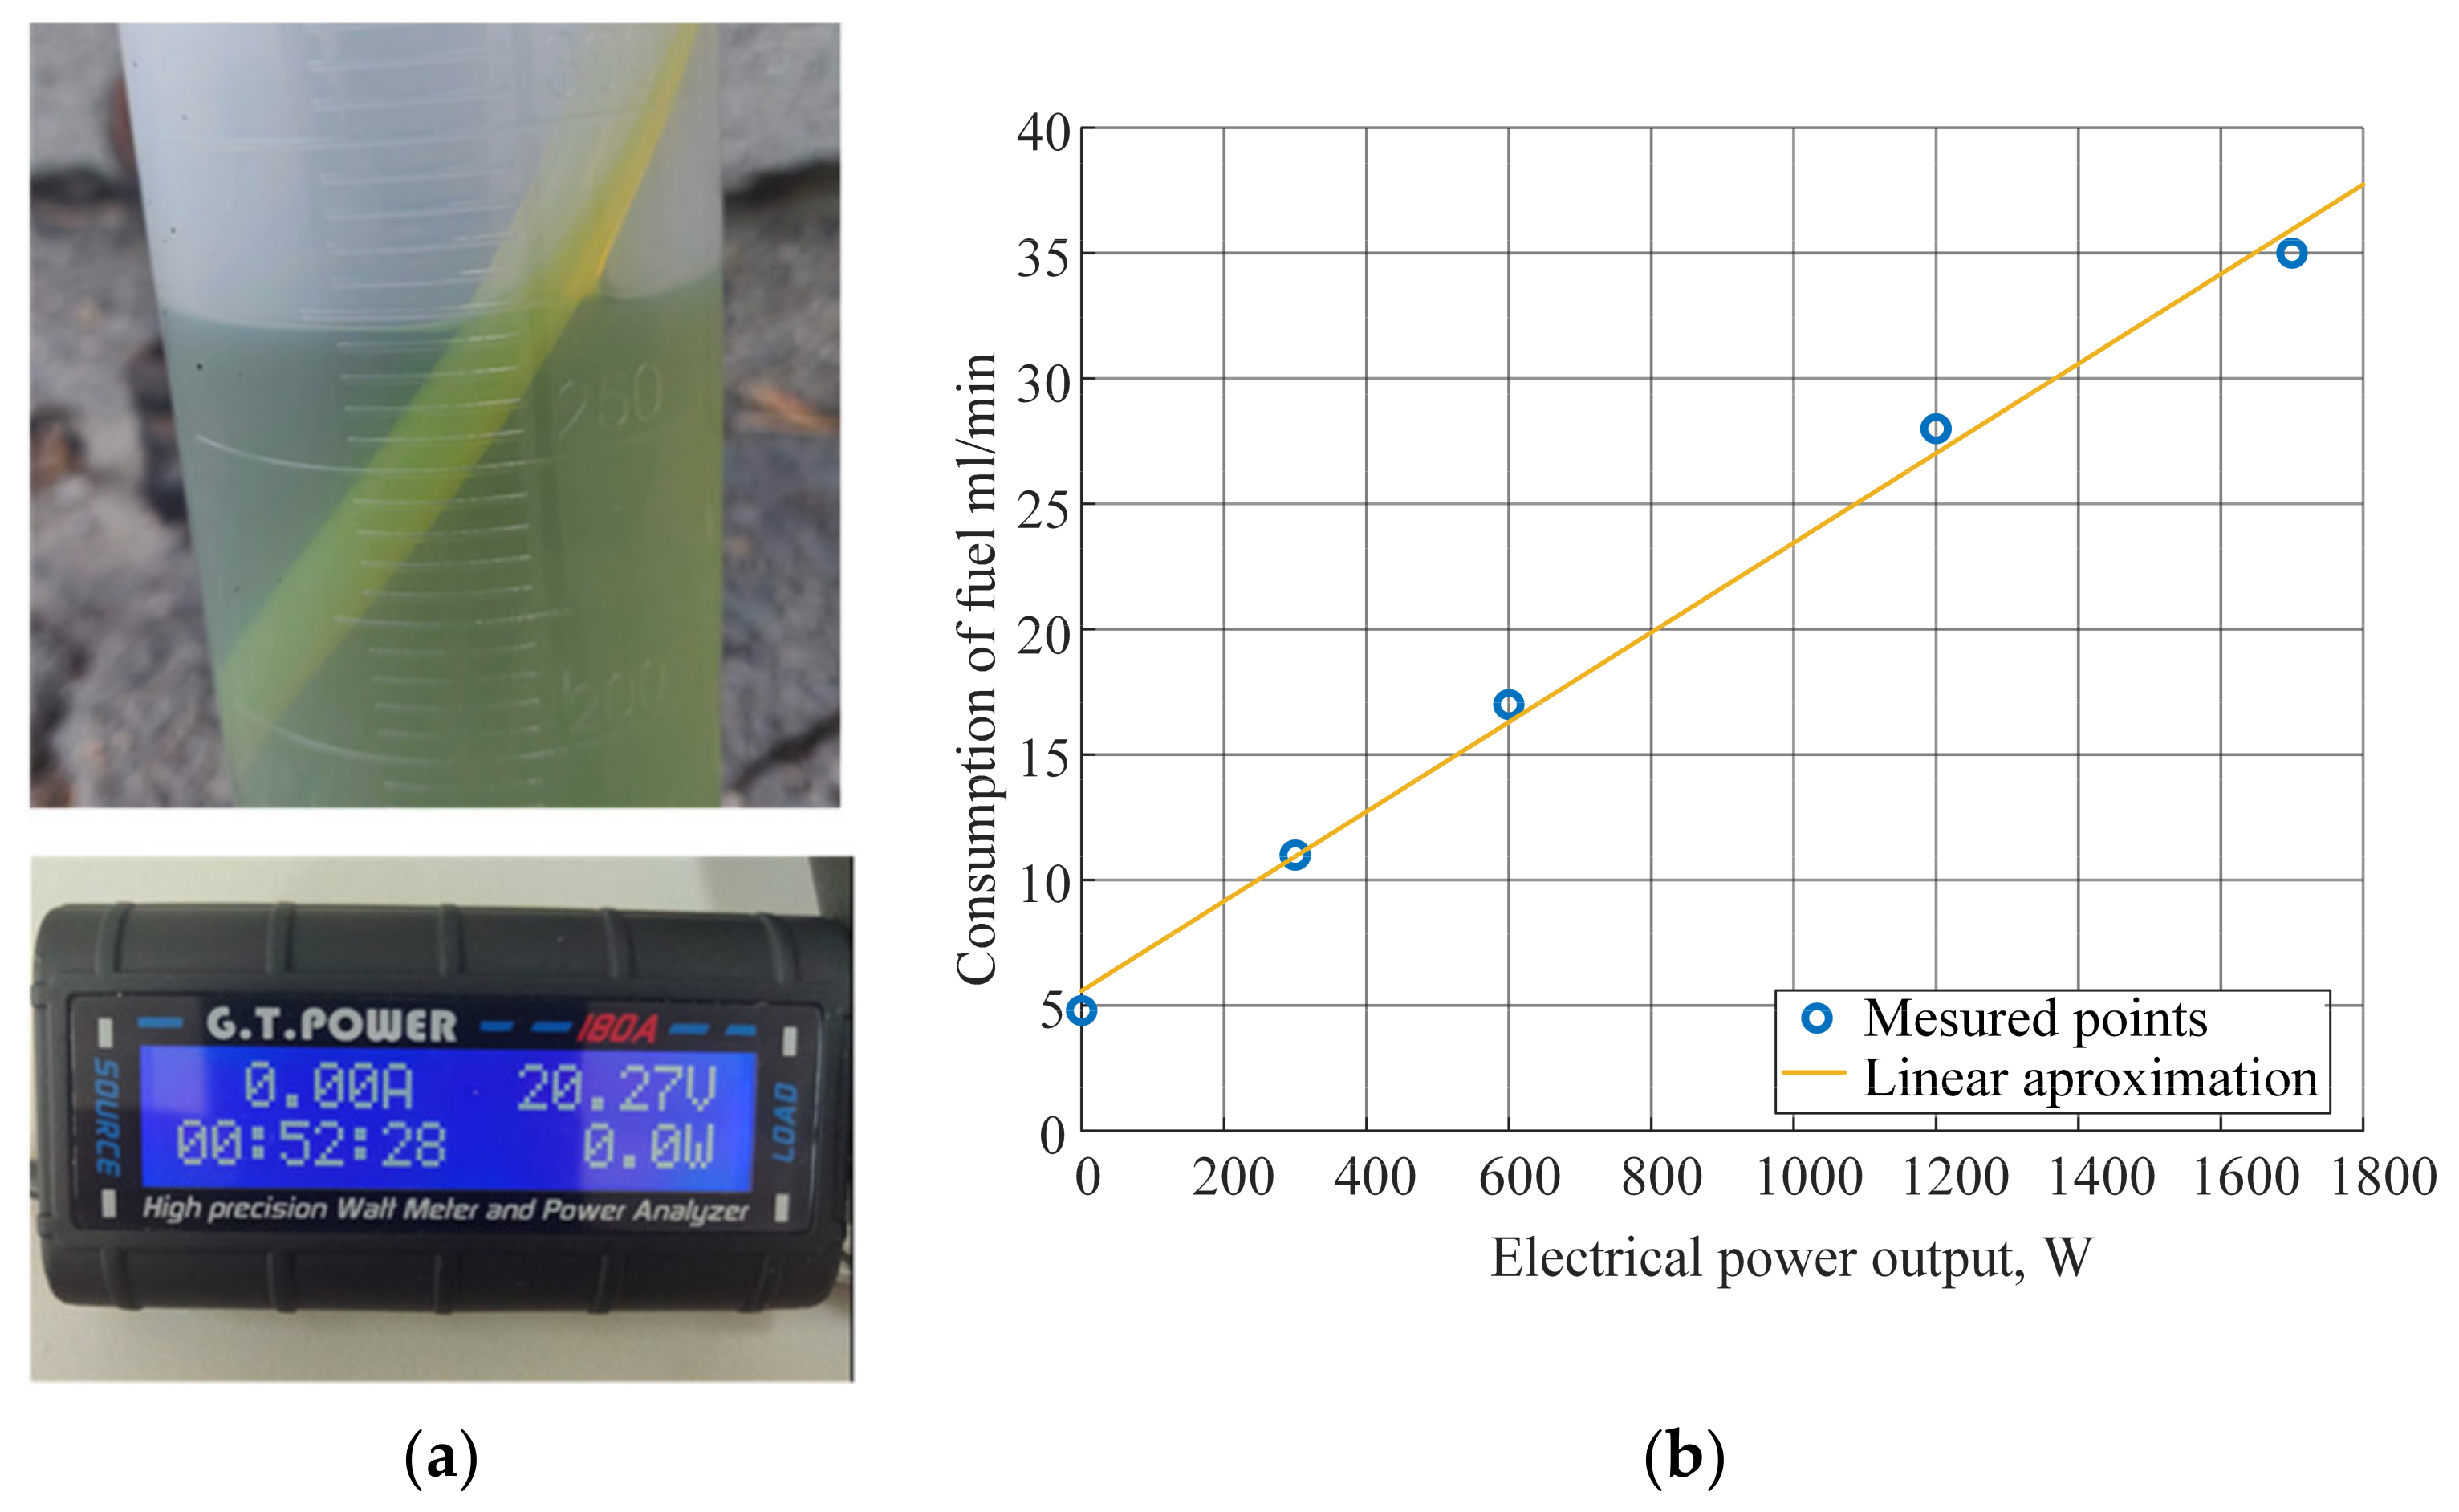
The fuel consumption was measured in engine idle regime first, followed by five characteristic operating points that corresponding to EG power output range between 300 to 1700 W. EG unit power was subsequently dissipated by the power resistor network, which was also simultaneously measured by means of a suitable DC wattmeter (see Figure 17a).
Each test was conducted under steady-state load conditions, by keeping the engine in the particular operating regime for over 5 min. For each steady-state load case, initial and final volumes of fuel were measured using the graduated cylinder tank (as shown in Figure 17a). Each test was repeated five times to obtain a reliable fuel consumption estimate. The final results of averaged fuel consumption for each operating regime are shown in Figure 17b. The presented results indicate that fuel consumption characteristic is practically linear with respect to the EG unit electrical load.

4.3. Hybrid Power Unit Measurements

In order to test the functionality of the proposed hybrid power system concept under realistic load conditions, a system was tested in several operating regimes corresponding to no-load (idling), low load, medium load, and high load operating modes. In all experiments, the voltage reference is set to 50 V. The DC bus voltage PID controller was implemented in the C programming language complying with the proposed PID algorithm structures presented in Section 3.
A stepwise load is chosen for the testing of the hybrid power system transient and steady-state performance for the following reasons: (i) it provides the most abrupt load profile, usable for stringent testing of the control system transient performance, including testing for possible saturation effects and stability issues (closed-loop damping issues), and (ii) it can be easily related to a sudden vertical ascending maneuver, because in that case all propeller drives are suddenly loaded with an almost equal constant (stepwise) load which is maintained until the desired flight level is reached.
Each test was repeated five times and consists of the following DC bus loads emulated by the power dissipation resistor network equivalent resistance:
  • 4 Ω load (low load);
  • 2 Ω load (medium load);
  • 1.33 Ω load (high load);
  • 1 Ω load (peak load).
During tests, ICE is initially held in idle conditions for approximately 5 min (engine warm-up period), followed by the DC bus load being stepped up and down, with each load step lasting several seconds to record the corresponding load-on and load-off DC bus system voltage and current transients. Offsets in current measurements are due to non–ideal sensor characteristics, notably emphasized while measuring low (near–zero) currents, which would be removed by periodic recalibration of current sensors in actual applications. Since the tests conducted herein were rather short, these offsets were simply subtracted offline after the measurements were carried out.
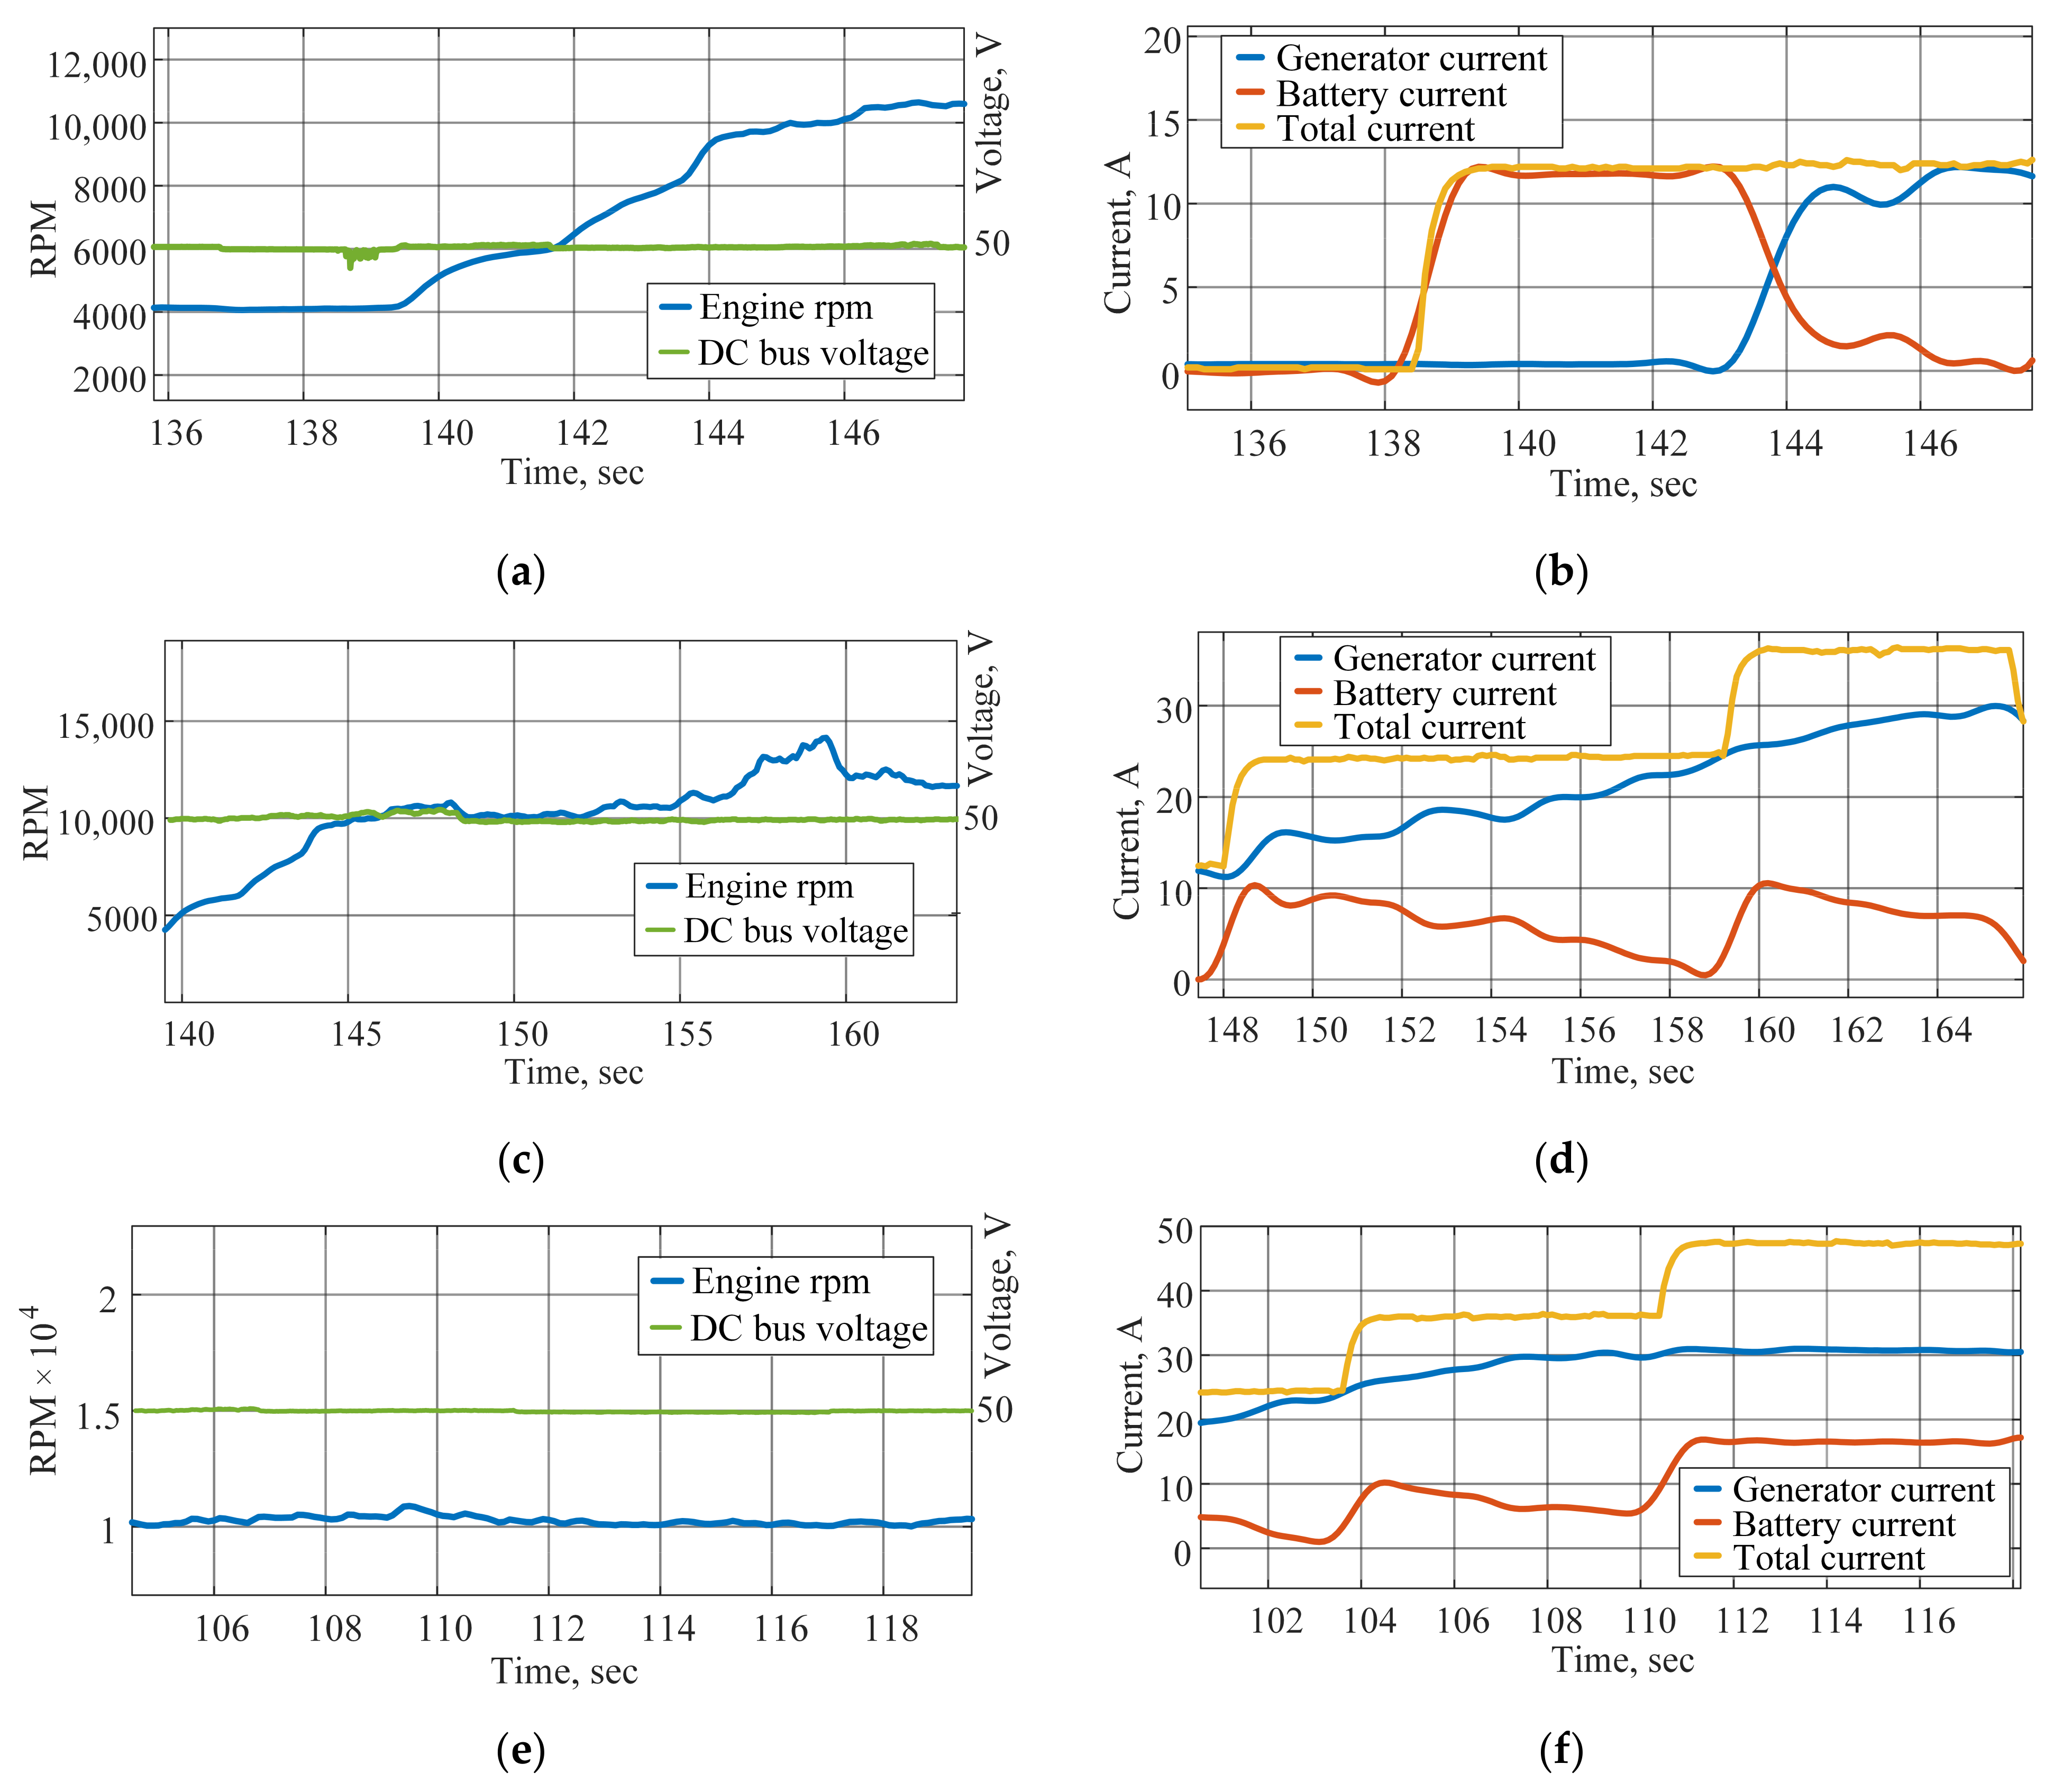
Low load responses are presented in Figure 18a,b. Initially, during the engine run-up from idle speed to the chosen operating point around 10,000 rpm, the battery provides the DC bus load (139–143 s). As the engine speed (rpm) reaches around 10,000 rpm, the EG takes over the load, and the battery current drops to zero. DC bus voltage remains stable near the target value of 50 V throughout the experiment, without significant voltage drop excursions.
Results for medium-high and high load regimes are shown in Figure 18c,d. Engine ramps up its rpm to approximately between 13,500 rpm and 14,000 rpm. As was the case for low load, the battery initially supplies DC bus load until the EG takes over, with the average generator load being around 30–35 A, thus corresponding to 1500–1750 W of power consumption at the load dissipation resistor network. Again, DC bus voltage is maintained near the target value of 50 V without significant voltage drop excursions.
Results for the case of peak load are shown in Figure 18e,f. Due to limited ICE-EG set power output, the battery needs to supply the additional current load (approx. 16 A) to the DC bus when the EG current limit of 30 A is reached. In this case, the overall hybrid power system is characterized by maximum power production, amounting to 2400–2500 W of total power output. The DC bus voltage again remains very stable near the reference voltage, without significant voltage excursions under abrupt load current changes.

5. Discussion

Based on the obtained results, it can be concluded that a functional hybrid power system has been developed comprising an ICE-EG set and LiPo battery, with the output DC voltage being fully supported by the power output of the ICE-EG set up to DC bus electrical loads amounting to 1700 W. For larger loads magnitudes, the battery pack is capable of supplying the additional peak load, so a total of 2200 W (up to 2.5 kW in best cases) can be obtained from the proposed hybrid power system. The EG is capable of continuously delivering up to 1200 W without significant heating, with increased heating of the EG (up to 85 °C) being noticed when the power demand exceeds 1500 W, primarily due to EG being fully enclosed, which may prevent adequate cooling at higher loads.
The hybrid power supply overall efficiency can be estimated in the following manner:
                η e f f = P e l P m e c h 0.75  
where P m e c h is the mechanical power at the ICE output, and P e l is the electrical power transferred from the generator to the load (i.e., power at the dissipation resistor grid). Since the engine can produce 1.8 Nm of torque at 10,500 rpm, what would correspond to the mechanical power of 1980 W. Under these conditions, electrical power dissipated that the load is 1500 W, and the overall efficiency of the hybrid power system is estimated to the aforementioned value of 0.75.
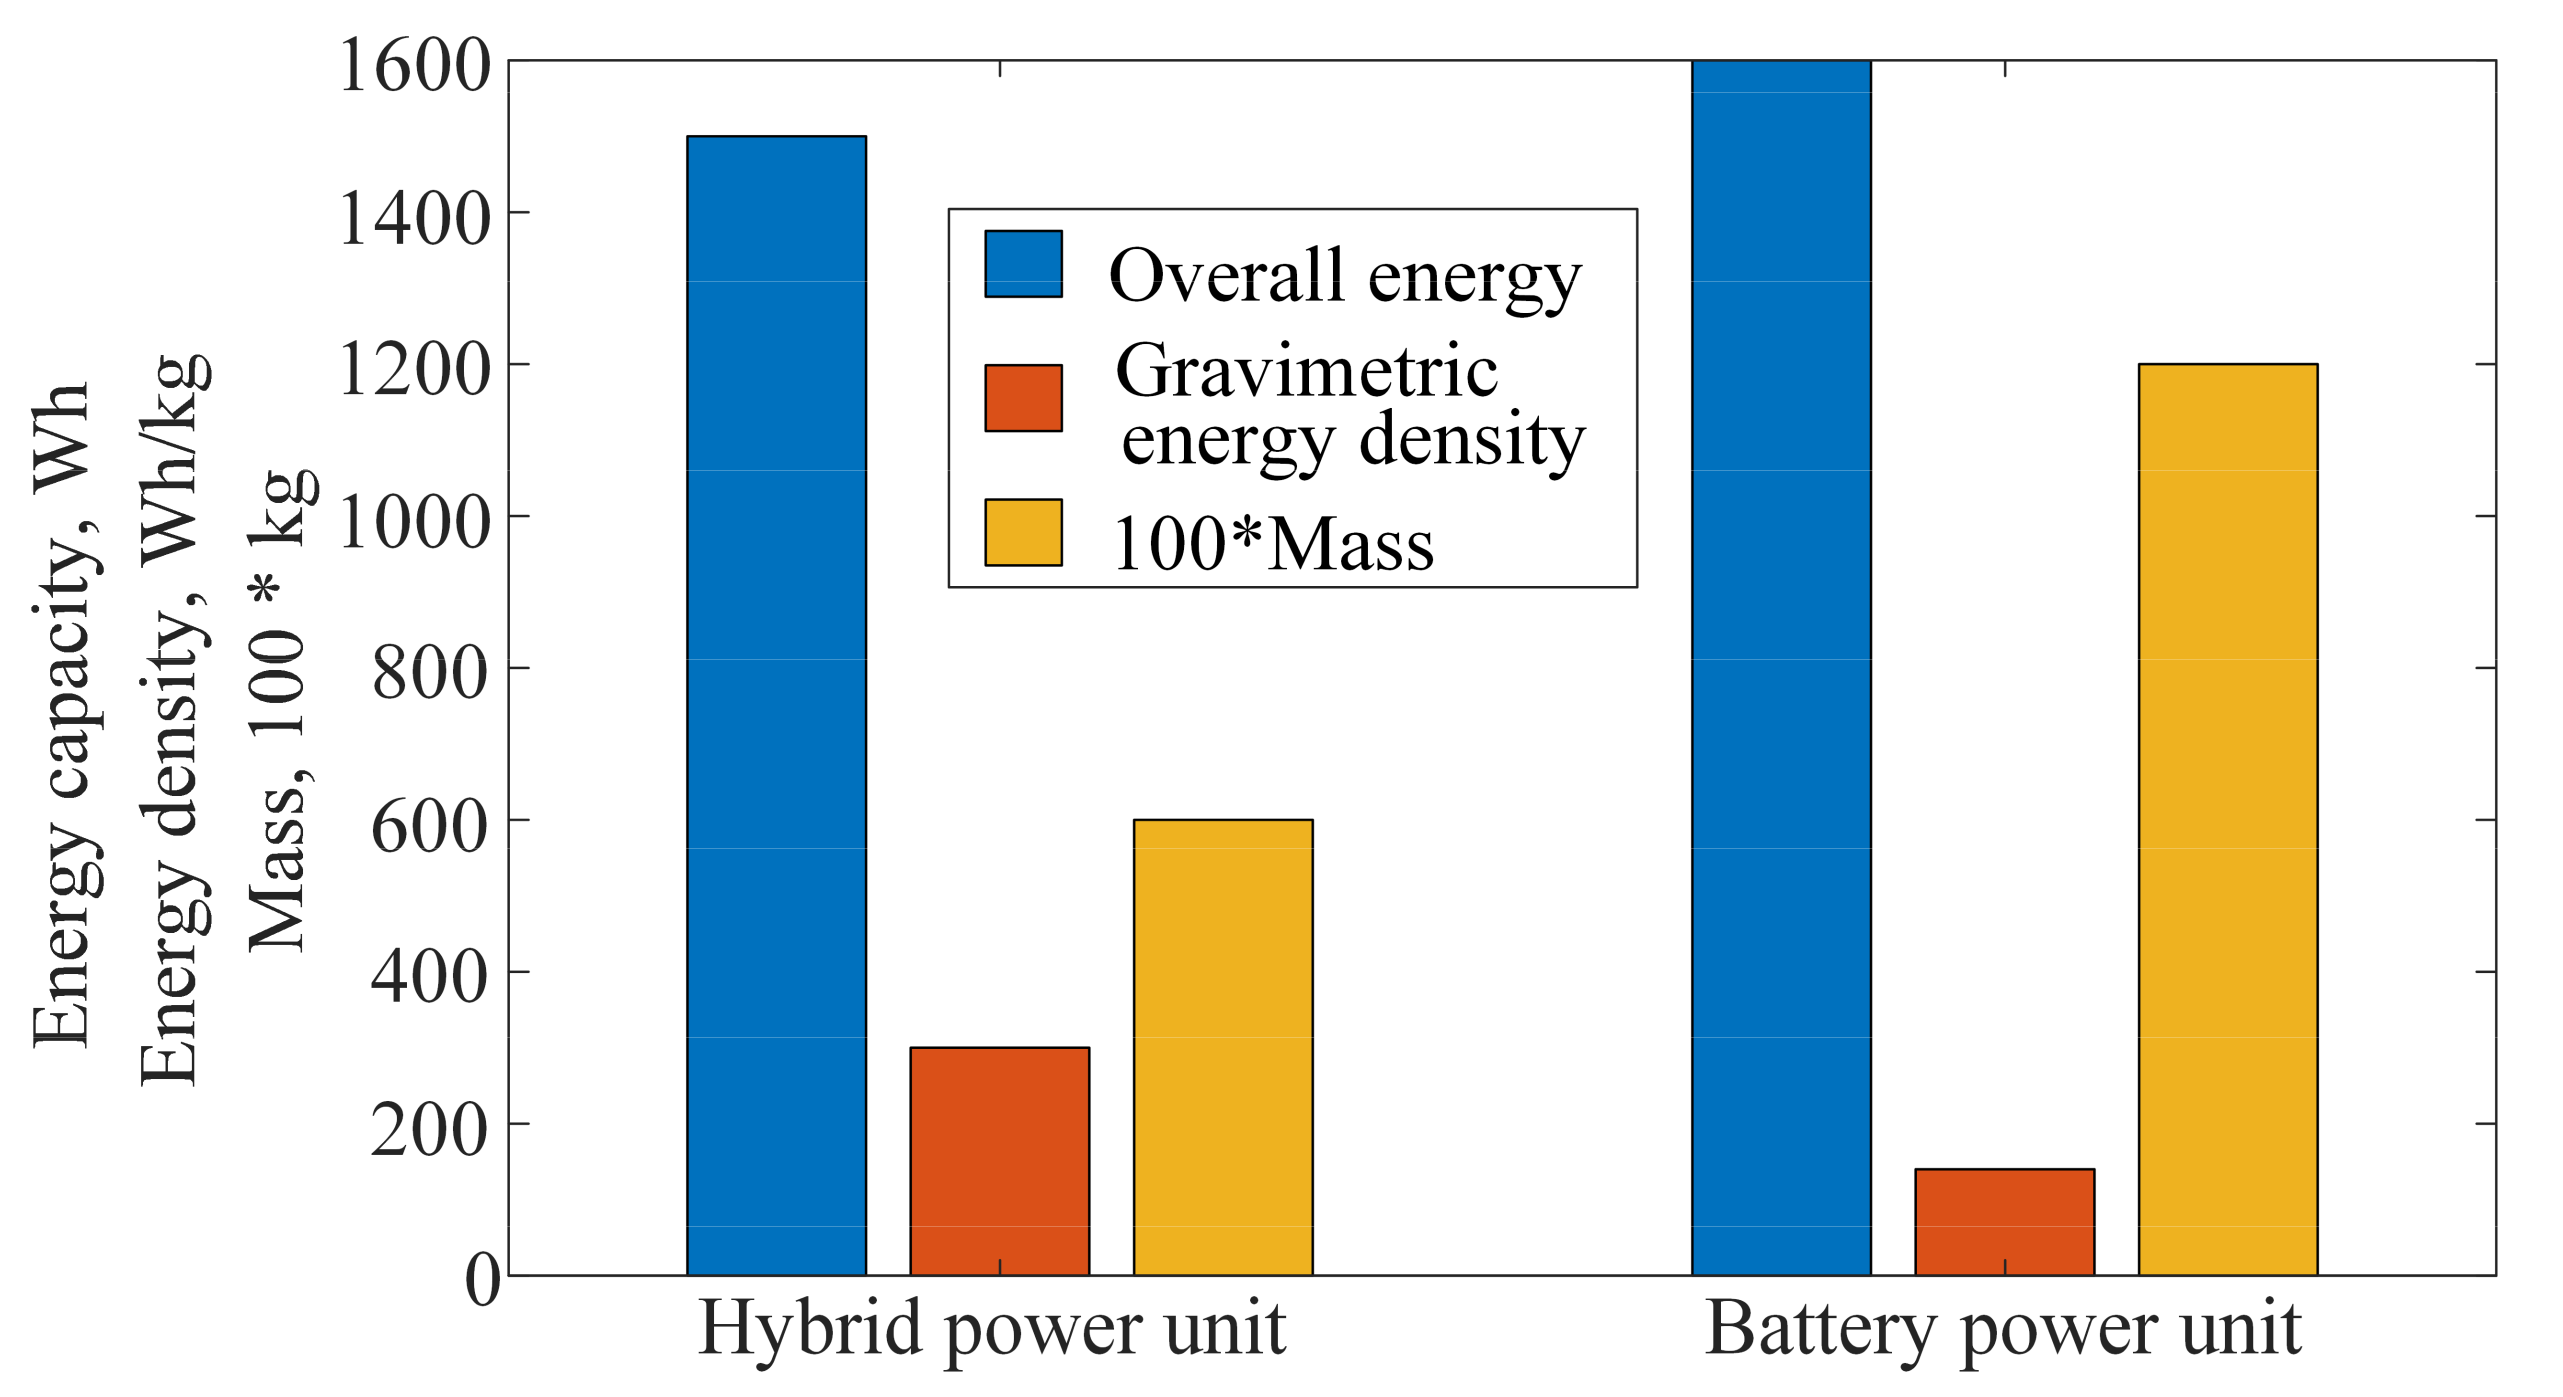
The hybrid drive vs. conventional drive efficiency analysis can be determined based on the energy obtained over a particular reference time interval. In order to equate the energy capacity of the battery and the hybrid drive energy delivery capacity in a straightforward manner, the equivalent hybrid drive energy production in Watt-hours was calculated based on the recorded data and compared with values of the energy capacity of typical batteries for UAV applications. In particular, the internal combustion engine fuel consumption is about 30 mL/min under sustained power production of 1500 W at the generator (corresponding to medium to high generator loads), thus resulting in hourly fuel consumption of about 1.8 L of fuel. This corresponds to 1500 Wh of available energy at the generator, with the overall mass of the hybrid power unit (engine, generator, rectifier, fuel) amounting to 6 kg.
On the other hand, the UAV battery pack under examination is characterized by 400 Wh of energy capacity (see results of battery identification section), with the total mass of the battery and the supporting equipment of about 3 kg. Thus, in order to match the energy output of the hybrid power unit, a total of 4 battery packs are needed, resulting in an overall battery system mass of 12 kg. It is, therefore, easily concluded that the ICE-EG hybrid power unit has a gravimetric energy density of 300 Wh/kg, while the energy-equivalent battery pack has an energy density of about 140 Wh/kg. This clearly shows that the energy (i.e., flight) autonomy of a UAV equipped with a hybrid power unit is significantly improved in comparison to the battery-only ”benchmark” case (see Figure 19).
It is important to point out that when designing the experimental setup, the authors have mounted the ICE-generator set on rubber dampeners (so-called rubber bobbins or bushings). An estimate of the vibrations magnitude was done by using vibration tests that were implemented in the UAV multirotor “Pixhawk 2” controller unit and “Mission Planner” software. It turns out that the vibration modes that occur during the operation of the ICE-based hybrid propulsion are outside the frequencies that would affect the sensors (inertial unit) and, thus, create navigation problems and stability problems for the aircraft in general. This fact inspires confidence that it should not be too complicated to decouple the hybrid drive from the frame of the aircraft and thereby reduce the impact of vibrations generated by ICE.

6. Conclusions

Based on the results of computer-based simulations and experiments conducted using the hybrid power unit test bench, and the comparative assessment of the conventional battery power unit with the proposed hybrid power unit, several clear benefits of hybrid power supply are identified, which are given below:
  • Hybridization of the conventional ICE–EG set results in a stable power source is obtained which is characterized by the gravimetric energy density which is two times higher compared to a purely battery-based power supply;
  • For the aforementioned increase in the gravimetric energy density using a hybridized ICE + EG power unit, the overall mass of the hybrid power system is two times smaller when compared to the comparable battery-based system.
According to the obtained results that indicate the maximum stable power obtained from the hybrid propulsion, in the future the plan is to build a multirotor aircraft (presumably a quadcopter) with a takeoff mass of 10–12 kg with highly efficient 22–24 inch agricultural-UAV propellers, with typical hovering regime power requirements of approximately 1000–1200 W, which would be provided for by a hybrid drive, and an additional power margin of 300–500 W, wherein any power demand above 1500 W would be covered by the battery.
In the future, it would be interesting to explore hybrid power supplies featuring energy recovery, where the battery would be recharged if the generated power of the hybrid drive allows charging of the battery, by means of simultaneous DC bus voltage and battery current control, which may require additional power electronic systems in the form of bidirectional DC/DC power converter.
Of particular interest would be the application of an active rectifier, where a stable DC bus voltage could be generated, independent of the ICE speed, which motivates further research of fuel consumption-optimal ICE control.

Author Contributions

Conceptualization, M.K. and D.P.; methodology, M.K., P.P. and D.K.; software, M.K., P.P. and D.K.; validation, M.K., P.P., and D.K.; writing—original draft, M.K. and D.P.; writing—review and editing, M.K. and D.P. All authors have read and agreed to the published version of the manuscript.

Funding

This research was funded by European Regional Development Fund, Operational programme competitiveness and cohesion 2014–2020, grant number KK.01.1.1.04.0092 and the APC was funded by KK.01.1.1.04.0092.

Institutional Review Board Statement

Not applicable.

Informed Consent Statement

Not applicable.

Data Availability Statement

Not applicable.

Conflicts of Interest

The authors declare no conflict of interest.

References

  1. Fischer, M.; Werber, M.; Schwartz, P.V. Batteries: Higher energy density than gasoline? Energy Policy 2009, 37, 2639–2641. [Google Scholar] [CrossRef]
  2. Cipek, M.; Pavković, D.; Petrić, J. A control-oriented simulation model of a power-split hybrid electric vehicle. Appl. Energy 2013, 101, 121–133. [Google Scholar] [CrossRef]
  3. Cipek, M.; Pavković, D.; Kljaić, Z.; Mlinarić, T. Assessment of battery-hybrid diesel-electric locomotive fuel savings and emission reduction potentials based on a realistic mountainous rail route. Energy 2019, 173, 1154–1171. [Google Scholar] [CrossRef]
  4. Abdul Sathar Eqbal, M.; Fernando, N.; Marino, M.; Wild, G. Hybrid propulsion systems for remotely piloted aircraft systems. Aerospace 2018, 5, 34. [Google Scholar] [CrossRef] [Green Version]
  5. Friedrich, C.; Robertson, P.A. Hybrid-electric propulsion for aircraft. J. Aircr. 2015, 52, 176–189. [Google Scholar] [CrossRef]
  6. Recoskie, S.; Fahim, A.; Gueaieb, W.; Lanteigne, E. Hybrid power plant design for a long-range dirigible UAV. IEEE Trans. Mechatron. 2013, 19, 606–614. [Google Scholar] [CrossRef]
  7. Recoskie, S.; Fahim, A.; Gueaieb, W.; Lanteigne, E. Experimental testing of a hybrid power plant for a dirigible UAV. J. Intell. Robot. Syst. 2013, 69, 69–81. [Google Scholar] [CrossRef]
  8. Donateo, T.; De Pascalis, C.L.; Ficarella, A. Synergy effects in electric and hybrid electric aircraft. Aerospace 2019, 6, 32. [Google Scholar] [CrossRef] [Green Version]
  9. Depcik, C.; Cassady, T.; Collicott, B.; Burugupally, S.P.; Li, X.; Alam, S.S.; Hobeck, J. Comparison of lithium ion Batteries, hydrogen fueled combustion Engines, and a hydrogen fuel cell in powering a small Unmanned Aerial Vehicle. Energy Convers. Manag. 2020, 207, 112514. [Google Scholar] [CrossRef]
  10. Hageman, M.D.; McLaughlin, T.E. Considerations for Pairing the IC Engine and Electric Motor in a Hybrid Power System for Small UAVs. In Proceedings of the 2018 AIAA Aerospace Sciences Meeting, Kissimmee, FL, USA, 8–12 January 2018; p. 2132. [Google Scholar]
  11. McKinney, K.; Feight, J.A.; Gaeta, R.J.; Jacob, J.D. Implementation Implications of Hybrid-Electric Power Systems on Multi-Rotor UAS. In Proceedings of the 2018 AIAA Information Systems-AIAA Infotech @ Aerospace, Kissimmee, FL, USA, 8–12 January 2018; p. 986. [Google Scholar]
  12. Dudek, M.; Tomczyk, P.; Wygonik, P.; Korkosz, M.; Bogusz, P.; Lis, B. Hybrid fuel cell–battery system as a main power unit for small unmanned aerial vehicles (UAV). Int. J. Electrochem. Sci. 2013, 8, 8442–8463. [Google Scholar]
  13. Zhang, T.; Zhu, X.; Zhou, Z.; Wang, R.; Chen, R. Energy management of solar UAV level flight. In Proceedings of the IEEE International Conference on Prognostics and Health Management, Seattle, WA, USA, 11–13 June 2018. [Google Scholar]
  14. Panagiotou, P.; Tsavlidis, I.; Yakinthos, K. Conceptual design of a hybrid solar male UAV. Aerosp. Sci. Technol. 2016, 53, 207–219. [Google Scholar] [CrossRef]
  15. Phan, L.N.; Sarma, S.E.; Wojcik, C.M.; Davis, E.M.; Sena, B.A.; Lemus, J. Top Flight Technologies Inc, 2017. Micro Hybrid Generator System Drone. U.S. Patent 9,764,837, 19 September 2017. [Google Scholar]
  16. Jeong-Gyu, B.A.K.; Cho, J.; Kim, B.; Senghyun, Y.U.N.; Sunghong, W.O.N.; Jeong, T.C.; Sooyoung, C.H.O.; Geunho, L.E.E.; Park, K.; Juhyung, H.A.; et al. Vertical Take-Off and Landing Aircraft Using Hybrid Electric Propulsion System. U.S. Patent 9,932,118, 3 April 2018. [Google Scholar]
  17. Annati, R.E.; O’brien, P.L. Honeywell International Inc, 2012. Hybrid Power for Ducted Fan Unmanned Aerial Systems. U.S. Patent 8,128,019, 6 March 2012. [Google Scholar]
  18. Benbrook, J.A.; Hagen, C. Hybrid Powertrain Improvements for Increased Flight Duration in Multirotor Unmanned Aerial Systems. In Proceedings of the AIAA Propulsion and Energy 2019 Forum, Indianapolis, IN, USA, 19–22 August 2019; p. 4306. [Google Scholar]
  19. Lin, C.E.; Supsukbaworn, T. Development of dual power multirotor system. Int. J. Aerosp. Eng. 2017, 2017, 9821401. [Google Scholar] [CrossRef]
  20. Krznar, M. Modelling and Control of Hybrid Propulsion Systems for Multirotor Unmanned Aerial Vehicles. Ph.D. Thesis, Faculty of Mechanical Engineering and Naval Architecture, University of Zagreb, Zagreb, Croatia, 2020. [Google Scholar]
  21. Pavkovic, D.; Deur, J.; Kolmanovsky, I. Adaptive Kalman filter-based load torque compensator for improved SI engine idle speed control. In IEEE Transactions on Control Systems Technology; IEEE: Piscataway, NJ, USA, 2008; Volume 17, pp. 98–110. [Google Scholar]
  22. Krznar, M.; Pavković, D.; Kozhushko, Y.; Cipek, M.; Zorc, D.; Crneković, M. Control System Design for Hybrid Power Supply of an Unmanned Aerial Vehicle Based on Linearized Averaged Process Models. In Proceedings of the IEEE International Conference on Unmanned Aircraft Systems (ICUAS), Athens, Greece, 6 October 2020; pp. 582–587. [Google Scholar]
  23. Pavković, D.; Krznar, M.; Cipek, M.; Zorc, D.; Trstenjak, M. (September 2020). Internal Combustion Engine Control System Design Suitable for Hybrid Propulsion Applications. In Proceedings of the IEEE International Conference on Unmanned Aircraft Systems (ICUAS), Athens, Greece, 6 October 2020; pp. 1614–1619. [Google Scholar]
  24. Lu, W.; Zhang, D.; Zhang, J.; Li, T.; Hu, T. Design and implementation of a gasoline-electric hybrid propulsion system for a micro triple tilt-rotor VTOL UAV. In Proceedings of the IEEE 6th Data Driven Control and Learning Systems (DDCLS), Chongqing, China, 16 October 2017; pp. 433–438. [Google Scholar]
  25. Hung, J.Y.; Gonzalez, L.F. On parallel hybrid-electric propulsion system for unmanned aerial vehicles. Prog. Aerosp. Sci. 2012, 51, 1–17. [Google Scholar] [CrossRef] [Green Version]
  26. Thurlbeck, A.P.; Cao, Y. Analysis and modeling of UAV power system architectures. In Proceedings of the 2019 IEEE Transportation Electrification Conference and Expo (ITEC), Detroit, MI, USA, 8 August 2019; pp. 1–8. [Google Scholar]
  27. Krznar, M.; Pavković, D.; Kozhushko, Y.; Cipek, M.; Zorc, D. Generator Set Control System Design for Unmanned Aerial Vehicle Hybrid Propulsion. In Proceedings of the Digital proceedings of 4th South East Europe (SEE) Sustainable Development of Energy Water and Environment Systems (SDEWES) conference, Sarajevo, Bosnia and Herzegovina, 1–5 September 2020. [Google Scholar]
  28. Krznar, M.; Pavković, D.; Cipek, M.; Crneković, M.; Zorc, D. Design of a low-cost DC/DC Converter Power Distribution System for a Hybrid Power Unit of the Multirotor Unamnned Aerial Vheicle. In Proceedings of the Digital proceedings of 4th South East Europe (SEE) Sustainable Development of Energy Water and Environment Systems (SDEWES) conference, Sarajevo, Bosnia and Herzegovina, 1–5 September 2020. [Google Scholar]
  29. Lu, B.; Yu, Q.; Fu, X.; Shi, Y.; Cai, M. Parameter matching of hybrid coaxial rotors and multi-rotor UAV’s power system. In Proceedings of the IEEE International Conference on Aircraft Utility Systems (AUS), Beijing, China, 21 November 2016; pp. 1099–1104. [Google Scholar]
  30. Piljek, P.; Kotarski, D.; Krznar, M. Method for Characterization of a Multirotor UAV Electric Propulsion System. Appl. Sci. 2020, 10, 8229. [Google Scholar] [CrossRef]
  31. Bizon, N.; Shayeghi, H.; Tabatabaei, N.M. (Eds.) Analysis, Control and Optimal Operations in Hybrid Power Systems: Advanced Techniques and Applications for Linear and Nonlinear Systems; Springer Science & Business Media: Berlin, Germany, 2013. [Google Scholar]
  32. Hayes, J.G.; Goodarzi, G.A. Electric Powertrain: Energy Systems, Power Electronics and Drives for Hybrid, Electric and Fuel Cell Vehicles; John Wiley & Sons: Hoboken, NJ, USA, 2018. [Google Scholar]
  33. He, H.; Xiong, R.; Fan, J. Evaluation of lithium-ion battery equivalent circuit models for state of charge estimation by an experimental approach. Energies 2011, 4, 582–598. [Google Scholar] [CrossRef]
  34. Pavković, D.; Krznar, M.; Komljenović, A.; Hrgetić, M.; Zorc, D. Dual EKF-based state and parameter estimator for a LiFePo4 battery cell. J. Power Electron. 2017, 17, 398–410. [Google Scholar] [CrossRef] [Green Version]
  35. Deur, J.; Ivanović, V.; Pavković, D.; Jansz, M. Identification and speed control of SI engine for idle operating mode. Sae Tech. Pap. 2004. [Google Scholar] [CrossRef]
  36. Rajamani, R. Mean Value Modeling of SI and Diesel Engines; Springer: Boston, MA, USA, 2012. [Google Scholar]
  37. Cipek, M.; Petrić, J.; Pavković, D. A Novel Approach to Hydraulic Drive Sizing Methodology and Efficiency Estimation based on Willans Line. J. Sustain. Dev. Energy Water Environ. Syst. 2019, 7, 155–167. [Google Scholar] [CrossRef]
  38. Gamazo-Real, J.C.; Vázquez-Sánchez, E.; Gómez-Gil, J. Position and speed control of brushless DC motors using sensorless techniques and application trends. Sensors 2010, 10, 6901–6947. [Google Scholar] [CrossRef] [Green Version]
  39. Mevey, J.R. Sensorless Field-Rriented Control of Brushless Permanent Magnet Synchronous Motors. Master’s Thesis, Kansas State University, Manhattan, KS, USA, 2009. [Google Scholar]
  40. Hanselman, D.C. Brushless Permanent Magnet Motor Design; The Writers’ Collective: Cranston, RI, USA, 2003. [Google Scholar]
  41. Krznar, M.; Kotarski, D.; Pavković, D.; Piljek, P. Propeller speed estimation for unmanned aerial vehicles using Kalman filtering. Int. J. Autom. Control. 2020, 14, 284–303. [Google Scholar] [CrossRef]
  42. Dahbi, M.; Doubabi, S.; Rachid, A. Current Spikes Minimization Method for Three-Phase Permanent Magnet Brushless DC Motor with Real-Time Implementation. Energies 2018, 11, 3206. [Google Scholar] [CrossRef] [Green Version]
  43. Pavković, D.; Šprljan, O.; Cipek, M.; Krznar, M. Cross-axis control system design for borehole drilling based on damping optimum criterion and utilization of proportional-integral controllers. Optim. Eng. 2021, 22, 51–81. [Google Scholar] [CrossRef]
  44. Pavković, D.; Deur, J. Modeling and Control of Electronic Throttle Drive: A Practical Approach—From Experimental Characterization to Adaptive Control and Application; Lambert Academic Publishing: Saarbrücken, Germany, 2011. [Google Scholar]
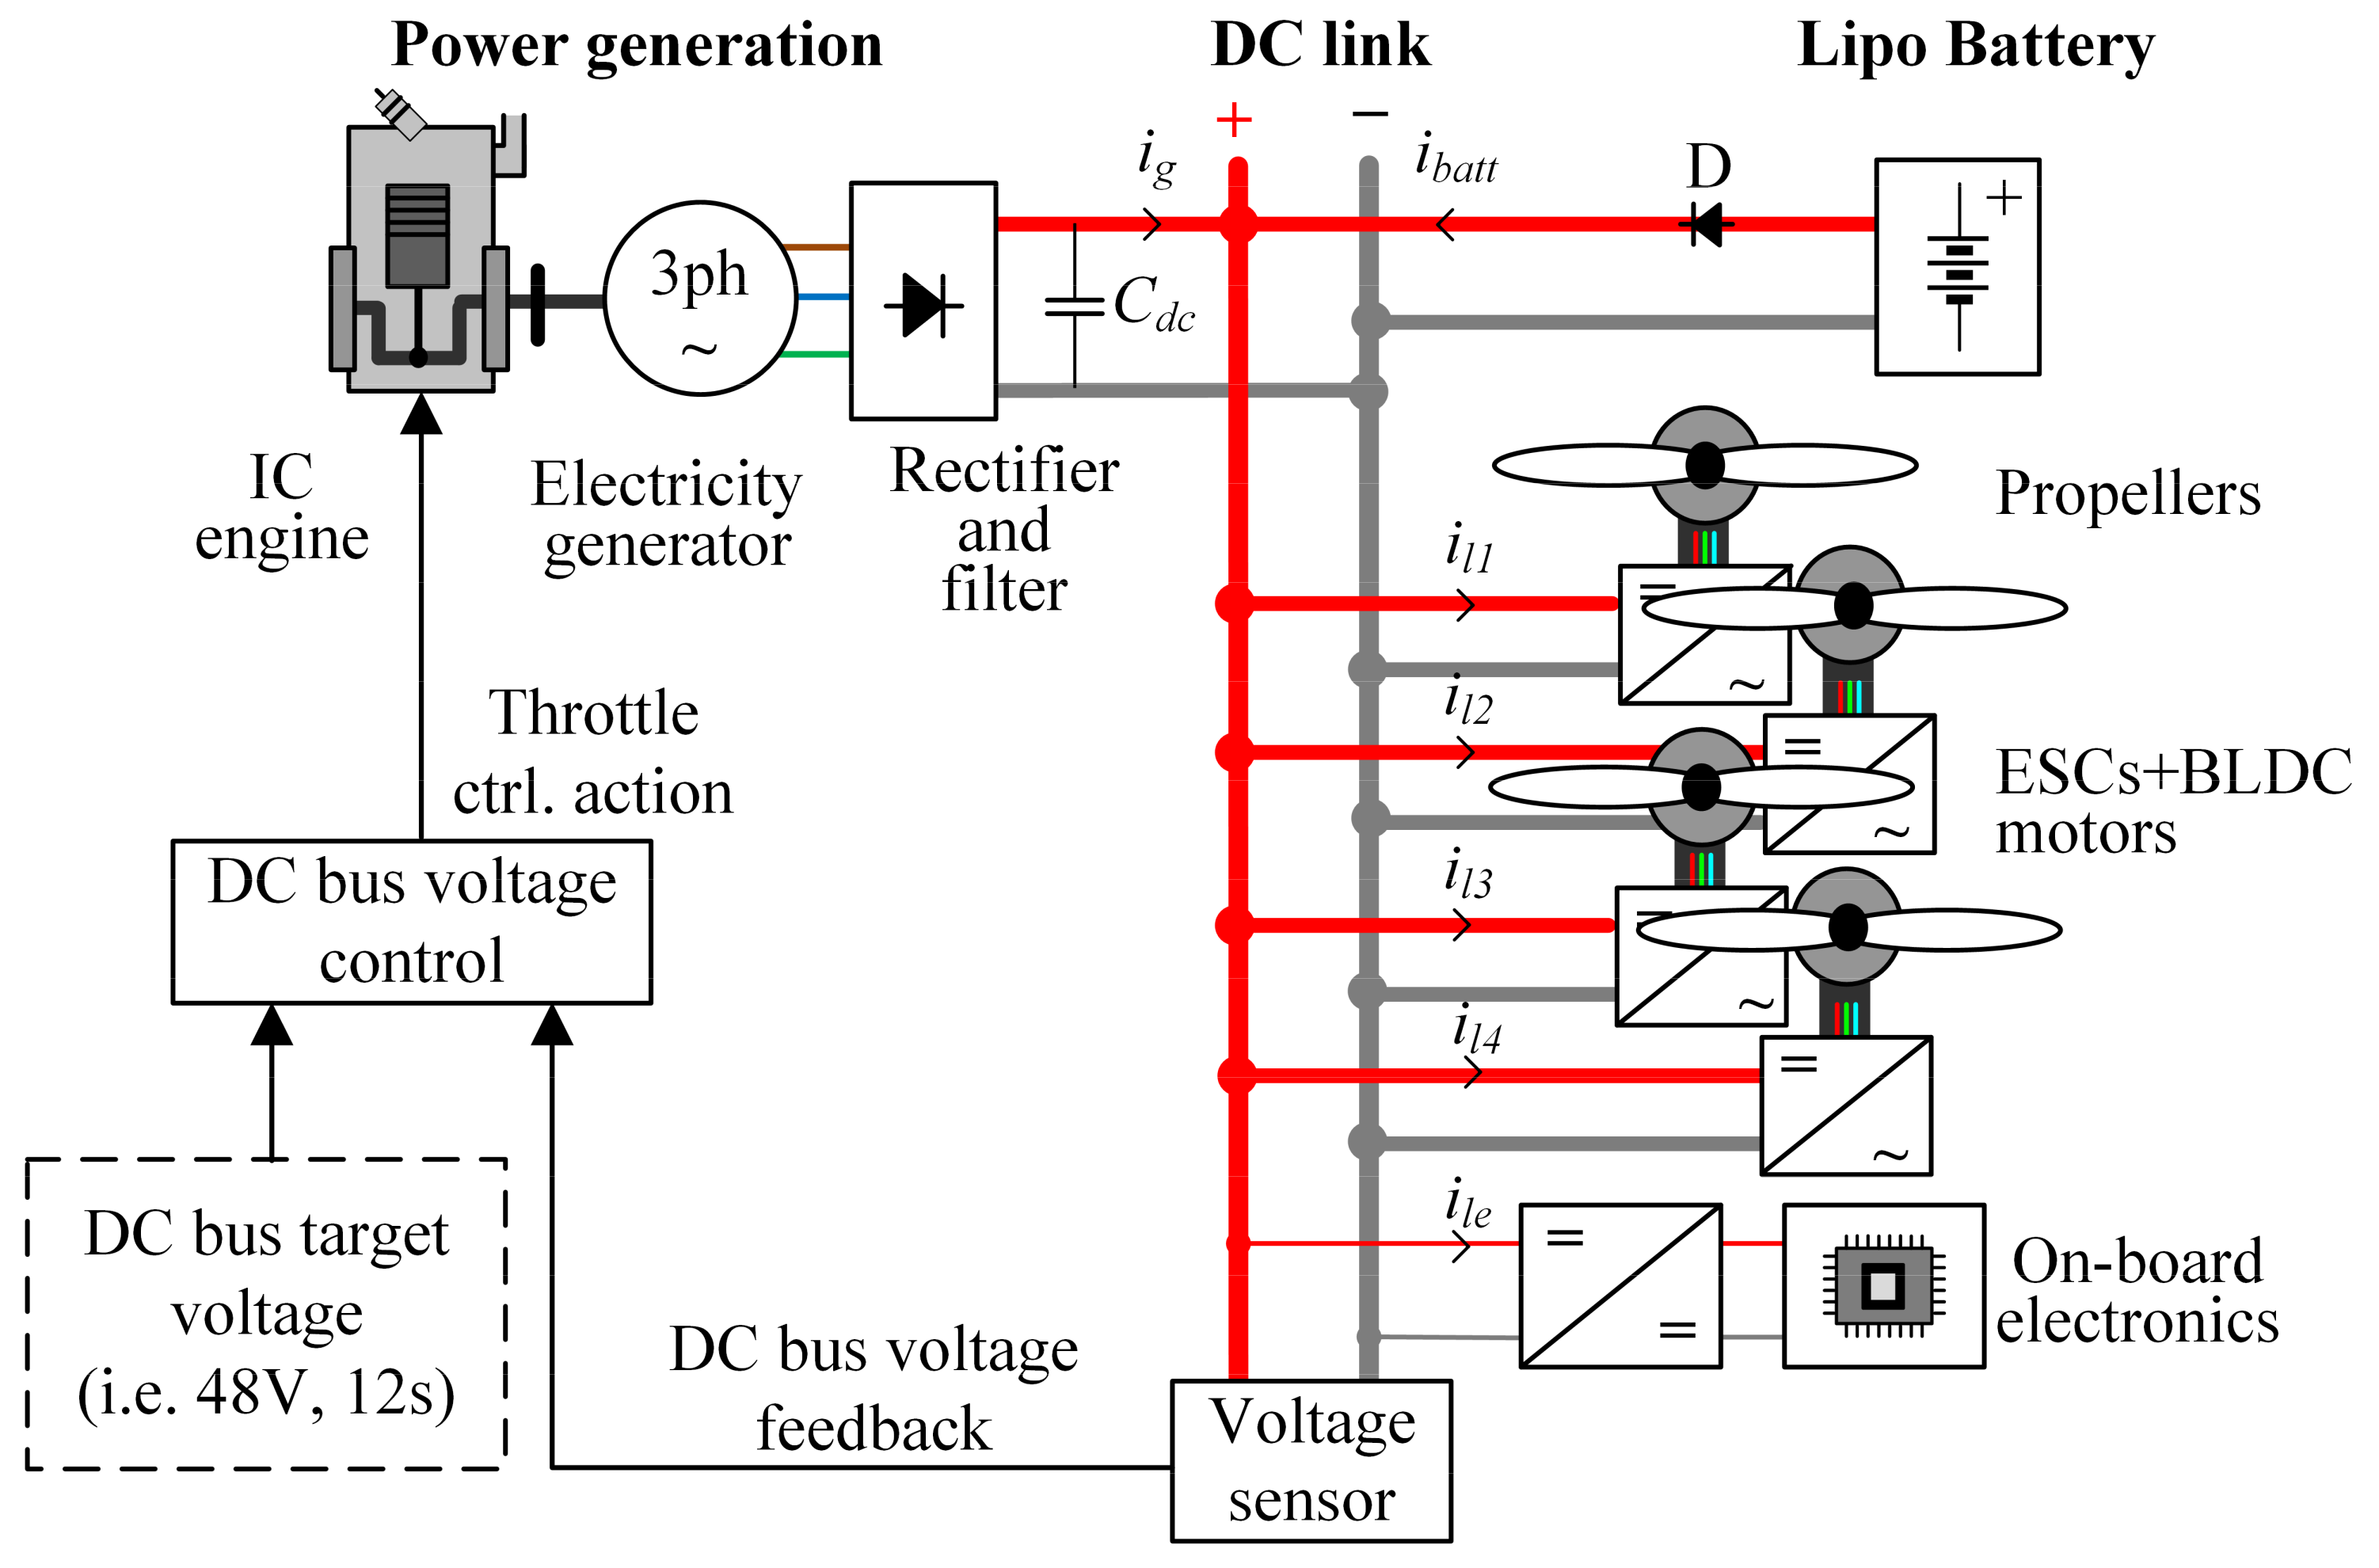
Figure 1. Considered hybrid power unit topology.
Energies 14 02669 g001
Figure 2. LiPo Battery modeling: (a) Quasi-static Thevenin model; (b) battery model block diagram realization.
Energies 14 02669 g002
Figure 3. LiPo battery test-bench.
Energies 14 02669 g003
Figure 4. LiPo Battery identification: (a) OCV vs. SoC; (b) Continuous discharge curve example (2 ohm load); (c) Experimentally–recorded and extracted internal resistance vs. state of discharge (1−SOC), for discharging operation.
Energies 14 02669 g004
Figure 5. ICE modeling: (a) Non-linear mean value model of ICE; (b) simplified non-linear model of ICE; (c) model linearized in the vicinity of ICE operating point.
Energies 14 02669 g005
Figure 6. ICE-EG set test bench.
Energies 14 02669 g006
Figure 7. ICE characterization (a) Power and torque curves for G320RC provided by manufacturer product specifications (© Husqvarna Zenoah Co. Ltd) as shown in [20]; (b) torque map linearized in the vicinity of ICE operating point.
Energies 14 02669 g007
Figure 8. BMPS: (a) electrical circuit of the three-phase BPMS EG and its connection to the three-phase full-wave diode rectifier; (b) trapezoidal back-emf waveforms of individual EG phases.
Energies 14 02669 g008
Figure 9. BMPS: (a) EG; (b) Back-emf measurements.
Energies 14 02669 g009
Figure 10. DC bus voltage control system process dynamics.
Energies 14 02669 g010
Figure 11. DC bus voltage control system.
Energies 14 02669 g011
Figure 12. Dominant closed-loop pole locations of PID controller-based DC bus control system ICE speed control system subject to torque gain error.
Energies 14 02669 g012
Figure 13. Simulation results of ICE-EG set DC bus voltage control system with PID controller: (a) ICE quantities; (b) EG quantities.
Energies 14 02669 g013
Figure 14. Experimental setup: (a) Schematic view; (b) Photograph of experimental setup.
Energies 14 02669 g014
Figure 15. Coupling mechanical details: (a) Coupling adapter—ICE side, (b) ICE-EG coupling.
Energies 14 02669 g015
Figure 16. Model validation.
Energies 14 02669 g016
Figure 17. Fuel consumption measurement (a) Graduated tank and DC wattmeter, (b) Fuel consumption measurement results.
Energies 14 02669 g017
Figure 18. Low load responses (a) RPM and DC bus voltage, (b) DC bus currents; Medium and high load responses (c) RPM and DC bus voltage, (d) DC bus currents; High load (1.33 Ω) and peak load (1 Ω) response (e) RPM and DC bus voltage, (f) DC bus currents.
Energies 14 02669 g018
Figure 19. Energy density analysis of hybrid and conventional electric power unit.
Energies 14 02669 g019
Table 1. ICE engine technical parameters given by the manufacturer.
DescriptionValue
Manufacturer and modelZenoah G320RC
TypeTwo-stroke gasoline engine with air cooling
FuelEurosuper 95 gasoline and synthetic 2–stroke oil mixture 25:1
Bore × Stroke38 mm × 28 mm
Compression ratio9.1:1
Maximum power output3.22 HP (2.4 kW)
Operating speed 4000–18,000 rpm
CarburetorWalbro WT–1107
Ignition and spark plugTransistor charger ignition; NGK CMR7H
Length, width, height16.7 cm, 21.5 cm, 19.6 cm
Mass2.3 kg (dry)
Table 2. BPMS machine technical parameters.
DescriptionValue
Model numberMTO6374–170–HA–C
Back emf-constant KV170 rpm/V
Maximum Current vs. Rated Current65 A/60 A
Input voltage (defined as number of LiPo Cells)2–12 s
Shaft8 mm with 3 mm keyway
Motor Weight830 g
Line resistance; line inductance (both measured)0.04068 Ω; 40.43 μH
Max. Power3550 W
Table 3. BPMS machine technical parameters.
ComponentDescription
Throttle actuatorHigh torque stepper motor, 5 V, separately powered
RPM sensorHall sensor, pull up logic
Current sensorACS758 Hall sensor, 100 A, 3 qty
Voltage sensorVoltage divider network with ratio 22.3, 0.1% tolerance 0.5 W resistors
DiodeHigh voltage Schottky rectifier diode, Vf = 0.37 V, Imax = 250 A
Load switchesLogic level n–channel MOSFET, IRLZ44, Vdss = 60 V, Id = 27 A
Filter Capacitors1200 μF, electrolytic, 63 V
BatteryLiPo 10,000 mAh, 25 C, 12 s
Computer and MicrocontrollerHost computer: MacBook Pro 2018 with running MATLAB/Simulink™, Microcontroller: Arduino Mega, 2 qty.
LoadWirewound power resistors network, 2 Ω, 500 W, 8 qty.
Cooling fans for load resistors6–inch racing multirotor prop–motor set, 3 qty.
Publisher’s Note: MDPI stays neutral with regard to jurisdictional claims in published maps and institutional affiliations.