Article

Hydrogen Purification Performance Optimization of Vacuum Pressure Swing Adsorption on Different Activated Carbons

1
Hubei Key Laboratory of Advanced Technology for Automotive Components, Hubei Research Center for New Energy & Intelligent Connected Vehicle, School of Automotive Engineering, Wuhan University of Technology, Wuhan 430070, China
2
Hydrogen Research Institute, Université du Québec à Trois-Rivières, Trois-Rivières, QC G8Z 4M3, Canada
3
Production Management Department, Dongfeng Honda Automobile Company Limited, Wuhan 430058, China
4
School of Mechanical Engineering, Xinjiang University, Urumqi 830046, China
*
Authors to whom correspondence should be addressed.
Energies 2021, 14(9), 2450; https://doi.org/10.3390/en14092450
Submission received: 16 March 2021 / Revised: 14 April 2021 / Accepted: 21 April 2021 / Published: 25 April 2021

Abstract

:
Hydrogen purification is an important part of hydrogen energy utilization. This study aimed to perform hydrogen purification of multi-component gas (H2/CO2/CH4/CO/N2 = 0.79/0.17/0.021/0.012/0.007) by one-column vacuum pressure swing adsorption (VPSA) and pressure swing adsorption (PSA). AC5-KS was selected as the adsorbent for hydrogen purification due to its greater adsorption capacity compared to R2030. Furthermore, VPSA and PSA 10-step cycle models were established to simulate the hydrogen purification process using the Aspen Adsorption platform. The simulation results showed that the hydrogen purification performance of VPSA is better than that of PSA on AC5-KS adsorbent. The effects of feeding time and purging time on hydrogen purity and recovery were also discussed. Results showed that feeding time has a negative effect on hydrogen purity and a positive effect on hydrogen recovery, while purging time has a positive effect on hydrogen purity and a negative effect on hydrogen recovery. By using an artificial neural network (ANN), the relationship between the inputs (feeding time and purging time) and outputs (hydrogen purity and recovery) was established. Based on the ANN, the interior point method was applied to optimize hydrogen purification performance. Considering two optimization cases, the optimized feeding time and purging time were obtained. The optimization results showed that the maximum hydrogen recovery reached 88.65% when the feeding time was 223 s and the purging time was 96 s. The maximum hydrogen purity reached 99.33% when the feeding time was 100 s and the purging time was 45 s.

1. Introduction

Hydrogen is the secondary energy source with the most potential [1]. Compared with traditional fossil fuels, hydrogen has the advantages of zero pollution and widely available sources, and is recognized as the most important energy vector [2,3]. Moreover, hydrogen energy is expected to account for 90% of energy consumption in 2080 [4]. At present, most hydrogen is produced by natural gas and steam methane reforming (SMR) [5,6]. However, the SMR process releases a gas mixture containing H2, CH4, CO2, N2, and CO [7]. There are many works on the separation of two-component gases; which include H2/CO2 [8], H2/CH4, and H2/CO [9]. Park et al. used the above three gas mixtures to carry out breakthrough experiments and adsorption kinetic characteristics analysis [10]. In this study, the SMR gas mixture was used in a VPSA system for hydrogen purification.
Currently, pressure swing adsorption (PSA) hydrogen purification technology is used by more than 85% of hydrogen production companies worldwide [11]. PSA is the basis of vacuum pressure swing adsorption (VPSA). VPSA has higher efficiency and productivity than PSA [12]. The VPSA cycle contains many operation variables [13,14] that need to be used for parametric study and performance optimization. Yang et al. carried out an experimental and theoretical study on the separation of a binary gas mixture (H2/CO2 = 0.50/0.50) by PSA [13] in which the effects of the P/F ratio, co-current depressurization, feed rate and pressure, bed repressurization, and pore diffusivity were explored. Malek et al. established a six-bed pressure swing adsorption model and found that the product purity decreases relatively quickly as the cycle time increases and the working pressure decreases [14]. Ling et al. studied the effects of the valve constant, step time, flow rate, and bed geometry on hydrogen purification performance. The results showed that the optimizer maximized hydrogen recovery when the pressure and hydrogen purity met the requirements [15]. It was found that co-current depressurization was beneficial to CO2 purity and capture rate, and that increasing the number of pressure equalization steps would increase CO2 purity, but reduce productivity [16]. Qasem et al. found that longer beds and larger adsorbent particle sizes had better VPSA purification performance [17]. A multi-component hydrogen mixture (H2/CO2/CO/N2/Ar = 0.88/0.02/0.03/0.06/0.01) was used for breakthrough and PSA experiments of activated carbon beds or activated carbon/zeolite LiX layered beds. The experimental results showed that the purification performance of four-bed PSA is better than that of two-bed PSA [18]. Brea et al. used UTSA-16 and BPL activated carbon adsorbent to purify hydrogen from SMR gas mixture [19]. The performance of HKUST-1, ZIF-8, and UTSA-16 extrudates for separating carbon dioxide from a binary hydrogen-containing gas mixture were compared. UTSA-16 showed the best biohydrogen purification performance [20]. Lopes et al. used a single adsorption bed and a five-step cycle to conduct a rapid vacuum PSA (RVPSA) experiment. According to the simulation, in the RVPSA experiment, the hydrogen recovery reached 61.8%, and the purity was greater than 99.99% [21]. The COMSOL platform was used to simulate the breakthrough curves of the gas mixtures on activated carbon [22] and zeolite 5A [23], and the effects of adsorption pressure, gas velocity, and gas composition on hydrogen purification performance were studied. Based on the Aspen Adsorption platform, Cu-BTC was used for PSA cycle simulation and parametric study [24]. The results showed that the increase in adsorption pressure, the shortening of the feeding time, and the decrease of the feed flow rate increased the hydrogen purity, but reduced the recovery and productivity. The PSA process is accompanied by a thermal effect. The heat released during the gas adsorption process causes the temperature to rise, which causes the adsorption capacity of the adsorbent to decrease, thereby affecting the hydrogen purification performance and reducing the system efficiency. The temperature control device should be used according to the characteristics of the PSA system to improve the overall efficiency. The adsorption bed size also has an impact on the energy consumption of the PSA process, as the reduction of the bed size increases the energy consumption [25]. Some optimization methods have been used in PSA, such as sequential quadratic programming and the single discretization method; however, these methods are complex and require time-consuming calculations [26,27]. Multiple artificial intelligence models have been applied to predict the performance of PSA cycles, and research results showed that the deep learning model has the best predictive effect [28]. Dual- and tri-objective optimizations were applied to a four-bed, eight-step PSA model to produce hydrogen from an SMR gas mixture [29].
In this study, the hydrogen purification of multi-component gas (H2/CO2/CH4/CO/N2 = 0.79/0.17/0.021/0.012/0.007) is performed by one-column VPSA and PSA. The adsorption capacity of AC5-KS and R2030 adsorbents are compared [30]. Furthermore, 10-step cycle VPSA and PSA models are established to simulate the hydrogen purification performance using the Aspen Adsorption platform. In addition, parametric studies of the VPSA hydrogen purification performance are carried out based on the feeding time and purging time. Finally, the optimal options are proposed to get the highest purity and recovery, and the optimized feeding time and purging time are obtained.
Based on our previous work [31], this study was carried out with some novelties. AC5-KS is selected as the adsorbent for hydrogen purification due to its greater adsorption capacity compared with that of R2030. VPSA is also compared with PSA for the AC5-KS adsorbent. A parametric study of purge time is also carried out. Based on an ANN, the interior point method is applied to optimize the cycle.

2. Heat and Mass Transfer and Adsorption Model

A heat and mass transfer model includes mass, energy, and momentum conservation equations, and an adsorption model includes adsorption isotherms and an adsorption kinetic model. The established model contains the following assumptions: (1) this model is considered as an axially dispersed plug-flow, (2) radial concentration and temperature gradients are ignored, (3) energy conservation equations include gas and solid phase conservations, and (4) the gas mixture follows the ideal gas equation of state [32].
The multi-component gas follows mass conservation when it is adsorbed in the adsorption bed. When the gas molar concentration is used to express the mass conservation of each gas component in the adsorbent bed, it can be expressed as follows:
ε b c i t + ( v g c i ) z = D L ε b 2 c i z 2 ρ p ( 1 ε b ) n i t ,   i = 1 , , N
Momentum conservation is followed when multi-component gas is adsorbed in an adsorption bed. The fluid flow in porous media can be expressed by the Ergun equation:
d p d z = 150 ( 1 ε b ) 2 ( 2 R P ) 2 ε b 3 μ v g + 1.75 ρ g ( 1 ε b ) 2 R P ε b 3 v g 2
Dual energy equations of the adsorption bed are adopted for gas and solid phase:
ε b c g C p g T g t + c g C p g v g T g z = ε b K L g 2 T g z 2 p v g z + h g s a p ( T s T g ) + 2 h in R in ( T w T g )
ρ s c p s T s t + ρ s i = 1 N ( C p a i n i ) T s t = K L s 2 T s z 2 + ρ s i = 1 N ( Δ H i n i t ) + h g s a p ( T g T s )
The energy balance for the wall of the adsorption bed is expressed as follows:
ρ w c p w T w t = K w 2 T w z 2 + 2 R in h in ( T g T w ) 2 R out h out ( T w T f ) R out 2 R in 2
The Langmuir model is the simplest and most commonly used adsorption isotherm model for predicting the adsorption equilibrium of gas or liquid [33]. It is based on the adsorption kinetic principle and assumes that the gas adsorption rate on the surface of the adsorbent is equal to the desorption rate. In this work, multi-component gas was applied. Competitive adsorption exists among gases, so the Langmuir model could be corrected to the extended Langmuir model. The extended Langmuir equation was used to express the adsorption isotherms of each gas component, and the equation is as follows:
n i * = n i s b i p i 1 + j = 1 N b j p j ,   i = 1 , , N
In this expression, p i = y i p , n i s = k 1 i + k 2 i T , and b i = k 3 i e x p ( k 4 i / T ) . The adsorption kinetics are expressed by the linear driving force (LDF) model; the formula is as follows:
n i t = w i ( n i * n i ) ,   i = 1 , , N
The multi-component gas follows the ideal gas equation of state. The following parameters can be calculated using the ideal gas equation of state:
c i = y i p R T ,   i = 1 , , N ;   ρ g = i = 1 N M i c i ;   c g = ρ g M
Hydrogen purity, recovery, and productivity are usually regarded as performance indicators for hydrogen purification. According to the characteristics of the 10-step VPSA cycle, the expressions of hydrogen purity, recovery, and productivity are as follows:
P u r H 2 = 100 0 t feed c H 2 v z | z = L d t i = 1 N 0 t feed c i v z | z = L d t ( % )
R e c H 2 = 100 0 t feed c H 2 v z | z = L d t 0 t purge c H 2 v z | z = L d t 0 t press c H 2 v z | z = L d t 0 t feed c H 2 v z | z = 0 d t ( % )      
P r o H 2 = A 0 t feed c H 2 v z | z = L d t 0 t purge c H 2 v z | z = L d t 0 t press c H 2 v z | z = L d t m adsorbent t cycle / 3600 ( mol kg - 1 h - 1 )      

3. Model Parameters and Validation

3.1. Adsorption Isotherms of AC5-KS and R2030

Table 1 shows the adsorption isotherm parameters and isosteric heats of adsorption on AC5-KS and R2030. The extended Langmuir model parameters were fitted from experiment data from [30] through Matlab. Table 2 shows characteristics of the adsorbents AC5-KS and R2030, and of the adsorption bed [30,34] .
The specific surface areas of R2030 and AC5-KS are 700.3 m2/g and 971 m2/g [30]. The operating conditions of adsorption process [35] are listed in Table 3. The adsorption isotherms are presented in Figure 1, which shows that the extended Langmuir model exhibits great adaptability to fit adsorption equilibrium data of different gases.

3.2. Breakthrough Curves Validation of AC5-KS and R2030 Adsorption Beds

The molar fraction simulated results of the five-component mixture in AC5-KS and R2030 are shown in Figure 2, which agree well with experiment results. From Figure 2, it can be observed that the breakthrough time of each component was different. Hydrogen was slightly adsorbed and reached the breakthrough point rapidly. Nitrogen was the first gas to break through the adsorption bed, followed by carbon monoxide, and methane and carbon dioxide were the last to break through the adsorption bed. The main reason is that the adsorption performance of different gases is not the same. The adsorption capacity of AC5-KS and R2030 adsorbents for each gas component is as follows: CO2 > CH4 > CO > N2 > H2. In the adsorption process, the weak adsorbate is desorbed from the adsorption bed and reintegrated into the gas flow, so an apparent peak appears in the breakthrough curve. As shown in Figure 2, adsorbate in AC5-KS breakthroughs the adsorption bed slower than that in R2030, and the breakthrough curve’s peak in AC5-KS is lower than that in R2030. This means that AC5-KS can adsorb more carbon dioxide, methane, carbon monoxide, nitrogen, and hydrogen than R2030. Except for H2, CO2 is the most abundant component in the mixture, and while H2 is slightly adsorbed, CO2 is adsorbed much more. Thus, in this case, the adsorption amount of CO2 was chosen as an indicator of the adsorbent’s adsorption capacity. When the adsorption pressure was 5 bar and the temperature was 303–323 K, AC5-KS adsorbed 17.80–25.75% more CO2 than R2030.
When the gas is adsorbed, the temperature of the adsorption bed will increase, and when the gas is desorbed, its temperature will drop. However, due to the heat transfer between the adsorption bed and the environment, the temperature of the adsorption bed will eventually drop to the initial value. The temperature peak in R2030 was lower than that in AC5-KS, which is mainly because the adsorption heat and amount in R2030 were smaller than those in AC5-KS.

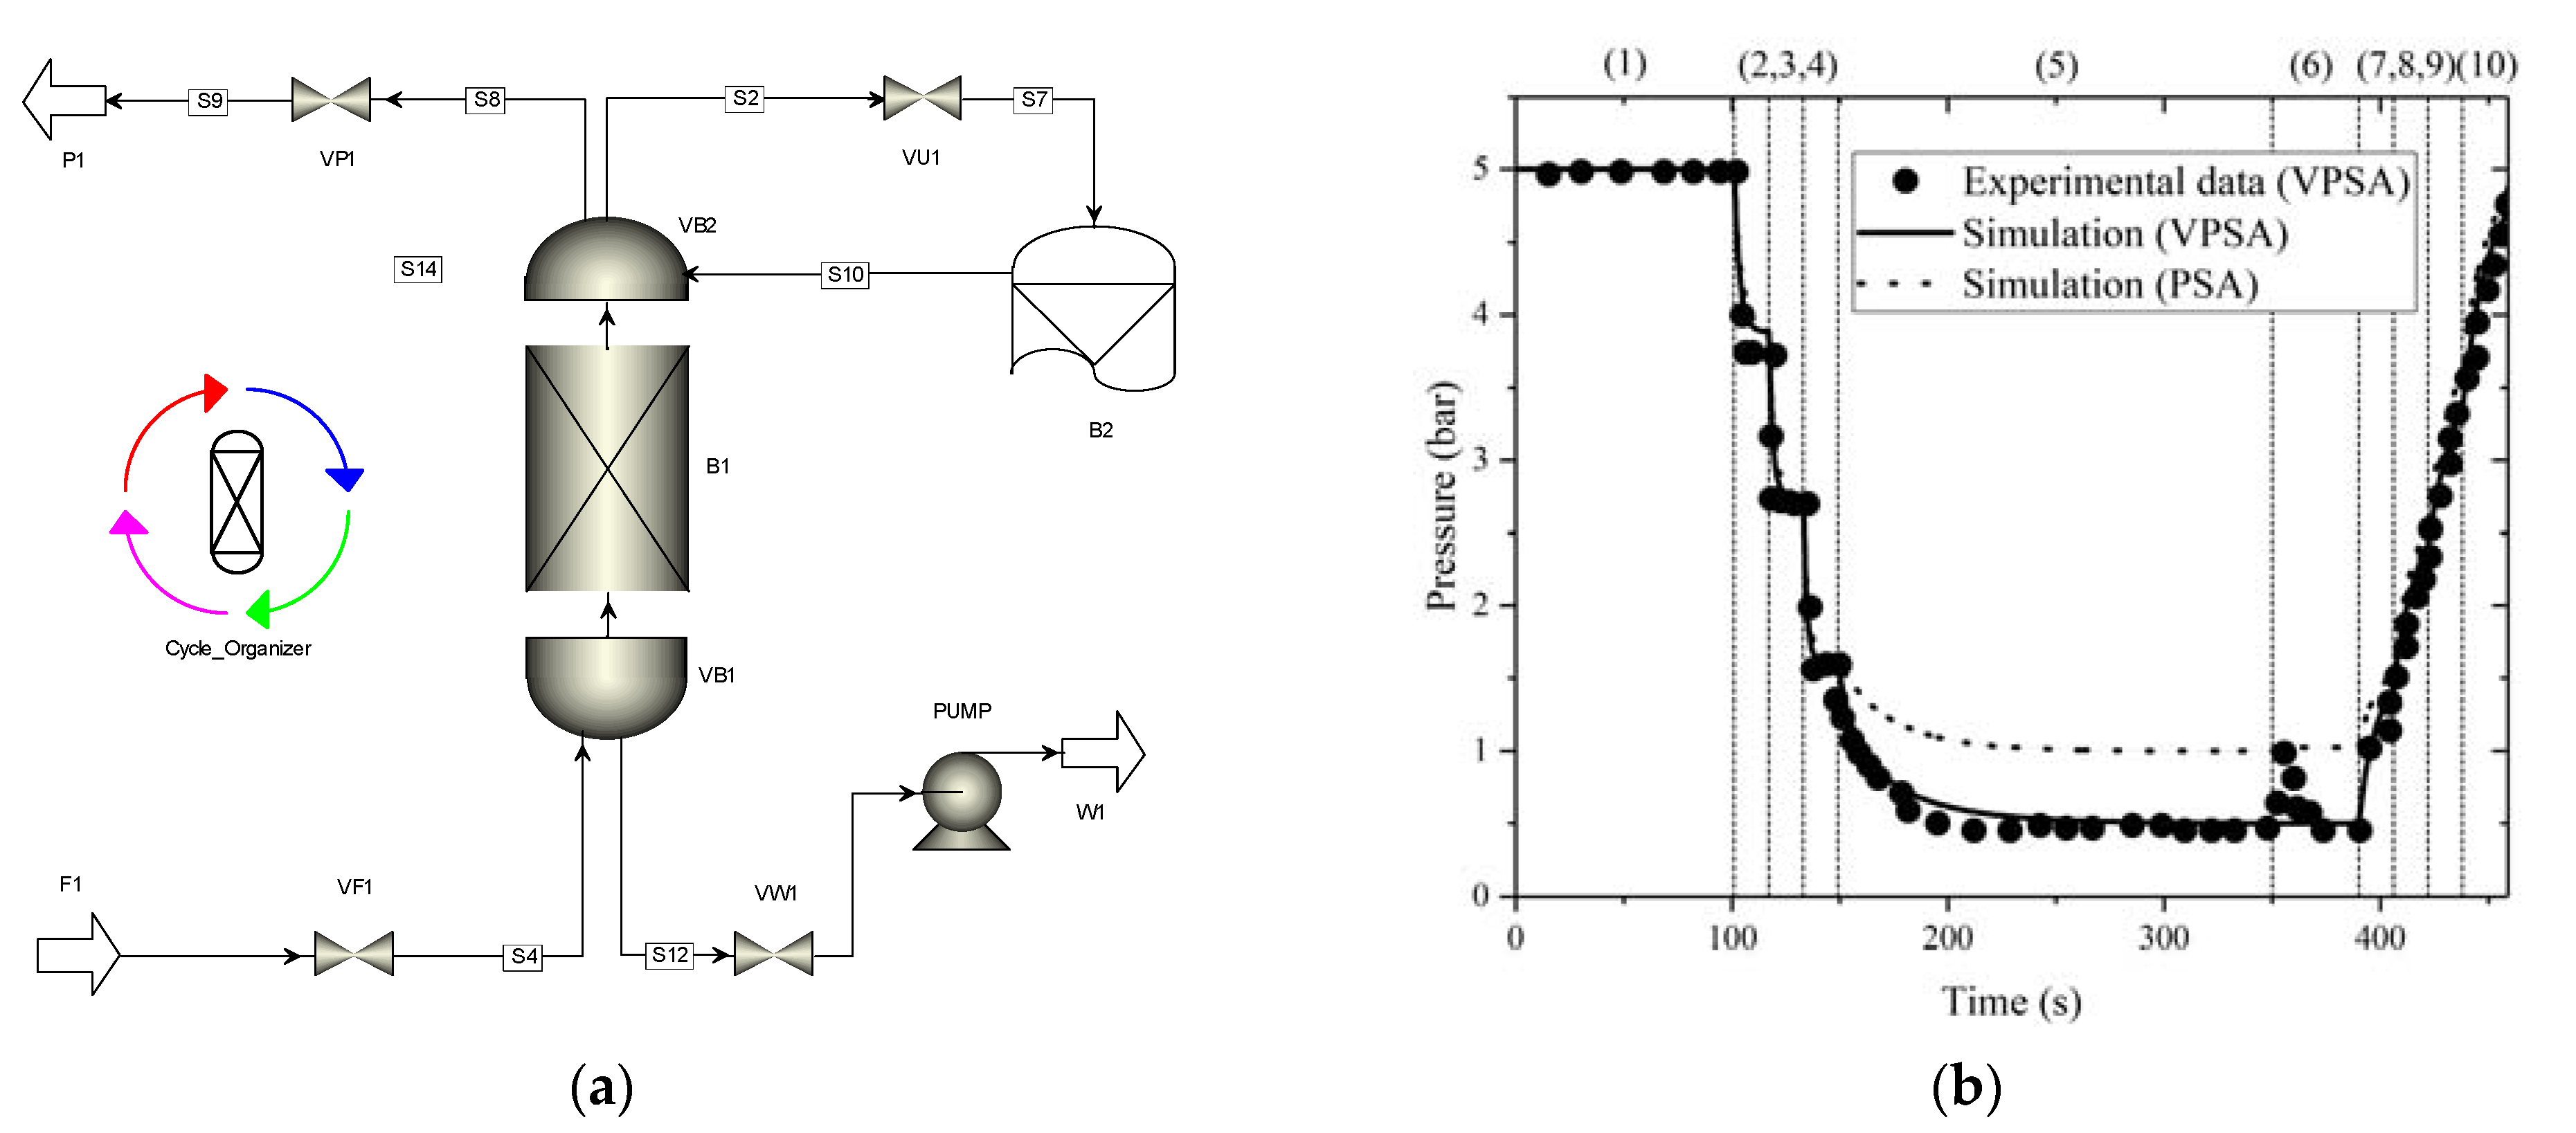
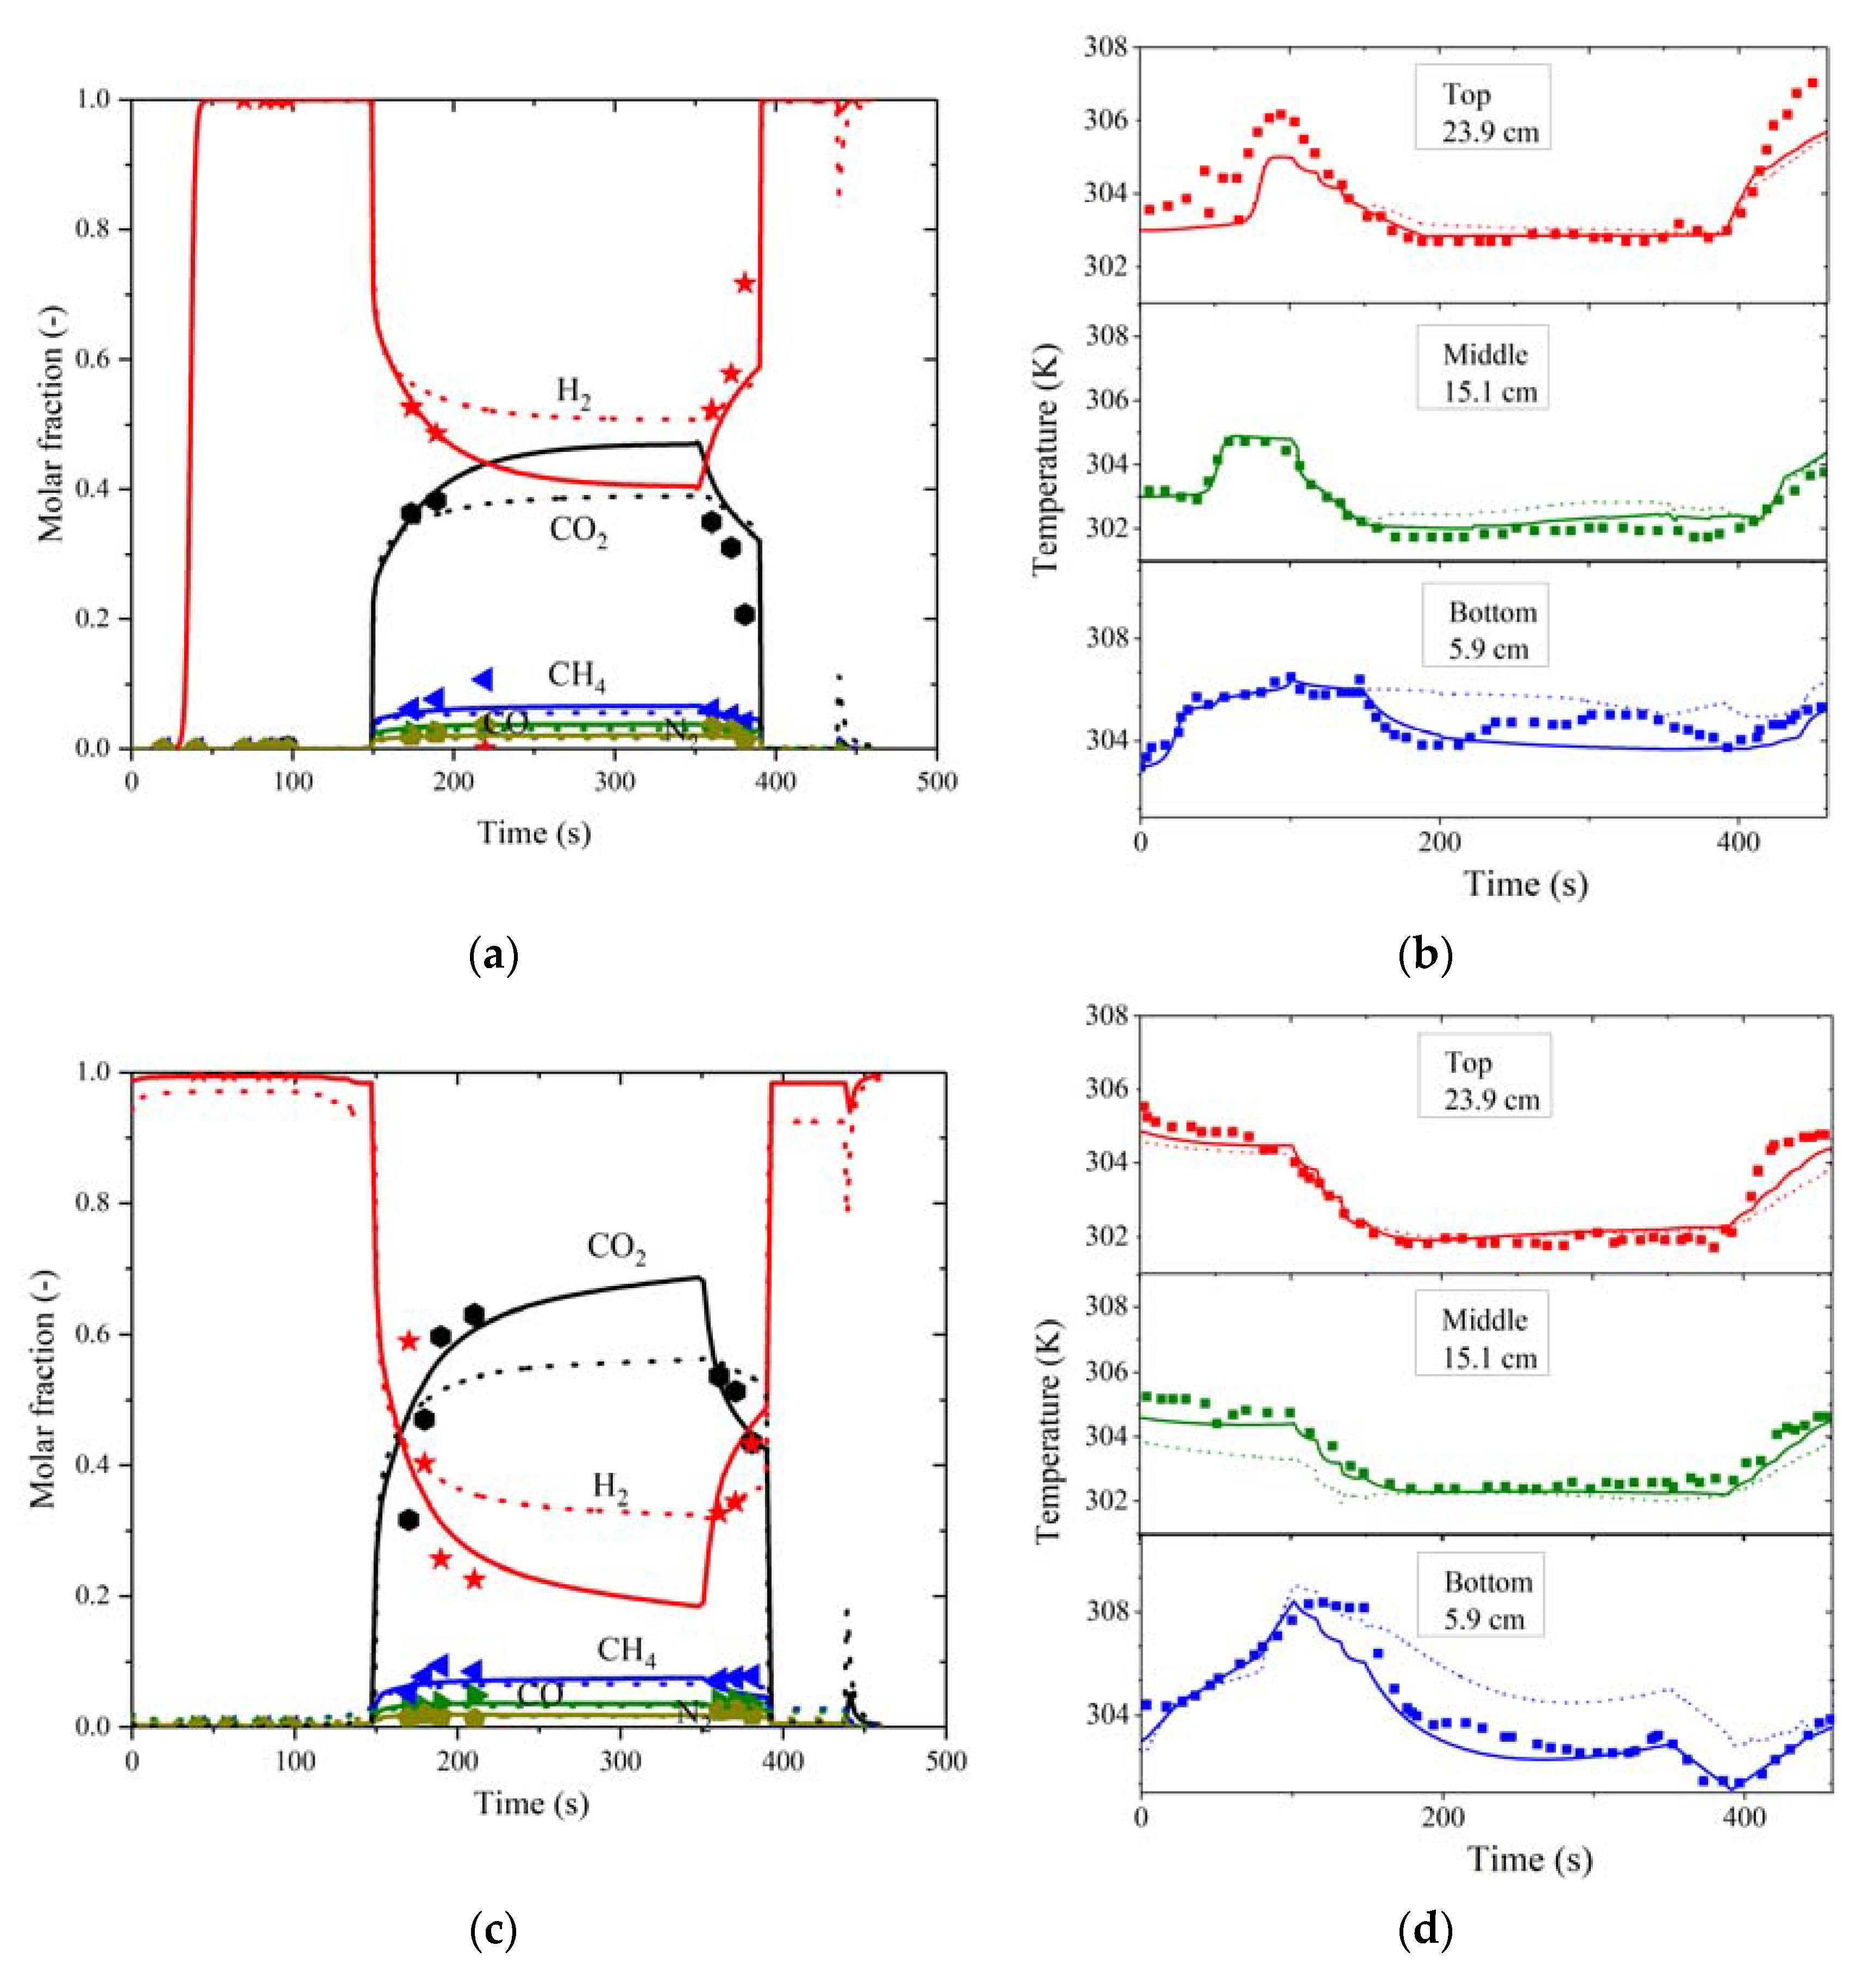
3.3. VPSA and PSA Cycle Validation and Comparison in AC5-KS

The 10-step cycle VPSA and PSA models were established for hydrogen purification. Usually, the PSA process includes feed (FEED), depressurizing equalization (ED), blow down (BLOW), purge (PURGE), pressurizing equalization (EP), and pressurization (PRESS). A 10-step cycle means that pressure needs to equalize six times: three times for pressurizing equalization drop and three times for pressurizing equalization press. Figure 3a is the VPSA flow diagram. As shown in Figure 3b, the vacuum was applied in the pressure drop and purge step to reach the low pressure of 0.5 bar. In the feed step, the gas mixture was fed through VF1, B1, and VP1 to obtain pure hydrogen. In order to realize pressurizing equalization, valves VF1, VW1, and VP1 were closed, valve VU1 was opened, and the gas diffused from B1 to B2 or B2 to B1 to balance the pressure. For the depressurization step, valves VP1, VF1, and VU1 were closed, valve VW1 was opened, and the gas in the adsorption bed flowed out from the outlet WASTE, resulting in a pressure drop in the adsorption bed. For the purge step, the gas in B1 flowed into the adsorption bed, valves VP1, VF1, and VU1 remained closed, and the gas came out from WASTE to recycle the adsorption bed. For the pressurization step, valves VP1, VU1, and VW1 were closed and valve VF1 was opened. The gas flowed from FEED through VF1 to the adsorption bed, which increased the gas pressure in the adsorption bed.
The operating conditions for the VPSA cycles are presented in Table 4. The PSA had the same operating conditions as the VPSA, except that the low pressure for the PSA was 1 bar. The VPSA cycle simulation results were in good agreement with the experimental data. The hydrogen purity was 99.18%, and the hydrogen recovery was 81.12%.
In Figure 4, can be seen that the hydrogen molar fraction in the VPSA cycle was higher than that in the PSA cycle, which means that a higher hydrogen purity was obtained when VPSA was applied. Therefore, activated carbon AC5-KS, which is found to have a larger capacity in Section 3.2, and the VPSA data were used for the optimization of hydrogen purification.

4. Parametric Study and Optimization of Hydrogen Purification

4.1. Parametric Study of Hydrogen Purification

The effect of feeding time is shown in Figure 5. When feeding time increased from 101 s to 151 s, hydrogen purity decreased by 0.53–1.07% and hydrogen recovery increased by 8.66–15.30%; when feeding time increased from 151 s to 201 s, hydrogen purity decreased by 0.82–1.71% and hydrogen recovery increased by 3.77–6.64%. When the VPSA system reaches the cyclic steady state, extending the feeding time increases the amount of impure gas at the outlet, which leads to a decrease in hydrogen purity, but because the amount of hydrogen fed into the adsorption bed increases, the hydrogen recovery increases. When the purging time is long and the feeding time increases, the hydrogen purity change rate reduces, and the hydrogen recovery change rate increases.
The effect of purging time is shown in Figure 5. When purging time increased from 40 s to 70 s, hydrogen purity increased by 0.44–1.35% and hydrogen recovery decreased by 2.61–6.57%; when purging time increased from 70 s to 100 s, hydrogen purity increased by 0.21–0.76% and hydrogen recovery decreased by 2.91–7.19%. With the increase of the purging time, the molar fraction of hydrogen in the purge step increases, as more impure gas is desorbed out of the adsorbent. Thus, as the adsorbent is recycling, the molar fraction of those impurities decreases, so as purging time increases, hydrogen purity increases. However, recovery drops down, which can be also explained by Equations (9) and (10). When the feeding time is short and the purging time increases, the hydrogen purity change rate reduces, and the hydrogen recovery change rate increases.

4.2. Optimization of Hydrogen Purification Performance Based on Interior Point Method

Studies have shown that ANN models can predict hydrogen purification performance well [36]. The ANN method uses simple mapping to approximate and implement a certain function of complex mapping. It has a highly parallel structure and information processing capability, strong self-learning and information memory, strong fault tolerance, and strong nonlinearity approximation ability. The feed-forward neural network is typical and widely used in ANNs. In this paper, a three-layer feed-forward neural network was established to predict the hydrogen purification performance of the VPSA cycle.
In this work, the input units of the neural network were the feeding time and purging time, and the output units were hydrogen purity and recovery. The input–output samples were from Figure 5. For a three-layer BP neural network, if the number of neurons in the hidden layer is sufficiently large, any continuous function defined on a non-unbounded region can be approximated [37]. However, if there are too many hidden layer neurons, the generalization ability of the network is poor; if there are too few hidden layer neurons, it is difficult for the network to complete the sample learning [38]. To get the reference number of hidden layer neurons, at first, an empirical formula was used as follows [39]:
N hid = 2 N in + 1
where N in is the number of input layer neurons and N hid is the number of hidden layer neurons. Using this trial and error method, we decided to use 5 neurons in hidden layer.
Figure 6 shows the result of regression. The values of R are close to 1; the closer R is to 1, the higher the accuracy is. The result shows that the ANN model is validated and can be used to predict VPSA cycle performance.
In this work, two cases were considered for optimization, one for higher purity, and the other for higher recovery. The objective function could be hydrogen purity P u r H 2 or hydrogen recovery R e c H 2 , which can be calculated by Equations (9) and (10). One was chosen as the objective function, and the other was assigned a lower bound value. The lower bound value for hydrogen purity was 0.98, and the lower bound value for hydrogen recovery was 0.80. There were two design variables: t feed is feeding time and t purge is purging time, which have their ranges. The optimization problems can be described as the following two cases:
m i n . P u r H 2 s . t . : 101 t feed 201 , 40 t purge 100 ,   R e c H 2 80 %
m i n . R e c H 2 s . t . : 101 t feed 201 , 40 t purge 100 ,   P u r H 2 98 %
The interior point method in the fmincon function was used to optimize hydrogen purification performance. Table 5 shows the optimization results based on the ANN model and Aspen model. Max P u r H 2 means the maximum value of hydrogen purity, and Max R e c H 2 means the maximum value of hydrogen recovery. Table 5 shows that the ANN prediction results and Aspen conformation results are very close. Thus, the ANN model trained by Aspen data can predict VPSA cycle performance well. The optimal hydrogen recovery reached 88.65% when feeding time was set to 223 s and purging time was set to 96 s. In another case, the optimal hydrogen purity reached 99.33% when feeding time was set to 100 s and purging time was set to 45 s. Compared with our previous work, it was found that using the interior point method combined with the ANN was better than sequential quadratic programming when optimizing hydrogen purification performance.

5. Conclusions

Both R2030 and AC5-KS adsorbents, and both atmospheric and vacuum pressure swing adsorption (VPSA) cycles, were analyzed and compared. The VPSA cycle using AC5-KS adsorbent was optimized by the interior point method and ANN model. The following conclusions were obtained.
  • AC5-KS had greater adsorption capability than R2030 when purifying hydrogen from multi-component gas (H2/CO2/CH4/CO/N2 = 0.79/0.17/0.021/0.012/0.007). AC5-KS could adsorb 17.80–25.75% more CO2 than R2030 when the adsorption pressure was 5 bar and the temperature was 303–323 K.
  • The hydrogen purification performance of VPSA was better than that of PSA. Therefore, the parameters of the VPSA system for hydrogen purification was further studied and optimized.
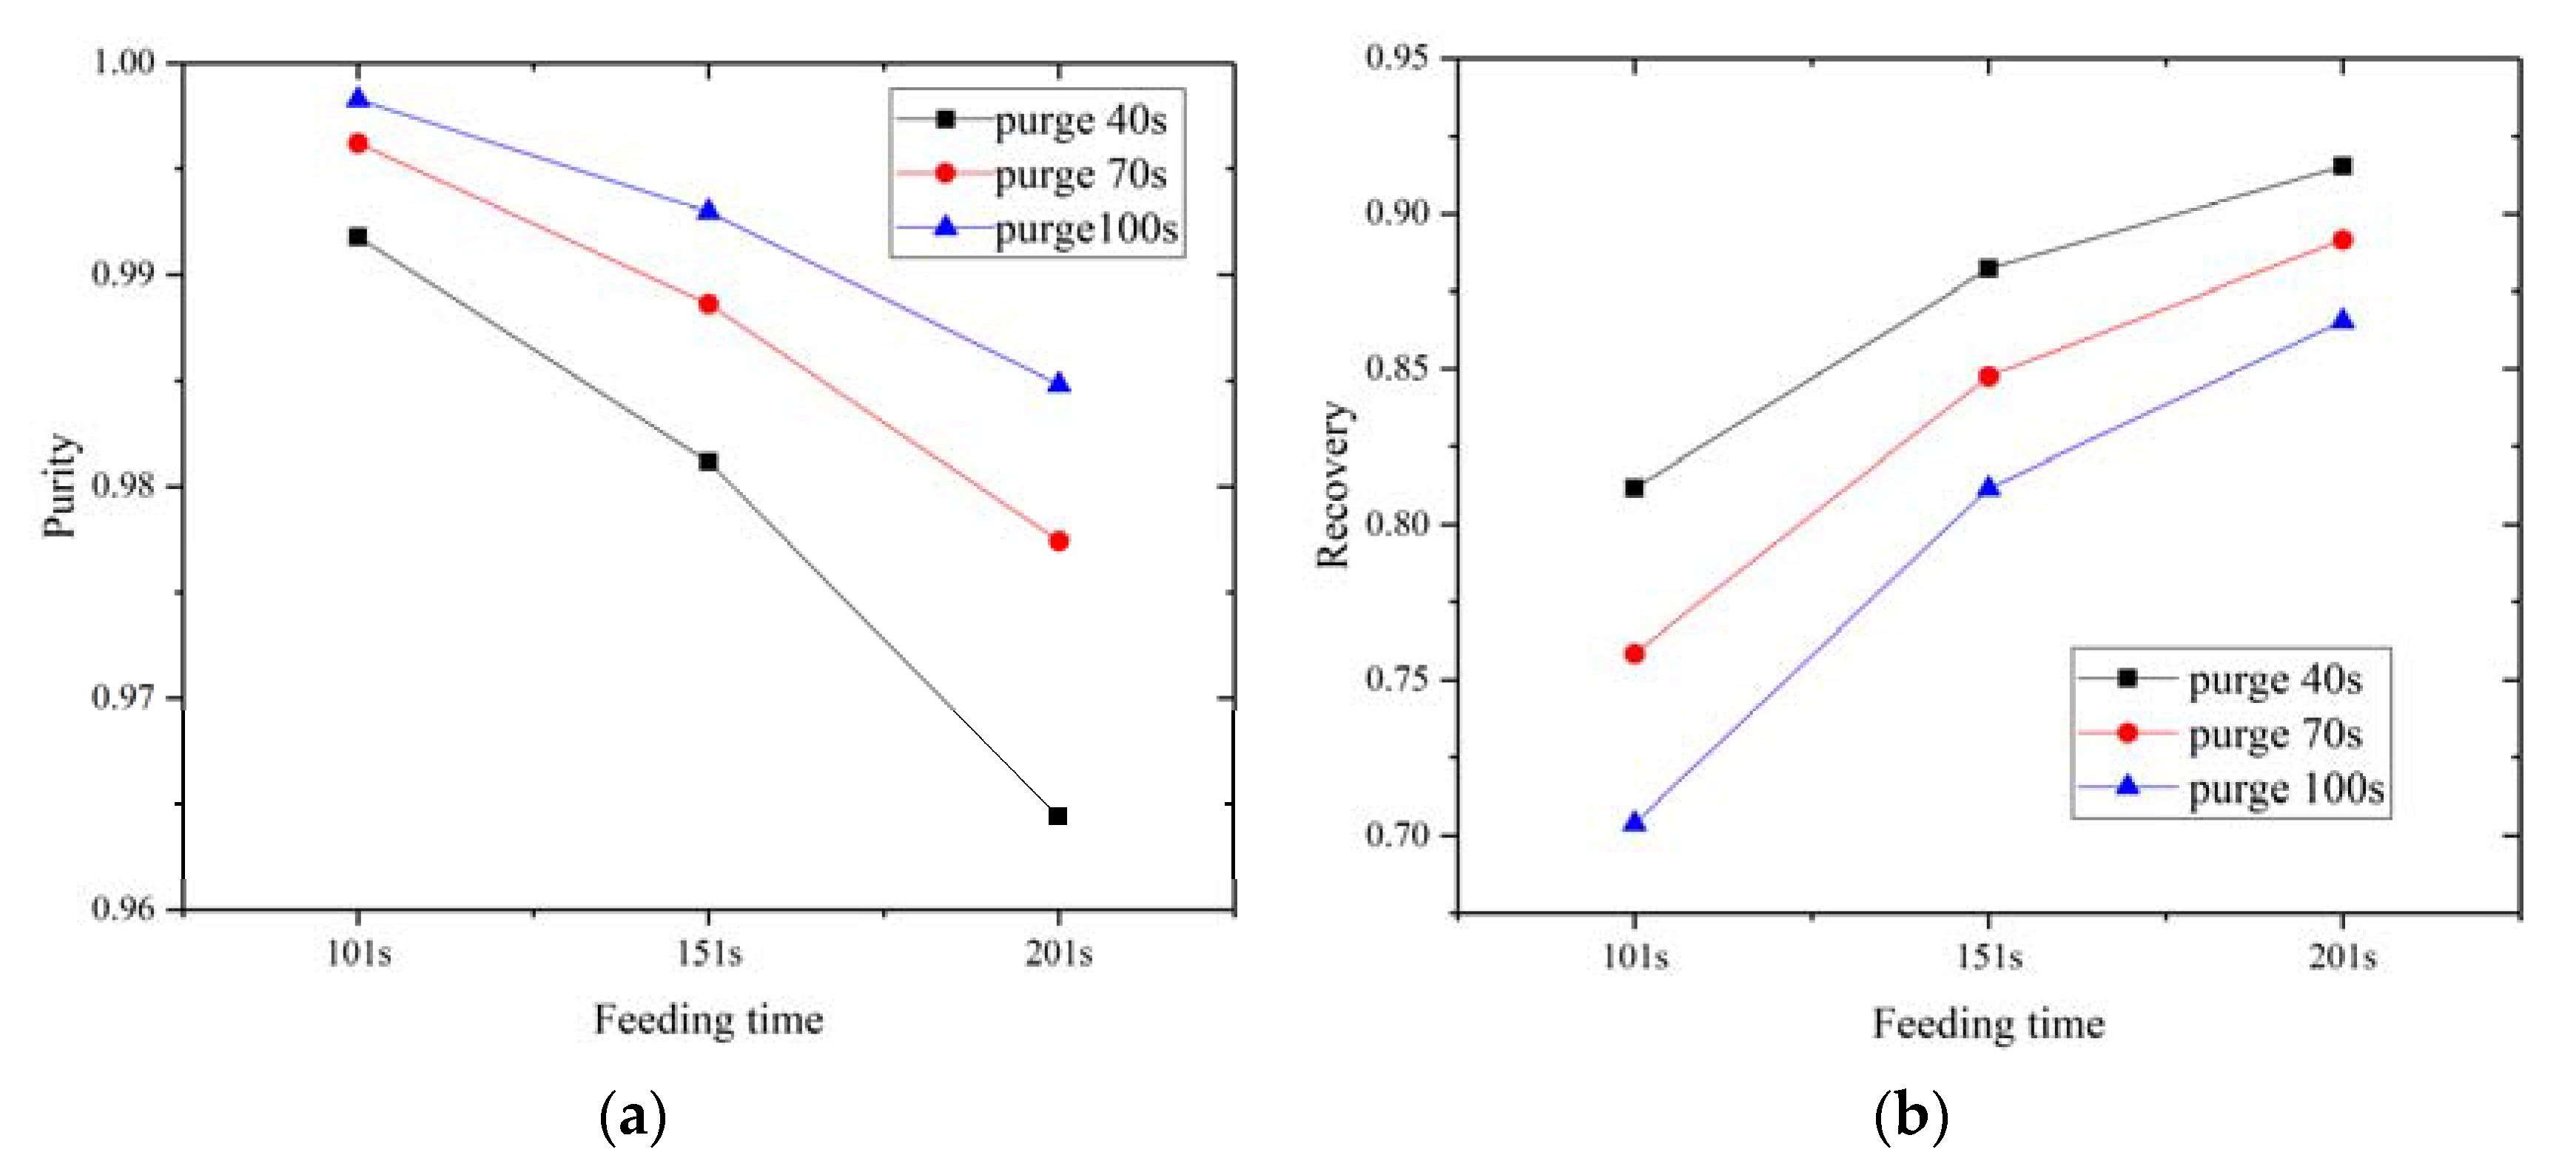
  • Results show that feeding time has a negative effect on hydrogen purity and has a positive effect on hydrogen recovery, while purging time has a positive effect on hydrogen purity and a negative effect on hydrogen recovery.
  • The performance of hydrogen purification in the VPSA process was optimized by the interior point method combined with an ANN model. The optimal results show that the maximum hydrogen recovery reached 88.65% when feeding time was set to 223 s and purging time was set to 96 s, and the maximum hydrogen purity reached 99.33% when feeding time was set to 100 s and purging time was set to 45 s.
In future work, parametric studies can include more operating conditions and adsorbent characteristics. These parameters can be used as the input layer of artificial neural networks. Multi-objective optimization methods can be used to optimize both hydrogen purity and recovery.

Author Contributions

Conceptualization, J.X., P.B. and R.C.; data curation, S.M.; investigation, A.M. and W.T.; methodology, J.X. and P.B.; software, W.T.; supervision, R.C.; validation, S.M.; visualization, A.M.; writing—original draft, A.M., W.T. and S.M.; writing—review and editing, J.X., P.B. and R.C. All authors have read and agreed to the published version of the manuscript.

Funding

This research was funded by National Natural Science Foundation of China, grant number 51476120, Natural Science Foundation of Liaoning Province of China, grant number 2020-CSLH-43, and Independent Innovation Research Fund of Wuhan University of Technology, grant number 2019-JL-018.

Acknowledgments

We wish to express our gratitude to Feng Ye for his assistance in artificial neural network programming.

Conflicts of Interest

The authors declare no conflict of interest.

Nomenclature

apspecific surface area of adsorbent, m2/m3
biLangmuir constant, 1/bar
cimolar concentration of component i, mol/m3
cgmolar concentration of mixture, mol/m3
Cpaispecific heat capacity of adsorbed phase, J/mol/K
Cpgspecific gas phase heat capacity at constant pressure, J/mol/K
cpsspecific heat capacity of adsorbent, J/kg/K
cpwspecific heat capacity of column wall, J/kg/K
DLaxial dispersion coefficient, W/m2/K
hgsheat transfer coefficient between gas and solid phase, W/m2/K
hinheat transfer coefficient between gas phase and bed wall, W/m2/K
houtheat transfer coefficient between wall and environment, W/m2/K
Hiheat of adsorption of component i, J/mol
k1iparameter of nis in Equation (6), mol/kg
k2iparameter of nis in Equation (6), mol/kg/K
k3iparameter of bi in Equation (6), 1/bar
k4iparameter of bi in Equation (6), K
KLgaxial gas phase thermal conductivity, W/m/K
KLsaxial solid phase thermal conductivity, W/m/K
Kwaxial thermal conductivity for wall, W/m/K
Mmolecular weight of mixture, kg/mol
Mimolecular weight of component i, kg/mol
ni*equilibrium adsorption amount, mol/kg
nidynamic adsorption amount of ith component, mol/kg
nissaturation adsorption amount of ith component, mol/kg
ppressure, bar
Runiversal gas constant, 8.314 J/mol/K
Rininner radius of adsorption column, m
Routouter radius of adsorption column, m
Rpparticle radius, m
ttime, s
Ttemperature of adsorption bed, K
Tggas phase temperature, K
Tssolid phase temperature, K
Twwall temperature, K
Tfambient temperature, K
wimass transfer coefficient of component i, 1/s
yimolar fraction of component i in gas phase
zaxial position in adsorbent bed, m
Greek symbols
εbbed porosity
νgsuperficial velocity, m/s
μdynamic viscosity, N∙s/m2
ρggas phase density, kg/m3
ρpadsorbent density, kg/m3
ρssolid phase density, kg/m3
ρwwall density, kg/m3

References

  1. Winter, C.J. Hydrogen energy—Abundant, efficient, clean: A debate over the energy-system-of-change. Int. J. Hydrogen Energy 2009, 34, S1–S52. [Google Scholar] [CrossRef]
  2. Yáñez, M.; Relvas, F.; Ortiz, A.; Gorri, D.; Mendes, A.; Ortiz, I. PSA purification of waste hydrogen from ammonia plants to fuel cell grade. Sep. Purif. Technol. 2020, 240, 116334. [Google Scholar] [CrossRef]
  3. Golmakani, A.; Nabavi, S.A.; Manovi, V. Effect of impurities on ultra-pure hydrogen production by pressure vacuum swing adsorption. J. Ind. Eng. Chem. 2020, 82, 278–289. [Google Scholar] [CrossRef]
  4. da Silva Veras, T.; Mozer, T.S.; da Costa Rubim Messeder dos Santos, D.; da Silva César, A. Hydrogen: Trends, production and characterization of the main process worldwide. Int. J. Hydrogen Energy 2017, 42, 2018–2033. [Google Scholar] [CrossRef]
  5. Elam, C.C.; Evans, R.J. Overview of hydrogen production. Prepr. Pap. Am. Chem. Soc. Div. Fuel Chem. 2004, 49, 481–482. [Google Scholar]
  6. Sircar, S.; Golden, T.C. Purification of hydrogen by pressure swing adsorption. Sep. Sci. Technol. 2000, 35, 667–687. [Google Scholar] [CrossRef]
  7. Song, C.F.; Liu, Q.L.; Ji, N.; Kansha, Y.; Tsutsumi, A. Optimization of steam methane reforming coupled with pressure swing. Appl. Energy 2015, 154, 392–401. [Google Scholar] [CrossRef]
  8. Casas, N.; Schell, J.; Pini, R.; Mazzotti, M. Fixed bed adsorption of CO2/H2 mixtures on activated carbon: Experiments and modeling. Adsorption 2012, 18, 143–161. [Google Scholar] [CrossRef] [Green Version]
  9. Yang, J.Y.; Lee, C.H. Separation of hydrogen mixtures by a two-bed pressure swing adsorption process using zeolite 5A. Ind. Eng. Chem. Res. 1997, 36, 2789–2798. [Google Scholar] [CrossRef]
  10. Park, J.Y.; Yang, S.I.; Choi, D.Y. Adsorption dynamics of H2/CO2, H2/CO and H2/CH4 mixtures in Li-X Zeolite bed. Korean Chem. Eng. Res. 2008, 5, 783–791. [Google Scholar]
  11. You, Y.W.; Lee, D.G.; Kim, K.H.; Oh, M.; Lee, C.H. Layered two- and four-bed PSA processes for H2 recovery from coal gas. Chem. Eng. Sci. 2012, 68, 413–423. [Google Scholar]
  12. Olajossy, A.; Gawdzik, A.; Budner, Z.; Dula, J. Methane separation from coal mine methane gas by vacuum pressure swing adsorption. Chem. Eng. Res. Des. 2003, 81, 474–482. [Google Scholar] [CrossRef]
  13. Yang, R.T.; Doong, S.J. Gas separation by pressure swing adsorption: A pore-diffusion model for bulk separation. AlChE J. 1985, 31, 1829–1842. [Google Scholar] [CrossRef]
  14. Malek, A.; Farooq, S. Study of a six-bed pressure swing adsorption process. AlChE J. 1997, 43, 2509–2523. [Google Scholar] [CrossRef]
  15. Jiang, L.; Fox, V.G.; Biegler, L.T. Simulation and optimal design of multiple-bed pressure swing adsorption systems. AlChE J. 2004, 50, 2904–2917. [Google Scholar] [CrossRef]
  16. Casas, N.; Schell, J.; Joss, L.; Mazzotti, M. A parametric study of a PSA process for pre-combustion CO2 capture. Sep. Purif. Technol. 2013, 104, 183–192. [Google Scholar] [CrossRef]
  17. Qasem, N.A.A.; Ben-Mansour, R. Energy and productivity efficient vacuum pressure swing adsorption process to separate CO2 from CO2/N2 mixture using Mg-MOF-74: A CFD simulation. Appl. Energy 2018, 209, 190–202. [Google Scholar] [CrossRef]
  18. Moon, D.K.; Lee, D.G.; Lee, C.H. H2 pressure swing adsorption for high pressure syngas from an integrated gasification combined cycle with a carbon capture process. Appl. Energy 2016, 183, 760–774. [Google Scholar] [CrossRef]
  19. Brea, P.; Delgado, J.A.; Águeda, V.I.; Uguina, M.A. Comparison between MOF UTSA-16 and BPL activated carbon in hydrogen purification by PSA. Chem. Eng. J. 2018, 355, 279–289. [Google Scholar] [CrossRef]
  20. Delgado, J.A.; Águeda, V.I.; Uguina, M.A.; Brea, P.; Grande, C.A. Comparison and evaluation of agglomerated MOFs in biohydrogen purification by means of pressure swing adsorption (PSA). Chem. Eng. J. 2017, 326, 117–129. [Google Scholar] [CrossRef]
  21. Lopes, F.V.S.; Grande, C.A.; Alírio, E.R. Fast-cycling VPSA for hydrogen purification. Fuel 2012, 93, 510–523. [Google Scholar] [CrossRef]
  22. Xiao, J.S.; Li, R.P.; Bénard, P.; Chahine, R. Heat and Mass Transfer Model of Multicomponent Adsorption System for Hydrogen Purification. Int. J. Hydrogen Energy 2015, 40, 4794–4803. [Google Scholar] [CrossRef]
  23. Xiao, J.S.; Peng, Y.Z.; Bénard, P.; Chahine, R. Thermal Effects on Breakthrough Curves of Pressure Swing Adsorption for Hydrogen Purification. Int. J. Hydrogen Energy 2016, 41, 8236–8245. [Google Scholar] [CrossRef]
  24. Xiao, J.S.; Fang, L.; Bénard, P.; Chahine, R. Parametric study of pressure swing adsorption cycle for hydrogen purification using Cu-BTC. Int. J. Hydrogen Energy 2018, 43, 13962–13974. [Google Scholar] [CrossRef]
  25. Mondal, M.; Datta, A. Energy transfer in hydrogen separation from syngas using pressure swing adsorption (PSA) process: A thermodynamic model. Int. J. Energy Res. 2016, 41, 448–458. [Google Scholar] [CrossRef]
  26. Choi, W.K.; Kwon, T.I.; Yeo, Y.K.; Lee, H.; Song, H.K.; Na, B.K. Optimal Operation of the Pressure Swing Adsorption (PSA) Process for CO2 Recover. Korean J. Chem. Eng. 2003, 20, 617–623. [Google Scholar] [CrossRef]
  27. Huang, Q.L.; Malekian, A.; Eić, M. Optimization of PSA process for producing enriched hydrogen from plasma reactor gas. Chem. Eng. Sci. 2008, 62, 22–31. [Google Scholar] [CrossRef]
  28. Oliveira, L.M.; Koivisto, H.; Iwakiri, I.G.; Loureiro, J.M.; Ribeiro, A.M.; Nogueira, I.B. Modelling of a Pressure Swing Adsorption Unit by Deep Learning and Artificial Intelligence Tools. Chem. Eng. Sci. 2020, 224, 115801. [Google Scholar] [CrossRef]
  29. Yu, X.; Shen, Y.; Guan, Z.; Zhang, D.; Tang, Z.; Li, W. Multi-objective optimization of ANN-based PSA model for hydrogen purification from steam-methane reforming gas. Int. J. Hydrogen Energy 2021, 46, 11740–11755. [Google Scholar] [CrossRef]
  30. Lopes, F.V.S.; Grande, C.A.; Ribeiro, A.M.; Oliveira, E.L.G.; Loureiro, J.M.; Rodrigues, A.E. Enhancing capacity of activated carbons for hydrogen production. Int. Eng. Chem. Res. 2009, 48, 3978–3990. [Google Scholar] [CrossRef]
  31. Tao, W.; Ma, S.; Xiao, J.S.; Bénard, P.; Chahine, R. Simulation and optimization for hydrogen purification performance of vacuum pressure swing adsorption. Energy Procedia 2019, 158, 1917–1923. [Google Scholar] [CrossRef]
  32. Hermes, R.; Amaro, G.; Frederico, W. Methane/nitrogen separation through pressure swing adsorption process from nitrogen-rich streams. Chem. Eng. Process. 2016, 103, 70–79. [Google Scholar]
  33. Park, Y.; Moon, D.K.; Kim, Y.H.; Ahn, H.; Lee, C.H. Adsorption isotherms of CO2, CO, N2, CH4, Ar and H2 on activated carbon and zeolite LiX up to 1.0MPa. Adsorption 2014, 20, 631–647. [Google Scholar] [CrossRef]
  34. Lopes, F.V.S.; Grande, C.A.; Rodrigues, A.E. New Pressure Swing Adsorption Cycles for Hydrogen Purification from Steam Reforming Off-Gases; University of Porto: Porto, Portugal, 1999. [Google Scholar]
  35. Lopes, F.V.S.; Grande, C.A.; Rodrigues, A.E. Activated carbon for hydrogen purification by pressure swing adsorption: Multicomponent breakthrough curves and PSA performance. Chem. Eng. Sci. 2011, 66, 303–317. [Google Scholar] [CrossRef]
  36. Xiao, J.S.; Li, C.L.; Fang, L.; Böwer, P.; Wark, M.; Bénard, P.; Chahine, R. Machine learning–based optimization for hydrogen purification performance of layered bed pressure swing adsorption. Int. J. Energy Res. 2020, 44, 4475–4492. [Google Scholar] [CrossRef]
  37. Ito, Y. Approximation of continuous functions on Rd by linear combinations of shifted rotations of a sigmoid function with and without scaling. Neural Netw. 1992, 5, 105–115. [Google Scholar] [CrossRef]
  38. Ma, S.; Tong, L.; Ye, F.; Xiao, J.S.; Bénard, P.; Chahine, R. Hydrogen purification layered bed optimization based on artificial neural network prediction of breakthrough curves. Int. J. Hydrogen Energy 2019, 44, 5324–5333. [Google Scholar] [CrossRef]
  39. Ye, F.; Ma, S.; Tong, L.; Xiao, J.S.; Bénard, P.; Chahine, R. Artificial neural network based optimization for hydrogen purification performance of pressure swing adsorption. Int. J. Hydrogen Energy 2019, 44, 5334–5344. [Google Scholar] [CrossRef]
Figure 1. Adsorption isotherms of H2 (a), CO2 (b), N2 (c), CH4 (d), and CO (e) on R2030 and AC5-KS. Symbols: Experimental data from [30]. Lines: Fitting with the extended Langmuir model of the AC5-KS (—) and of the R2030 (- - -).
Energies 14 02450 g001
Figure 2. Breakthrough curves (a,b) and temperature profiles (c,d) on AC5-KS and R2030. Symbols: Experimental data for AC5-KS from [35]. Lines: Simulation results for AC5-KS (—) and R2030 (- - -).
Energies 14 02450 g002
Figure 3. VPSA flow diagram (a) and pressure curves (b). Symbols: Experimental data for VPSA from [35]. Lines: Simulation results of VPSA (—) and PSA (- - -).
Energies 14 02450 g003
Figure 4. Changes in molar fraction and temperature for VPSA and PSA cycles in adsorption bed: (a) Molar fraction for cycle 1; (b) temperature profiles for cycle 1; (c) molar fraction for cycle 37; (d) temperature profiles for cycle 37. Symbols: Experimental data for VPSA from [35]. Lines: Simulation results of VPSA (—) and PSA (- - -).
Energies 14 02450 g004
Figure 5. Effects of feeding time and purging time on hydrogen purity (a) and recovery (b) for VPSA cycles.
Energies 14 02450 g005
Figure 6. Regression results of training, validation, test, and all.
Energies 14 02450 g006
Table 1. Adsorption isotherm parameters and isosteric heats of adsorption for AC5-KS and R2030 [30].
Componentsk1i (mol/kg)k2i × 102 (mol/kg/K)k3i × 105 (1/bar)k4i (K)Hi (kJ/mol)
AC5-KS-----
CO5.416−0.45955.94235923.23
CO213.78−1.6354.733273528.02
H2−7.8923.2590.999823007.26
N20.47641.0852.098256018.27
CH46.217−0.45041.88293123.18
R2030-----
CO6.225−1.2735.66214219.100
CO213.94−2.31635.46219527.870
H2−6.7922.5511.08324383.192
N20.0000053280.99991.048280011.834
CH46.973−0.778421.86213217.652
Table 2. Characteristics of adsorbents and adsorption bed [30,34].
AdsorbentsAC5-KSR2030Adsorption BedValue
Adsorbent density, ρp (kg/m3)786874Internal bed radius, Rin (m)0.021
Solid density, ρs (kg/m3)21102162Bed length, L (m) 0.2456
Particle porosity, εp0.6270.60Bed porosity, εb0.404
Particle specific heat, cps (J/kg/K)1046880Wall density, ρw (kg/m3)7870
Particle radius, Rp (m)0.001450.00117Wall specific heat, cpw (J/kg/K)142
Gas phase thermal conductivity, KLg (W/m/K)0.10830.1083Wall thermal conductivity, Kw (W/m/K)400.9
Solid phase thermal conductivity, KLs (W/m/K)20.5820.58Heat transfer coefficient, hin (W/m2/K)55
Heat transfer coefficient, hgs (W/m2/K)130130Heat transfer coefficient, hout (W/m2/K)50
Table 3. Operating conditions used in the adsorption process [35].
Mixture CompositionAdsorption
Pressure (bar)
Feed
Temperature (K)
Feed Flow Rate
(298 K, 1 bar) (m3s−1)
Initial GasAmbient
Temperature (K)
N2/CO/CO2/CH4/H2 =
0.007/0.012/0.021/0.23/0.73
53235 × 10−5He303
Table 4. Operating conditions used in VPSA cycles.
CycleA0A1A2A3A4B0B1B2B3B4C0C1C2C3C4
tFeed (s)101101101101101151151151151151201201201201201
tPurge (s)407010013016040701001301604070100130160
Feed temperature: 303 K, Ambient temperature: 303 K, Flow rate: 5 × 10⁵ m3/s (298 K 1 bar)
phigh = 5 bar, plow = 0.5 bar, pinter = 3.875 bar, tED1 = tED2 = tED3 = tEP3 = tEP2 = tEP1 = 16 s, tBlow down = 201 s, tPress = 21 s
Table 5. Optimization results with ANN method and Aspen confirmation.
Optimization TargetOptimal Parameters
t feed ( s ) ,   t purge ( s )
ANN Prediction
P u r H 2 ,   R e c H 2
Aspen Confirmation
P u r H 2 ,   R e c H 2
Max R e c H 2 223, 960.9800, 0.88650.9791, 0.8844
Max P u r H 2 100, 450.9933, 0.80000.9929, 0.8009
Publisher’s Note: MDPI stays neutral with regard to jurisdictional claims in published maps and institutional affiliations.

