Article

Numerical Damping Calibration Study of Particle Element Method-Based Dynamic Relaxation Approach for Modeling Longwall Top-Coal Caving

1
School of Energy Science and Engineering, Henan Polytechnic University, Jiaozuo 454003, China
2
College of Chemistry and Chemical Engineering, Henan Polytechnic University, Jiaozuo 454003, China
3
Zhaozhuang Coal Industry Co., Ltd., Jinneng Holding Group, Changzhi 046600, China
4
Postdoctoral Station of Safety Science and Engineering, Henan Polytechnic University, Jiaozuo 454003, China
*
Author to whom correspondence should be addressed.
Energies 2021, 14(9), 2348; https://doi.org/10.3390/en14092348
Submission received: 23 March 2021 / Revised: 15 April 2021 / Accepted: 16 April 2021 / Published: 21 April 2021

Abstract

:
When using the explicit dynamic relaxation approach (DRA) to model the quasi-static rock breakage, fragmentation, and flow problems, especially the top-coal caving question, introducing numerical damping into the solution equation is inevitable for reducing the vibration frequency and impact speed of mesh nodes, which is significantly affect the fidelity of the computation results. Although the DRA has been widely adopted to simulate top-coal caving, the reasonable value and calibration method of numerical damping are still open issues. In this study, the calibration process of reasonable numerical damping for modeling top-coal caving is investigated by comparing with the experimental results, in which several geometry parameters of the drawing funnel are selected as the calibration indexes. The result shows that the most reasonable numerical damping value is 0.07 for the numerical modeling of interval top-coal caving in extra-thick coal seams. Finally, the correlation between the numerical damping and the physical top-coal drawing process is discussed. The numerical damping indirectly reflects the fragmentation in multi scale of coal mass and friction interaction between coal particles during the caving process, which reduces the vibration intensity of the top-coal caving system and dissipates the kinetic energy.

1. Introduction

The longwall top-coal caving technology (LTCC) is the most popular mining approach in extra-thick coal seams in China, vigorously promoting the coal production of single working faces up to 10 million tons in many northwestern China coal mines [1,2,3]. Through nearly 40 years, the LTCC has replaced the conventional slicing mining method [4,5], as its great potential in improving the safety, effectiveness, and production of coal mines. According to statistics, the mining period of the fully mechanized top-coal caving face is shortened, and the recovery rate can reach 60~85% [6,7].
Nowadays, the LTCC in extra-thick coal seam has entered the stage of automation and intelligence. Therefore, the evolution characteristics of the coal-rock interface under different caving technologies need to be studied more accurately. The shape of coal rock interface after top-coal caving in the strike direction of working face was studied and verified by Wang et al. [8] through laboratory similar experiment. The coal and rock flow law, which is affected by coal drawing step, top coal lump size, coal drawing process and drawing opening size, was studied by Huang et al. [9] through using the experimental platform of drawing coal. Taking the LTCC panel no. 21072 of Changcun coal mine as the study object, the mechanism of top-coal caving influenced by mining-caving ratio and caving step was studied by using a 1:25 laboratory similar experiment model [10]. Besides, the cycle ratio of mining and caving was also investigated by laboratory similarity experiments [11]. From the above, it is evident that the laboratory similarity experiment is an essential tool in studying the LTCC question.
The particle flow code (PFC) numerical simulation was applied to study the top-coal caving law by Xie who found that the top coal at the coal caving opening can form an arch, and the arch structure probably was destroyed after hydraulic support’s tail beam swinging [12]. Based on PFC, a three-dimensional top-coal drawing model was established by Wang et al. [13,14,15]. He found that the drawing funnel was greatly affected by the hydraulic support and that the recovery rate of interval drawing was higher when simulating the drawing law of top-coal containing gangue. Continuum-discontinue element method (CDEM) numerical software was applied to study the caving effect of single round caving and multi-round caving with different top coal thickness and it was concluded that the recovery rate of multi-round caving was higher from the perspective of top coal recovery rate [7,16]. In the CDEM, the continuous-cohesive particle element model showed an excellence performance in modeling LTCC, verified by the Bergmark Roos model’s theoretical results [17]. Based on CDEM simulation, a control method based on time criterion was proposed to optimize the automatic top-coal caving technology [18].
Definitely, in obtaining the fracture evolution process of top coal, the underground in-situ measurement method is most direct and accurate. Still, it has several shortages: the deterioration test condition, the difficulty of repetition, a high cost in data collection. Compared to the in-situ monitoring, the laboratory physical similar experiment has the advantages in modeling the drawing process and obtaining the displacement data of the coal particles, but it only can get the results of the final distribution of the coals and rocks, which usually is hard to trace back to the initial position of the drawn coals and record the stress variations. By contraries, numerical modeling can enrich the study means of top-coal drawing by capturing the precise stress and displacement fields and calculating the drawn coals’ ellipsoid body in reverse, which has become a powerful technique for investigating the mechanism of top-coal drawing. The dynamic relaxation approach (DRA) is prevalent in modeling the flow of top coal, which models the static or quasi-static mechanical behavior by introducing a significant parameter, the numerical damping, in its balance equation. Many commercial simulation software adopts this approach, such as FLAC3D [19] and CDEM [17]. Numerical damping embraces the idea of backward time step iteration, which can deal with the shock or non-convergence caused by too fast stress. In the process of top coal drawing out, the broken coal and rock blocks frequently contact, collide, rub and rotate with each other under the action of external force and gravity. This process consumes the gravitational potential energy of coal and rock mass and turns into specific kinetic energy and internal energy of mutual friction. The force produced by contact friction between coal and rock blocks can be expressed by numerical damping and block velocity. And the value of numerical damping is usually related to the simulated physical process, boundary conditions, material properties, and other factors, which is a macro parameter. The value of numerical damping may directly affect numerical simulation results, such as the characteristics of coal rock interface, so it is crucial to study the determination method of numerical damping value for improving the numerical simulation of top-coal caving.
In this paper, the CDEM based on the DRA is used to simulate the top coal caving process in extra thick coal seams. By studying the caving funnel’s boundary characteristics and the shape of the caving funnel under different damping values, and comparing with the laboratory simulation, a method to determine the damping value in the numerical simulation of top-coal caving is proposed by quantifying the characteristic parameters of the caving body. And the influence mechanism of numerical damping on top-coal drawing process in particle discrete element simulation is also revealed.

2. Basic Theory of Dynamic Relaxation Approach

2.1. Dynamic Relaxation Principle

The DRA was a new mechanical concept proposed by Rayleigh in the last century [19]. It was developed by Day [20,21] and successfully applied to solve plane rigid frame and plate structures in 1965. The DRA solves static problems by using the dynamic solution of the stressed system. In the DRA, it is assumed that the structure’s mass was concentrated on the nodes, and each node adds virtually damping force and inertia force. Thus, the static equilibrium equation of each node was transformed into the dynamic equilibrium equation. Starting from the known initial state of the node, the linear differential equation with time as independent variable and velocity as dependent variable was integrated, which was called the dynamic relaxation process of the node. When the node reached the static state, the dynamic relaxation end of the node was defined. After the dynamic relaxation of a node was completed, it would inevitably lead to the imbalance of the related nodes to start the dynamic relaxation process until all nodes were statically balanced [22].
In DRA, the equation to be solved is a linear function about time. Using the initial state to iteratively calculate the new function value can also be applied to nonlinear problems. The algorithm of DRA is as follows:
It is assumed that the system is discretized into n connected nodes, and the cndition that the whole system is static equilibrium is as follows:
{ P ( Δ ) } = { F }
where { P ( Δ ) } represents the inner force induced by displacements of nodes 1~N; F is the force on a node, given by:
P ( Δ ) } = { P 1 , P 2 , , P N } T
where P N represents the inner force induced by displacements of the node N.
The three freedom degrees of each node is expressed by the following formula:
P i = [ P x i , P x i , P x i , ] T
Then the residual force of each node is equal to the difference value between the external load and the inner force, and its matrix is as follows:
{ R } = [ R 1 , R 2 , , R N ] T = { F } { P ( Δ ) }
The residual force of each node can be decomposed by:
R 1 = [ R xi , R yi , R zi , ] T
For any node i, taking the x direction as an example, the residual force R x i   is zero when x direction is in a static equilibrium state, and if it’s unbalanced, the residual force R x i   is not zero. Assuming that the inertia force along the x direction is M x i a x i and the damping force is C i V x i , the motion equation of the node along the x direction at t time can be expressed as follows:
R t x i = M x i a t x i + C i V t x i
where a t x i and V t x i are the acceleration and velocity of node i in the x direction at time t respectively, and M x i is the mass of node i in the x direction, and C i is the numerical damping coefficient.
The difference equation of the formula is as follows:
R t x i = M x i ( V x i t + Δ t / 2 V x i t Δ t / 2 ) / Δ t + C i ( V x i t + Δ t / 2 V x i t Δ t / 2 ) / 2
According to Equation (7), the velocity V x i t + Δ t / 2 can be calculated by:
V x i t + Δ t / 2 = 2 R t x i Δ t + ( 2 M x i C i Δ t ) V x i t Δ t / 2 2 M x i + C i Δ t
Through Equation (8), we can get the new coordinate value in x-direction of node i at t + Δ t :
x i t + Δ t = x i t + 2 R t x i Δ t + ( 2 M x i C i Δ t ) V x i t Δ t / 2 2 M x i + C i Δ t × Δ t
The velocity and displacement of node i in y or z direction are the same as that in the x direction.
From the node dynamic relaxation process, it can be seen that the model should be calculated from the initial position and initial velocity. Simultaneously, time goes from beginning to end until all nodes complete this process, and dynamic relaxation ends. In the process of operation, the selection of parameters M   i ,   C i , Δ t have a direct impact on the operation results. The mass parameter M   i is determined by the material properties, and Δ t is the time step which is generally very small. So the value of numerical damping C i has a significant influence on the application results of the DRA. Numerical damping dramatically influences the accuracy of static simulation results, and its value is generally related to the mechanical properties of material damage, simulation boundary conditions, contact, and other factors.

2.2. The Principle of Progressive Failure Process of CDEM

CDEM is a method of coupling the finite element and the discrete element. And It can carry out finite element calculation inside the block and discrete element calculation at the boundary of the block. CDEM can simulate the deformation and motion characteristics of materials in continuous and discontinuous states and simulate materials’ progressive failure process from continuum to in-continuity.
As shown in Figure 1, a link bar model is established between the two particles, which can simulate the fracture and crushing process of top coal under the action of external force in the initial complete state [18,19]. The link bar model can be regarded as a rectangle. The short side of the rectangle is the smaller particles’ diameter, and the long side is the sum of the radii of the two particles. It can be used to calculate the contact force or cohesion between two particle elements. Based on the connecting bar model, the surface contact relationship between two particle elements is established. The equivalent contact area Ac is the projected area of smaller particles, and Ac is mainly used to calculate the contact stiffness between particle elements [17].
The contact stiffness parameters can be obtained by Equation (10):
{ K i = E i A c ( R 1 + R 2 ) , i = 1 , 2 A c = min { 2 R 1 , 2 R 2 }
where Ki and Ei are the contact stiffness and modulus tensors, respectively; the subscript i = 1 represents the normal component, and it represents tangential components if i = 2. R1 and R2 are the radii of the two particle elements, respectively.
The contact force and momentum between two contact particle elements are calculated by:
{ F i ( t + Δ t ) = F i ( t ) K i Δ u i , i = 1 , 2 M i ( t + Δ t ) = M i ( t ) K i J i Δ θ i / A c
where Fi(t + Δt) and Fi(t) are respectively the contact force at the time of t + Δ t and t. Mi(t + Δt) and Mi(t) are respectively the moment at the time of t + Δ t and t ; Ji and Δθi are respectively the moment of inertia and increment angle difference between two contact particles; Δui is the increment of contact displacement.
According to Mohr-Coulomb criterion and maximum tensile stress criterion, the calculation formula of contact force is shown as below:
If   F 1 T A c 0 ,   then   F 1 = F 2 = 0 ,   T = C = 0 ; If   F 2 F 1 tan ( φ ) C A c 0 ,   then   F 2 = F 1 tan ( φ ) = 0 ,   T = C = 0
Equation (13) is the criterion of contact between two particle elements. If any inequality in the formula is satisfied, the contact between particles will no longer transfer moment:
( F 1 A c + M 2 I R a v e ) T 0 ;   or ( | F 2 | A c + M 1 I R a v e ) [ F 1 tan ( φ ) + C ] 0
where T, C and φ are tensile strength, cohesion, and internal friction angle, respectively; I is the moment of inertia; Rave = (R1 + R2)/2.
In the two-dimensional numerical model, the contact state between the rigid boundary and the particle element is determined by the relative position between the particle center and the rigid wall edge. When the distance between the center of the particle and the rigid wall is less than or equal to the radius of the particle, it is considered that the particle and the rigid boundary are in contact, given by:
d = | V k l n | R
where d is the distance from the particle center to the rigid wall, Vkl is the relative position vector from the particle center to the endpoint in which k and l are the two points of the vector, respectively (see Figure 2); n is the unit normal vector of the rigid wall, and R is the radius of the particle element. The method to determine the contact between particles and rigid wall is shown in Figure 2. Once the contact between the particle and the rigid wall is established, the normal and tangential contact behaviors are generated automatically.

3. Numerical Simulation Experiment of Drawing Coal in Extra-Thick Coal Seams

3.1. Numerical Model

(1)
Basic assumptions
In the process of top-coal caving, the top coal and immediate roof experienced the process of ‘damaged body → broken block → loose coal flow’ under the action of overlying strata advanced supporting pressure and repeated support pressure. The numerical simulation assumed that the top coal was discharged through the coal caving opening as uniform particles. The particle size increased gradually from bottom to top. In coal particle migration, it was only affected by its gravity and mutual friction. If there was a little gangue in the top coal, it was simplified as coal particles.
(2)
Engineering background and numerical model
In this paper, the 8222 working face of Tashan coal mine is taken as the engineering background. The average thickness of coal seam is 14.0 m, the mining height is 4.0 m, the caving height is about 10.0 m, the average dip angle of coal seam is 2 degrees. The working face adopts the one-round interval mining technology with ‘large, medium, small and micro’ four-stage automatic top-coal caving method, as shown in Figure 3.
The top-coal caving sequence is as follows: the coal in ’large’ position is drawn first, the coal in ‘medium’ position second, the ‘small’ third, and the ‘micro’ last. In order to simplify the calculation and accurately reflect the coal rock shape after top-coal caving in the working face, the numerical model is set with an angle of 0° and a length of 58 m. There are 25 top-coal caving openings in total, and the width of each coal caving opening is 1.75 m. The top-coal drawing openings are numbered as 1#, 2#, 24#, 25#, with 7.05 m and 7.2 m reserved on both sides. Rigid plates are used as displacement constraints on the left and right sides and the top of the model to limit the movement range of particles; velocity constraints are used on the bottom boundary surface. The velocity and displacement are zero in the initial state, as shown in Figure 4. In the model, the top coal is divided into coal 1 layer, coal 2 layer and coal 3 layer, and the particle size is 0.05 m, 0.08 m and 0.15 m, respectively. The physical and mechanical parameters of coal and rock are shown in Table 1.

3.2. Simulation Scheme

The numbers of the top-coal caving openings of the numerical model are 1#~25#, divided into four levels in advance: large, medium, small and micro. There are seven intervals between two ‘large’ top-coal caving openings, seven intervals between ‘medium’, four intervals between ‘small’ and one interval between ‘micro’. The support classification is shown in Table 2. The sequence of the numerical model is as follows: large → medium → small → micro. This paper studies the influence of different numerical damping on the numerical simulation of top-coal caving and puts forward the damping value method, which is reasonably determined. Combined with experience, numerical damping is set as 0.01, 0.03, 0.07, 0.11 and 0.15, respectively, to simulate the coal-rock interface rules of top coal caving.

3.3. Simulation Results
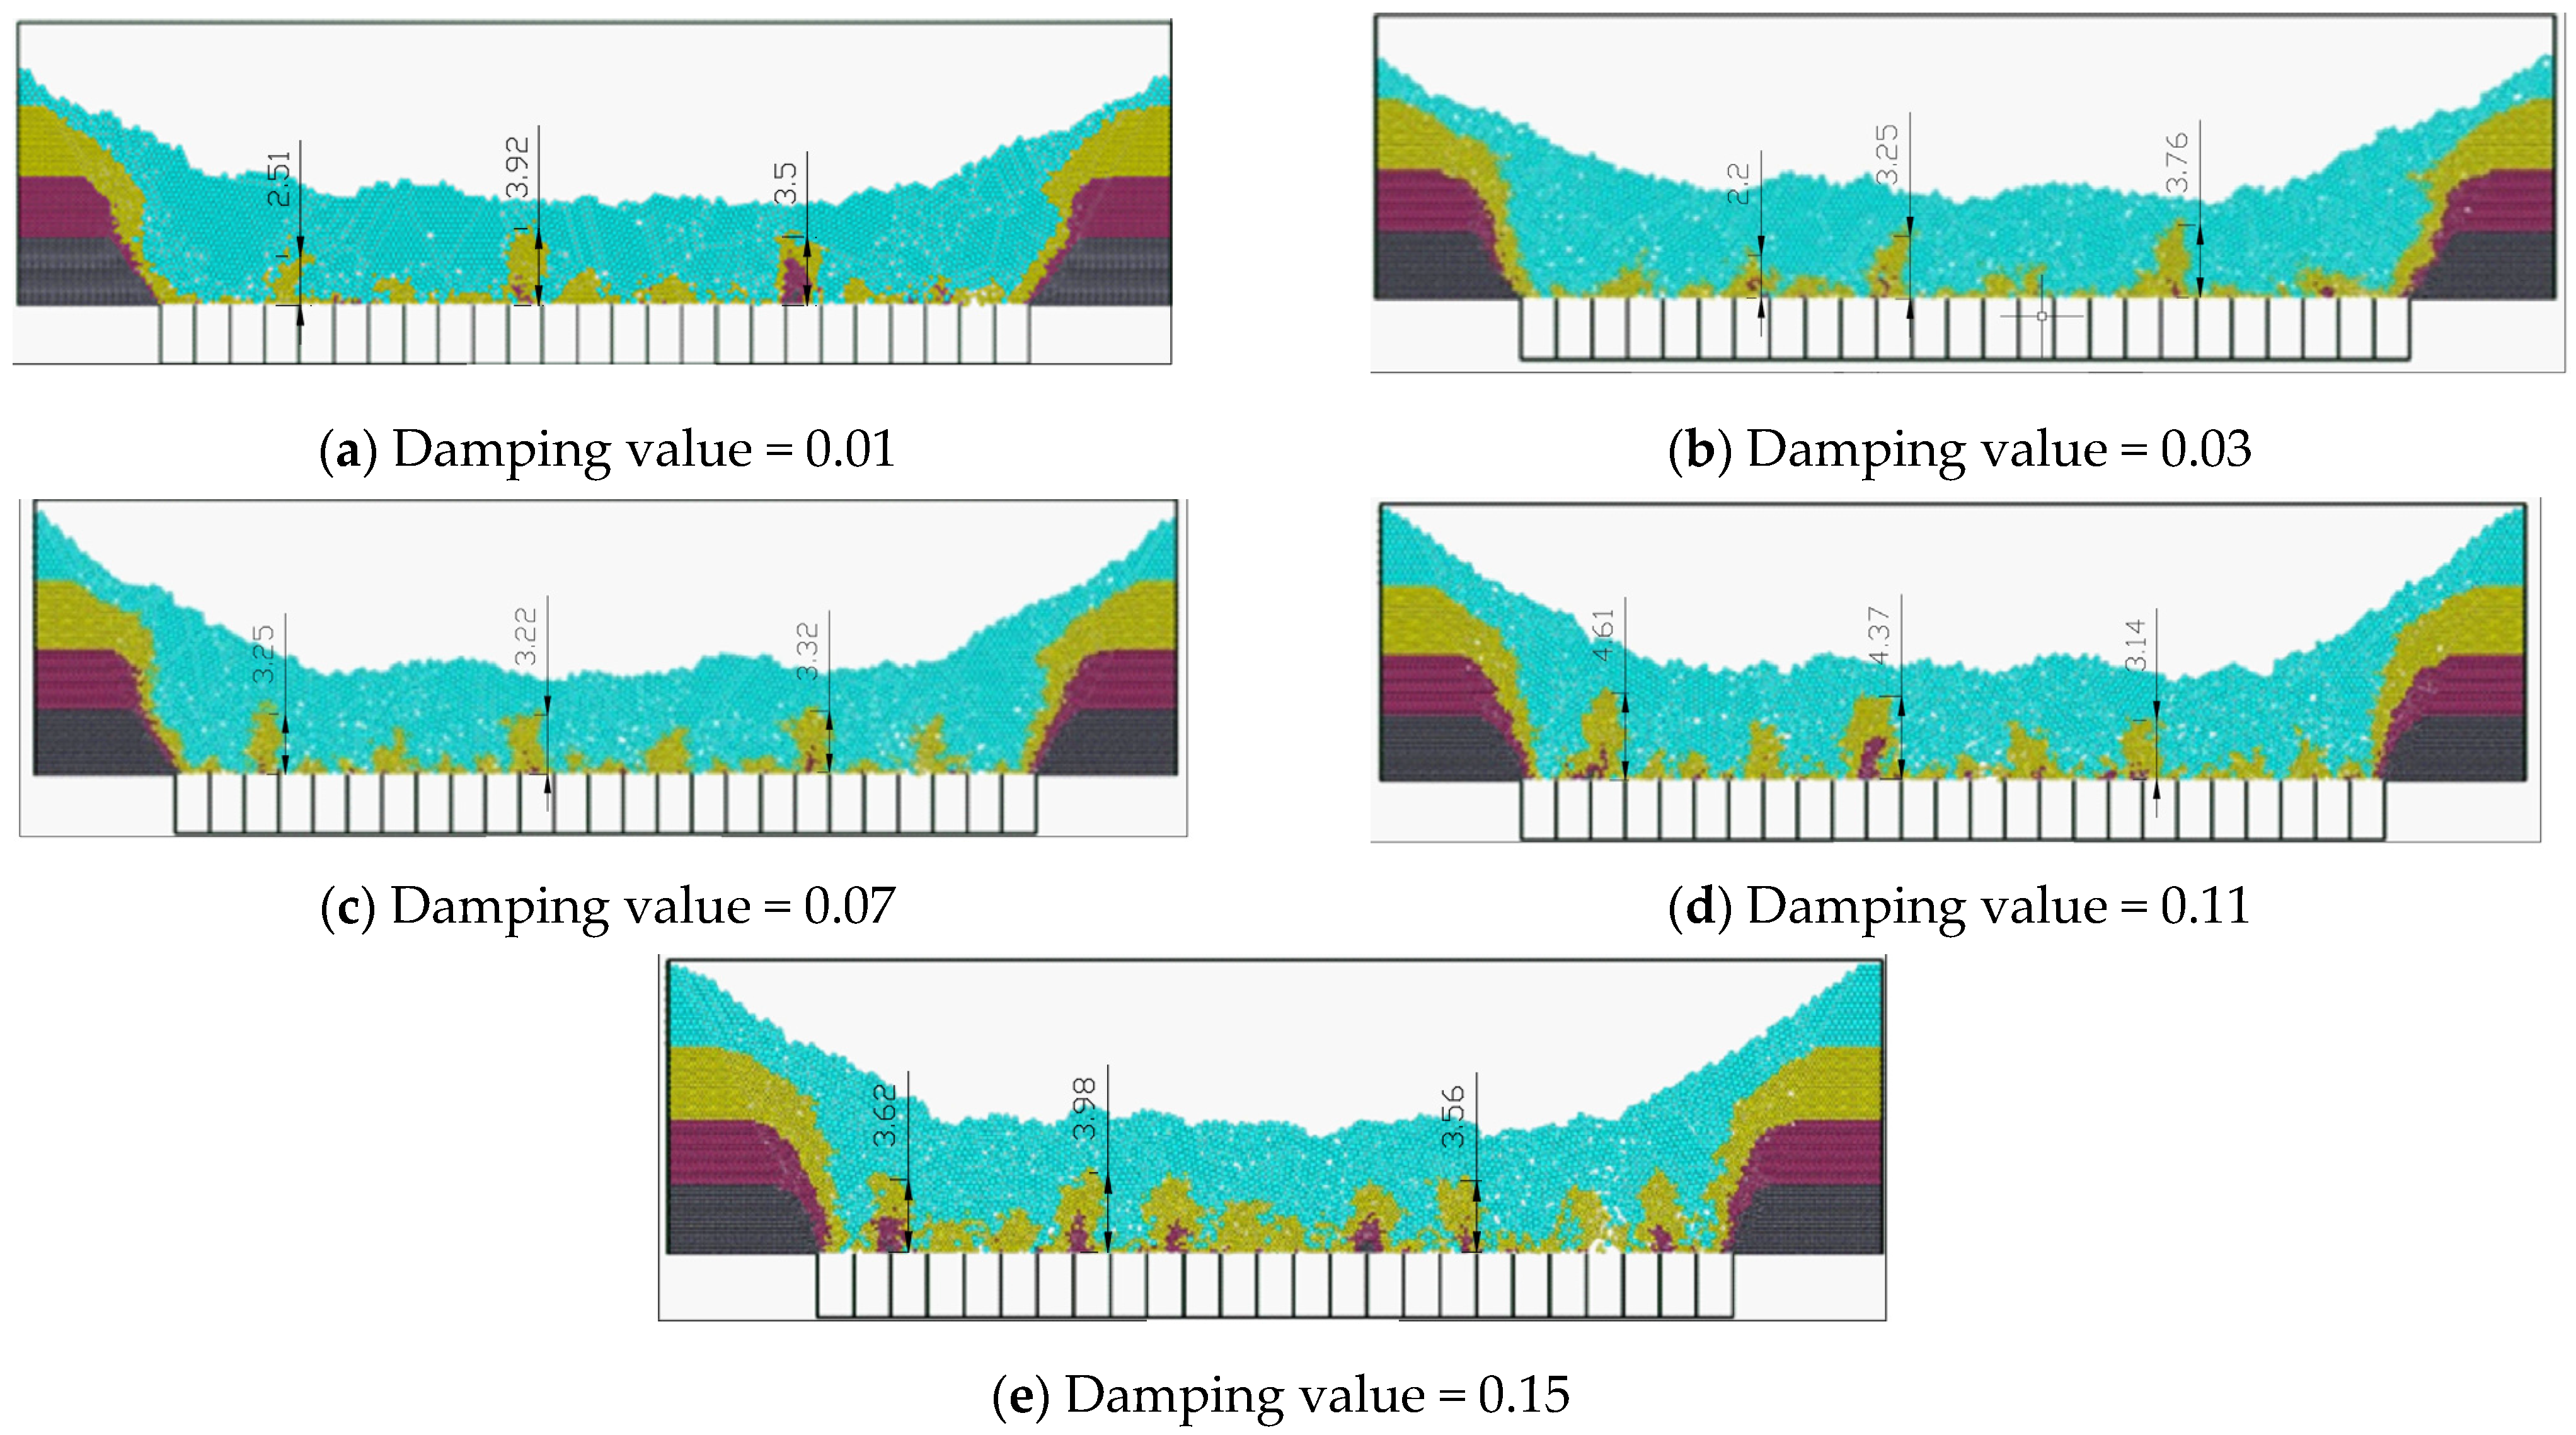
(1)
Results of the level 1 caving under different damping values
The top-coal drawing openings which are set as level 1 are 1#, 9#, 17#, 25#, and the coal-rock boundaries are formed as a symmetrical ‘V’ type with the top-coal drawing opening as the center. The ‘V’ type is divided into upper and lower parts. The upper coal-rock boundary is similar to a curve, and the lower part is identical to a straight line, as shown in Figure 5. The simulation results show that under the same conditions of other parameters, the larger the numerical damping value, the smaller the top-coal drawing funnel’s angle, and the narrower the ‘V’ shape.
When the numerical damping value is 0.01, the average angle of ‘V’ is 48.5°, the maximum influence range of the upper part of ‘V’ is 10.9 m, and the average height of upper part of ‘V’ is 1.99 m. When the numerical damping value is 0.03, the angle of ‘V’ decreases, with an average of about 41.25°. The maximum influence range of the upper part of the top-coal drawing funnel is 9.47 m, and the height of the upper part of ‘V’ is about 1.51 m. When the numerical damping value is 0.07, the angle of ‘V’ is reduced to about 35.5°, the maximum influence range of ‘V’ is also reduced to 4.96 m, and the height of upper part of ‘V’ is about 1.51 m. When the numerical damping value is 0.11 and 0.15, the angle of ‘V’ is 29.25° and 17° respectively, the maximum influence range of the top-coal drawing funnel is 7.43 m and 6.43 m respectively, and the upper height of ‘V’ is 1.69 m and 2.63 m respectively. The characteristics of top-coal drawing funnel are shown in Table 3.
(2)
Results of the level 2 caving under different damping value
After the hydraulic support coal caving of level 2 (5#, 13#, 21#), the coal-rock boundaries also form a ‘V’ shaped funnel, as shown in Figure 6. With the increase of numerical damping value, the width of ‘V’ type top-coal drawing funnel gradually decreases and the drawing funnel becomes smaller. When the numerical damping value is 0.01 and 0.03, the funnel formed by the secondary caving is irregular ‘V’ shape, and the angle is about 64° and 56.7°, respectively. When the numerical damping value is 0.01 and 0.03, the funnel is irregular ‘V’ shape, and the angle is about 64° and 57° respectively; When the numerical damping value is 0.07, a regular ‘V’ type caving funnel is formed, and the top angle is about 43.3°. When the numerical damping value is 0.11, the drawing funnel is irregular ‘V’ shape, and the top angle of ‘V’ is about 30.7°. When the numerical damping is 0.15, a ‘V’ shape is formed with an average angle of 10°. The maximum width of the upper part of ‘V’ shape formed by different numerical damping is also different. From small to large, the average maximum width of ‘V’ shape is 6.88 m, 6.72 m, 7.15 m, 7.74 m and 7.88 m, respectively, as shown in Table 4.
(3)
Results of the level 3 and level 4 caving under different damping value
As shown in Figure 7, the morphology of coal-rock is further affected after the level 3 caving, and the top coal sinks gradually as a whole. Due to different numerical damping, coal-rock movement and boundary distribution are complex and irregular. With the increase of damping value, the more coal left, the higher the ‘V’ shaped funnel. Among all the horns formed by hydraulic support coal caving, the funnels’ height created by 3#, 11# and 19# support top-coal caving is higher. When the numerical damping is 0.01 and 0.03, the funnel’s maximum height is 4.41 m and 4.07 m, respectively. When the numerical damping is 0.07, the average height of the funnel is about 4.09 m. When the numerical damping is 0.11 and 0.15, the height of the funnel gradually increases to 5.06 m and 5.33 m.
After the end of level 4 (Figure 8) micro caving, the top coal is further released, and the remaining coal is less. The caving funnel is irregular, and the coal-rock boundary is also very rough.

4. Verification by Laboratory Experiments

The purpose of the laboratory experiments is to compare with the numerical simulation results under different numerical damping values, and put forward the method by which the reasonable damping value can be determined. The engineering background of the laboratory mining experiment is the working face no. 8222 of Tashan coal mine, and the similarity ratio is 1:10.

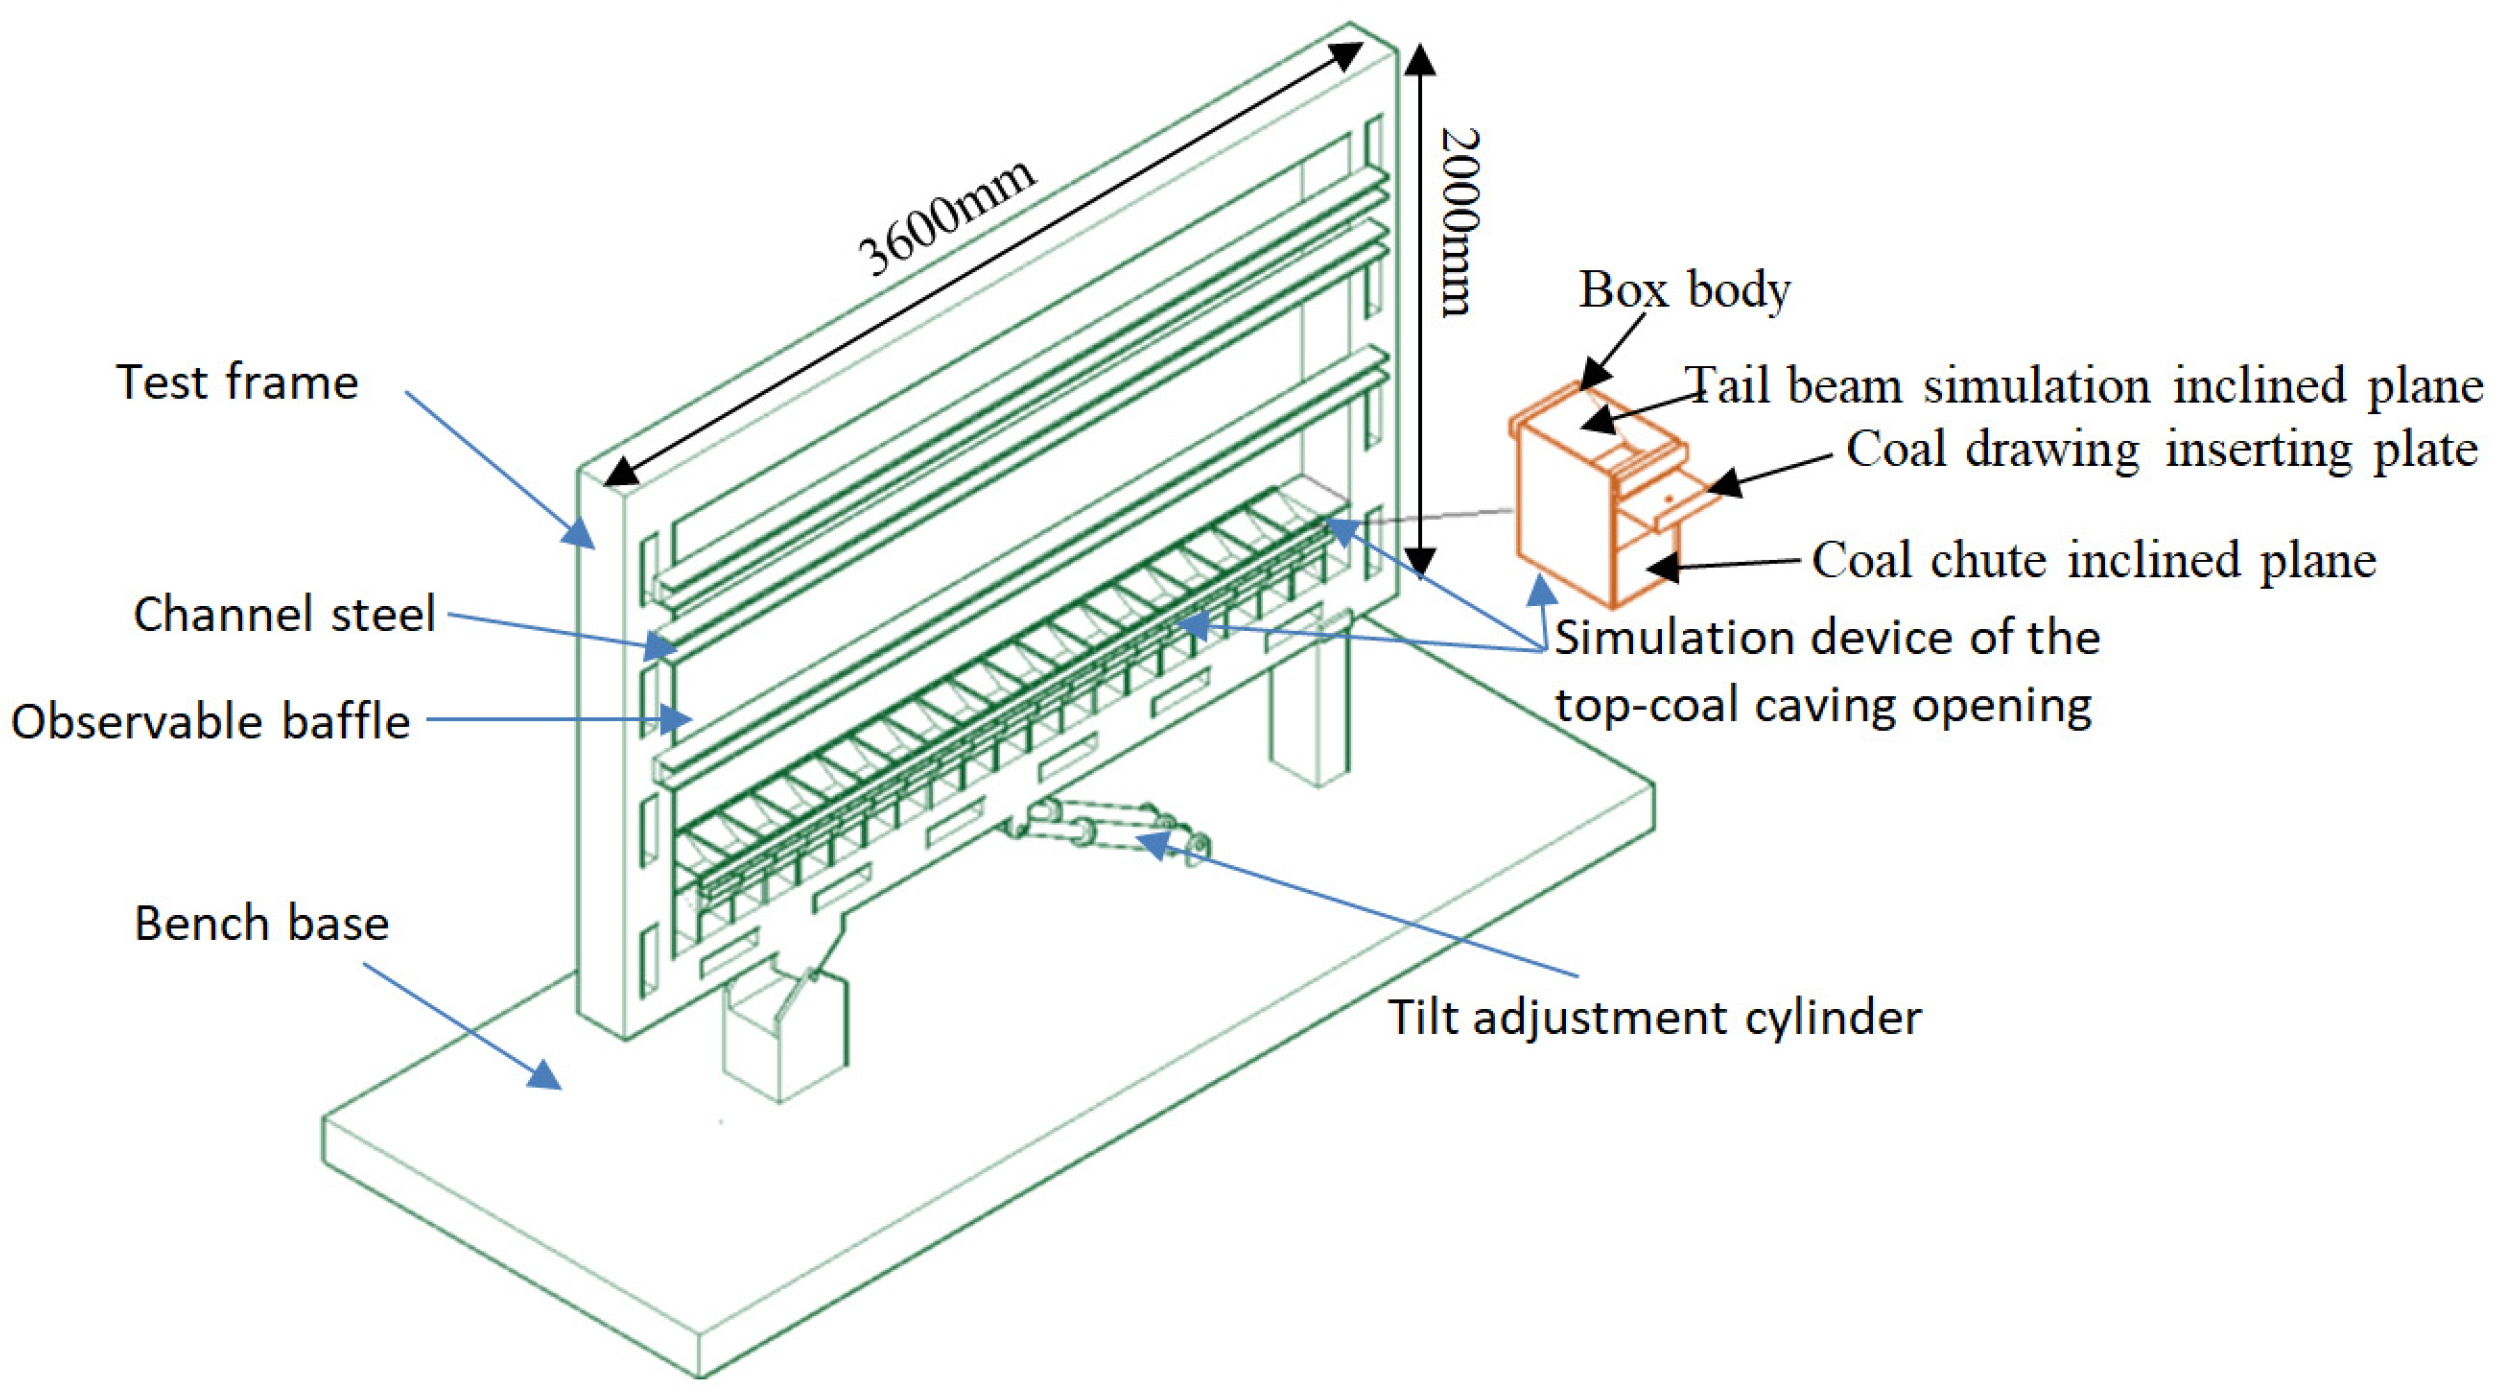
4.1. Structure Design of Test Device

The top-coal caving test platform in the dip direction of the extra thick coal seam is shown in Figure 9. The main body is a cuboid frame with a length of 3600 mm, a width of 250 mm, and a height of 2000 mm. It is mainly composed of the test frame, the top-coal caving openings, the observable baffle, the tilt adjustment cylinder, and other supporting devices. (1) The oil cylinder can adjust the tilt angle of the test frame at the bottom of the frame. The range of tilt angle adjustment is 0~30°. (2) The top-coal caving opening simulation device is composed of box body, tail beam simulation inclined plane, coal chute inclined plane, coal drawing inserting plate, glass plate groove, and coal chute. And the height of the box is 300 mm, the width is 175 mm, and the length is 250 mm. (3) The observable baffle, whose thickness is 10 mm, is used to fix the front and rear sides of the experimental frame. We can observe the experiment process through the glass plate. (4) Other supporting devices mainly include a three-layer vibrating machine, electronic platform scale, camera, etc. The three-layer vibrating machine has three layers of sieves with a diameter of 12, 9 and 6 mm from top to bottom, which can automatically divide the mixed bulk materials into different particle sizes. The electronic platform scale adopts K-FINE high-precision electronic platform scale with a weighing range of 200 g~300 kg and an error value of 50 g~200 g. The camera adopted was a D7000 high-resolution SLR camera (Nikon, Bangkok, Thailand) which is used for real-time video recording of observed changes in the whole experimental platform during coal caving.

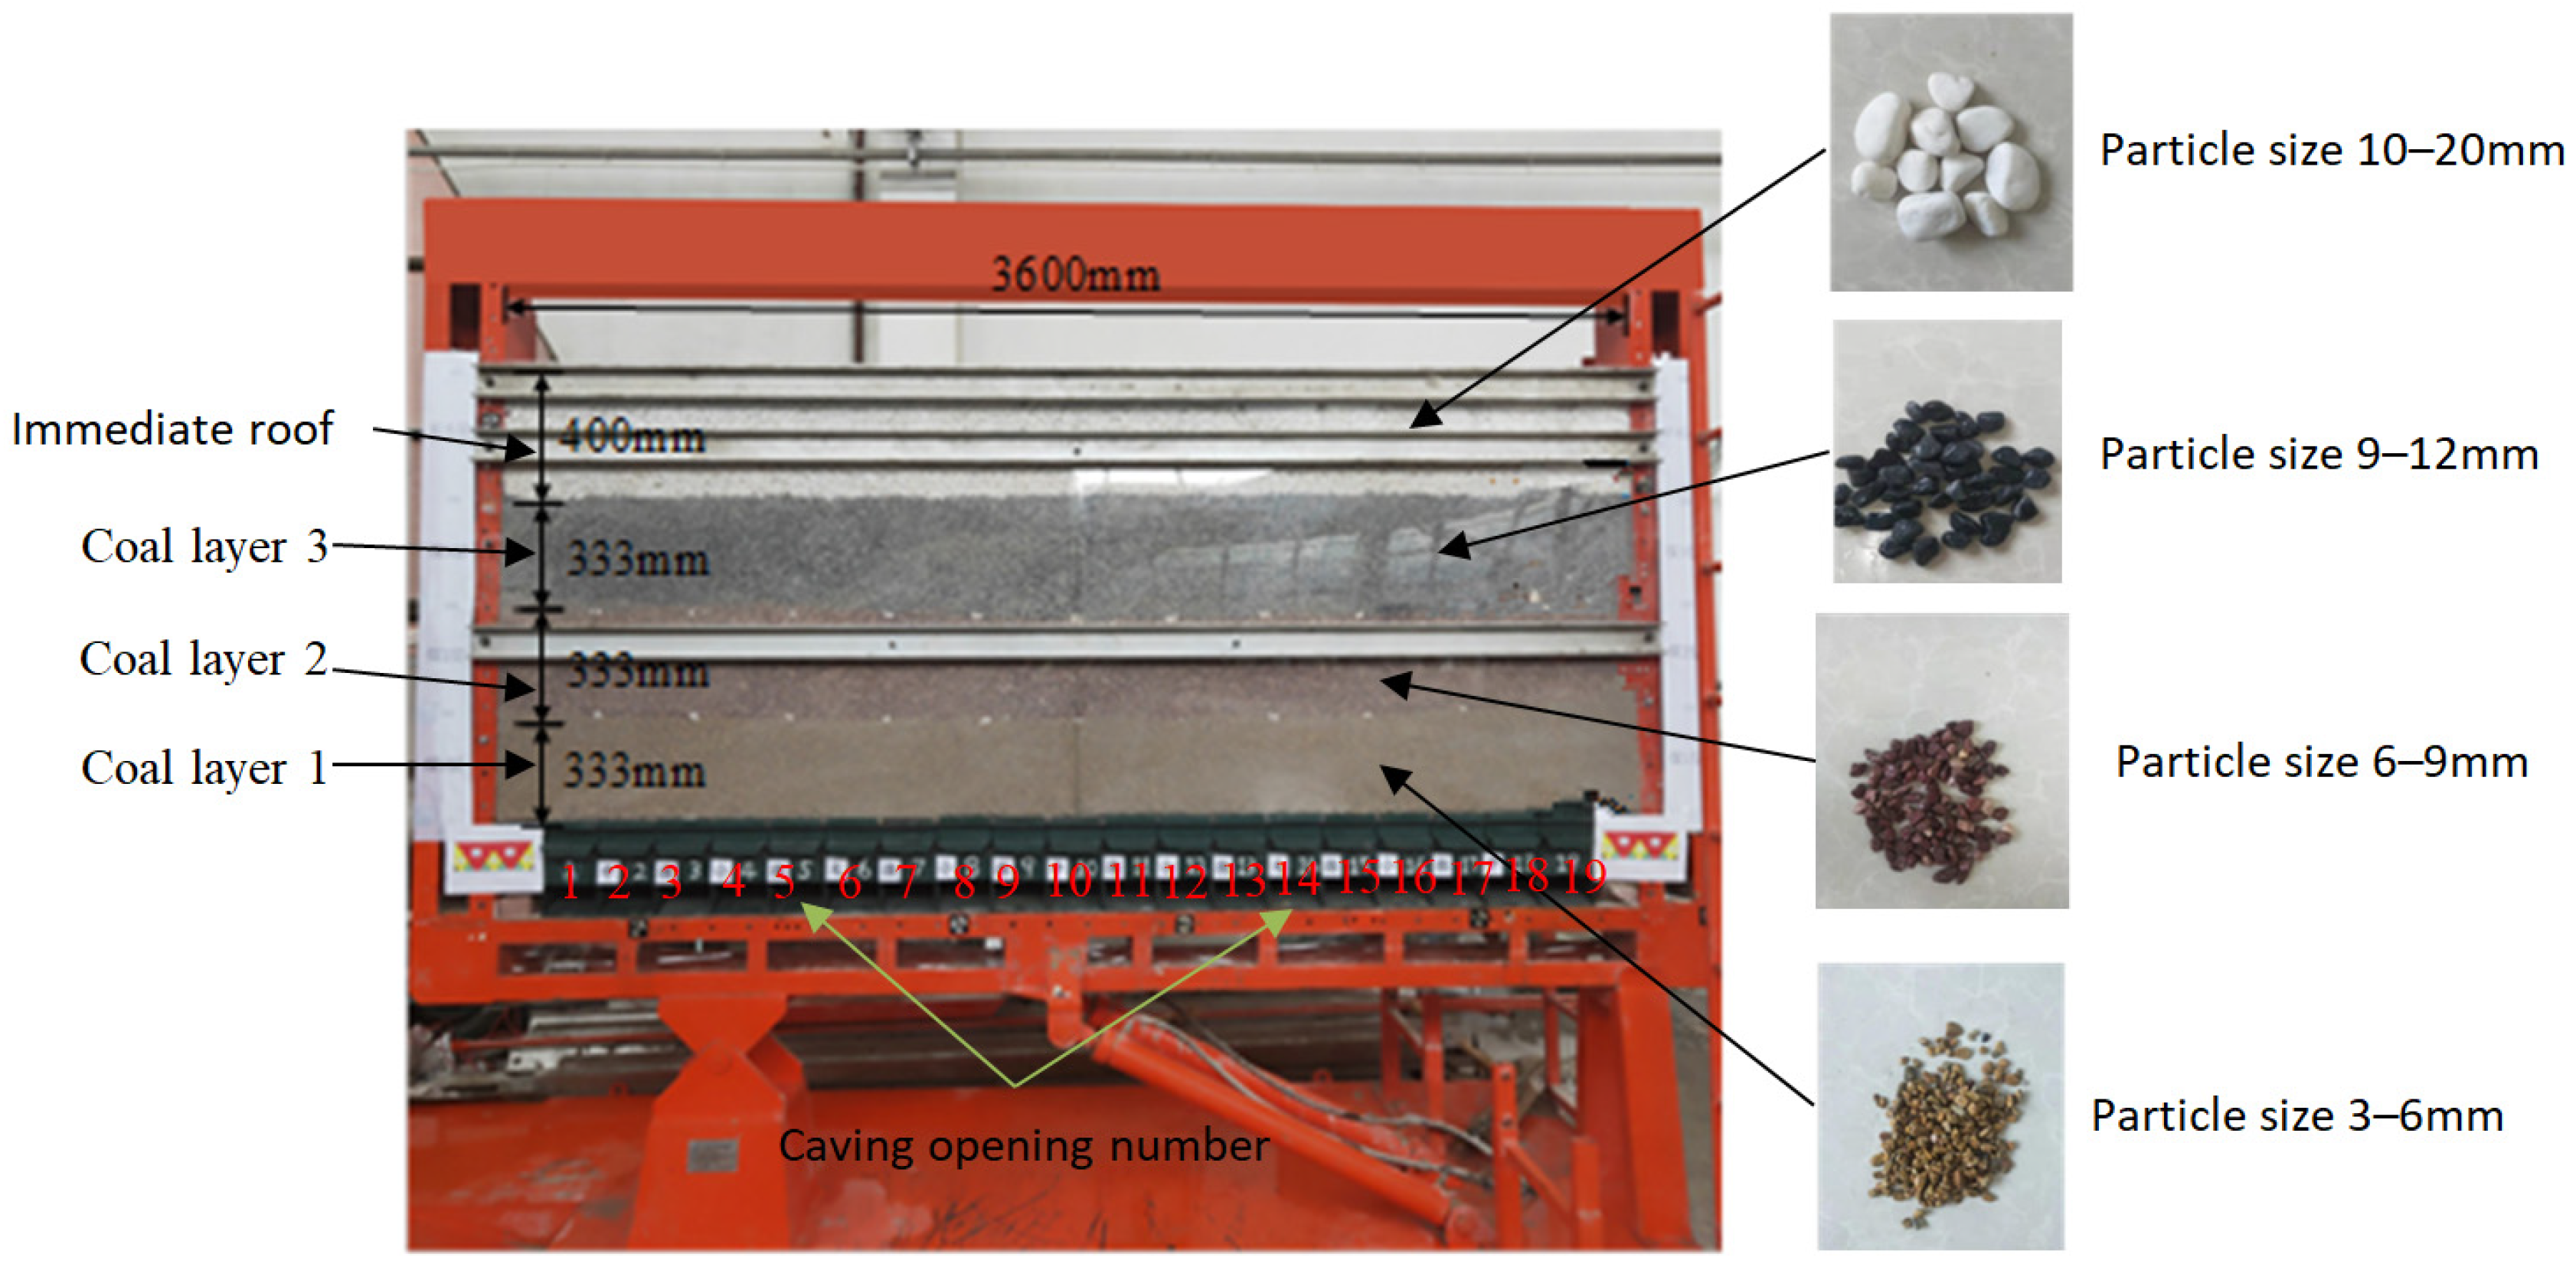
4.2. Scheme of Laboratory Similarity Experiment

(1) Material laying scheme. In the actual fully mechanized top coal caving mining process, the coal above the hydraulic support has been broken under the overburden pressure and repeated support pressure. The coal block size gradually increases from bottom to top. The top coal is laid in three layers. The first layer is yellow terrazzo, whose particle size is 3–6 mm, and the height is 334 mm. The second layer is red terrazzo with a height of 333 mm, and its particle size is 6–9 mm. The third layer is black terrazzo with a height of 333 mm, and its particle size is 9–12 mm. The immediate roof is replaced by white terrazzo which its particle size is 10–20 mm and its laying height is 400 mm. The laying scheme is shown in Figure 10.
(2) Experiment scheme of coal drawing. The simulation device of coal drawing opening is numbered 1#~19#. The laboratory similarity experiment scheme is the same as the numerical simulation scheme, and the intervals of ‘large, medium, small and micro’ are the same. The sequence of coal drawing is shown in Table 5.

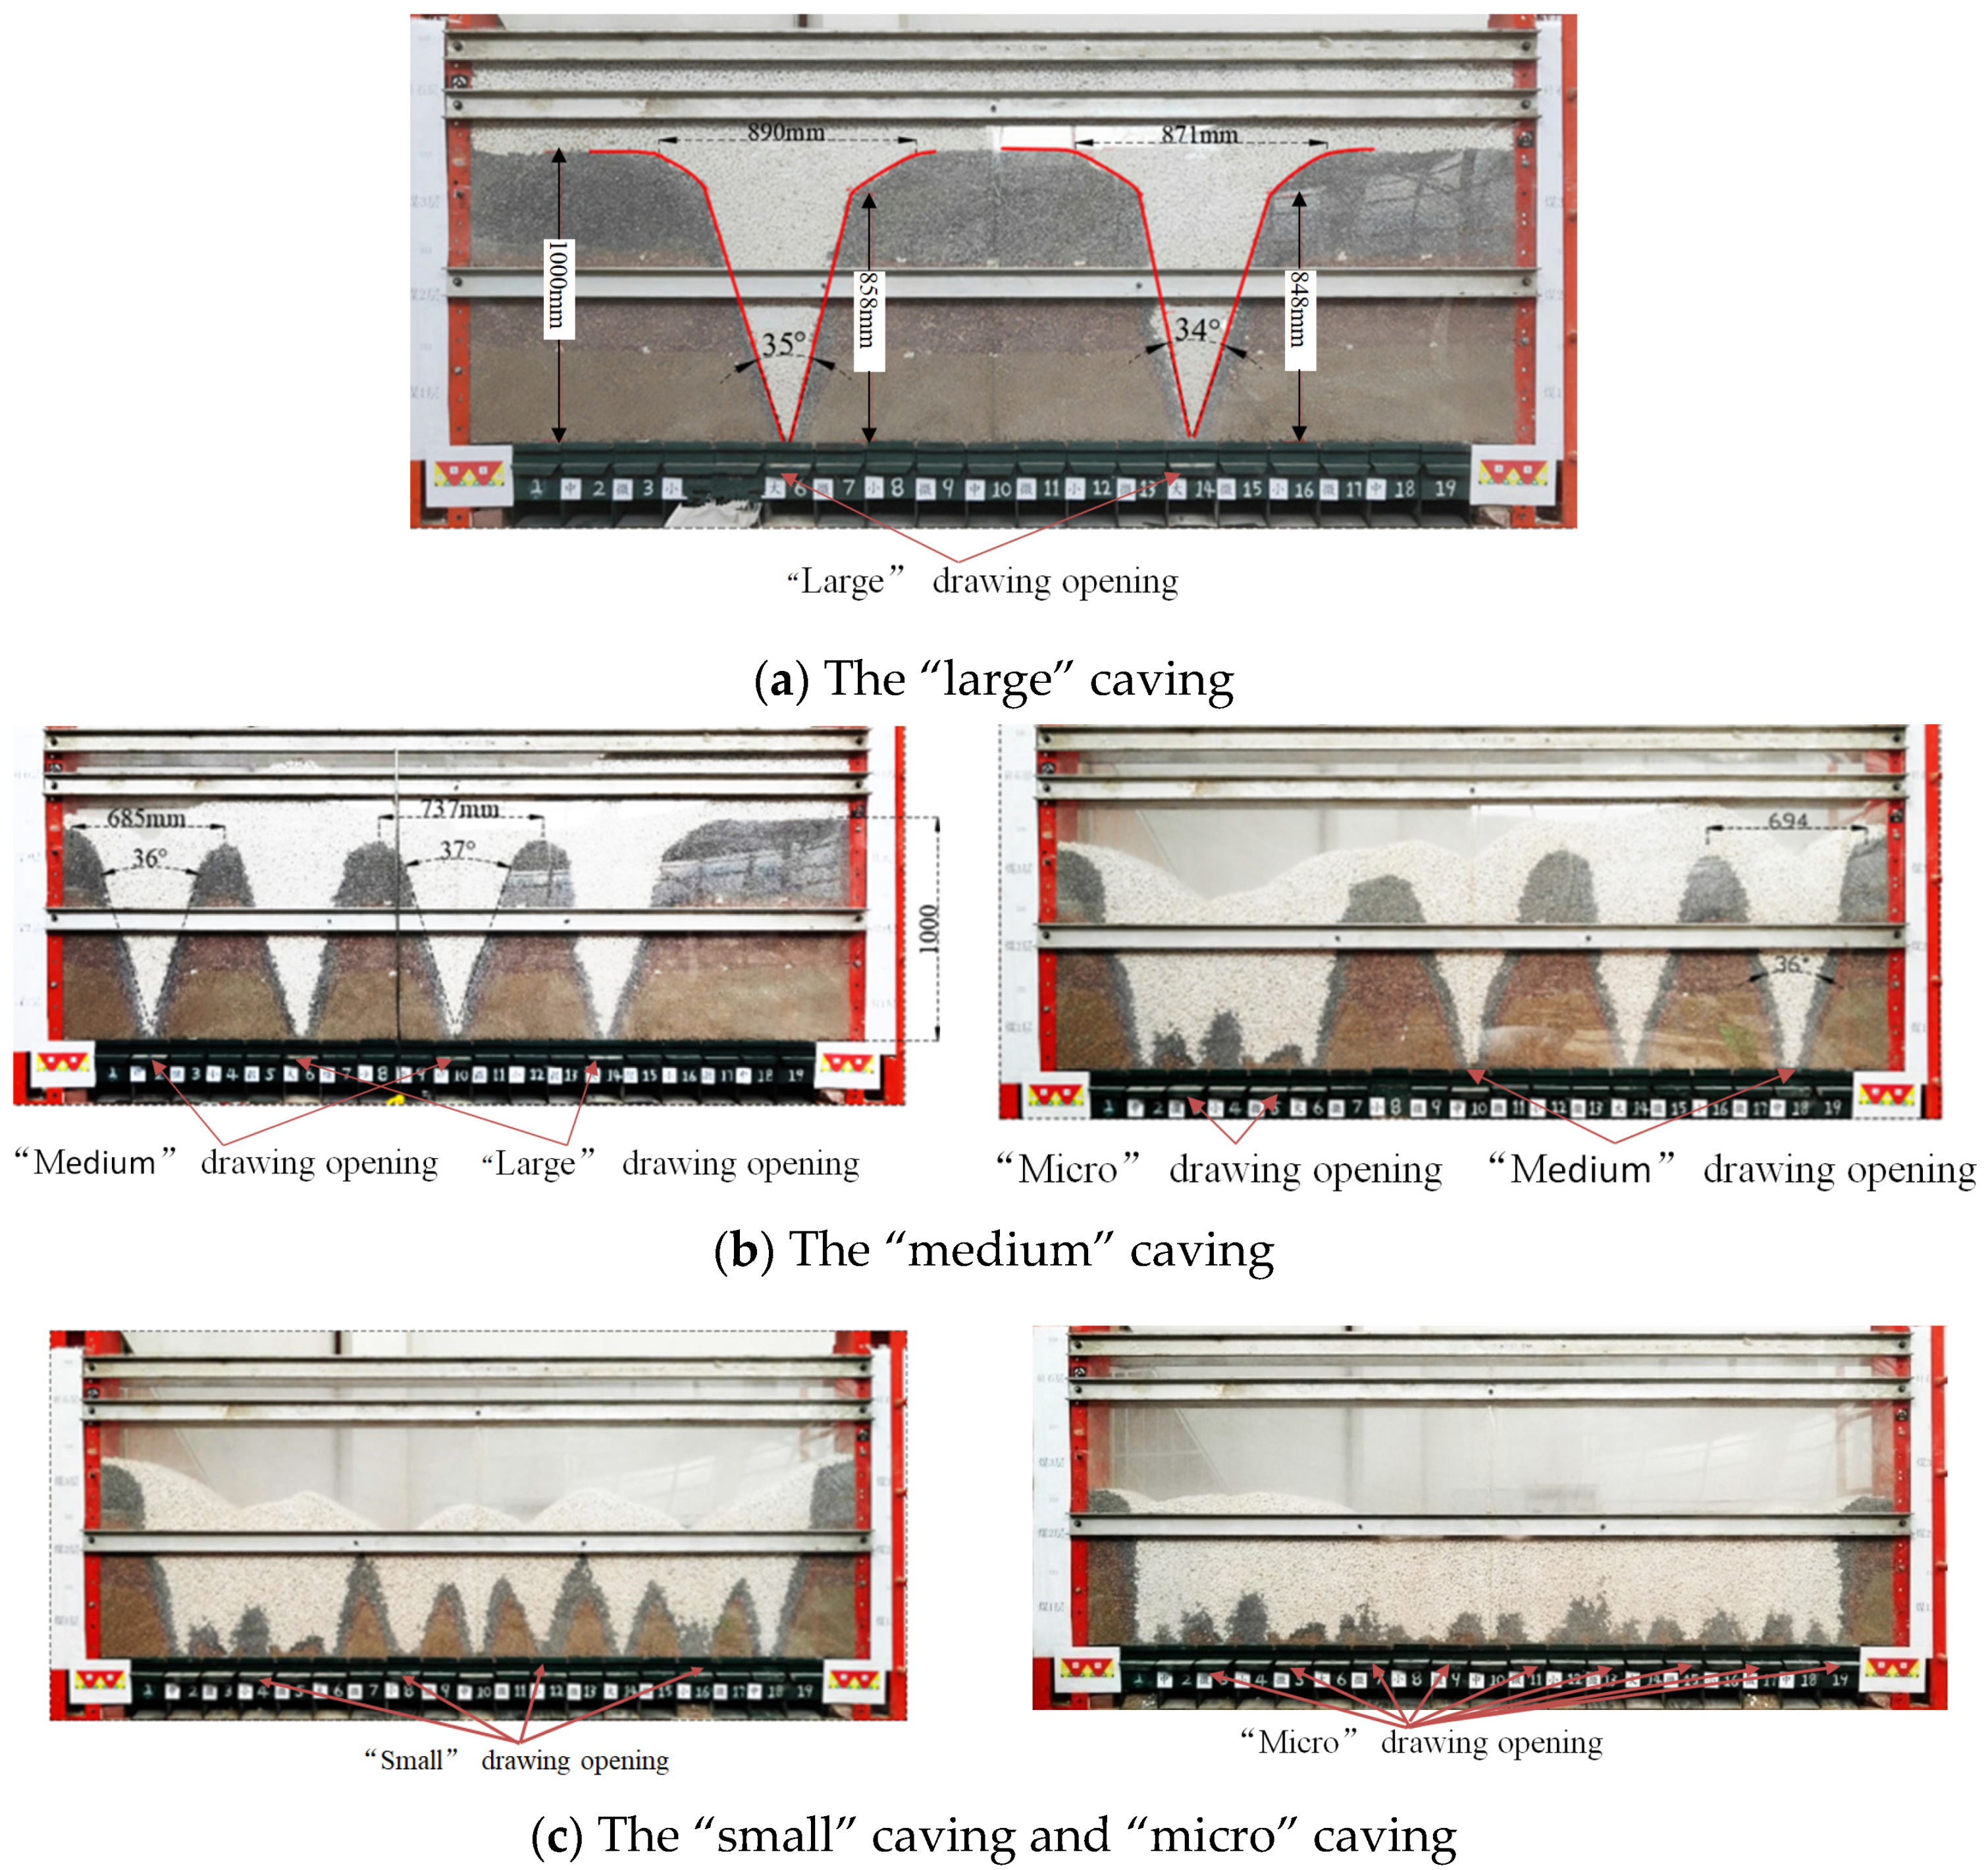
4.3. Experimental Process and Results

According to Table 5, the 19 simulation devices of the test bench complete a round of coal caving process by separating into four times. The evolution process of coal and rock in front of the test platform is shown in Figure 11. The detailed coal caving process and results are as follows: 6# and 8# of hydraulic support are opened in sequence as ‘large’ caving opening. The migration evolution process of the coal-rock boundary is shown in Figure 11a. The drawing funnel above the coal drawing opening of 6# is approximately ‘V’ type with the coal drawing opening as the center. The ‘V’ type can be subdivided into the lower part of ‘V’ type, similar to a straight line. The upper part of ‘V’ type, which is identical to the curve. The angle of the lower part of ‘V’ type is about 35°, and its height is 858 mm. The width of the uppermost part of the ‘V’ shape is 890 mm, and the height of the upper part of ‘V’ type is 142 mm. The funnel of 14# is the same as that of 6#, and it is approximately ‘V’ type. The angle of lower part of ‘V’ type is about 34°, and its height is 848 mm. The width of the uppermost part of the ‘V’ shape is 871 mm, and the height of upper part of ‘V’ type is 152 mm.
The top coal of 2#, 10# and 18# as ‘medium’ caving opening are drawing in turn. The migration evolution process of coal-rock boundary is shown in Figure 11b, and the coal-rock boundary is approximate ‘V’ type. The ‘V’ type formed by 2# coal caving has an angle of about 36°and a maximum width of about 685 mm in the uppermost part. The ‘V’ shape formed above the 10# coal drawing opening has an angle of about 37° and a length of 737 mm in the uppermost part. The top angle of the ‘V’ type formed above the 18# coal drawing opening is about 36° and the uppermost length is 694 mm.
The top coal of 4#, 8#, 12#, and 16# as ‘small’ caving are drawing in sequence as shown in Figure 6c. And the drawing funnel formed by drawing coal is irregular ‘V’ shape. The remaining coal drawing openings are ‘micro’ drawing openings. After top-coal drawing, the amount of coal left is less, and the drawing funnel is exceptionally irregular.

5. Discussion

5.1. Calibration Parameters

To accurately describe and compare the coal-rock migration rules after coal drawing in laboratory experiments and numerical simulation experiments, it is necessary to choose the drawing funnel’s characteristic parameters. After the ‘large’ and ‘medium’ caving, the coal-rock boundary forms obvious ‘V’ type.
After the ‘large’ caving, the ‘V’ type can be divided into the lower part of the coal-rock boundary, which is similar to a straight line, and the upper part is similar to a curve. The parameter θ 1 can be expressed as the angle of ‘V’ type, and B 1 can be delivered as the maximum width of the upper part of ‘V’ type. And h 1 can be formulated as the height of the upper part of ‘V’ type. Meanwhile, The parameter θ 2 can be expressed as the angle of ‘V’ type, and B 2 can be formulated as the maximum width of ‘V’ type after the ‘medium’ caving. Moreover, it is difficult to extract the characteristic parameters because of the small amount of coal and the irregular caving funnel after the ‘small’ and ‘micro’ caving.
After the ‘large’ caving, the similarity degree of the caving funnel formed by the laboratory similarity experiment and the numerical simulation experiment can be expressed by X 1 , α :
X 1 , α = { ( 1 θ 1 , 0 / θ 1 , α ) 2 + ( 1 B 1 , 0 / B 1 , α ) 2 + ( 1 h 1 , 0 / h 1 , α ) 2 } / 3
where θ 1 , 0 is the average angle of ‘V’ type of simulation experiment after the ‘large’ caving; B 1 , 0 is the average maximum width of the upper part of ‘V’ type in simulation experiment after the ‘large’ caving; h 1 , 0 is the average height of the upper part of ‘V’ type of simulation experiment after the ‘large’ caving; θ 1 , α is the average angle of ‘V’ type in numerical simulation under different numerical damping α   ( α = 0.01 , 0.03 ,   0.07 ,   0.11 ,   0.15 ) after the ‘large’ caving; B 1 , α is the average maximum width of the upper part of ‘V’ type in numerical simulation under different numerical damping α   ( α = 0.01 ,   0.03 ,   0.07 ,   0.11 ,   0.15 ) after the ‘large’ caving; h 1 , α is the average height of the upper part of ‘V’ type in numerical simulation under different numerical damping α   ( α = 0.01 ,   0.03 ,   0.07 ,   0.11 ,   0.15 ) after the ‘large’ caving.
After the ‘medium’ caving, the similarity degree of the caving funnel formed by the laboratory similarity experiment t and the numerical simulation experiment can be expressed by Y 2 , α :
Y 2 , α = { ( 1 θ 2 , 0 / θ 2 , α ) 2 + ( 1 B 2 , 0 / B 2 , α ) 2 } / 2
where θ 2 , 0 is the average angle of ‘V’ type of simulation experiment after the ‘medium’ caving; B 2 , 0 is the average width of ‘V’ type in simulation experiment after the ‘medium’ caving;   θ 2 , α is the average angle of ‘V’ type in numerical simulation under different numerical damping α   ( α = 0.01 ,   0.03 ,   0.07 ,   0.11 ,   0.15 ) after the ‘medium’ caving; B 2 , α is the average maximum width of ‘V’ type in numerical simulation under different numerical damping α   ( α = 0.01 ,   0.03 ,   0.07 ,   0.11 ,   0.15 ) after the ‘medium’ caving;
The sum of Equations (15) and (16) gives the comprehensive index S α , which can be expressed as follows:
S α = { X 1 , α + Y 2 , α } / 2
Finally, the reasonable value of numerical damping which can be defined as α can be determined by:
α = { α | S ( α ) = min S α }

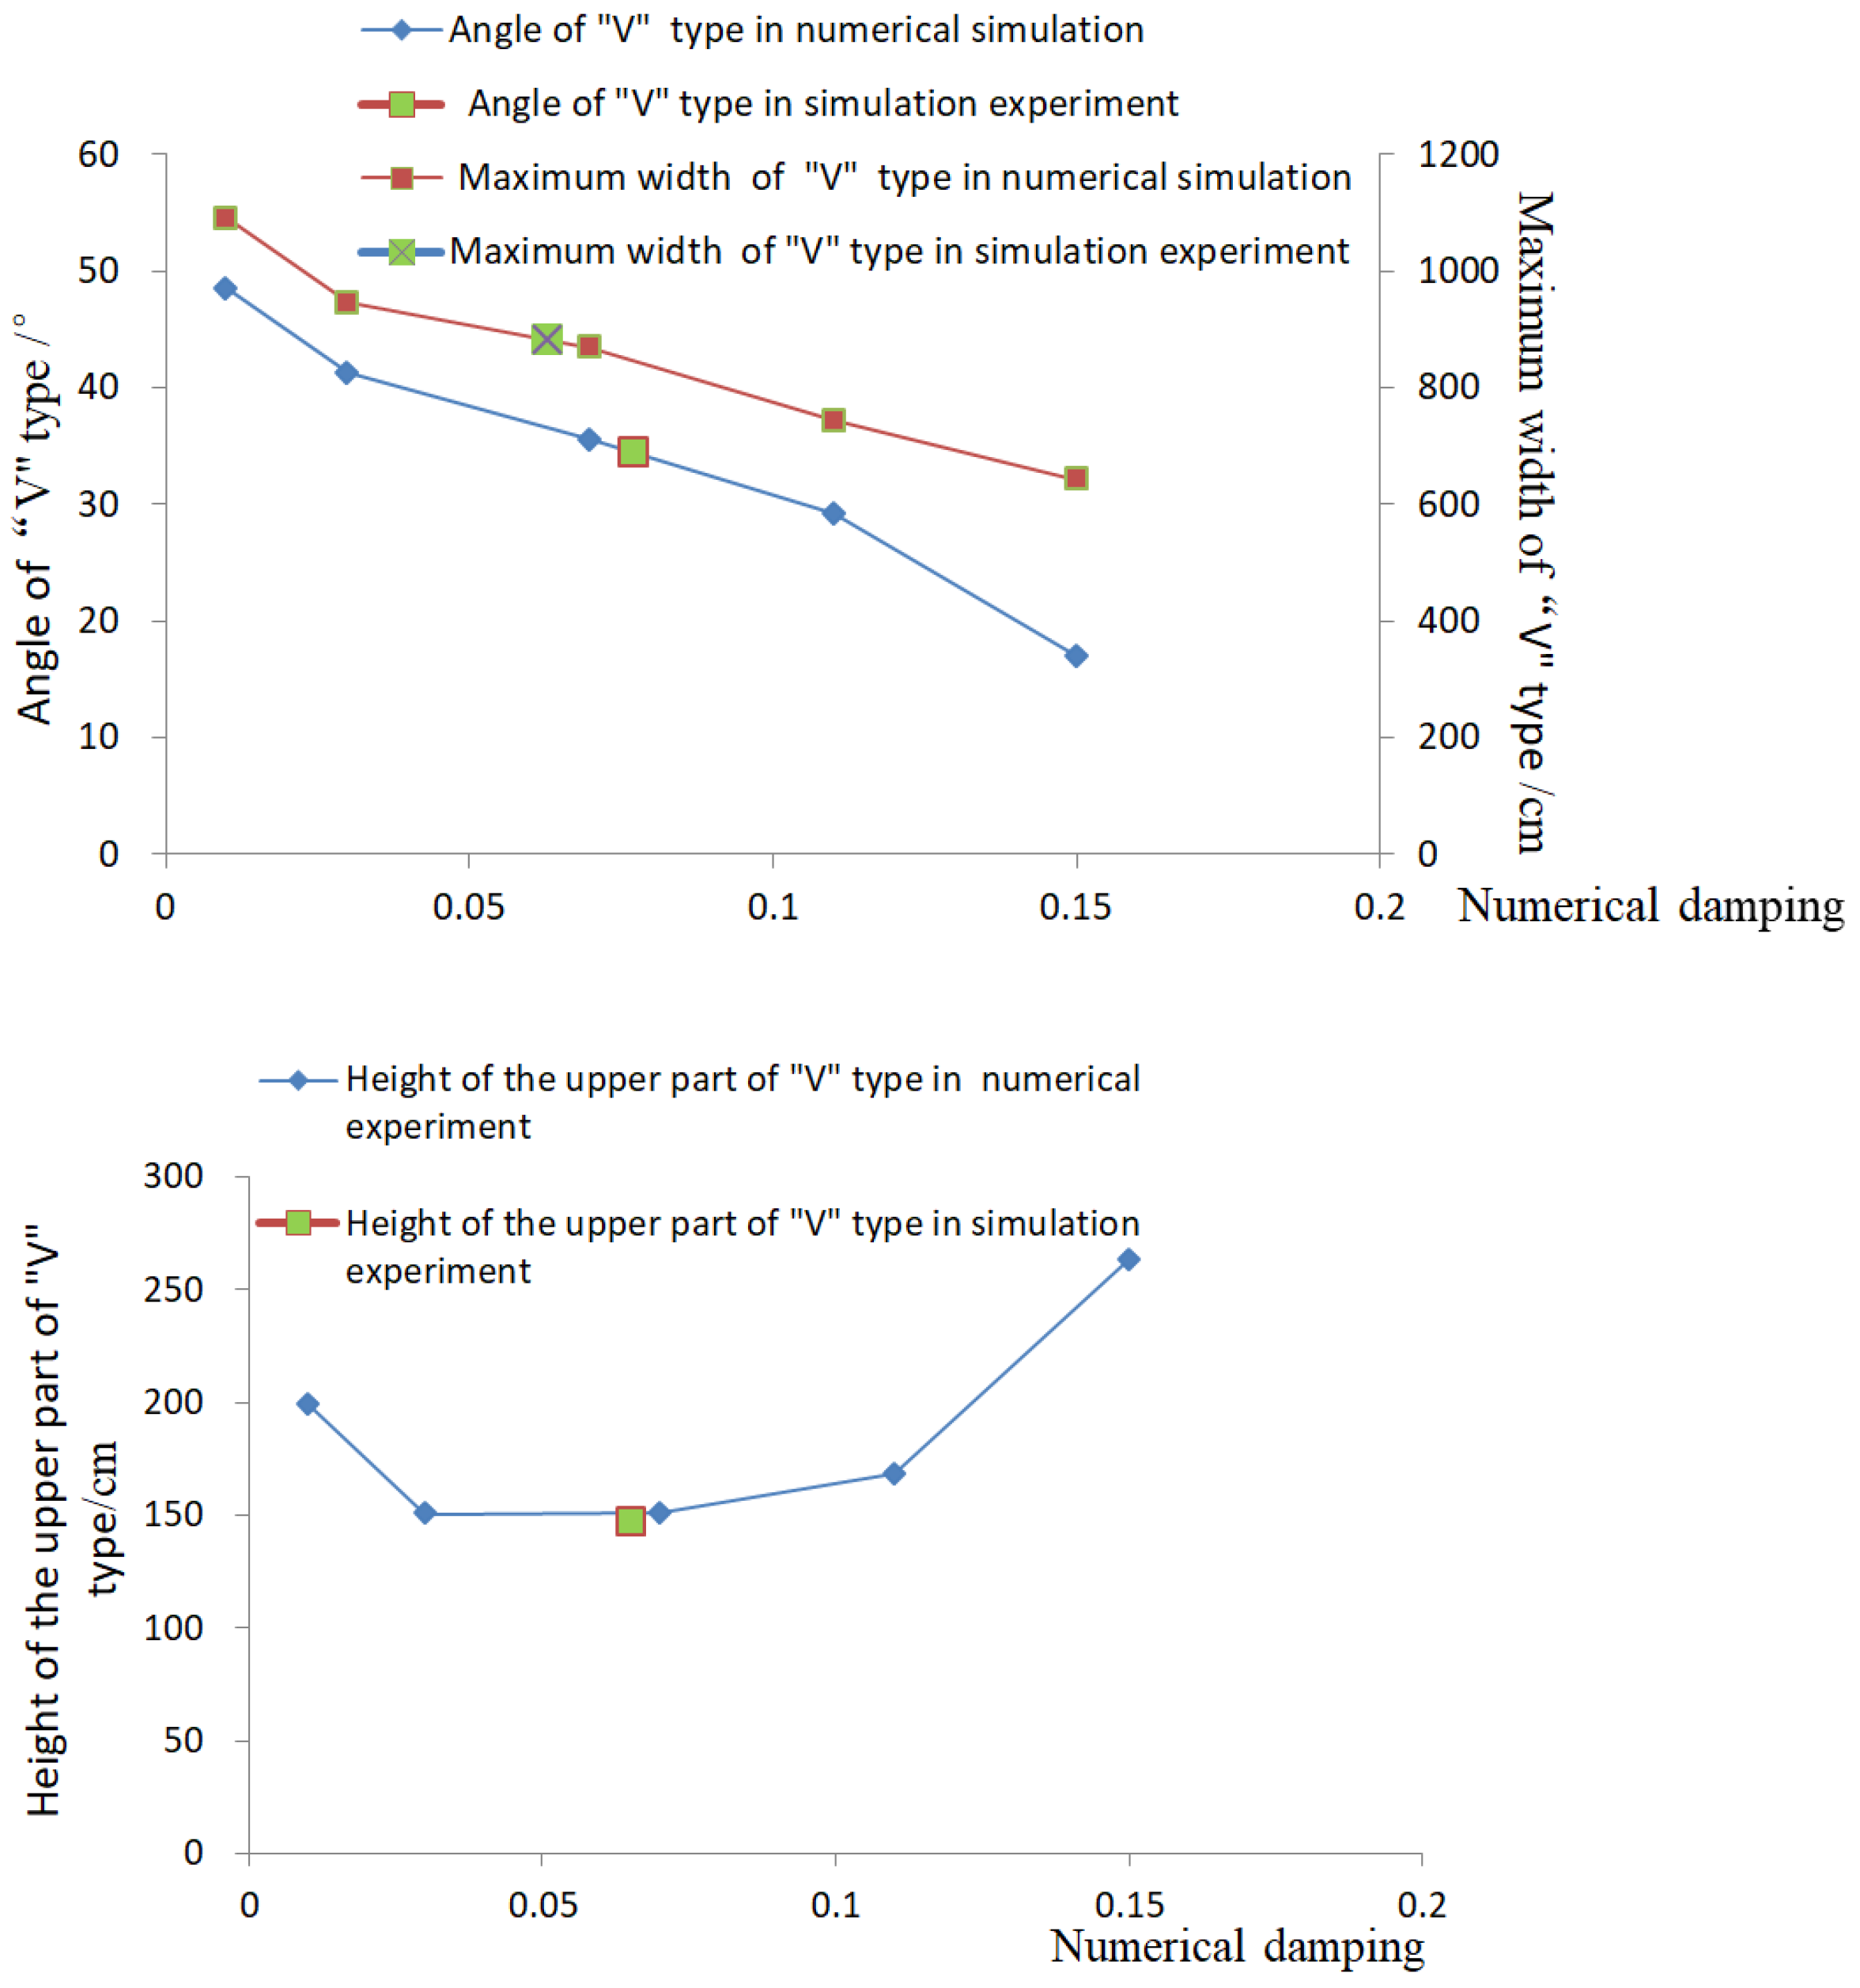
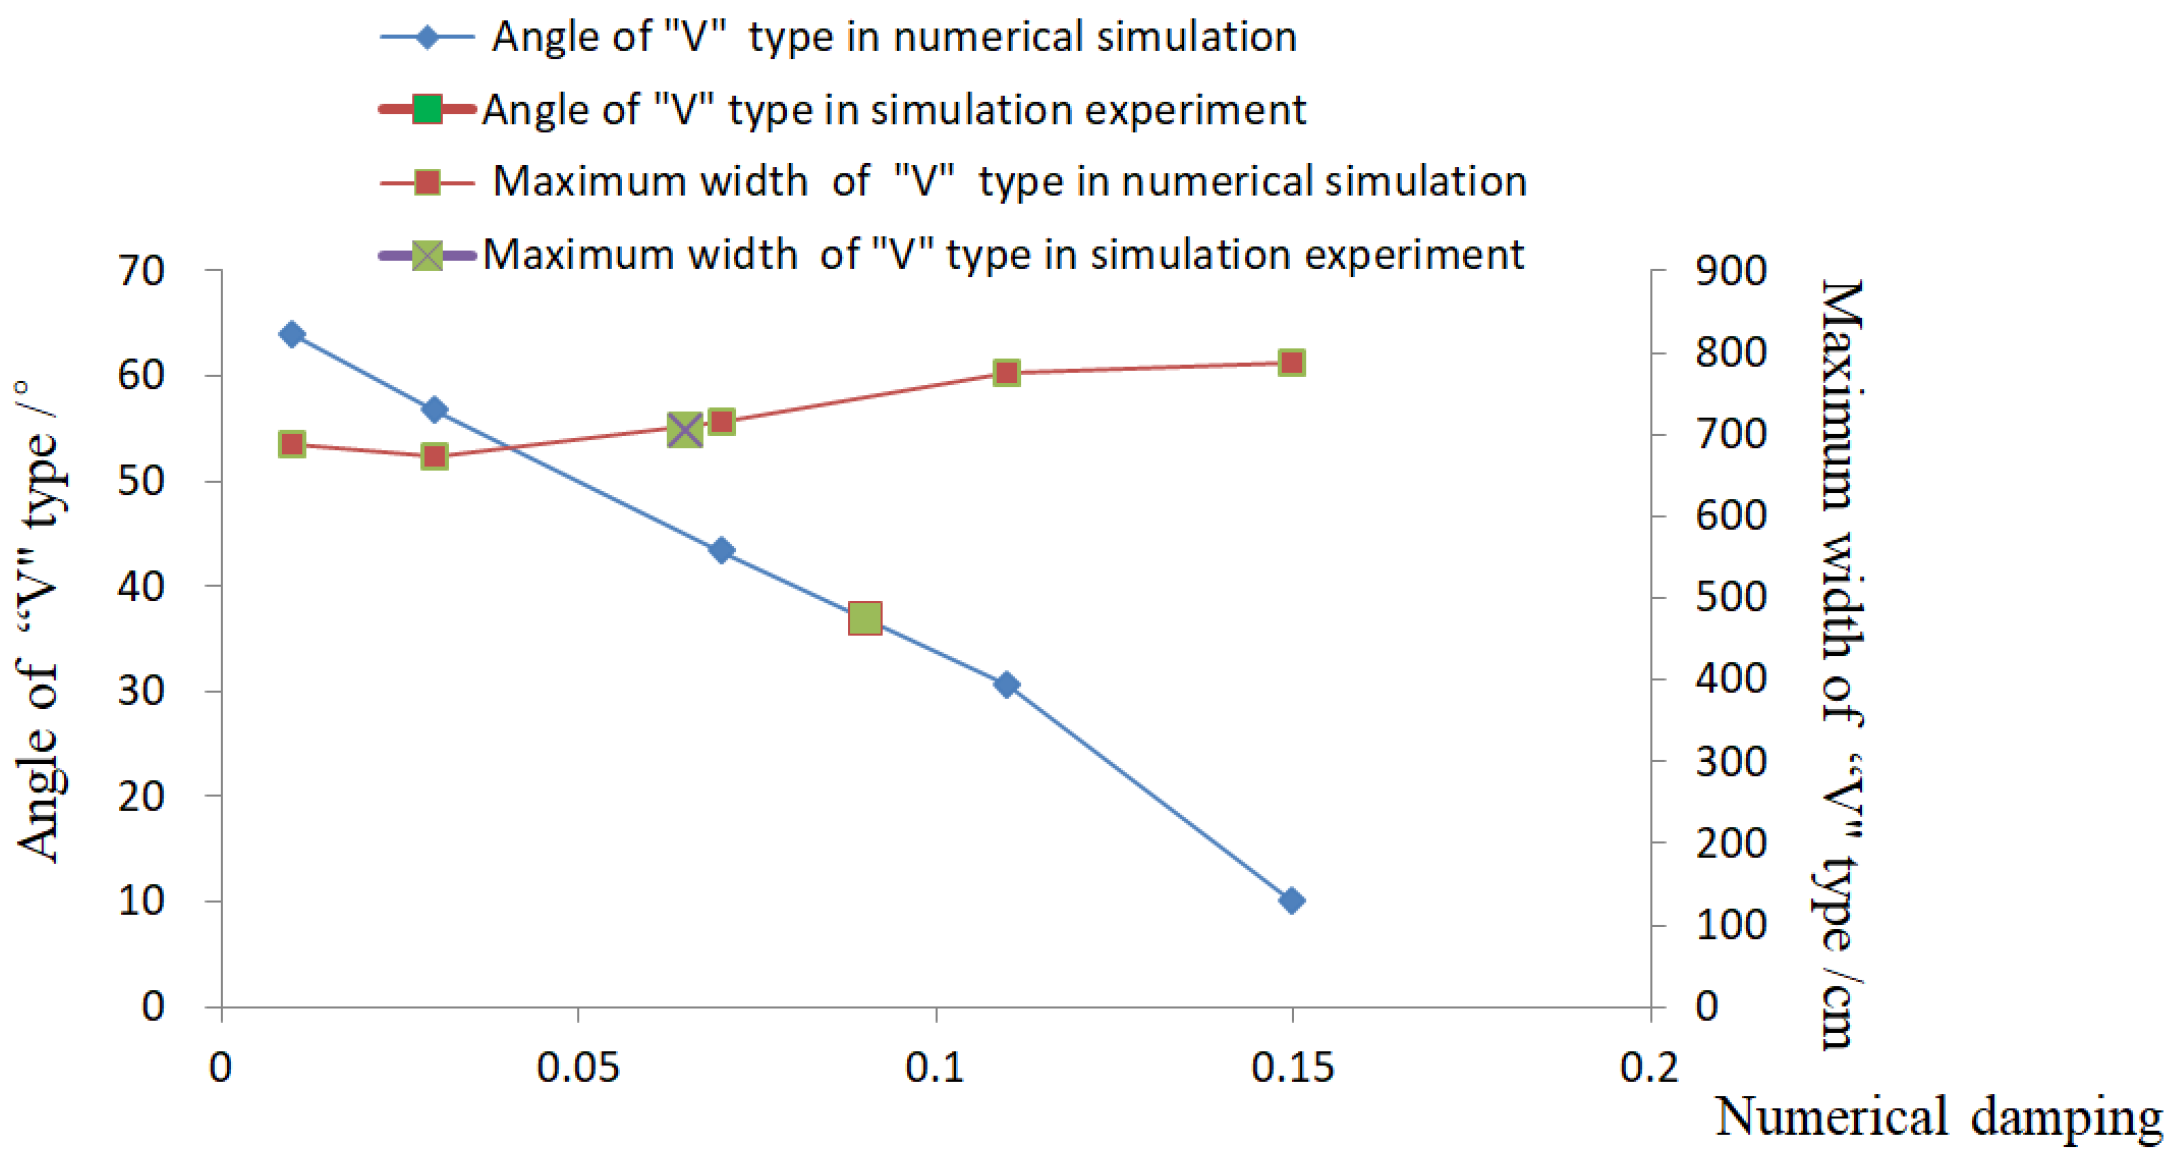
5.2. Comparison of Results

Figure 12 and Figure 13 show the characteristics of the coal drawing funnel after the ‘large’ and ‘medium’ caving in numerical simulation and similar simulation. According to the numerical simulation results, the ‘V’ type of coal drawing funnel is different with different numerical dampings, such as the angle and the maximum influence width of ‘V’ type. Furthermore, it is verified that the numerical damping value has a great influence on the accuracy of top-coal caving modeling. It can be concluded that the ‘V’ shape formed by the laboratory similarity experiment is close when the numerical damping value is 0.07 in the numerical simulation. Through Equation (18), the similarity degree parameter S α of numerical simulation and laboratory similarity experiment can be obtained as follows:
S 0.01 = { X 1 , 0.01 + Y 2 , 0.01 } / 2 = 0.0761
S 0.03 = { X 1 , 0.03 + Y 2 , 0.03 } / 2 = 0.0361
S 0.07 = { X 1 , 0.07 + Y 2 , 0.07 } / 2 = 0.0057
S 0.11 = { X 1 , 0.11 + Y 2 , 0.11 } / 2 = 0.0265
S 0.15 = { X 1 , 0.15 + Y 2 , 0.15 } / 2 = 2.0572
S 0.07 < S 0.11 < S 0.03 < S 0.01 < S 0.15
The results show that the value of S0.07 is the minimum, and the corresponding value of α’ is 0.07. In other words, the deviation between numerical simulation and similar simulation is the smallest when the numerical damping value is 0.07. And the similarity is the closest between numerical simulation and laboratory similarity experiment.

6. Conclusions

Although the DRA has been widely adopted to simulate top-coal caving, the reasonable value and calibration method of numerical damping are still open issues. In this study, the calibration process of reasonable numerical damping for modeling top-coal caving is investigated by comparing with the experimental results, in which several geometry parameters of the drawing funnel are selected as the calibration indexes. Finally, the correlation between the numerical damping and the physical top-coal drawing process is discussed. The numerical damping indirectly reflects the fragmentation in multi scale of coal mass and friction interaction between coal particles during the caving process, which reduces the vibration intensity of the top-coal caving system and dissipates the kinetic energy. The specific conclusions can be drawn as follows.
(1)
By studying the results of different damping values in CDEM numerical simulation of top-coal caving, it is verified that the numerical damping value greatly influences the accuracy of top-coal caving modeling.
(2)
In the comparison of numerical simulation and similar simulation results, it is proposed that the angle, the maximum width, and the upper height of ‘V’ shape of coal drawing funnel are the indexes to determine the numerical damping in ‘large’ drawing. The angle and the maximum width of ‘V’ shape are the indexes to determine the numerical damping in a ‘medium’ drawing. By comparing the deviation of characteristic parameters between numerical simulation and similar simulation, it is concluded that 0.07 is the reasonable numerical damping value for CDEM numerical simulation of ‘large, medium, small and micro’ top-coal caving in Tashan coal mine.

Author Contributions

Project administration, and funding acquisition D.L. and H.L. (Huamin Li); investigation and conceptualization, W.Z., H.W., X.X. and Z.L.; formal analysis and data curation, D.L., validation, writing-original draft, and writing-review & editing, H.L. (Hongbin Li), D.L. and S.W. All authors have read and agreed to the published version of the manuscript.

Funding

This study was supported by the National Key R&D Program of China (Grant No. 2018YFC0604502), China Postdoctoral Science Foundations (Grant No. 2020M672227), the Natural Science Foundation of Henan Province (Grant No. 202300410175), and the National Natural Science Foundation of China (Grant No. 51904091).

Institutional Review Board Statement

Not applicable.

Informed Consent Statement

Not applicable.

Conflicts of Interest

The authors declare no conflict of interest.

References

  1. Yu, B.; Xia, H.C.; Meng, X.B. Top coal arching mechanism and arch removal strategies in fully mechanized top coal caving mining of ultra-thick coal seam. J. China Coal Soc. 2016, 41, 1617–1623. [Google Scholar]
  2. Yu, B.; Xu, G.; Huang, Z.Z.; Guo, J.G.; Li, Z.; Li, D.Y.; Wang, S.B.; Meng, E.C.; Pan, W.D.; Niu, J.F.; et al. Theory and its key technology framework of intelligentized fully-mechanized caving mining in extremely thick coal seam. J. China Coal Soc. 2019, 44, 42–53. [Google Scholar]
  3. Yihui, P.; Xinhua, L.; Ying, M. Key technologies of fully-mechanized caving intelligent mining equipment in ten million tons of mines group. Coal Sci. Technol. 2015, 43, 98–101. [Google Scholar]
  4. Hongxing, S. Thinking and Prospect of Full-mechanized Caving Mining Technology in China. Coal Min. Technol. 2012, 17, 1–3. [Google Scholar]
  5. Guofa, W. Innovation and development on automatic completed set technology and equipment of fully-mechanized coal mining face. Coal Sci. Technol. 2013, 41, 1–9. [Google Scholar]
  6. Wang, J.C.; Yang, S.L.; Huang, G.J.; Liu, H.H.; Zheng, L.Y. Research on Top Coal Tracker of Fully Mechanized Top Coal Caving Mining and Measurement of Top Coal Recovery Rate. Coal Sci. Technol. 2013, 41, 36–39. [Google Scholar]
  7. Chuang, L. Research on the Method of Synergetic Multi-Windows Top Coal Caving and the Mechanism of Coal-Gangue Identification in Longwall Top Coal Caving Working Face; Henan Polytechnic University: Jiaozuo, China, 2018. [Google Scholar]
  8. Jinwang, W.J.Z. BBR study of top-coal drawing law in longwall top-coal caving mining. J. China Coal Soc. 2015, 40, 487–493. [Google Scholar]
  9. Huang, B.-X.; Liu, C.-Y.; Wu, F.-F.; Wang, Z. Experimental research on drawing top-coal with loose medium model under dead-unconsolidated sandstone roof. J. China Univ. Min. Technol. 2006, 35, 351–355. [Google Scholar]
  10. Wang, Z.; Liu, C.Y.; Huang, B.X.; Wu, F.F.; Liu, K. Test on top coal caving mining in special thick seam. Coal Sci. Technol. 2006, 34, 43–45. [Google Scholar]
  11. Zhang, Y.D.; Zhang, F.T.; Ji, M.; Gao, L.S.; Jin, Z.Y.; Cheng, L.; Wu, L.P. Research on the Reasonable Coal Caving Technological Parameters of Extra-Thick Coal Seam. J. Min. Saf. Eng. 2012, 29, 808–814. [Google Scholar]
  12. Xie, Y.S.; Zhao, Y.S. Numerical simulation of the top coal caving process using the discrete element method. Int. J. Rock Mech. Min. Sci. 2009, 46, 983–991. [Google Scholar] [CrossRef]
  13. Wang, J.C.; Zhang, J.W.; Yang, S.L.; Song, Z.Y. 3-D movement law of top-coal in near horizontal coal seam with multi-gangue under caving mining technique. J. China Coal Soc. 2015, 40, 979–987. [Google Scholar]
  14. Wang, J.C.; Zhao, B.W.; Zhao, P.F. Research on the longwall top-coal caving mining technique in extremely inclined and soft thick coal seam. J. China Coal Soc. 2017, 42, 286–292. [Google Scholar]
  15. Zhang, J.W.; Song, Z.Y.; Geng, H.L. 3-D numerical simulation on the top-coal movement law under caving mining technique. J. China Coal Soc. 2013, 38, 1905–1911. [Google Scholar]
  16. Liu, C.; Li, H.; Ying, Z. Method of synergetic multi-windows caving in longwall top coal caving working face. J. China Coal Soc. 2019, 44, 2632–2640. [Google Scholar]
  17. Zhang, Q.; Yue, J.; Liu, C.; Feng, C.; Li, H. Study of automated top-coal caving in extra-thick coal seams using the continuum-discontinuum element method. Int. J. Rock Mech. Min. Sci. 2019, 122, 104033. [Google Scholar] [CrossRef]
  18. Zhang, Q.; Yuan, R.; Wang, S.; Li, D.; Li, H.; Zhang, X. Optimizing Simulation and Analysis of Automated Top-Coal Drawing Technique in Extra-Thick Coal Seams. Energies 2020, 13, 232. [Google Scholar] [CrossRef] [Green Version]
  19. Dan, L. Principle and Program of FLAC and its Application in Analysis of Deformation and Stability on High Aubgrade; Fuzhou University: Fuzhou, China, 2006; pp. 25–26. [Google Scholar]
  20. Day, A.S. An Introduction to dynamic relaxation. Engineer 1965, 219, 218–221. [Google Scholar]
  21. Otter, J.R. Coputation for prestressed concrete reactor pressure vessels using dynamic relaxation. Nuct. Struct. Eng. 1965, 1, 61–75. [Google Scholar] [CrossRef]
  22. Feng, C.; Li, S.H.; Liu, X.Y. A procedure for transiting FEM into DEM and its application. Rock Soil Mech. 2015, 36, 1027–1034. [Google Scholar]
Figure 1. The linked bar model.
Energies 14 02348 g001
Figure 2. Schematic diagram of boundary contact between particles and rigid wall.
Energies 14 02348 g002
Figure 3. Mining technology of working face.
Energies 14 02348 g003
Figure 4. Numerical model.
Energies 14 02348 g004
Figure 5. Rules of the coal-rock interface of Level 1 under different damping values (The unit in the picture is meter).
Energies 14 02348 g005
Figure 6. Rules of coal-rock interface of Level 2 under different damping values (The unit in the picture is meter).
Energies 14 02348 g006aEnergies 14 02348 g006b
Figure 7. Results of coal-rock interface of Level 3 under different damping values (The unit in the picture is meter).
Energies 14 02348 g007
Figure 8. Results of coal-rock interface of Level 4 under different damping values (The unit in the picture is meter).
Energies 14 02348 g008
Figure 9. Three dimensional diagram of coal caving test platform.
Energies 14 02348 g009
Figure 10. Physical picture of laying scheme.
Energies 14 02348 g010
Figure 11. Evolution process of coal-rock morphology in front of test platform.
Energies 14 02348 g011
Figure 12. “V” type characteristics of coal drawing funnel of numerical simulation and simulation experiment after “large” caving.
Energies 14 02348 g012
Figure 13. “V” type characteristics of coal drawing funnel of numerical simulation and simulation experiment after “medium” caving.
Energies 14 02348 g013
Table 1. Assignment of coal and rock mechanics parameters.
Rock Layer TypeDensity/(kg/m3)Elastic Modulus/GPaPoisson’s RatioTensile Strength/MPaCohesion/MPaInternal Friction/°
Coal Seams136420.270032.65
Immediate Roof2552100.10031.24
Table 2. Numerical simulation scheme.
Top-Coal Drawing SequenceHydraulic Support Number
Level 1 or Large1#; 9#; 17#; 25#
Level 2 or Medium5#; 13#; 21#
Level 3 or Small3#; 7#; 11#; 15#; 19#; 23#
Level 4 or Micro2#; 4#; 6#; 8#; 10#; 12#; 14#; 16#; 18#; 20#; 22#; 24#
Table 3. Characteristics of top-coal drawing funnel after level 1 caving.
Damping ValueHydraulic Support NumberThe Angle of ‘V’ (°)Average Angle of ‘V’ (°)Maximum Influence Width of ‘V’ (m)Average Maximum Influence Width of ‘V’ (m)Upper Height of ‘V’ (m)Upper Average Height of ‘V’ (m)
0.011#5348.510.4110.901.851.99
9#4811.221.62
17#4710.812.69
25#4611.141.81
0.031#4141.2510.239.471.271.51
9#439.111.44
17#369.241.5
25#459.311.82
0.071#3835.58.858.691.321.51
9#348.971.57
17#369.081.53
25#347.851.62
0.111#2929.258.237.431.21.69
9#306.711.49
17#327.681.98
25#267.092.07
0.151#17176.426.432.932.63
9#176.461.89
17#196.612.65
25#156.243.06
Table 4. Characteristics of top-coal drawing funnel after level 2 caving.
Damping ValueHydraulic Support NumberAngle of ‘V’ (°)Average Angle of ‘V’ (°)Maximum Influence Width of ‘V’ (m)Average Maximum Influence Width of ‘V’ (m)
0.015#33646.36.88
13#767.53
21#836.81
0.035#5456.76.16.72
13#526.73
21#647.34
0.075#4243.37.367.15
13#447.03
21#447.05
0.115#2530.78.177.74
13#367.21
21#317.84
0.155#12108.177.88
13#87.71
21#107.75
Table 5. The coal drawing sequence of similar simulation.
Coal Drawing SequenceType of Coal Drawing OpeningHydraulic Support NumberCoal Port Size
1Large6#; 14#100 mm
2Medium2#; 10#; 18#100 mm
3Small4#; 8#; 12#; 16#100 mm
4Micro3#; 5#; 7#; 9#; 11#; 13#; 15#; 17#; 19#100 mm
Publisher’s Note: MDPI stays neutral with regard to jurisdictional claims in published maps and institutional affiliations.

