Article

Effects of Module Spatial Distribution on the Energy Efficiency and Electrical Output of Automotive Thermoelectric Generators

1
Department of Mechanical Engineering and Industrial Construction, Universitat de Girona, c/Universitat de Girona 4, 17003 Girona, Spain
2
Escuela de Ingeniería Industrial y Aeroespacial de Toledo, Campus de Excelencia Internacional en Energía y Medioambiente, Universidad de Castilla-La Mancha, Av. Carlos III, s/n. Real Fábrica de Armas, 45071 Toledo, Spain
*
Authors to whom correspondence should be addressed.
Energies 2021, 14(8), 2232; https://doi.org/10.3390/en14082232
Submission received: 19 March 2021 / Revised: 11 April 2021 / Accepted: 13 April 2021 / Published: 16 April 2021

Abstract

:
Automotive thermoelectric generators (ATEGs) are devices used to harvest waste energy from the exhaust gases of internal combustion engines. An ATEG is essentially formed by three main elements: (1) heat absorber in contact with exhaust gases; (2) thermoelectric modules that directly convert heat into electricity; (3) heat sink to increase the heat transfer through the system. Thermoelectric modules (TEM) are commonly based on small-scale commercial units, with tenths of them needed to assemble a full ATEG device. Thus, several thermal and electrical connections between TEMs can be implemented. Previous studies focused on the implications on the output power. Here, we investigated the effects of using different module connections on the energy efficiency and on the electrical outputs (voltage and current). The study was carried out numerically with ATEGs that used from 4 to 100 individual TEMs. Series, parallel and square connections were investigated under two different engine operating points. The maximum output power was obtained with overall energy conversion efficiencies on the order of 3%. Though the series connection provided the highest output power, the square configuration was the best compromise between output power and electrical characteristics (voltage and current) to successfully integrate the ATEG into the vehicle management system.

1. Introduction

The shift towards an electrified mobility will imply the coexistence of transportation modes based on different powertrains. In the mid-term, the long-distance road transport of goods will continue relying on vehicles with internal combustion engines [1]. However, regulatory requirements will seek to pursue cleaner and more efficient devices, with national and supranational organizations planning strategies to promote new technologies to achieve such goals. As an example, several calls of the European Union funding programmes have tackled different aspects involved in the issue of green mobility of road vehicles [2].
It is well known that approximately 1/3 of the fuel primary energy employed in internal combustion engines is lost through the exhaust gases [3]. Among the techniques aimed to partially recover this energy, thermoelectricity may be a feasible candidate since it directly converts heat into electricity without the need of moving parts. Commercial thermoelectric generator modules (TEMs) consist of pairs of n-type and p-type semiconductor legs electrically connected in series and thermally in parallel. Once interconnected via copper junctions, all these legs are packed in between two electrical insulator plates, usually made of ceramic. A single TEM of dimensions 40 × 40 × 3.5 mm may contain on the order of 100 legs, being able to generate < 10 W with a 240 Wm−2 heat flux and an overall energy efficiency below 5% (see, e.g., [4]).
To conform to market demand, an automotive thermoelectric generator (ATEG) based on commercial TEMs requires a large number of TEM units. For example, the number of TEMs used in ATEG prototypes for passenger cars ranged from 8 to 80, substantially varying in the form on how single units are spatially distributed. Stobart et al. [5] analyzed an ATEG with 16 TEMs in a square configuration pattern (4 columns each one with 4 TEMs, where the term column refers to a location perpendicular to the exhaust pipe direction), reaching a maximum output power of 30 W. Massaguer et al. [6] tested a plane parallel ATEG with 12 TEMs distributed in 3 columns each one with 4 units. Comamala et al. [7] tested a compact radial design with 10 TEMs located at the same exhaust pipe cross section point. Fernández-Yáñez et al. [8] and Ezzitouni et al. [9] designed a plane parallel ATEG with 80 TEMs distributed in 8 columns each one with 10 units. In heavy duty vehicles, the number of TEMs employed in an ATEG often increases. Frobenius et al. [10] employed 224 TEMs packed at the exhaust pipe of a commercial heavy duty truck. Wang et al. [11] experimentally analyzed the performance of an ATEG formed by four units of 60 TEMs distributed in 6 columns each one with 10 TEMs. However, smaller ATEGs have been tested in large capacity engines, as in Lan et al. [12] who analyzed an ATEG with 20 TEMs (5 column each one with 4 TEMs) in a 6.6 L displacement diesel engine.
As expected, the configuration of the electrical connection between TEMs modifies the output power (see, e.g., [13]). Series electrical configuration between TEMs appears to be the most adequate, as Montecucco et al. [14] suggested in the experimental analysis of 3 TEMs. In comparison with a parallel connection, they found that the output power of a series one was closer to the value obtained when maximizing the TEMs independently. Once the operating point is fixed, adding TEMs to an ATEG increases the output power, eventually reaching a maximum value beyond which the use of more TEMs decreases the overall energy generation. This effect arises because the added TEMs extract low heat flux values, so their contribution to energy generation by the Seebeck effect is low. At the same time, their Joule heating term is high due to the non-negligible current as they are electrically connected to the rest of the system. Therefore, the overall energy generation reduces in comparison with a case with less TEMs [15]. Stevens et al. [16] numerically found that the point of maximum output power was higher when using a series electrical connection between TEMs rather than parallel.
Mixed series-parallel electrical configurations between TEMs in an ATEG have also been investigated. Quan et al. [17] experimentally analyzed the implications of using different electrical connections in an ATEG formed by 64 TEMs. The pure series connection was superior than the pure parallel one in terms of energy generation. However, they found a mixed configuration that was able to increase by a 9% the output of the series case. Similarly, Fang et al. [18] experimentally and numerically studied an ATEG with 60 TEMs. They obtained a 20% increase in the output power of the series electrical configuration by using a mixed electrical topology.
Li et al. [19] numerically investigated the effect of changing the number and distribution of TEMs in an ATEG. The ATEG was formed by 17 columns. Response surfaces of maximum electrical output power and energy conversion efficiency were obtained as a function of the number of TEMs employed in different columns. A multi-objective genetic algorithm was applied to find the optimal distribution pattern that increased by a 53% the initial design. The optimal design used different number of TEMs in different columns.
The effect of inhomogeneous temperature distribution in ATEGs formed by large number of TEMs was numerically investigated by Tao et al. [20]. In an ATEG formed by 8 columns each one with 4 TEMs, these authors found a clear decrease of output power in individual TEMs located along the exhaust gas flow direction. However, those TEMs located in the same column had similar performance values. These results were experimentally confirmed by Quan et al. [21] in the analysis of the ATEG formed by 240 TEMs already analyzed in [11].
The effect of the spatial distribution of TEMs (thermal connection) on the ATEG energy generation was also studied by Cózar et al. [15] who numerically analyzed three spatial distributions of TEMs: full series, square and full parallel. They found that the full series topology (all TEMs in a row along the exhaust pipe) reached the highest value of energy generation. In contrast, the full parallel one (all TEMs located in a cross-sectional plane of the exhaust pipe; i.e., in one column) had the lowest value of energy generation.
These previous studies were mainly focused on how the output power changed when using different electrical and thermal connections between TEMs. However, additional information is needed to assess the commercial feasibility of applying this technology to recover waste heat in internal combustion engines. In particular, values of global energy conversion efficiency and electrical magnitudes such as voltage and current are very relevant when the ATEG is finally integrated into the vehicle management system. Therefore, the objectives of the present work were (1) to obtain the energy conversion efficiency and (2) to analyze voltage and current for different configurations of TEMs in ATEGs formed by 4 to 100 TEM units.
Following Cózar et al. [15], three different thermal configurations were here numerically studied: full series, square and full parallel. Full series corresponded to a distribution in which TEMs formed a row aligned with the exhaust pipe. In full parallel all TEMs occupied the same exhaust pipe cross-sectional plane. In the square configuration, we distributed an equal number of TEMs per row than per cross-section. The latter configuration constrained the cases analyzed to ATEGs with a number of TEMs equal to the square of an integer number.
On the other hand, the electrical connection between TEMs was series in the thermal series case, mixed series-parallel in the thermal square case and parallel in the thermal parallel case, though other electrical connections were also analyzed and discussed in Section 2. The electrical circuit was closed with a load resistance, whose value was varied to maximize the output power as explained in Section 2. The simulation of the system, including the optimization procedure for the load resistance, was carried out with the GT-SUITE software detailed in Section 2. For each ATEG configuration, two different operating conditions representative of vehicle engine regimes were used.

2. Materials and Methods

2.1. Model Set Up

The numerical model was based on GT-SUITE software from Gamma Technologies [22]. This multi-physics CAE system has been successfully applied in a wide variety of studies focused on the exhaust gases of internal combustion engines, including those involving waste heat recovery systems such as organic Rankine cycles [23], turbocompounding [24] and ATEGs [25]. In thermoelectricity, this model has been able to correctly reproduce experimental data of temperature, power, voltage and current at different engine regimes and ATEG configurations (see, e.g., [26]). Here, we carried out the same procedure as that developed in Cózar et al. [15], who defined the ATEG as a set of submodels each one corresponding to an individual TEM.
The commercial thermoelectric generator Marlow TG-12-8-01LS (40 × 40 × 3.5 mm) was used as the individual TEM element [27]. This TEM was simulated as a whole unit with effective thermoelectric properties calculated from manufacturer’s datasheet values (see Table 1). The effective Seebeck coefficient α was obtained as α = V o c / T T E M with V o c the open circuit voltage and T T E M the temperature difference at hot and cold sides of the TEM (see, e.g., [28]). The effective internal electrical resistance R was calculated from R = V o c / I s c , with I s c the short circuit current. The effective thermal resistance was directly provided by the manufacturer. Thus, the effective Seebeck coefficient corresponded to the overall TEM conversion factor from temperature difference to voltage. Since TEM output values involved contact resistances, Thomson effect, etc., the figure of merit calculated from the effective properties was smaller than that of the intrinsic p-type and n-type thermoelements.
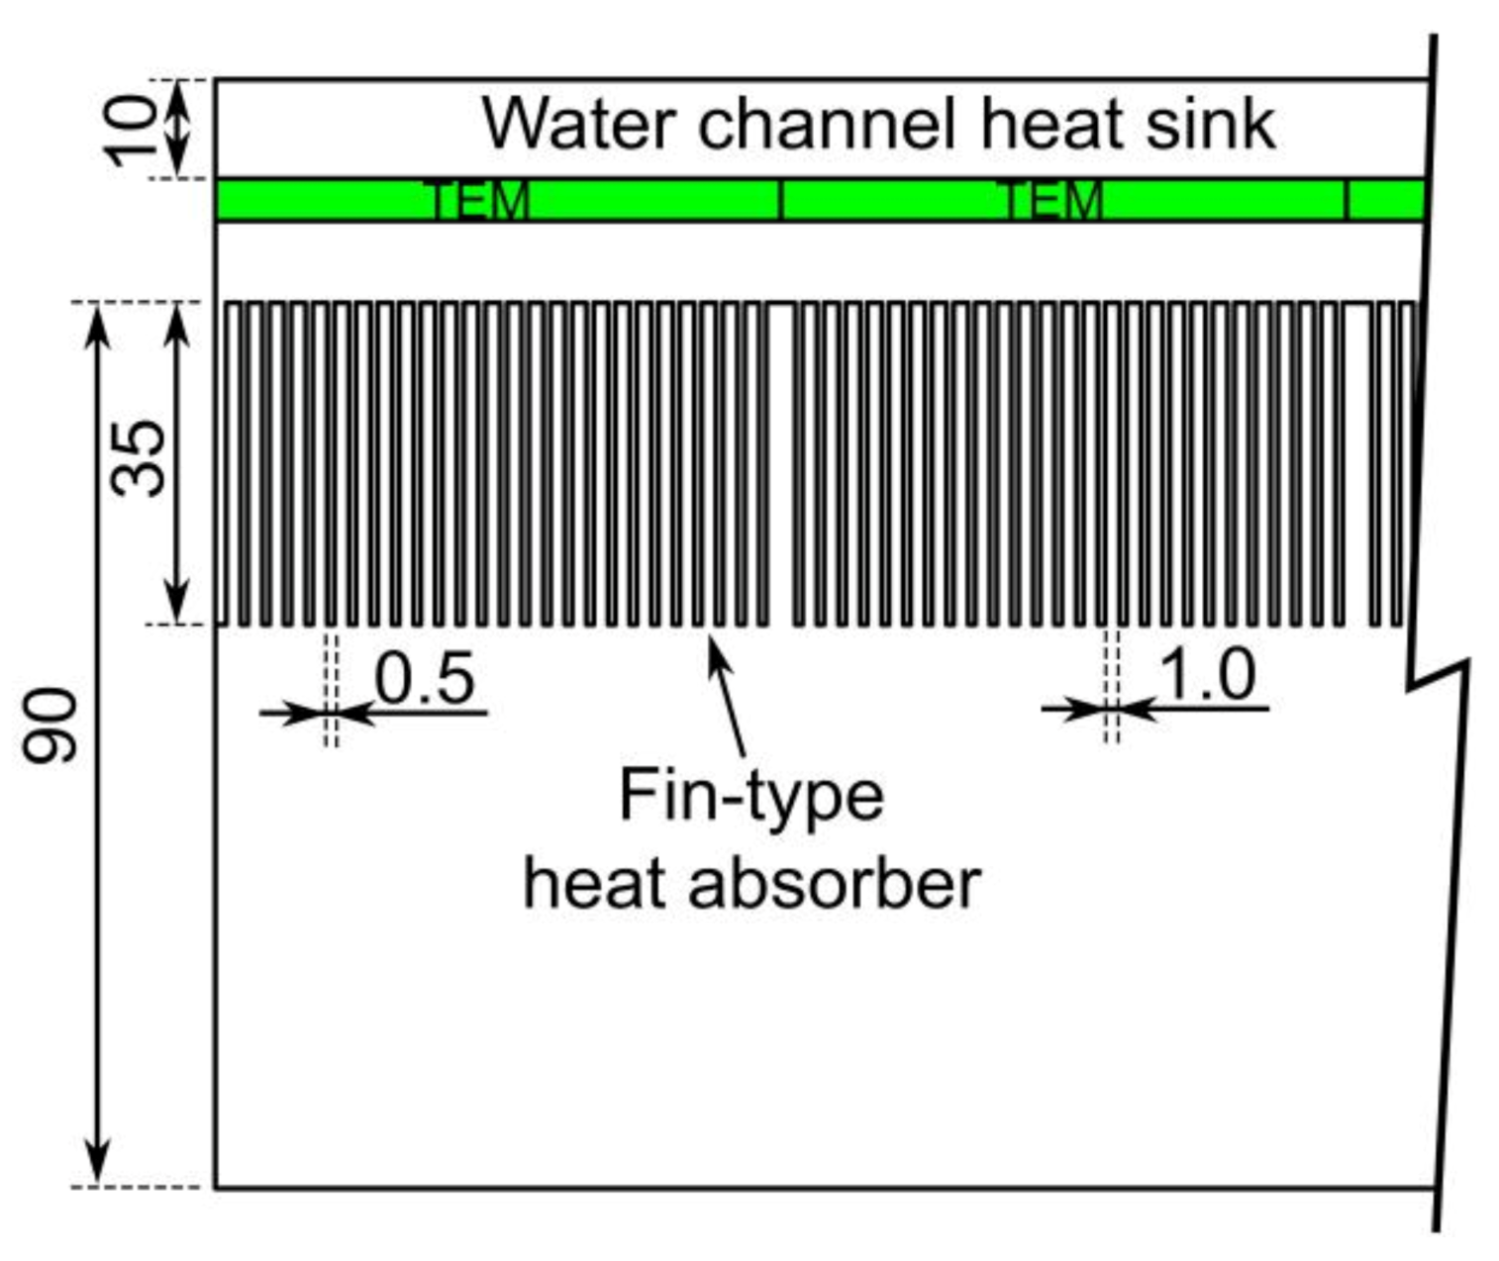
The hot side of the TEM was in contact with a finned type heat absorber inserted into the exhaust pipe. Fins were aluminum made 0.5 mm wide and 35 mm long. The fin-to-fin distance was 1 mm. The cold side of the TEM was in contact with a water heat sink of rectangular shape 10 mm high (see Figure 1).
The global dimensions of the ATEG were 100 times longer and wider than a single TEM unit since our purpose was to analyze results up to include 100 individual TEMs in full series or in full parallel thermal configurations. This meant that the actual ATEG modelled had cross-sectional areas equal to 4000 × 90 mm in the exhaust pipe (heat absorber zone) and to 4000 × 10 mm in the water channel (heat sink zone). Obviously, an ATEG with these dimensions is unfeasible but it allowed us to directly compare cases with different number of TEMs n T E M . Thus, the dimensions of the whole system were kept equal for any n T E M used in order to maintain both hot and cold flow conditions. Otherwise, changes in pipe and channel dimensions would have involved flow variations that would affect the ATEG performance. Certainly, this would have made difficult to discern the effect of the electrical or thermal connections from other causes when comparing cases with different number of TEMs. All surfaces not covered by active TEMs were assumed adiabatic. The cooling flow was assumed to be in counter-current with respect to the exhaust gases since it was expected to provide a better performance [29].
Model boundary conditions were taken from data of an engine test bench [30], being listed in Table 2. Data were extracted from two working regimes of a 110 kW, four-cylinder diesel engine of 3.9 L displacement. Operating point #1 was representative of medium load, low engine speed (1000 rpm) regime, whereas operating point #2 was achieved at low loads and high engine speed (2000 rpm). Although more points could be analyzed the conclusions extracted from the present work were independent of the operating points chosen.
Besides the boundary conditions listed in Table 2, the model set up included a constant air to fuel ratio equal to 14:1. Thermal contact resistance values between different bodies (exhaust pipe—TEM and TEM—water channel) were constant and equal to 1.5 × 10⁻⁵ m2KW−1, as employed in [15]. This value was similar to that measured for two aluminum bodies with a graphite interface material clamped at 1.2 MPa pressure (2.2 × 10⁻⁵ m2KW−1; ref. [31]), which is a common recommended pressure for clamping TEM elements. An order of magnitude variation of this value implied less than 10% variation in maximum output power. Heat transfer coefficients were evaluated using uniform temperatures at each individual TEM. In the heat sink, the Shah and London correlation [32] was applied to determine the Nusselt number. In the heat absorber, the Nusselt number took the well-known expression for finned heat sinks (now working as heat absorbers) [32]. Absolute pressures at the outlet of the ATEG for both water coolant and exhaust gases were set to 1 bar.
The numerical model was validated against both manufacturer and experimental data [15]. Simulated electric output power of a single TEM successfully reproduced datasheet values, with an error less than 2.60% in a range of TEM hot side temperatures equal to 373 K < T h < 493 K, for a TEM cold side temperature T c = 323 K (see Table 3). As detailed in Cózar et al. [15], the model was also experimentally validated with results obtained from an ATEG installed in an engine test bench. Differences between simulated and experimental TEM hot side temperatures were less than 2% for eight types of engine regimes tested. At the same time differences between simulated and experimental TEM cold side temperatures were less than 4%.

2.2. TEM Spatial and Electrical Configurations

The spatial distribution of TEMs in the ATEG determined its thermal configuration. The series thermal case consisted of putting all TEMs in a single row, aligned with the direction of the exhaust gases (see Figure 2). In this case, the electrical connection between individual TEMs was also pure series since it provided a superior output power. The parallel thermal case assumed that all TEMs were located in a cross-section of the exhaust pipe (i.e., all in a single column in Figure 2). We chose the parallel electrical connection between elements for doing all the calculations since it required less CPU time to solve. The series electrical connection in this case provided the same output results, since the numerical model assigned uniform temperatures at both hot and cold sides of individual TEMs. Finally, the square case took into account spatial patterns with the same number of TEMs in rows than in columns. In this topology, results were obtained with an electrical connection that consisted of a hybrid series-parallel configuration. All TEMs in a given column were connected in parallel and then in series with the output of the next column (see Figure 3). Results with this configuration were equal to those for the pure electrical series connection but computationally more efficient. We did not investigate additional electrical connection types, such as mixed series and parallel. Thus, the electrical connections employed reproduced the spatial configuration patterns (pure series, pure parallel, and square parallel first then series connections).
Since our purpose was to compare data from these three configurations, cases analyzed were limited to use a number of TEMs n T E M = i 2 , with i being an integer number. Thus, ATEGs studied used n T E M = 4, 9, 16, 25, 36, 49, 64, 81 and 100 distributed in a single row (series), a single column (parallel), and in equal number of rows than columns (square). Note that, as discussed above, flow conditions were identical for all ATEGs as far as the same engine operating point in Table 2 was chosen.

2.3. Optimization Algorithm and Data

The electrical circuit was closed with a load resistance RL. The value of RL was set to maximize the output power. This was done by applying the discrete-grid optimization algorithm with a 1% resolution [15]. This method involved a large number of simulations, so a script in Python code was developed to deal with the generation and submission of the multiple cases required by the GT-SUITE software. In essence, the computational procedure consisted of finding the load resistance that maximized the objective function (electrical output power). From previous runs, the python code established a range of load resistance values in which it was expected to contain that able to maximize output power. Then GT-SUITE applied the maximum power point algorithm based on the discrete-grid optimization technique.
Extracted data were local and global. Local data consisted in information at TEM level. For example, values of TEM’s hot side temperature T h , TEM’s cold side temperature T c and heat flux through the TEM at its hot Q h and cold Q c sides, respectively were obtained. Electrical data (current I and voltage V) at TEM level were also monitored.
At TEM level, the previous variables satisfied the equations [25]
Q h = α T h I 1 2 I 2 R + K T h T c
Q c = α T c I + 1 2 I 2 R + K T h T c
where α was the TEM effective Seebeck coefficient, R the effective electrical internal resistance and K the effective thermal conductance, all being functions of temperature as indicated in Table 1. In Equations (1) and (2), the first term on the right hand side was the thermoelectric Seebeck effect, the second term was related to Joule heating and the last term corresponded to heat conduction phenomenon.
The electrical output power P for a single TEM unit was calculated from Equations (1) and (2) as
P = Q h Q c = α T h T c I I 2 R
being a function of the Seebeck effect and Joule heating only.
The TEM energy conversion efficiency η (in %) was obtained from
η = 100 P Q h
and the voltage V at the ends of a single TEM equal to
V = α T h T c I R
Global values of output power for the whole ATEG system P A T E G were obtained by adding up the individual contribution of TEM units,
P A T E G = n T E M P
Similarly, the amount of heat flux globally extracted from the heat absorbed Q h A T E G was obtained from
Q h , A T E G = n T E M Q h
These two global values were employed to calculate the overall energy conversion efficiency of the ATEG device (in %) as
η A T E G = 100 P A T E G Q h , A T E G
Finally, current through the load resistance RL was calculated from
I R L = P A T E G R L 2
and voltage at the ends of the load resistance RL was
V R L = I R L R L
We point out that values of I R L and V R L calculated as in Equations (9) and (10) coincided with those obtained after applying the standard rules of electrical circuits when using I and V values at the TEM level and TEM connections as in Figure 3.

3. Results

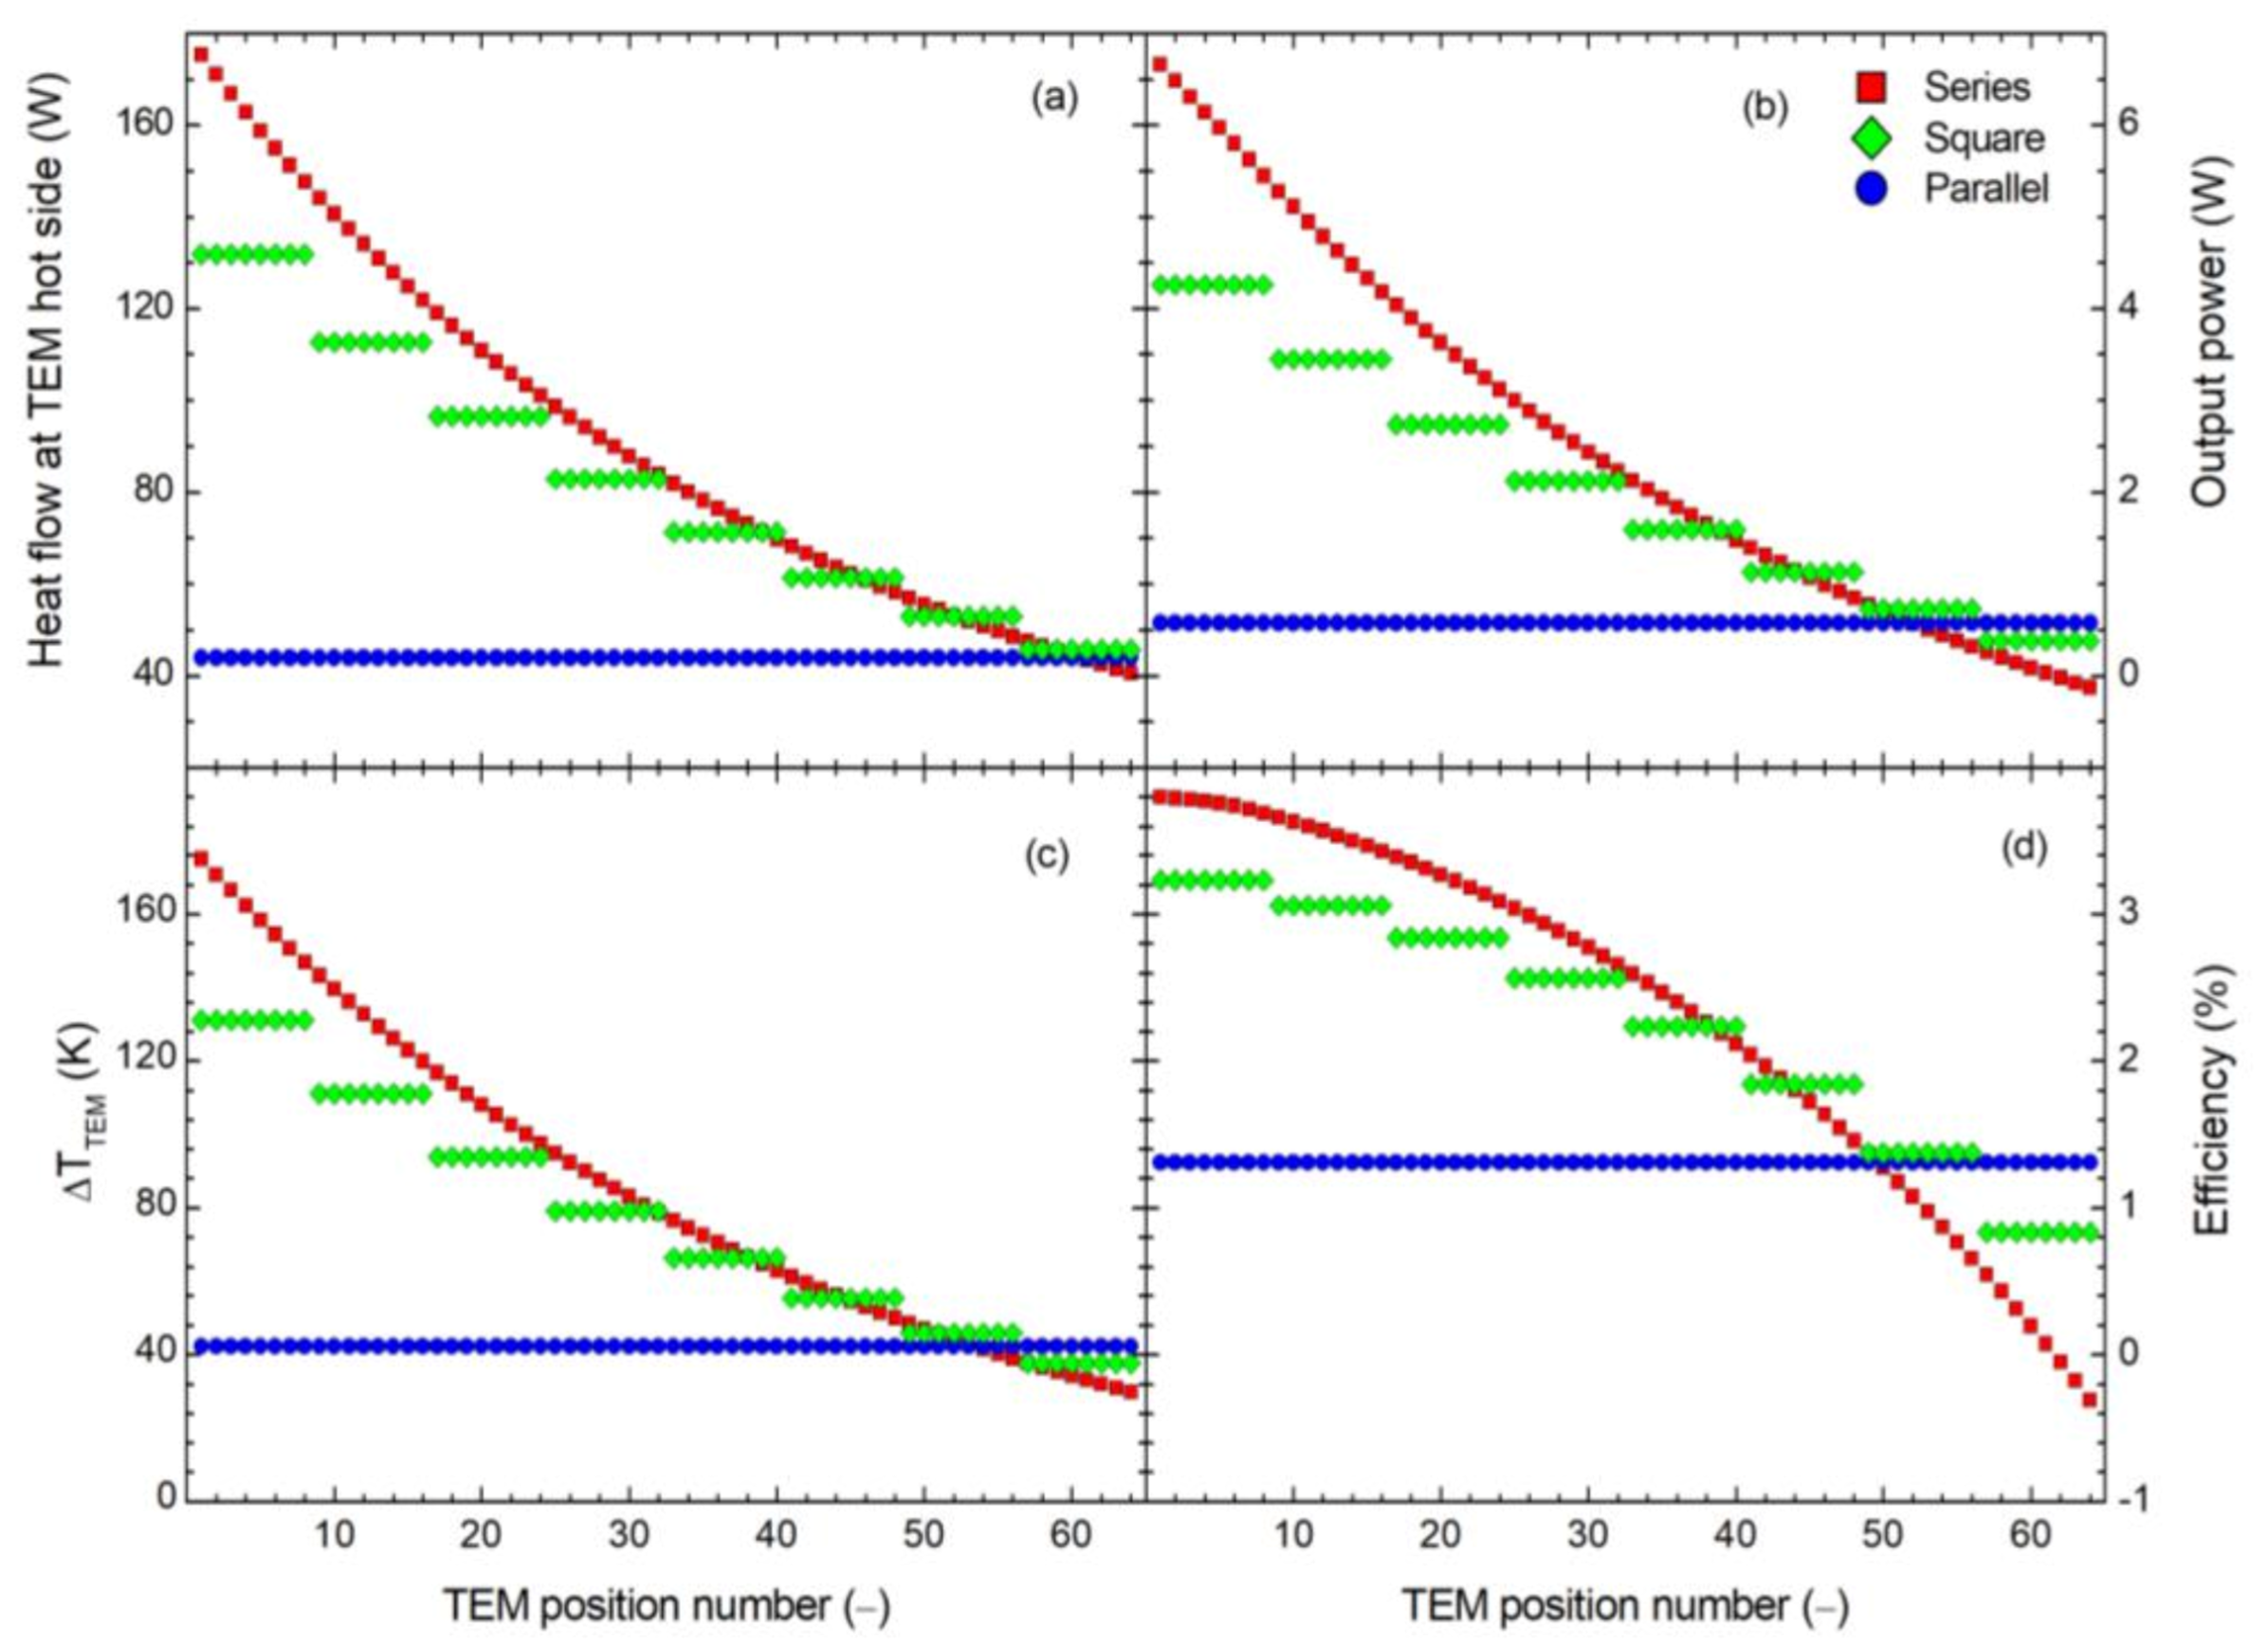
Thermal series, square and parallel configurations implied different working conditions at the TEM level. This was already observed in Cózar et al. [15], though they only focused on the electrical output power and TEM values of voltage and current. In terms of extracted heat from the exhaust fumes, TEMs at the same column absorbed an equal amount, as expected (see, e.g., the square configuration in Figure 4). This led to a continuous decrease of the energy available in the exhaust along the flow direction. Therefore, the heat flux across the TEMs diminished in the downstream path and, as a consequence, the temperature difference at both sides of TEMs also reduced. Figure 4 illustrates these phenomena for an ATEG with 64 TEMs working at operating point #2.
For the series pattern, the heat flow at the TEM hot side varied from 175 W at TEM #1 to 41 W at TEM #64. In terms of temperatures, values were hot side temperature T h = 482 K and temperature difference T T E M = T h T c = 175 K at TEM #1 and T h = 324 K and T T E M = 29 K only at TEM #64. Since the effective Seebeck coefficient decreases as a function of temperature, the conversion rate of heat into electricity was highly penalized in those TEMs located downstream. Therefore, individual TEM output power substantially reduced along the downstream pipe direction, as observed in Figure 4. Thermal series configuration for any number of TEMs always reported a monotonically decreasing convex behavior of output power P , heat flows Q h and Q c , temperatures T h and T c , temperature difference T T E M , and voltage V as a function of the number of TEMs. However, local energy conversion efficiency η values behaved as a monotonically decreasing concave function since the rate of change of output power was higher than the rate of change of heat flow (see the series configuration in Figure 4). This meant that local efficiency values tended to abruptly decline once moving towards the downstream end of the ATEG. Note that negative values of local output power and, hence, of efficiency, might occur at TEMs located at the tail of the ATEG, even when they had positive values of heat flux and hot minus cold side temperature differences. This effect was caused by a Joule heating term that exceeded the Seebeck generation term in Equation (3). This was a consequence of having all TEMs electrically interconnected, so the current flow through the downstream TEMs was substantially larger than that expected in case of being electrically independent from their neighbors. In the latter assumption, current would be much lower, and positive (though very low) values of local output power and efficiency would be attained. However, the purpose here was to assess the feasibility of integrating an ATEG into the vehicle management system so we ignored the contribution of individual TEMs disconnected from the main electrical line.
The square configuration had a trend similar to that of the series one although modulated by the effect of arranging some TEMs in columns. All TEMs located at the same cross-sectional plane provided equal output values, so there was not a strict monotonic decrease of the reported variables. It implied that peak values of output power, efficiency, temperature difference, heat flux, voltage, etc., were lower than those obtained in the series configuration. But, at the same time, minimum values of such variables were higher than those of the series topology. In the particular case of an ATEG with 64 TEMs with operating point #2 (Figure 4), none of the TEMs contributed negatively to the global output power, which contrasted with the findings of the series configuration. Note also, that energy conversion efficiency values of TEMs in upstream columns slightly changed, with differences increasing as moving to downstream locations. Finally, the thermal parallel configuration implied a uniform behavior for all TEMs in the ATEG since they were exposed to the same heat and cold flow conditions. In this case, T T E M = 42 .4 K for all TEMs, a value much lower than that obtained for the first TEM in the pure series configuration. This was a consequence of the pure parallel pattern that extracted all the energy from the exhaust gases in a single point. This procedure was not as effective as to gradually take out the heat from the exhaust fumes along the pipe direction (series configuration). For example, the overall heat flux extracted at a single point in the parallel configuration in Figure 4 was 2815 W. This was equally distributed among all 64 TEMs, giving a heat flux per TEM of 44 W. In contrast, the maximum heat flux extracted at a single point was 175 W at TEM #1 in the series case. In the series configuration, the addition of all the heat extracted by TEMs reached a total amount of 5844 W, much larger than in the thermal parallel configuration.
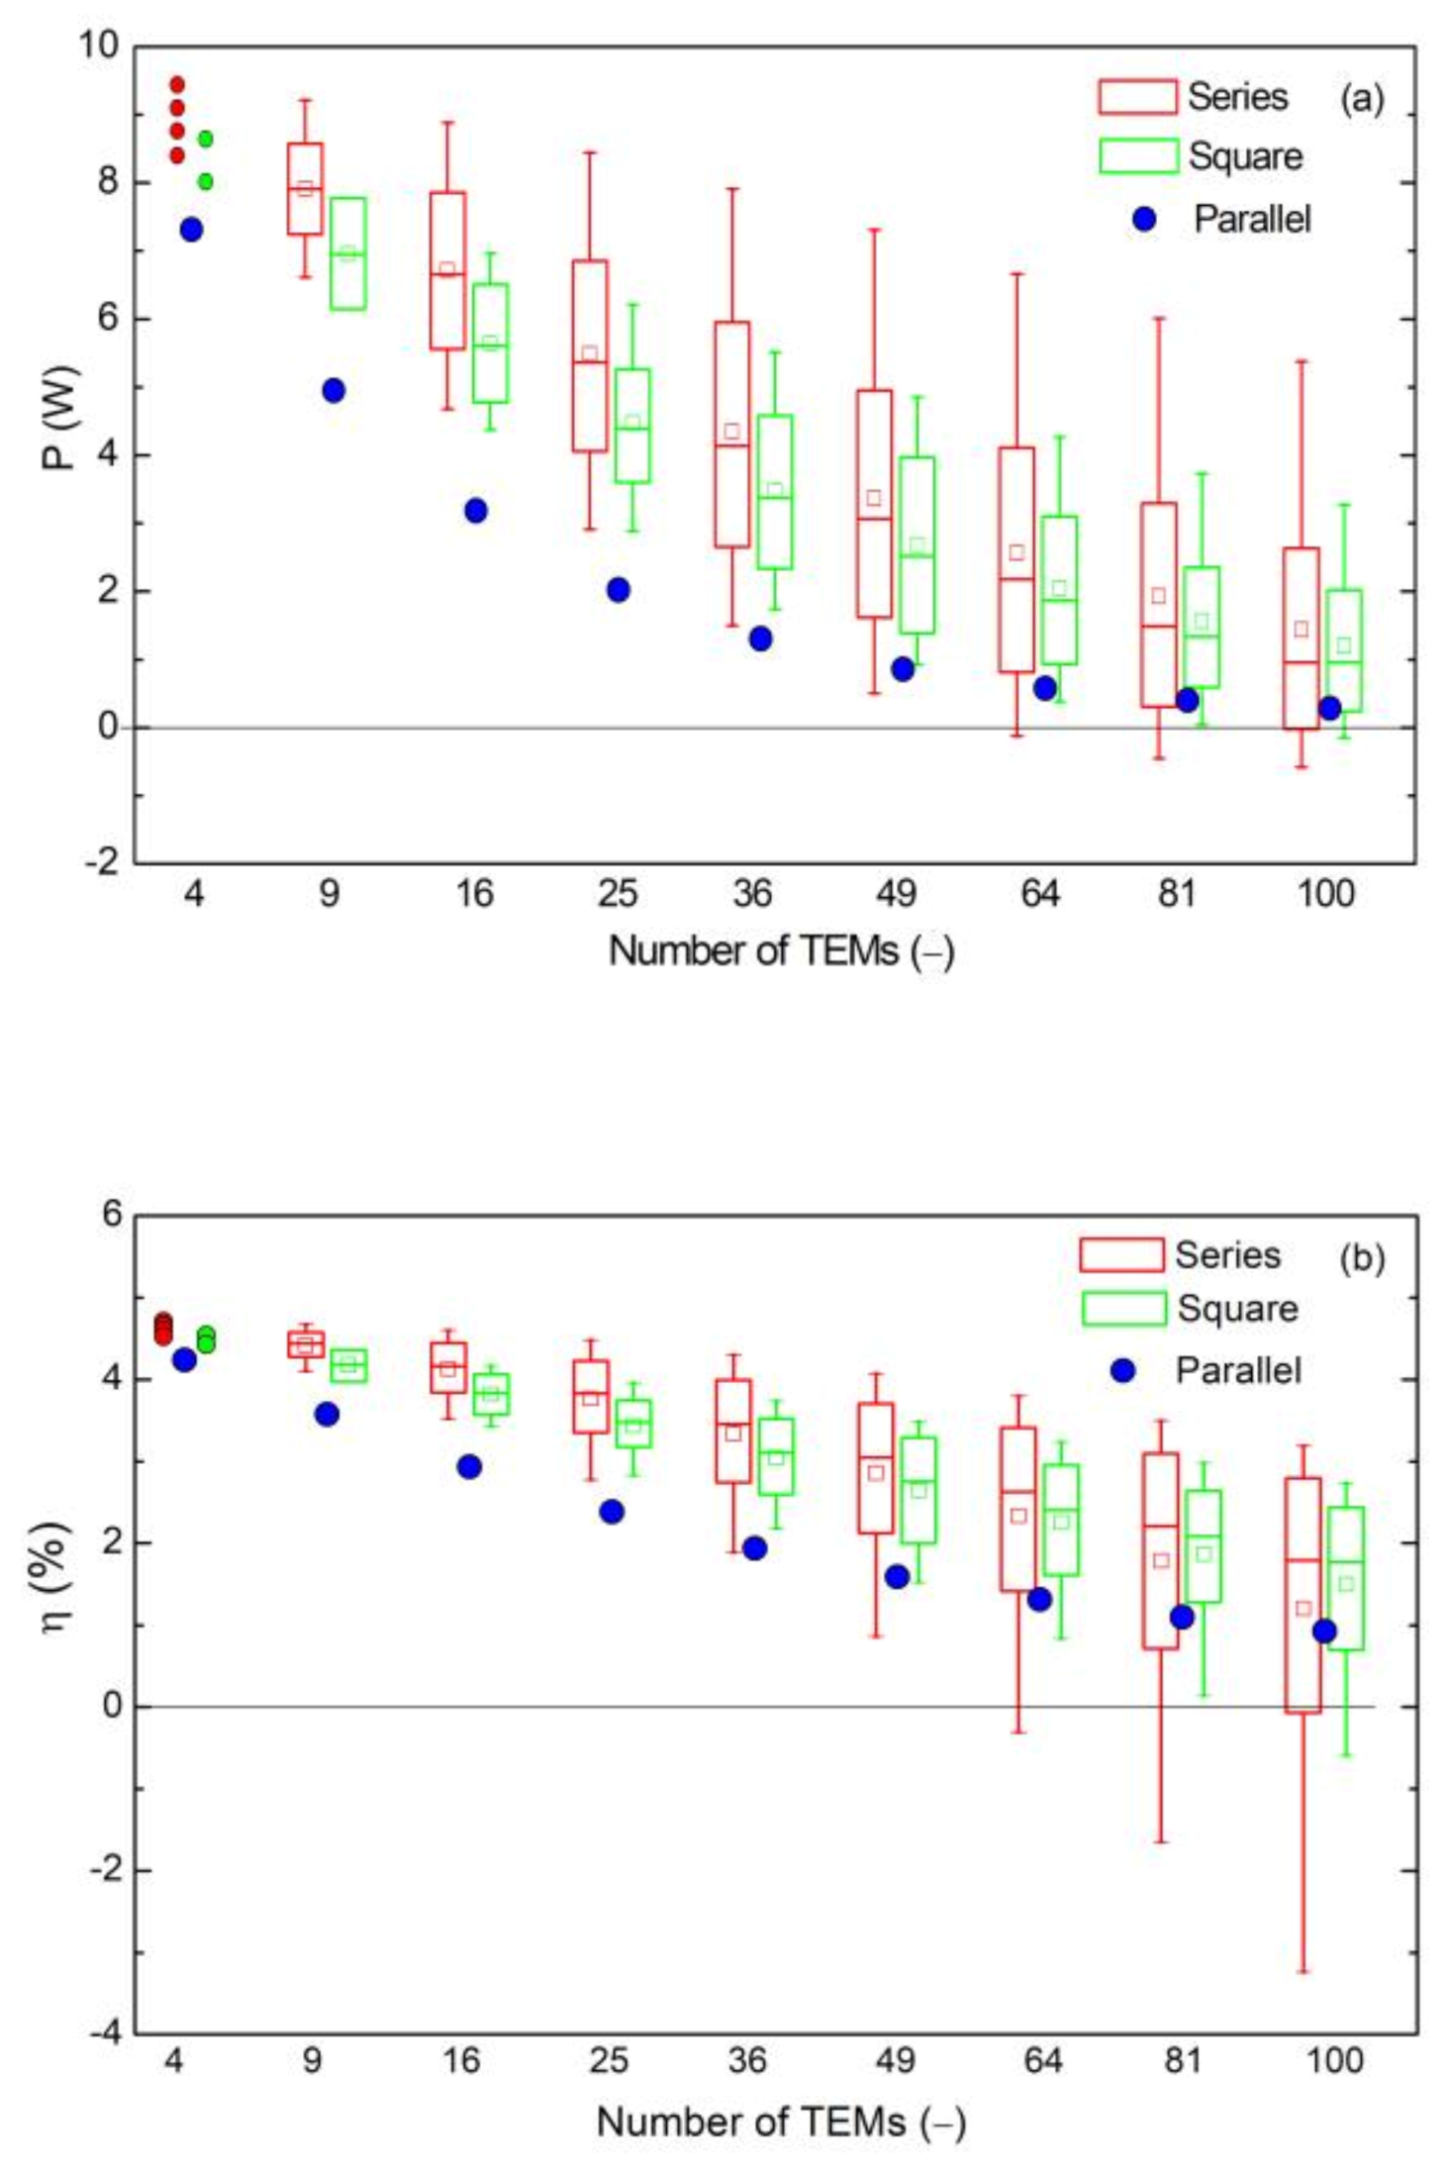
We applied a descriptive statistics analysis to both output power and efficiency datasets for all the ATEGs analyzed. Figure 5 shows the results for the operating case #2. The end of whiskers in box charts referred to the maximum and minimum values of the dataset. The open square indicated the average value. Individual points were shown for the case of an ATEG with only 4 TEMs since a box chart would be meaningless with such a small number of data points. The statistical analysis of the data shown in Figure 4 corresponded to the box charts for the case of an ATEG with 64 number of TEMs in Figure 5. Note that all TEMs had the same outputs in the thermal parallel configuration, so a single point in Figure 5 represented this case.
Upper and lower boxes and whiskers were similar in ATEGs with a low number of TEMs (<25) indicating a regular data distribution with no dominant trend and a median very similar to the average value. As the number of TEMs employed in the ATEG increased, boxes became taller revealing a raise in data variation, though it eventually shortened for output power values when using very high number of TEMs. The latter was caused by the fact that the variability at the lower range was limited since large negative output power values were not possible. At the same time, boxes were uneven in size, meaning a more variable nature in the upper half of values, for output power, and in the lower half of values, for energy conversion efficiency. The very long lower whisker observed in the efficiency data was a direct consequence of the rapid decline of their values in TEMs located near the downstream end of the ATEG, as shown in Figure 4 for an ATEG with a number of TEMs n T E M = 64. The thermal square configuration clearly showed a more uniform behavior than the series one.
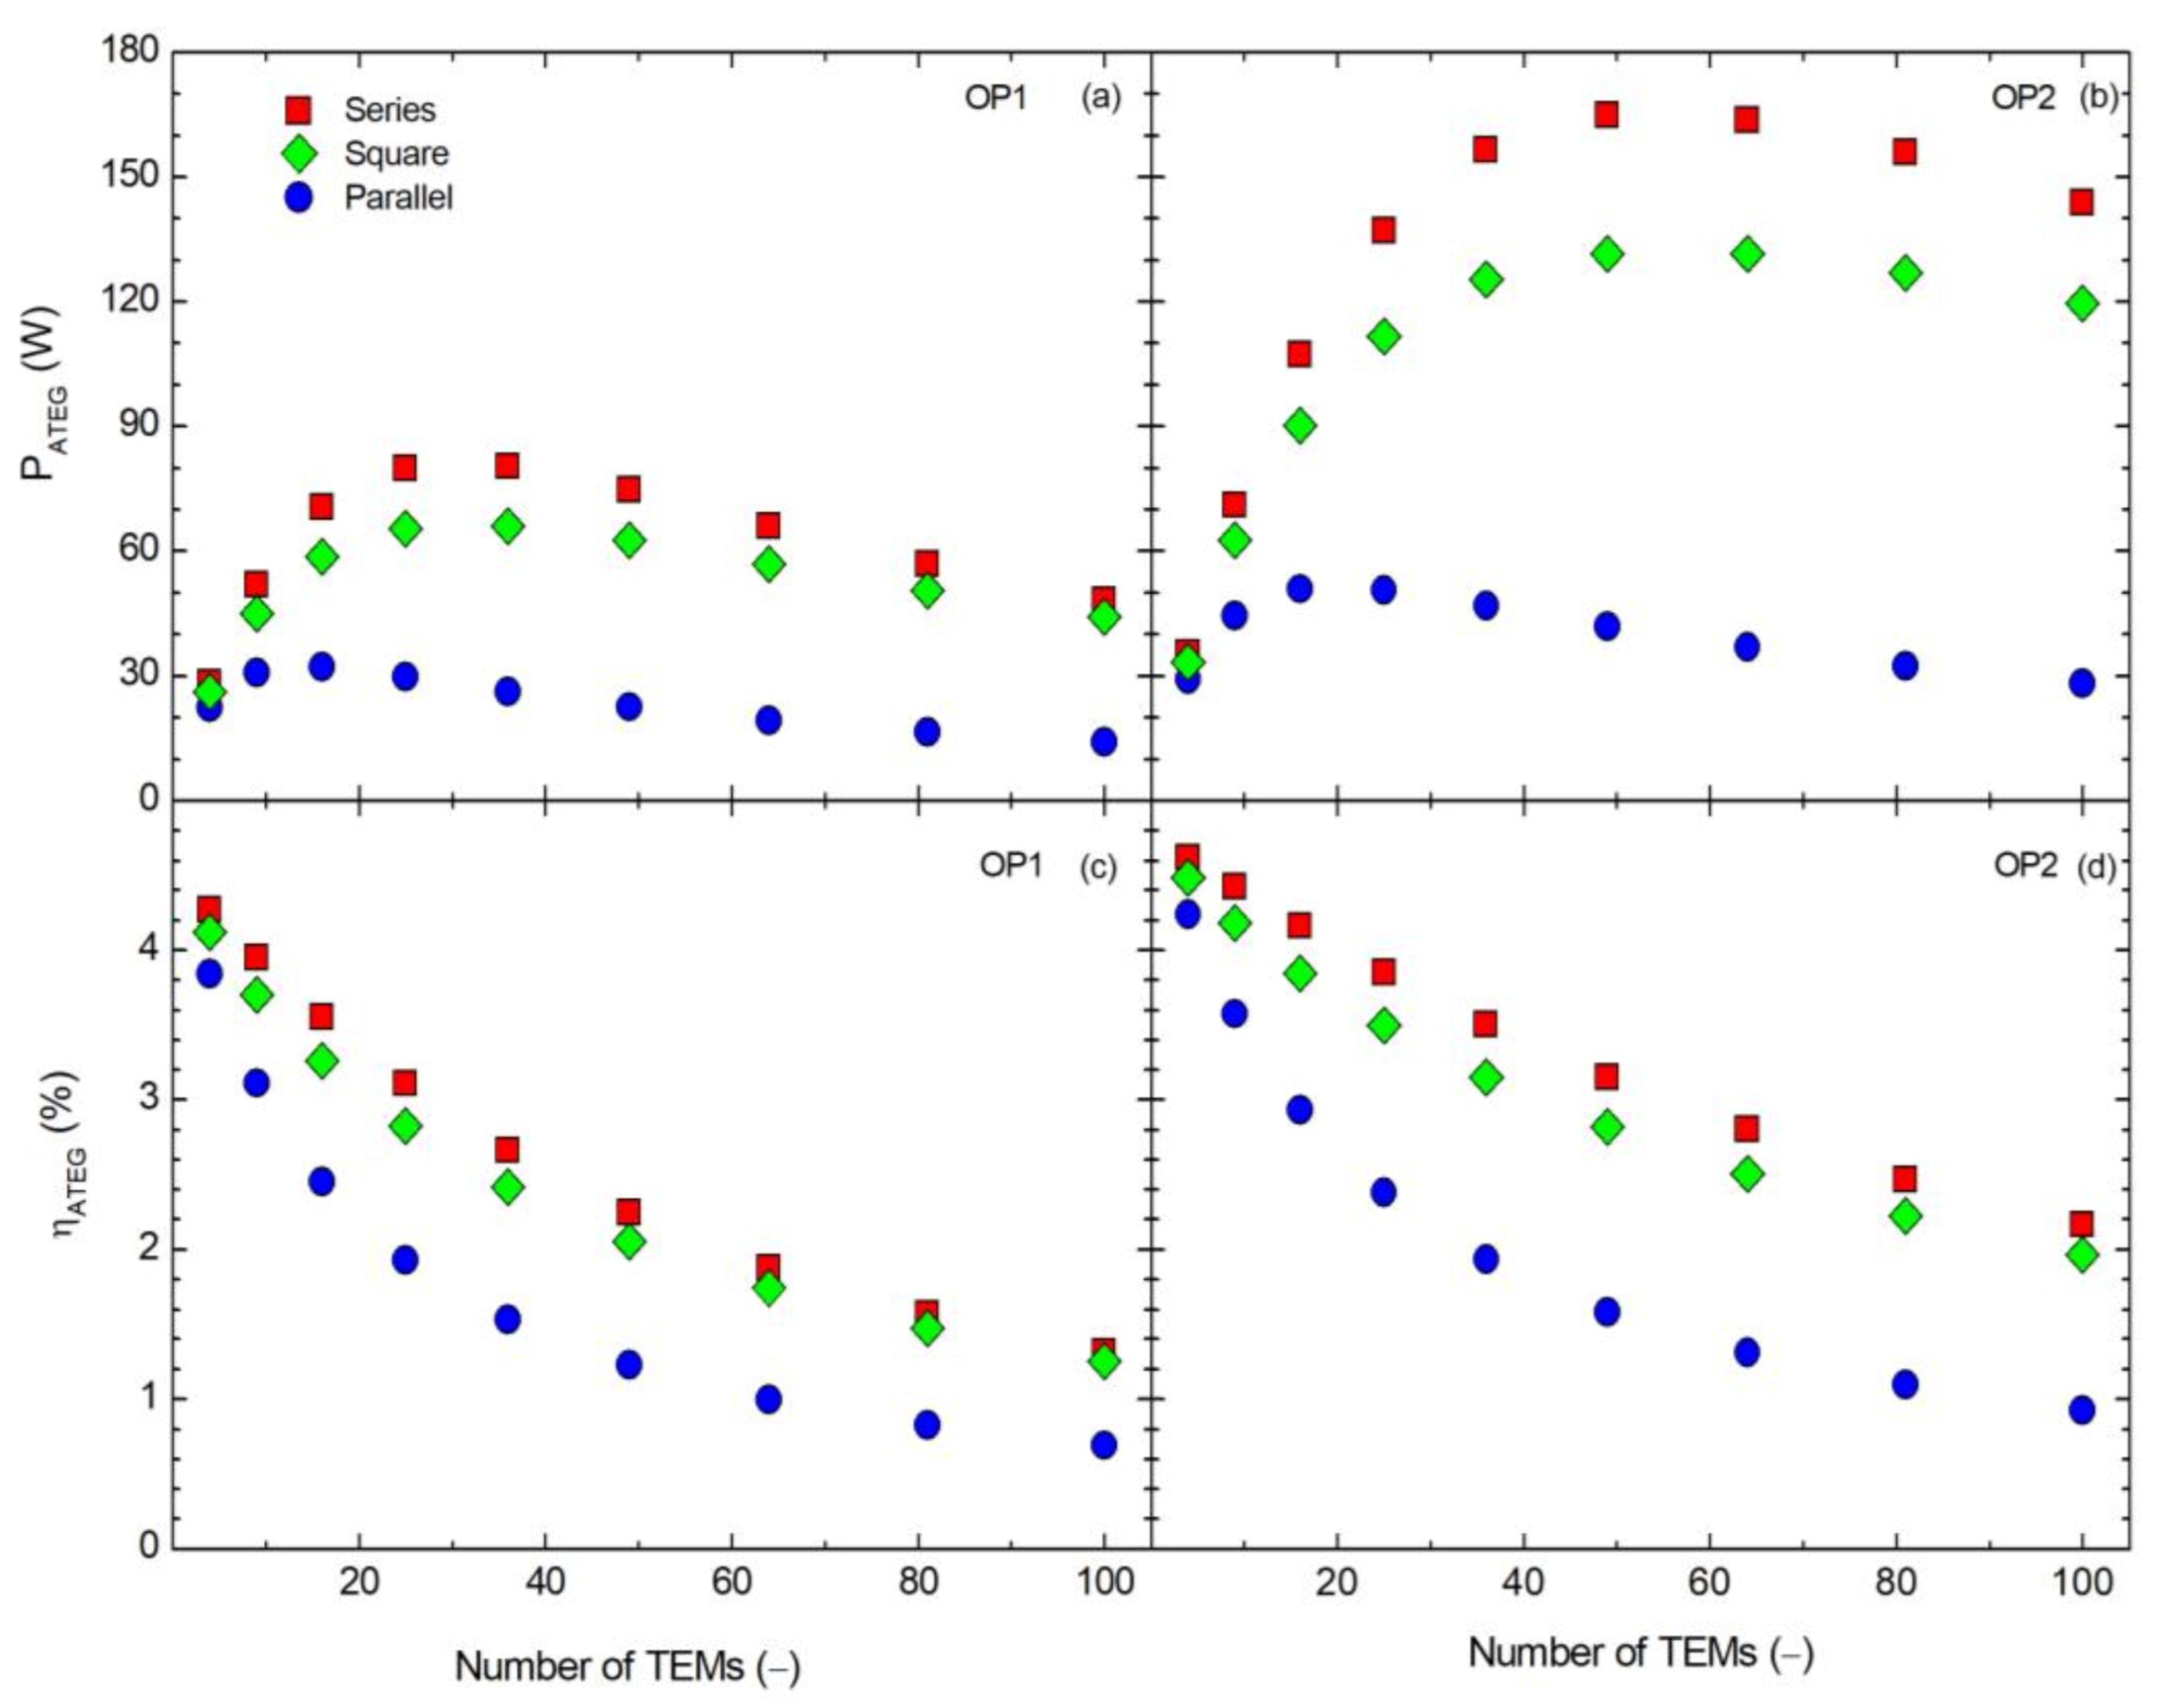
Global values of output power P A T E G and energy conversion efficiency η A T E G were calculated with Equations (6) and (8). Results confirmed that there existed a threshold number of TEMs assembled in an ATEG beyond which the total output power extracted P A T E G decreased (see Figure 6). This effect was not only observed in the series configuration, when downstream TEMs might negatively contribute to the overall output power value, but also arose in the pure parallel configuration in which all TEMs behaved identically. In this case, as the number of TEMs employed in the ATEG increased, the heat flux absorbed per TEM decreased, leading to small temperature differences, output power and energy conversion efficiency. Thus, the energy generation tended to zero as the number of TEMs tended to infinity. A greater output power was always attained with the series configuration, though the obvious mismatch in working conditions at the TEM level. In the low regime scenario (operating point #1), the maximum output power was P A T E G = 80.5 W with an ATEG with n T E M = 36 for the series configuration. For the very same conditions, the square configuration was able to reach P A T E G = 66.1 W with the same number of TEMs, and the parallel configuration generated a maximum of 32.2 W attained with n T E M = 16 (see Figure 6). The 18% decrease in maximum output power between the series and the square configurations was slightly increased in the high regime scenario (operation point #2). In this case, the series case produced up to 165.0 W using n T E M = 49, whereas the square one reached 131.5 W with the same number of TEMs (20% decrease). The maximum output power of the parallel configuration was 69% below that of the series one, being only 50.9 W at the n T E M = 16 case. Energy conversion efficiency values were maximum at the smallest ATEG device, monotonically decreasing as a function of the number of TEMs used in the ATEG.
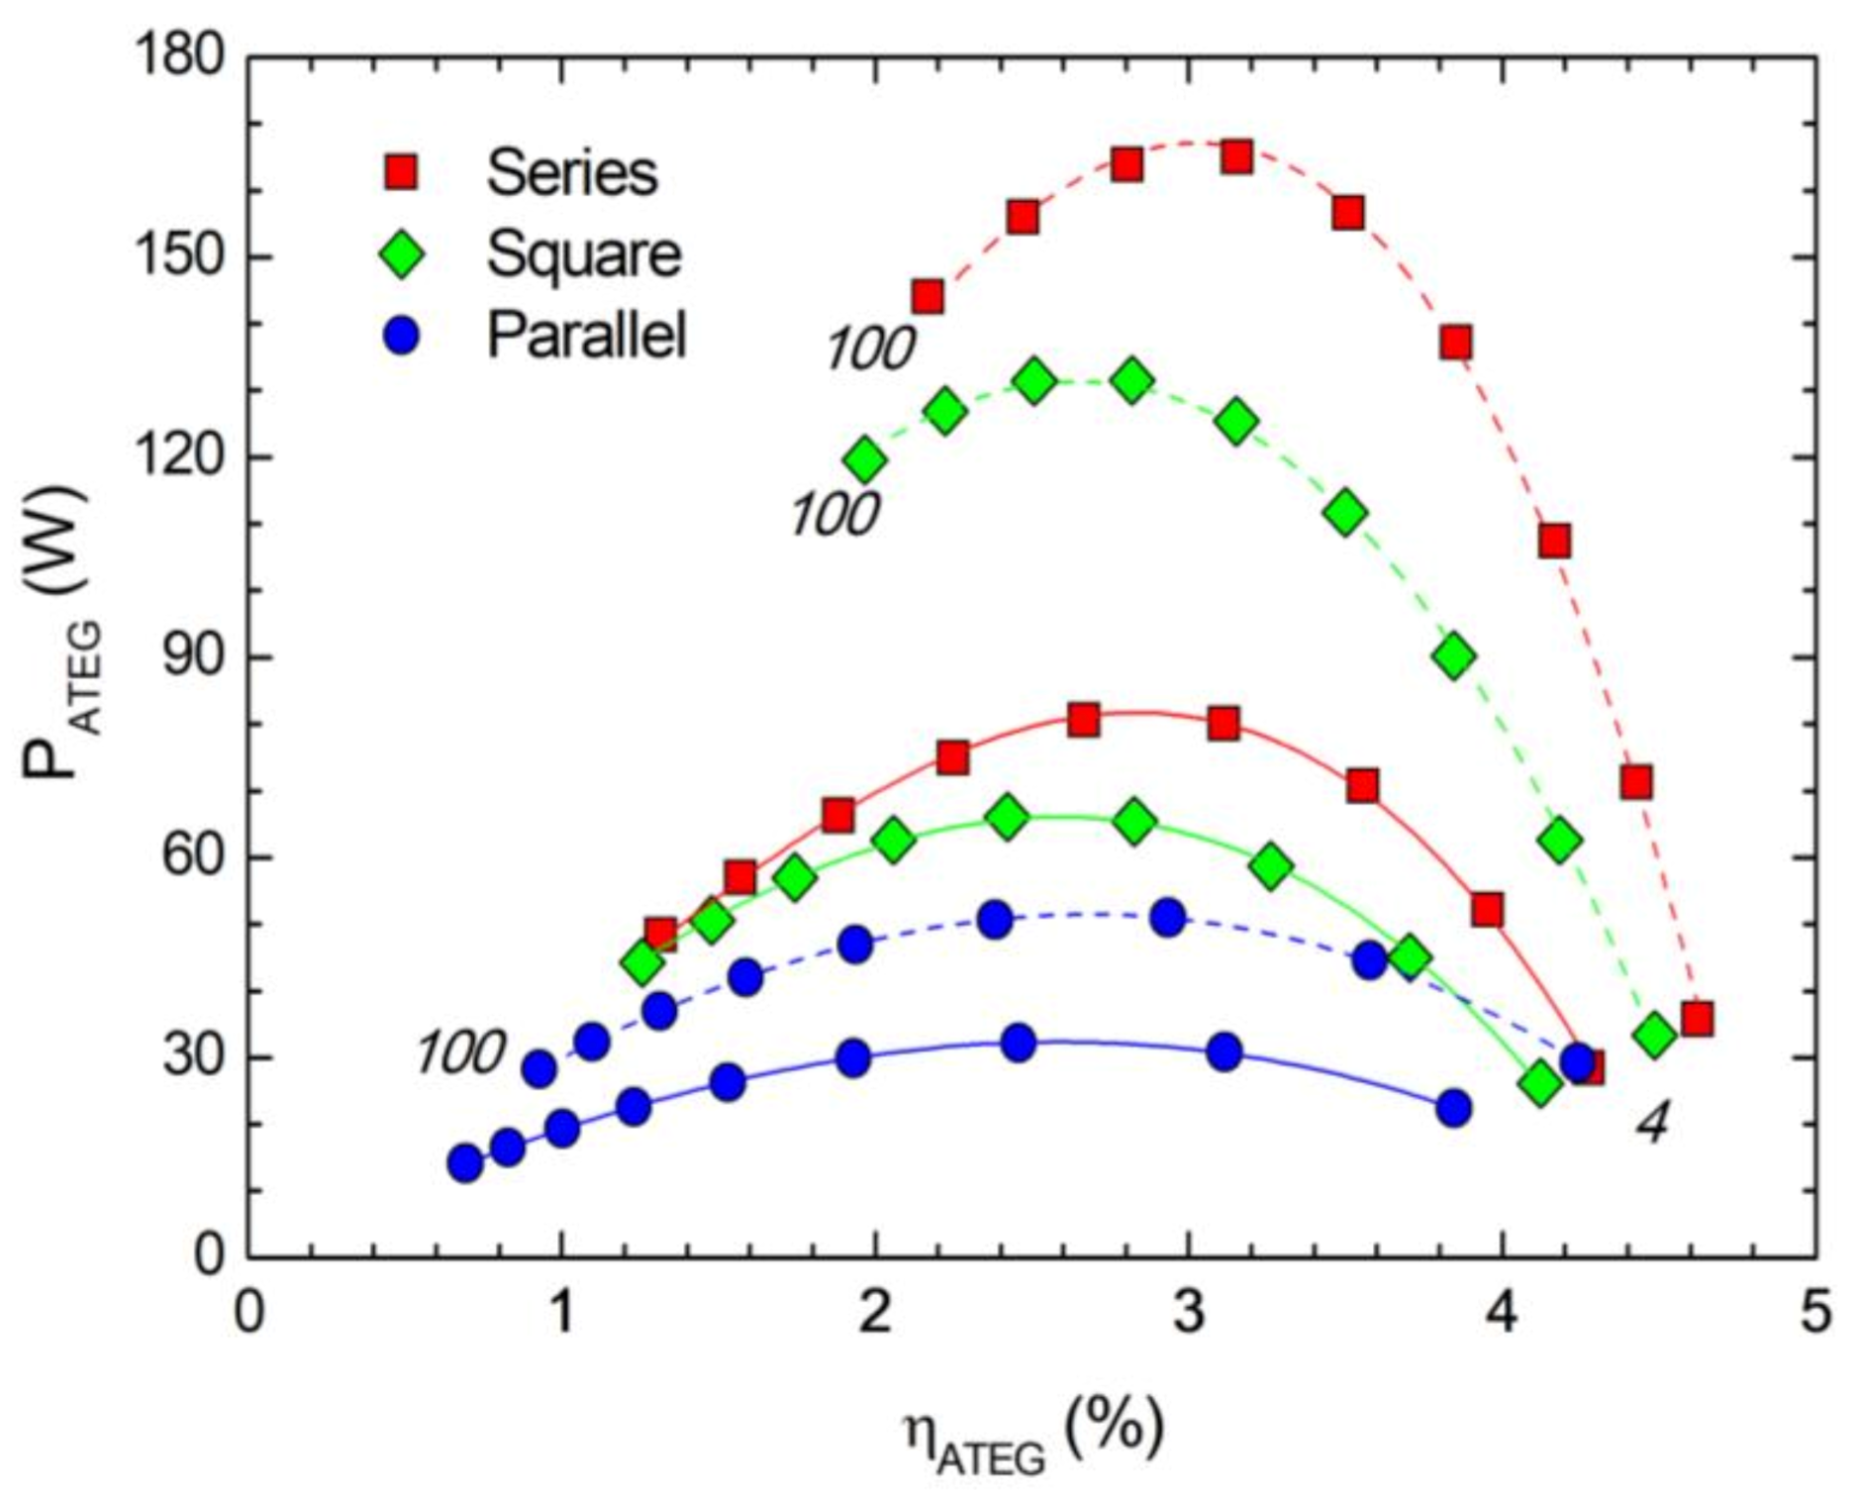
It was interesting to observe that, despite the large variations of energy generation reported for different configurations, all cases predicted a similar value of η A T E G at maximum P A T E G conditions. Figure 7 shows the ATEG output power as a function of the ATEG energy conversion efficiency for the working conditions of Table 2. Lines in Figure 7 correspond to cubic polynomials fitted to data constrained to intercept the origin of coordinates. Coefficients of determination were above 0.99 for all cases. For operating point #1, the overall efficiencies of the ATEG that produced the maximum output power were 2.7%, 2.4% and 2.5% in the series, square and parallel configurations, respectively. For the operating point #2, these values were slightly greater, being 3.2% (series), 2.8% (square) and 2.9% (parallel). Thus, maximum output power values were achieved in ATEG designs whose global energy conversion efficiency was on the order of 3%, irrespective of the model configuration.
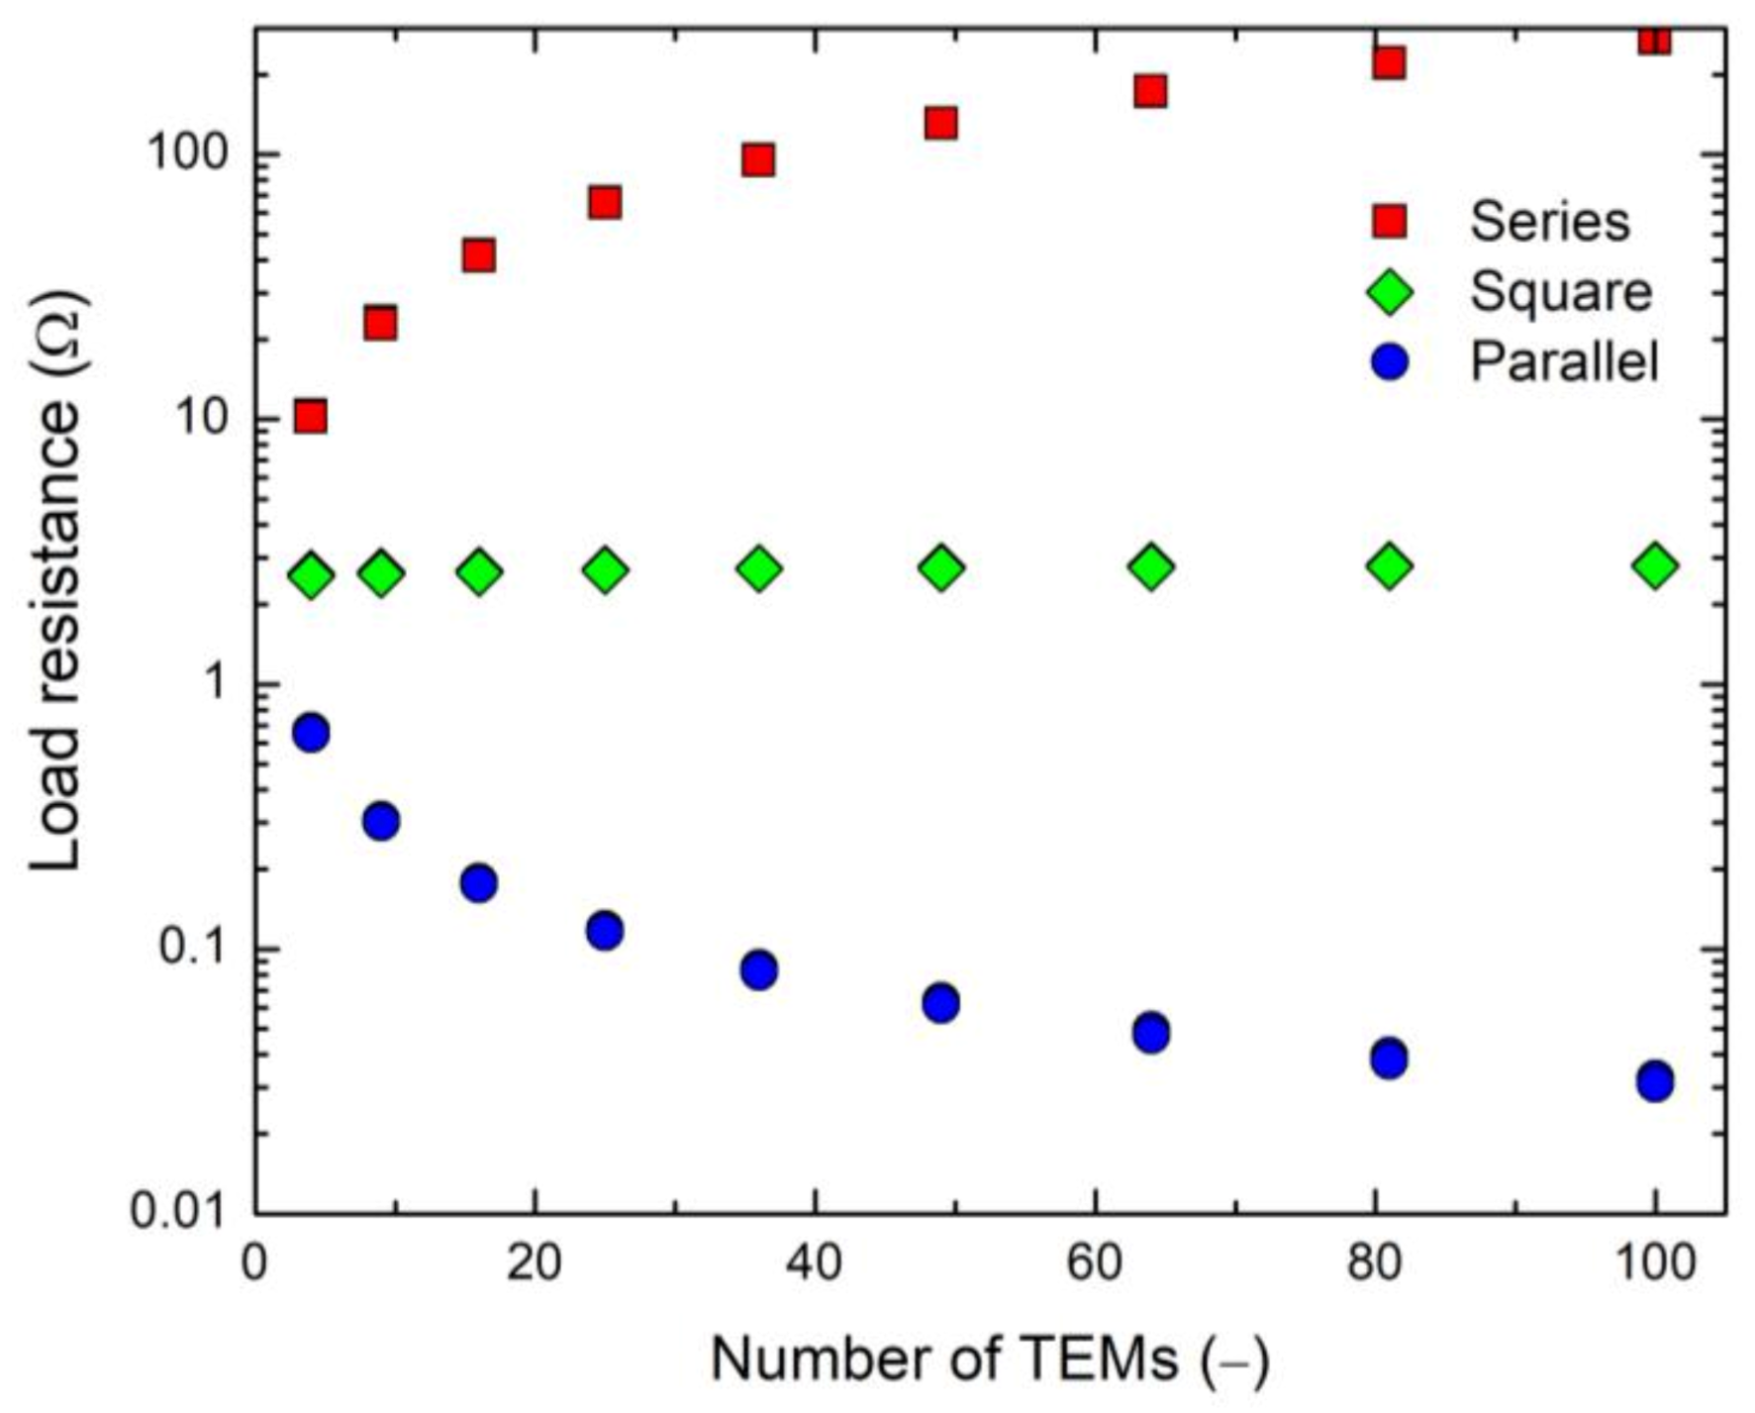
The full integration of thermoelectric generators in a vehicle is a complex task, especially in terms of managing the energy generation [33]. Several control strategies about using this additional power source have been proposed (see, e.g., [34,35]). Values of electrical variables such as current, voltage and load resistance are key to assure a smooth technical implementation into the vehicle system. Output voltages on the order of 12 V–24 V and load resistances with small variations between different regimes would favor such an integration process. The required load resistance R L to maximize the output power when the number of TEMs was fixed had more than one order of magnitude variation in both series and parallel configurations (see Figure 8). For the series case, R L ranged from 10 Ω ( n T E M = 4) to 273 Ω ( n T E M = 100). In comparison, R L for the parallel layout varied from 0.67 Ω ( n T E M = 4) to 0.03 Ω ( n T E M = 100). These differences contrasted with the narrow band of R L needed to maximize the output power in the square configuration. In this case, R L changed from 2.6 Ω ( n T E M = 4) to 2.8 Ω ( n T E M = 100) only. Previous R L values corresponded to those for the operating point #2, though very small variations were found when analyzing the operating point #1.
Global current and voltage at ATEGs with different configurations and number of TEMs but at the   R L that maximized the output power were also investigated (Figure 9). The series configuration generated low currents and very high voltages, reaching 147 V when using n T E M = 49 at the operating point #2 (global maximum output power was 165 W, see Figure 6). On the contrary, the full parallel configuration produced high currents and very low voltages. For example, current was 16.8 A and voltage 3.0 V in case n T E M = 16 at the operating point #2 (50.9 W in Figure 6). In addition, both series and parallel configurations had large variations in current and voltage as a function of the number of TEMs used in the ATEG (see Figure 9). However, the thermal square configuration supplied a remarkable steady values of current and voltages for all the range of ATEGs studied. Thus, current varied from 3.6 A to 6.9 A and voltage from 9.3 V to 19.1 V at operating point #2 using designs from n T E M = 4 to n T E M = 100. These values where slightly reduced at operating point #1.
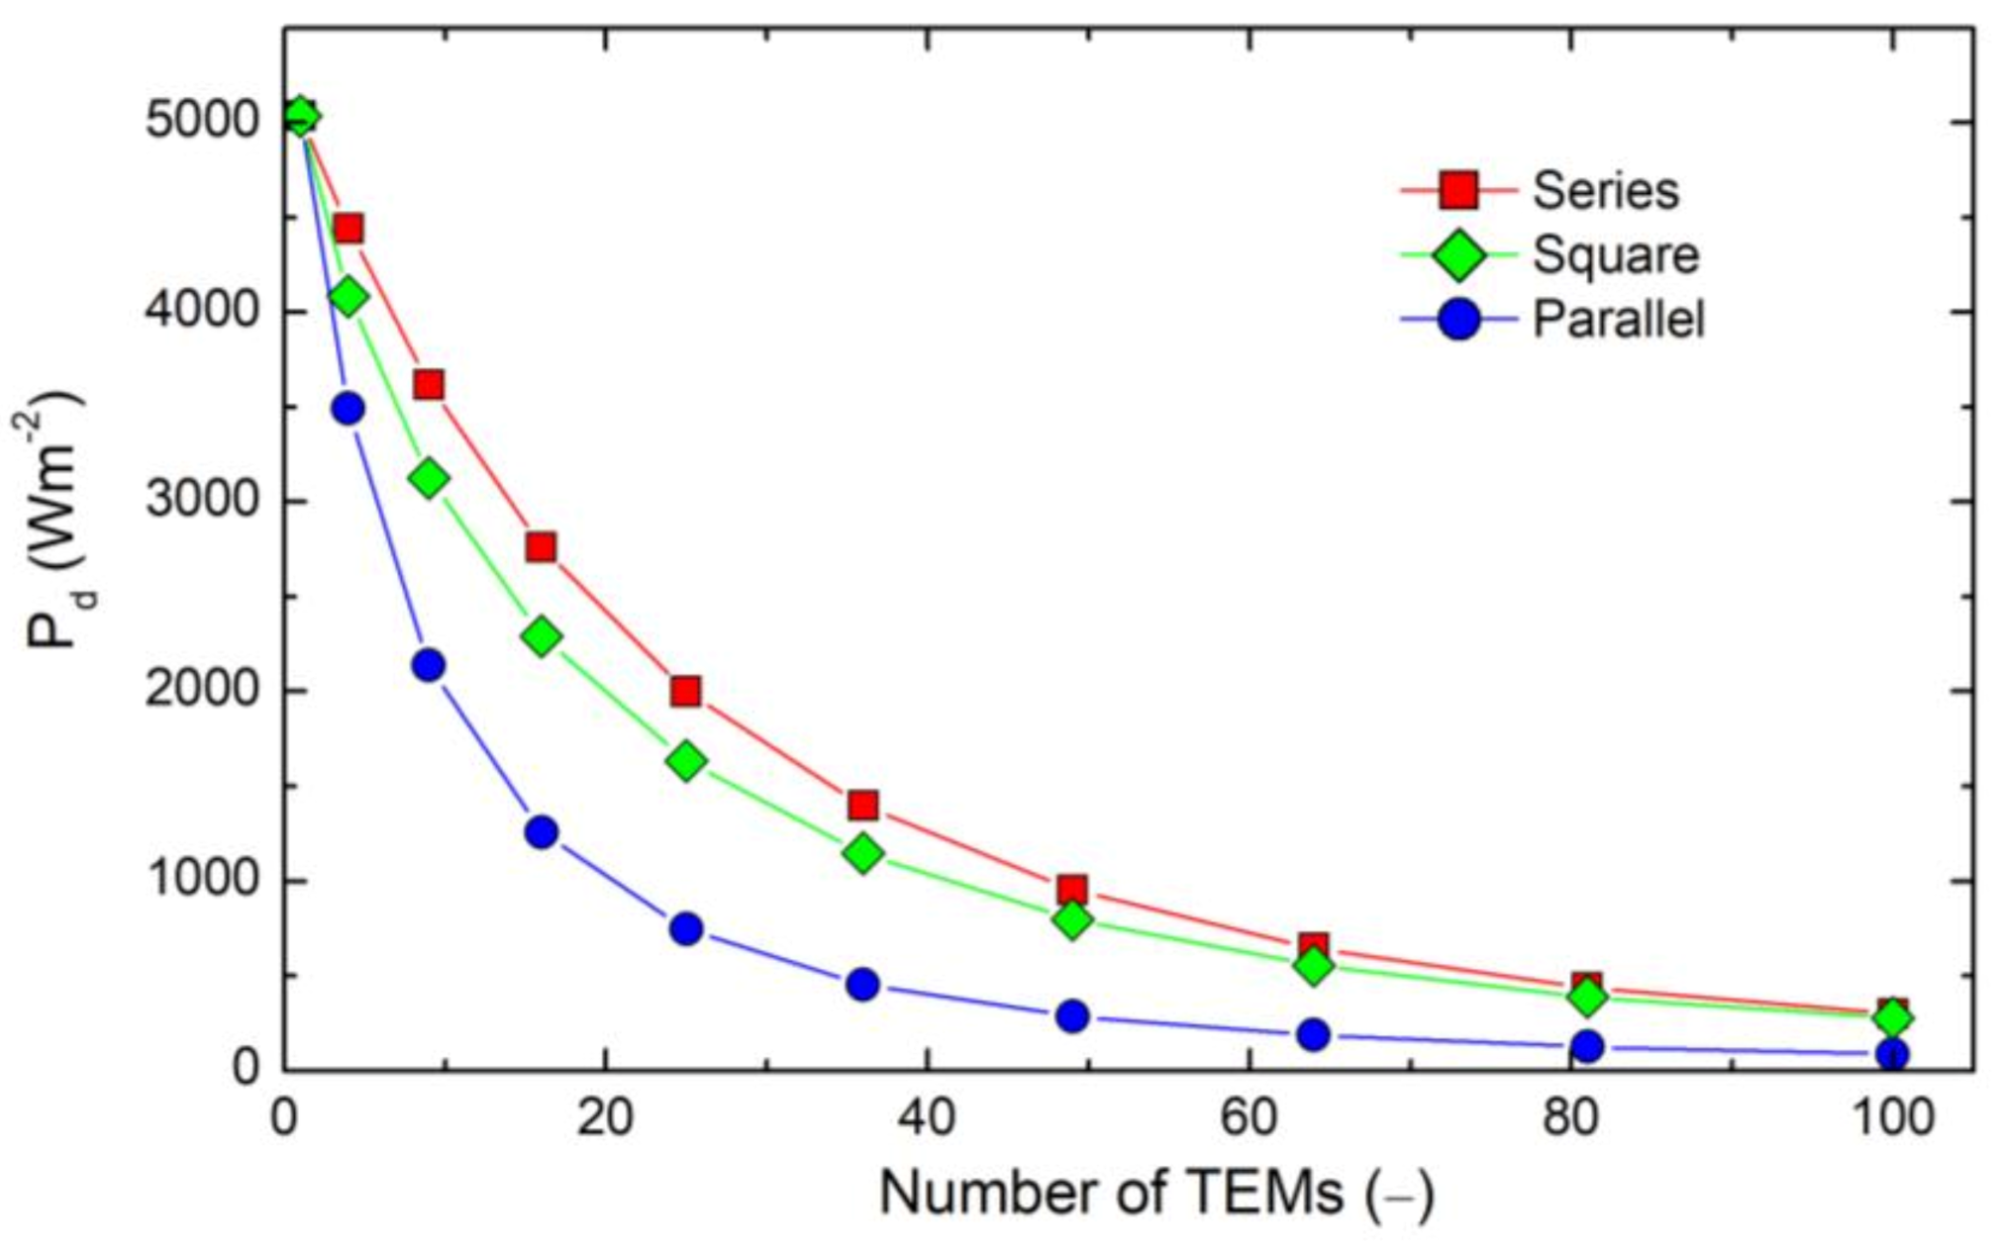
Besides the technical requirements for an easy integration into the vehicle system, the adoptability rate of ATEGs strongly depends on economic aspects. Above, we analyzed ATEGs that largely varied in the number of TEMs n T E M employed (from 1 to 100), so the question here was how did the cost of an ATEG increase as a function of n T E M ? To answer it, we calculated the output power density P d by dividing the total output power by the area occupied by TEMs in the ATEG. Since the solution sought intended to be general, final variables were normalized to a reference value. This was chosen as the case of an ATEG formed by a single TEM element (i.e., n T E M = 1), for which we obtained an output power of 8.1 W and 9.6 W under operating point #1 and #2 conditions, respectively. As expected, P d was maximum for n T E M = 1, decreasing with the number of TEMs (for operating point #1 data see Figure 10).
A non-linear fit was applied to the maximum power density data per ATEG shown in Figure 10 as a function of n T E M , giving P d = a + b e r n T E M with a = 517.45 Wm−2, b = 4696.62 Wm−2 and r = 0.04529 with a coefficient of determination R2 = 0.999. This expression was used to estimate the cost per watt of the ATEG as a function of n T E M . The manufacturing cost of the TEG depends on the number of TEMs employed. We assumed a linear relationship of the total cost c n as a function of n T E M , being c n = c a + n T E M c b where c b was the part of the cost directly proportional to the number of TEMs employed in the assembly (for example, direct cost of TEM units and cost of elements that were a function of the ATEG size, which is directly proportional to n T E M , such as the heat absorber, the water heat sink, minor wiring, etc.), whereas c a was the invariable, in terms of n T E M , contribution to the total cost (for example, openings and endings of the ATEG pipe, load resistance, main wiring, etc.). Then, the cost per watt was c n / P A T E G where, by definition of P d , the output power was P A T E G = n T E M A T E M P d with A T E M (= 40 × 40 mm) the surface area of a single TEM.
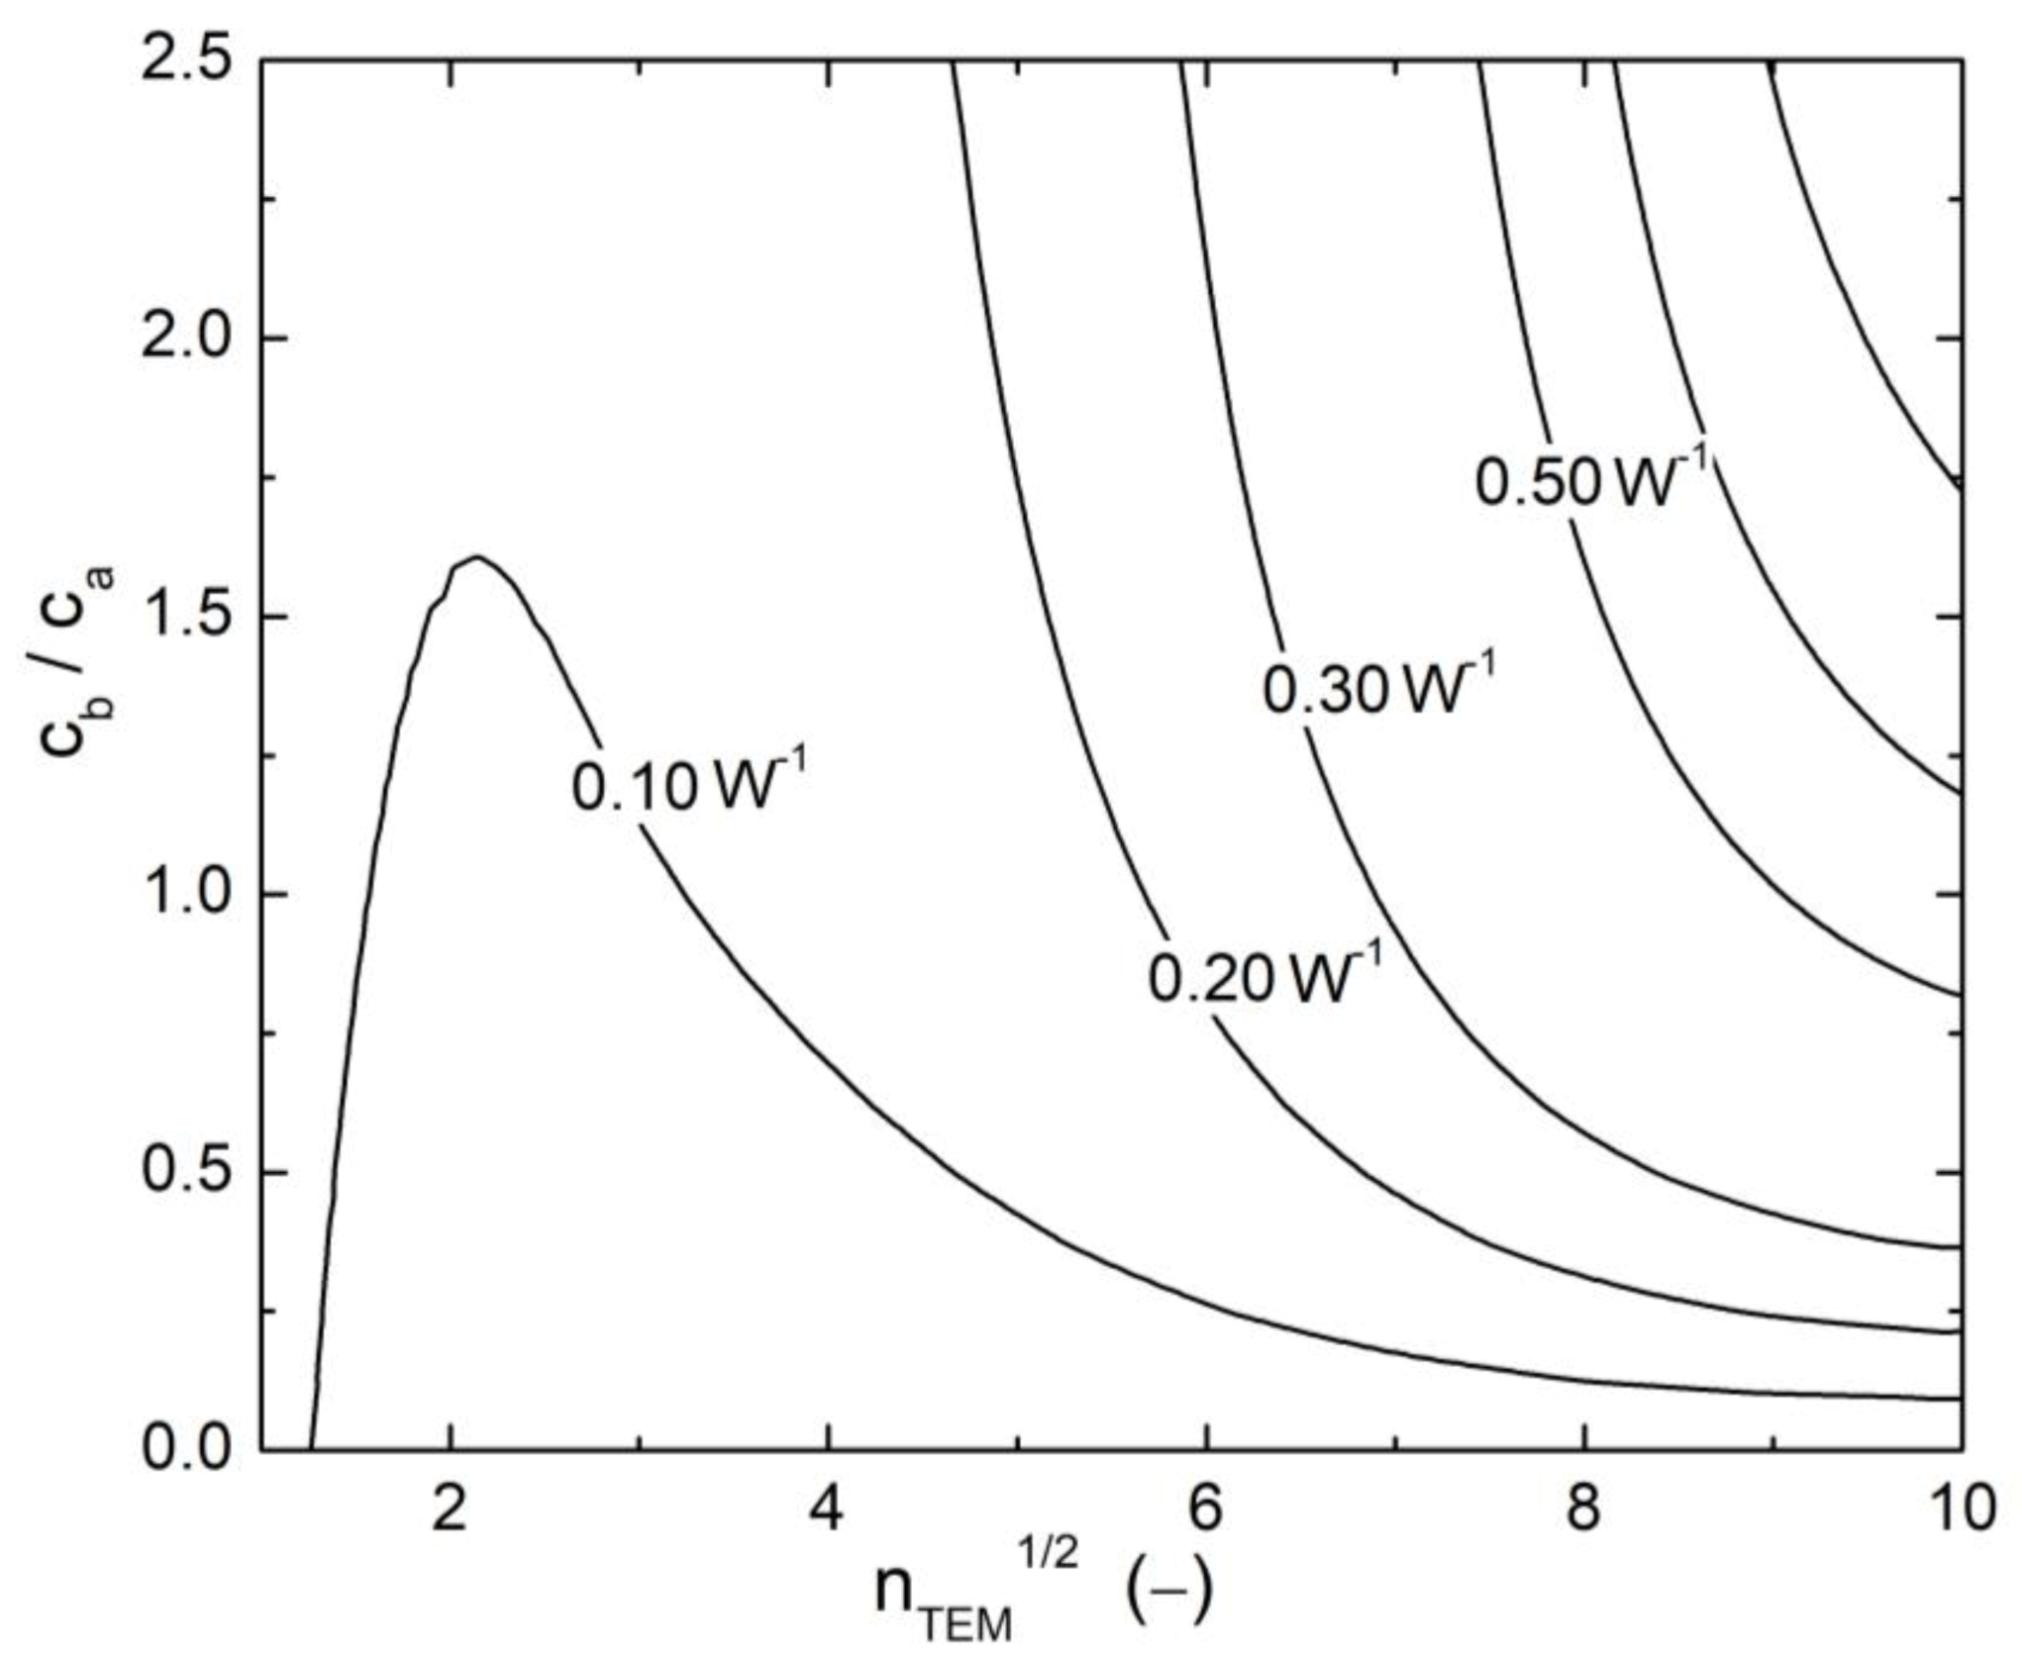
Figure 11 shows the cost per watt c n / P A T E G normalized to the cost of a TEG formed with a single TEM c 1 ,
c n c 1 P A T E G = c n c 1   n T E M A T E M P d = 1 + n T E M c b c a 1 + c b c a n T E M A T E M   P d
applying the P d function previously fitted to the series configuration at operating point #1. However, the conclusions extracted from this analysis were not limited to this particular case, since, from Figure 10, similar dependences of P d on n T E M were expected for different configurations and working conditions.
In the limit of an invariable cost tending to zero (or, conversely, of a very high proportional cost), c n / c 1 P = A T E M P d 1 whereas for high values of the invariable cost, the cost per watt tends to a constant value c n / c 1 P = n T E M A T E M P d 1 . The minimum cost per watt generated was found at low values of n T E M , but not at n T E M = 1. A good design strategy to reduce the cost per watt would rely on reducing the proportional cost c b as much as possible in order to be on the lower right region of Figure 11.

4. Conclusions

We analyzed the consequences of modifying the spatial distribution of individual TEMs in ATEGs on global energy conversion efficiency and electrical variables (current, voltage and external load resistance). Three different layouts were studied: series (TEMs arranged in a single row aligned with the exhaust flow direction), parallel (TEMs arranged in a single column along a cross-sectional plane of the exhaust pipe) and square (same number of TEMs in rows than in columns). The number of TEMs used in the ATEGs varied from 4 to 100. The electrical connections between individual TEMs followed the spatial configurations (series circuit for the series thermal; parallel circuit for the parallel thermal; column parallel and row series circuit in the square thermal). The external load resistance was tuned to maximize the output power in all configurations. Two working conditions were evaluated.
Results confirmed that the pure series topology provided a superior output performance in comparison with other configurations. However, a very rapid decline in TEM efficiency was observed towards the downstream end of the ATEG. In ATEGs with a high number of TEMs, TEMs located farther from the beginning (exhaust upstream) of the ATEG even reached negative efficiency values, penalizing the global performance of the system. In comparison, the square configuration had a remarkable lower variability, though its generation was around 20% lower. The parallel configuration provided uniform working conditions for all TEMs though generating on the order of 70% less than the series case for the same number of TEMs used.
For a fixed spatial configuration (series, square or parallel), the ATEG whose number of TEMs produced the uppermost output power had a global efficiency on the order of 3% independently of the layout. Thus, from the point of view of the global energy conversion efficiency, all configurations were very similar. The parallel case, for example, generated the less since it extracted the less energy from the exhaust gases. In some cases, this feature may be of interest in order to assure, for example, a minimum enthalpy of exhaust fumes at ATEG’s outlet.
Electrical output variables were monitored. Current through the load resistance and voltage at its ends for both series and parallel configurations had large variations depending on the number of TEMs employed in the ATEG. Values above 200 V and below 10 V (series) and above 30 A and below 5 A (parallel) were obtained when using different number of TEMs. However, the square configuration supplied on the order of 15 V and 5 A for most of n T E M values. In addition, the optimized load resistance value for this configuration required very small variations as a function of the number of TEMs employed. Finally, a cost analysis of ATEGs with different number of TEMs revealed the possibility of having a minimum cost per generated watt in ATEGs with low n T E M values.
The viability of an ATEG highly depends on its ability of being integrated into the vehicle management system. From the above, we recommend the square thermal configuration. In spite of its lower generation with respect to the series configuration, its nearly steady output of electrical variables regardless of the number of ATEGs used (or, equivalently, turned on), and its realistic physical dimensions makes it a reasonable candidate for this technology.
Author Contributions

Conceptualization, A.M. and E.M.; methodology, I.R.C. and T.P.; software, I.R.C.; validation, M.C.; formal analysis, T.P.; resources, L.M.; data curation, I.R.C.; writing—original draft preparation, T.P.; writing—review and editing, T.P. and L.M.; visualization, T.P.; supervision, J.R.G.; resources S.E. All authors have read and agreed to the published version of the manuscript.

Funding

Some authors wish to thank the financial support received to the project RECOVER-TE Waste thermal energy recovery in light duty vehicles. Technological impact. Ref.: RTI2018-095923-B-C21 and the doctoral fellowship provided by the University of Castilla-La Mancha to Samir Ezzitouni Zerhouni.

Institutional Review Board Statement

Not applicable.

Informed Consent Statement

Not applicable.

Data Availability Statement

Acknowledgments

Sergi Saus and Jordi Vicens provided very helpful technical assistance.

Conflicts of Interest

The authors declare no conflict of interest. The funders had no role in the design of the study; in the collection, analyses, or interpretation of data; in the writing of the manuscript, or in the decision to publish the results.

References

  1. European Commission. Clean Power for Transport: A European Alternative Fuels Strategy. Communication from the Commission to the European Parliament, the Council, the European Economic and Social Committee and the Committee of the Regions; COM (2013) 17; European Commission: Brussels, Belgium, 2013. [Google Scholar]
  2. European Comission. Available online: https://ec.europa.eu/clima/policies/transport_en (accessed on 14 March 2021).
  3. Rahman, A.; Razzak, F.; Afroz, R.; AKM, M.; Hawlader, M.N.A. Power generation from waste IC engines. Renew. Sust. Energy Rev. 2015, 51, 382–395. [Google Scholar] [CrossRef]
  4. Crystal Ltd. Available online: www.crystalltherm.com (accessed on 14 March 2021).
  5. Stobart, R.; Wijewardane, M.A.; Yang, Z. Comprehensive analysis of thermoelectric generation systems for automotive applications. Appl. Therm. Eng. 2017, 112, 1433–1444. [Google Scholar] [CrossRef]
  6. Massaguer, A.; Massaguer, E.; Comamala, M.; Pujol, T.; Montoro, L.; Cardenas, M.D.; Carbonell, D.; Bueno, A.J. Transient behavior under a normalized driving cycle of an automotive thermoelectric generator. Appl. Energy 2017, 206, 1282–1296. [Google Scholar] [CrossRef]
  7. Comamala, M.; Pujol, T.; Cózar, I.R.; Massaguer, E.; Massaguer, A. Power and fuel economy of a radial automotive thermoelectric generator: Experimental and numerical studies. Energies 2018, 11, 2720. [Google Scholar] [CrossRef] [Green Version]
  8. Fernández-Yáñez, P.; Armas, O.; Kiwan, R.; Stefaopoulou, A.G.; Boehman, A.L. A thermoelectric generator in exhaust systems of spark-ignition and compression-ignition engines. A comparison with an electric turbo-generator. Appl. Energy 2018, 229, 80–87. [Google Scholar] [CrossRef]
  9. Ezzitouni, S.; Fernández-Yáñez, P.; Sánchez, L.; Armas, O. Global energy balance in a diesel engine with a thermoelectric generator. Appl. Energy 2020, 269, 115139. [Google Scholar] [CrossRef]
  10. Frobenius, F.; Gaiser, G.; Rusche, U.; Weller, B. Thermoelectric generators for the integration into automotive exhaust systems for passenger cars and commercial vehicles. J. Electron. Mater. 2016, 45, 1433–1440. [Google Scholar] [CrossRef]
  11. Wang, Y.; Li, S.; Xie, X.; Deng, Y.; Liu, X.; Su, C. Performance evaluation of an automotive thermoelectric generator with inserted fins or dimpled-surface hot heat exchanger. Appl. Energy 2018, 218, 391–401. [Google Scholar] [CrossRef]
  12. Lan, S.; Yang, Z.; Chen, R.; Stobart, R. A dynamic model for thermoelectric generator applied to vehicle waste heat recovery. Appl. Energy 2018, 210, 327–338. [Google Scholar] [CrossRef] [Green Version]
  13. Deng, Y.D.; Zheng, S.J.; Su, C.Q.; Yuan, X.H.; Yu, C.G.; Wang, Y.P. Effect of thermoelectric modules’ topological connection on automotive exhaust heat recovery system. J. Electron. Mater. 2016, 45, 1740–1750. [Google Scholar] [CrossRef]
  14. Montecucco, J.; Siviter, A.R.; Knox, A.R. The effect of temperature mismatch on thermoelectric generators. Appl. Energy 2014, 123, 47–54. [Google Scholar] [CrossRef] [Green Version]
  15. Cózar, I.R.; Pujol, T.; Lehocky, M. Numerical analysis of the effects of electrical and thermal configurations of thermoelectric modules in large-scale thermoelectric generators. Appl. Energy 2018, 229, 264–280. [Google Scholar] [CrossRef]
  16. Stevens, R.J.; Weinstein, S.J.; Koppula, K.S. Theoretical limits of thermoelectric power generation from exhaust gases. Appl. Energy 2014, 113, 80–88. [Google Scholar] [CrossRef]
  17. Quan, R.; Tang, X.; Quan, S.; Huang, L. A novel optimization method for the electric topology of thermoelectric modules used in an automobile exhaust thermoelectric generator. J. Electron. Mater. 2013, 42, 1469–1475. [Google Scholar] [CrossRef]
  18. Fang, W.; Quan, S.H.; Xie, C.J.; Ran, B.; Li, X.L.; Wang, L.; Jiaho, Y.T.; Xu, T.W. Effect of topology structure on the output performance of an automobile exhaust thermoelectric generator. In Proceedings of the 2017 2nd Asia Conference on Power and Electrical Engineering (ACPEE 2017), Shanghai, China, 24–26 March 2017. [Google Scholar]
  19. Li, X.; Xie, C.; Quan, S.; Shi, Y.; Tang, Z. Optimization of thermelectric modules’ number and distribution patter in an automotive exhaust thermoelectric generator. IEEE Access. 2019, 7, 72143–72157. [Google Scholar] [CrossRef]
  20. Tao, C.; Chen, G.; Mu, Y.; Liu, L.; Zhai, P. Simulation and design of vehicle exhaust power generation systems: The interaction between the heat exchanger and the thermoelectric modules. J. Electron. Mater. 2015, 44, 1822–1833. [Google Scholar] [CrossRef]
  21. Quan, R.; Liu, G.; Wang, C.; Zhou, W.; Huang, L.; Deng, Y. Performance investigation of an exhaust thermoelectric generator for military SUV application. Coatings 2018, 8, 45. [Google Scholar] [CrossRef] [Green Version]
  22. Gamma Technologies LLC. Available online: https://www.gtisoft.com (accessed on 12 March 2021).
  23. Zhao, M.; Wei, M.; Song, P.; Liu, Z.; Tian, G. Performance evaluation of a diesel engine integrated with ORC system. Appl. Therm. Eng. 2017, 115, 221–228. [Google Scholar] [CrossRef] [Green Version]
  24. Zhao, R.; Li, W.; Zhuge, W.; Zhang, Y.; Yin, Y. Numerical study on steam injection in a turbocompound diesel engine for waste heat recovery. Appl. Energy 2017, 185, 506–518. [Google Scholar] [CrossRef]
  25. Massaguer, A.; Massaguer, E.; Comamala, M.; Pujol, T.; González, J.R.; Cardenas, M.D.; Carbonell, D.; Bueno, A.J. A method to assess the fuel economy of automotive thermoelectric generators. Appl. Energy 2018, 222, 42–58. [Google Scholar] [CrossRef]
  26. Comamala, M.; Cózar, I.R.; Massaguer, A.; Massaguer, E.; Pujol, T. Effects of design parameters on fuel economy and output power in an automotive thermoelectric generator. Energies 2018, 11, 3274. [Google Scholar] [CrossRef] [Green Version]
  27. II-VI Marlow. Available online: https://ii-vi.com/thermoelectrics/ (accessed on 12 March 2021).
  28. Kishore, R.A.; Priya, S. A reviw on low-grade thermal energy harvesting: Materials, methods and devices. Materials 2018, 11, 1433. [Google Scholar] [CrossRef] [PubMed] [Green Version]
  29. Du, Q.; Diao, H.; Niu, Z.; Zhang, G.; Shu, G.; Jiao, K. Effect of cooling design on the characteristics and performance of thermoelectric generator used for internal combustion engine. Energy Convers. Manag. 2015, 101, 9–18. [Google Scholar] [CrossRef]
  30. Kim, T.Y.; Negash, A.A.; Cho, G. Waste heat recovery of a diesel engine using a thermoelectric generator equipped with customized thermoelectric modules. Energy Convers. Manage. 2016, 124, 280–286. [Google Scholar] [CrossRef]
  31. Araiz, M.; Catalan, L.; Herrero, O.; Perez, G.; Rodriguez, A. The importance of the assembly in thermoelectric generators. In Bringing Thermoelectricity into Reality; IntechOpen: London, UK, 2018. [Google Scholar]
  32. Incropera, F.P.; DeWitt, D.P.; Bergman, T.L.; Lavine, A.S. Fundamentals of Heat and Mass Transfer, 7th ed.; John Wiley & Sons, Inc.: Hoboken, NJ, USA, 2007. [Google Scholar]
  33. Risseh, A.E.; Nee, H.-P.; Erlandsson, O.; Brinkfeldt, K.; Contet, A.; Frobenius, F.; Gaiser, G.; Saramat, A.; Skare, T.; Nee, S.; et al. Design of a thermoelectric generator for waste heat recovery application on a drivable heavy duty vehicle. SAE Int. J. Commer. Veh. 2017, 10, 26–44. [Google Scholar] [CrossRef] [Green Version]
  34. Massaguer, E.; Massaguer, A.; Pujol, T.; Comamala, M.; Montoro, L.; Gonzalez, J.R. Fuel economy analysis under a WLTP cycle on a mid-size vehicle equipped with a thermoelectric energy recovery system. Energy 2019, 179, 306–314. [Google Scholar] [CrossRef]
  35. Massaguer, A.; Pujol, T.; Comamala, M.; Massaguer, E. Feasibility study on a vehicular thermoelectric generator coupled to an exhaust gas heater to improve afterthreatment’s efficiency in cold-starts. Appl. Therm. Eng. 2020, 167, 114702. [Google Scholar] [CrossRef]
Figure 1. Cross-sectional view of the ATEG model (dimensions in mm).
Energies 14 02232 g001
Figure 2. Schematic view of the spatial distribution of individual TEMs in the ATEG for the (a) series configuration, (b) parallel configuration, and (c) square configuration. The example shown corresponds to the case with 4 TEMs.
Energies 14 02232 g002
Figure 3. Schematic view of the electric connections for (a) series, (b) parallel and (c) square configurations (all cases correspond to an ATEG with 4 TEMs).
Energies 14 02232 g003
Figure 4. (a) Heat flow at TEM hot side Q h , (b) output power of each TEM P , (c) temperature difference between the hot and the cold side of the TEM T T E M = T h T c , and (d) energy conversion efficiency η for each TEM as a function of the TEM position in the ATEG for series, square and parallel topologies (see Figure 2). Case corresponding to ATEGs with 64 TEMs ( n T E M = 64 ) for operating point #2.
Energies 14 02232 g004
Figure 5. Box chart of (a) output power P   and (b) energy conversion efficiency η datasets for series, square and parallel configurations for ATEGs using different number of TEMs ( n T E M from 4 to 100). Whisker ends correspond to maximum and minimum values of the dataset. The hollow square corresponds to the average value of the dataset.
Energies 14 02232 g005
Figure 6. ATEG output power P A T E G and ATEG energy conversion efficiency η A T E G as a function of the number of TEMs in an ATEG for operating points #1 and #2, using series, square and parallel configurations. (a) P A T E G and OP1, (b) P A T E G and OP2, (c) η A T E G and OP1, (d) η A T E G and OP2.
Energies 14 02232 g006
Figure 7. ATEG output power P A T E G as a function of the ATEG energy conversion efficiency η A T E G for operating conditions #1 (solid lines) and #2 (dashed lines), using series, square and parallel configurations. Numbers in italics refer to the number of TEMs n T E M used.
Energies 14 02232 g007
Figure 8. Load electrical resistance at the point of maximum output power for ATEGs with different number of TEMs using series, square and parallel configurations. Results for both operating points #1 and #2 are represented.
Energies 14 02232 g008
Figure 9. Voltage at the ends of the load resistance as a function of current through the load resistance at the maximum output power in ATEGs with different number of TEMs and using series, square and parallel configurations. Results under (a) operating point #1 and (b) operating point #2. Numbers in italics refer to the number of TEMs n T E M used.
Energies 14 02232 g009
Figure 10. Power density as a function of the number of TEMs employed in an ATEG (operating point #1).
Energies 14 02232 g010
Figure 11. Contours of cost per watt c n / P A T E G normalized to the cost of an ATEG formed with a single TEM c 1 ; units W−1, as a function of the proportional vs invariable cost ratio c b / c a , and of the square root of the number of TEMs n T E M used in the ATEG.
Energies 14 02232 g011
Table 1. TEM effective thermoelectric properties (Marlow TG12-8-01LS).
TEM Temperature Difference
(K)
Effective Seebeck Coefficient
(mVK−1)
Effective Electrical Resistance
(Ω)
Effective Thermal Resistance
(KW−1)
6054.502.211.20
12054.002.471.17
18052.392.771.13
Table 2. Model boundary conditions for the two operating points analyzed.
UnitsOperating Point #1Operating Point #2
Exhaust gas inlet temperatureK473.0489.6
Coolant inlet temperatureK293.0293.0
Exhaust gas mass flow rategs−119.133.8
Coolant flow ratels−10.10.1
Table 3. Error between simulated and manufacturer data of output power for a single TEM at different hot side temperatures ( T h ) with a cold side temperature T c = 323 K.
T h (K)Simulated Output Power
(W)
Datasheet Output Power
(W)
Error
(%)
3730.840.86−2.60
4032.052.040.55
4333.643.591.40
4635.445.390.95
4937.367.330.29
Publisher’s Note: MDPI stays neutral with regard to jurisdictional claims in published maps and institutional affiliations.