Abstract
The characterization of materials, stress and fatigue state monitoring based on the acoustoelastic principle are gaining widespread attention in recent years, mainly due to their advantages such as high sensitivity and non-destructive character. This article presents the application of a non-destructive acoustic method to test the degree of degradation of materials with which the heating boiler is coated. The combustion chamber is covered in materials when the temperature of the process itself increases, and has a very positive effect on fuel combustion. Unfortunately, with the passage of time, such materials undergo gradation. This article describes an innovative measuring system that has been successfully applied to monitor changes in resonance frequency under uniaxial compression in refractory grade material, which by definition is characterized by a high level of heterogeneity with a network of pre-existing cracks. The paper indicates that both stress and elasticity coefficients have an impact on the vibration frequency of the measuring system. Initial research was conducted to qualitatively determine the influence of these parameters on the measured frequency of the system.
1. Introduction
Refractory materials are designed to line high-temperature industrial furnaces and vessels used in several industries such as iron and steel, cement, glass, environment and energy. Their proper functioning has a crucial impact on the energy consumption, quality of the end product and process safety. In service, refractory materials experience complex thermo-mechanical loads, corrosion, abrasion or sudden impact, which inevitably lead to their gradual weakening and degradation. Adequate testing, lifetime prediction and monitoring of materials working in the harsh, high-temperature environment continue to be a challenge and is one of the main obstacles for complete process digitalization in high-temperature processes industries [1].
In general, refractories fall into two categories: either shaped and monolithic (unshaped) materials; the latter group is continually gaining its share in the global refractories market [2]. Belonging to the group of monolithic materials, refractory concretes are increasingly installed in various applications such as steel ladles, boilers and waste incinerators. From the microstructural point of view, refractory concrete may be considered as a composite containing a fine bonding fraction being the matrix that is reinforced with aggregates. One of the essential features of refractory concretes or refractory materials, in general, is their inhomogeneous character and high concentration of discontinuities such as microcracks and pores. Even though much progress has been made with the design of advanced bonding systems, most refractory concretes are still bonded with Calcium Aluminate Cement (CAC). Microstructural evolution taking place during subsequent stages of CAC hydration and dehydration due to thermal treatment is a complex phenomenon, which influences the state of the discontinuities, the final properties and concrete performance in service [3].
Materials characterization, stress and fatigue state monitoring based on acoustoelastic principles are gaining widespread attention in recent years, mainly due to their advantages such as high sensitivity and their non-destructive character. Acoustoelasticity, by definition, refers to the change in velocity of an acoustic wave with applied stress. Therefore, this principle may constitute the base for advanced stress change monitoring systems. Additionally, recent studies led to considerable progress in understanding the potential of the acoustoelastic response in the assessment of material properties and fundamental structural studies [4]. Despite the undisputed advantages of monitoring systems based on acoustoelastic principles, only a few researchers attempted to implement them to the fundamental structural studies coping with ceramic materials or their fatigue state monitoring [5]. Still, most investigations dealing with acoustoelasticity concern only basic metallic materials and an enormous scientific potential originating from its possible applications are still unexploited in the field of refractories and broad ceramic science. One of the main obstacles while applying monitoring systems based on the acoustoelastic principle to the studies on refractory materials is the lack of fundamental knowledge about dominant factors influencing nonlinear acoustoelastic behavior in polycrystalline ceramic materials, and a high level of heterogeneity [6].
This paper presents the results of an experimental study aiming to verify the utility of Self-Excited Acoustical System (SAS) in stress changes monitoring in refractory grade material, which by definition is characterized by a high level of heterogeneity with a network of pre-existing cracks. Another objective of this research was to investigate whether the determined stress–frequency relation depends on the material’s microstructure and thermal history. Initial trials were conducted to introduce an alumina waveguide to SAS, which was intended to be the first step in the system adaptation for the resonance frequency monitoring in a hostile and high-temperature environment.
2. The Self-Excited Acoustical System (SAS) for Indirect Stress Changes Monitoring
Developed at the Department of Process Control, AGH University of Science and Technology, the Self-Excited Acoustical System (SAS) utilizes the elastoacoustical phenomenon for indirect stress changes monitoring and implements the self-excitation phenomenon to achieve a higher level of sensitivity.
Acoustoelasticity originates from an interaction between acoustic wave and elastic deformation in a solid, resulting in a wave speed change. The relation between the change of wave’s speed and the stress level is generally known as the acoustoelastic effect [7] and in the case of isotropic solid can be expressed by (1).
where:
- —wave velocity of the stresses sample [],
- —wave velocity of unstressed sample [],
- —acoustoelastic coefficient [],
- —stress [].
The SAS system, such as any self-excited system, has four basic elements (Figure 1):
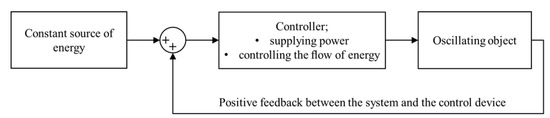
Figure 1.
Diagram of a self-excited system.
- the energy source (constant),
- oscillating object,
- energy supply regulator for an oscillating object,
- positive feedback loop.
This energy loop increases the vibration amplitude and achieves a stable limit cycle with enhanced sensitivity to load changes.
The Self-excited Acoustical System is formed from a vibration exciter distanced from the receiver or eventually formed in one head. Both of them are coupled by a proper power amplifier via positive feedback closed control loop. The SAS system diagram is shown in Figure 2. This configuration made it possible to generate self-excited vibrations of a resonance frequency. Determined by SAS, the change of resonance frequency of the system correspond to the change of the wave’s speed and varies with the loading level, in line with the electroacoustic effect.
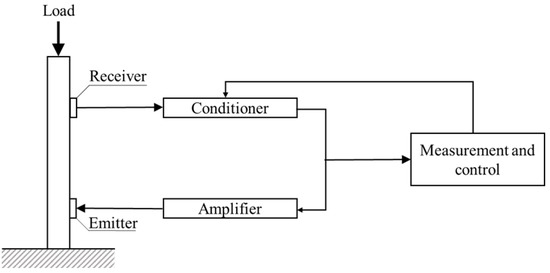
Figure 2.
The SAS diagram.
3. Research Methodology
To provide the details of the proposed system and its novelty, it is necessary to have a more detailed understanding of the existing systems using the elastoacoustic effect. Basically, there are two measurement methods so far. The first method refers directly to measuring the acoustic wave’s speed passing through the material [8,9,10,11]. The second method is to investigate the resonant frequencies in an open system. Both of those methods have some measurement disadvantages for ceramic materials. In the direct measurement of the acoustic wave passage velocity method, [12] points out that each microcrack affects the acoustic wave velocity. Besides, the change in stress causes new microcracks to open and further complicates the results’ interpretation. This is confirmed by the mathematical model presented in [13]. The dispersion effect is further applied [14]. As indicated by [15], the variation of the value of the acoustic wave velocity change is difficult to detect precisely because of dispersion. Of course, the method’s indicated inconveniences have proven effective in the ultrasonic detection of defects in a wind turbine [16]. Nevertheless, for concrete materials, these are a significant disadvantage and usually require very sensitive measuring tools and very precisely prepared samples [12,17,18]. The second method in use involves open-circuit frequency measurements [19]. This paper, and the studies presented in [9,10,20], discuss ways to avoid dispersion problems and the occurrence of microcracks. One way to increase the quality of the measurement is to use higher excitation frequencies, i.e., to work in higher modes of the natural frequencies. Unfortunately, depending on the type of material, this leads to severe distortions of the results related to, e.g., the nonlinearity of the elastoacoustic effect [14]. The SAS system’s novelty is the use of a positive feedback loop and the study of the resonant frequency of the self-excited system rather than the natural frequency in the material. Analyzing Figure 1 shows that in a self-excited system, a nonlinear valve (regulator) must be present to supply an appropriate dose of energy to the vibrating system. Hence, it is straightforward to mistake the vibrating system and the tested vibrating concrete, which is also vibrating. However, to standardize the test stand’s description, it is necessary to state the principle of the self-excited system without the concrete object under test. For this purpose, an example referring to a scientific conference is used. If any loudspeaker is coupled to a microphone, the effect will be the excitation of a sound of relatively high frequency if only the microphone has the appropriate sensitivity and the loudspeaker has the appropriate volume. The coupling element is the air between the speaker and the microphone and the electronic circuit between the microphone and the speaker. The acoustic wave frequency depends on the delays in the electrical positive feedback path and the gain of individual components. A third component that affects the frequency of such an acoustic wave is the distance between the transmitter and the receiver. It is not difficult to encounter such an example, e.g., during a conference, when a presenter with a microphone comes too close to the speakers. This produces quite a characteristic noise in one dominant frequency, even though the sound from the speaker spreads, shatters into irregular shapes and generates reflections, e.g., from walls. The system shown in Figure 3 shows that the tested object is precisely the regulator for the self-excited system emitter–receiver, that is, in simple terms, the medium that induces the transmission and inflow of energy to the receiver. The research presented in [7] proved that the most crucial parameter that is significant in determining the frequency of the self-excited system (not the natural frequency of tested material) is the delay of the acoustic wave passage regulator. This transition time is strongly affected by the elastoacoustic coefficient and the stresses in the tested material. Considering the fact that the limit cycle frequency of the SAS system is measured, and not the natural frequency of the cement system, the frequencies achieved are much lower than those at which the nonlinearities of the elastoacoustic coefficient, as defined at least in [14], would have to be taken into consideration. The second problem that the SAS system eliminates is the one related to wave dispersion in the concrete. In classical methods, whether those are related to the passage of the wave and examination of its velocity or the passage of harmonic signals and examination of the spectrum, dispersion is an undesirable phenomenon and disturbs the results. In the SAS system, dispersion affects the result only during excitation, while after reaching a stable limit cycle, it does not affect the obtained results [21]. An example of the system excitation waveform in the time domain is shown in Figure 4. The dispersion of the waveform entering as a pulse or finite harmonic signal affects its ability to be correctly interpreted at the receiver. The same happens when the SAS system achieves a stable limit cycle for a given form of vibration, which rises to the proper amplitude and frequency but does not affect the limit cycle’s frequency. Another advantage of the SAS system over classical methods is the excitation for the dominant energy input flow channel. In the conference room example, the system frequency depended mainly on the straight-line transmission between the speaker and the microphone, even though the microphone also received reflected waves from various obstacles and walls. In the case where the controller is a concrete sample in which there are transverse waves, longitudinal waves, surface waves formed on microcracks (which may additionally open or close under the influence of an external load), it is still the wave that transmits the highest energy that has the most significant influence on the frequency of the limit cycle. Of course, this can cause the limit cycle itself to change drastically when transverse and longitudinal waveforms have similar energy at a given load, but this effect can be minimized by properly filtering the system’s electrical part.
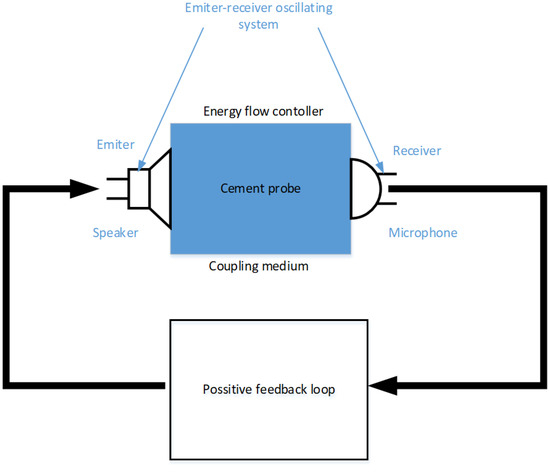
Figure 3.
Test sample as a regulator of energy inflow to the SAS system.
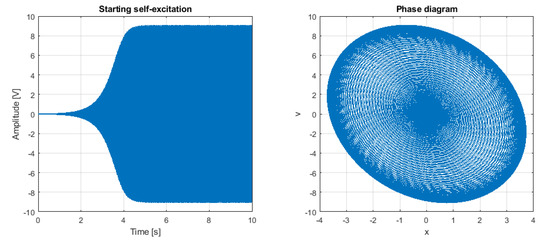
Figure 4.
Example of excitation progress of the SAS system and its limit cycle.
Therefore, the innovation of the SAS system is that, in contrast to classical methods, we do not directly measure the natural frequency of the tested cement sample. Neither is the velocity of the acoustic wave that propagates through the test sample directly measured. Only the self-excited system’s frequency depending on the elastoacoustic constant and stress in the tested material is measured. This eliminates problems associated with dispersion or the presence of microcrack.
Typical results obtained during SAS monitoring, where the resonance frequency shift with the stress level change, are presented in Figure 5.
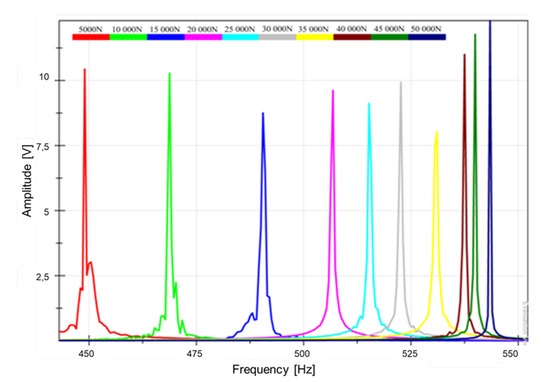
Figure 5.
The shift in the resonance frequency for a steel beam related to the change of stress.
Previous successful applications of the SAS in stress changes monitoring include both real objects such as tower crane mast [22], rock bolt support in the underground mine [23], the leg of the silo [24] as well laboratory tests of metals in tension [25], sandstones and ordinary concretes in compression. Up to now, no trials have been conducted that incorporate SAS as a microstructural characterization technique.
4. Experimental
4.1. Materials Preparation and Characterization Techniques
Samples with different thermal histories were prepared from industrially available concrete bonded with Calcium Aluminate Cement (CAC) and based on Tabular Alumina aggregates. The investigated castable consisted mainly of AlO—93.2 wt%, MgO—4.51 wt%, CaO—1.59 wt% and the impurities being FeO —0.21 wt%, NaO—0.17 wt%, SiO—0.14 wt%, KO—0.08 wt%. Two prismatic samples (231 × 80 × 67 mm) were cut from the as-delivered, bigger concrete block after curing and drying (24 h at 110 °C) procedure. One of the samples was sintered at 1200 °C with 2 h soaking time in order to decompose the hydrate system and develop the ceramic bond. The second sample was left in a dried state. Therefore the sample’s strength was imparted mainly by the hydraulic bond. The microstructural characterization of materials with different thermal histories was realized with a Scanning Electron Microscope (SEM) type Zeiss GeminiSEM 500 equipped with an EDX detector (Energy-Dispersive X-ray Spectroscopy). Resonance frequency, dynamic Young’s modulus and damping value were characterized non-destructively via the impulse excitation technique from flexural vibrations using the Resonance Frequency Damping Analyzer (RFDA System 23) provided by IMCE, Belgium and with a resonance frequency measurement device (GHI self set-up). Both techniques are commonly used to determine Young’s modulus value and are described elsewhere [26,27] Samples for SAS monitoring, working in conjunction with alumina waveguides were prepared from low cement refractory concrete with a composition described in greater detail in [28] Here it will be only recalled that the concrete composition is based on Tabular Alumina aggregates embedded in alumina fines and bonded with CAC. After casting, concrete samples were cured for 48 h in a humid environment, dried at 110 °C for 24 h and sintered at 1500 °C with 6 h, which favored the development of the strong and uniform ceramic bond.
4.2. SAS Resonance Frequency Monitoring for Concrete Samples with Different Thermal History
SAS monitoring was carried out on the samples during cyclic compressional loading by a hydraulic jack in the range from around 90 to 1500 kg, which corresponds approximately to 0.17 and 2.8 MPa concrete stress. The self-excitation resonance frequency was determined in loading steps of 100 kg average. The SAS set-up was comprised of an emitter and a receiver (accelerometer IMI 623C01) placed at a distance that constituted the system’s core. SAS monitoring was conducted in two configurations that differ in the type of emitter. In the first one, an acoustic emitter (vibro speaker EasyTouch 360° Omni-Directional) was used to excite the samples, whereas in the second one, a piezo emitter was used. The power amplifier (HVA-B100-2i), the emitter, the accelerometer and the conditioner (VibAMP PA-3000) were used in the positive feedback loop. Data acquisition and display were performed using a computer with LabVIEW software. Before the loading procedure, the self-excitation resonant frequency was determined in both configurations.
4.3. Introduction of Alumina Waveguide to SAS
The concept of alumina waveguide connecting the measurement system and a sample under investigation is quite common in multiple high-temperature monitoring systems [29]. The fundamental role of an alumina waveguide is to transmit acoustic signal from the emitter to the sample and as well from the sample to the receiver while ensuring high dimensional stability. In the initial stage of adaptation, three system configurations were tested in order to investigate if alumina waveguide can be incorporated into the SAS without any detrimental effect on the system features. The first set of measurements was conducted in reference, standard SAS configuration, where an acoustic emitter (ET-5018 Dancer Classic) and receiver (accelerometer IMI 623C01) are directly placed on the sample. To the second intermediate configuration, one alumina waveguide was introduced, connecting the emitter and a sample, whereas in the last third configuration, both emitter and receiver were separated from the sample through a waveguide. SAS arrangement in the last two configurations is presented in Figure 6. In all three configurations, SAS monitoring was carried out on the concrete samples during cyclic compressional loading by a hydraulic jack in the range from around 90 up to 5000 kg. The main parameters of the exciters were presented in Table 1.
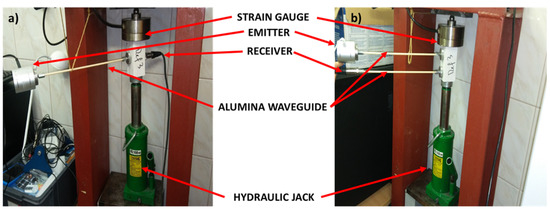
Figure 6.
The SAS arrangement working with (a) one waveguide and (b) two waveguides.

Table 1.
Electrical and mechanical parameters of the emitters.
Additional tests were carried out for different emitter types with different electromechanical constants, reinforcements and processing times. For each emitter type, the first step was to conduct the measurement in an open system loop. This measurement’s methodology consisted of introducing a chirp-type signal into the tested sample and measurement of the system response through an accelerometer. This signal was not reintroduced into the emitter, so we can talk about open-loop measurement. The measurement was made for several loads of concrete samples.
5. Results
5.1. Load and Resonance Frequency Characteristics of Materials with Different Thermal History
The SEM images of refractory concrete samples before and after sintering are presented in Figure 7a–d, respectively. As can be seen, in the case of material before sintering, the bonding phase is composed of the CAC’s hydration products, hydrated dicalcium aluminate 2CaO · AlO· 8HO (CAH) and Al(OH) (AH), which are uniformly distributed within the concrete’s matrix. Clearly visible changes in the microstructure are observed in the case of the material after thermal treatment, where a network of microstructural defects, pores and cracks developed as an effect of conversion, dehydration and sintering phenomena. In the case of the material after sintering, the main bonding phase constitutes the monocalcium aluminate CaO · AlO or CA. The hydrated dicalcium aluminate 2CaO · AlO 8HO (CAH) and Al(OH)(AH) are the main hydration products of CAC cements usually developing after 24 h of curing in room temperature. The chemical composition of the hydrated phase (Figure 7b was additionally analyzed with EDS, which confirmed the bonding phase being the 2CaO · AlO 8HO(CAH) and Al(OH)(AH).
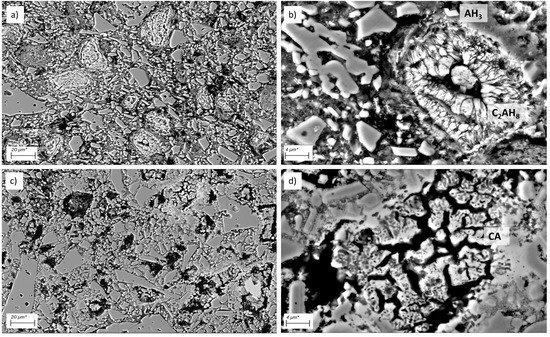
Figure 7.
SEM images of (a,b) concrete sample before sintering and (c,d) concrete sample after sintering emitter.
The volumetric densities, the determined resonant frequencies, dynamic Young’s modulus and damping value of samples in the unloaded state are summarized in Table 2. As expected, concrete sample after sintering is characterized by a higher Young’s modulus value and accordingly higher values of resonant frequencies. Additionally, in the case of the sintered material, the damping value is higher, which corresponds to the state of grain boundaries and discontinuities level. Fundamental resonant frequency determined by impulse excitation technique is performed in a flexural mode of vibration, whereas it is performed by a resonance frequency device in the longitudinal mode. In SAS, there is a multitude of waves propagating throughout the system simultaneously. Therefore, SAS does not oscillate in one specific mode.
Table 2.
Parameters of the unloaded material determined by the Resonance Frequency and Damping Analyzer (RFDA), the resonance frequency technique and the Self-Excited Acoustical System (SAS).
Characteristics of the resonance frequency in a function of load for non-sintered and sintered refractory concrete samples determined using the SAS system equipped with the acoustic emitter are shown in Figure 8 and Figure 9, respectively. As can be seen, the load variation induces the change of the system’s oscillation frequency, which in the investigated loading range, is fully reversible and replicable. In both cases, the characteristic exhibits strong nonlinear character, whereas this effect seems to be more pronounced for the concrete sample after sintering.
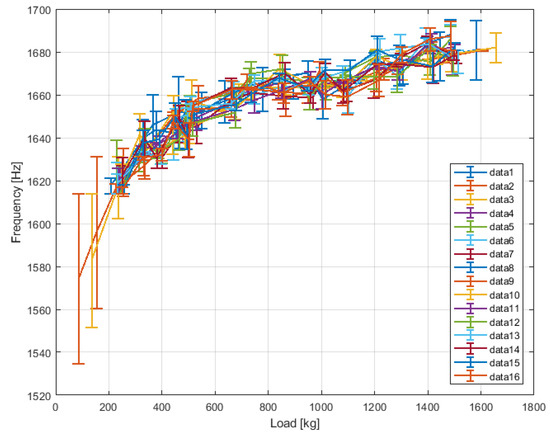
Figure 8.
Dependence of the resonance frequency in the function of load for non-sintered sample determined with the use of acoustic emitter.
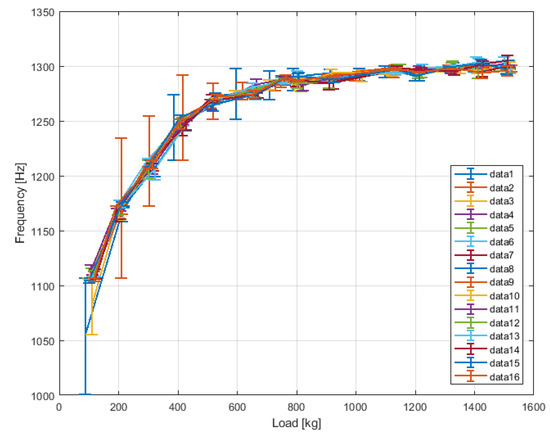
Figure 9.
Dependence of the resonance frequency in the function of load for sintered sample determined with the use of acoustic emitter.
Load and resonance frequency characteristics obtained with the piezo-emitter are presented in Figure 10 for non-sintered and sintered sample. In the second configuration, SAS monitoring was only possible up to 800 kg. For higher loading levels, we observed multiple step changes of the frequency, which made it impossible to conduct any comparative study above this load level. In order to compare the frequency variation determined with the use of acoustic and piezo-emitter, the relative change of frequency was calculated for the two loading ranges: 100–1500 kg and 100–800 kg. Summarized results are presented in Table 3.
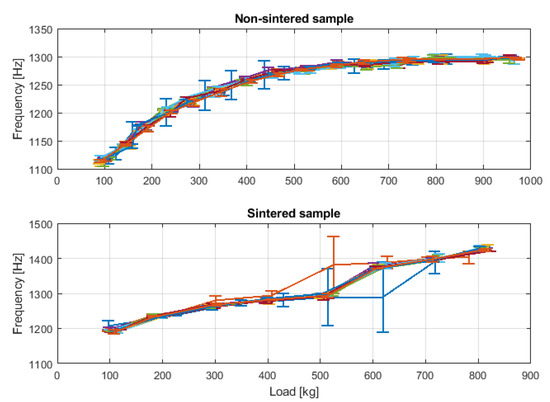
Figure 10.
Dependence of the resonance frequency in the function of load for non-sintered and sintered sample determined with the use of piezo-emitter. Green and blue curves correspond to the subsequent measurements.
Table 3.
Relative change of resonant frequency versus load determined by SAS working in two configurations with acoustic and piezo-emitter.
5.2. Resonance Frequency Monitoring with SAS Working in Conjunction with Alumina Waveguide
The load–resonance frequency characteristics obtained during cyclic compressional loading determined by SAS working in three configurations are presented in Figure 11. In reference, standard SAS configuration load variation induces the oscillation frequency system’s change in the range of 1380 and 2050 Hz, with the characteristic exhibiting a typical nonlinear character. In the case of the second intermediate configuration with one alumina waveguide connecting the emitter and a sample, basically no change in the determined characteristic can be observed, compared to the standard SAS configuration. Results obtained with the third configuration, where both emitter and receiver are separated from the sample through a waveguide are shifted to the higher frequency level and exhibit different character. Above 1500 kg, no significant change in resonant frequency with increasing load can be observed.
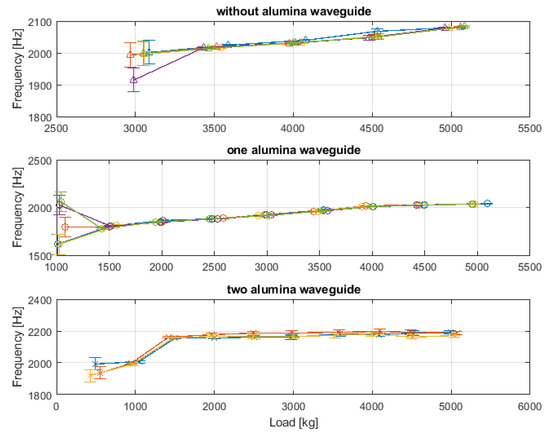
Figure 11.
Dependence of the resonance frequency in the function of load determined by SAS working in three configurations: without alumina waveguide; with one alumina waveguide connecting the emitter and the sample; with two alumina waveguides connecting both emitter and receiver with the sample. Green and blue curves correspond to the subsequent measurements.
Exemplary results for one emitter in the frequency domain are shown in Figure 12. Within it, a few resonance peaks are visible, including some at constant distances. The results from additional tests of self-excitation for different emitters are shown in Figure 13. As can be seen, each emitter produces a similar response; however, their values differ. The load and resonance frequency characteristics for the second and third emitters are moderately similar, but a shift in values can be observed.
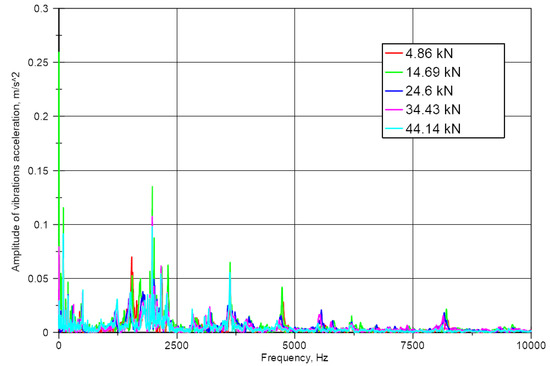
Figure 12.
Dependence of the resonance frequency for different sample load determined by SAS using a piezoelectric actuator.
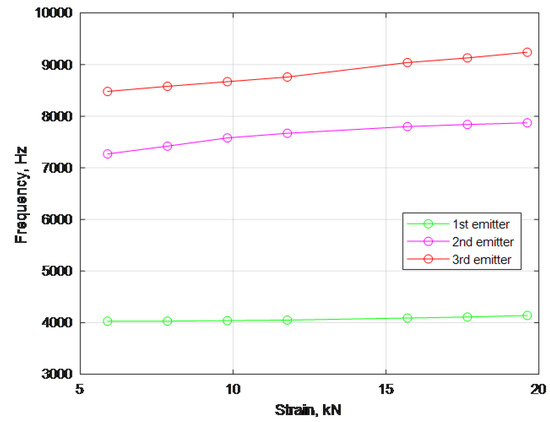
Figure 13.
Dependence of the resonance frequency in the function of sample load determined by SAS working with three emitters.
6. Discussion
6.1. Influence of the Thermal History on the Load and Resonance Frequency Characteristics
As expected, the presented results clearly reveal stress-dependent resonance frequency. A similar trend for concrete under compressional load was found in the resonance acoustic study [30] and in multiple ultrasonic investigations [31,32,33,34]. From the theoretical point of view, considering only acoustoelastic behavior, the change in ultrasonic velocity and consequently, resonance frequency should be linear with the applied load. Nevertheless, purely acoustoelastic behavior of concrete has been rarely reported in the literature and if, only in the very initial stage of loading [35]. The prevailing nonlinear behavior was explained [30] by the fact that concrete is an inhomogeneous material that contains a significant number of discontinuities such as microcracks. In the initial loading phase, some of the microcracks close, resulting in an increase of elastic modulus and resonance frequency. Therefore, the total acoustoelastic effect is a superposition of two phenomena: the macroscopic phenomenon originating from the acoustoelastisity and the second microscopic phenomenon from the crack closure, which in the case of heavy microcracked material may constitute the significant contribution.
The obtained resonance frequency and load characteristics in the initial state of loading revealed a more substantial acoustoelastic effect for refractory concrete after sintering. A higher increase of resonance frequency with load in the sintered sample may be explained by a higher concentration of discontinuities such as microcracks and pores, which developed mainly due to conversion, dehydration and sintering phenomena. Additionally, in the case of multiphase materials such as refractory concrete, microcracking is an inevitable process that usually occurs during the cooling stage of sintering due to the thermal expansion mismatch of constituents [36]. This statement that material after sintering is characterized by higher level discontinuities is supported by the obtained damping values. Despite the fact the material after sintering exhibited higher Young’s modulus value, which reflects the change in bond type from hydraulic to ceramic and its strength, it also developed higher damping properties. It is well known that damping is a microstructure sensitive parameter depending largely on crack density, which has been demonstrated to be true also for refractory grade concretes [37].
Crack closure characteristics and their influence on the general acoustoelastic effect depend on the type of material, crack distribution, orientation, and shape. In the case of ordinary concretes, it has been reported, that crack closure largely determines the acoustoelastic material response up to 30–35 % of the ultimate compressive strength [34]. After this stage, when most of the cracks are closed, the concrete stats exhibit the typical linear behavior of an uncracked medium, which is characterized by a change in the slope of the wave velocity–load curve. Similar behavior can be clearly observed in load–resonance frequency characteristic of the sintered material determined with the use of acoustic emitter (Figure 9) and non-sintered material with the use of piezo-emitter (Figure 10).
The presented results of load and resonance frequency obtained with SAS working with acoustic and piezo-emitter for sintered and non-sintered material clearly showed that both types of emitters enable proper resonance frequency monitoring in the initial state of loading. The relative change of resonant frequency versus load for the sintered sample was at a similar level for both types of emitters. In the case of the non-sintered material, the discrepancy in the relative change of resonant frequency between the acoustic and piezo-emitter may be explained by the fact that SAS does not oscillate in one specific mode. The change of the emitter could result in the change of the main oscillation mode, and as it has been demonstrated in [30] different types of waves may exhibit distinct sensitivity to microcrack closure.
6.2. Introduction of Alumina Waveguide to SAS
Each SAS configuration made it possible to observe strong nonlinear behavior in the initial state of loading. The nature of self-excited vibrations can easily explain the effect of nonlinearity. It is a natural feature related to the requirements for their creation.
An important issue related to self-excitation systems is the phenomenon of the boundary cycle. The boundary cycle occurs when the system will vibrate in a steady state. The energy balance will be zero when the system draws as much energy as it will lose. The vibrations will remain unchanged. The situation in which there is an excess or under-supply of energy is shown in Figure 14. Figure 14a shows that, the more energy supplied (), the amplitude increases to the value A until the balance is zero. For , the amplitude will decrease to the same A value. There are also more complex situations. Figure 14b shows that there may be more equilibrium points: here, for example, three. First, at the beginning of the coordinate system and the second and third for amplitudes A and B. The amplitude increases or decreases depending on which part of the graph the system is located in. The second graph presents the difference between a steady and a non-steady cycle. The cycle for amplitude A can be called stable because the amplitude around point A is heading towards it. The amplitude B is of the unstable cycle. This area behaves in exactly the opposite way as around the A point—amplitudes greater than B increase even further, and smaller ones decrease, in this case to A [38].
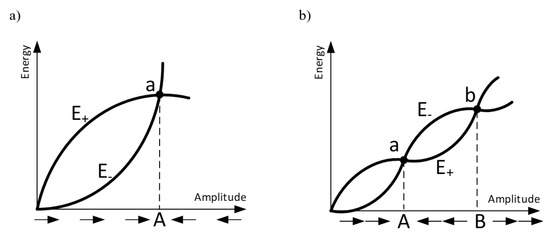
Figure 14.
Energy flows during vibrations for (a) one stability point; (b) multiple stability points.
As shown in works [7,22] the frequency of the self-explanatory system depends on the mathematical root of the stress , hence the course of the presented frequency characteristics can be explained by Equation (2).
where:
- —frequency of the SAS system [],
- —time constant for the measurement stand [s],
- —delay time for wave transmission between the emitter and receiver [s],
- —dumping coefficient [−].
Unfortunately, the characteristics do not explain the frequency shifts. In understanding this phenomenon, the interpretation of the characteristics in Figure 10 can be beneficial. These resonance peaks result directly from the principles of mechanics because they are directly responsible for the subsequent vibration forms of the material under test. Additionally, several other resonant peaks are observed for frequencies from about 1 to 2.5 kHz. These are resonances of the reflected waves inside the material. It shows that the obtained results are strongly influenced by the parameters of the sample, such as e.g., the material or the shape and geometric dimensions. However, it is clear that the frequencies for the open-loop system’s maximum amplitude are significantly distant from each other.
During this preliminary research, an attempt was made to determine if and how the self-excited system’s frequency is affected by the stress of the cement sample being tested. Besides, sintered and non-sintered specimens have a different structure and thus a different elastoacoustic coefficient, which affects the frequency of the self-excited system. Hence, during the samples’ initial examination, an attempt was made to investigate these differences empirically. Nevertheless, the type of exciter used and the type of its coupling to the material under test is the most significant for the limit cycle. As shown in Figure 13, each of the emitters produced a similar response, however, they differed in values. The second and third emitters’ plots are moderately similar, but the first emitter’s plot has much lower values. It is worth noting that two similar results were obtained for the most similar equipment. The values obtained for two piezo-emitters with the same operation principle and similar power are the most consistent ones. A third electromechanical emitter of lower power caused vibrations of much lower frequencies. This difference was caused not only by lower power but also lower emitter mass and dimensions, so the dominant frequencies were different. As shown in Figure 14, each self-excited system has a specific energy balance. For the tested emitters, several equilibrium positions can be found. Through its parametric differences, each of the used emitters excited the system at a different equilibrium point. As a result, the self-excited system aimed at different equilibrium points, stabilizing itself at different frequencies and amplitudes.
During the preliminary investigations, there was also an unfavorable phenomenon visible in Figure 10 and Figure 11. This was a frequency shift. If the test sample is treated as an intermediate medium, the frequencies around the natural frequencies of the sample will carry the most significant portion of energy. If the resonance peaks are at sufficiently small distances from each other, there may be a spontaneous switchover between them; it is switched to the nearest vibration mode. Under given conditions and at a given moment, it causes more energy dissipation. Thus, it is possible to explain the shift changes of the resonance frequency.
This approach also makes it easier to explain the phenomenon visible in Figure 9. In this case, it is clear that, in principle there is no difference between the frequencies achieved for a system without waveguide alumina and a system with waveguide alumina for the emitter. However, there is a significant difference when waveguide alumina is used for the receiver. It is important to note that an alumina waveguide is a system of a slender rod structure. In this way, the waves obtained from the rod are homogenized. It results in fewer reflected waves being passed through to the receiver. So, the amplitudes of some of the acoustic waves are reduced. Hence, the whole system vibrates in a different limit cycle, with significantly higher frequencies.
6.3. Limitations of the Study
A potential limitation in applying SAS as a microstructural characterization technique, not as a stress monitoring system, originates from the fact that SAS does not oscillate in one specific mode. Determination of the oscillation mode is necessary for any microstructural study, where different materials are going to be compared or microstructural development under thermal or thermo-mechanical loading conditions are going to be assessed. This fact was clear while comparing resonant frequencies determined by SAS of concrete samples before and after sintering. Sintered samples should have a higher resonance frequency than non-sintered samples, which was captured by the RFDA and the resonance frequency technique but not by SAS (Figure 6 and Figure 7). Therefore, the critical issue for further investigations is the determination of the proper oscillation mode. Without it, any comparative study may be, in fact, quite questionable.
7. Conclusions
The Self-Excited Acoustical System (SAS) was successfully applied to monitor changes in resonance frequency under uniaxial compression in refractory grade material, which by definition is characterized by a high level of heterogeneity with a network of pre-existing cracks. In the initial stage of loading, a superposition of two effects exists, which influences the total acoustoelastic effect. Macroscopic effects originate from the acoustoelastisity and microscopic from crack closure.
It has been demonstrated that the thermal history of the material may influence the stress–frequency relation. Through SAS monitoring it has been possible to capture the variation in the level of discontinuities introduced by the high-temperature thermal treatment.
This article presents a very extensive discussion and additional studies on the stability of the limit cycle for SAS together with a discussion of the reasons for the frequency shift. Due to the assumed model, it was possible to justify the step-in nonlinearity of the obtained frequencies and discuss the impact of the use of alumina waveguide to the SAS emitter and receiver on the obtained results. The frequency shift is still an autonomous and uncontrolled phenomenon; therefore, further work should focus on developing a specialized filtering system based on the hardware-in-the-loop concept in order to remove the possibility of spontaneous limit cycle variation.
The high sensitivity of the SAS system to stress changes and microstructure variation provides the basis for his potential dual application; for microstructure characterization in fundamental research studies and for stress changes monitoring systems.
Author Contributions
Conceptualization, I.K. and I.D.; methodology, R.T. and T.T.; software, K.L.; validation, I.D. and J.S.; formal analysis, I.K.; investigation, K.L.; resources, I.D.; data curation, I.D. and K.L.; writing—original draft preparation, I.K. and K.L.; writing—review and editing, I.K and K.L.; visualization, K.L.; supervision, I.D.; project administration, I.D.; All authors have read and agreed to the published version of the manuscript.
Funding
This work was supported by the funding scheme of the European Commission, Marie Skłodowska-Curie Actions Innovative Training Networks in the frame of the project ATHORAdvanced Termomechanical multiscale modeling of Refractory linings 764987 Grant. This paper was written under grant entitled ‘The Self-Excited Acoustic System (SAS) for Monitoring Safety Levels in Mine Workings’. Agreement No. TANGO2/340166/NCBR/2017.
Institutional Review Board Statement
Not applicable.
Informed Consent Statement
Not applicable.
Data Availability Statement
Not applicable.
Conflicts of Interest
The authors declare no conflict of interest.
References
- Steiner, R.; Lammer, G.; Spiel, C.; Jandl, C. Refractories 4.0. BHM Berg-Hüttenmännische Monatshefte 2017, 162, 514–520. [Google Scholar] [CrossRef]
- Tomsu, F.; Palco, S. Refractory monolithics versus shaped refractory products. Interceram Int. Ceram. Rev. 2017, 66, 20–23. [Google Scholar] [CrossRef]
- Lee, W.; Zhang, S.; Karakus, M. Refractories: Controlled microstructure composites for extreme environments. J. Mater. Sci. 2004, 39, 6675–6685. [Google Scholar] [CrossRef]
- Jin, J.; Rivière, J.; Ohara, Y.; Shokouhi, P. Dynamic acousto-elastic response of single fatigue cracks with different microstructural features: An experimental investigation. J. Appl. Phys. 2018, 124, 075303. [Google Scholar] [CrossRef]
- Ankay, B.; Zhang, C. Acoustoelastic evaluation of ultra-high performance concretes. In AIP Conference Proceedings; AIP Publishing LLC.: Melville, NY, USA, 2019; Volume 2102, p. 110002. [Google Scholar] [CrossRef]
- Gutiérrez-Vargas, G.; Ruiz, A.; Kim, J.Y.; Jacobs, L.J. Characterization of thermal embrittlement in 2507 super duplex stainless steel using nonlinear acoustic effects. NDT E Int. 2018, 94, 101–108. [Google Scholar] [CrossRef]
- Kwaśniewki, J.; Dominik, I.; Lalik, K.; Holewa, K. Influence of acoustoelastic coefficient on wave time of flight in stress measurement in piezoelectric self-excited system. Mech. Syst. Signal Process. 2016, 78, 143–155. [Google Scholar] [CrossRef]
- Masurkar, F.; Tse, P.W.; Yelve, N.P. Theoretical and experimental measurement of intrinsic and fatigue induced material nonlinearities using Lamb wave based nonlinearity parameters. Meas. J. Int. Meas. Confed. 2020, 151, 107148. [Google Scholar] [CrossRef]
- Yang, Y.; Ng, C.T.; Mohabuth, M.; Kotousov, A. Finite element prediction of acoustoelastic effect associated with Lamb wave propagation in pre-stressed plates. Smart Mater. Struct. 2019, 28, 095007. [Google Scholar] [CrossRef]
- Pei, N.; Bond, L.J. Comparison of acoustoelastic Lamb wave propagation in stressed plates for different measurement orientations. J. Acoust. Soc. Am. 2017, 142, EL327–EL331. [Google Scholar] [CrossRef]
- Chen, P.; He, X.; Wang, X. Ultrasonic Measurement of Axial Stress Using High-frequency Cylindrical Guided Wave. IEEE Sens. J. 2020, 21, 6691–6697. [Google Scholar] [CrossRef]
- Bompan, K.F.; Haach, V.G. Ultrasonic tests in the evaluation of the stress level in concrete prisms based on the acoustoelasticity. Constr. Build. Mater. 2018, 162, 740–750. [Google Scholar] [CrossRef]
- Shokouhi, P.; Zoëga, A.; Wiggenhauser, H.; Fischer, G. Surface wave velocity-stress relationship in uniaxially loaded concrete. ACI Mater. J. 2012, 109, 131–139. [Google Scholar] [CrossRef][Green Version]
- Lott, M.; Remillieux, M.C.; Garnier, V.; Le Bas, P.Y.; Ulrich, T.J.; Payan, C. Nonlinear elasticity in rocks: A comprehensive three-dimensional description. Phys. Rev. Mater. 2017, 1, 023603. [Google Scholar] [CrossRef]
- Pau, A.; Vestroni, F. The role of material and geometric nonlinearities in acoustoelasticity. Wave Motion 2019, 86, 79–90. [Google Scholar] [CrossRef]
- Muñoz, C.Q.G.; Márquez, F.P.G. A new fault location approach for acoustic emission techniques in wind turbines. Energies 2016, 9, 40. [Google Scholar] [CrossRef]
- Perugia, I.; Schöberl, J.; Stocker, P.; Wintersteiger, C. Tent pitching and Trefftz-DG method for the acoustic wave equation. Comput. Math. Appl. 2020, 79, 2987–3000. [Google Scholar] [CrossRef]
- Carcione, A.; Blanloeuil, P.; Rose, L.R.; Wang, C.H.; Veidt, M. Modulated high frequency excitation approach to nonlinear ultrasonic NDT. J. Sound Vib. 2019, 446, 238–248. [Google Scholar] [CrossRef]
- Abbasi, Z.; Ozevin, D. The influence of ultrasonic frequency on shear stress measurement using acoustoelasticity. In AIP Conference Proceedings; AIP Publishing LLC.: Melville, NY, USA, 2016. [Google Scholar] [CrossRef]
- Dubuc, B.; Ebrahimkhanlou, A.; Salamone, S. Higher order longitudinal guided wave modes in axially stressed seven-wire strands. Ultrasonics 2018, 84, 382–391. [Google Scholar] [CrossRef]
- Dominik, I.; Lalik, K.; Flaga, S. Modeling of self-excited stress measurement system. J. Low Freq. Noise Vib. Act. Control 2020, 146134842092945. [Google Scholar] [CrossRef]
- Lalik, K.; Dominik, I.; Ćwia̧kała, P.; Kwaśniewski, J. Integrated stress measurement system in tower crane mast. Meas. J. Int. Meas. Confed. 2017, 102, 47–56. [Google Scholar] [CrossRef]
- Skrzypkowski, K.; Korzeniowski, W.; Zagórski, K.; Dominik, I.; Lalik, K. Fast, non-destructive measurement of roof-bolt loads. Studia Geotech. Mech. 2019, 41. [Google Scholar] [CrossRef]
- Kwaśniewski, J.; Dominik, I.; Lalik, K. A Self-Excited Acoustical System for Stress Measurement in a Cement Plant. Mech. Control 2012, 31, 29. [Google Scholar] [CrossRef]
- Kwaśniewki, J.; Dominik, I.; Lalik, K. Application of self-oscillating system for stress measurement in metal. J. Vibroeng. 2012, 14, 1429–2955. [Google Scholar]
- Roebben, G.; Bollen, B.; Brebels, A.; Van Humbeeck, J.; der Biest, O. Impulse excitation apparatus to measure resonant frequencies, elastic moduli, and internal friction at room and high temperature. Rev. Sci. Instrum. 1997, 68, 4511–4515. [Google Scholar] [CrossRef]
- Bradt, R.C.; Alton, N. Elastic properties of refractories- their role and characterization. Refract. Appl. News 2007, 12. [Google Scholar]
- Etzold, S.; Tarabeux, J.; Porada, R.; Tonnesen, T.; Telle, R. Thermomechanical behavior of high-alumina refractory castables containing partially stabilized zirconia with different grain shapes. In Proceedings of the 15th Biennial Worldwide Congress UNITECR, Santiago, Chile, 26–29 September 2017; pp. 54–57. [Google Scholar]
- Huger, M.; Fargeot, D.; Gault, C. High-temperature measurement of ultrasonic wave velocity in refractory materials. High Temp.-High Press. 2002, 34, 193–201. [Google Scholar] [CrossRef]
- Lundqvist, P.; Rydén, N. Acoustoelastic effects on the resonance frequencies of prestressed concrete beams—Short-term measurements. NDT E Int. 2012, 50, 36–41. [Google Scholar] [CrossRef]
- Shokouhi, P.; Zoëga, A.; Wiggenhauser, H. Nondestructive investigation of stress-induced damage in concrete. Adv. Civ. Eng. 2010, 2010, 740189. [Google Scholar] [CrossRef]
- Popovics, S.; Popovics, J.S. Effect of stresses on the ultrasonic pulse velocity in concrete. Mater. Struct. 1991, 24, 15–23. [Google Scholar] [CrossRef]
- Berthaud, Y. Damage measurements in concrete via an ultrasonic technique. Part I experiment. Cem. Concr. Res. 1991, 21, 73–82. [Google Scholar] [CrossRef]
- Chaix, J.F.; Lillamand, I.; Ploix, M.A.; Garnier, V.; Corneloup, G. Study of acoustoelasticity behavior of concrete material under uniaxial compression. J. Acoust. Soc. Am. 2008, 123, 3847. [Google Scholar] [CrossRef]
- Larose, E.; Hall, S. Monitoring stress related velocity variation in concrete with a 2 × 10⁻⁵ relative resolution using diffuse ultrasound. J. Acoust. Soc. Am. 2009, 125, 1853–1856. [Google Scholar] [CrossRef]
- Ghassemi Kakroudi, M.; Yeugo-Fogaing, E.; Huger, M.; Gault, C.; Chotard, T. Influence of the thermal history on the mechanical properties of two alumina based castables. J. Eur. Ceram. Soc. 2009, 29, 3197–3204. [Google Scholar] [CrossRef]
- Tonnesen, T.; Telle, R. Thermal shock damage in castables: Microstructural changes and evaluation by a damping method. CFI Ceram. Forum Int. 2007, 84, E131–E136. [Google Scholar]
- Skrzypkowski, K.; Korzeniowski, W.; Zagórski, K.; Dudek, P. Application of long expansion rock bolt support in the underground mines of legnica-głogów copper district. Studia Geotech. Mech. 2017, 39, 47–57. [Google Scholar] [CrossRef]
Publisher’s Note: MDPI stays neutral with regard to jurisdictional claims in published maps and institutional affiliations. |
© 2021 by the authors. Licensee MDPI, Basel, Switzerland. This article is an open access article distributed under the terms and conditions of the Creative Commons Attribution (CC BY) license (https://creativecommons.org/licenses/by/4.0/).