1. Introduction
Technical diagnostics has been developing effectively over recent years. This phenomenon is favored by the use of artificial intelligence in the diagnosis of technological processes and technical devices [
1,
2,
3,
4,
5,
6]. Diagnostic programs with the use of artificial neural networks and programs operating on the basis of evolutionary and genetic algorithms and other algorithms are effectively used in technical diagnostics [
7,
8,
9,
10,
11,
12].
The experiments presented in the literature on the theory and practice of neural networks and artificial intelligence, included in [
13,
14,
15,
16,
17,
18,
19,
20], serve to confirm that they are aimed at the implementation of selected functions of the mind and human reactions (senses, behavior, etc.) that do not yield to simple numerical algorithmization. Therefore, they constitute an effective tool for logical and rational inference and decision making in the conditions of the lack of all data. The use of artificial intelligence methods means that it is not only data but also knowledge that is processed in production processes. Therefore, the machining system can be operated with the use of explicit and implicit knowledge. The procedural processing approach, based on algorithms, in technological systems, is supported by the use of artificial intelligence methods. The procedural processing approach, based on algorithms, in technological systems, is supported by the use of artificial intelligence methods. Additionally, it can be replaced with intelligent searching, which enables the creation of intelligent decision support systems in technological processes. In the organization and operation of intelligent technical and organizational systems, the issue of broadly understood optimization is of great importance.
In the literature on the optimization of inference and decision-making processes (modules), which constitute important elements in diagnostic and maintenance systems, one can also use evolutionary algorithms, including genetic algorithms modeled on biological evolutionary strategies used by nature to solve various problems [
11]. The genetic algorithm searches the space of solutions to the problem in order to find the best solutions, by applying the principle of population competition in accessing limited resources, using matching and elimination mechanisms. As in the phenomenon of biological evolution, population elements best suited to the criterion function have the best chance of transferring their features onto descendant elements [
7,
11,
12,
13,
14,
15].
Important issues related to the directions and methods of the functioning of technical diagnostics of objects include the following: measurement; recording; and using the values measured of diagnostic signals features. Therefore, the measurement module plays an important role in the intelligent diagnostic system designed by the authors. It is this procedure that serves to measure the distinguished diagnostic signals in the object and that processes (transforms) these into the form required for use by a computer. The possibilities created by the measurement technique permit a continuous observation and collection of numerous changes in the characteristics of signals related to the course of technological processes and the operation of machines and devices involved in them. These signals are more and more frequently to systems that enable their analysis in order to estimate the features that may constitute the symptoms of the current technical condition of the object under observation.
The issue of inference based on the reliability information available is currently being particularly intensively developed, especially in the area of improvement with the use of artificial intelligence [
21,
22,
23,
24,
25,
26,
27,
28]. In these systems, decision making is important in their functioning. Developing decisions in intelligent systems, especially in intelligent diagnostic systems, is always carried out on the basis of certain information. The basis of the uncertainty (vagueness) of inference in technical intelligent systems is mainly the imperfection of knowledge describing the reality tested (i.e., processes and technical occurrences, etc.). In most computer science applications, those methods that are also used in mathematics and technical sciences are utilized to solve and research technical problems. These methods describe the reality (the world) using strictly defined (sharp) and unambiguous concepts (definitions and theorems). Hence, inference methods resulting from the application of the above conceptual apparatus in research are strictly defined and described with the use of inference in multi-valued logics. The issue of inference in systems including artificial intelligence and other (hybrid) decision-making systems is subject to continuous improvement and development. The criteria that describe the nature and manner of developing a decision must be formalized most frequently in the form of inference (decision) rules. The inferring rule base, which forms the basis for the development of decisions, must include all possible situations (decisions) that condition the determination of a finite set of possible decisions [
16,
17,
18,
19,
20,
21,
22,
23,
24,
25,
26,
27].
The papers by Madan et al., Duer, and others [
7,
12,
24,
25,
26] may be of great practical importance in the organization of a diagnostic system with the use of artificial neural networks. These studies present a method that demonstrates the practical use of the results of technical diagnostics in the organization of a technical object maintenance system [
27,
28]. The work presents the essence of the change of states in a technical object, as a result of which its functional properties decrease: a change of the state. Therefore, there is a need for an effective recognition of this existing state in the object. If the diagnosed condition is a state of incompleteness or unfitness, appropriate countermeasures should be taken by organizing preventive measures (restoration of the object). In the aforementioned studies, the authors presented a diagram and a description of the structure of the artificial neural network and theoretical relationships describing the functioning of the network in accordance with the algorithm presented. The theoretical basis for diagnosing technical objects in three-valued logic with the use of an artificial neural network was also presented. The results of the work are supported with an example of a diagnostic information base for the device tested.
In the diagnostics of technical objects, the object of action is the object itself. Its purpose, structure, and specificity of functioning impose (define) the method of diagnosis. The problem of diagnosis described in this work concerns the electric hybrid power supply system of the House on Water (HoW). The paper presents the specificity of the construction and operation of this type of power supply system. At present, electric power systems using renewable energy (wind, solar etc.) are developing particularly intensively; this can be seen as regards the subject of publications [
29,
30,
31,
32,
33,
34,
35,
36,
37,
38]. A novelty in this article in the aspect of electric power supply systems is a presentation of the method of building and developing diagnostic knowledge bases for electric hybrid power supply systems for the HoW.
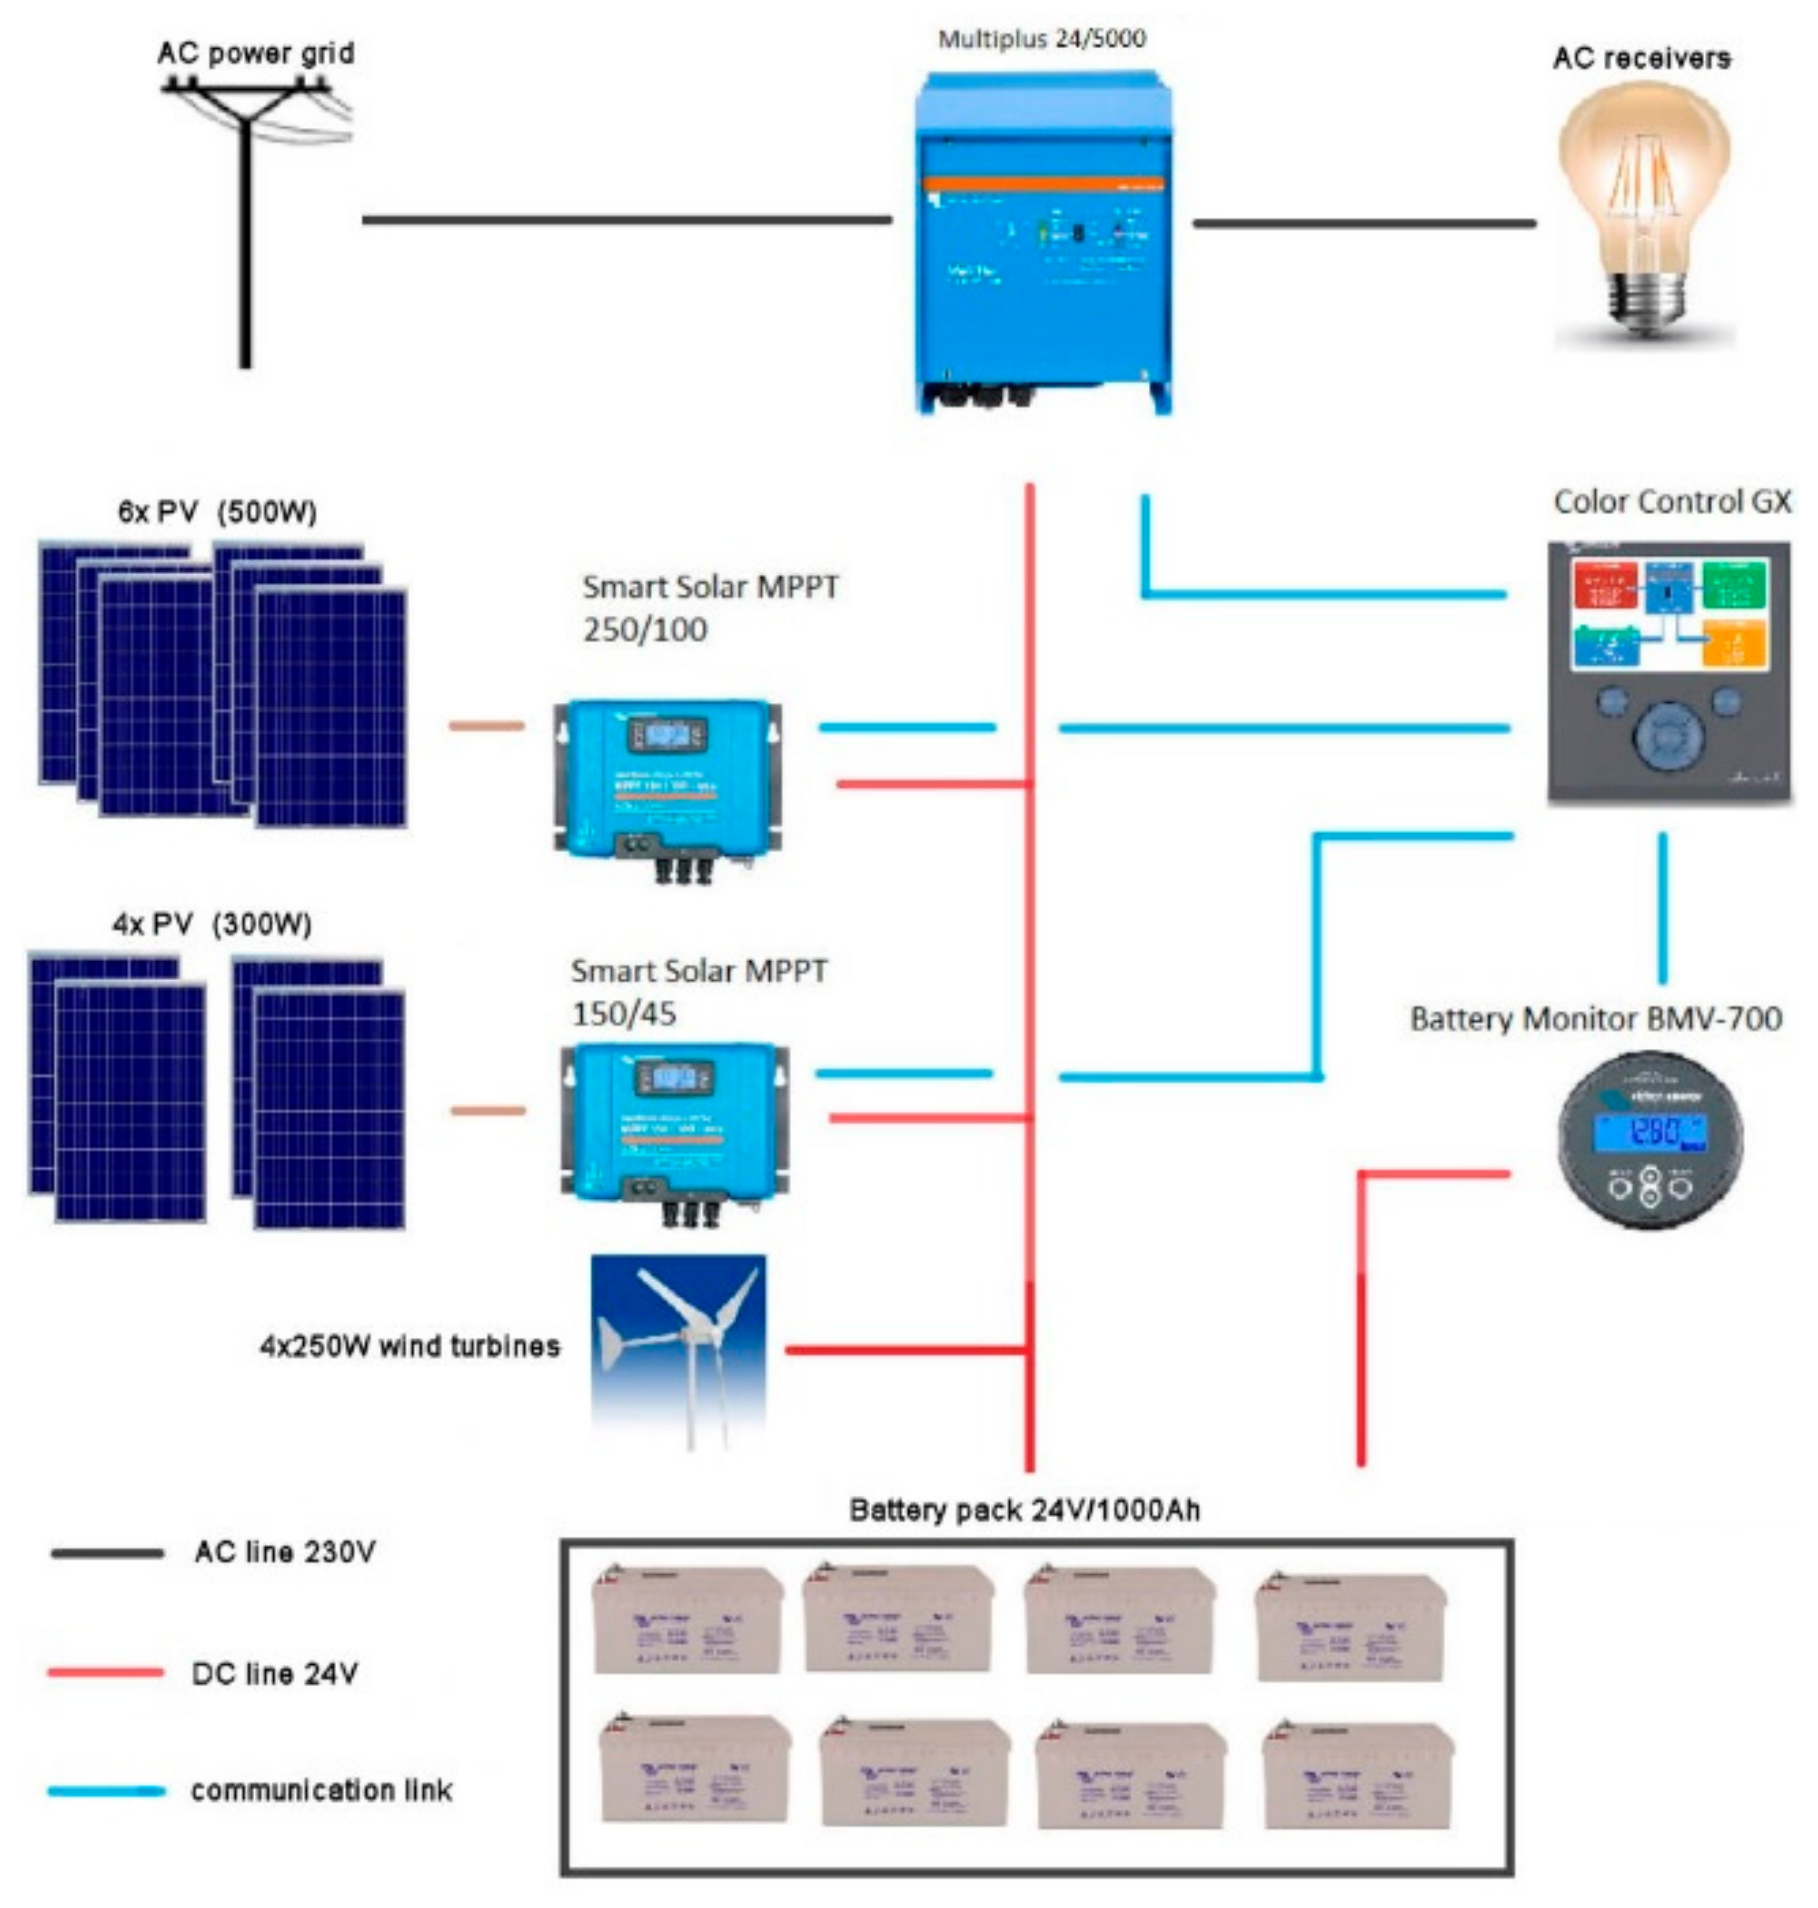
The object of the research was an electric hybrid power supply system for the House on Water (HoW) (
Figure 1), which was designed and built for the purpose of tourist recreation throughout the year.
This house is equipped with the following hybrid power engineering elements:
- -
four wind turbines (at the corners of the roof);
- -
10 photovoltaic panels (on the roof and on the wall);
- -
24 V battery bank;
- -
heat pump extracting heat from water;
- -
air conditioner; and
- -
230 V alternating current power grid.
The energy flow in this facility is controlled on two levels. At the lowest level, energy management is handled by an algorithm embedded in the Victron Energy controller. At the highest level, what is superior is the wireless controller from FHome Radio, which in addition to controlling the aforementioned elements, also manages the electrical installation (light, blinds in the windows). Changing the direction of the energy flow is possible by measuring the internal and external temperature, time of the day and year, sunlight, wind intensity, and the battery charge level. In addition, the user may influence the condition of the devices through commands given using a smartphone.
The authors of the article systematically improved the reliability condition testing of technical devices by improving the method of testing the condition of the object consisting in an analysis of distance metrics resulting from a comparison of diagnostic signal vector images with their patterns. For this purpose, solutions developed on the basis of artificial intelligence (radial basis function (RBF) type artificial neural network) were used. The result of this work is a diagnostic computer program (DIAG 2) [
3,
4,
5,
6,
28].
The aim of the article is to present the problems of examining and assessing the increase in the informational value of diagnoses developed by the DIAG 2 intelligent diagnostic system in k-valued logics (at k = 2, 3, and 4) compiled in the form of “State tables”. Therefore, the article presents the issues as follows [
29].
The first part of the article presents the essence of the problem of the informational value of k-value diagnoses in relation to their valence {k = 2, 3, 4} in recognizing the state of an object. The theoretical basis of each diagnosis expressed in k
th logic and the possibilities of using them in practice are presented [
31].
The second part of the article presents and describes the structure of the DIAG 2 intelligent diagnostic system using an artificial neural network of the radial basis function (RBF) [
24].
The third part of the paper presents study practical final results in the form of diagnoses in k-valued logics for devices of the HoW power supply system. The results obtained of the diagnosis of state evaluation in the selected form of the “Object States Table” are separately related to each of inference logics, including: four-valued state evaluation (4VL); three-valued evaluation (3VL); and two-valued state assessment (2VL).
The fourth part of the article presents the problems of the research and analysis of diagnoses developed in k-valued logics for the HoW power system devices. The results obtained of state assessment diagnoses were summarized in the form of the “Object States Table” separately for: (4VL, 3VL, or 2VL).
The fifth part of the article presents the problems of the study and the assessment of an increase in information for diagnoses developed by the DIAG 2 intelligent diagnostic system in k-valued logics (at k = 2, 3, and 4) for the results compiled in the form of “State Tables” separately for each of the logics examined for the HoW electric power supply devices. In addition to this, the problem of an assessment of the informational value of diagnoses was extended to include an analytical assessment of this problem on the basis of the dependencies developed for 4-value and 3-valued logic.
2. Ranges of Changes of Object’s Conditions in Four-Valued Logic Used in the DIAG 2 Diagnostic System
Every complex technical object is defined by the values of those physical quantities that characterize its technical properties. These quantities are known as those features which reflect the individual conditions in which the object can be found. The output signals of the object depend on the conditions of signals at the input and the conditions of its basic elements. We define this in the following manner:
where
Yi is the output diagnostic signal of the i
th functional element X
1, X
2,…, X
m is the input signals supplied to the m
th inputs of the elements of the object, p
1, p
2,…,p
n are parameters that characterize the condition of the object.
In the diagnostics of technical objects, the method of comparing diagnostic signals with their model signals is commonly used. This diagnostic method is presented in the literature [
2,
10] in the form of the following Equation:
where the following stand for: W(ε(e
i,j)) is the value of state assessment logics for j
th element within i
th module, X(e
i,j) is the diagnostic signal in j
th element of i
th assembly of the object, X
(w)(e
i,j) is the model signal for X(e
i,j) signal, → is a symbol of diagnostic activities E
i is the i
th assembly of the object,
is a symbol of comparison.
Those parameters that characterize the condition of the object may include the internal features of the system and the external factors that have an influence on the object (system), which are generally known as loads. When the system is in an operable condition, a strictly defined output function value corresponds to each input function. A change of the internal properties of the object may cause a deviation of the output function value beyond the value of admissible changes, which leads the object into an inoperable condition.
If we ensure the provision of the nominal values of the features of input signals, we obtain the value of the signal that characterizes its condition at the output of the object. The examination of output signal Y
i consists of a measurement of its k
th features and a comparison of the result of the measurement of the signal examined with its feature of the i
th model signal Y
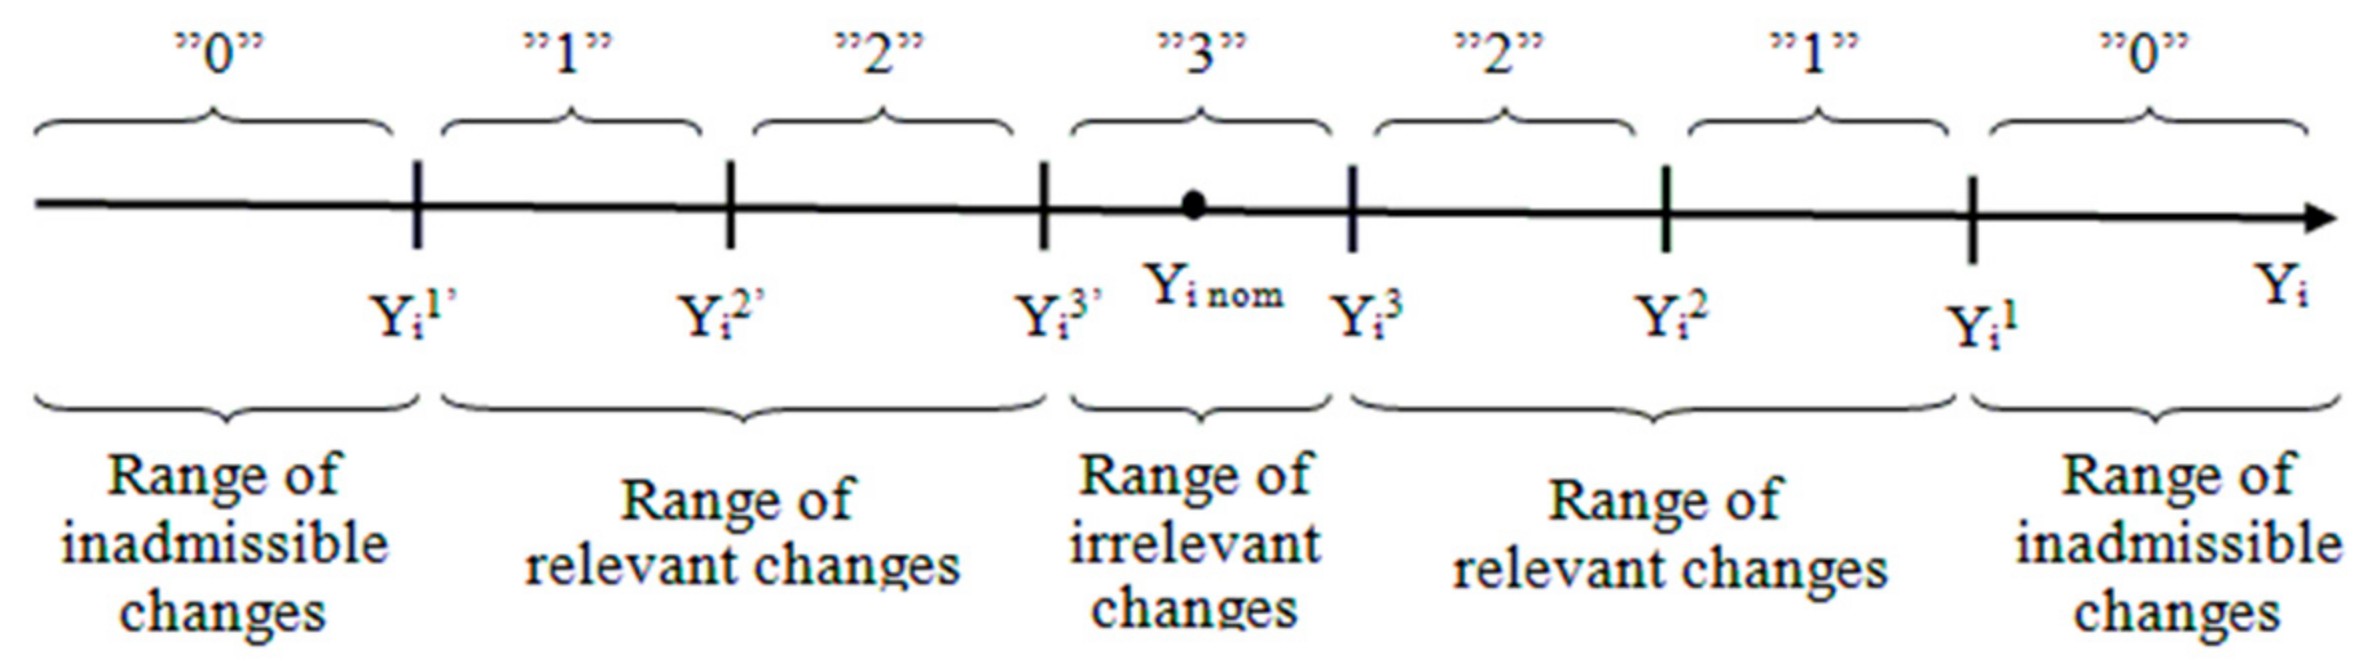
(w),i. Instead of comparing the output signal with the model, it is considerably simpler to check whether the values of diagnostic signals are in their scope of admissible changes. The ranges of the value changes of the feature of the i
th diagnostic signal for four-valued logic are presented in
Figure 2 [
6,
21,
30,
31,
32,
33,
34].
Three ranges of changes were distinguished in
Figure 2, that is:
range of irrelevant changes of signal (Yi3′, Yi3) that defines the condition of the feature of the object at level “3”;
range of the relevant change of signal (Yi2′, Yi3′) ∪ (Yi3, Yi2) that defines the condition of the feature of the object at level “2”;
range of the critical change of signal (Yi1′, Yi2′) ∪ (Yi2, Yi1) that defines the condition of the feature of the object at level “1”; and
range of the inadmissible changes of signal (−∞, Yi1′) ∪ (Yi1, +∞) that indicates the condition of the feature of the object at level “0”— in the case of a need to examine more than one feature of output signal Y, one should verify for each of these features whether it is in an admissible change range.
The ranges developed of changes in the value of diagnostic signals in relation to the reference signal made it possible to develop diagnostic rules for the operation of the RBF artificial neural network in the following form:
where the following stand for: R
w1 is the 1st rule of diagnostic inference, (Y
i3, Y
i3) is the range of irrelevant changes for the values of the features of signal,
is a symbol of comparison, {3} is the operable condition.
where the following stand for: R
w2 is the 2nd rule of diagnostic inference, (Y
i2′, Y
i3′) ∪ (Y
i3, Y
i2) is the range of changes for the relevant values of the features of signal,
is a symbol of comparison, {2} is the incomplete operable condition.
where the following stand for: R
w3 is the 3rd rule of diagnostic inference, (Y
i1′, Y
i2′) ∪ (Y
i2, Y
i1) is the range of changes for the critical values of the features of the signal,
is a symbol of comparison, {1} is the critical operable condition.
where the following stand for:
Rw4 is the 4
th rule of diagnostic inference, (−∞, Y
i1′) ∪ (Y
i1, +∞) is the inadmissible range for the values of the features of signal,
is a symbol of comparison, {0} is the condition of inoperability.
An introduction of the four-valued assessment of conditions in technical diagnostics leads to the realization of the diagnosing process, where we assign one condition out the following set of conditions to the real condition of the object states:
− {3}: an operable condition where the object possesses a full ability to perform the tasks it has been designed for;
− {2}: an incomplete operable condition where the object possesses an ability to perform its tasks in a limited scope—this is a condition where one should commence the performance of preventive activities to regenerate the object;
− {1}: a critical operable condition where the object possesses an ability to perform its tasks in a very limited scope—this is a condition that precedes damage and it requires undertaking preventive activities to regenerate the object;
− {0}: an inoperable condition where the object has lost the resources of functioning and is not capable to perform the tasks it has been designed for.
3. Diagnostic Model of Devices of the Hybrid Power System in the “House on Water”
The model of a technical object for the needs of organizing the process of its diagnosis and operation is most often presented in literature [
30,
31,
32,
33,
34] in the form of a functional-diagnostic model (
Figure 3). The technical object accepted for research, with the internal structure shown in
Figure 4, is a complex object. However, there is a condition that in the object at the designated measurement points of its internal structure, there are measurement signals—diagnostic (analog or digital signals), which are assigned the characteristics of diagnostic signals [
1,
2,
3,
4,
5,
6,
12,
13,
24,
25,
26,
27]. When developing the model of the object, its internal structure was divided into four levels of the service structure: (1) object {O}; (2) functional units {E
i} in the object; (3) subassemblies {e
j} in each unit {E
i}; and (4) core modules {e
i,j} in each subassembly of each object assembly. By making this division of the structure of the object, a set of component elements {e
i,j} is obtained.
The first stage of the diagnostic development is the creation of the structure (model) of the technical object and its functional and diagnostic scheme on the basis of which we determine the set of diagnostic signals {X
i,j}. The functional units of the object (units) included in the functional-diagnostic scheme presented in
Figure 2 are addressed as follows (E
i), where i is the number of the unit in the object. The elements of the set are addressed in the form (e
i,j), where j is the number of the element in the i
th group. However, before we start the implementation of the stages of the diagnostic process, a new project should be created, including the object tested. If any project already exists and it is currently open, it will be closed and saved in an appropriate (XML) document structure [
25,
26]. Opening a new project sets all parameters to the default value. A change in the default values of parameters can be obtained in the configuration window (Preferences). Newly created projects are saved in the default “data” directory located in the main path of the program.
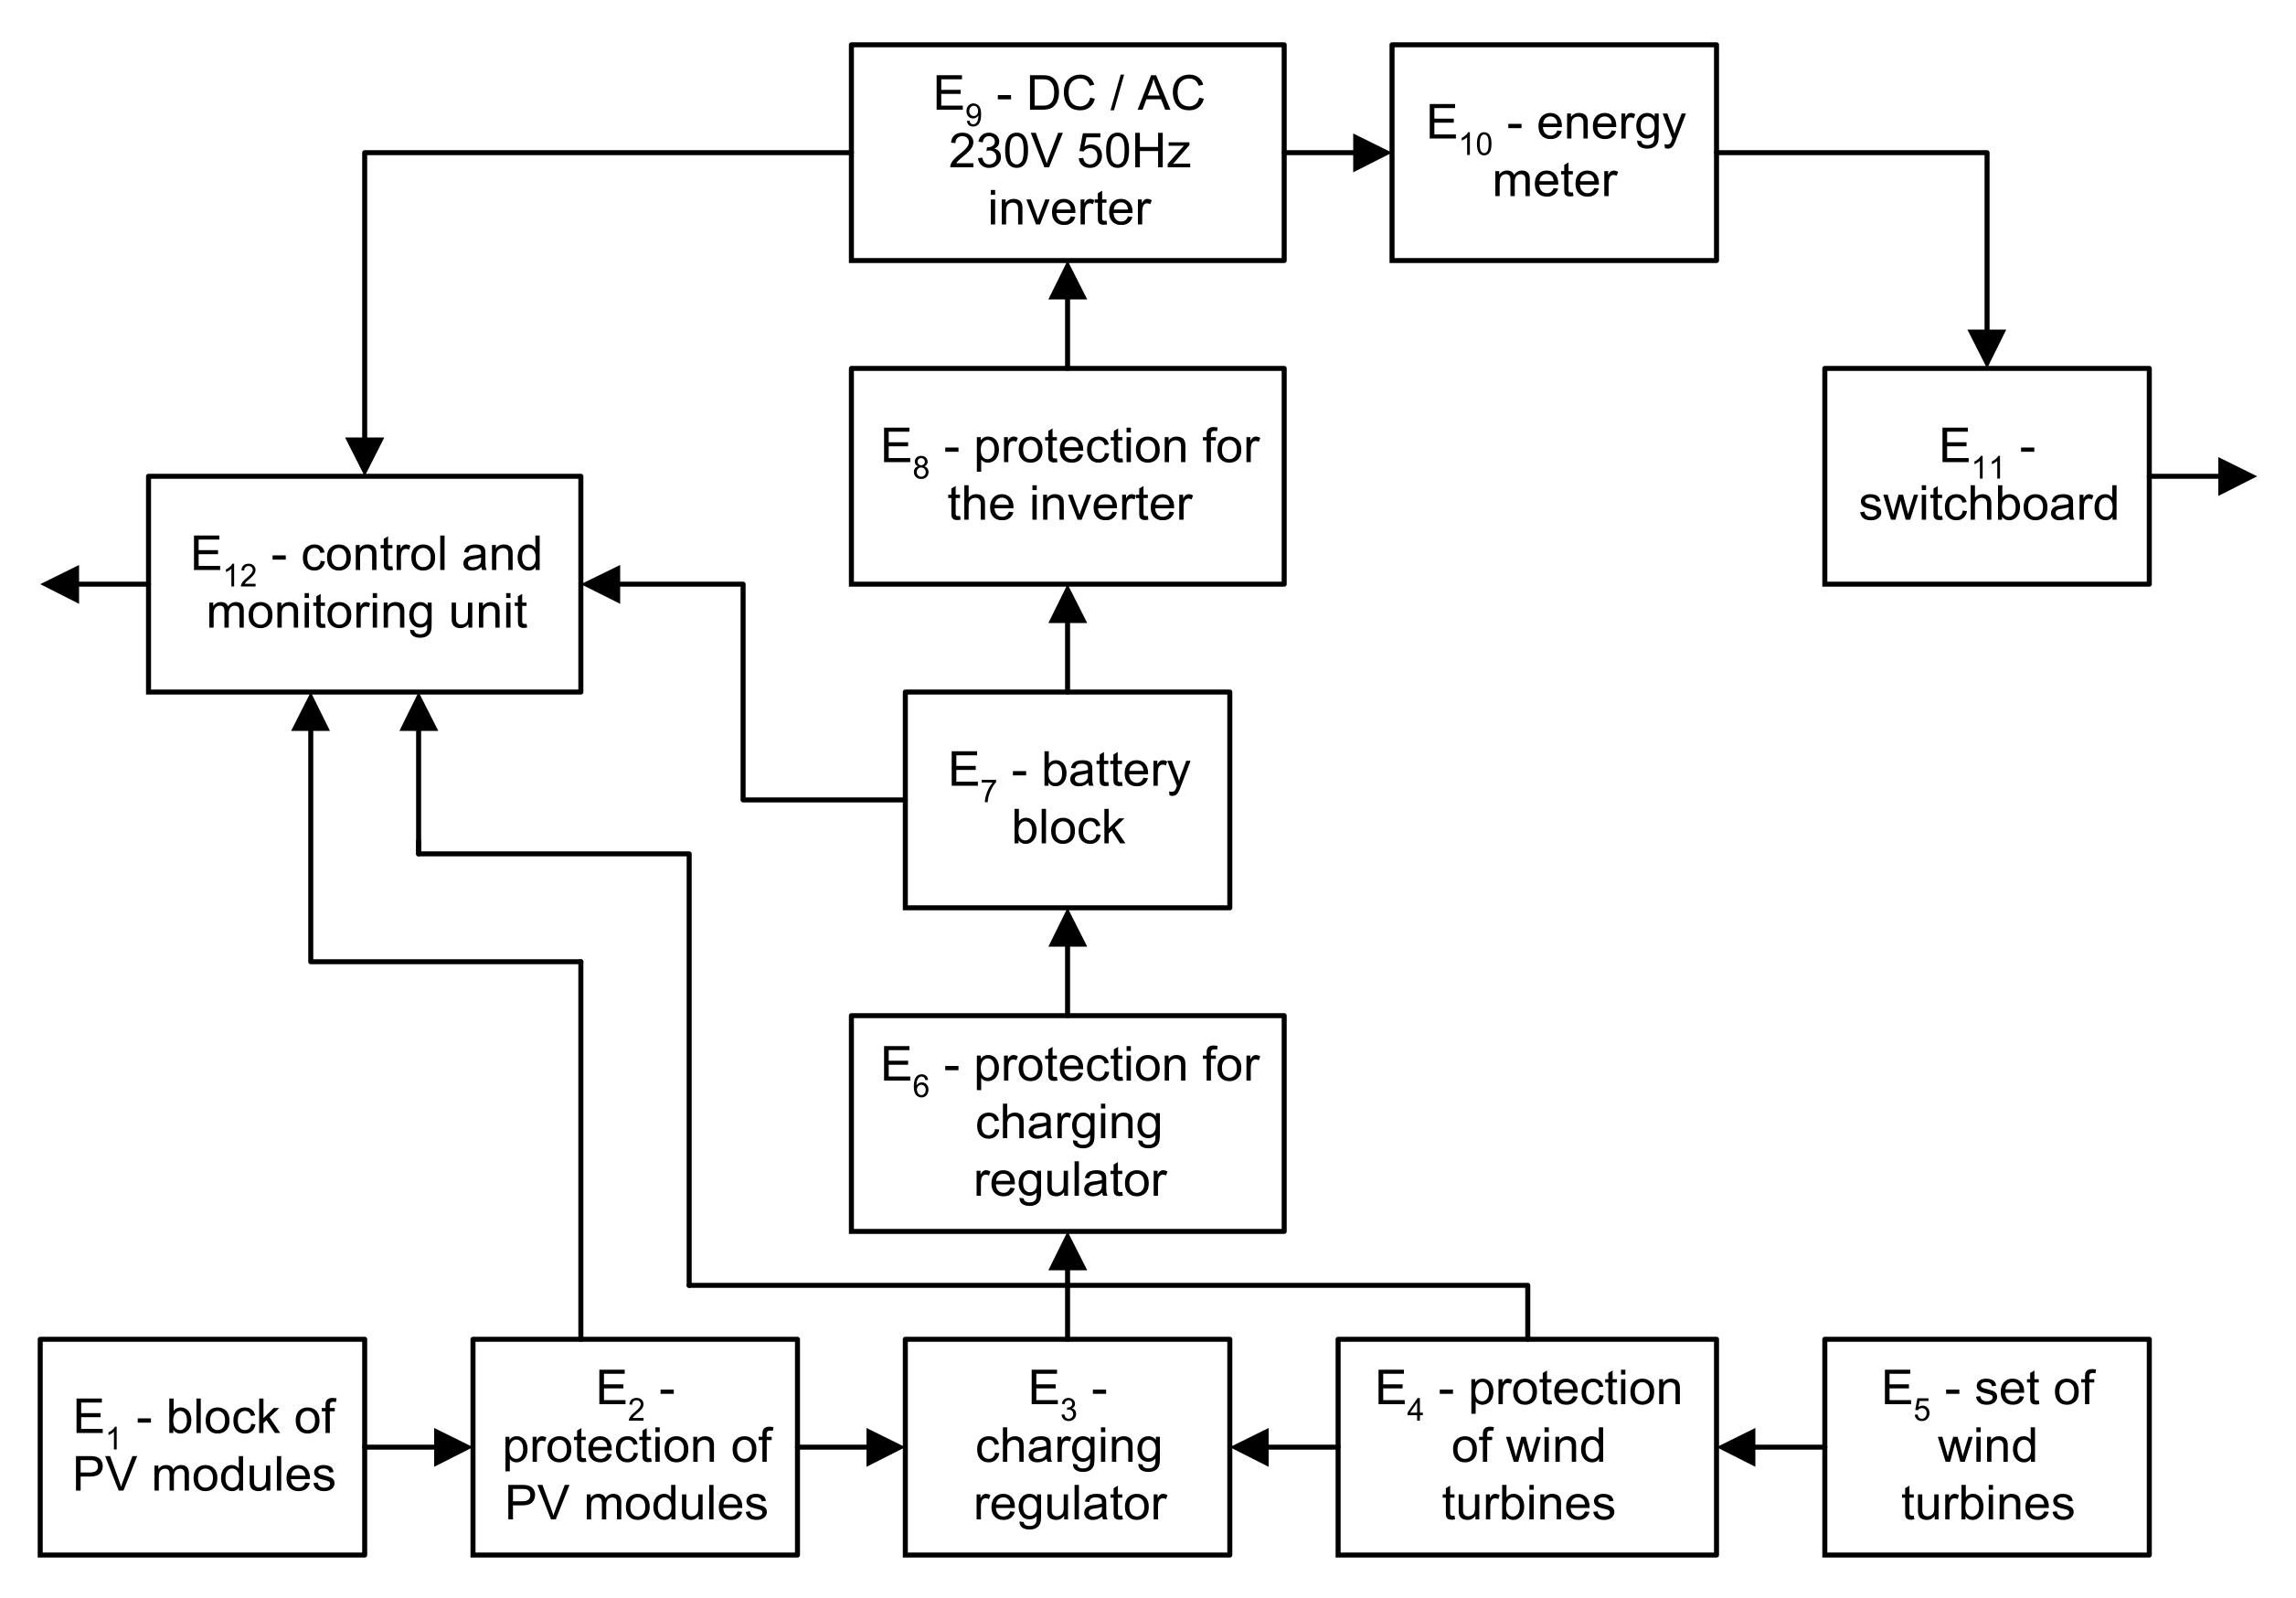
The basis of the diagnostic tests of technical devices are functional and diagnostic models of these objects [
3,
4,
5,
6,
13] (
Figure 4). Hence, for the purposes of this work, a functional and diagnostic diagram of the wind farm system was developed (
Figure 4). As a result of the functional and diagnostic analysis, seven functional units were distinguished in the wind farm model. In each of the i
th groups, a subset of its j
th basic (functional) elements was determined. This was the designated set of basic elements {e
i,j} in the wind farm model determining its internal structure, which is presented in
Table 1 and
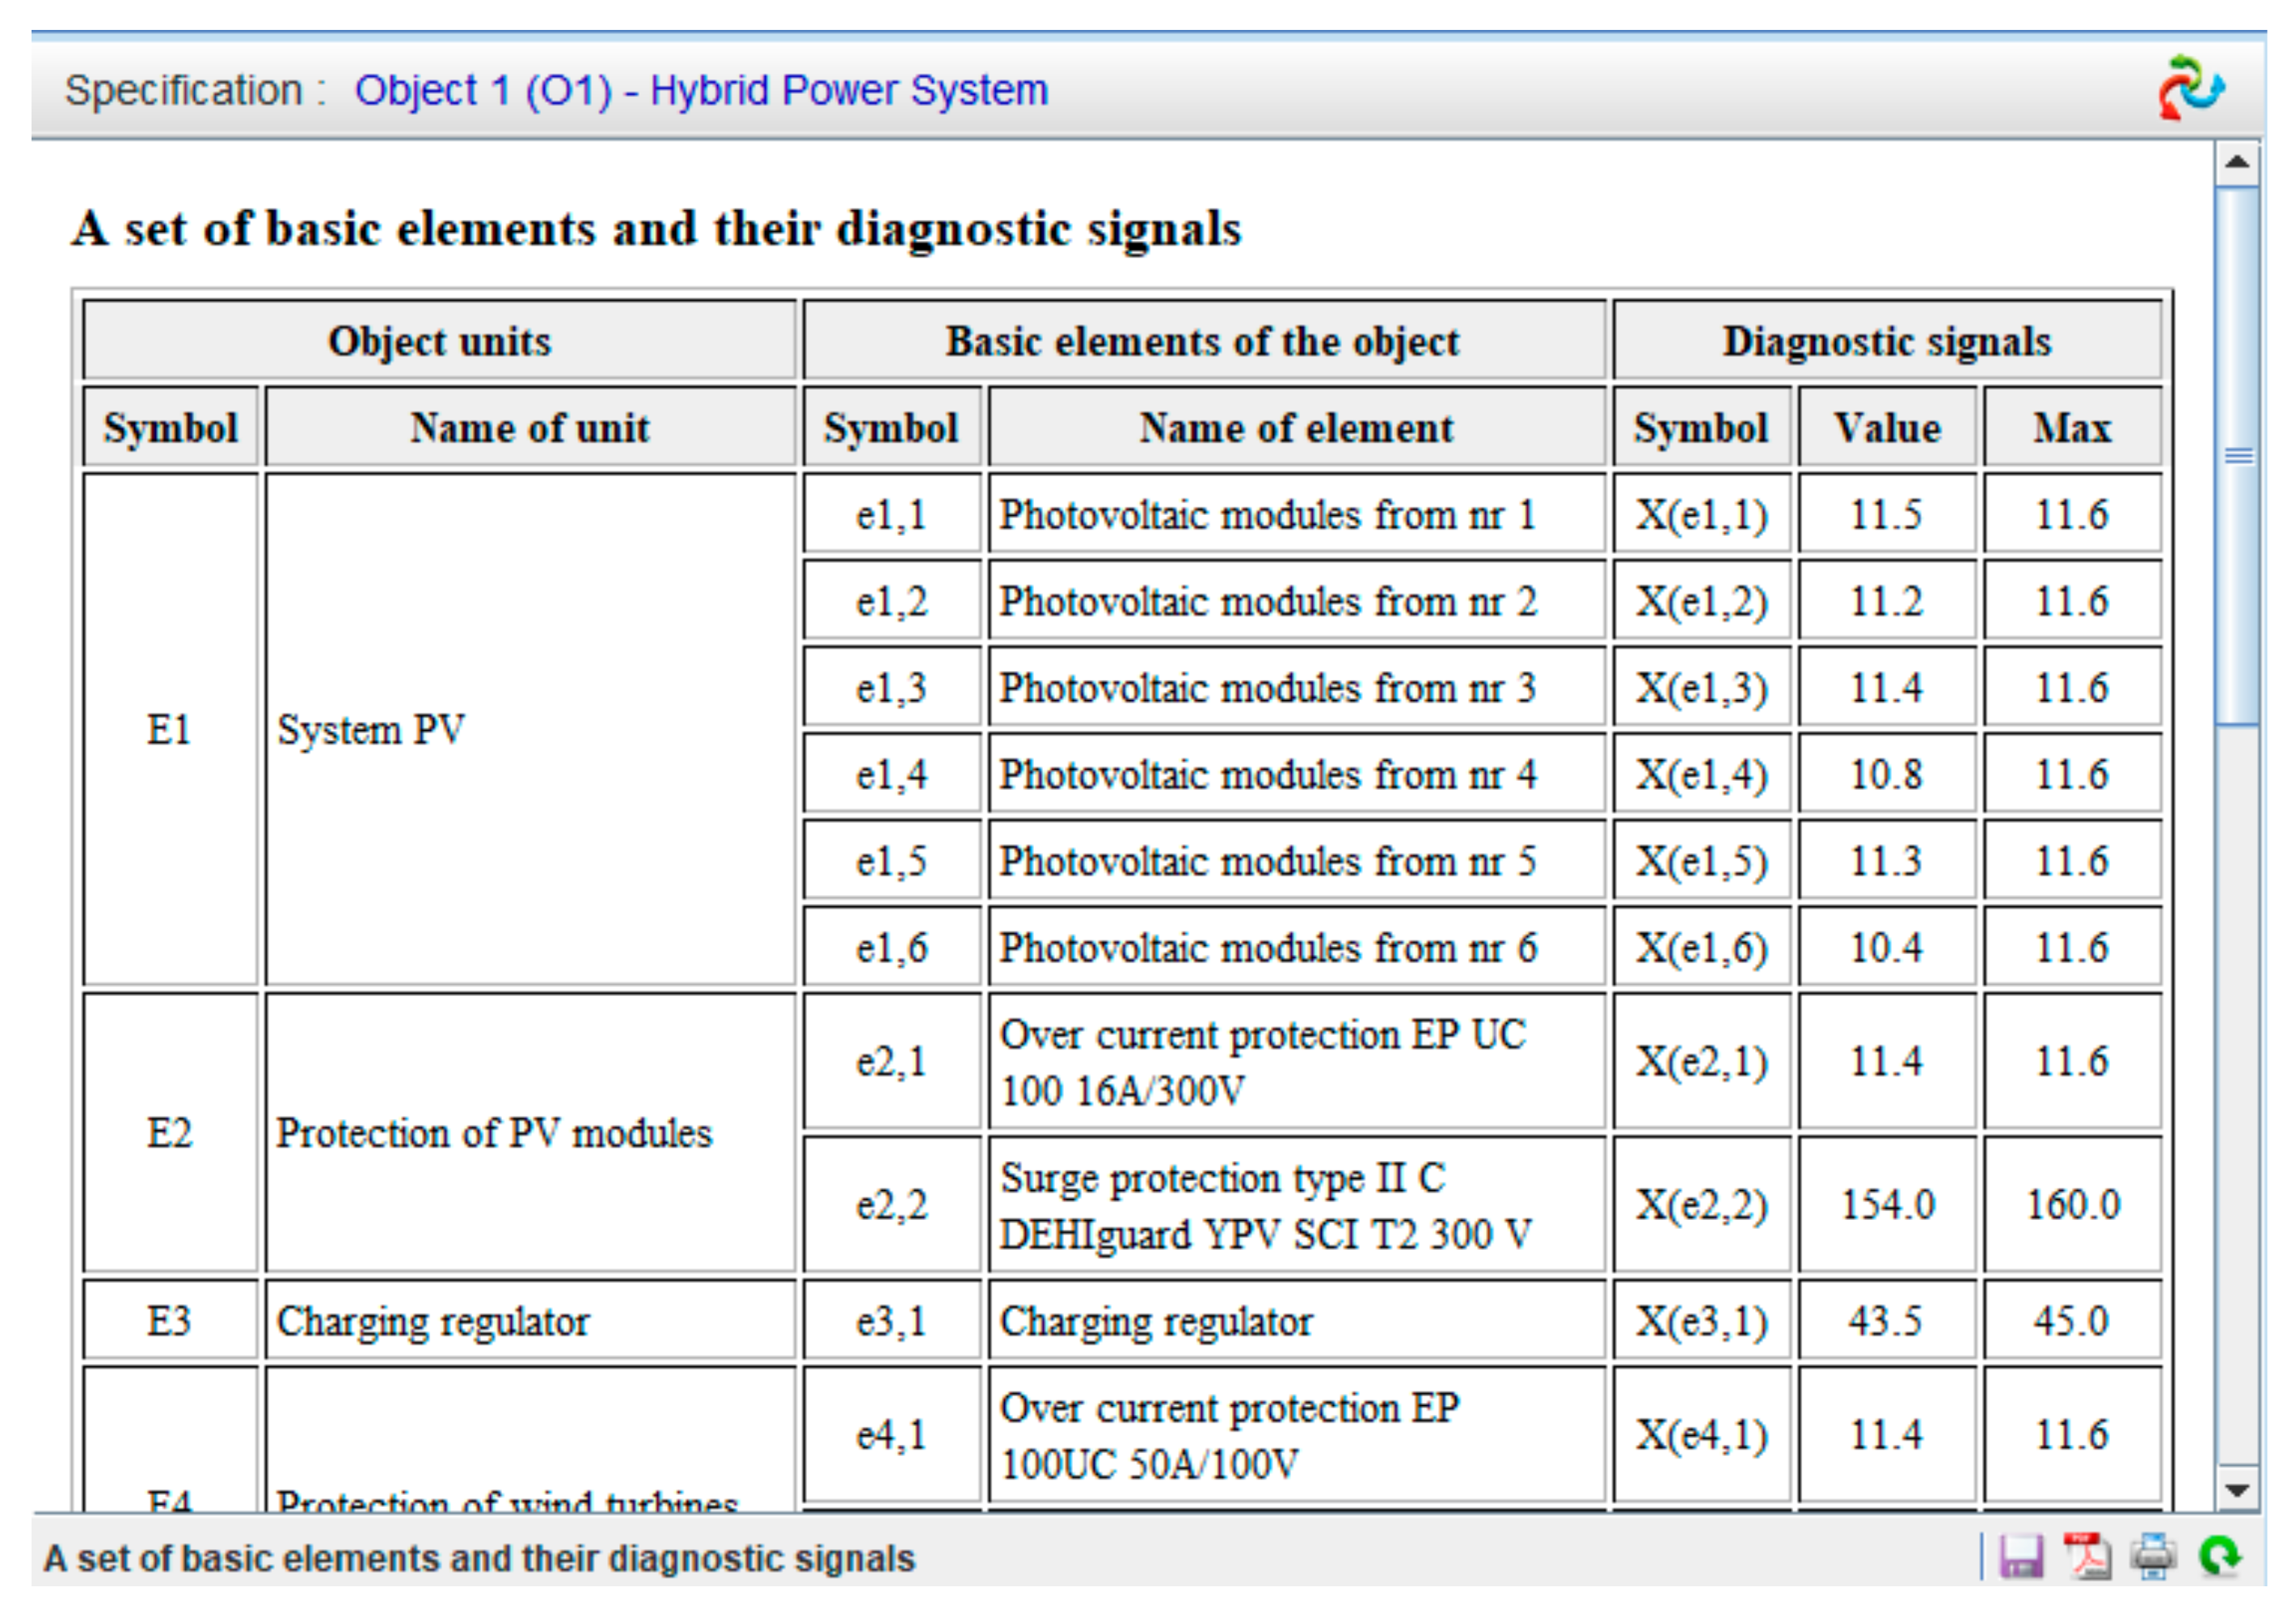
Table 2.
Where: E1 is the block of (PV) modules, e1.1 to e1.6 are photovoltaic modules from No. 1 to No. 6; E2 is the protection of PV modules, e2.1 is the over current protection EP UC 100 16 A/300 V, e2.2 is the over voltage protection type II C over voltage protection (DEHI) guard YPV SCI T2 300 V; E3 is the charging regulator, e3,1 is the charging regulator; E4 is the wind turbine protection, e4,1 is the over current protection EP 100UC 50 A/100 V, e4,2 is the over voltage protection type II C over voltage protection DEHI guard YPV SCI T2 100 V; E5 is the set of wind turbines, e5,1 to e 5,4 are wind turbines from No. 1 to No. 4; E6 is the protection for charging regulator, e6.1 is the over current protection with B-type characteristics with current of 150 A; E7 is the battery block, from e7,1 to e7,6—24 V batteries from No. 1 to No. 6; E8 is the protection for the inverter, e8.1 is the over current switch type CLS6-B10 269,608 EATON with a setting of 16 A; E9 is the DC/AC inverter 230 V/50 Hz, e9,1 is the DC/AC inverter; E10 is the inverter protection from AC sides, e10,1 is the protection type 1-pole 32 A switch disconnector; E11 is the energy meter, switchboard, e11,1 is the switchboard; E12 is the control and control unit, e12,1 is the control unit, and e12,2 is the power system control and display unit.
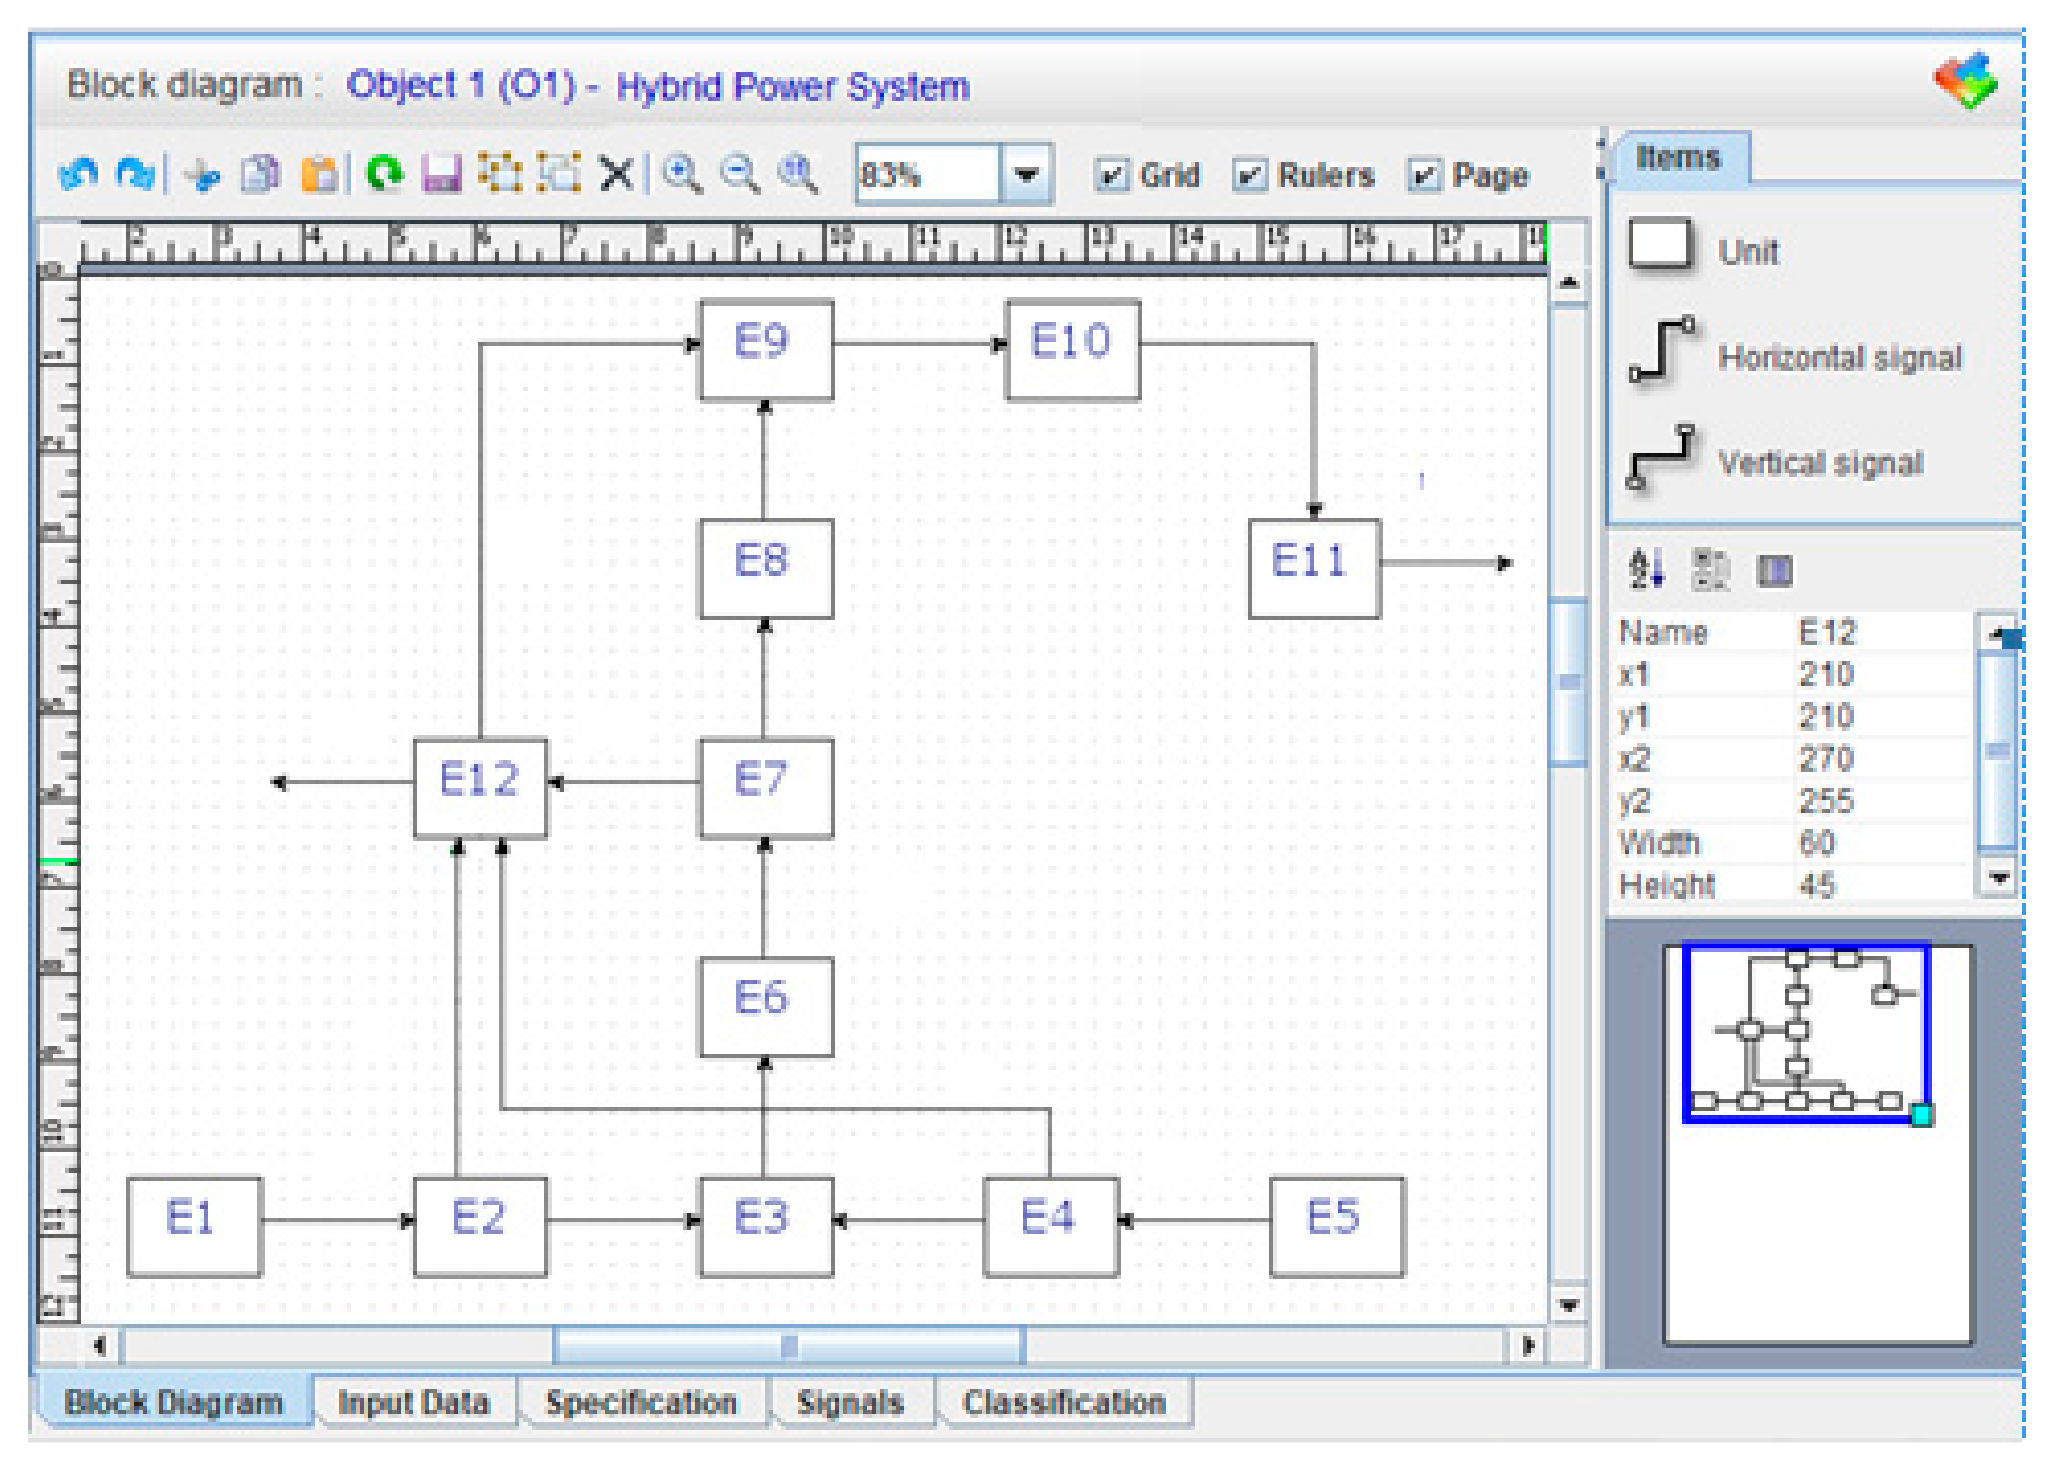
The use of the DIAG 2 program in the diagnosis process requires the preparation of input diagnostic information on the basis of a functional and diagnostic analysis. Therefore, the basic elements are as follows: the object modules included in its functional and diagnostic model must be “addressed” in the following way (e
i,j), where j is the number of an element in a given group, and (i) is the i
th number of this group of objects. The functional units of the object are presented in the diagnostic system (DIAG 2) as “units”, and the basic elements as “elements”, while the subassemblies, as elements of the third level, play the role of “intermediate elements” enabling bidirectional transformation of the hierarchical form of the object into the internal matrix structure shown in
Figure 3 and
Figure 4.
When creating a project, as well as other structure elements, i.e., objects, units, and elements, it is required to fill in the appropriate form in the dialog box (
Figure 3 and
Figure 4). Each such form contains data characteristic for individual structure elements, i.e., full and short name, description, code, author, date, etc. If we open an existing project (Open Project), the entire structure, object’s diagrams, input data and configuration variables will be positioned (
Figure 5 and
Figure 6).
The input of the descriptive data or values of diagnostic signals can mainly be done by means of forms in dialog boxes. An example of such a window with a form for a new functional element is shown in
Figure 7.
Input data feed to the program can be done manually using the keyboard or automatically directly from the measurement system (the measuring card). The program is designed in such a way that it is possible to correct the dimensions of the structure of the object tested at any time, including a change in the number of assemblies or a change in the number of basic elements (modules) in a given assembly. The application window shown in
Figure 7 divides the program screen into two basic parts: the left one containing the hierarchical structure of the project including its elements, and the central right one that carries out the various stages of the diagnosis process. The left panel is the main panel, always available and fully integrated with the individual stages of the central panel. This means that any changes made to the project structure are automatically updated in the central panel. The course of the diagnosis process, along with its configuration, is considered independently for each object. A single object, showing the features of encapsulation and uniqueness, allows for the differentiation of the depth of diagnosis in relation to individual elements. Choosing a different one or creating a new object will save the results obtained until now and start editing a new diagnostic process.
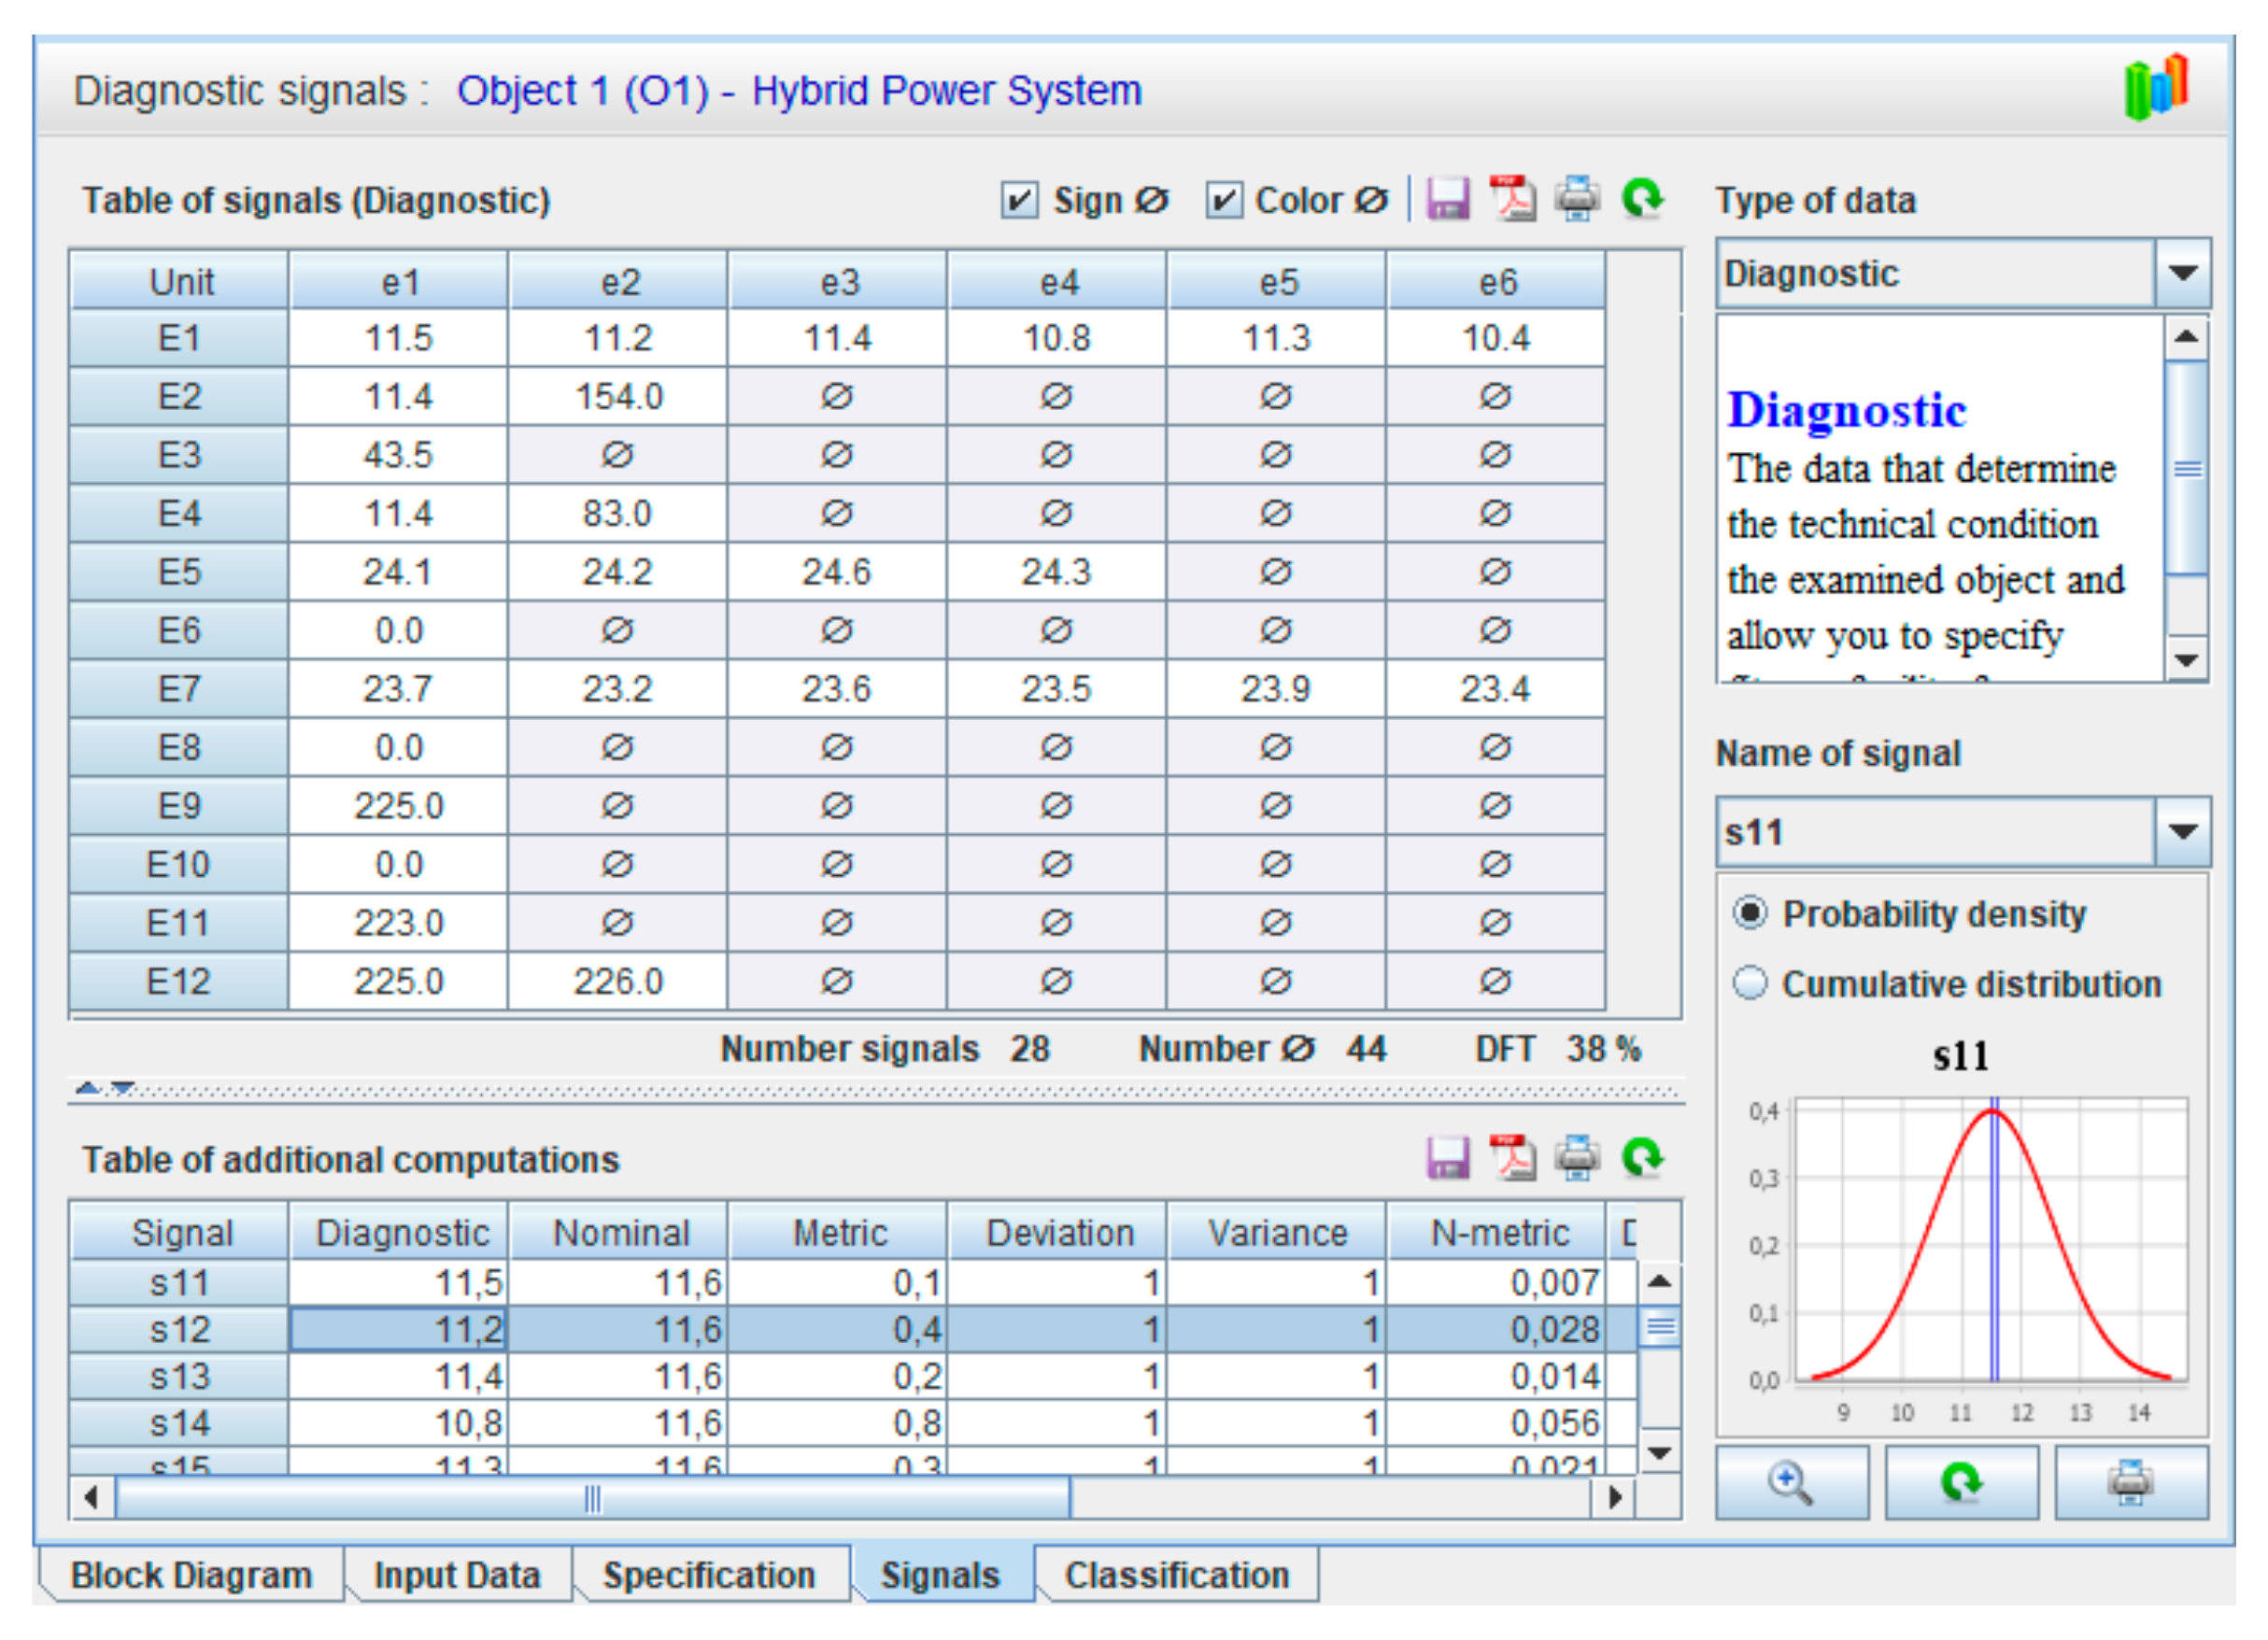
After entering the values of measurement signals, the next step is to go to the next panel by selecting the “Signals” program table. This panel is divided into two main parts: the upper one, representing the diagnostic signal set, and the lower one, containing the intermediate calculations performed on the values of these signals. The calculations are presented in the form of successive table columns, where the lines define the set of basic elements of the internal structure of the object tested. Within these calculations, we may distinguish the following: signal measurement values (Diagnostic); nominal values (Nominal); metrics; deviations of the metric vector (Deviation); variances (Variances); distance metric standard (N-metrics); distribution function (Distribution); Probabilities; ZG Probabilities; and WG weight.
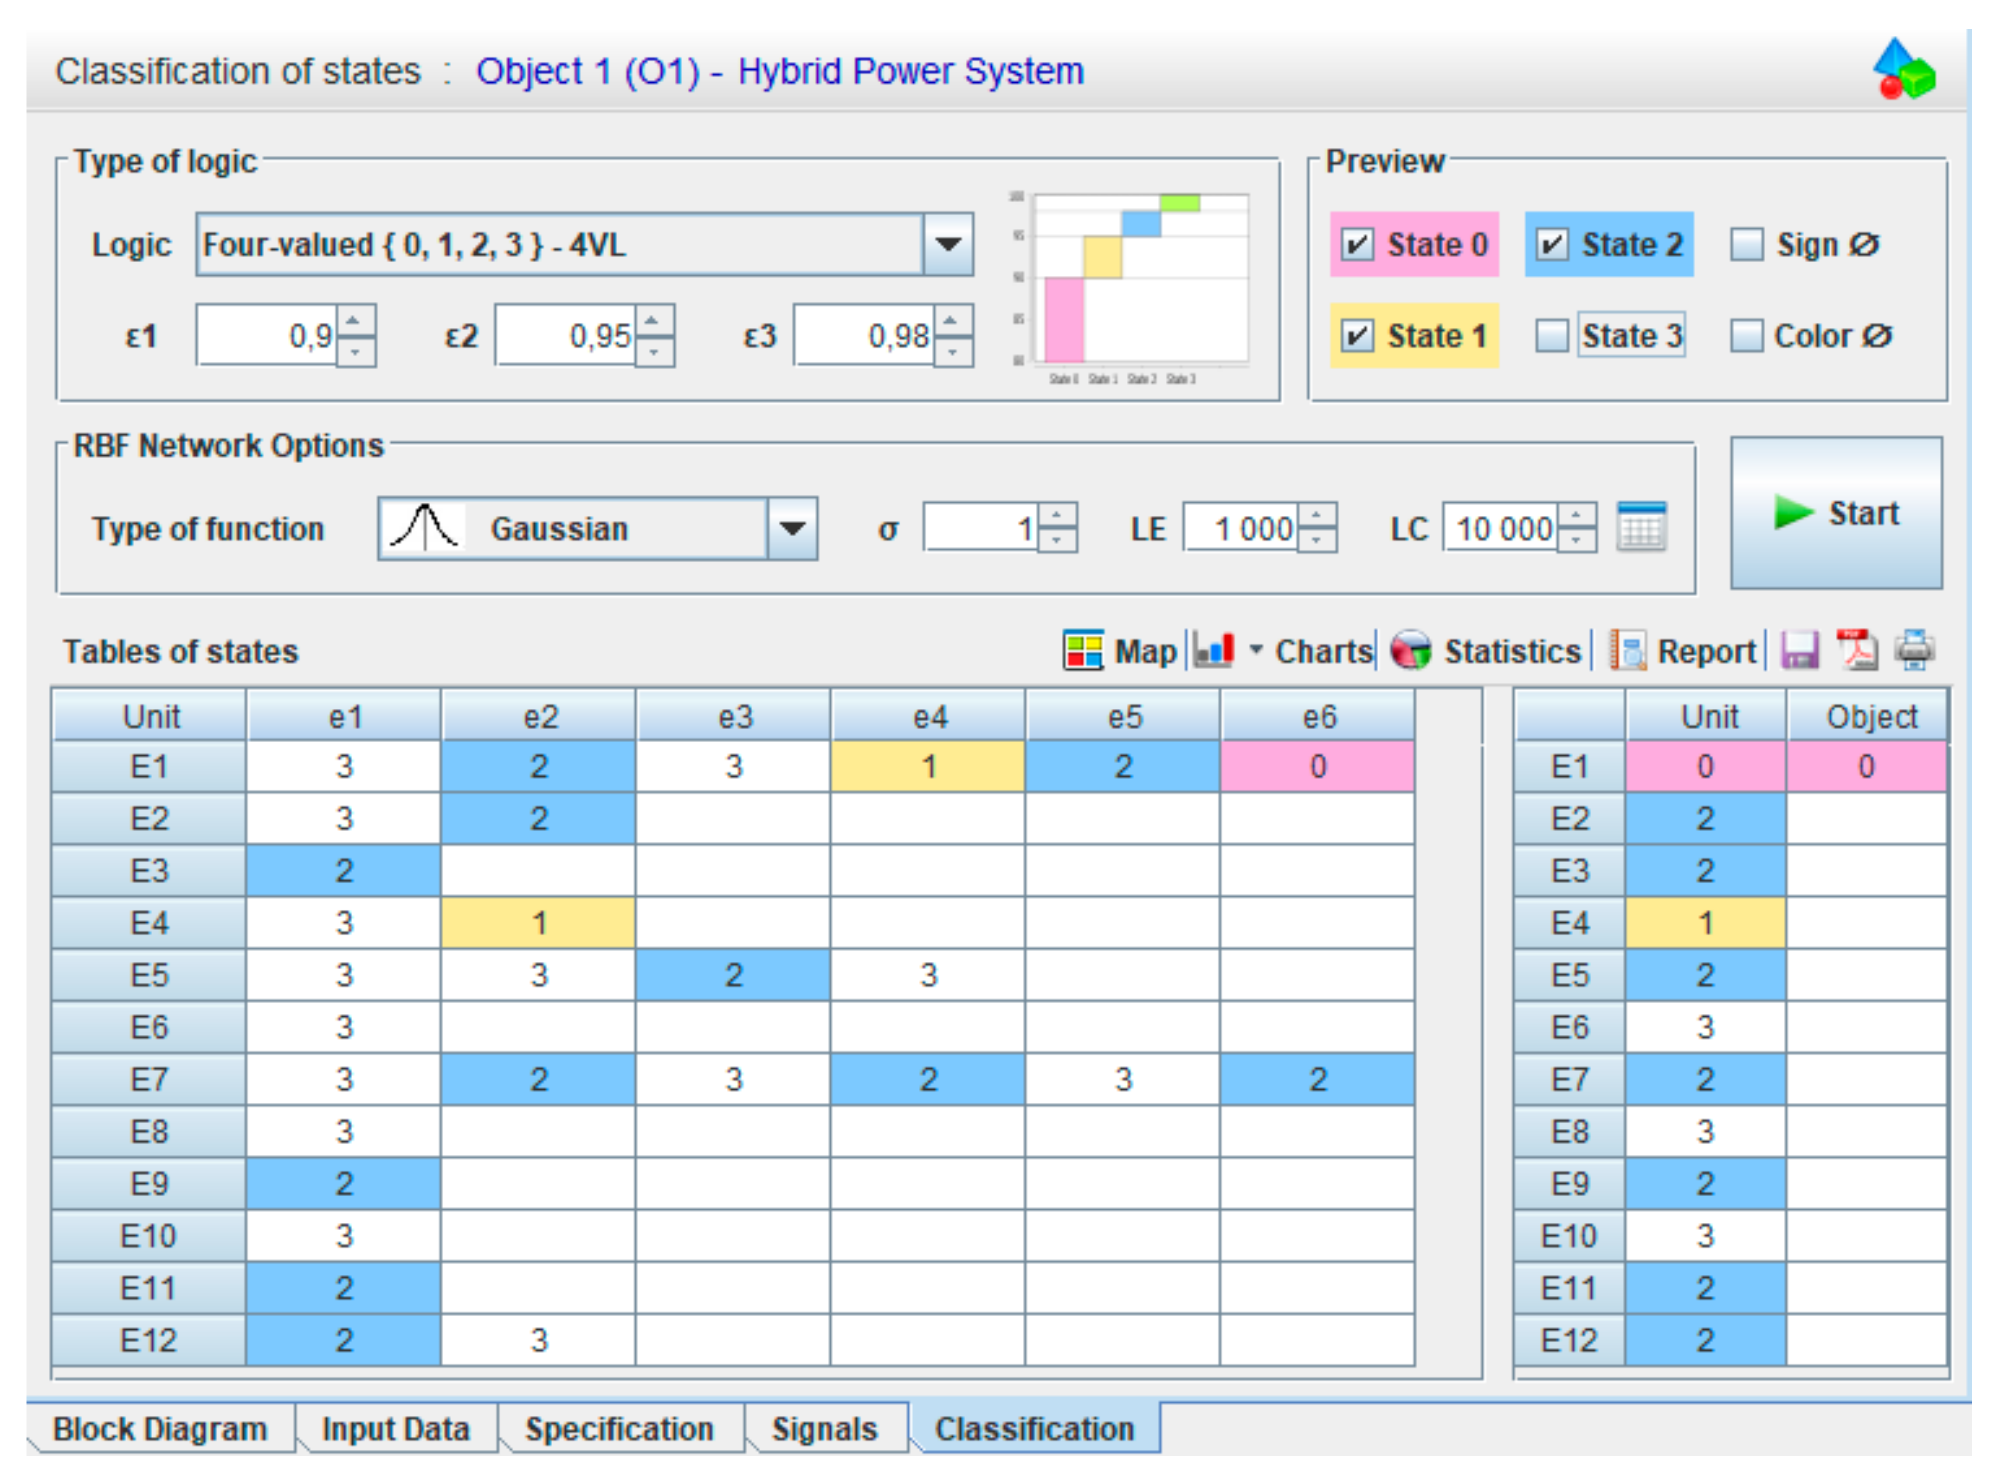
4. Research and Analysis of Multi-Valued Diagnoses Developed by the DIAG 2 System for Devices of the Electric Hybrid Power System for HoW
The process of the classification of states in the computer system described here is carried out after selecting the “Classification” panel. This panel includes configuration options and resultant state tables (state maps). As part of the configuration, the following are defined: the type of state logic and the range of their intervals; options for visual presentation in the state table; and RBF network parameters. The object states accepted for multi-valued logic were defined in Polish standards concerning the reliability and quality of service [
6,
33,
34,
35,
36,
37,
38,
39] (
Figure 8 and
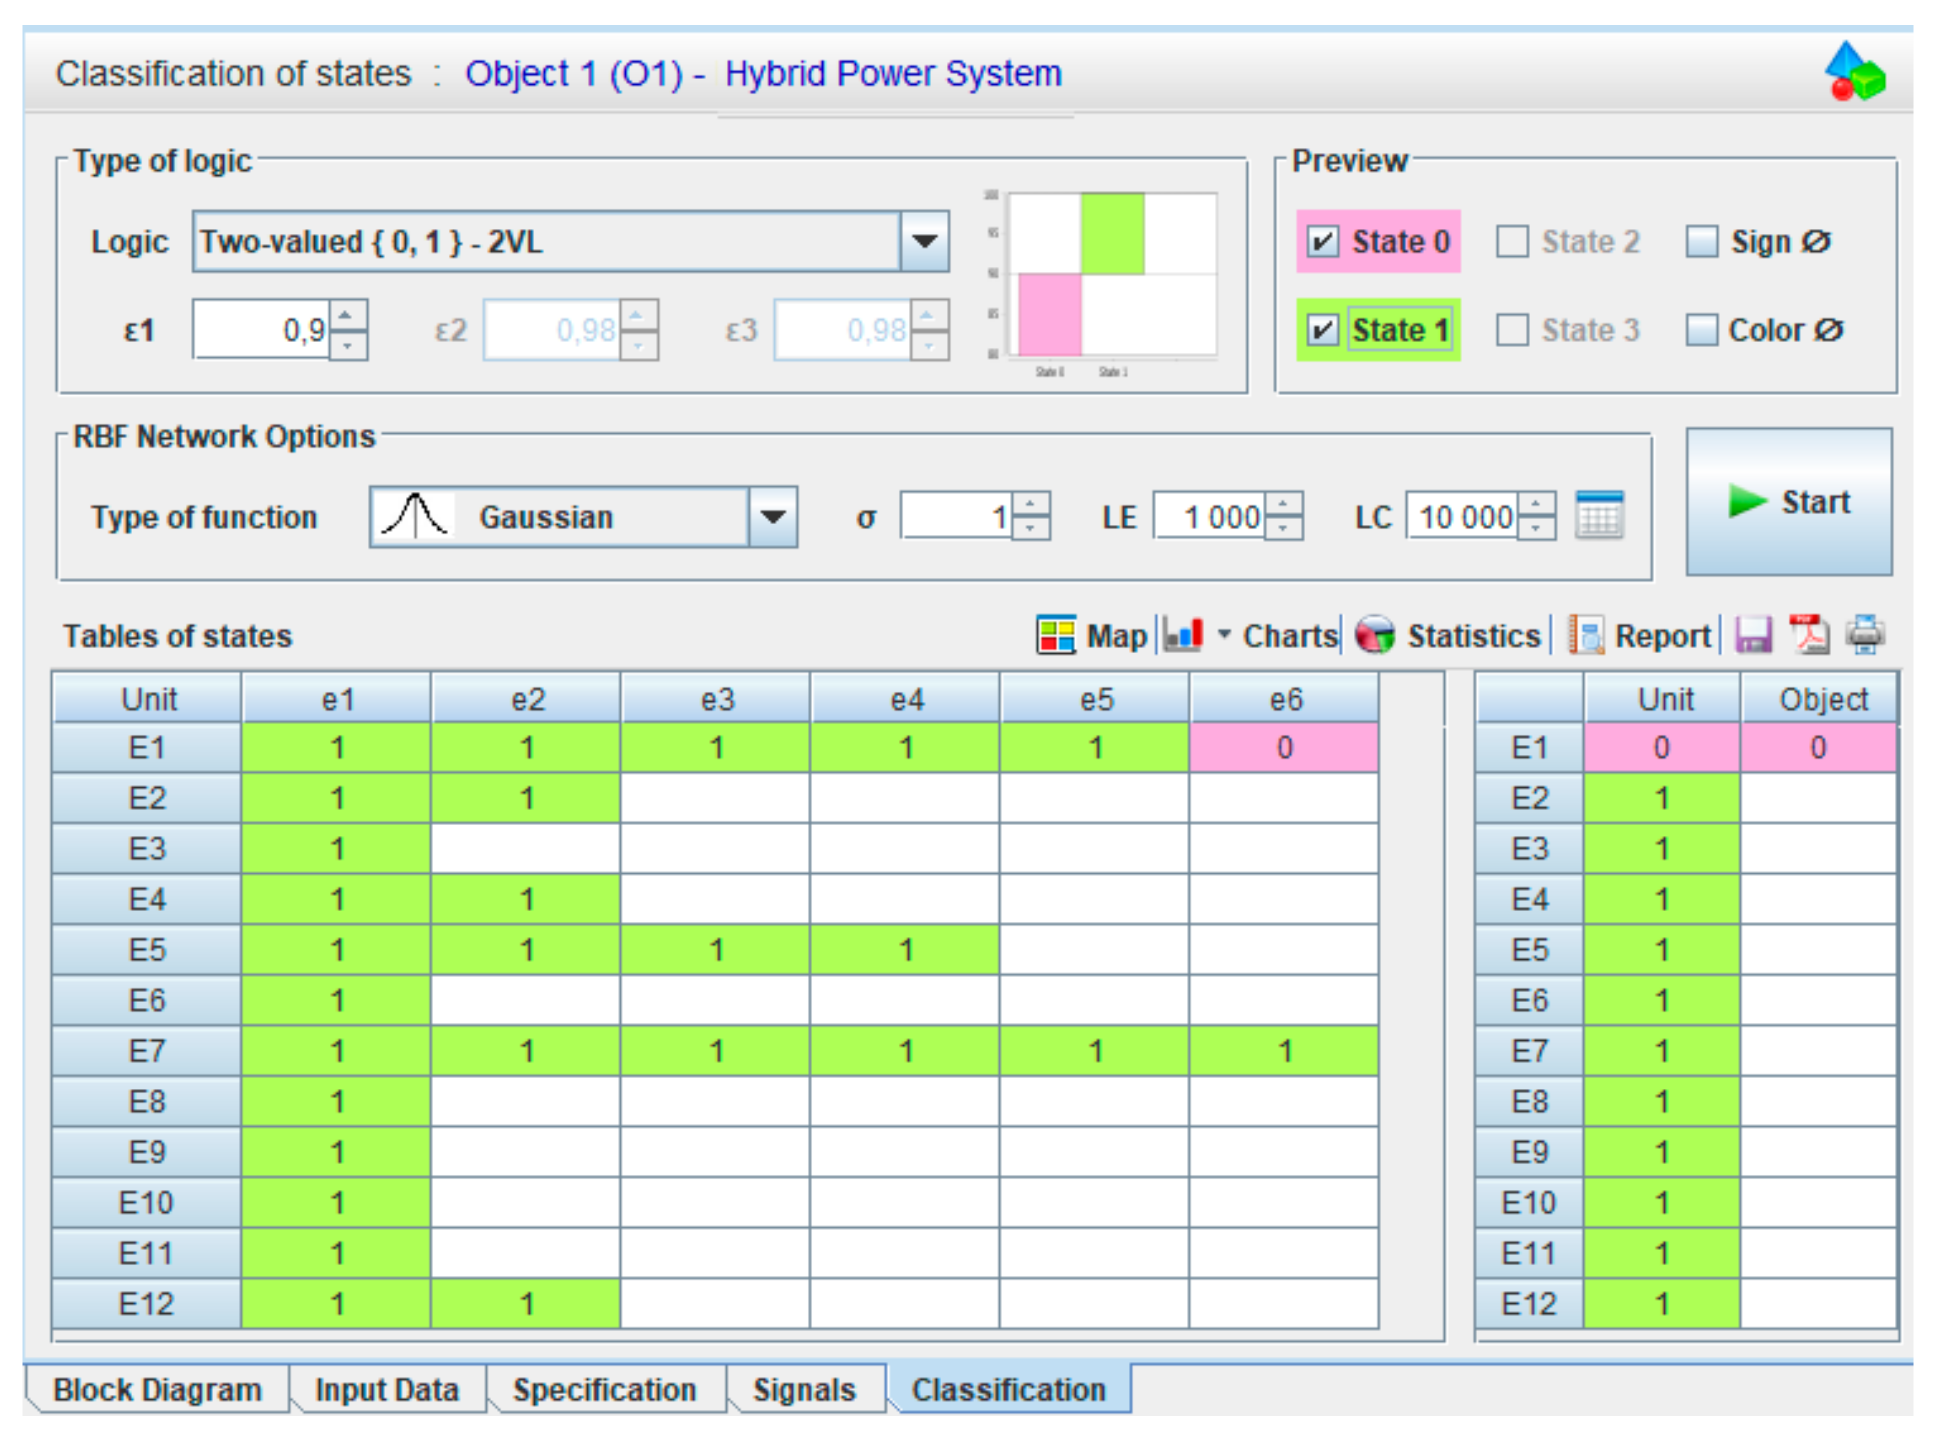
Figure 9). Therefore, the classification stage in the diagnosis process determines a specific state for each basic element of the technical object examined. Therefore, we checked whether the values of the output signals of individual elements were within the range of their permissible changes. The classification of states for functional assemblies or the object itself is determined on the basis of the classification rules and it depends on the valence of the logic.
The results obtained from the diagnostics of the object examined are presented in
Figure 8 and
Figure 9. The results obtained of the diagnosis process in the intelligent diagnostic system (DIAG 2) can be presented in various convenient graphic forms. The basic form of the diagnostic information obtained in the program (DIAG 2), which is presented in
Figure 9, is the “Status table” of the object.
The final form of diagnostic information concerning the states of the object examined, in which 27 j
th basic elements (modules) located in the i
th functional units are distinguished in its internal structure. The resulting form of the program DIAG 2 in the form of the “Object states table” for (2VL): bivalent state evaluation is presented in
Figure 9. It is the final form of diagnostic information about the technical conditions of the object examined. In the internal structure of the object examined, 28 j
th basic elements (modules) were distinguished in the i
th functional units. An analysis of
Figure 10 and
Figure 11 demonstrates that the basic elements from the subset {e
1,1; e
1,2; e
1,3; e
1,4; e
1,5; e
1,6; e
2,1; e
2,2; e
3,1; e
4,1; e
4,2; e
5,1; e
5,2; e
5,3; e
5,4; e
6,1; e
7,1; e
7,2; e
7,3; e
7,4; e
7,5; e
7,6; e
8,1; e
8,2; e
9,1; e
10,1; e
11,1; e
12,1; e
12,2} possess the state “1”: fitness. The percentage share of these j
th elements in the i
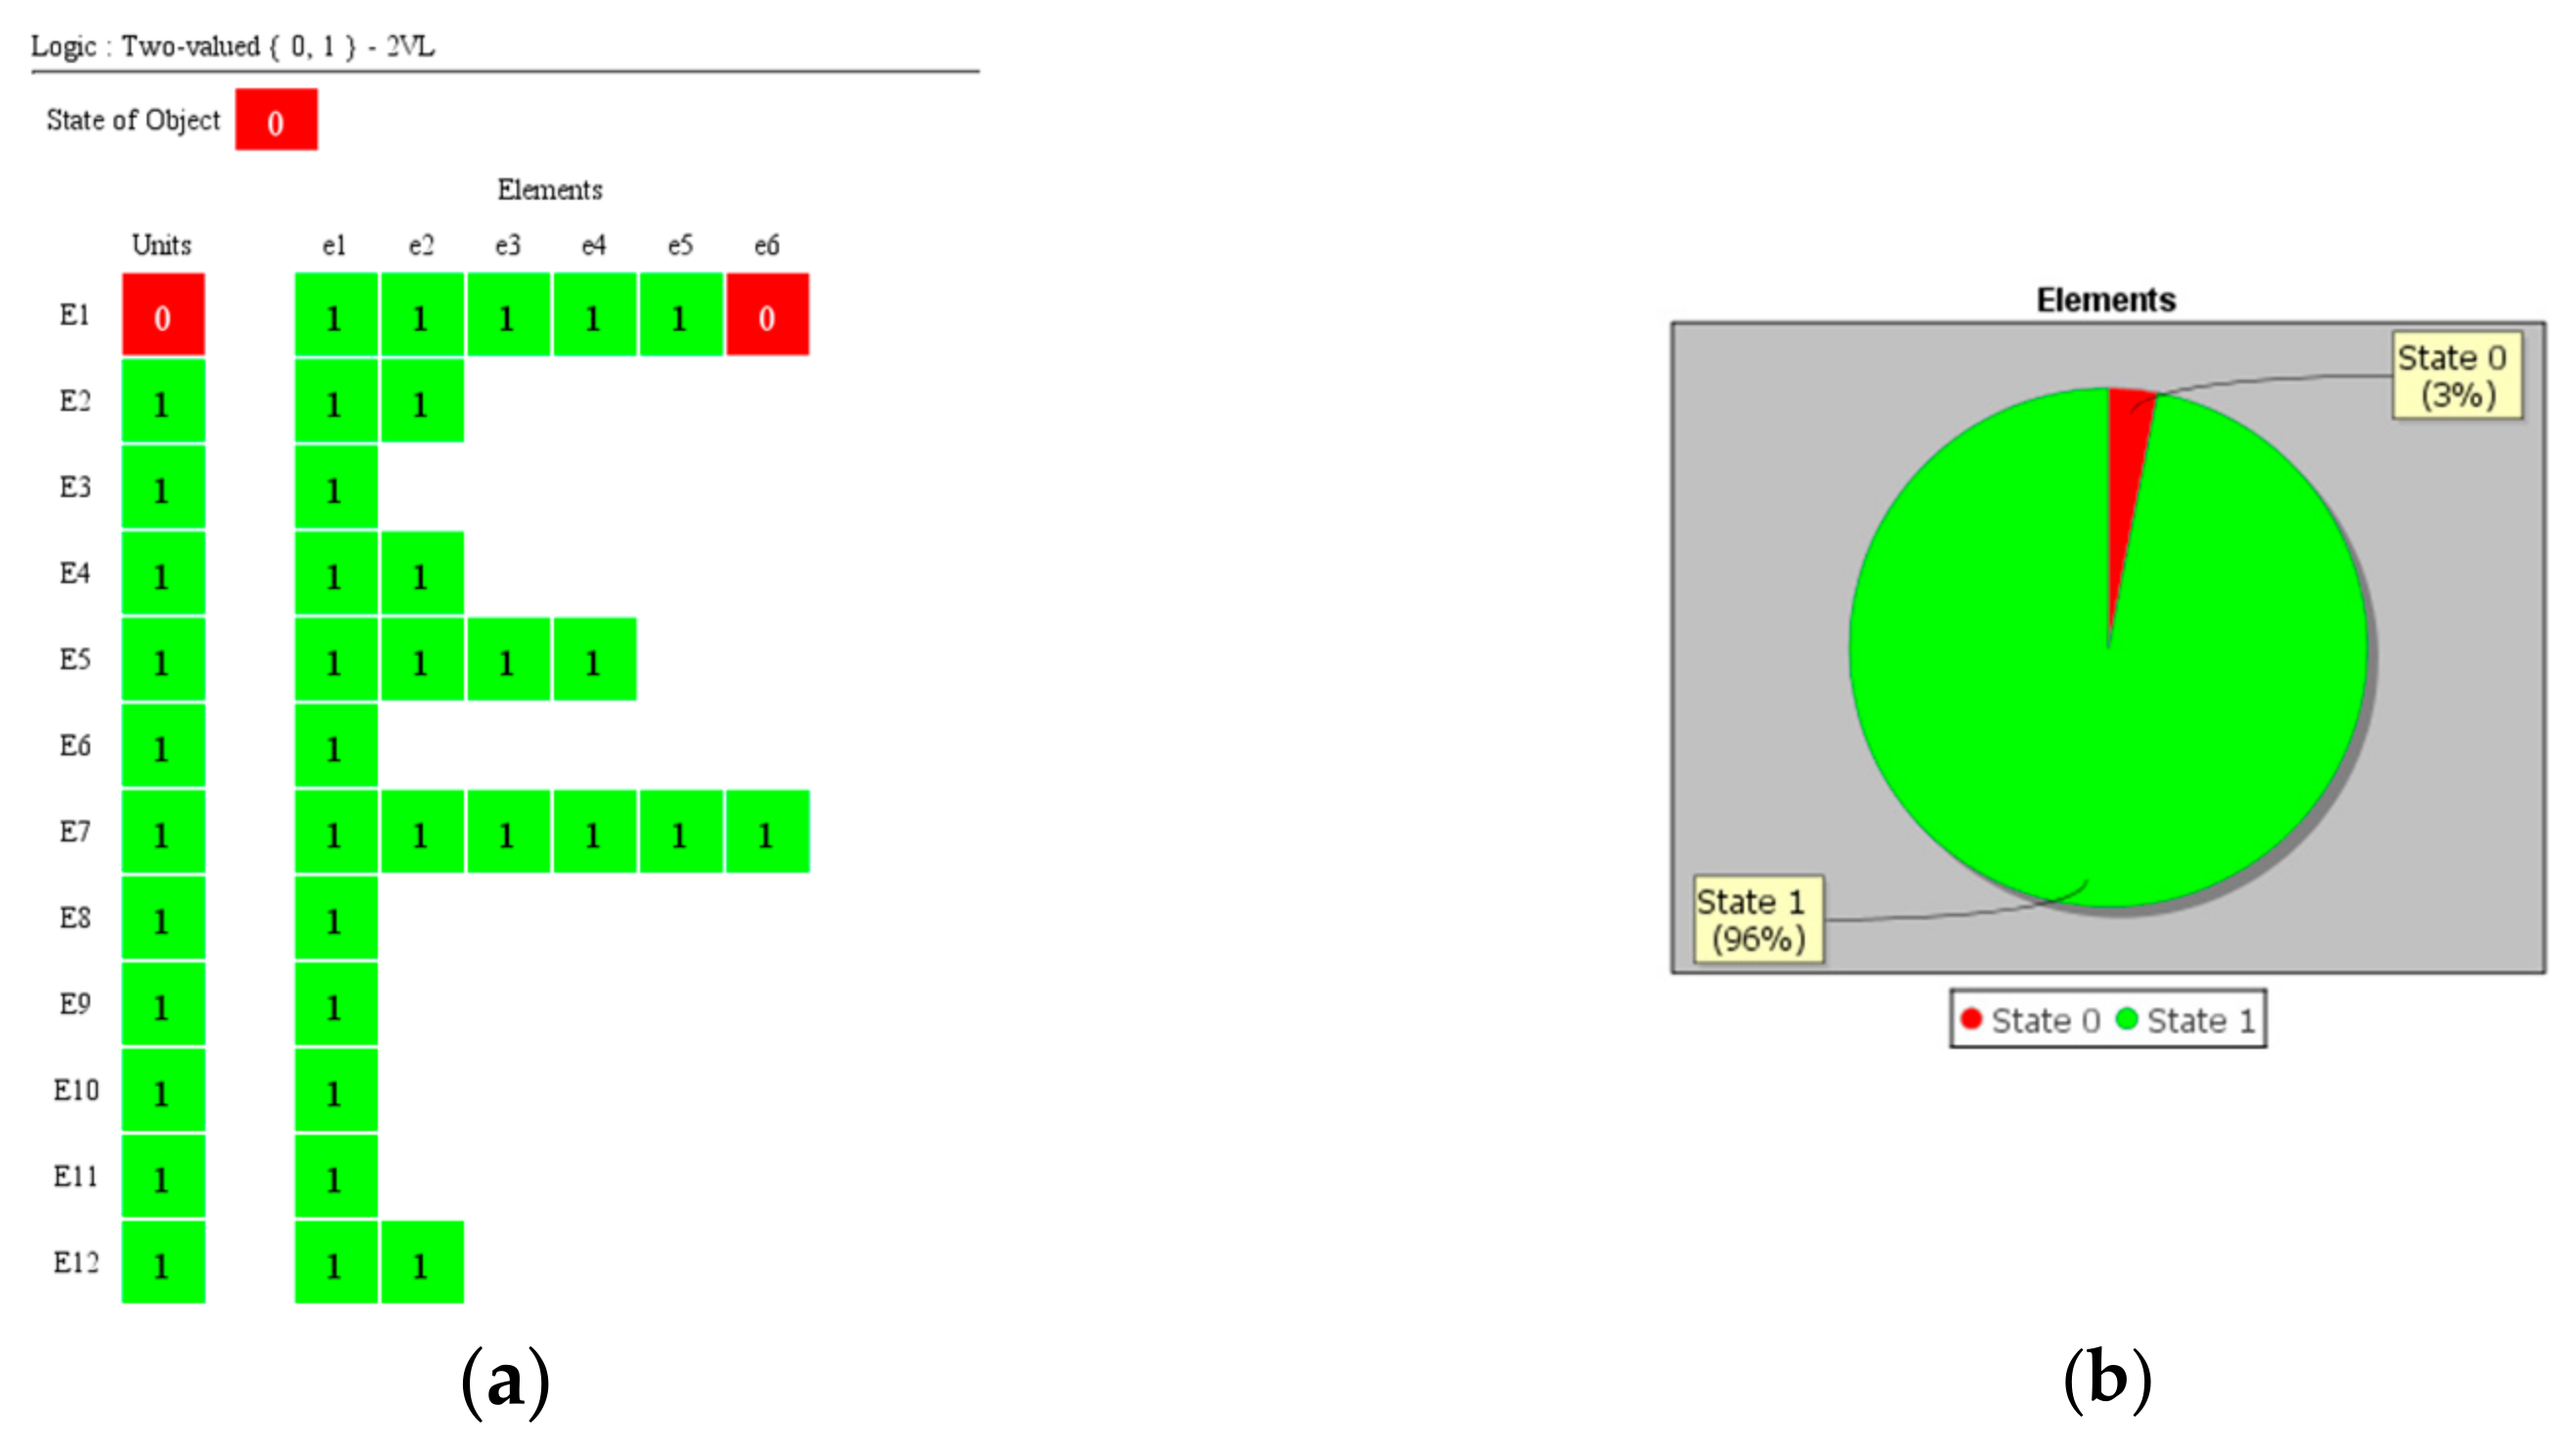
th assemblies of the object with the fitness condition in the structure of the object tested is 96%. However, one basic element {e
1,6} possesses the “0” state: unfitness, which constitutes 4%.
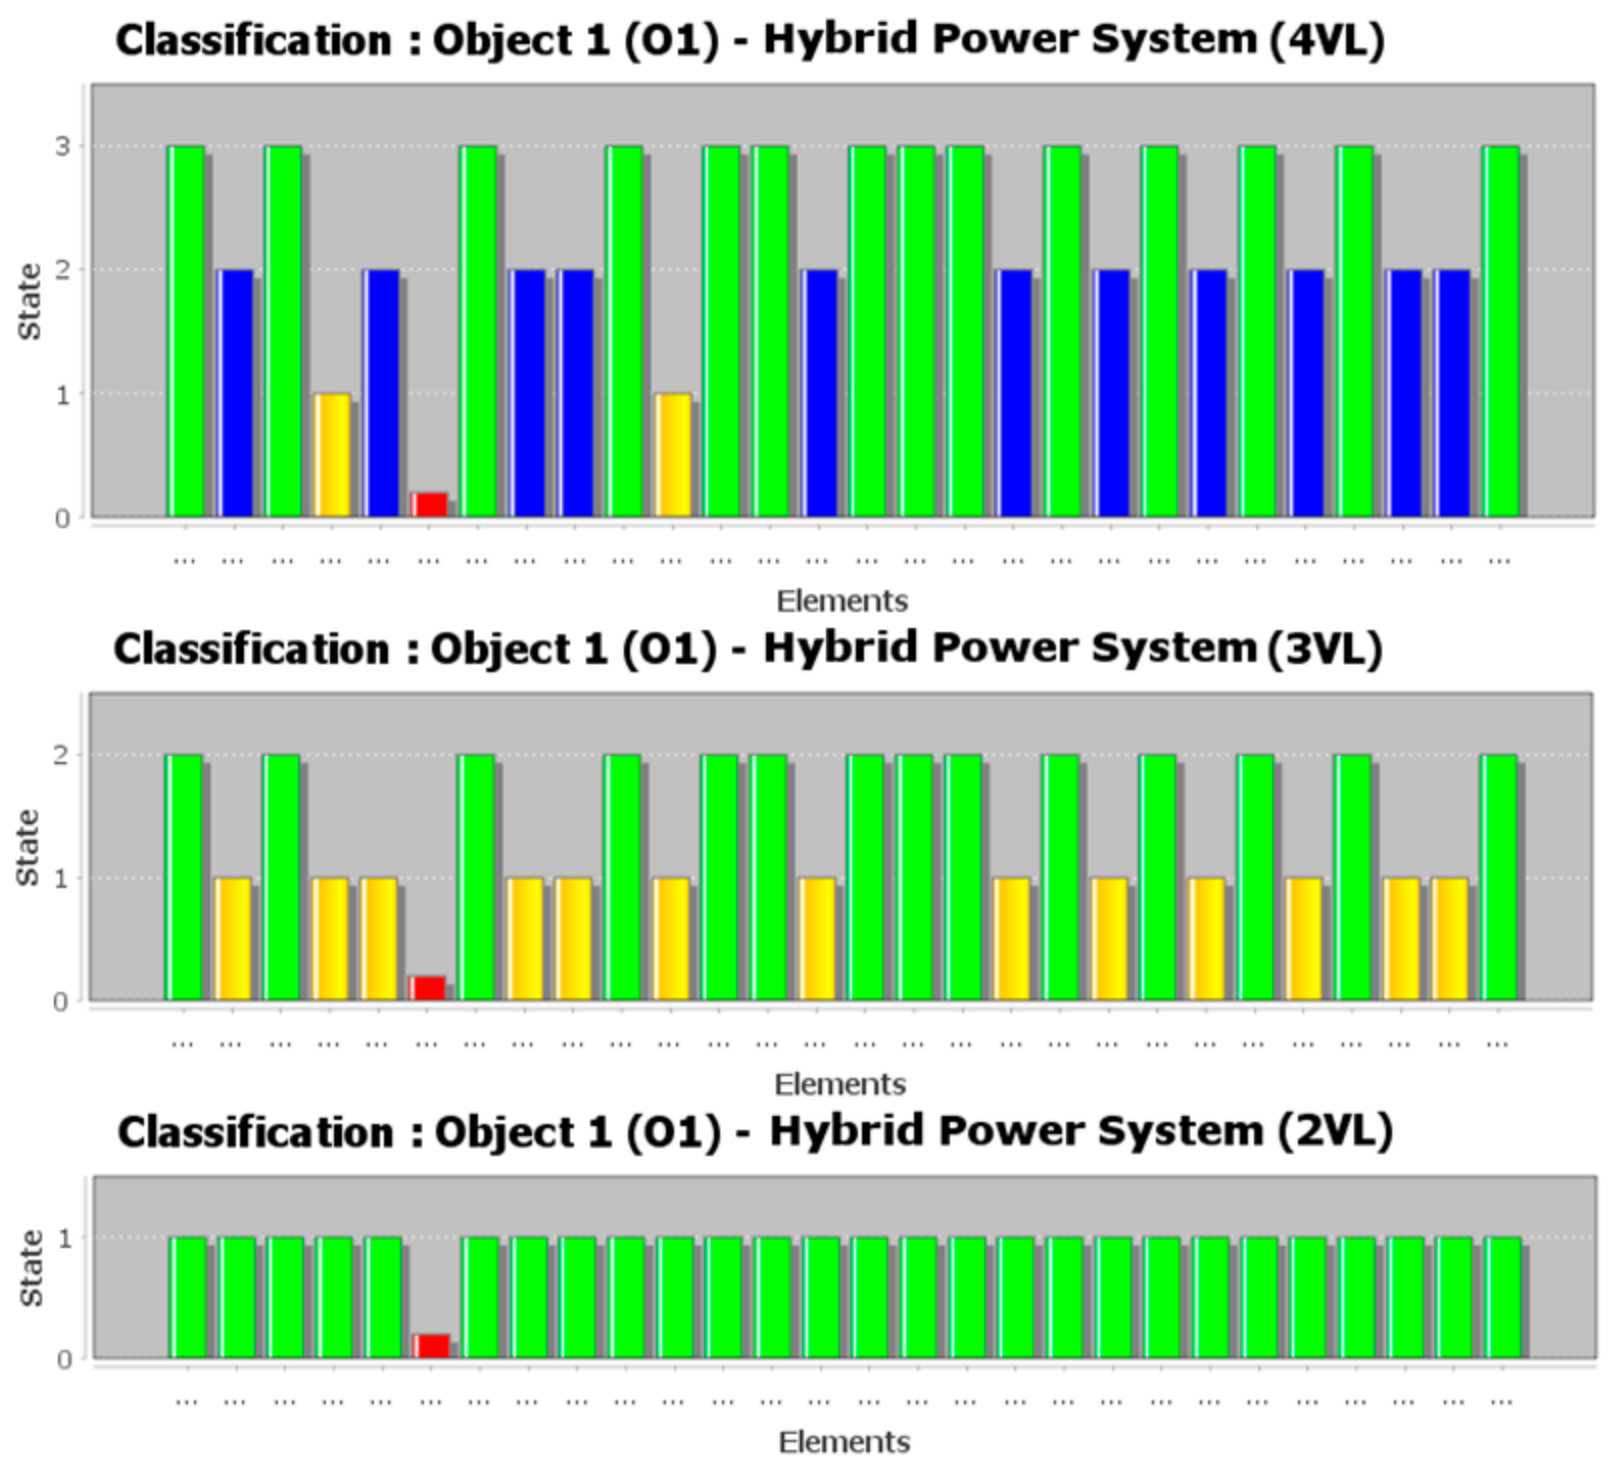
Other graphic forms of final information, such as charts, histograms, and reports, are also possible to visualize. A combination of the individual forms of presentation permits a more precise analysis or a more effective comparison of the results of the final diagnostic information for different kth valences of the state evaluation logic applied.
Figure 10 and
Figure 11 show the diagnostic information in 3-valued logic.
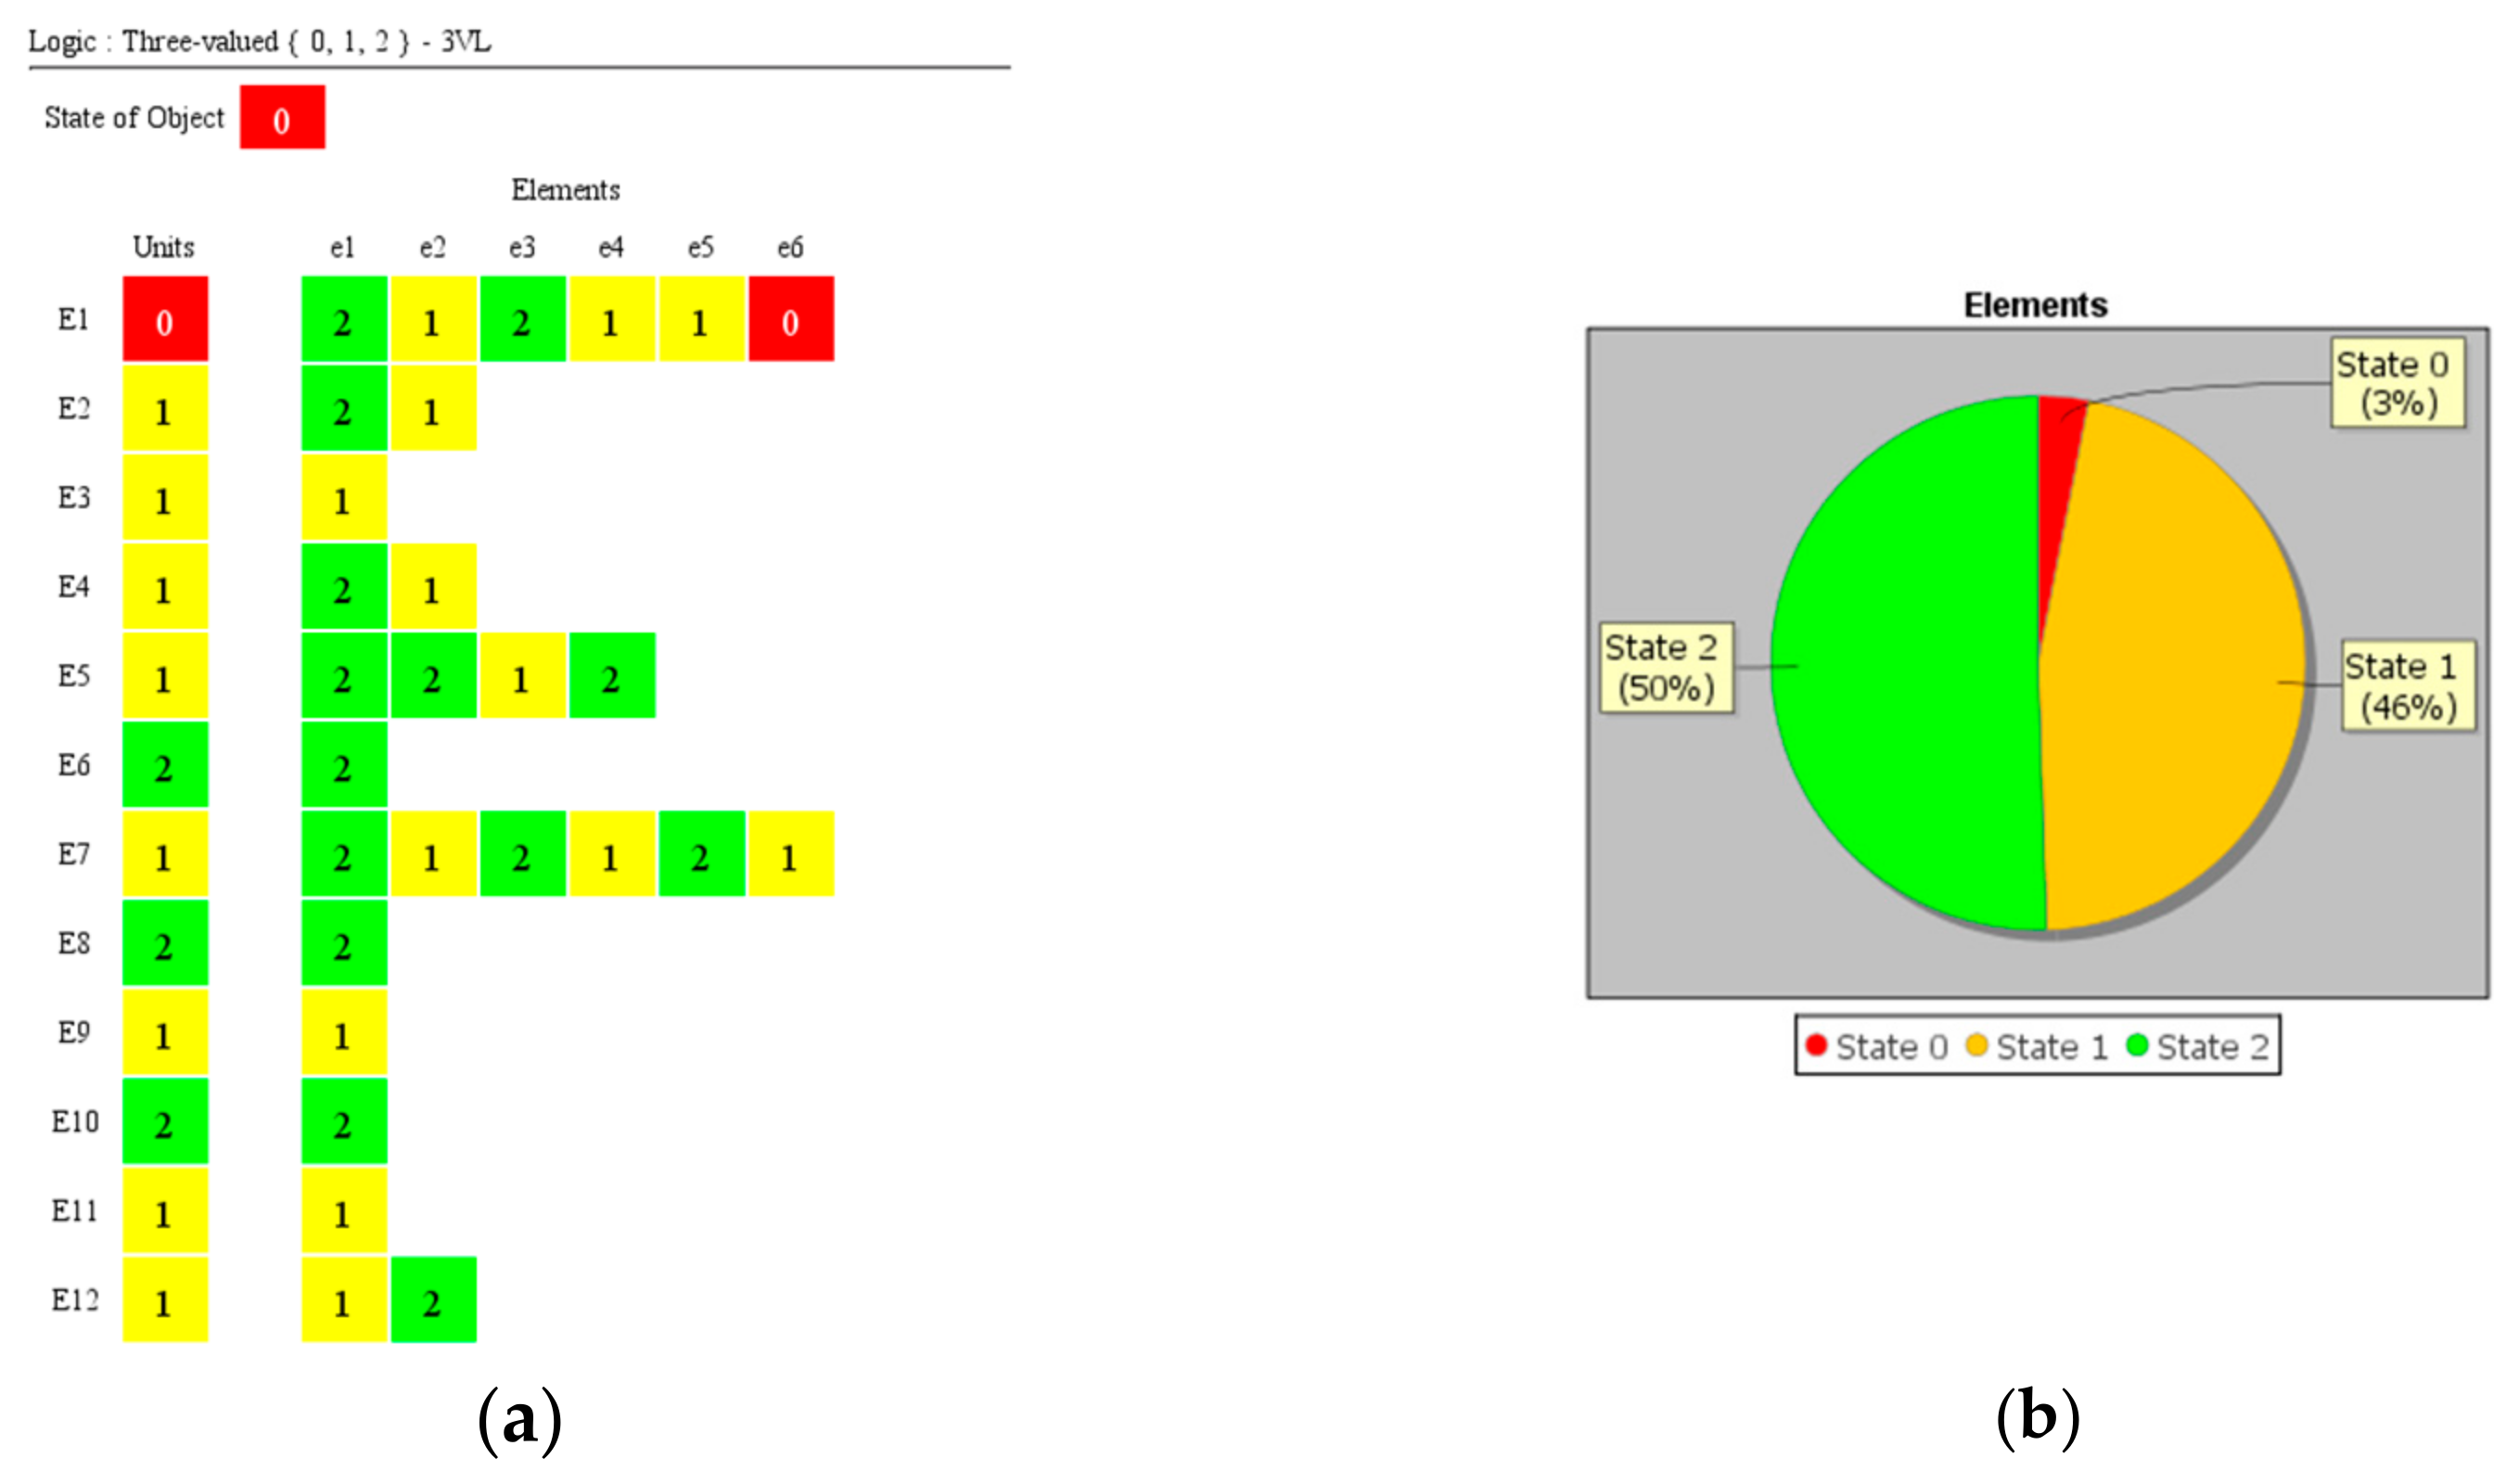
Figure 10 shows diagnostic information in 3-valued logic. An analysis of
Figure 10 demonstrates that the basic elements from the subset {e
1,1; e
1,3; e
2,1; e
4,1; e
5,1; e
5,2; e
5,4; e
6,1; e
7,1; e
7,3; e
7,5; e
8,1; e
10,1; e
12,2} possess state “2”: fitness. The share of the j
th elements in the i
th assemblies of the object with the condition of fitness in the structure of the object tested is 50%. However, the following basic elements tested from the subset {e
1,2; e
1,4; e
1,5; e
2,2; e
4,2; e
7,2; e
7,4; e
7,6; e
9,1; e
11,1; e
12,1} possess state “1”: incomplete. The share of the j
th elements of incomplete condition in the structure of the object tested is 46%. A single basic element {e
1,6} possesses state “0”: unfitness, which is 4%.
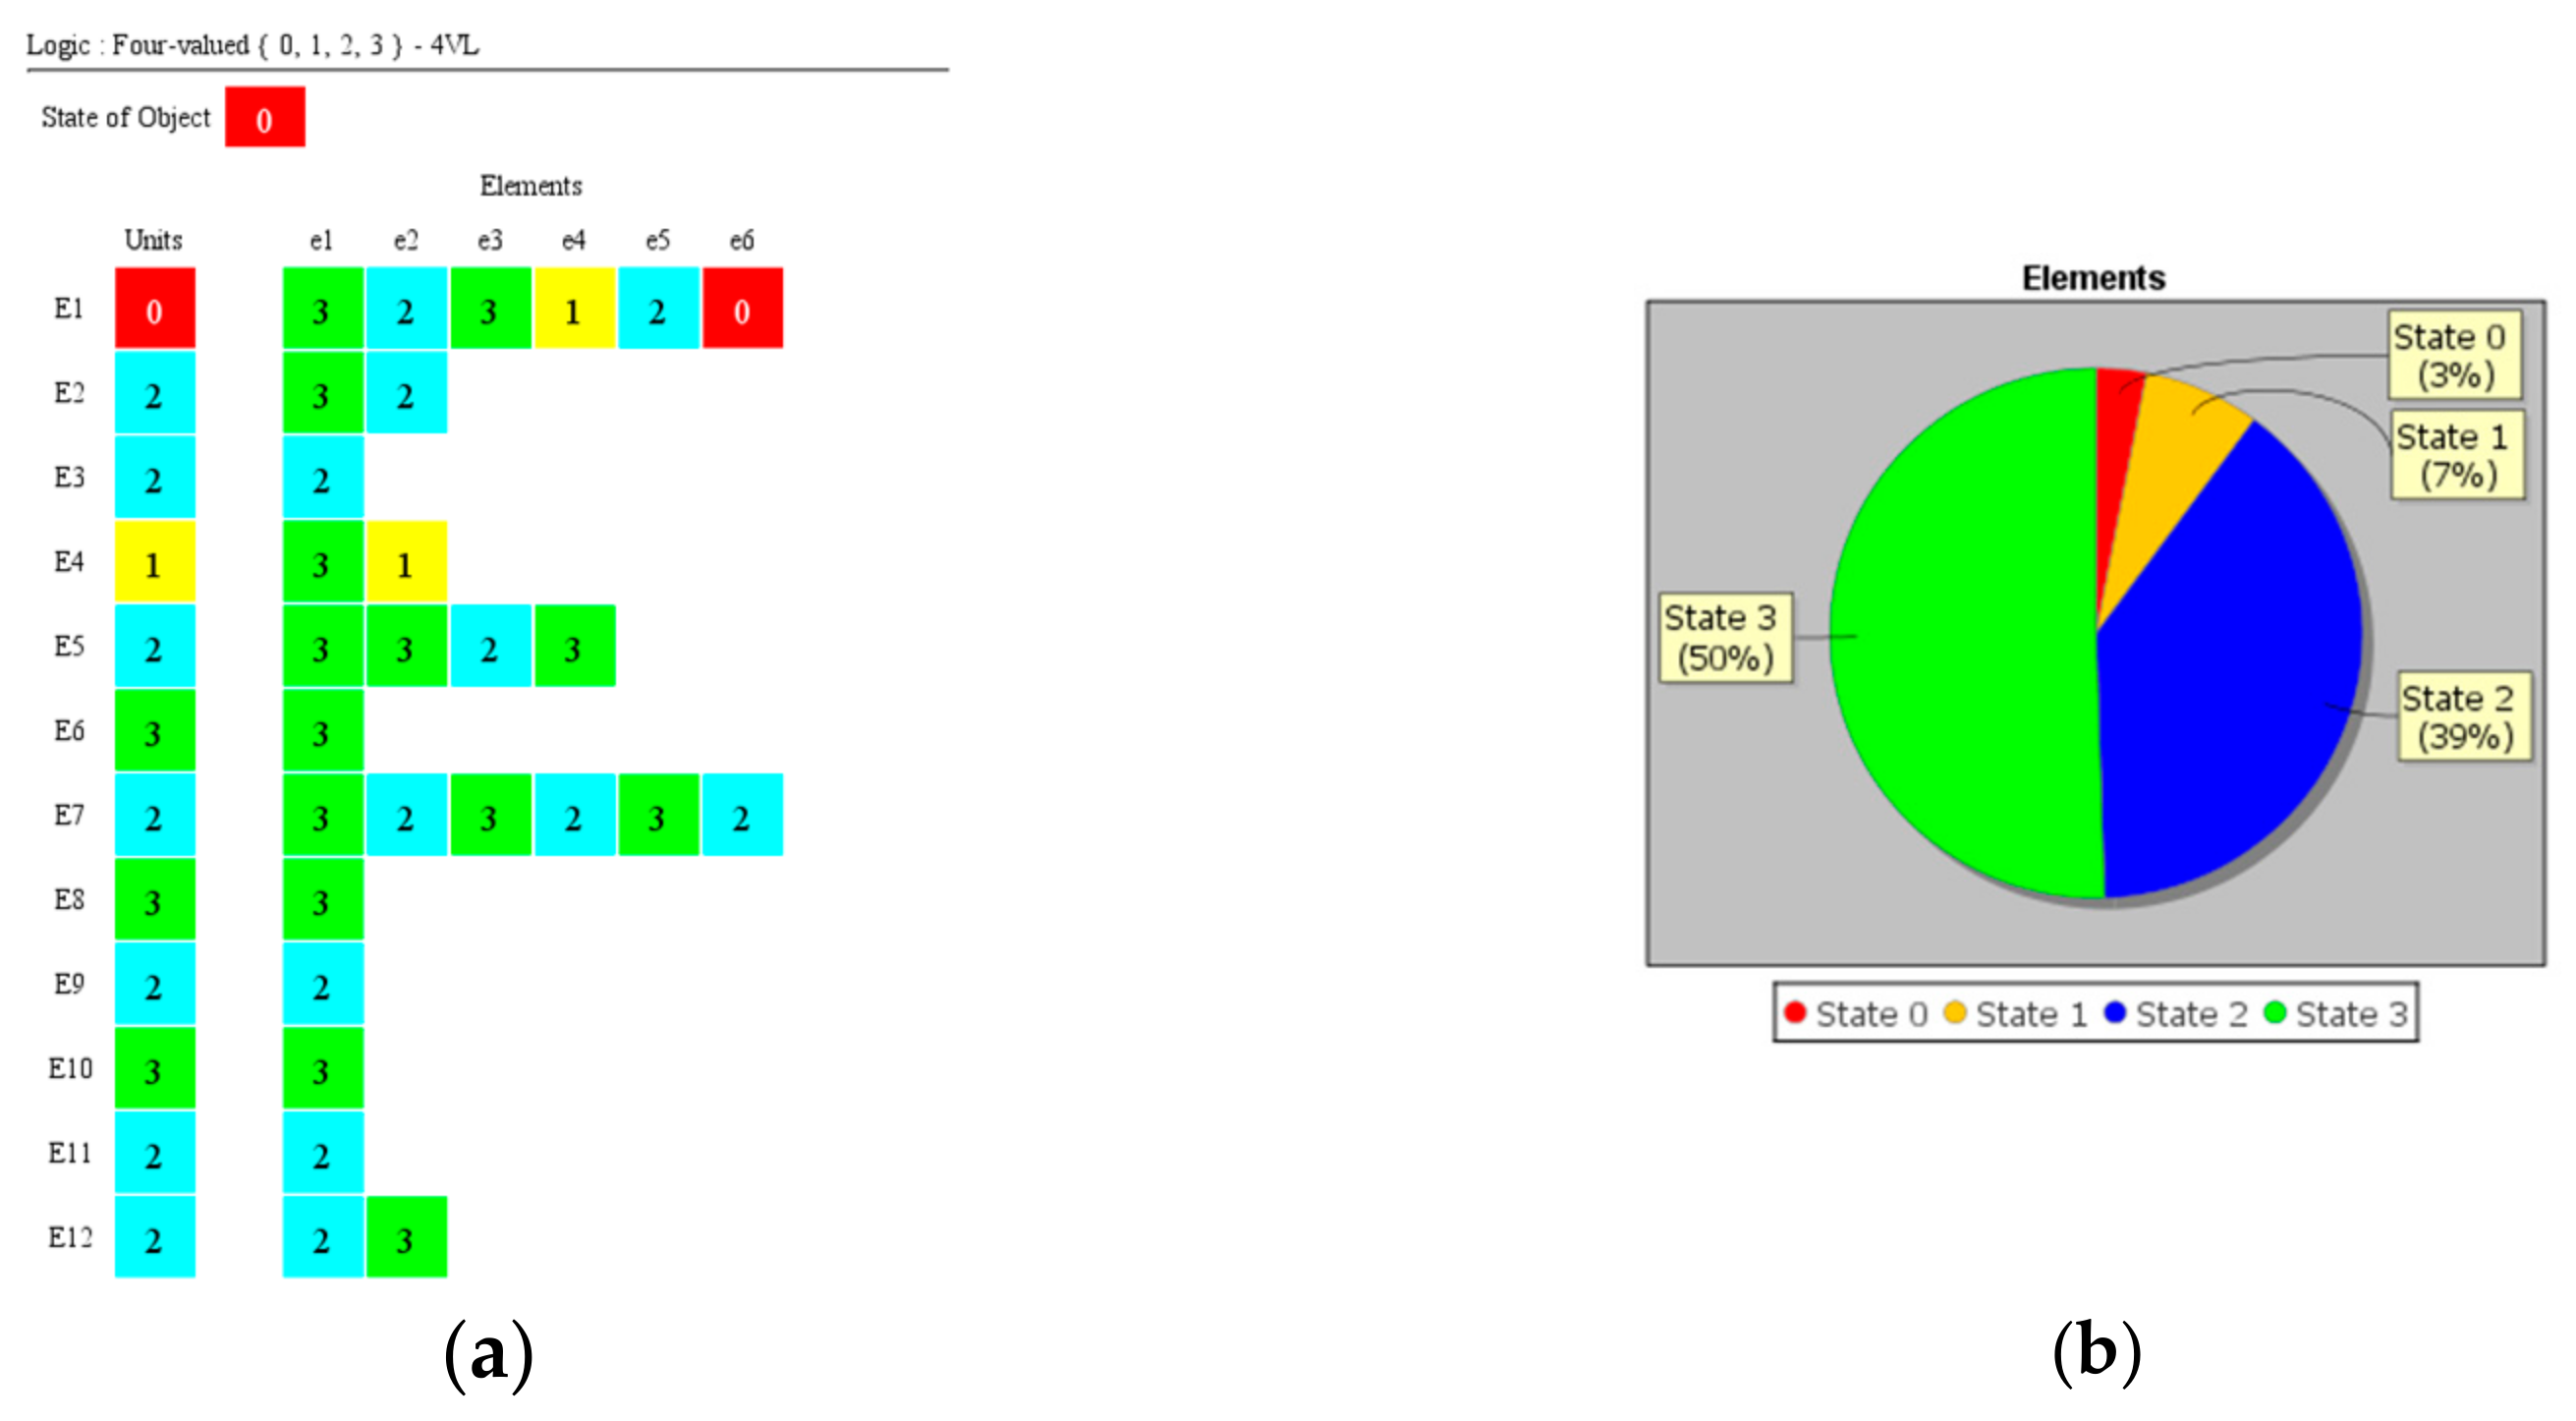
Figure 12 and
Figure 13 show the diagnostic information in 4-valued logic. The final form of diagnostic information about the states of the object examined, where 27 j
th basic elements (modules) located in the i
th functional units are distinguished in its internal structure. An analysis of
Figure 12 shows that the basic elements from the subset {e
1,1; e
1,3; e
2,1; e
4,1; e
4,2; e
5,1; e
5,2; e
5,4; e
6,1; e
7,1; e
7,3; e
7,5; e
8,1; e
10,1; e
12,2} possess state “3”: fitness. The share of the j
th elements in the i
th assemblies of the object with the condition of fitness in the structure of the object tested is 50%.
However, the following basic elements tested from the subset {e1,2; e1,5; e2,2; e3,1; e5,3; e7,2; e7,4; e7,6; e9,1; e11,1; e12,1} possess state “2”: incomplete. The percentage share of these jth elements of incomplete condition in the structure of the object tested is 39%. The remaining subset examined of basic elements from the set {e1,4; e4,2} possess state “1”: critical fitness. The share of these jth elements with the state of critical fitness in the structure of the object tested is 7%. Only a single basic element {e1,6} possesses state “0”: unfitness, which is 4%.
5. Examination of Informational Value in Multi-Valued Logic Developed by the DIAG 2 Smart Diagnostic System
An informational analysis of diagnoses developed by the DIAG 2 system in k-valued logics (at k = 2, 3, and 4) was carried out on the basis of the final form of diagnostic information about the state of the object examined contained in
Figure 9,
Figure 11,
Figure 13 and
Figure 14. The analyses contained in
Figure 9,
Figure 11,
Figure 13 and
Figure 14 show that in the internal structure of the technical object tested, 27 j
th basic elements (modules) were distinguished in the i
th functional units. The form of the program results (DIAG 2) in the form of “Map of the state of the object elements” for two-valued state assessment (2VL) is presented in
Figure 14.
An analysis of
Figure 9,
Figure 11,
Figure 13 and
Figure 14 shows that the 26 j
th basic elements possess state “1”: capability. In the implemented information analysis of diagnoses developed by the (DIAG 2) system, the “Pie chart of the percentage of object element states” (
Figure 14) meets the requirements. Based on the diagnostic information presented in the form of the “Pie chart of the percentage of states” presented in
Figure 14, it can be seen that the percentage share of the j
th elements in the i
th assemblies of the object with a “1” condition in the structure of the object tested is 96%. Only one j
th basic element in the object possesses state “0”: unfitness, which constitutes 4%.
An informational analysis of diagnoses developed by the (DIAG 2) system in 3-valued logic was carried out on the basis of the final form of diagnostic information about the state of the object examined, contained in
Figure 9,
Figure 11,
Figure 13 and
Figure 14. An analysis of
Figure 13 and
Figure 14 shows that in the internal structure of the technical object examined, 27 j
th basic elements (modules) were distinguished in the i
th functional units. The form of the program results (DIAG 2) in the form of “Map of the state of the object elements” for three-valued state assessment (3VL) is presented in
Figure 14. An analysis of
Figure 14 shows that the 14 j
th basic elements possess state “2”: the state fitness, the 13th basic elements possess state “1”: the state of incomplete fitness.
Based on the diagnostic information presented in the form of the “Pie chart of the percentage of states” presented in
Figure 13, it can be seen that the percentage share of the j
th elements in the i
th assemblies of the object with “2”: condition of fitness in the structure of the object tested is 50%. On the other hand, the percentage share of the j
th elements in the i
th assemblies of the object with “1”: incomplete fitness in the structure of the object tested is 46%. Only one j
th basic element in the object possesses state “0”: unfitness, which constitutes 4%.
An informational analysis of diagnoses developed by the (DIAG 2) system in 4-valued logic was carried out on the basis of the final form of diagnostic information about the state of the object examined, contained in
Figure 12,
Figure 13 and
Figure 14. An analysis of
Figure 12,
Figure 13 and
Figure 14 shows that in the internal structure of the technical object examined, 27 j
th basic elements (modules) were distinguished in the i
th functional units. The results of the program (DIAG 2) in the form of “Object element state maps” for (4VL): four-valued state evaluation are presented in
Figure 14.
An analysis of
Figure 14 shows that 14 of the j
th basic elements possess state “3”: the condition of fitness; 11 of the j
th basic elements possess state “2”: the state of incomplete fitness; and the two j
th basic elements possess state “1”: the critical fitness condition. Based on the diagnostic information presented in the form of the “Pie chart of the percentage of states” presented in
Figure 14, it can be seen that the percentage share of the j
th elements in the i
th assemblies of the object with a “3” condition in the structure of the object tested is 50%.
On the other hand, the percentage share of the jth elements in the ith assemblies of the object with “2”: the state of incomplete fitness in the structure of the object tested is 39%. The next percentage share of the jth elements in the ith complexes of the object with “1”: the state of critical fitness in the structure of the object tested is 7%. Only one jth basic element, similarly to the logic 2VL and 3VL, possesses state “0”: failure, which constitutes 4%.
An analysis related to the informational value of the diagnoses developed by the (DIAG 2) system in 3- and 4-valued logic, carried out on the basis of diagnostic information about the conditions of the object examined, contained in
Figure 13 and
Figure 14, indicates that these are technical conditions of the object, except for the conditions of fitness and unfitness, which are common to all logics tested (k = 2, 3, and 4).
Conclusion: any possible increase in information for (3VL)—trivalent logic (in relation to (2VL)—divalent logic) is determined by the set of incomplete conditions for 13 jth elements of the object, which is 46%.
On the other hand, in four-valued logic (4VL) it is determined by the set of incomplete fitness states for the 11 jth elements of the object, which is 39%, and by the set of critical fitness states for two jth elements, which is 7%. In total, in logic (4VL), an increase in informational value for four-valued logic (4VL) (in relation to divalent logic (2VL)) is 46%.
A similar analysis of the information gain can be performed for the four-valued logic (4VL) in relation to the trivalent logic (3VL). Technical states of the object should be ignored, except for the states of fitness and unfitness, which are common to both logics, such state is the state of incomplete fitness. An additional state occurring only in four-valued logic (4VL) is state “1”: the state of critical fitness. In four-valued logic (4VL), state “1” is recognized: the state of critical fitness for two jth elements, which constitutes 7%.
Conclusion: any possible increase in informational value for four-valued logic (4VL) (in relation to trivalent logic (3VL)) is determined by the set of critical fitness states for 2 jth elements of the object, which is 7%.
6. Conclusions
The paper presents the problems of the study and an assessment of the increase in the informational value of diagnoses developed by the (DIAG 2) intelligent diagnostic system in k-valued logics (at k = 2, 3, and 4) compiled in the form of “Table state of the object” for each of the tested logics for the electrical power supply devices installed in HoW. Additionally, the problem of the assessment of informational value of the diagnoses was extended to an analytical assessment of this problem on the basis of the dependencies developed for 4-valued and 3-valued logic. The (DIAG 2) system used in the research is a proprietary solution of the team of the authors functioning in one of the multi-valued logics that can be selected, including: 2-, 3-, and 4-valued logics. The task of the (DIAG) system is to develop a diagnosis in the appropriate valence of the state assessment, e.g., 4-valued (4VL). The properly identified states of the functional elements, and then the states of the structural units in the facility, inform the user about the serviceability state of the hybrid power system. The (DIAG 2) diagnostic system constitutes only a research tool in the research conducted.
The scientific goal of the authors’ team was to prove the thesis that diagnoses expressed in the 4-valued state assessment are better and more informative in relation to the diagnoses expressed in the 2- and 3-valued state assessment. It is theoretically known that an increase in the validity of diagnoses makes these diagnoses more information saturated. The problem remains, however, in the assessment of an increase in the informational value, e.g., diagnoses in the 4-valued (4VL) state assessment, 3-valued (3VL) state assessment, and 2-valued (2VL) state assessment. The testing of an engineering object’s operational state by the application of 4-valued logic diagnostics allowed an evaluation of the diagnostic information increment with 4-valued logic. In the diagnostic test, the results of which are shown in
Figure 9,
Figure 11,
Figure 13 and
Figure 14, states were determined aside from the operational and non-operational states. Hence, the increment of diagnostic information by the application of 3-valued logic and 4-valued logic was 46% from 2-valued logic.
The results obtained and the research results fully confirm this thesis. This work constitutes the first attempt to solve this problem in practice in the literature


 ,
, 


