Article

Analysis of PV Subsidy Schemes, Installed Capacity and Their Electricity Generation in Japan

1
Department of Civil and Environmental Engineering, Waseda University, 3-4-1 Okubo, Shinjuku-ku, Tokyo 169-8555, Japan
2
Department of Socio-Environmental Energy Science, Graduate School of Energy Science, Kyoto University, Yoshidahonmachi, Sakyo-ku, Kyoto 606-8501, Japan
*
Author to whom correspondence should be addressed.
Energies 2021, 14(8), 2128; https://doi.org/10.3390/en14082128
Submission received: 5 March 2021 / Revised: 8 April 2021 / Accepted: 8 April 2021 / Published: 11 April 2021
(This article belongs to the Section A2: Solar Energy and Photovoltaic Systems)

Abstract

:
Solar PV capacity growth in Japan has been facilitated by a number of government schemes that have been implemented since 1994. Publicly available capacity data are provided by a number of agencies and organisations at various resolutions and at different stages within these schemes. This study provides a comprehensive review of solar PV data sources in Japan between 1994 and 2019, as well as an introduction to the subsidy schemes and organisations involved in scheme management and data collection in Japan. As a result, the authors produced their own dataset of installed capacities and generation across time for the various regions. Lastly, this study provides insights and recommendations to policy makers regarding opportunities for improving the accessibility and quality of data from a user perspective and to enhance Japan’s presence in international research.

1. Introduction

Renewable energy sources for electricity (RES-E) are being developed worldwide to decarbonise the economy and mitigate the effects of climate change [1]. Some of the countries that have installed the greatest amount of solar photovoltaics (PV) include the USA (88.9 GW installed capacity [2], representing 2.8% of the electricity generated in the country as of 2020 [3]), the UK (13.6 GW [4] and 3.9% in 2019 [5]) and Germany (54 GW [6] and 9.3% in 2020 [7]). In Japan, solar PV and renewables in general have received increasing attention to help decarbonise the energy system following the 2011 Fukushima Earthquake and Tsunami, which caused the shutdown of the Daiichi and Daini nuclear power plants, as well as most of the nuclear fleet [8]. Solar PV in Japan has 54 GW of installed capacity (i.e., similar to that of Germany), generating 7% of electricity as of 2019 [9]. As a result, it has already reached its generation goal for 2030 [10]. This target for 2030 was quite unambitious as, in comparison, by the same year the USA aims for a 30–50% generation share from solar PV [11], the UK for 19–40.6 GW with no specific generation share target [12,13], and Germany for 100 GW and a 65% generation target for renewables as a whole [14]. While in the UK solar PV sales only took off in the mid-2000s [15], commercial development began in the 1990s in the other three countries [16,17,18].
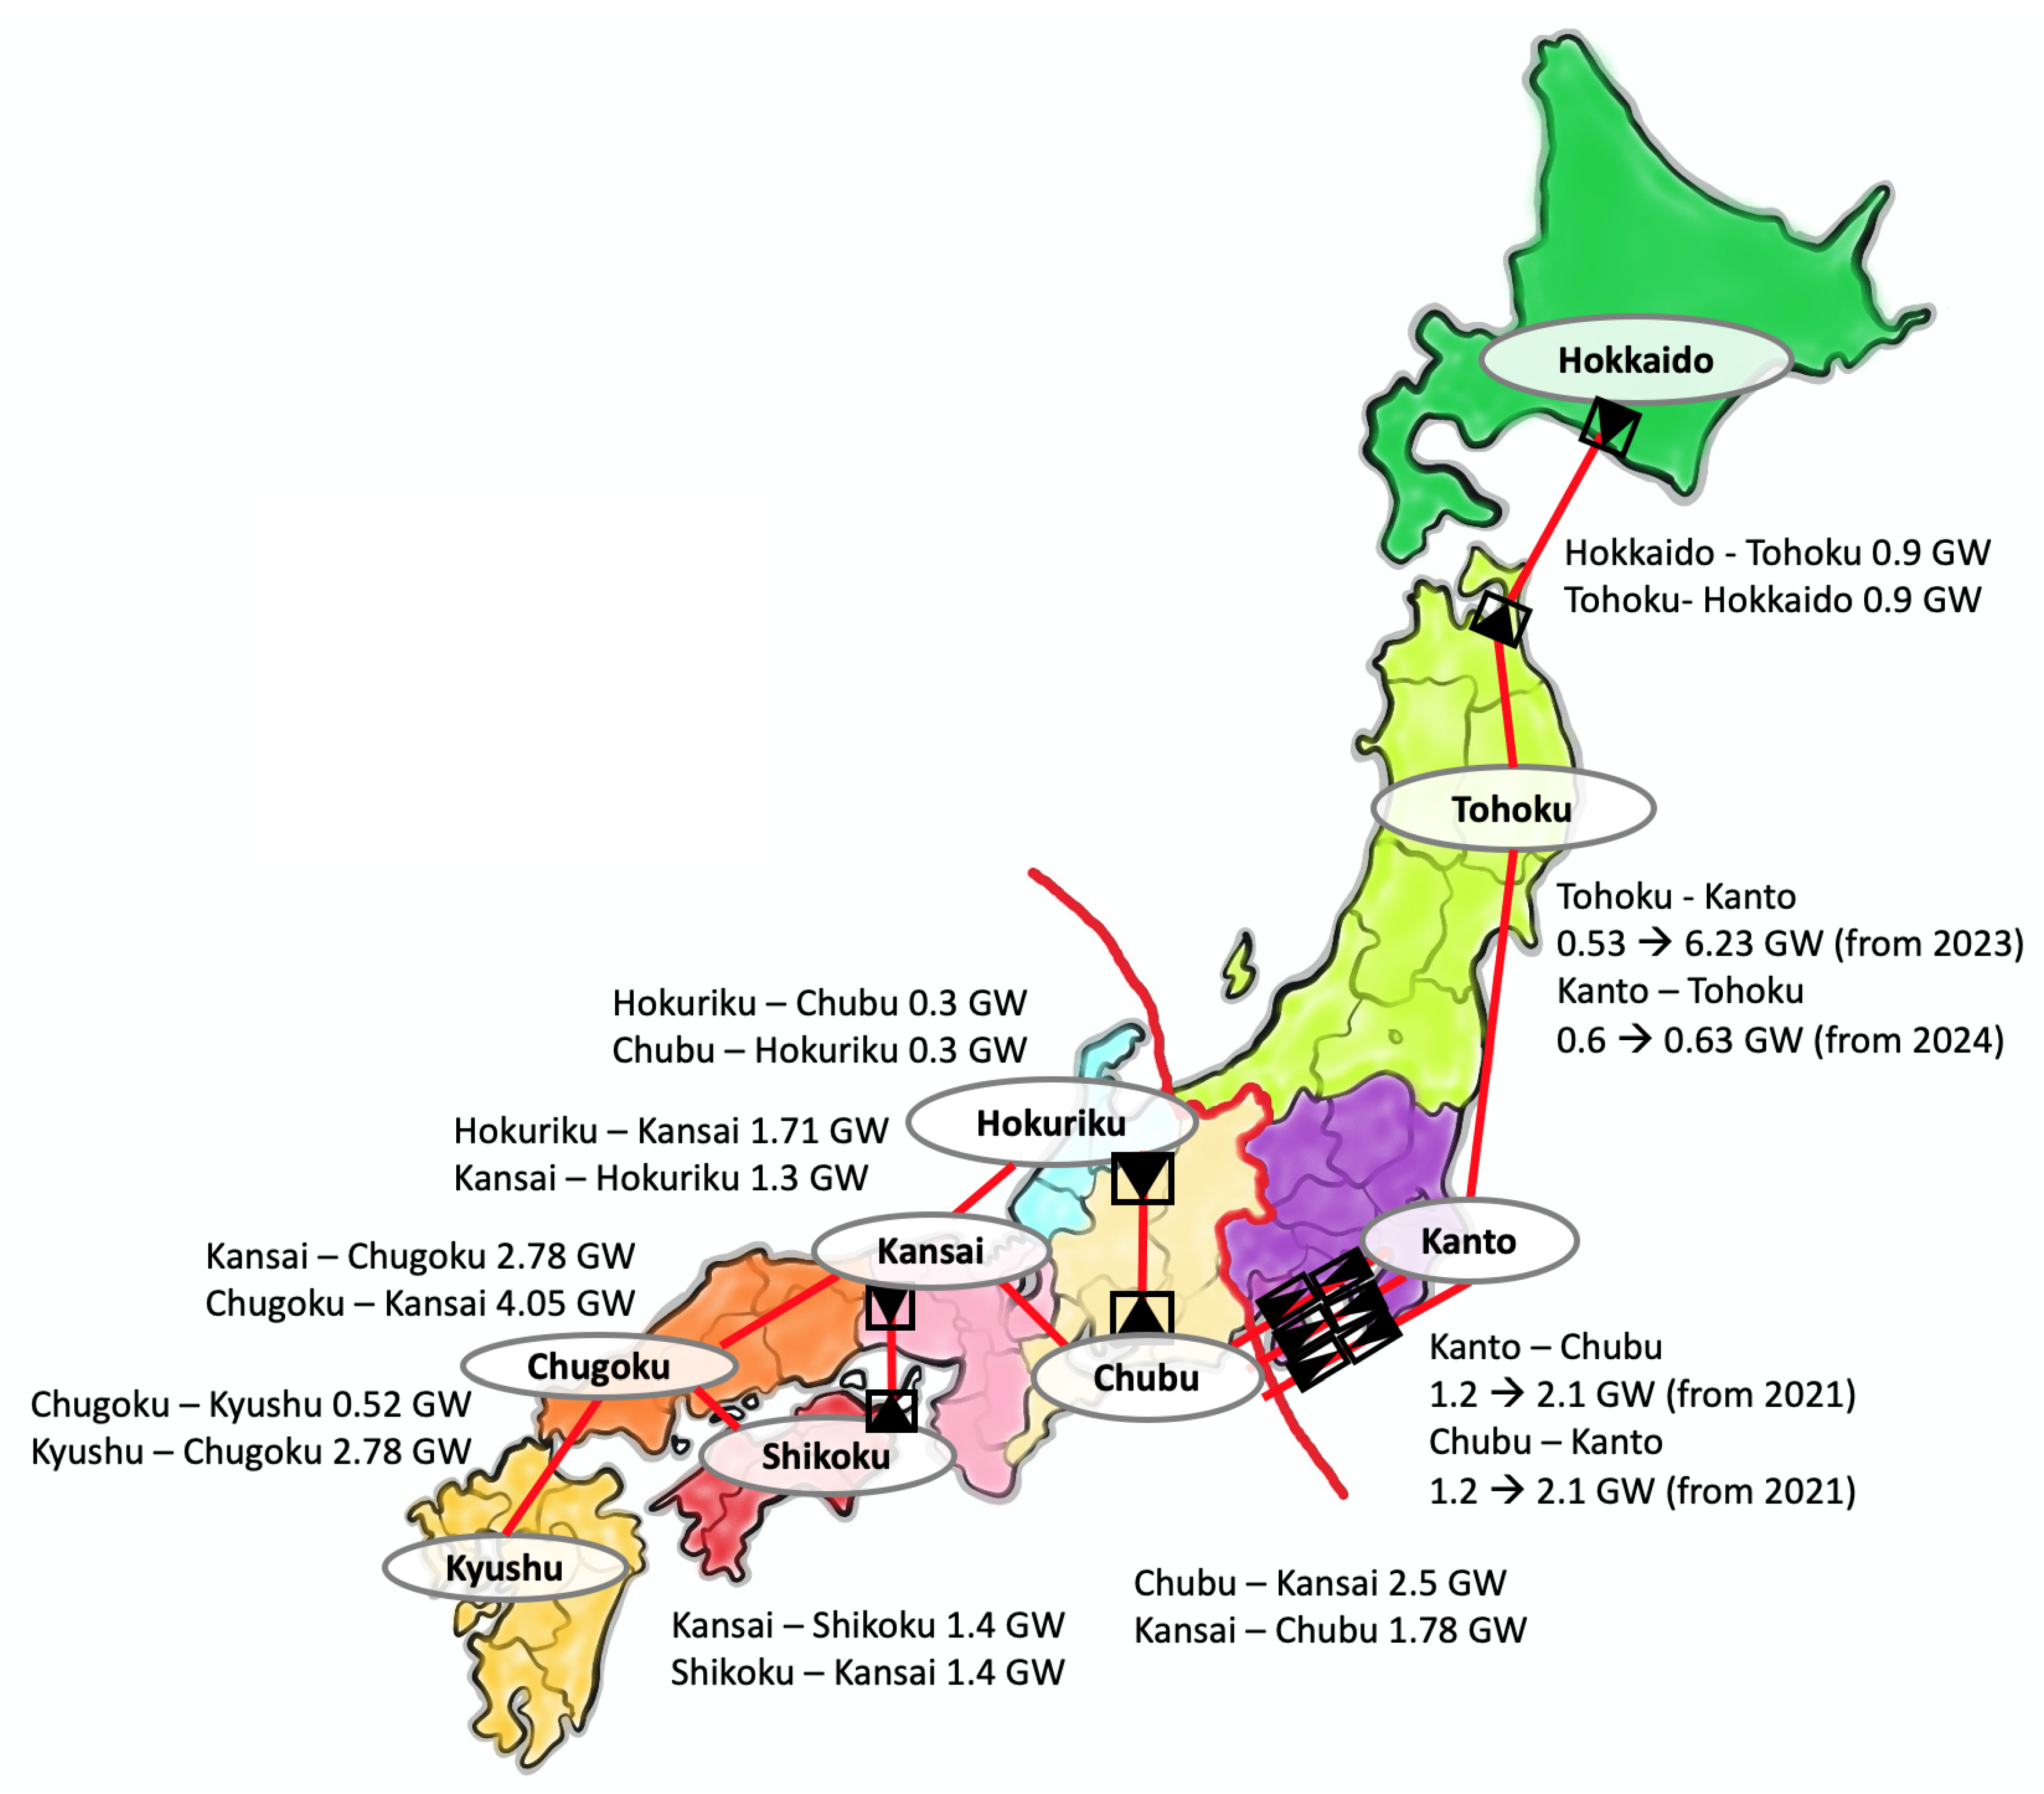
The Japanese experience of solar PV development is relevant for the international community, as the country currently has one of the largest installed capacities and is suitable for comparative studies with other countries in terms of policy and energy system impacts (e.g., [19]), as well as for model verification [20,21] or land use assessments [22]. The country also represents the interesting case of a developed island nation with an isolated grid, subdivided into regional grids with a relatively low level of interconnection between them. This could provide other countries with insights regarding how grid infrastructure can be adapted to cope with increased levels of PV penetration and ensure resource self-sufficiency when managing future investments.
To conduct such studies, the availability of open access data is important, with the OECD even compiling an open data index to rank governments on the openness, usefulness and re-usability of their data [23]. The open data handbook defines open data as “data that can be freely used, re-used and redistributed by anyone—subject only, at most, to the requirement to attribute and sharealike” [24]. This further includes unrestricted re-usability, whether for educational, commercial or other purposes, as well as universal participation, irrespective of affiliation, and free availability and access.
In Japan, both capacity and generation data have been collected and made publicly available on different platforms by various organisations over the years, though typically only in Japanese. Essentially, the scattered nature of the data and language barriers presents a problem with regard to its accessibility and usefulness to the international community.
The present paper contributes to international research in three ways. First, at a practical level, it aims to provide Japanese solar PV data for the international community in line with open data standards, that is easily accessible (on Zenodo [25]), usefully formatted and freely re-usable. Second, the present paper clarifies the relations between data sources, collecting, and providing entities. In doing so, this paper provides the first comprehensive overview of the schemes that have been implemented since Kimura and Suzuki’s (2008) [26] review of the first 30 years of solar energy development in Japan. Third, based on the insights gained from this exercise, the authors provide recommendations on how improvements in data availability can be made by Japanese policy makers and organisations for international and domestic users. While these recommendations are formulated for the Japanese case, they are essentially transferable to any other country. To achieve this, the next section covers an overview of the schemes that have been implemented, describing the stakeholders involved and the relations between them. Essentially, the research connects and expands from that of Kimura and Suzuki (2008) [26], who reviewed solar PV capacity development from 1974 to 2006, to provide a continuous overview of available data up until 2021. The third section contains the data collection methodology and an overview of the datasets available in Japan regarding installed PV capacity and generation development between 1994 and 2021. This is followed by the results section. Finally, the authors discuss the insights obtained, and provide recommendations for policy makers and organisations involved in collecting data to make it more readily available to an international audience, and so its usefulness can be improved (from the perspective of users).

2. Overview of Solar PV Development in Japan (1994–2020)

All solar PV development activities subsidised by the government of Japan (GOJ) are conceived by various agencies and institutes within the Ministry for Economy, Trade and Industry (METI). The main agencies and institutes affiliated with METI that are of note are:
  • The National Institute of Advanced Industrial Science and Technology (AIST), which focuses on research and development, and to which the New Energy and Industrial Technology Development Organisation (NEDO) was affiliated until 2005.
  • The Agency for Natural Resources and Energy (ANRE, sometimes known as ENECHO), which focuses on market introduction projects.
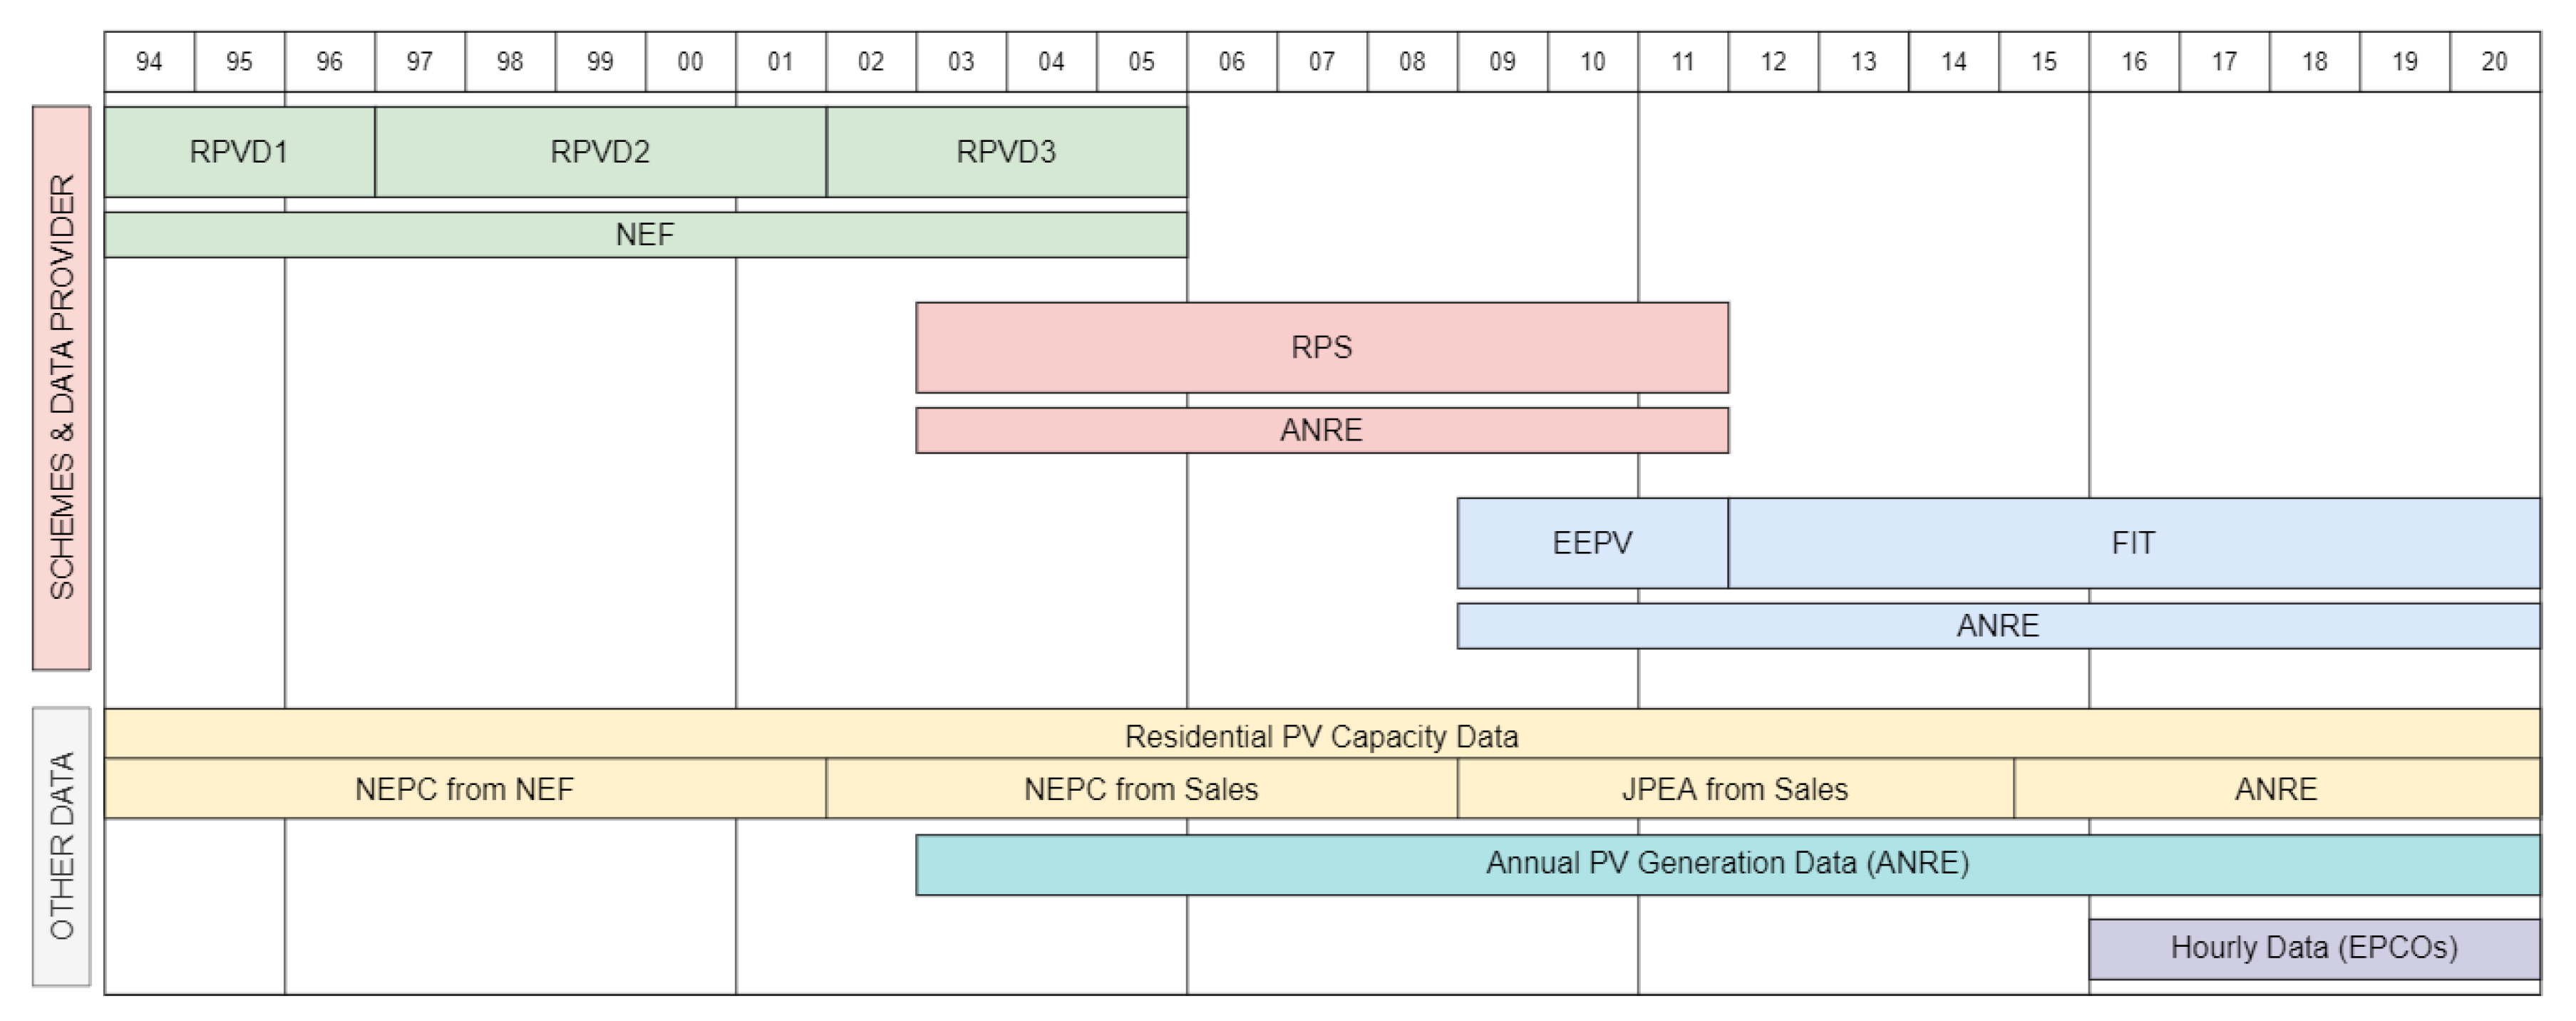
However, it is not only government agencies that provide data, and a number of other organisations have been involved over the years in the provision of solar PV data, as summarized in Table 1. The development and progression of PV schemes and their implementation is described in detail in the following subsections. Figure 1 summarises the timeline of these solar PV schemes, their managing entities and data collectors between 1994 and 2021.

2.1. 1994–2005: Residential Solar PV Development Schemes

Three Residential PV Dissemination (RPVD) schemes were conceived between 1994 and 2005, which are denoted as RPVD 1–3 in Figure 1. The first of such schemes was the “Residential photovoltaic system monitor business” (1994–1996), which was followed by the “Residential photovoltaic power generation introduction infrastructure development project” (1997–2001), and finally by the “Residential photovoltaic power generation introduction promotion business” (2002–2005) [18]. While the first two schemes were managed directly by NEDO at the central government level, the third was operated by each local authority using subsidies from METI [27]. The Residential PV Dissemination schemes supported residential PV installations of less than 4 kW by providing one-third of the installation costs and a maximum of 340,000 JPY/ kW [28]. For price trends of various PV installation components throughout the 1990s, also see [28].
Throughout the period from 1994 to 2004 subsidy applications were made to the New Energy Foundation (NEF), which also conducted the data collection regarding subsidy decisions for residential capacity development [29] and reported the data obtained to the New Energy Promotion Council (NEPC) [30]. For a detailed overview of the Residential PV Dissemination schemes, refer to [26,28].

2.2. 2003–2012: Parallel Commercial and Residential Development Schemes

In the period between 2003 and 2012 several solar PV developments and data reporting schemes were implemented. Following the promulgation of the “Special Measures Law Concerning the Use of New Energy by Electric Utilities” in June 2002 [31], ANRE introduced the Renewables Portfolio Standard (RPS) programme in 2003, for which it also oversaw data collection until its termination in 2012 [32]. Rather than subsidising capacity development directly, a Renewable Portfolio Standard requires electricity resellers to meet a certain quota of renewable shares in their resource portfolio. Renewable energy producers can attach their generation to a specific reseller through certificates (which can be traded between resellers) and negotiate the price of their electricity with the reseller rather than directly through the market. This means that a Renewable Portfolio Standard supports capacity growth, though it does not guarantee profitability for renewable generators [33].
For both residential and commercial solar PV generation under the Renewable Portfolio Standard programme, the surplus purchase price decreased slightly for industrial installations in the period between 2003 and 2010, though it increased for private installations over the same time period (Table 2). To compare the subsidy purchase price with the cost of electricity between 1994 and 2016, see Table A1 in the Appendix A.
Multiple renewable resources were eligible under the Renewable Portfolio Standard programme, including solar PV. However, since a Renewable Portfolio Standard subsidises electricity provision instead of capacity installation, this may have predominantly benefited those who already had solar PV systems installed at the time, as well as those planning to feed into the grid (rather than self-use only). Thus, since the end of the Residential PV Dissemination scheme (RPVD 3 in Figure 1) in 2005 [35], non-Renewable Portfolio Standard funded local authority schemes may now be the main subsidy option for homeowners, which focus on capacity installation rather than payments for electricity feed-in. For a summary of local authorities that provide residential subsidy schemes, please refer to [35] and for a detailed overview of local authority solar PV subsidy schemes, refer to [27]. In 2009 METI began considering the implementation of a Feed-in-Tariff (FiT) scheme [36] and made a first step toward it through the “Excess electricity purchasing scheme for photovoltaic power” in late 2009 [33,37]. This scheme subsidised both residential and commercial installations.
Residential development data between 2004 and 2012 are qualitatively inconsistent and is often highly aggregated and at times indirectly approximated rather than directly measured. In 2004, the NEPC officially took over data collection from the NEF up to and including 2007 [30]. In 2008, the NEPC reports data from the Japan Photovoltaic Energy Association (JPEA), which took over data collection and reporting for residential solar PV development around that time and up to 2014 [38]. During this period the JPEA reported monthly electricity generation and installed capacities for residential and non-residential solar PV installations for the whole country [39]. Additionally, in 2003 ANRE began recording annual solar PV generation for Japan [40], which is published up to the present day.

2.3. 2012–2019: FiT

After the promulgation of the “Act on special measures concerning procurement of electricity from renewable energy sources by electricity utilities” in August 2011 [41], the FiT scheme was officially launched in July 2012, replacing the previous Renewable Portfolio Standard scheme. A FiT scheme fixes the price for renewables, and while it does not guarantee them access to the market (as a Renewable Portfolio Standard does, albeit indirectly), it does ensure profitability for those connected. The Japanese FiT scheme subsidised both residential and commercial participants [33], which effectively ended the previous parallel schemes (Residential PV Dissemination, local authority schemes and Renewable Portfolio Standard and data collection (ANRE and JPEA/NEPC/NEF).
The FiT subsidy decreased by 65% for commercial installations between 2012 and 2019, and by 35% for private installations (Table 3).
ANRE, which had overseen the Renewable Portfolio Standard scheme and collected its data, was also in charge of both duties for the FiT scheme from 2012. However, as the JPEA was still reporting residential data between 2012 and 2014, there were then two sets of residential data available, though these were recorded from different sources (one from subsidies and one from panel sales). Between 2014 and 2016, the JPEA report [43] cited residential solar PV data from ANRE [44], which may indicate a period of handover and streamlining. A second overlap period between technically similar datasets occurred in 2019, when ANRE began to report solar PV installed capacity by prefecture [45] separately from installed capacity data regarding this FiT [46]. This again may indicate a transition period to a data storage space that was not subsidy-affiliated, as the FiT closed for new applications in November 2019 [47].
Apart from the solar PV generation data that ANRE began publishing annually from 2004, the regional utilities, as part of their energy market reform responsibilities [48], also began publishing hourly solar PV generation data in 2016 for their respective regions. Again, there are discrepancies between the data published by the utilities and that by ANRE, further confusing the picture as to the total amount of electricity generated.

2.4. External Data Collecting Organisations

In addition to the agencies providing primary solar PV generation and capacity data, there are a number of other organisations using these and other related data that draft regular reports on the Japanese electricity sector and its progression toward sustainability (often providing policy targets for individual resources, see Table 4).
This section provides a brief overview of these resources, highlighting the importance of taking into account the additional data they provide in order to obtain a complete and accurate picture of the installed capacity and electricity that is generated in the country.
First, in addition to providing primary data, the JPEA also publishes an annual, solar PV-centric outlook for Japan’s 2050 solar energy vision, from which a summary of PV sales until 2016 could be found [43]. Further, the number of households with solar PV installations up until 2016 was aggregated based on [30,38,53,54]. As these sources provide only the number of households with PV installations, as well as the average PV installed capacity size for Japan, this does not reflect regional differences in average PV installation sizes, or potential differences in installation sizes from year to year.
JEPIC’s “The Electric Power Industry in Japan (EPIJ)” report series [49], which was first published in 1959, focuses on the structure, policy, supply structure, and markets in Japan. It includes statistical data gathered from various sources. The two most recent reports are available for free to download in English. Similarly to JEPIC, the Federation of Electric Power Companies of Japan (FEPC) makes their annual reports freely available since 2005 [50], reporting on their position and measures regarding policy and resource development for the past and upcoming year(s). Aside from this review, FEPC regularly updates the “INFOBASE: Electric Power Company Database [51]”, which contains information about Japan’s electric power businesses clustered into thematic groups, such as power supply and demand, power equipment, electric power development, etc.
Further, the Institute for Sustainable Energy Policies (ISEP) is a non-profit organisation that specifically focuses on renewable energy projects, working with policy makers to speed up the renewable transition in Japan. Between 2012 and 2017, they published the annual “Renewables Japan Status Report”, for the period 2016–2018 the “Energy Chart”, and an interactive graph is available for regional, as well as aggregated generation and demand data for the country [55]. In 2019, ISEP also published the “Status of Renewable Energy in Japan” [52], where they tracked the growth of renewable energy capacity in Japan per prefecture and the corresponding penetration rate of each type of renewable energy sources.
Lastly, Electrical Japan [56] curates an interactive website with spatial visualisation of a large selection of major electricity resource capacities, including many individual sites for solar PV. This organisation provides links to primary data, though the data gathering process for the site is not transparent (as of January 2021) and does not archive data. This means that the data presented does not show developments over time, but only the latest data available (which is not complete).

3. Methodology

3.1. Data Identification

To identify a comprehensive set of solar PV installation data for Japan, it was assumed that solar panel installations in the country are covered by a combination of the government subsidy scheme-collected data and the manufacturer data [39] provided each year. Based on this, the authors first identified the schemes under which PV panels were installed between 1994 and 2021, using a philosophy similar to that established by Kimura and Suzuki [26], Myojo and Ohashi [57] and Kurokawa and Ikki [28]. As a result, the websites of the ministries responsible were searched for relevant data or mentions of entities that were responsible for data collection. The authors also checked every METI-affiliated department website and conducted a Google search in Japanese for the terms shown in Table 5.
Throughout the research, only publicly available datasets were used. This data collection process took place between October 2020 and January 2021, with all results for installed capacity and actual generation stored by the authors in a dedicated open access Zenodo archive [25]. Table 6 and Table 7 in the next section indicate which data are stored in the repository, as well as their spatial, temporal and governance levels, language and format.

3.2. List of Dataset Used

3.2.1. Original Data

Table 6 summarises the unique datasets available regarding the installed capacity in Japan since the inception of the first residential and commercial installations in 1994. Where the end-date of a dataset is given as “present”, this refers to at least January 2021. Further, included in the table are the spatial resolution (SP) of each dataset, the governance level (GL), the timestep (TS) and the language (LG) of the source file. A list of all the abbreviations used can be found at the bottom of each table.
The Residential PV Dissemination data provided by NEF (and reported to NEPC) are situated within several locations in their homepage. Most importantly, the PV system status from 1994 to 2004 can be found here [53], and an update from 2005 here [58]. Post-2005 data are provided here [35]. The exact role of the NEPC as a data curating and collecting organisation is unclear, as the NEF also published the data it collected on its own website. Further, it should be noted that NEPC, when collecting data itself, did not collect data on the capacity installed, but PV panel sales by domestic and international manufacturers within Japan, which were assumed to be installed in residential households during this period [30].
Table 6. Solar PV capacity data.
TitleInstitutionDurationSPGLTSLGFMTRef.
Implementation Status of PV Subsidy System (Homepage)NEF1994–2005CNYJPWEB[29]
PV System Introduction Status 1994–2004NEF1994–2004CNYJPXLS[53]
Implementation Status of PV Subsidy System in 2005NEF2005CNYJPXLS[58]
Local Government Support for Residential PV Systems 2006NEF2006CNYJPPDF[35]
Installation Status of Residential PV SystemNEPC1994–2008CNYJPPDF[30]
Subsidy Application Data by PrefectureJPEA2009–2014CNYJPPDF[38]
Natoku! Renewable Energy Information Disclosure (Homepage)METI-ANRE2014–2017CNM WEB[44]
Natoku! Renewable Energy Information Disclosure (List of Data)METI-ANRE2014–2017CNM XLS[54]
RPS Equipment InformationMETI-ANRE2003–2011CNYJPXLS[32]
RPS Program (English Home Page)METI-ANRE ---ENWEB[59]
FIT Contracts in JapanMETI-ANRE2012–PresentCNYJPWEB[46]
FIT System Information DisclosureMETI-ANRE2012–PresentNNYJPXLS[60]
Electric Power Survey Statistical Table (Homepage)METI-ANRE2003–PresentPNMJPXLS[61]
Number of Power Plants and CapacityMETI-ANRE2019–PresentPNM XLS[45]
Power plants in JapanNII-ElectricityJPPresentRNCJPWEB[56]
Columns (SP: Spatial; GL: Governance Level; TS: Timestep, LG: Language; FMT: File Format); Spatial and governance level (N: National; R: Regional; P: Prefecture; C: City; R0: Regional Jurisdiction); Timestep (Y: Yearly; Q: Quarterly; M: Monthly; D: Daily; H: Hourly; C: Current); File Format (XLS: Excel; WEB: Website; CSV: Comma Separated Values).
Similar to NEF, ANRE data are also distributed over several websites. Individual (disaggregated) FiT-contracted installations 20 kW have been collected on the FiT portal site [46] continuously from 2012 to the present day (January 2021). Furthermore, since 2012 ANRE has published monthly aggregated FiT installations in a second portal called “Nattoku” [54], which changed its reporting format in 2014 and became a legacy site in 2017 (available but not maintained). Any aggregated capacity data from 2017 can be found on the FiT portal site [46], effectively merging two portal pages but keeping separate datasets.

3.2.2. Consolidated PV Installed Capacity Data

Based on some of the resources listed in Table 6, the authors consolidated the installed solar PV capacity data by prefecture, year and installation type (≥10 kW as commercial and <10 kW as residential, based on the classification used by the Japanese government [46]).
The following caveat to the overall comprehensiveness of the dataset was identified: aside from the four main islands that make the country, Japan has a further 400 inhabited islands [62] with solar PV installations (e.g., [63]). These are not comprehensively reflected in the datasets identified in Table 6, as these data are difficult to access. However, the authors argue that the dataset provided by this paper is still reasonably comprehensive, due to the relatively small installed capacity in such small islands.
Data that met the resolution criteria stipulated above were those provided by NEF [35,53,58], NEPC [30], JPEA [38] and most ANRE datasets. The criteria for leaving out the ANRE data of [45,61] were that these only record mega-level solar projects (≥1 MW), which are already included in [32,46]. The data provided by Electrical Japan [56] were not included due to difficulties in establishing unambiguous data sources.
Additionally, the authors took care to remove duplicate data points during the consolidation process. Duplicates were assumed only be able to occur in the subsidy datasets (and not in the manufacturer data), and were identifiable by their unique ID numbers. While the consolidated dataset does not include all identified capacity data, it is sufficiently comprehensive and free of duplicates to provide a more accurate annual timeline of installed capacity data in Japan than that of any of the other sources alone.

3.3. Actual Generation

3.3.1. Original Data

Using the same nomenclature utilized in Table 6 and Table 7 summarises the actual solar PV electricity generation data available for Japan. Actual generation data at the country-level has been provided by ANRE between 2004 and 2015 [40]. From 2016 onward, ANRE changed its reporting format from country to prefectural level [61]. Following the Fukushima earthquake and tsunami, the Electricity Power Companies—known in Japan as EPCOs—began publishing their demand and supply data with forecasts for their respective regional service areas in 2011 [64,65,66,67,68,69,70,71,72]. Among them, only Kansai EPCO has been keeping these data on their website continuously from that point [73]. The remaining Electricity Power Companies only began archiving their data in 2016, the same year that the Organization for Cross-regional Coordination of Transmission Operators (OCCTO) was created [48]. For the generation data across all regions, it is notable that non-utility generation provides the majority of solar PV-derived electricity. Table 1 provides the full names of the Electricity Power Companies that are mentioned in Table 7.
Table 7. Actual generation.
TitleInstitutionDurationSPGLTSLGFMTRef.
Power Generation ResultsMETI-ANRE2004–PresentPNMJPXLS[40]
System Information about the Major Electric Power Companies in JapanOCCTO2016–PresentRNHJPXLS[74]
Power Usage (Supply and Demand)HEPCO2016–PresentRR0HJPXLS[75]
Power Usage (Supply and Demand)TOHOKUDEN2016–PresentRR0HJPCSV[76]
Power Usage (Supply and Demand)TEPCO2016–PresentRR0HJPCSV[77]
Power Usage (Supply and Demand)CHUDEN2016–PresentRR0HJPCSV[78]
Power Usage (Supply and Demand)RIKUDEN2016–PresentRR0HJPCSV[79]
Power Usage (Supply and Demand)KEPCO2016–PresentRR0HJPCSV[80]
Power Usage (Supply and Demand)CEPCO2017–PresentRR0HJPCSV[81]
Power Usage (Supply and Demand)YONDEN2016–PresentRR0HJPCSV[82]
Power Usage (Supply and Demand)KYUDEN2016–PresentRR0HJPCSV[83]
Power Usage (Supply and Demand)OKIDEN2016–PresentRR0HJPCSV[84]
Power Generation Comparison Ranking by Prefecture PP JPWEB[85]
Columns (SP: Spatial; GL: Governance Level; TS: Timestep, LG: Language; FMT: File Format); Spatial and governance level (N: National; R: Regional; P: Prefecture; C: City; R0: Regional Jurisdiction); Timestep (Y: Yearly; Q: Quarterly; M: Monthly; D: Daily; H: Hourly; C: Current); File Format (XLS: Excel; WEB: Website; CSV: Comma Separated Values).

3.3.2. Consolidated Solar PV Generation Data

Based on the resources listed in Table 7, the authors consolidated the actual annual solar PV generation by region based on the data provided by the electricity power companies [75,76,77,78,79,80,81,82,83,84]. Though ANRE [40] has provided quarterly actual generation data since 2004, this only measures generation by solar PV installations of 1 MW capacity. As the electricity power companies’ datasets include these, but are not limited to them, the ANRE dataset was not considered further by the authors. The actual generation data provided by the electricity power companies lump the 47 prefectures into 10 regions, according to the regional service area of each utility operator (see Figure 2).
While generation data can therefore not be accurately disaggregated at the prefecture level, an estimation of the generation by prefecture could be obtained by assuming similar weather and equipment maintenance conditions across them, and proportionately distributing regional generation according to the actual installed capacity.

4. Results

4.1. Solar PV Capacity Development in Japan between 1994 and 2019

As actual solar PV generation data are only available at the regional level (i.e., for the regional service areas of each of the electricity power companies), the capacity data were also aggregated to this level to enable a direct comparison. Nevertheless, the dataset that accompanies this manuscript also provides capacity data at the prefecture level (as this may be relevant to some researchers). The development of solar PV capacity between 1994 and 2019 shows an increasing (non-linear) rate of development up to and including 2015 (see Figure 3), with continuing, but more linear development between 2015 and 2019.
The installed capacity in each region is provided in Appendix A. As of the end of 2019, 43 GW of the total of 54 GW solar capacity was commercially owned. Figure 3 shows that Hokkaido was the last region to develop solar PV capacity, as could be expected given that it is the northernmost island in Japan and receives the least solar radiation.
Figure 4 and Figure 5 show the disaggregated residential and commercial installed capacity, respectively. Looking at these figures it is possible to observe, for example, that most of the capacity in Hokkaido is commercial, which was integrated predominantly in 2007, with some additional gradual growth from 2013 onwards. On the other hand, most PV installation has taken place in the regions of Kanto, Chubu and Kyushu, with overall similar and steady progression between commercial and residential development over the years. Residential capacity developed at an increasing rate until around 2013, with growth beginning to slow in 2014. Commercial solar PV capacity grew rapidly between 2012 and 2015, with growth slowing slightly after that. In 2014, commercial capacity exceeded residential capacity for the first time.

4.2. Actual Solar PV Generation between 2016 and 2019

As companies were not obliged to publish actual solar PV generation data until 2016, this is also when the data reporting period begins. Note that, despite this, Chugoku only started publishing generation data from 2018 (Figure 6).
Using (1) to calculate the load factor (LF) for solar PV, Table 8 provides the LF for each region between 2016 and 2019 through the data used in Figure 3 and Figure 6.
L F = A n n u a l e n e r g y p r o d u c t i o n k W h y e a r S y s t e m r a t e d c a p a c i t y k W × 24 h o u r s d a y × x d a y s y e a r
Table A2,Table A3,Table A4 in the Appendix A provide the actual electricity generation by region and year, the installed residential and commercial capacity, respectively. While the installed capacity for this timeframe is available at the prefectural level, generation data are only provided at the regional level by the respective utilities. Therefore, while regional LFs can be calculated (see Table 8), it should be noted that these are aggregating differences between prefectures within a region. For instance, [85] estimated an LF of 16.5% for Yamanashi prefecture, contrasting with the 13.7% LF for the entire Chubu region that it belongs to. However, it should also be noted that [85] only focused on 4 kW-installations from the period between March 2013 and February 2014. Estimating the LF for each region over several years is useful as a data quality indicator, as it provides some insight into the consistency of the generation and capacity data of each region and year. Some low level of standard variation (<0.8) in the LF between years for a given region can be attributed to differences in the received solar irradiation due to weather patterns, though higher levels may show data inaccuracies (possibly from unaccounted generation capacity for the respective year and region).

5. Discussion

5.1. Improving the Quality of the Data in Accordance with the Open Data Philosophy

The data used in the present research fulfils two of the three requirements for open data (as per the open data handbook [24]): the data archives run by the Japanese government (through its various ministries and associated departments) permit the re-use and re-distribution of data, as well as universal participation, i.e., anyone can use them for any purpose (e.g., educational or commercial). Further, while access and availability are also generally open, several points for improvement could be identified with regard to this requirement, as will be detailed below.

5.1.1. The Need for Useful and Accessible Data in a Domestic Context

While the data are made available free of membership- or payment barriers, there is a barrier in terms of language, which is compounded by the occasional use of non-machine readable scripts (e.g., [29,39,54]) and loose translations in academic reports (e.g., the bundling of three schemes under one name that was not the official one for any of these schemes, for example in Myojo and Ohashi [57]). Furthermore, data on NEF’s [29] and NEPC’s [30] websites are provided within the temporary visible space of the newsfeed bar, rather than a dedicated location. Finally, there is the potential issue of double-reporting of data and a lack of clear authority in terms of which data might be included in others (see Section 2.3, which details for example how JPEA cited ANRE before the latter took over; and the apparent transition from the FiT portal for solar PV data to a separate ANRE data portal since 2019, which the authors assume to be handovers). Basically, there are two issues: first, installed capacity data are scattered across various websites that disclose them for different intervals in various formats, and maintain them to different degrees once schemes have ended. Second, how data between schemes relate is not always transparent, so that questions arise regarding data overlap or missing entries. Therefore, while solar capacity has been collected continuously from 1994, putting together one continuous dataset represents a challenge, emphasising that data availability does not necessarily equal accessibility. The present paper aimed to address this issue and provides a Zenodo-archived and usefully formatted, continuous dataset [25] for installed solar PV capacity by prefecture from 1994 to 2019, as well as annual generation by region between 2016 and 2019.
This issue could be addressed by designating one agency for data collection, preparation and disclosure, irrespective of the scheme that may be active at the time. A good candidate for this task would be e-Stat, the portal site of official statistics of Japan [87], which is available in Japanese as well as English and provides machine-readable formatted data. This is another important issue, as the data identified by the authors were often provided in PDF formatted lists, or as individual values in brief statements. From a user perspective, CSV formatting would be highly desirable for multi-purpose usability. When data was available it was often in the form that is used by current spreadsheets (XLS, XLSX, ODS, etc.), which may be good in terms of compactness, but is less desirable from the point of view of open data, as some formats are proprietary (such as Excel). The e-Stat site is managed by the National Statistical Center, which should collect generation and capacity data from schemes, as well as other stakeholders that register new installations or generation, and provide a consolidated dataset on e-Stat. Additionally, by providing a comprehensive and regularly updated dataset, e-Stat could enable third parties to access and redistribute the data further. For instance, stakeholders such as Open Data Japan [88] may make solar PV generation and capacity datasets more accessible to international researchers.
The authors recommend that data from past schemes (such as the Residential PV Dissemination) be consolidated and re-uploaded in this way, and that local authorities are engaged to provide the data for their own schemes. For solar PV generation and installation data, the minimum requirement should be that prefecture-level and hourly resolutions are made available, as well as that the chosen resolution and reporting units are consistent across schemes. Further, the authors recommend that datasets such as that for the FiT (which include a mix of residential and commercial installations), provide a clearer distinction of before- (residential) and after-the-meter (commercial) data entries.

5.1.2. Privacy vs. Transparency

Utilities mostly begun publishing hourly generation data from 2016. Among others, reasons for their hesitance in releasing such information may be that their financial situation- and CO2 emissions estimates could be reconstructed through reporting generation at an hourly level. This is a problem, as the enforcement of data publication without a certain quality standard results in information that has only limited use. The authors propose that this dilemma could be solved through the previously proposed categorisation of solar PV capacity and generation data into commercial and residential, rather than utility, non-utility commercial and residential.

5.2. Limitations

While the aim of this study was to provide a comprehensive timeline of the development of PV in Japan, and to provide an accurate estimate of the installed and generated electricity across regions, several limitations need to be noted.
Residential capacity post-NEF and pre-ANRE reporting in 2016 was not directly reported, as the JPEA recorded the number of households with solar PV and an average capacity per household. While the total residential capacity can be estimated from this, direct measurements would be preferable, especially since average installation sizes may differ between regions, depending on solar potential. Further, while ANRE (through the FiT) records residential installations, these are only available in aggregate format when <10 kW, and not reliably identifiable for those installations ≥10 kW, since they are published in one list with commercial installations and there is no category to distinguish them other than whether the owner is an entity or a private person.
While ANRE [89] reports that there were 90 MW of commercial solar PV installed by 2012 (before the beginning of the FiT scheme), the consolidated Renewable Portfolio Standard data only amounts to 70 MW of commercial solar PV. Furthermore, by the end of 2019 FiT registered 266 MW under transition certificates, which means that these installations were active but not reported before the FiT scheme started. It is likely that 70 of the 266 MW are transitions from Renewable Portfolio Standard to FiT. However, it is unclear where the other 196 MW of installed capacity originated from and when they were first installed (including the 20 MW difference between reported installed capacity and Renewable Portfolio Standard registered capacity by 2012). Partially, this capacity may be comprised of previously non-subsidised commercial solar PV and from capacity subsidized by local government schemes. For the latter, it is unclear whether the capacity installed through it is listed in the datasets mentioned in Table 4.
Similarly, it is unclear where, if at all, the capacity that was installed outside of subsidy schemes or by utilities has been recorded in the databases. A dataset of installed capacity separate from the FiT portal has been provided by ANRE since 2019 [45], though this dataset only includes mega-solar installations. A comprehensive dataset that includes the installed capacity for self-use only would be useful for estimates, such as the potential reduction in electricity demand from self-use at present or in the future.
Lastly, two gaps were identified in the data provided. First, there appears to be data missing from March 2017 (the end of the [54] portal) to September 2017 (the beginning of the joint use of [60] portal for both aggregate and disaggregated FiT data), which requires clarification. Second, there is a discrepancy between the FIT-provided commercial data. The FiT A dataset provides prefectural-level PV installed capacities for commercial installations between 10 kW and 50 kW, with the FiT B dataset providing the addresses of installations between 20 kW and 50 kW. While there is an overlap between these two datasets, which provides some additional information, they do not overlap entirely, and for the smaller installations (between 10 and 20 kW) the exact address is not provided.

6. Conclusions

This paper set out to provide a reference for studies looking to access Japanese solar PV data, while also summarising the context of the PV sector in the country (so that the origin of the data can be better understood, by identifying the various schemes and data collecting arrangements). Further, it provides an analysis of both the completeness and quality of the data from the perspective of the open data paradigm.
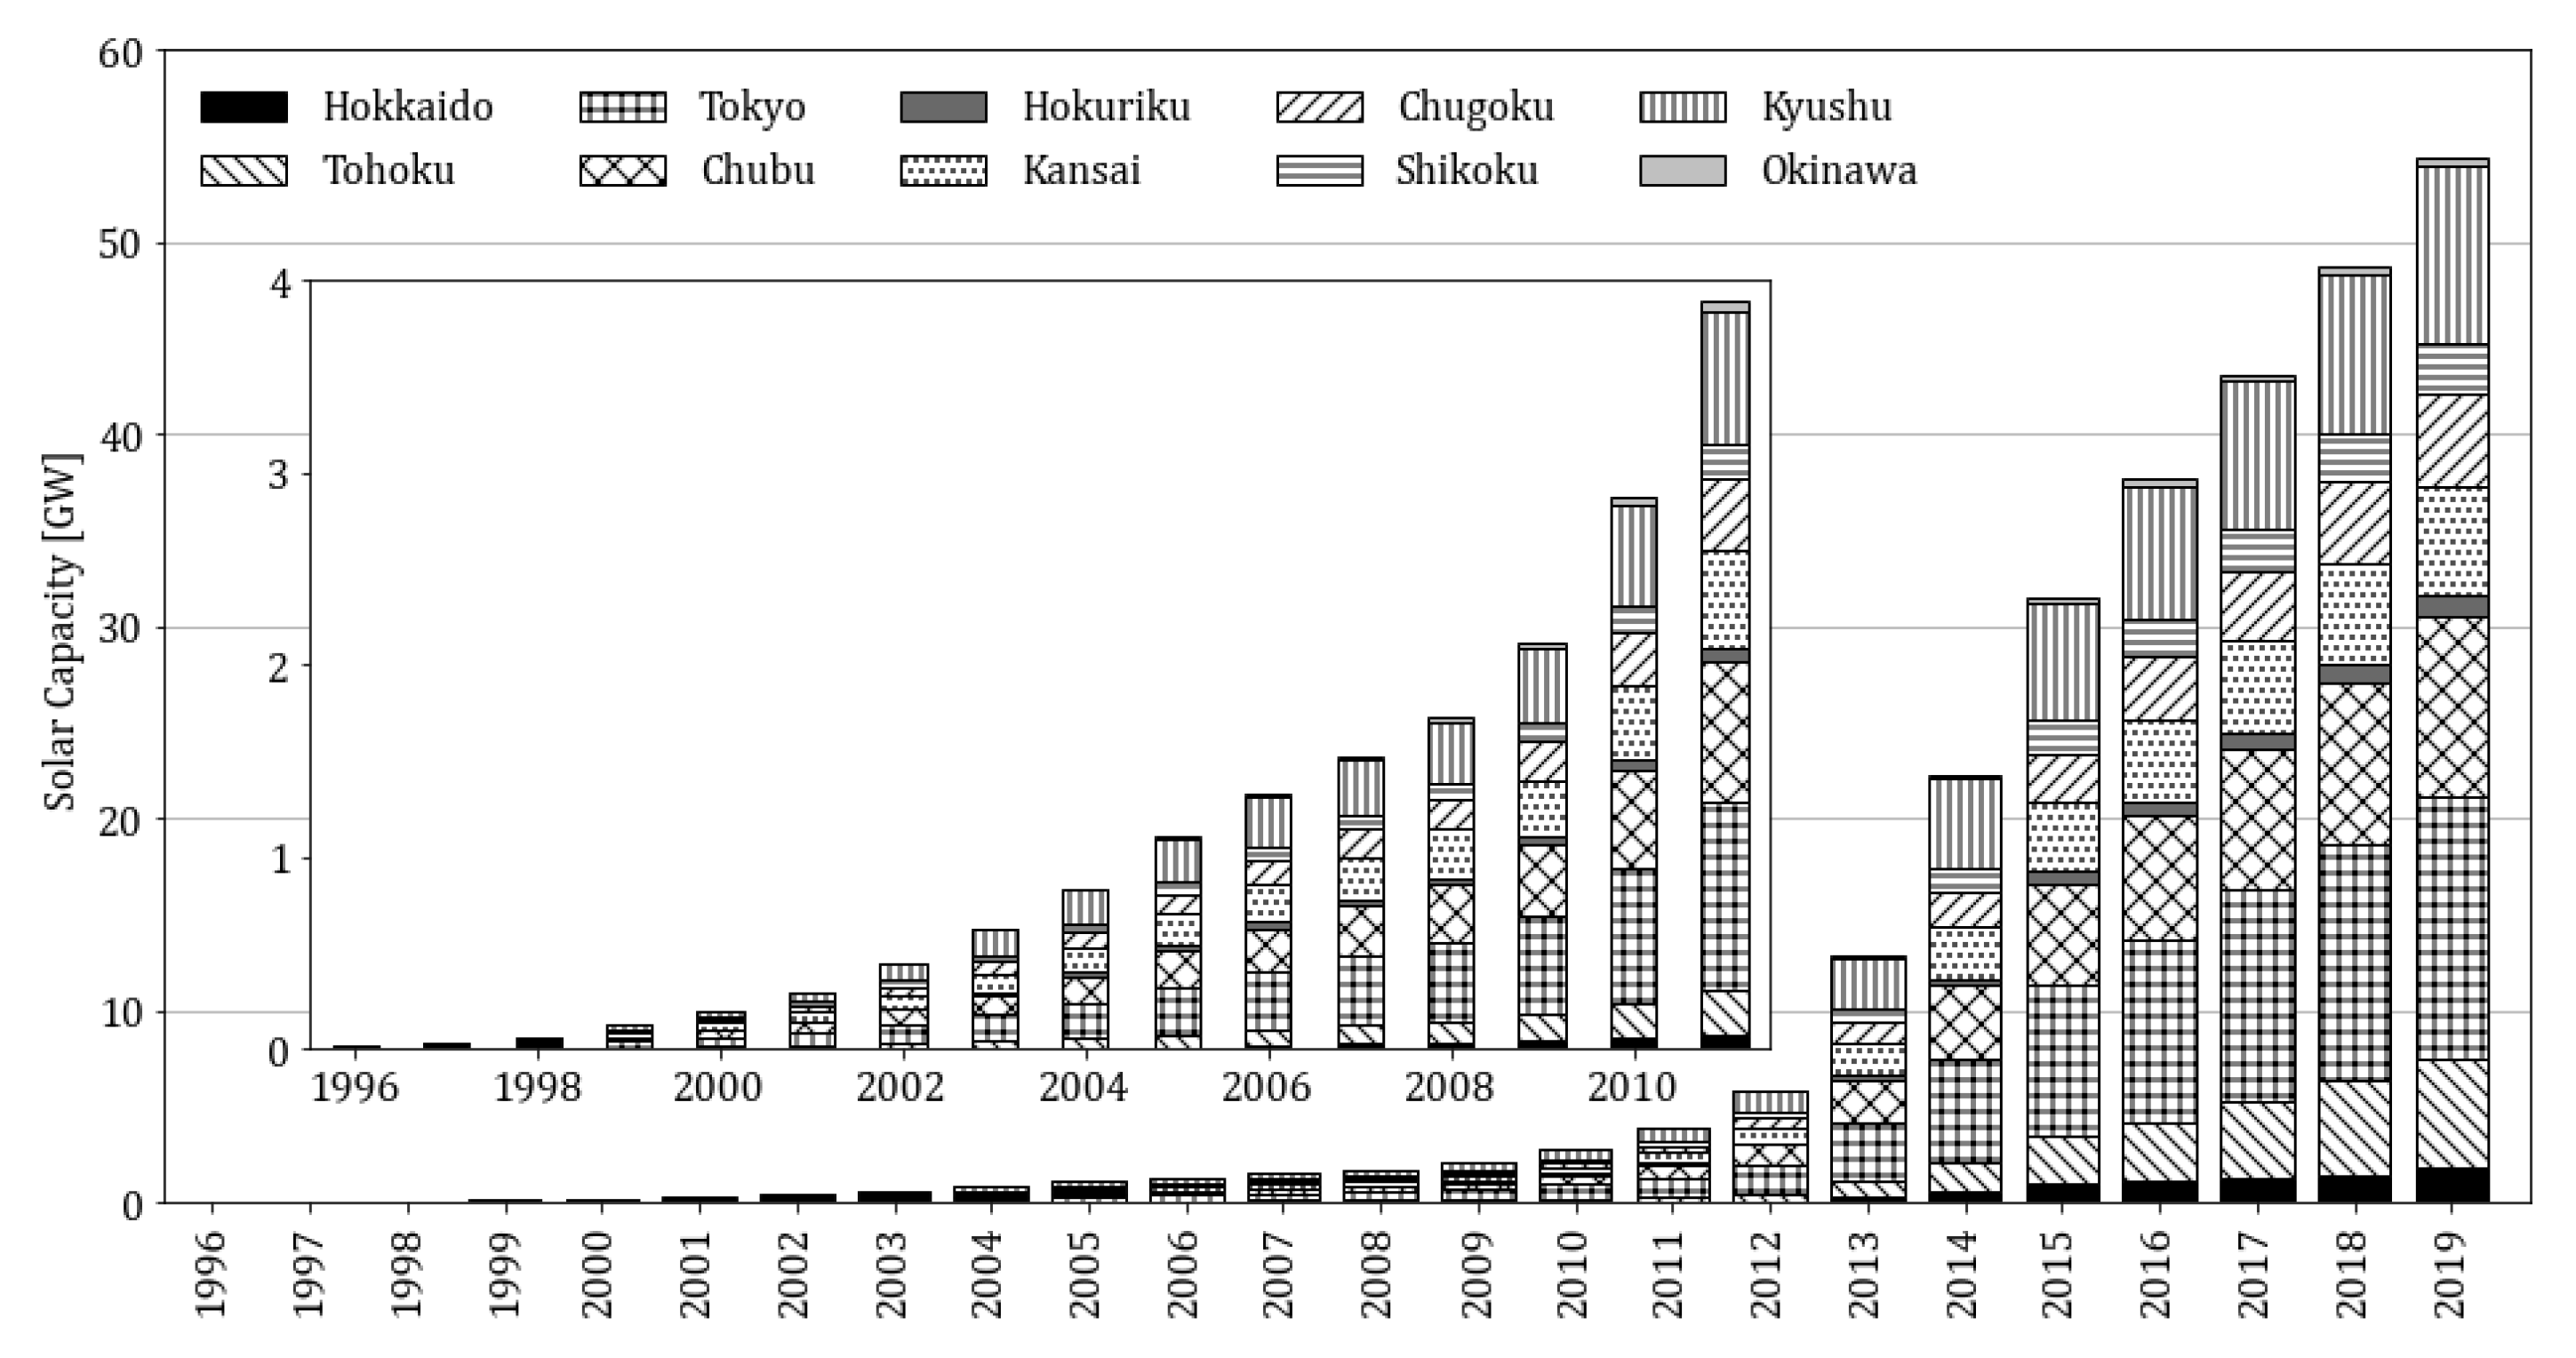
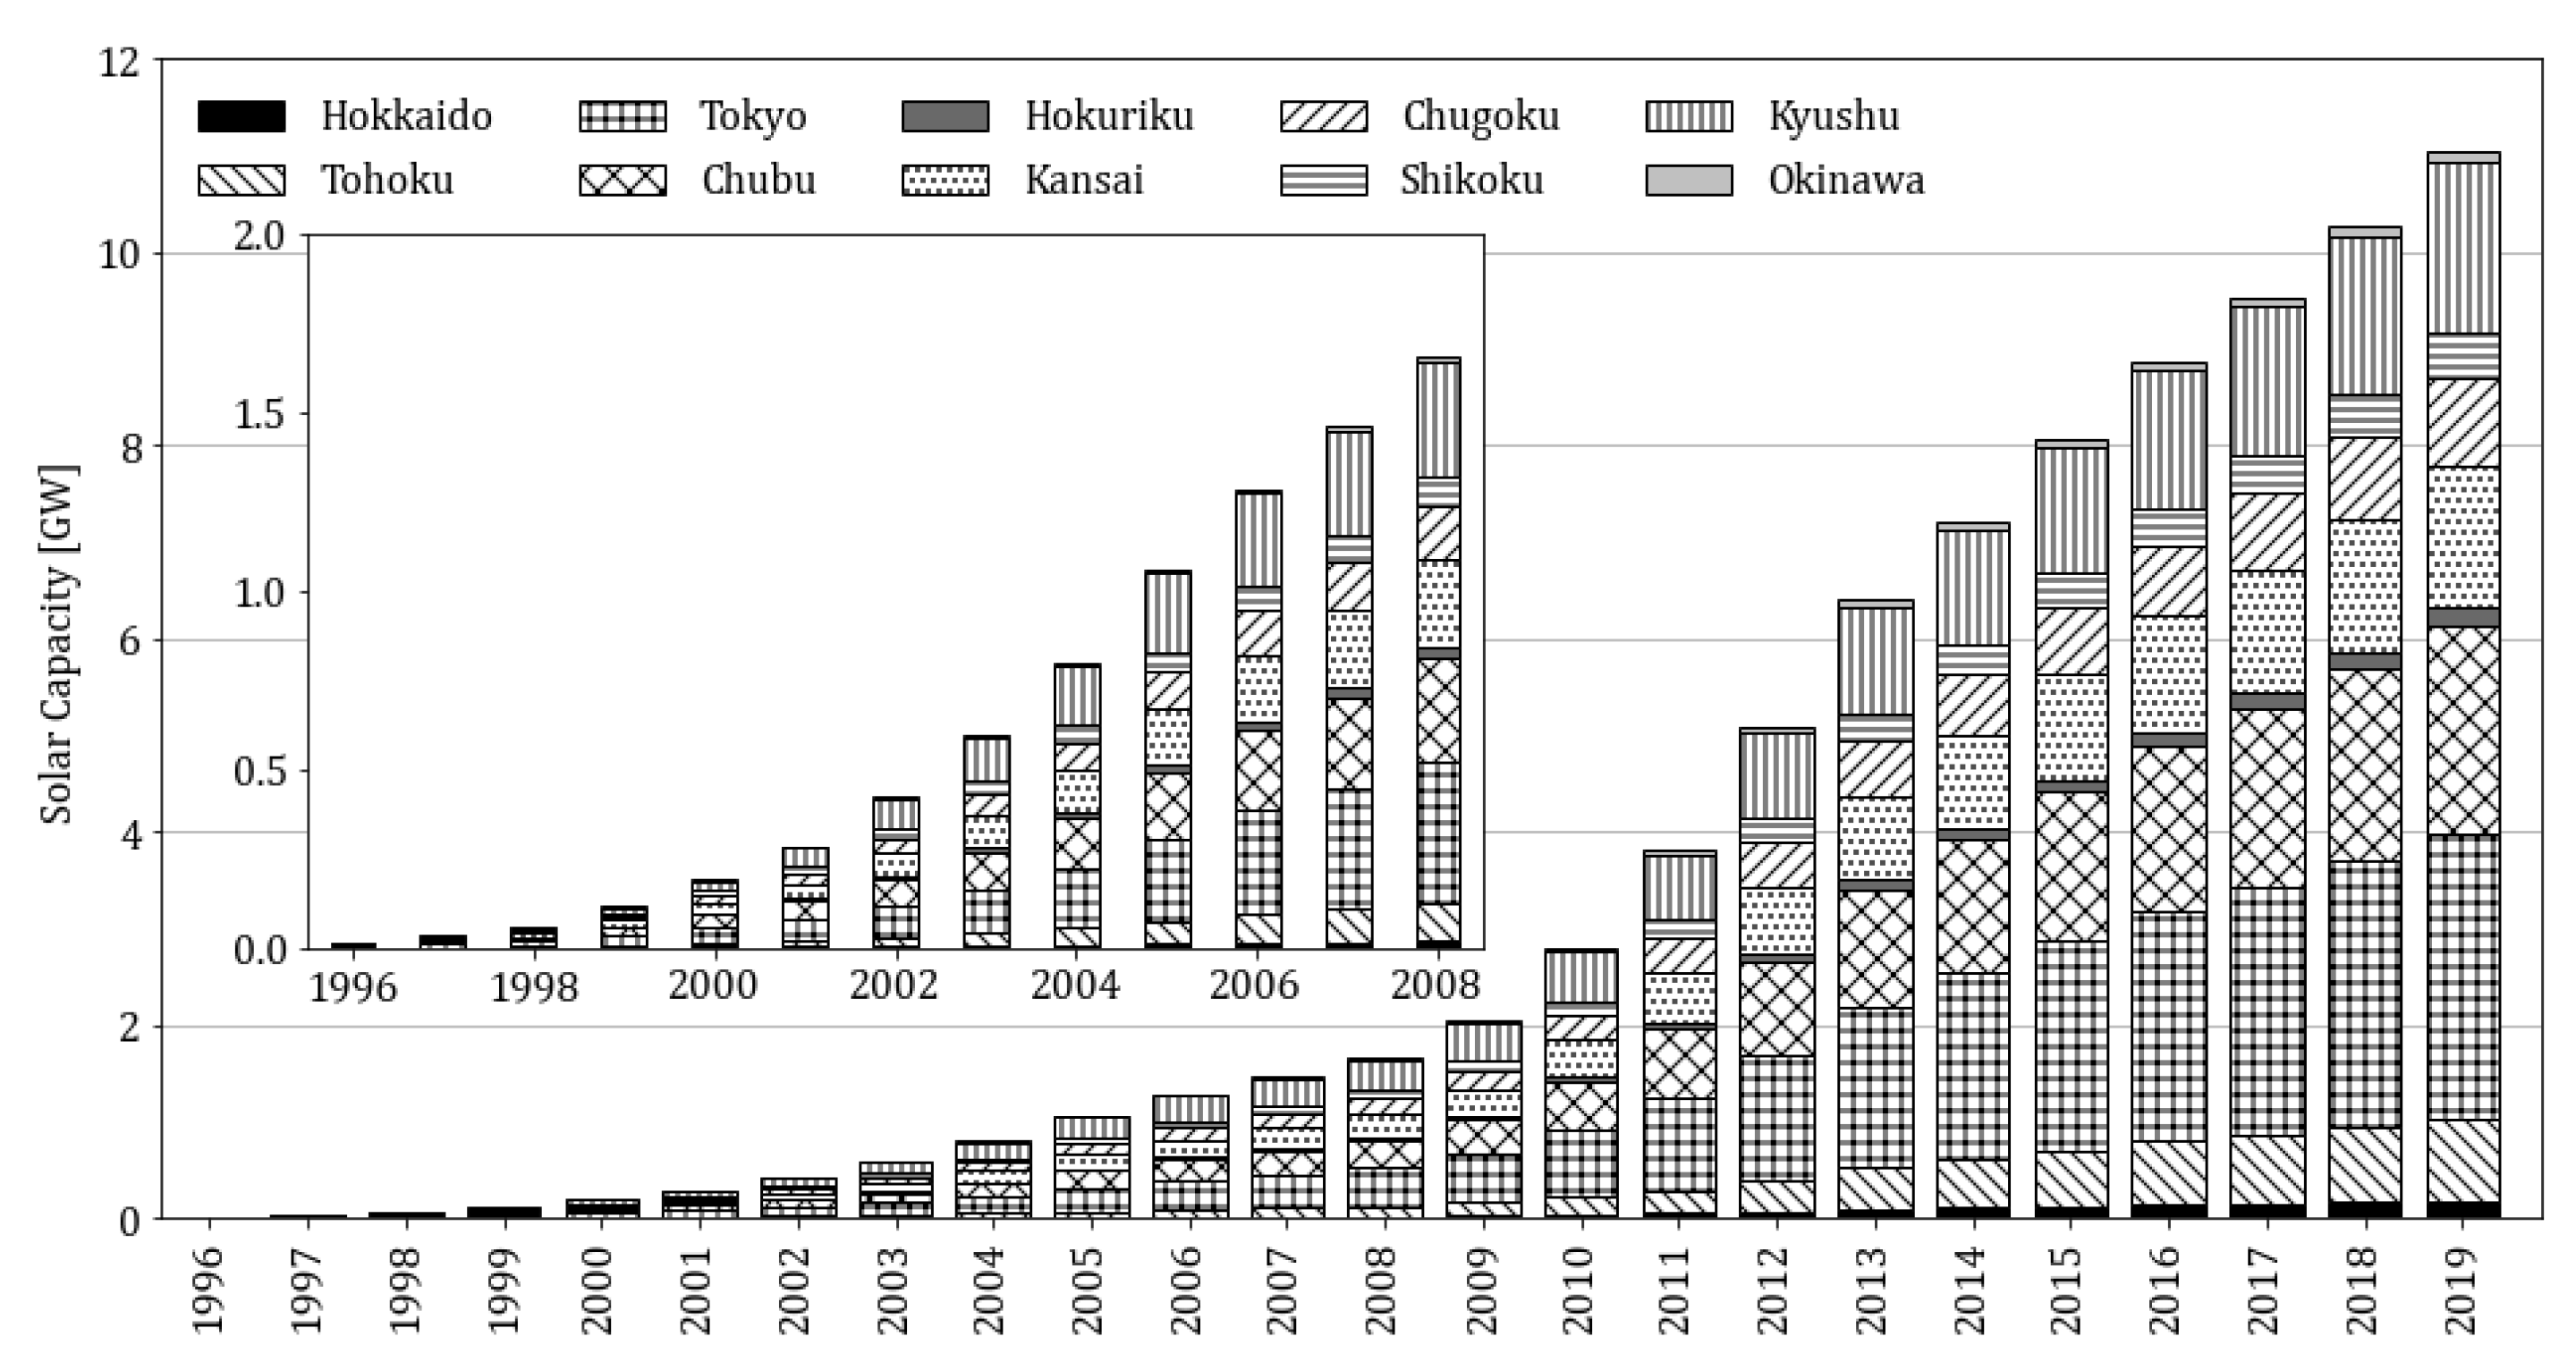
The authors conclude that there are various gaps and incomplete datasets that that prevent a comprehensive and complete view of the evolution of solar PV capacity between 1994 and 2020. The shortcomings of the data mainly relate to installations that are for home use only, and those that were installed without subsidies, though there is also a gap of half a year in 2017. More clarification from the government may also be necessary for those datasets where double-counting may be taking place. Nevertheless, the dataset compiled (and made available through this paper) is, to the authors’ knowledge, the most comprehensive and accurate that has been produced to date, recording developments across time and the different regions and prefectures of Japan.
Lastly, the authors provided recommendations for improving the accessibility and availability of the reported data to the international community, through measures such as formatting, data provisioning structure changes and connecting all reported data through a meta-level governing site.

Author Contributions

Conceptualization, S.M.G.D., K.N.I. and K.K.; methodology, K.K., S.M.G.D. and M.E.; validation, S.M.G.D. and K.K.; formal analysis, S.M.G.D. and K.K.; investigation, S.M.G.D. and K.K.; data curation, S.M.G.D.; writing—original draft preparation, K.K.; writing—review and editing, M.E., T.S. and K.N.I.; visualization, S.M.G.D.; supervision, T.S. and K.N.I. All authors have read and agreed to the published version of the manuscript.

Funding

This research was supported by Japan Science and Technology Agency (JST) as part of the Belmont Forum Grant Number JPMJBF18T2.

Data Availability Statement

The data presented in this study are openly available in Zenodo at https://doi.org/10.5281/zenodo.4673976 under CC-BY 4.0 license (https://creativecommons.org/license/by/4.0/)

Acknowledgments

A part of the present work was performed as a part of activities of Research Institute of Sustainable Future Society, Waseda Research Institute for Science and Engineering, Waseda University. This research was supported by Japan Science and Technology Agency (JST) as part of the Belmont Forum Grant Number JPMJBF18T2. The authors are also grateful for the financial support from the Ministry of Education, Culture, Sports, Science, and Technology of Japan for the doctoral studies of Samuel Matthew Dumlao at Kyoto University.

Conflicts of Interest

The authors declare no conflict of interest.

Abbreviations

The following abbreviations are used in this manuscript:
AISTNational Institute of Advanced Industrial Science and Technology
ANREAgency for Natural Resources and Energy (also known as ENECHO)
CEPCOChugoku Electric Power Company
CHUDENChubu Electric Power Company
EEPVExcess electricity purchasing scheme for photovoltaic (FIT Trial)
EPCOElectric Power Cooperative
EPIJElectric Power Industry in Japan
FEPCFederation of Electric Power Companies of Japan
FITFeed-in Tariff
GOJGovernment of Japan
HEPCOHokkaido Electric Power Company
IRENAInternational Renewable Energy Agency
ISEPInstitute for Sustainable Energy Policies
JEPICJapan Electric Power Information Center
JPEAJapan Photovoltaic Energy Association
KEPCOKansai Electric Power Company
KYUDENKyushu Electric Power Company
LFLoad Factor
METIMinistry for Economy, Trade, and Industry
NEDONew Energy and Industrial Technology Development Organisation
NEFNew Energy Foundation
NEPCNew Energy Promotion Council
NII-ElecJapanNational Institute of Informatics
OCCTOOrganization for Cross-regional Coordination of Transmission Operators
OKIDENOkinawa Electric Power Company
PVPhotovoltaic
REN21REN21 Renewable Now
RES-ERenewable energy sources for electricity
RIKUDENHokuriku Electric Power Company
RPSRenewables Portfolio Standard
RPVDResidential Photovoltaic Dissemination
TEPCOTokyo Electric Power Company
TOHOKUDENTohoku Electric Power Company
YONDENShikoku Electric Power Company

Appendix A

Table A1. Cost of electricity between 1994 and 2016 (the last year that data are available) [JPY/kWh] [90].
YearResidentialCommercial
199424.7617.13
199524.5516.94
199624.1616.50
199724.4416.75
199823.3315.89
199923.0615.47
200023.0815.44
200122.7915.46
200221.8314.39
200321.5014.07
200421.2213.75
200520.7913.51
200620.7313.62
200720.7813.66
200821.8915.21
200920.5413.77
201020.3713.65
201121.2614.59
201222.1415.63
201324.0117.23
201424.8518.25
201522.8116.37
201620.3813.79
Table A2. Annual Generation by region between 2016 and 2019 [GWh].
Annual Generation [GWh]
YearHokkaidoTohokuTokyoChubuHokurikuKansaiChugokuShikokuKyushuOkinawa
201613113190994775686243938-21927086387
20171313416314,10789048035093-25649156396
20181570599815,35199909426523525326859992414
20191979683916,78811,178115871926047314710,881406
Table A3. Cumulative Residential Solar PV Capacity [MW].
Solar PV Capacity [MW]
YearHokkaidoTohokuTokyoChubuHokurikuKansaiChugokuShikokuKyushuOkinawa
19960.20.83.52.90.42.41.10.51.50.1
19970.42.09.06.60.86.03.01.43.50.2
19980.93.314.911.31.19.95.63.36.30.3
19991.95.927.922.11.518.911.58.516.00.5
20003.110.343.936.52.129.819.314.128.90.8
20013.816.062.051.74.243.427.319.850.61.2
20025.024.488.474.77.365.641.027.785.02.2
20036.436.0122.6102.810.792.357.837.8125.03.6
20048.248.8167.6136.815.7121.476.747.5167.45.3
200510.764.5231.3185.221.1156.7102.557.0219.88.1
200613.180.8290.1223.126.4188.4122.265.2261.110.6
200715.593.1340.3254.228.9214.9136.572.1289.713.3
200819.1107.7395.4288.831.8244.4152.280.1319.516.9
200926.0137.5494.3358.738.2290.6192.498.8387.623.2
201036.9186.4683.1504.550.4382.9267.3133.7519.832.8
201152.4238.8954.5721.666.4509.2363.7179.4687.947.7
201274.8324.11297.3967.784.4678.6471.1235.5886.467.7
201397.2427.11658.61222.7103.4858.8575.5289.21085.980.4
2014109.8505.61926.01374.9113.5986.6622.4312.91188.679.2
2015127.4583.52161.31547.2125.61104.8679.6343.91318.182.1
2016141.0660.42378.01709.0140.51205.9740.0375.11431.486.6
2017150.5721.42562.11844.1153.21284.8789.0403.01532.490.3
2018161.3790.72761.21990.0165.31377.1843.6437.41642.596.0
2019173.8852.82967.12149.4180.41469.8902.3473.61764.9101.3
Table A4. Cumulative Commercial Solar PV Capacity [MW].
Solar PV Capacity [MW]
YearHokkaidoTohokuTokyoChubuHokurikuKansaiChugokuShikokuKyushuOkinawa
19960.00.00.20.00.00.10.00.60.00.2
19970.00.01.50.00.00.70.00.90.20.2
19980.00.02.20.10.21.10.20.90.20.3
19990.00.05.00.60.22.00.41.10.50.3
20000.10.56.01.00.23.10.71.50.60.3
20010.11.77.02.00.63.41.41.81.00.9
20020.22.08.52.60.74.31.52.61.40.9
20030.22.910.53.80.84.81.82.82.01.3
20040.23.712.75.01.66.42.23.13.31.6
20050.33.913.35.71.87.12.93.53.62.0
20060.44.115.05.42.27.73.13.83.82.1
200716.64.116.17.12.29.14.14.13.82.1
200816.74.116.87.02.29.24.14.13.92.1
200916.74.116.87.02.29.34.14.13.92.1
201016.74.116.87.02.29.34.14.14.02.1
201117.74.116.87.12.29.54.14.14.02.1
201227.031.0164.0134.123.0111.053.270.9152.39.4
2013233.9351.71397.21048.9123.4764.1562.9382.71562.983.6
2014492.0996.83429.62456.2289.91685.81190.6924.53454.0163.4
2015863.91890.15704.53782.2438.02540.41871.61357.24727.1213.2
2016984.32422.17173.34756.5563.33079.42461.71625.95513.5245.1
20171155.83229.28449.75538.1627.33523.42802.81802.66202.0266.6
20181318.44068.59576.56366.6792.03970.03396.71972.36756.3280.8
20191672.54841.010,699.57179.1852.54301.23881.42150.67496.7292.1

References

  1. United Nations Framework Convention on Climate Change. Adoption of the Paris Agreement. In 21st Conference of the Parties; United Nations: Paris, France, 2015. [Google Scholar]
  2. Solar Energy Industries Association. Solar Industry Research Data. Available online: https://www.seia.org/solar-industry-research-data (accessed on 1 October 2020).
  3. US Energy Information Administration. Electric Power Annual: Table 1.2. Summary Statistics for the United States, 2009–2019. Available online: https://www.eia.gov/electricity/annual/html/epa_01_02.html (accessed on 1 October 2020).
  4. Statista. Annual Cumulative Installed Capacity of Solar Photovoltaic in the United Kingdom (UK) from 2009 to 2019. Available online: https://www.statista.com/statistics/792406/cumulative-solar-pv-capacity-united-kingdom/ (accessed on 1 October 2020).
  5. UK Department for Business, Energy & Industrial Strategy. Energy Trends 6.1: Renewable Electricity Capacity and Generation. Available online: https://www.gov.uk/government/statistics/energy-trends-december-2020 (accessed on 1 October 2020).
  6. Fraunhofer ISE. Net Electricity Generation in Germany in 2020. Available online: https://energy-charts.info/?l=de&c=DE (accessed on 1 October 2020).
  7. Bundesverband der Energie- und Wasserwirtschaft e.V. Electricity Generation and Consumption in Germany. Available online: https://www.bdew.de/energie/stromerzeugung-und-verbrauch-deutschland/ (accessed on 1 October 2020).
  8. Skea, J.; Lechtenböhmer, S.; Asuka, J. Climate policies after Fukushima: Three views. Clim. Policy 2013, 13, 36–54. [Google Scholar] [CrossRef] [Green Version]
  9. Agency for Natural Resources and Energy. Survey of Electric Power Statistics. Available online: https://www.enecho.meti.go.jp/statistics/electric_power/ep002/results.html (accessed on 1 October 2020).
  10. Agency for Natural Resources and Energy. The 5th Strategic Energy Plan. Available online: https://www.enecho.meti.go.jp/en/category/others/basic_plan/5th/pdf/strategic_energy_plan.pdf (accessed on 19 January 2021).
  11. Office of Energy Efficiency & Renewable Energy. US Department of Energy. New Solar Opportunities for a New Decade. Available online: https://www.energy.gov/eere/solar/sunshot-2030 (accessed on 1 October 2020).
  12. Gall, N.; Stanley, G.; Solar Trade Association. 40 GW by 2030? The UK Solar PV Market Outlook. Available online: https://www.solar-trade.org.uk/wp-content/uploads/2019/11/STA-2030-Deployment-forecast-final.pdf (accessed on 18 February 2021).
  13. UK Committee on Climate Change. Executive Summary: The Renewable Energy Review. Available online: https://www.theccc.org.uk/wp-content/uploads/2011/05/Executive-summary.pdf (accessed on 18 February 2021).
  14. Wirth, H.; Fraunhofer ISE. Current Facts Regarding Solar PV in Germany. Available online: https://www.ise.fraunhofer.de/content/dam/ise/de/documents/publications/studies/aktuelle-fakten-zur-photovoltaik-in-deutschland.pdf (accessed on 18 February 2021).
  15. UK Department of Energy & Climate Change. Energy Trends. Available online: https://www.webcitation.org/6QQBZUnIZ?url=http://webarchive.nationalarchives.gov.uk/20121217150421/http://www.decc.gov.uk/assets/decc/11/stats/publications/energy-trends/2076-trendsjun11.pdf (accessed on 18 February 2021).
  16. US Department of Energy. The History of Solar. Energy Efficiency and Renewable Energy. Available online: https://www1.eere.energy.gov/solar/pdfs/solar_timeline.pdf (accessed on 18 February 2021).
  17. Bundesministerium fuer Wirtschaft und Energie. Complete Edition of the Energy Data—Data Collection of the BMWi. Available online: https://www.bmwi.de/Redaktion/EN/Artikel/Energy/energy-data.html (accessed on 1 October 2020).
  18. Nakata, S.; Matsumoto, K. Empirical Research on the Effectiveness of the Subsidy System for the Introduction of Residential Photovoltaic Power Generation Systems (Translated). JSCE Proceedings G (Environment) 2014. Available online: https://www.jstage.jst.go.jp/article/jscejer/70/5/70_I_121/_pdf (accessed on 27 January 2021).
  19. Cherp, A.; Vinichenko, V.; Jewell, J.; Suzuki, M.; Antal, M. Comparing electricity transitions: A historical analysis of nuclear, wind and solar power in Germany and Japan. Energy Policy 2017, 101. [Google Scholar] [CrossRef] [Green Version]
  20. Park, M.; Barrett, M.; Gallo Cassarino, T. Assessment of future renewable energy scenarios in South Korea based on costs, emissions and weather-driven hourly simulation. Renewable Energy 2019, 143. [Google Scholar] [CrossRef]
  21. Mishra, M.; Byomakesha, D.P.; Nayak, J.; Naik, B.; Kumar, S.S. Deep learning and wavelet transform integrated approach for short-term solar PV power prediction. Meas. J. Int. Meas. Confed. 2020, 166. [Google Scholar] [CrossRef]
  22. Hörsch, J.; Hofmann, F.; Schlachtberger, D.; Brown, T. PyPSA-Eur: An open optimisation model of the European transmission system. Energy Strategy Rev. 2018, 22. [Google Scholar] [CrossRef] [Green Version]
  23. Organisation for Economic Co-Operation and Development. Open Government Data: OURdata Index. Available online: https://www.oecd.org/digital/digital-government/open-government-data.htm (accessed on 28 March 2021).
  24. Open Data Handbook. What is Open Data? Available online: https://opendatahandbook.org/guide/en/what-is-open-data/ (accessed on 1 October 2020).
  25. Knüpfer, K.; Dumlao, S.M.G.; Esteban, M.; Shibayama, T.; Ishihara, K.N. PV Installed capacity and actual generation in Japan. Zenodo 2020. [Google Scholar] [CrossRef]
  26. Kimura, O.; Suzuki, T. 30 Years of Solar Energy Development in Japan: Co-Evolution Process of Technology, Policies, and the Market. 2006 Berlin Conference on the Human Dimensions of Global Environmental Change 2006. Available online: https://citeseerx.ist.psu.edu/viewdoc/download?doi=10.1.1.454.8221&rep=rep1&type=pdf (accessed on 9 October 2020).
  27. New Energy Promotion Council. Survey on the Introduction Status of Residential Photovoltaic Power Generation Systems in 2008. Available online: http://www.nepc.or.jp/topics/pdf/0900817.pdf (accessed on 1 October 2020).
  28. Kurokawa, K.; Ikki, O. The japanese experiences with national PV system programmes. Solar Energy 2001, 70. [Google Scholar] [CrossRef]
  29. New Energy Foundation. Implementation Status of PV Subsidy System (Homepage). Available online: http://www.solar.nef.or.jp/josei/zissi.htm (accessed on 1 October 2020).
  30. New Energy Promotion Council. Installation Status of Residential PV System. Available online: http://www.nepc.or.jp/survey/index.html (accessed on 1 October 2020).
  31. Japanese Law Translation. Act on Special Measures Concerning New Energy Use by operators of electric utilities (Act No. 62 of 7 June 2002). Available online: http://www.japaneselawtranslation.go.jp/law/detail/?id=1889&vm=04&re=02 (accessed on 19 January 2021).
  32. Agency for Natural Resources and Energy. RPS Equipment Information. Available online: https://www.rps.go.jp/RPS/new-contents/open_info/setsubijoho_dl.html (accessed on 1 October 2020).
  33. Ito, Y. A Brief History of Measures to Support Renewable Energy: Implications for Japan’s FIT Review Obtained from Domestic and Foreign Cases of Support Measures. Institute of Energy Economics of Japan 2015. Available online: https://eneken.ieej.or.jp/data/6330.pdf (accessed on 9 October 2020).
  34. Agency for Natural Resources and Energy. RPS Management System. Available online: https://www.rps.go.jp/RPS/new-contents/top/ugokilink-kakaku.html (accessed on 28 March 2021).
  35. New Energy Foundation. Local Government Support for Residential PV Systems 2006. Available online: http://www.solar.nef.or.jp/josei/h18-09.pdf (accessed on 1 October 2020).
  36. Agency for Natural Resources and Energy. Feed-in Tariff Scheme for Renewable Energy. Available online: https://www.meti.go.jp/english/policy/energy_environment/renewable/pdf/summary201209.pdf (accessed on 19 January 2021).
  37. Ministry of Economy, Trade, and Industry. New Buyback Program for Photovoltaic Generation in Japan (October 2009). Available online: https://www.meti.go.jp/english/policy/energy_environment/renewable/ref2001.html (accessed on 1 October 2020).
  38. Japan Photovoltaic Energy Association. Subsidy Application Data by Prefecture. Available online: http://www.jpea.gr.jp/j-pec/data/ (accessed on 1 October 2020).
  39. Japan Photovoltaic Energy Association. Solar Cell Shipment Statistics. Available online: http://www.jpea.gr.jp/document/figure/index.html (accessed on 1 October 2020).
  40. Agency for Natural Resources and Energy. Power Generation Results. Available online: https://www.enecho.meti.go.jp/statistics/electric_power/ep002/results_archive.html (accessed on 1 October 2020).
  41. Japanese Law Translation. Act on Special Measures Concerning Procurement of Electricity from Renewable Energy Sources by Electricity Utilities (Act No. 108 of 30 August 2011). Available online: http://www.japaneselawtranslation.go.jp/law/detail/?id=2573&vm=&re=02 (accessed on 1 October 2020).
  42. Agency for Natural Resources and Energy. FIT Purchase Price (FY2012-FY2018). Available online: https://www.enecho.meti.go.jp/category/saving_and_new/saiene/kaitori/kakaku.html (accessed on 28 March 2021).
  43. Japan Photovoltaic Energy Association. PV Outlook by JPEA. Available online: http://www.jpea.gr.jp/pvoutlook2050.pdf (accessed on 1 October 2020).
  44. Agency for Natural Resources and Energy. Natoku! Renewable Energy Information Disclosure (Homepage). Available online: https://www.enecho.meti.go.jp/category/saving_and_new/saiene/statistics/index.html (accessed on 1 October 2020).
  45. Agency for Natural Resources and Energy. Number of Power Plants and Capacity. Available online: https://www.enecho.meti.go.jp/statistics/electric_power/ep002/results_archive.htmll (accessed on 1 October 2020).
  46. Agency for Natural Resources and Energy. FIT Contracts in Japan. Available online: https://www.fit-portal.go.jp/PublicInfo (accessed on 1 October 2020).
  47. Ministry of Economy, Trade, and Industry. FIT-Based Contracts between Household Consumers and Electricity Companies Start to Expire Sequentially. Available online: https://www.meti.go.jp/english/press/2019/1101_001.html (accessed on 1 October 2020).
  48. Shinkawa, Tatsuya. Electricity System and Market in Japan. Available online: https://www.emsc.meti.go.jp/english/info/public/pdf/180122.pdf (accessed on 19 January 2021).
  49. Japan Electric Power Information Center. The Electric Power Industry in Japan. Available online: https://www.jepic.or.jp/en/data/epijpdf.html (accessed on 1 October 2020).
  50. Federation of Electric Power Companies of Japan. Electricity Review Japan. Available online: https://www.fepc.or.jp/english/library/electricity_eview_japan/index.html (accessed on 1 October 2020).
  51. Federation of Electric Power Companies of Japan. INFOBASE: Electric Power Company Database. Available online: https://www.fepc.or.jp/library/data/infobase/index.html (accessed on 1 October 2020).
  52. Institute for Sustainable Energy Policies. Current Status of Renewable Energy in Japan as Seen from Data (FY2019 Electricity Edition). Available online: https://www.isep.or.jp/wpdm-package/JapanStatusRE20200720ISEP (accessed on 1 October 2020).
  53. New Energy Foundation. PV System Introduction Status 1994–2004. Available online: http://www.solar.nef.or.jp/josei/kw_bunpu.xls (accessed on 1 October 2020).
  54. Agency for Natural Resources and Energy. Natoku! Renewable Energy Information Disclosure (List of Data). Available online: https://www.enecho.meti.go.jp/category/saving_and_new/saiene/statistics/past.html (accessed on 1 October 2020).
  55. Institute for Sustainable Energy Policies. ISEP Energy Reports. Available online: https://www.isep.or.jp/archives/library/category/report (accessed on 1 October 2020).
  56. Asanobu Kitamoto; National Institute of Informatics. Power Plants in Japan. Available online: http://agora.ex.nii.ac.jp/earthquake/201103-eastjapan/energy/electrical-japan/ (accessed on 1 October 2020).
  57. Myojo, S.; Ohashi, H. Effects of consumer subsidies for renewable energy on industry growth and social welfare: The case of solar photovoltaic systems in Japan. J. Jpn. Int. Econ. 2018, 48. [Google Scholar] [CrossRef]
  58. New Energy Foundation. Implementation Status of PV Subsidy System in 2005. Available online: http://www.solar.nef.or.jp/josei/2005_setchi.xls (accessed on 1 October 2020).
  59. Agency for Natural Resources and Energy. RPS Program (English Home Page). Available online: https://www.rps.go.jp/RPS/new-contents/top/toplink-english.html (accessed on 1 October 2020).
  60. Agency for Natural Resources and Energy. FIT System Information Disclosure. Available online: https://www.fit-portal.go.jp/PublicInfoSummary (accessed on 1 October 2020).
  61. Agency for Natural Resources and Energy. Electric Power Survey Statistical Table (Homepage). Available online: https://www.enecho.meti.go.jp/statistics/electric_power/ep002/results_archive.html (accessed on 1 October 2020).
  62. Japan Remote Island Center; Ministry of Land. Remote Island Promotion Handbook November 2004 (Rito Shinko Handbook); National Printing Bureau: Tokyo, Japan, 2004.
  63. Kyushu Electric Power Company. Renewable Energy in Tsushima (Japanese). Available online: http://www.kyuden.co.jp/library/pdf/press/2014/tsuoux7bshi.pdf (accessed on 18 February 2021).
  64. Hokkaido Electric Power Company. Press Release on Posting Electricity Forecast (5 October 2011). Available online: http://www.hepco.co.jp/info/2011/1187943_1445.html (accessed on 28 March 2021).
  65. Tohoku Electric Power Company. Press Release on Posting Electricity Forecast (7 July 2011). Available online: https://www.tohoku-epco.co.jp/pastnews/normal/1183366_1049.html (accessed on 28 March 2021).
  66. Tokyo Electric Power Company. Press Release on Posting Power Usage Graph (22 March 2011). Available online: https://www.tepco.co.jp/cc/press/11032202-j.html (accessed on 28 March 2021).
  67. Chubu Electric Power Company. Press Release on Posting Electricity Forecast (21 June 2011). Available online: https://www.chuden.co.jp/publicity/press/3158928_6926.html (accessed on 28 March 2021).
  68. Hokuriku Electric Power Company. Press Release on Posting Electricity Forecast (14 April 2011). Available online: http://www.rikuden.co.jp/press/attach/11071401.pdf (accessed on 28 March 2021).
  69. Kansai Electric Power Company. Press Release on Posting Electricity Forecast (29 June 2011). Available online: https://www.kepco.co.jp/corporate/pr/2011/0629-3j.html (accessed on 28 March 2021).
  70. Chugoku Electric Power Company. Press Release on Posting Electricity Forecast (30 November 2011). Available online: https://web.archive.org/web/20120512185906/http://www.energia.co.jp/info/oshirase20111130_1.pdf (accessed on 28 March 2021).
  71. Shikoku Electric Power Company. Press Release on Posting Electricity Forecast (27 July 2011). Available online: https://www.yonden.co.jp/press/re1107/1178739_1523.html (accessed on 28 March 2021).
  72. Kyushu Electric Power Company. Disclosure of Power Usage Status (5 July 2011). Available online: http://www.kyuden.co.jp/library/pdf/press/2011/h110628-2.pdf (accessed on 28 March 2021).
  73. Kansai Electric Power Company. Past Power Consumption Record Data from 1 April 2016 (Supply and Demand Information in the Kansai Area). Available online: https://www.kansai-td.co.jp/denkiyoho/download/archives/index.html (accessed on 31 March 2021).
  74. Organization for Cross-regional Coordination of Transmission Operators, JAPAN. System Information about the Major Electric Power Companies in Japan. Available online: https://www.occto.or.jp/keitoujouhou/index.html (accessed on 1 October 2020).
  75. Hokkaido Electric Power Company. Power Usage (Supply and Demand). Available online: https://www.hepco.co.jp/network/renewable_energy/fixedprice_purchase/supply_demand_results.html (accessed on 1 October 2020).
  76. Tohoku Electric Power Company. Power Usage (Supply and Demand). Available online: https://setsuden.nw.tohoku-epco.co.jp/download.html (accessed on 1 October 2020).
  77. Tokyo Electric Power Company. Power Usage (Supply and Demand). Available online: https://www.tepco.co.jp/forecast/html/area_data-j.html (accessed on 1 October 2020).
  78. Chubu Electric Power Company. Power Usage (Supply and Demand). Available online: https://powergrid.chuden.co.jp/denkiyoho/ (accessed on 1 October 2020).
  79. Hokuriku Electric Power Company. Power Usage (Supply and Demand). Available online: http://www.rikuden.co.jp/nw_jyukyudata/area_jisseki.html (accessed on 1 October 2020).
  80. Kansai Electric Power Company. Power Usage (Supply and Demand). Available online: https://www.kansai-td.co.jp/denkiyoho/area-performance.html (accessed on 1 October 2020).
  81. Chugoku Electric Power Company. Power Usage (Supply and Demand). Available online: https://www.energia.co.jp/nw/service/retailer/data/area/ (accessed on 1 October 2020).
  82. Shikoku Electric Power Company. Power Usage (Supply and Demand). Available online: https://www.yonden.co.jp/nw/renewable_energy/data/supply_demand.html (accessed on 1 October 2020).
  83. Kyushu Electric Power Company. Power Usage (Supply and Demand). Available online: https://www.kyuden.co.jp/td_service_wheeling_rule-document_disclosure (accessed on 1 October 2020).
  84. Okinawa Electric Power Company. Power Usage (Supply and Demand). Available online: http://www.okiden.co.jp/business-support/service/supply-and-demand/index.html (accessed on 1 October 2020).
  85. 株式会社ネットリーチ (Net Reach Co., Ltd.). Power Generation Comparison Ranking by Prefecture. Available online: http://standard-project.net/solar/region/ (accessed on 1 October 2020).
  86. Organization for Cross-regional Coordination of Transmission Operators (Japan). Outlook of Electricity Supply–Demand andCross-regional Interconnection Lines (FY2019). Available online: https://www.occto.or.jp/en/information_disclosure/outlook_of_electricity_supply-demand/files/200918_outlook_of_electricity.pdf (accessed on 31 March 2021).
  87. Japan Statistics Bureau, Ministry of Internal Affairs and Communications. e-Stat: Portal Site of Official Statistics of Japan. Available online: https://www.e-stat.go.jp/ (accessed on 1 October 2020).
  88. Administrative Management Bureau, Ministry of Internal Affairs and Communications. Open Data Catalogue Information Portal. Available online: https://www.data.go.jp/ (accessed on 1 October 2020).
  89. Agency for Natural Resources and Energy. Accelerating the Introduction of Renewable Energy-Aiming for Medium- to Long-Term Independence. Available online: https://www.enecho.meti.go.jp/about/whitepaper/2018pdf/whitepaper2018pdf_3_3.pdf (accessed on 14 January 2021).
  90. Agency for Natural Resources and Energy. Changes in Electricity Charges. Available online: https://www.enecho.meti.go.jp/about/whitepaper/2019html/2-1-4.html (accessed on 28 March 2021).
Figure 1. Timeline of schemes and related data collection in Japan between 1994 and 2020. EEPV in this figure stands for “Excess electricity purchasing scheme for photovoltaic”.
Energies 14 02128 g001
Figure 2. The 10 Japanese Electricity Power Companies (EPCOs)’s regional service areas. The capacity of the grid connection between the various regions is also provided between them, with DC lines marked by triangles and AC lines without (Transmission capacity data based on: [86]). The dates inside the brackets indicate when the increased capacity should be available. Note that archipelago of Okinawa is not connected to the four main islands of Japan.
Energies 14 02128 g002
Figure 3. Development of installed solar PV capacity (GW) in Japan from 1996 to 2019 by electricity power companies’ regional service area.
Energies 14 02128 g003
Figure 4. Development of residential (<10 kW) solar PV capacity (GW) in Japan from 1996 to 2019 by electricity power companies’ regional service area.
Energies 14 02128 g004
Figure 5. Development of commercial (≥10 kW) solar PV capacity (GW) in Japan from 1996 to 2019 by electricity power companies’ regional service area.
Energies 14 02128 g005
Figure 6. Annual PV electricity generation (TWh) for each region between 2016 and 2019.
Energies 14 02128 g006
Table 1. Entities related to energy generation and data collection.
NameAbbreviationTypeRoleYears Active
Ministry of International Trade and Industry (now METI)MITIGov-until 2003
Ministry of Economy, Trade and IndustryMETIGov-2003–Present
New Energy and Industrial Technology Development OrganizationNEDOGov--
Agency for Natural Resources and EnergyMETI-ANREGovDP2003–Present
New Energy FoundationNEFOrgDC1997–2007
New Energy Promotion CouncilNEPCOrgDC1994–2008
Japan Photovoltaic Energy AssociationJPEAOrgDP2008–2014
Organization for Cross-regional Coordination of Transmission OperatorsOCCTOOrgDP2016–Present
Hokkaido Electric Power CompanyHEPCOEPCoDP2016–Present
Tohoku Electric Power CompanyTOHOKUDENEPCoDP2016–Present
Tokyo Electric Power CompanyTEPCOEPCoDP2016–Present
Chubu Electric Power CompanyCHUDENEPCoDP2016–Present
Hokuriku Electric Power CompanyRIKUDENEPCoDP2016–Present
Kansai Electric Power CompanyKEPCOEPCoDP2016–Present
Chugoku Electric Power CompanyCEPCOEPCoDP2017–Present
Shikoku Electric Power CompanyYONDENEPCoDP2016–Present
Kyushu Electric Power CompanyKYUDENEPCoDP2016–Present
Okinawa Electric Power CompanyOKIDENEPCoDP2016–Present
Federation of Electric Power Companies of JapanFEPCOrgDC2010–2017
Institute for Sustainable Energy PoliciesISEPOrgDC2010–2017
Japan Electric Power Information CenterJEPICOrgDC2019–Present
National Institute of InformaticsNII-ElecJapanAcaDCPresent
Gov: Government Institutions or Agencies; Aca: Academic Institutions; Org: Organisations; EPCo: Electric Power Companies; DP: Data Provider; DC: Data Consolidator.
Table 2. Residential and commercial solar PV surplus purchase price (JPY/kWh) [34].
YearResidentialCommercial
200323.413.4
200423.413.4
200523.213.4
200624.112.9
200724.112.9
200825.914.6
2009-12.6
2010-12.5
Table 3. FiT subsidy pricing for private and commercial installations (JPY/kWh) [42].
YearResidentialCommercial
20124240
20133836
20143732
20152927
20162724
20172721
20182718
20192614
Table 4. Entities producing reports on the Japanese electricity sector.
TitleInstitutionDurationSPGLTSLGFMTRef.
PV Outlook by JPEAJPEA1994–PresentNNYJPPDF[43]
The Electric Power Industry in JapanJEPIC2019–PresentNNYENPDF[49]
Electricity Review JapanFEPC2005–PresentRNYENPDF[50]
INFOBASE: Electric Power Company DatabaseFEPC2005–PresentRNYJPPDF[51]
Current status of renewable energy in Japan as seen from data (FY2019 Electricity Edition)ISEP2003–PresentRNYJPPDF[52]
Columns (SP: Spatial; GL: Governance Level; TS: Timestep, LG: Language; FMT: File Format); Spatial and governance level (N: National; R: Regional; P: Prefecture; C: City; R0: Regional Jurisdiction); Timestep (Y: Yearly; Q: Quarterly; M: Monthly; D: Daily; H: Hourly; C: Current); File Format (XLS: Excel; WEB: Website; CSV: Comma Separated Values).
Table 5. Google search terms used to identify solar PV installed capacity data in Japan.
Original Search TermTranslation
都道府県市村町太陽光発電所データSolar PV installation data by prefecture, city, and town
都道府県市村町太陽光発電実施データSolar PV actual generation data by prefecture, city and town
住宅用太陽光発電システム導入状況Current status of residential solar PV system introduction
住宅用太陽光発電システム設置支援策Residential photovoltaic power generation system installation support measures
Table 8. Annual load factor [%] by region between 2016 and 2019.
Capacity Factor per Region [%]
YearHokkaidoTohokuTokyoChubuHokurikuKansaiChugokuShikokuKyushuOkinawa
201613.2611.7811.8613.3310.0910.4612.4711.6213.28
201711.4412.0014.5813.7311.7112.0613.2313.4812.63
201812.0814.0514.1613.6111.2013.8914.1012.6913.5412.51
201912.2013.6713.9813.6412.7614.1914.3913.6513.3711.75
Mean12.2512.8813.6513.5811.4412.6514.2513.0113.0012.54
STD0.651.001.060.150.961.500.140.460.80.55
Publisher’s Note: MDPI stays neutral with regard to jurisdictional claims in published maps and institutional affiliations.

