Article

Miniaturization of an Offshore Platform with Medium-Frequency Offshore Wind Farm and MMC-HVDC Technology

Department of Electrical Engineering, Zhejiang University, Hangzhou 310027, China
*
Author to whom correspondence should be addressed.
Energies 2021, 14(8), 2058; https://doi.org/10.3390/en14082058
Submission received: 15 March 2021 / Revised: 31 March 2021 / Accepted: 6 April 2021 / Published: 8 April 2021

Abstract

:
Offshore wind power has great development potential, for which the key factors are reliable and economical wind farms and integration systems. This paper proposes a medium-frequency wind farm and MMC-HVDC integration system. In the proposed scheme, the operating frequency of the offshore wind farm and its power collection system is increased from the conventional 50/60 Hz rate to the medium-frequency range, i.e., 100–400 Hz; the offshore wind power is transmitted to the onshore grid via the modular multilevel converter-based high-voltage direct current transmission (MMC-HVDC). First, this paper explains the principles of the proposed scheme in terms of the system topology and control strategy aspects. Then, the impacts of increasing the offshore system operating frequency on the main parameters of the offshore station are discussed. As the frequency increases, it is shown that the actual value of the electrical equipment, such as the transformers, the arm inductors, and the SM capacitors of the rectifier MMC, can be reduced, which means smaller platforms are required for the step-up transformer station and the converter station. Then, the system operation characteristics are analyzed, with the results showing that the power losses in the system increase slightly with the increase of the offshore AC system frequency. Based on time domain simulation results from power systems computer aided design/electromagnetic transients including DC (PSCAD/EMTDC), it is noted that the dynamic behavior of the system is not significantly affected with the increase of the offshore AC system frequency in most scenarios. In this way, the technical feasibility of the proposed offshore platform miniaturization technology is proven.

1. Introduction

Offshore wind energy resources are stable and rich, and offshore wind power exploration has become the focus of wind power development worldwide in recent years [1,2]. The design and implementation of transmission systems for offshore wind farm are some of the key topics in the field of offshore wind power generation [3]. According to practical engineering experience, there are generally two kinds of offshore wind farm integration schemes: high-voltage alternating current (HVAC) schemes and high-voltage direct current (HVDC) scheme.
Regarding small-scale, near-shore wind farms, the conventional 50/60 Hz HVAC scheme has the advantages of high technology maturity and low investment costs [4]. However, the available transmission capacity and maximum transmission distance of AC submarine cables are seriously limited by the charging current. Thus, low-frequency alternating current (LFAC) transmission technology is often applied to improve the cable transmission capability by reducing the charging current [5], while AC/AC converters appropriate for high-voltage, high-power transmission have not yet been put into engineering practice. Moreover, the economic advantages of such schemes need to be further verified [6].
The HVDC transmission system has both technical and economic advantages in long-distance and large-capacity power transmission scenarios. The modular multilevel converter-based HVDC (MMC-HVDC) scheme is recognized as the industry standard for connecting offshore wind farms [7,8]. However, the converter stations at both ends of the DC submarine cables, especially for the offshore converter station and its platform, lead to high costs for the MMC-HVDC scheme. In order to improve the economic efficiency, the diode rectifier unit-based HVDC (DRU-HVDC) scheme [9,10,11] for offshore wind farm integration was proposed, which can greatly reduce the costs for offshore converter stations [12]. However, this scheme requires AC filters and reactive power compensation equipment installed at the AC side of the offshore converter station [13], which enlarges the space requirement of the offshore converter platform, and thus weakens the economic benefits brought about by the introduction of the DRU rectifier. Moreover, the offshore wind turbines (WTs) should operate in grid-forming mode [14,15] in order to provide voltage support for the offshore AC system. Considering that the power transmission direction of the DRU is irreversible, ensuring adequate black start strategies for offshore wind farms connected by DRU-HVDC systems are also an important issue to be further investigated [16,17].
For the abovementioned problems, this paper proposes a medium-frequency wind farm and MMC-HVDC integration system. In this scheme, the MMC is adopted in the rectifier station and the inverter station due to its high scalability and low switching frequencies with satisfactory output harmonics characteristics. The most important feature of the proposed scheme is that the operating frequency of the offshore AC system is increased to the medium-frequency range (100–400 Hz) instead of the conventional 50/60 Hz.
In the power transmission and distribution fields, a medium-frequency AC system was first proposed to build microgrids based on distributed power generation units [18,19], and was used to improve the power quality and microgrid utilization. Based on the European SuperGrid concept, [20] analyzed the impact of the offshore AC system operating frequency on the investment costs of a large-scale wind power HVDC transmission scheme. Another study [21] compared the performances of a medium-frequency AC distribution grid and DC distribution grid for offshore wind farms, focusing on the system operation losses. Studies have shown that the economic advantages of medium-frequency AC offshore wind farms mainly come from the volume and weight reductions for the electrical equipment and associated platforms in such offshore wind farms. However, the abovementioned study only carried out a preliminary analysis at the economic level. It is necessary to further investigate the overall scheme before putting it into engineering practice, including an analysis of system’s main circuit parameters and dynamic characteristics.
The rest of this paper is organized as follows. In Section 2, the basic principles of the proposed medium-frequency based wind farm and MMC-HVDC integration system scheme are explained regarding the system topology and control strategies. In Section 3 and Section 4, the impacts of operating frequency increases on the system’s main circuit parameters and the operating characteristics are discussed. In Section 5, a comparison of the system dynamics between the proposed scheme and the conventional 50 Hz MMC-HVDC scheme is carried out using time domain simulations and the feasibility of the proposed scheme is verified. Section 6 presents the conclusions.

2. Basic Principles

2.1. System Topology

The system topology of the medium-frequency wind farm and MMC-HVDC integration system is shown in Figure 1. Wind turbines are integrated into the medium-voltage collection system via wind turbine transformers, to which the other terminals are connected to the low-voltage side windings of step-up transformers installed on the offshore substations. The high-voltage AC feeders for each wind turbine clusters are located at the AC bus of the rectifier station and the generated wind power is transmitted to the land grid via MMC-HVDC transmission systems.
Currently, commercial offshore wind turbines are usually doubly-fed induction-generator-based wind turbines (DFIG-WTs) and permanent magnet synchronous-generator-based wind turbines (PMSG-WTs). Although the partially rated converters utilized in DFIG-WTs are cheap, they are not the first choice in practical offshore wind farms due to the low operational reliability and high maintenance costs of multistage gear boxes [22]. PMSG-WTs are favored in harsh offshore working environments [2] due to the lack of such gearboxes. Therefore, PMSG-WTs are selected as the offshore WTs in the proposed scheme.
Since the failure rate of DC cables is low, MMCs with half-bridge submodules (SMs) are considered for the rectifier and inverter stations in this paper. Additionally, DC choppers are installed in the DC links of wind turbine converters and the onshore inverter station to provide an inverter-side, low-voltage fault ride-through.

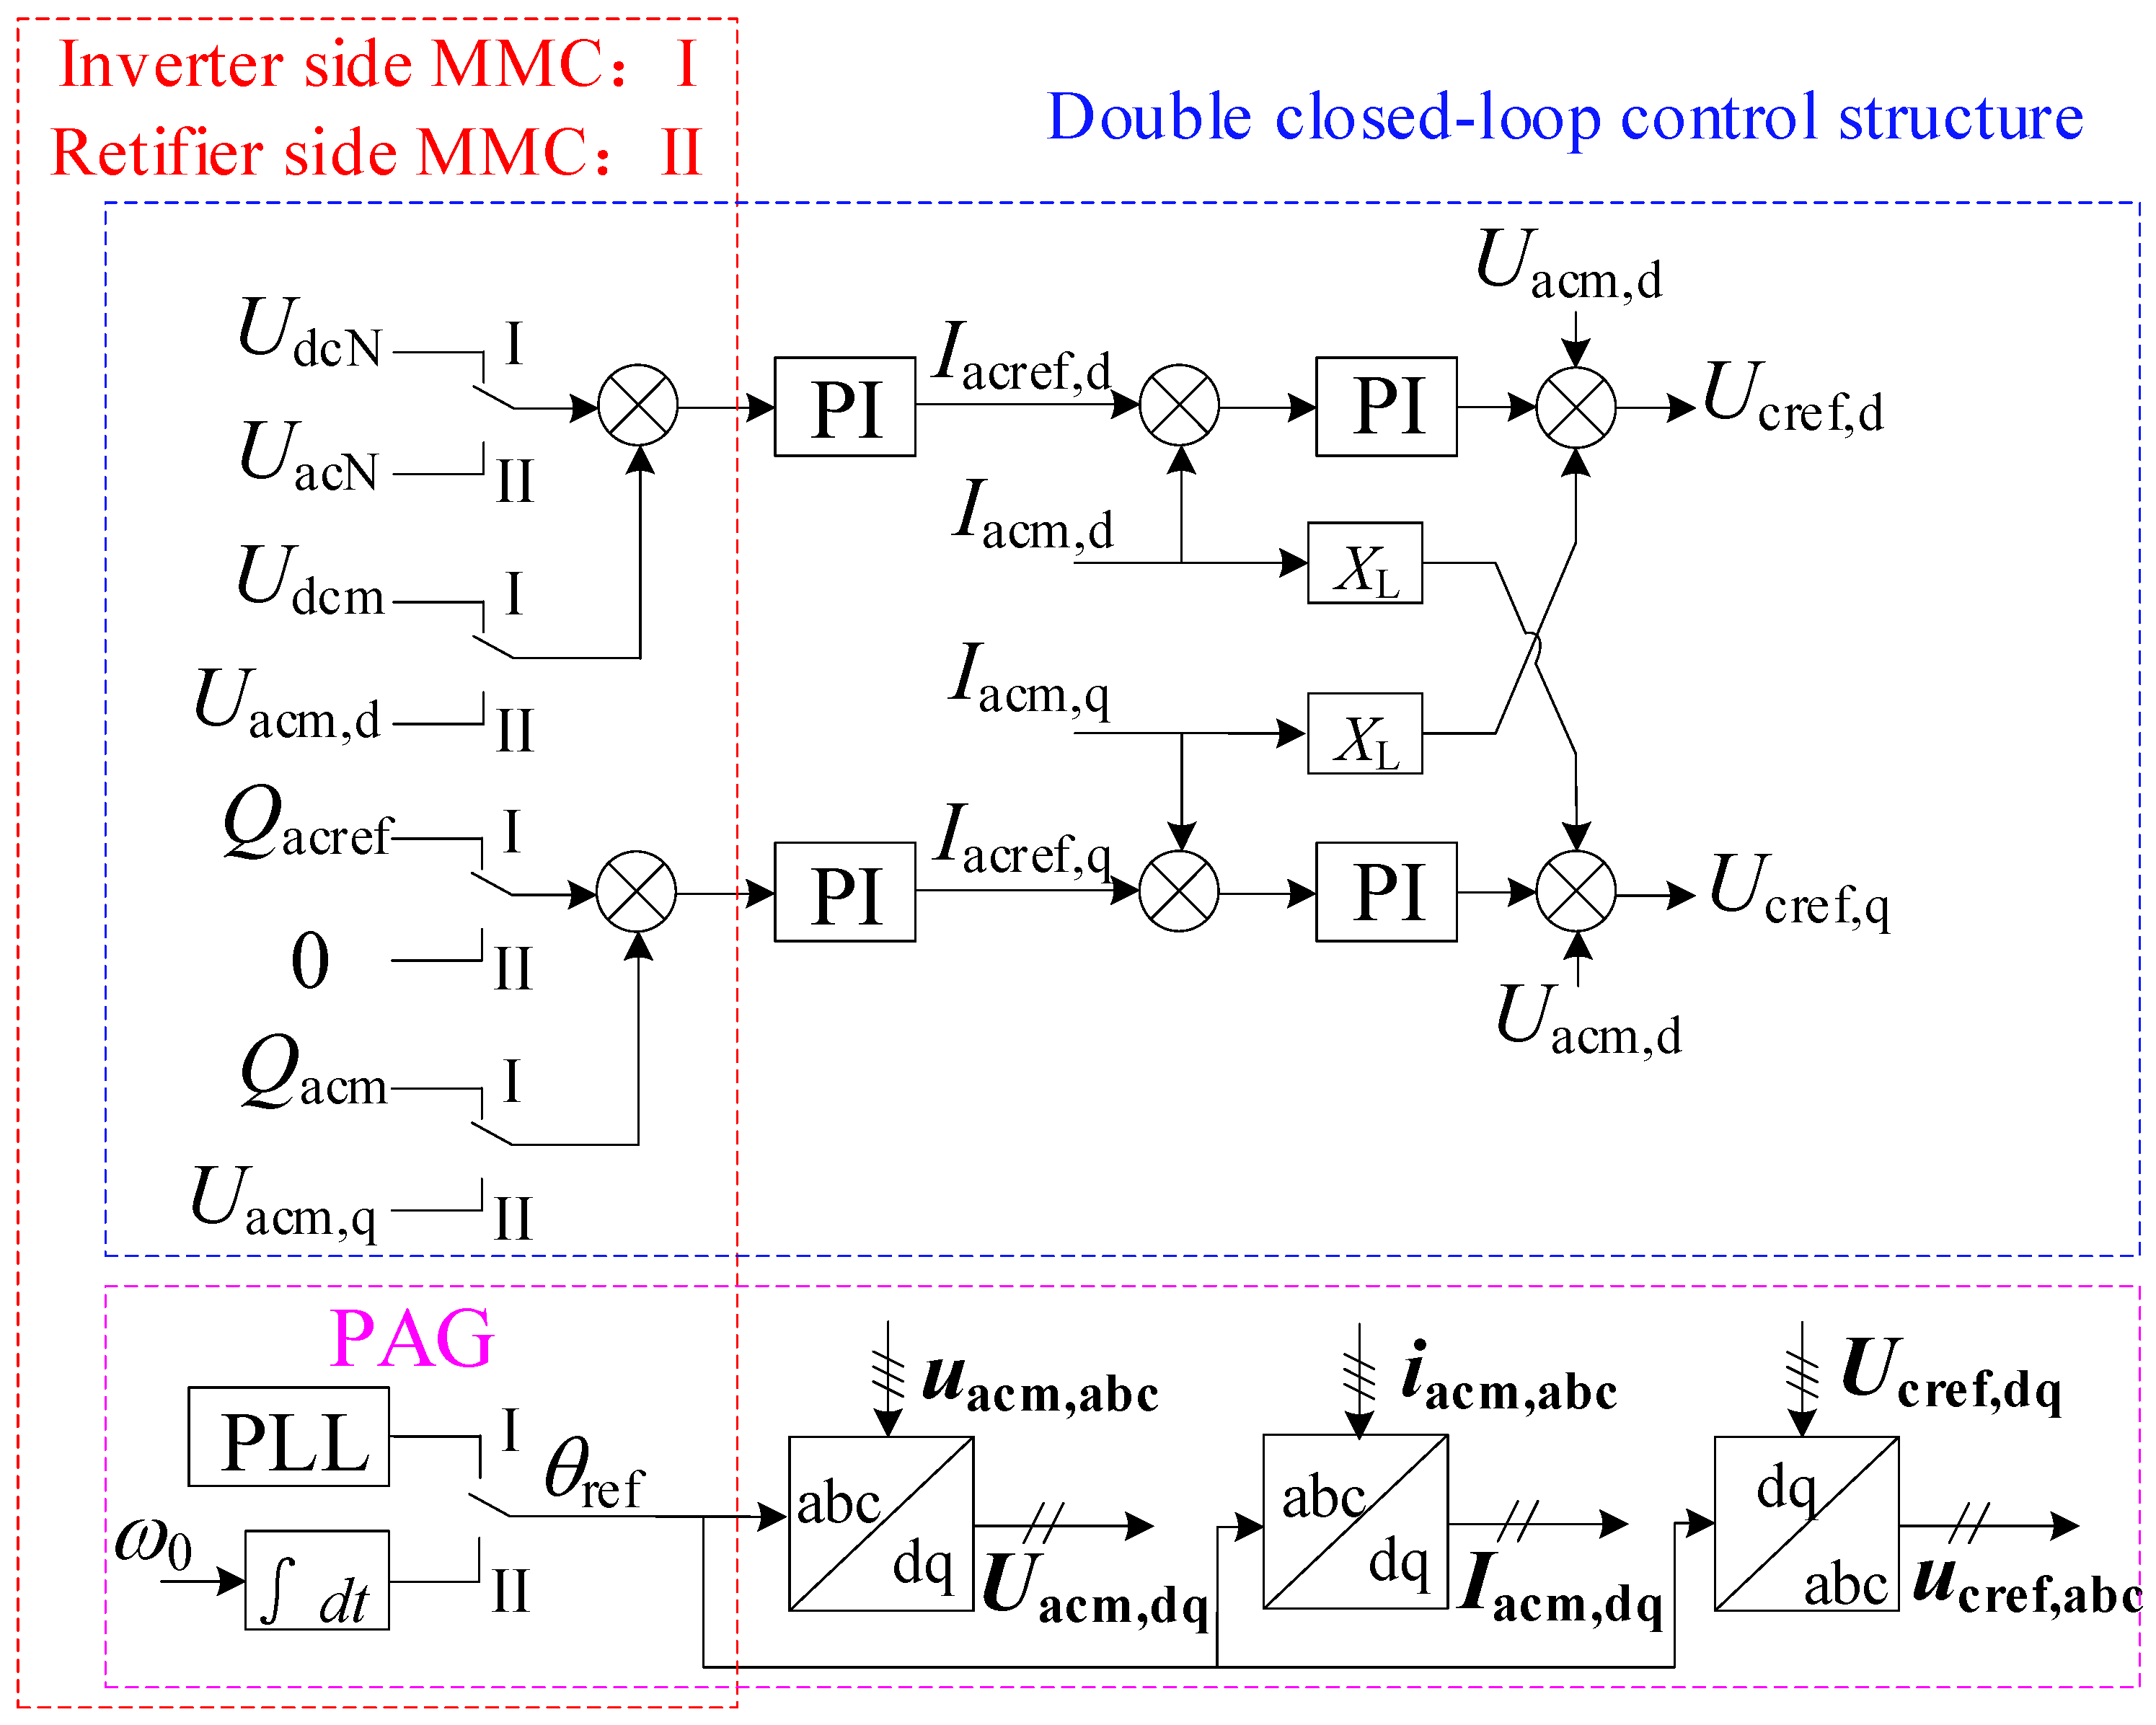
2.2. Control Strategies

The control system for the offshore wind farm HVDC transmission scheme can be divided into two parts: (1) control system for the wind turbine converters; (2) control system for the MMC-HVDC.
In the proposed scheme, the rectifier MMC operates in the grid-forming mode, providing voltage and frequency control for the offshore wind farm and absorbing the active and reactive power generated by wind turbines and AC submarine cables. In the meantime, the inverter MMC works in DC voltage and reactive power control mode. A double closed-loop structure based on the d-q synchronization rotating reference frame is adopted in both the rectifier-side and inverter-side MMCs, for which the control system diagram is demonstrated in Figure 2. Subscript d, q and dq means the d-axis, the q-axis and the d-q axis components of a variable. Here, UacN, UdcN, and uacm,abc, udcm represent the ratings and measurements of the AC-side and DC-side voltages of the MMC, respectively; iacm,abc represents the AC-side current measurements of the MMC; Iacref,dq and Ucref,dq represent the control system output reference current and voltage, respectively; XL is the coefficient of the compensation term in the decoupled current control loop; Uacm,dq, ucref,abc, and Iacm,dq are the current and voltage variables obtained by the coordinate transformation, respectively. It should be noted that the position of the control system reference frame for the inverter-side MMC is provided by a phase locker loop (PLL), while that for the rectifier-side MMC comes from an inside phase angle generator (PAG) at a fixed frequency signal ω0. PI is the proportional–integral controller.
The PMSG-WT usually adopts a back-to-back converter constituted by a two-level voltage-sourced converter (2L-VSCs) as the AC-AC frequency converter. The maximum power point tracking (MPPT) control is implemented by the machine-side converter (MSC), whereby the rotor-file-oriented control method combined with the zero d-axis current control strategy is used [22]. The grid-side converter (GSC) employs the conventional vector control scheme, with the active and reactive power control targets aimed at the DC-side voltage and AC-side reactive power, respectively. The control system diagram for the PMSG-WT is shown in Figure 3. Subscript d, q and dq means the d-axis, the q-axis and the d-q axis components of a variable. Here, Pe represents the generator’s electromagnetic power; ωref is the rotor rotation speed reference, which is derived from the power–speed optimal-relationship-based algorithm (ORB) [23]; ψr is the rotor flux of the generator; ωm is the measurement of the rotor rotation speed; UwtdcN and Uwtdcm represent the rating and measurement of the DC link voltage, respectively; imm,abc and igm,abc represent the AC-side current measurements of the MSC and GSC, respectively; Qgref and Qgm are the reference and the measurement of the GSC reactive power; Imcref,dq, Umcref,dq and Igcref,dq, Ugcref,dq are the output current references and voltage references from the MSC and GSC control systems, respectively; Xd and Xq represent the d-axis and q-axis reactance of the generator stator windings, respectively; umcref,abc, ugcref,abc, ugm,dq and Imm,dq, Igm,dq are the voltage current variables obtained after coordinate transformation, respectively. The position of the control system reference frame for the GSC is provided by the PLL, while that for the MSC comes from the rotor flux observer. PI is the proportional–integral controller.

3. Main Circuit Parameters

3.1. Transformers

The transformer leakage inductance Lt can be expressed as:
L t = X t 2 π f 0 U tN 2 S tN
where UtN and StN are the transformer’s rated voltage and capacity, respectively; Xt is the percentage of transformer reactance to the equivalent base impedance. Xt has a significant effect on the power transmission transformer’s manufacturing cost, which is usually selected as about 10–20%.
As can be seen from (1), if the voltage level UtN, the rated capacity StN, and the percentage of transformer reactance to the equivalent base impedance Xt remain unchanged, the leakage inductance Lt is inversely proportional to the operating frequency f0.
According to the typical transformer equation [24]:
E t = 4.44 f 0 N t B A
where the excitation voltage Et is related to the operating frequency f0, the winding turns Nt, the magnetic flux density B, and the core cross-sectional area A. Usually, the leakage inductance Lt of an power transformer is proportional to the core cross-sectional area A.
Therefore, it can be concluded that the volume and weight of the transformer made from the same material is inversely proportional to the operating frequency if the voltage level UtN, the rated capacity StN, and the percentage of transformer reactance to the equivalent base impedance Xt remain unchanged.
Transformers in offshore AC systems include wind turbine transformers, step-up transformers, and converter transformers, and the size and weight of such transformers determine the construction difficulty and investment cost for offshore platforms [1]. This is the main reason why [20,21] proposed increasing the offshore AC system operating frequency.

3.2. SM Capacitors

For the MMC topology, a number of small capacitors are distributed in series-connected submodules (SMs) in each arm, working as the power buffer between AC and DC systems. Thus, the variation of stored capacitive energy is affected by the active and reactive power transmission.
For analysis simplification, the voltage differences between SM capacitors in one arm are usually ignored, which is basically achieved through the capacitor voltage balance control strategy. Assuming that the SM capacitor voltage Uc varies in the form expressed in Equations (3) and (4):
U c = U c 0 + Δ u c ( t )
U c 0 = U dc / N c
where Uc0 represents the DC component of the capacitor voltage (also the rated voltage of an SM); Udc is the DC voltage of the MMC; Nc is the number of cascaded SMs in an arm; Δuc(t) is the time-dependent fluctuation in the SM capacitor voltage.
Then, the capacitor voltage fluctuation ratio εc can be defined as in (5):
ε c = max | Δ u c ( t ) | U c 0
According to [25], the capacitor voltage fluctuation ratio can be expressed in (6) with regard to the equivalent capacity discharging time constant H and AC-side operating frequency f0:
ε c = 1 2 π f 0 H
In (6), the equivalent capacity discharging time constant H can be denoted as in (7):
H = 3 C 0 U dc 2 S vN N c
where SvN is the converter’s rated capacity.
For a MMC-HVDC project, the DC voltage Udc and the converter’s rated capacity SvN are both predetermined. Note the fact that the rated voltage of the IGBTs used in practical MMC-HVDC projects is usually 3.3 kV or 4.5 kV, and the rated voltage of an SM can be treated as if it has already been selected. Therefore, the SM capacitor C0 is proportional to the equivalent capacity discharging time constant H according to (7).
Considering the voltage stress on the SM capacitor and SM power electronic devices, a reasonable εc value should be determined first. Then, the equivalent capacity discharging time constant H is inversely proportional to the AC-side operating frequency f0. Therefore, if the AC-side operating frequency f0 increases k times, the equivalent capacity discharging time constant H and the SM capacitor C0 will be reduced to k-th of its original value. The decrease of the SM capacitor C0 will reduce the volume and the weight of the MMC. The above analysis in this paragraph is one theoretical basis of the MMC miniaturization technology proposed in this paper.
In Figure 4, the relationship between the AC-side operating frequency f0, the equivalent capacity discharging time constant H, and the SM capacitor C0 is plotted for a ±320 kV/1200 MW MMC containing 291 cascaded SMs in each arm. The capacitor voltage fluctuation ratio εc is supposed as 8%. As plotted, H and C0 can be reduced from 40 ms and 9423 uF to 13.3 ms and 3141 uF when the AC-side operating frequency f0 increases from 50 Hz to 150 Hz.

3.3. Arm Inductors

Arm inductors in MMCs have several functions, such as improving the AC-side output current harmonics, suppressing the AC circulating current, and restraining the arm transient current during serious faults. However, the decisive design factor for the arm inductor is to avoid the circulating current resonance. The arm inductor L0 is usually selected according to (8) [25]:
L 0 = N c 16 π 2 f 0 2 C 0 = N c 16 π 2 f 0 ( f 0 C 0 )
As analyzed in Section 3.2, the SM capacitor C0 is inversely proportional to the AC-side operating frequency f0, i.e., (f0C0) can be assumed as constant. Combining this result with (8), it can be concluded that the arm inductor L0 is inversely proportional to the AC-side operating frequency f0. If the AC-side operating frequency f0 increases k times, the arm inductor L0 will be reduced to k-th of its original value, which is another theoretical basis for the MMC miniaturization technology proposed in this paper.
In Figure 5, the relationship between the AC-side operating frequency f0 and the arm inductor L0 is plotted based on the same MMC in Section 3.2. As plotted, L0 can be reduced from 90 to 30 mH when the AC system operating frequency f0 increases from 50 to 150 Hz.

4. Operating Characteristics

4.1. Submarine Cable Transmission Capability

The shunt capacitance of the cable is much larger than that of the overhead line. The capacitive charging current Icab flowing in the submarine cable can be simply estimated as [9]:
I cab = 2 π f 0 l C g U ac
where l is the cable length; Cg is the shunt capacitance; Uac is the AC transmission voltage.
The cable capacity left for the active power current Ip can be expressed by Icab and the cable ampacity Iamp:
I p I amp 2 I c 2
IEC-60287 provides standard formulas to calculate the cable ampacity under different operating conditions with different geometries. It is generally observed that the cable ampacity decreases with the increase of operating frequency [20]. Moreover, greater cable capacity will be occupied by the reactive current if a higher operating frequency is applied. If a greater number of cables or thicker cables have to be installed, the cable cost will increase. Although raising the operating frequency has a bad effect on the transmission capacity of AC submarine cables, it is not a major issue, since the cable lengths of offshore collecting systems are usually short enough that the influence of the capacitive charging current is not significant.

4.2. System Operation Losses

The operation losses produced inside the offshore wind farm and transmission system can be divided into three parts: the line losses, the transformer losses, and the converter losses. The system operation losses, including the line losses, the transformer losses, and the converter losses, will be increased in the proposed scheme. As a result, the increased power losses mean an increased operational cost.

4.2.1. The Line Losses

The line losses PL are mainly dependent on the line current and the line resistance:
P L = ( I p 2 + I c 2 ) R L , ac l ac + I dc 2 R L , dc l dc
where RL,ac represents the AC cable resistance per unit length; RL,dc represents the DC cable resistance per unit length; lac and ldc are the lengths of the AC and DC cable segments, respectively.
The AC cable resistance is frequency-dependent and the skin effect is the dominant cause for the resistance variations at frequencies below 10 kHz [26]. The relationship between RL,ac and RL,dc is presented below [27]:
R L , ac = α R R L , dc
where αR is defined as the skin factor, which is negatively related to the skin depth δ:
{ α R 1 / δ , δ = 1 / π f μ σ
where μ and σ are the conductor permeability and conductivity, respectively.
According to (11)–(13), the power losses generated in the submarine cables in the offshore collecting system will increase if the operating frequency of the offshore collecting system increases, while the DC transmission cable power losses remain almost unchanged. Considering that the total lengths of AC submarine cables in the offshore collecting system are relatively small compared to the DC transmission cables, the effect of frequency variation on PL is not significant

4.2.2. The Transformer Losses

The transformer losses Pt are composed of the core losses Pcor and the winding losses Pwin; Pcor is further made up of the hysteresis loss Phys and the eddy current losses Pedd, which can be expressed as [28]:
P cor = P hys + P edd = ( k h f B m η + k e f 2 B rms 2 h ) V t
Then, Pwin is calculated as:
P win = I t 1 2 l t 1 R t 1 + I t 2 2 l t 2 R t 2
where It1 and It2 are currents flowing through the primary side and the secondary side windings; lt1, lt2 and Rt1, Rt2 denote the length and resistance per unit length of the primary side and secondary side windings, respectively.
According to (14), the core losses per unit volume grow as the operating frequency grows. Considering the skin effect, the winding resistance in (15) also increases with the increase of the operating frequency, as do the winding losses per unit length. Nevertheless, regarding to the frequency range for the proposed scheme, the total transformer losses are not significantly larger [29], since the transformer volume at medium-frequency can be reduced.

4.2.3. The Converter Losses

The conduction losses Pon and the switching losses Psw produced in internal power electronic devices constitute the majority of the converter losses Pc. The power converters in the offshore wind power transmission system include the back to-back 2L-VSC inside wind turbine units and the HVDC system converters based on MMC. For the WTs, if the GSC operates in the same or a slightly higher switching frequency as 50/60 Hz, the converter losses will not increase too much. For the MMC in the offshore rectifier station, the converter losses are largest when the MMC transmits the largest active power [29]. Noted that the power factor of the rectifier MMC in this operation condition is always high, the switching frequency of the rectifier MMC is only slight higher than the offshore AC system frequency, and Pswi is much less than Pon [30]. Thus, although the switching losses of the rectifier-side MMC will be increased in the proposed scheme, there will be no significant effect on the total converter losses.

5. Case Study

5.1. System Parameters

As shown in Figure 1, an electromagnetic transient simulation model was developed in power systems computer aided design/electromagnetic transients including DC (PSCAD/EMTDC) for the proposed offshore wind farm and its integration system. The model configuration is illustrated in Figure 6. The offshore wind turbine groups are represented by four equivalent units operating in parallel. Considering the short transmission distance inside the offshore wind farm (usually several kilometers), the π-type equivalent circuit model is utilized for those feeders, while the frequency-dependent phase model is adopted for the long-distance DC cables linking the rectifier and the inverter. The onshore grid is modeled by its Thevenin equivalent circuit, consisting of the equivalent voltage source and equivalent impedance. More detailed parameters for the simulation model are listed in Table 1.
An offshore wind farm integration system based on a point-to-point MMC-HVDC is plotted in Figure 6, where #1 WT~#4 WT represent the equivalent wind turbine. F1 and F2 are the AC faults to be applied. In order to give general conclusions, the simulation model parameters listed in Table 1 approximate the two-terminal test system in [26]; the actual values and the per unit (p.u.) values of the parameters in the simulation model are listed. The base value of the converter transformer secondary side and primary side voltages are chosen as their rated voltages; the base value of the DC-side voltage is selected as the rated DC voltage [24].
This section involves a comparative study of the offshore wind farm integration system based on the MMC-HVDC scheme with the conventional 50 Hz scheme and the proposed medium-frequency scheme (f0 is set as 150 Hz) in terms of economic and operational characteristics. Additionally, under the constraint conditions presented in Section 3, the SM capacitor and the arm inductor of the rectifier MMC for the proposed scheme can be set at only one-third of the conventional 50 Hz scheme. The other parameters except for C0 and L0 remain unchanged in the two systems in the comparison.

5.2. Economic Analysis

The offshore platform cost Cop mainly consists of the offshore step-up station platform cost Css and offshore rectifier station platform cost Ccs, which can be estimated according to (16) and (17) at operating frequency f0 for an offshore wind farm with a rated power of Prate [20]:
C ss = 2.53 + 0.0887 P r a t e ( 1 3 + 2 3 50 f 0 )
C cs = 6.13 + 0.1758 P r a t e ( 1 3 + 2 3 50 f 0 )
In (17), the offshore rectifier station platform cost Ccs is calculated based on the fact that Ccs is mostly influenced by the transformer when the operating frequency f0 increases. However, as discussed in Section 3, as both the SM capacitors and the arm inductors decrease significantly when f0 increases, both the converter weight and the converter cost will inevitably decrease and (17) is actually a conservative estimation.
Based on (16) and (17), Css (Ccs) values at operating frequencies f0 of 50 and 150 Hz are calculated as 91.23 M€ and 51.81 M€ (181.93 M€ and 103.80 M€), respectively. It is noted that when the proposed offshore platform miniaturization scheme (operating frequency f0 as 150 Hz) is adopted, the offshore platform cost Cop can decrease by about 43% compared with the conventional 50 Hz MMC-HVDC scheme.

5.3. Simulation Results

The differences in the system operating characteristics for those two schemes are mainly reflected in the rectifier-side converter station and the wind turbine grid side converters, which are, thus, the focuses of simulation studies.

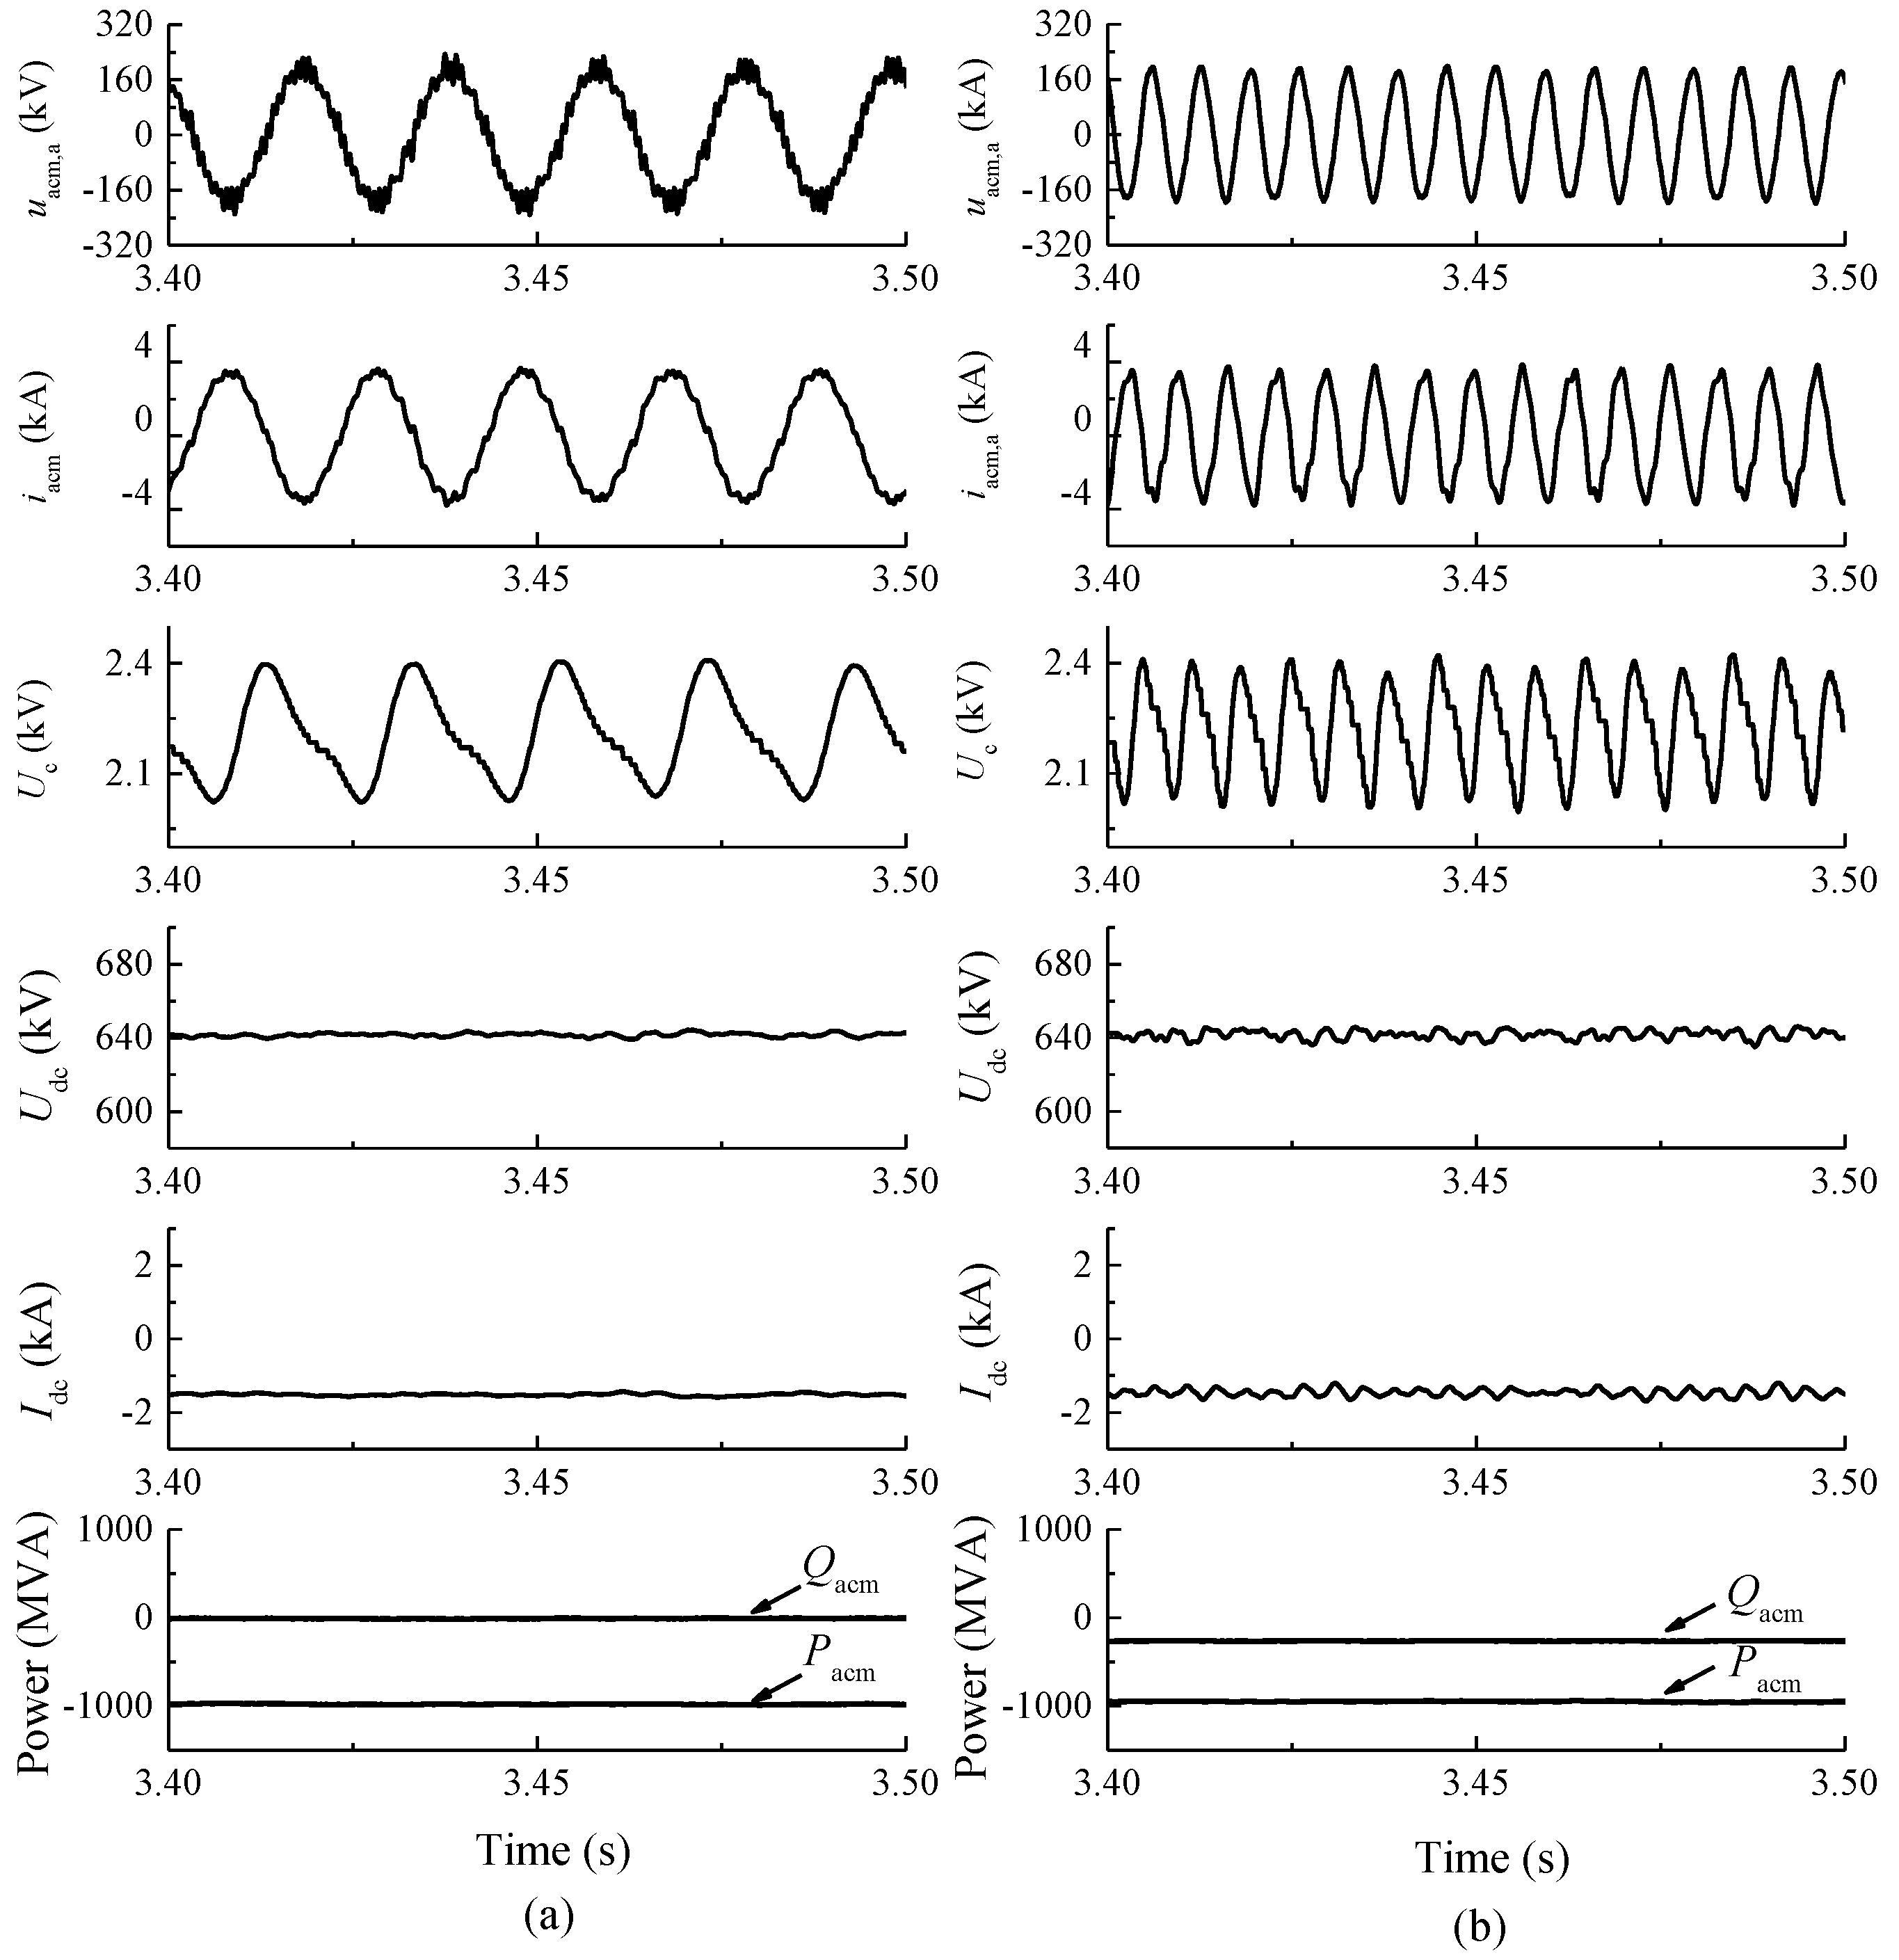
5.3.1. Steady-State Operating Point

The steady-state operation characteristics of the rectifier-side converter and the offshore wind turbines are shown in Figure 7 and Figure 8. Most of the related symbol definitions are given in Section 2; Pacm and Pgm refer to the active power measured at the AC side of the rectifier station and the wind turbine GSC, respectively. It can be seen that the output power of the offshore wind power transmission system in both schemes can maintain stable operation at the rated operating point.
Compared Figure 7a with Figure 7b, it is noted that the output power, the DC voltage, and the DC current of the rectifier-side are almost same in the 50 Hz scheme and the proposed medium-frequency scheme; the shapes of the output AC voltage, the AC current, and the SM capacitor voltage are also almost same in the two schemes, except that the frequencies of these waveforms in the two schemes are 50 and 150 Hz. Similar results can also be found by comparing Figure 8a with Figure 8b, showing that the increase of the offshore AC system operating frequency causes little effect on the output characteristics of wind turbine units, except that the frequencies of the output AC voltage and the AC current in the two schemes are different.
Moreover, the same capacitor voltage fluctuation ratio is obtained in Figure 7a,b, indicating that smaller SM capacitors and smaller arm inductors in the rectifier MMC are reached when the AC-side operating frequency is increased.

5.3.2. Wind Power Fluctuation

We assume that the offshore wind farm integration system achieves the rated operating point. At t = 3.5 s, the wind speed drops and the maximum power point of the offshore wind turbines changes to 0.8 p.u. Figure 9 and Figure 10 depict the system’s dynamic responses to wind power variations.
When the wind speed drops, the mechanical power of the WTs is decreased. Due to the imbalance between the electromagnetic power and the mechanical power, the WT generator inevitably slows down. Due to the regulation of the MPPT control, the reduction of the generator rotational speed makes the grid side converter reference active power decrease and the WTs can eventually enter a new stable operation state. Therefore, the offshore wind farm integration systems in both schemes are able to reach the new steady-state operating point.
As plotted in Figure 9, the dynamic responses of the output power, the DC voltage, and the DC current of the rectifier-side in the proposed scheme are exactly the same as those in the 50 Hz system; the amplitudes of the output AC voltage, the AC current, and the SM capacitor voltage are also almost the same in the two schemes. As plotted in Figure 10, the dynamic responses of the output power, the DC link voltage, and the rotor speed of the WT in the proposed scheme are exactly same as those in the 50 Hz system; the amplitudes of the output AC voltage and the AC current are also almost same in the two schemes.

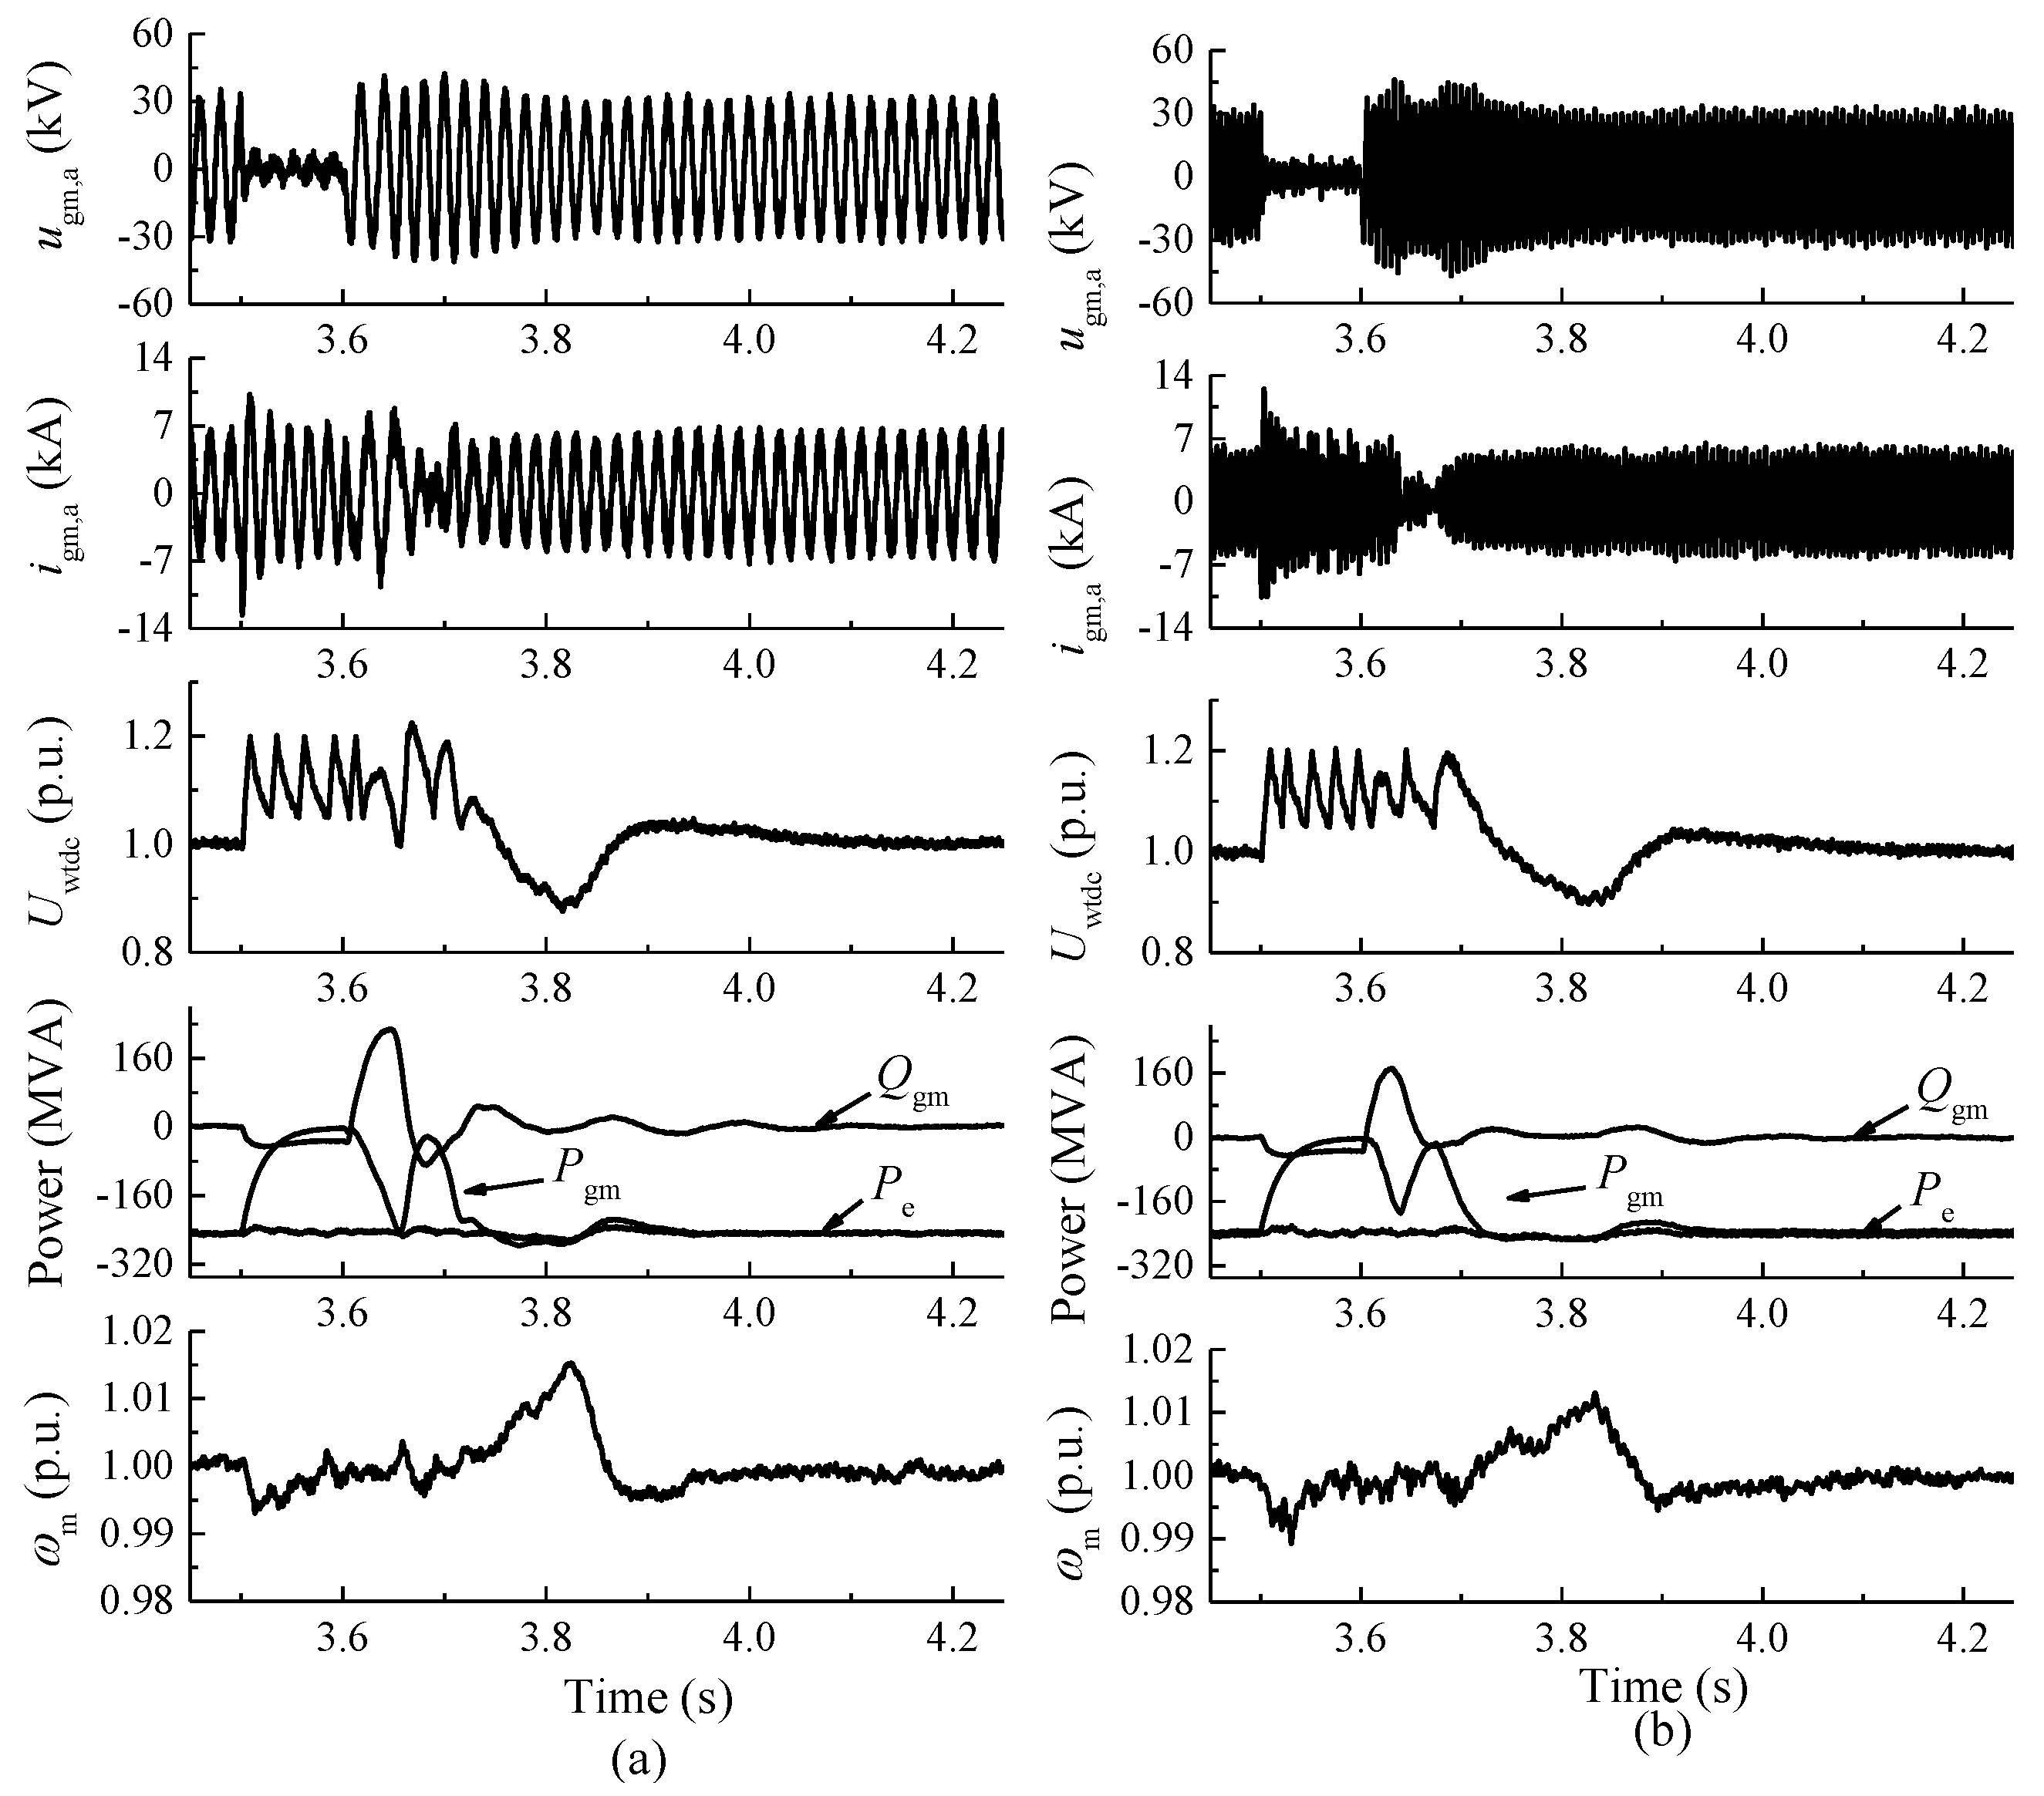
5.3.3. AC Faults in the Offshore Wind Farm

The system transient characteristics during serious offshore wind farm AC faults are shown in Figure 11 and Figure 12. The offshore wind farm integration system reaches the rated operating point before fault occurrence. At t = 3.5 s, a three-phase metallic short-circuit fault is applied to the offshore collection system (F1 in Figure 6) and the fault is cleared after 100 ms.
When the AC fault at offshore wind farm occurs, the active power cannot be transmitted out of the GSC of the WTs. Due to the active power imbalance, the WT rotor inevitably speeds up and the DC voltage of the WT converter also increases. However, when the DC voltage of the WT converter reaches the upper threshold, the braking resistor will be inserted to consume the active power generated by the WT [31]. After the fault, the active power transmission of the offshore wind farm integration system will be resumed rapidly. In this way, the low-voltage ride-through capability of the proposed system for AC faults in the offshore wind farm is verified.
From the simulation results, it can be observed that the disturbance of the 50 Hz scheme is more severe than for the proposed medium-frequency scheme, both during and after the AC fault. The difference in the system’s dynamic responses may be caused by the wind turbine GSCs.

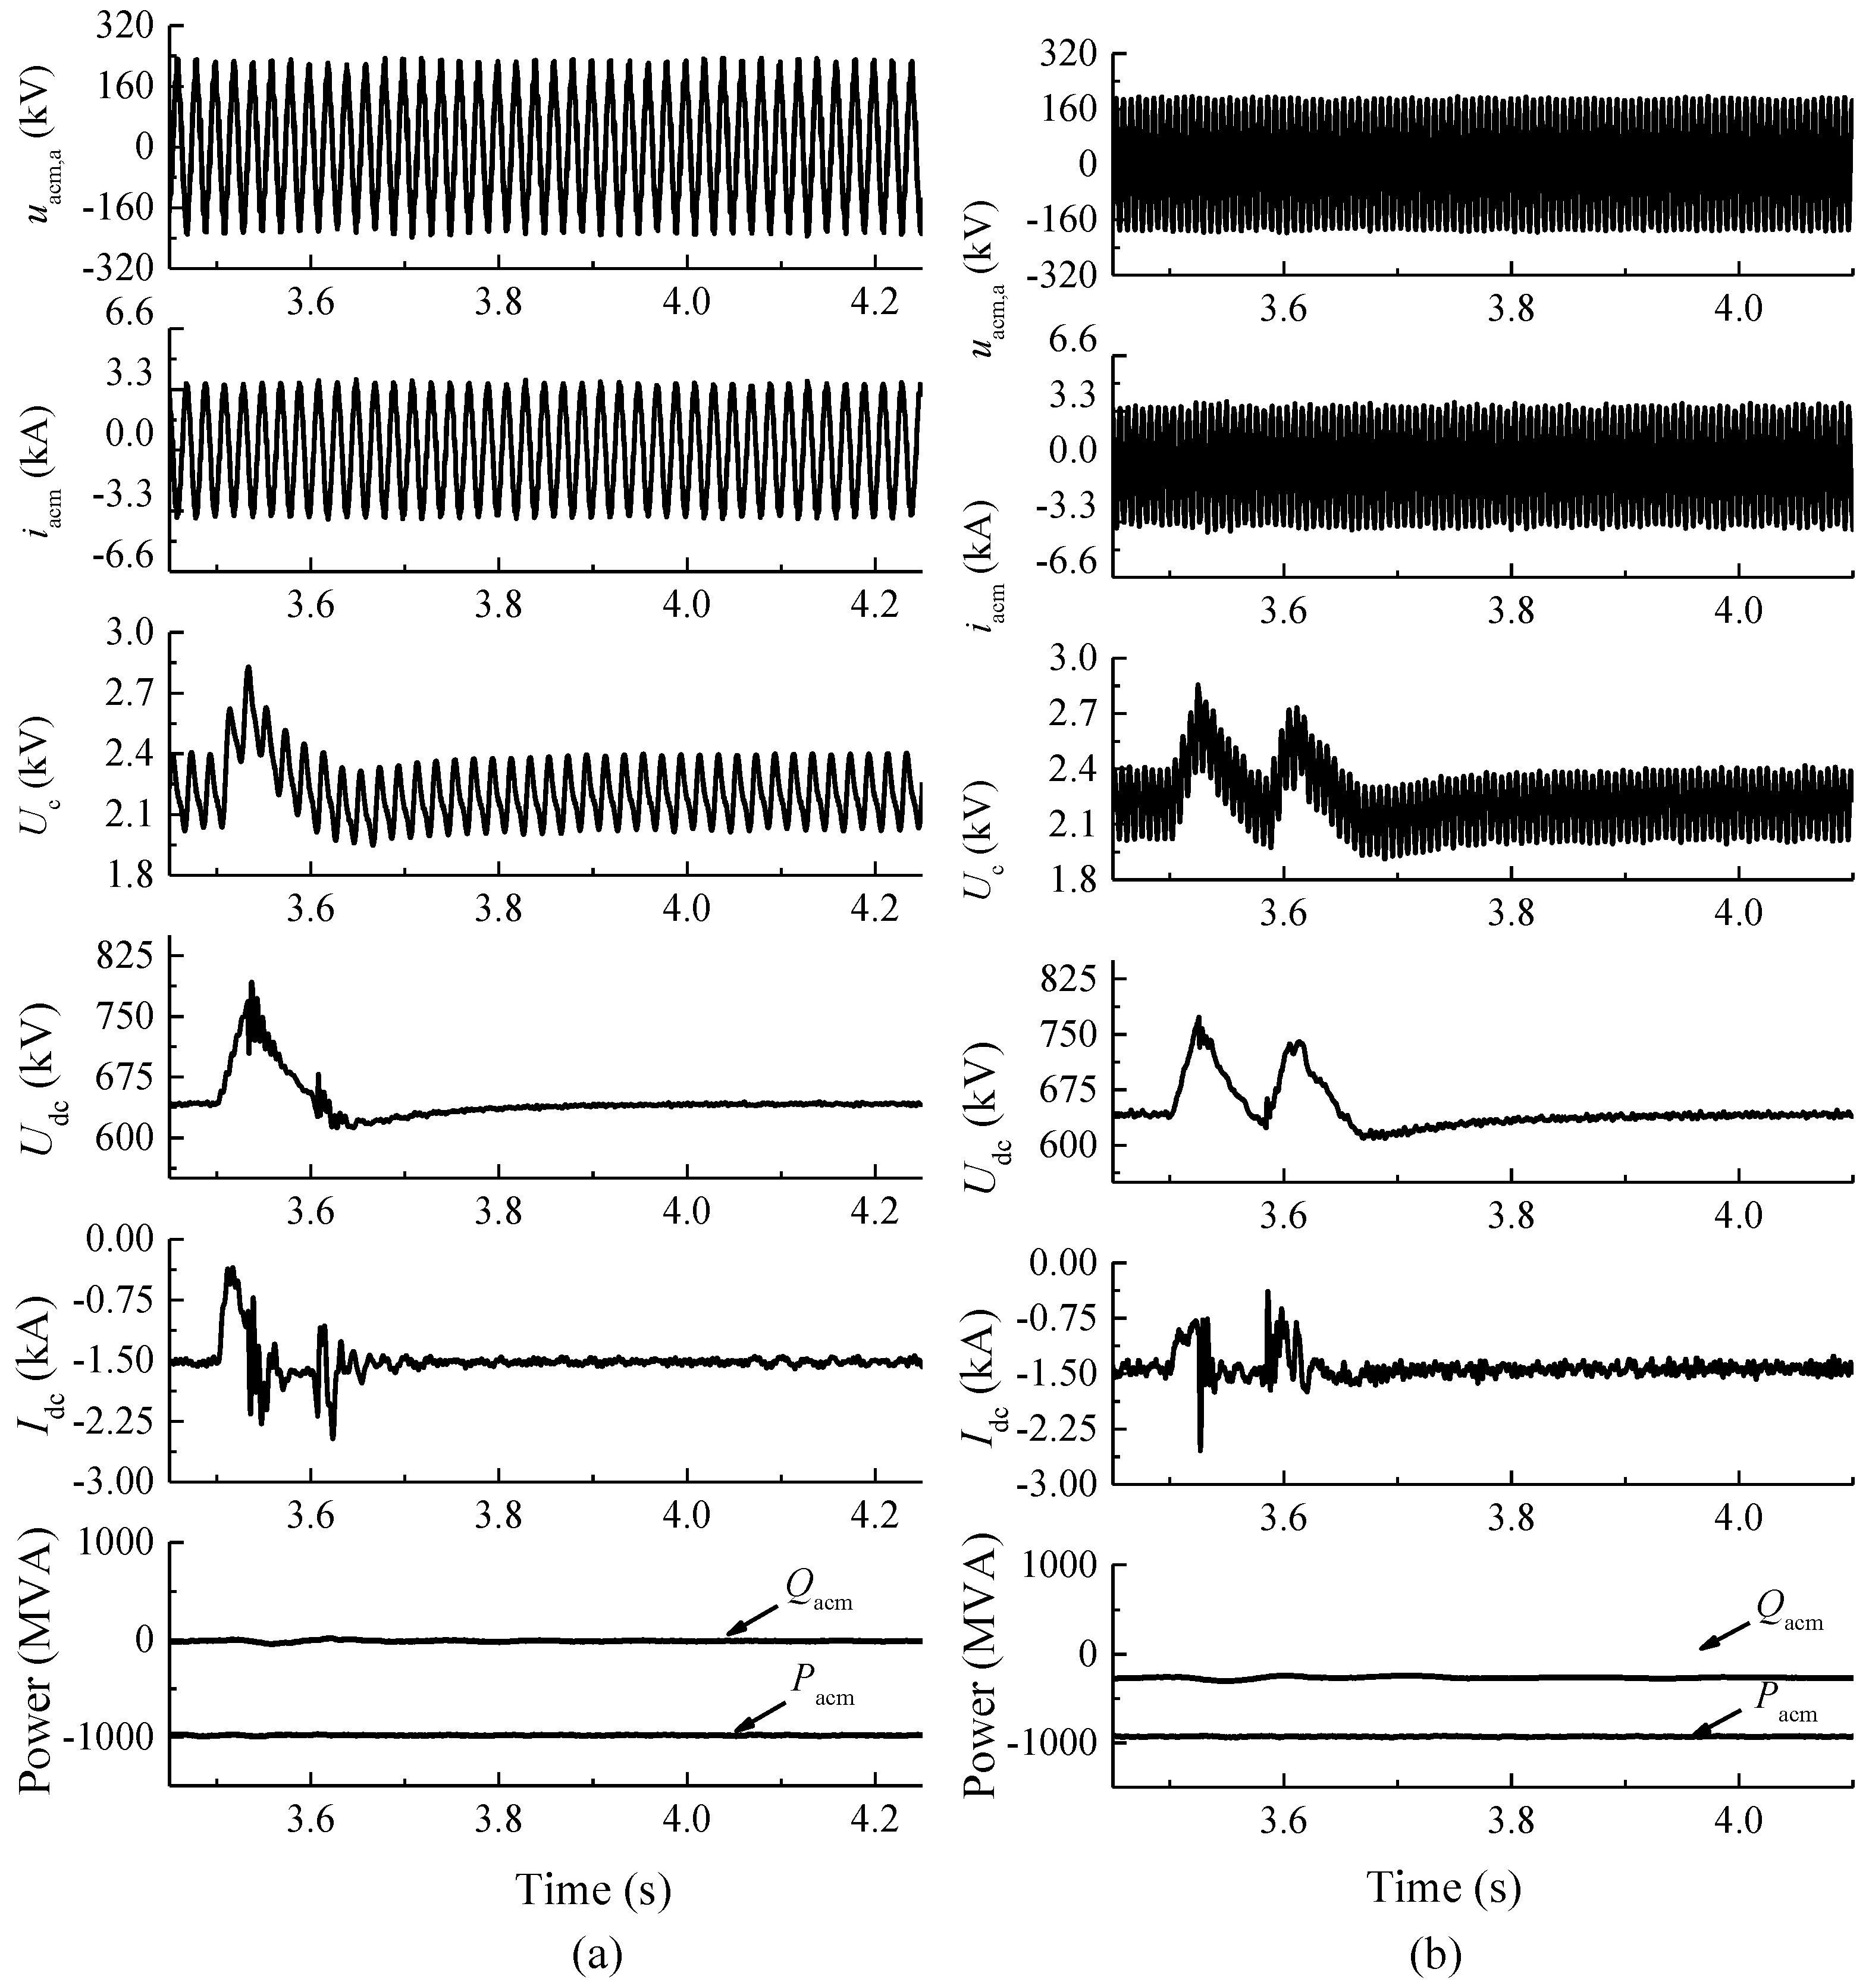
5.3.4. AC Faults in the Onshore Grid

The system’s transient characteristics during serious AC faults in the onshore grid are shown in Figure 13 and Figure 14, assuming that the offshore wind farm integration system is operating at the rated operating point and a three-phase metallic short-circuit fault was applied to the onshore grid (F2 in Figure 6) at t = 3.5 s and was cleared after 100 ms.
When an AC fault occurs in the onshore grid, the active power cannot be transmitted into the onshore grid due to the low AC voltage at the inverter-side. At the same time, the rectifier keeps absorbing active power from the offshore wind farm, making the DC voltage of the MMC-HVDC increase. Then, the DC chopper is inserted in order to protect the MMC-HVDC from severe DC-side overvoltage by dissipating the surplus active power from the rectifier [31]. As a result, the DC voltage of the MMC-HVDC can be limited.
From the simulation results, it can be observed that the disturbance of the 50 Hz scheme is more severe than the proposed medium-frequency scheme during the AC fault. However, the disturbance of the proposed medium-frequency scheme is more severe than the 50 Hz scheme after the AC fault. The differences in the system’s dynamic responses may be caused by the MMC-HVDC. As can be seen from Figure 14, the AC fault in the onshore grid has little effect on the offshore wind farm. It can be observed that both systems can also successfully ride through this kind of low AC voltage fault.

6. Conclusions

A medium-frequency wind farm and MMC-HVDC integration system scheme for offshore platform miniaturization was proposed and analyzed in this paper. Compared with the existing HVDC schemes, the contributions of the proposed scheme are as follows:
(1)
Compared with the conventional 50/60 Hz MMC-HVDC scheme, the operating frequency of the offshore AC system is increased to the medium-frequency range in the proposed scheme. Consequently, the actual values of the electrical equipment are decreased inversely to the increased frequency, resulting in significantly reductions in the spatial volume, weight, and cost of the offshore platform;
(2)
Compared with the other offshore platform miniaturization schemes, such as the DRU-rectifier-based HVDC scheme, the AC voltage and frequency of the offshore AC system are controlled by the offshore MMC rectifier station in the proposed scheme. Therefore, the conventional grid control mode can be maintained in the offshore WTs, as well as in the offshore wind farm black start scheme.
The technical feasibility of the proposed offshore wind farm and power integration scheme was proven through time domain simulation results under different operating conditions. Based on the comparison of the proposed scheme and the conventional 50 Hz scheme, the simulation results also showed that the system’s dynamic behavior is not significantly affected by the proposed scheme for most scenarios.

Author Contributions

Conceptualization, Z.X.; methodology, Z.Z. and Y.T.; validation, Z.Z. and Y.T.; formal analysis, Z.Z.; investigation, Y.T.; writing—review and editing, Z.Z. and Y.T.; supervision, Z.X. All authors have read and agreed to the published version of the manuscript.

Funding

This paper is supported by the Fundamental Research Funds for the Central Universities.

Institutional Review Board Statement

Not applicable.

Informed Consent Statement

Not applicable.

Data Availability Statement

Data available on request due to privacy.

Conflicts of Interest

The authors declare no conflict of interest.

Abbreviations

The following abbreviations are used in this manuscript:
DFIG-WTDoubly-fed induction generator-based wind turbine
DRUDiode-rectifier unit
DRU-HVDCDiode-rectifier unit-based high-voltage direct current
GSCGrid side converter
HVACHigh-voltage alternating current
HVDCHigh-voltage direct current
LFACLow frequency alternating current
MMCModular multilevel converter
MMC-HVDCModular multilevel converter-based high-voltage direct current
MPPTMaximum power point tracking
MSCMachine side converter
PAGPhase angle generator
PLLPhase-locker loop
PMSG-WTPermanent magnet synchronous generator-based wind turbine
SMSubmodules
2L-VSCsTwo level voltage sourced converter
CgThe cable shunt capacitance
C0The SM capacitor capacitance
EtThe excitation voltage
HThe equivalent capacity discharging time constant
iacm,abcThe AC-side current measurements of the MMC
imm,abc, igm,abcThe AC-side current measurements of the MSC and GSC, respectively
Iacref,dq, Ucref,dqThe control system output reference current and voltage, respectively
Iacm,dq, Uacm,dq, ucref,abcThe current and voltage variables obtained from the coordinate transformation, respectively
IcabThe capacitive charging current
IampThe cable capacity
Igcref,dq, Ugcref,dqThe output current references and voltage references from the GSC control system, respectively
Imcref,dq, Umcref,dqThe output current references and voltage references from the MSC control system, respectively
IpThe active power current
L0The arm inductor inductance
LtThe transformer leakage inductance
l, lac, ldcThe cable lengths of the AC and DC cable segments, respectively
NcThe number of cascaded SMs in an arm
NtThe winding turns
Pc, Pon, PswThe total converter losses, the converter conduction losses, and the converter switching losses, respectively
PeThe generator’s electromagnetic power
Phys, PeddThe hysteresis loss and the eddy current losses, respectively
PLThe transmission line losses
Pt, Pwin, PcorThe total transformer losses, the winding losses, and the core losses, respectively
RL,ac, RL,dcThe AC cable resistance and DC cable resistance per unit length, respectively
SvNThe converter’s rated capacity
ugcref,abc, ugm,dq, Igm,dqVoltage and current variables obtained after coordinate transformation at the GSC
umcref,abc, Imm,dqVoltage and current variables obtained after coordinate transformation at the MSC
UacThe AC transmission voltage
UacN, Uacm,abcThe AC-side voltage rating and measurements of the MMC, respectively
Uc, Uc0, Δuc(t)The SM capacitor voltage, the DC component of the SM capacitor voltage, and the time-dependent fluctuation in the SM capacitor voltage, respectively
UdcThe DC voltage of the MMC
UdcN, UdcmThe DC-side voltage rating and measurement of the MMC
UtN, StNThe transformer’s rated voltage and capacity, respectively
UwtdcN, UwtdcmThe DC link voltage rating and measurement, respectively
Xd, XqThe d-axis and q-axis reactance of the generator stator windings, respectively
XLThe coefficient of the compensation term in the decoupled current control loop
XtThe percentage of the transformer to the equivalent base impedance
αR, δThe skin factor and the skin depth, respectively
εcThe capacitor voltage fluctuation ratio
μ, σThe conductor permeability and conductivity, respectively
ω0, f0The operating frequency
ωref, ωmThe rotor rotation speed reference and measurement, respectively

References

  1. Erlich, I.; Shewarega, F.; Feltes, C.; Koch, F.W.; Fortmann, J. Offshore Wind Power Generation Technologies. Proc. IEEE 2013, 101, 891–905. [Google Scholar] [CrossRef]
  2. Friedrich, K. Modern HVDC PLUS application of VSC in Modular Multilevel Converter topology. In Proceedings of the 2010 IEEE International Symposium on Industrial Electronics, Bari, Italy, 4–7 July 2010; pp. 3807–3810. [Google Scholar]
  3. Apostolaki-Iosifidou, E.; Mccormack, R.; Kempton, W.; Mccoy, P.; Ozkan, D. Transmission Design and Analysis for Large-Scale Offshore Wind Energy Development. IEEE Power Energy Technol. Syst. J. 2019, 6, 22–31. [Google Scholar] [CrossRef]
  4. Andersson, D.; Petersson, A.; Agneholm, E.; Karlsson, D. “Kriegers Flak 640 MW Off-Shore Wind Power Grid Connection—A Real Project Case Study. IEEE Trans. Energy Convers. 2007, 22, 79–85. [Google Scholar] [CrossRef]
  5. Qin, N.; You, S.; Xu, Z.; Akhmatov, V. Offshore wind farm connection with low frequency AC transmission technology. In Proceedings of the 2009 IEEE Power & Energy Society General Meeting, Calgary, AB, Canada, 26–30 July 2009; pp. 1–8. [Google Scholar]
  6. Xiang, X.; Merlin, M.M.C.; Green, T.C. Cost analysis and comparison of HVAC, LFAC and HVDC for offshore wind power connection. In Proceedings of the 12th IET International Conference on AC and DC Power Transmission (ACDC 2016), Beijing, China, 28–29 May 2016; pp. 1–6. [Google Scholar]
  7. Berkani, A.; Pourkeivannour, S.; Negadi, K.; Boumediene, B.; Allaoui, T.; Ertan, H.B. Integration of Offshore Wind Farm Plants to the Power Grid using an HVDC line Transmission. In Proceedings of the 2019 International Aegean Conference on Electrical Machines and Power Electronics (ACEMP) & 2019 International Conference on Optimization of Electrical and Electronic Equipment (OPTIM), Istanbul, Turkey, 2–4 September 2019; pp. 486–492. [Google Scholar]
  8. Li, W.; Zhu, M.; Chao, P.; Liang, X.; Xu, D. Enhanced FRT and Postfault Recovery Control for MMC-HVDC Connected Offshore Wind Farms. IEEE Trans. Power Syst. 2019, 35, 1606–1617. [Google Scholar] [CrossRef]
  9. Blasco-Gimenez, R.; Añó-Villalba, S.; Rodríguez-D’Derlée, J.; Morant, F.; Bernal-Perez, S. Distributed Voltage and Frequency Control of Offshore Wind Farms Connected with a Diode-Based HVdc Link. IEEE Trans. Power Electron. 2010, 25, 3095–3105. [Google Scholar] [CrossRef]
  10. Blasco-Gimenez, R.; Anó-Villalba, S.; Rodriguez-D’Derlée, J.; Bernal-Perez, S.; Morant, F. Diode-Based HVdc Link for the Connection of Large Offshore Wind Farms. IEEE Trans. Energy Convers. 2011, 26, 615–626. [Google Scholar] [CrossRef]
  11. Bernal-Perez, S.; Ano-Villalba, S.; Blasco-Gimenez, R.; Rodriguez-D’Derlee, J. Efficiency and Fault Ride-Through Performance of a Diode-Rectifier- and VSC-Inverter-Based HVDC Link for Offshore Wind Farms. IEEE Trans. Ind. Electron. 2013, 60, 2401–2409. [Google Scholar] [CrossRef]
  12. Hoffmann, M.; Rathke, C.; Menze, A.; Hemdan, N.G.A.; Kurrat, M. Parallel operation of HVDC DRU and VSC converters for offshore wind farm connection: Technical and economic feasibility. In Proceedings of the 15th IET International Conference on AC and DC Power Transmission (ACDC 2019), Coventry, UK, 5–7 February 2019; pp. 1–6. [Google Scholar]
  13. Blasco-Gimenez, R.; Aparicio, N.; Ano-Villalba, S.; Bernal-Perez, S. LCC-HVDC Connection of Offshore Wind Farms With Reduced Filter Banks. IEEE Trans. Ind. Electron. 2012, 60, 2372–2380. [Google Scholar] [CrossRef] [Green Version]
  14. Yu, L.; Li, R.; Xu, L. Distributed PLL-Based Control of Offshore Wind Turbines Connected With Diode-Rectifier-Based HVDC Systems. IEEE Trans. Power Deliv. 2018, 33, 1328–1336. [Google Scholar] [CrossRef] [Green Version]
  15. Cardiel-Álvarez, M.Á.; Arnaltes, S.; Rodriguez-Amenedo, J.L.; Nami, A. Decentralized Control of Offshore Wind Farms Connected to Diode-Based HVdc Links. IEEE Trans. Energy Convers. 2018, 33, 1233–1241. [Google Scholar] [CrossRef]
  16. Ramachandran, R.; Poullain, S.; Benchaib, A.; Bacha, S.; Francois, B. On the Black Start of Offshore Wind Power Plants with Diode Rectifier based HVDC Transmission. In Proceedings of the 2019 21st European Conference on Power Electronics and Applications (EPE ‘19 ECCE Europe), Genova, Italy, 2–5 September 2019; pp. 1–10. [Google Scholar]
  17. Cai, L.; Karaagac, U.; Mahseredjian, J. Simulation of Startup Sequence of an Offshore Wind Farm With MMC-HVDC Grid Connection. IEEE Trans. Power Deliv. 2017, 32, 638–646. [Google Scholar] [CrossRef]
  18. Chakraborty, S.; Simoes, M.G. Advanced Active Filtering in a Single Phase High Frequency AC Microgrid. In Proceedings of the 2005 IEEE 36th Power Electronics Specialists Conference, Dresden, Germany, 16 June 2005; pp. 191–197. [Google Scholar]
  19. Chakraborty, S.; Simoes, M.G. Experimental Evaluation of Active Filtering in a Single-Phase High-Frequency AC Microgrid. IEEE Trans. Energy Convers. 2009, 24, 673–682. [Google Scholar] [CrossRef]
  20. Domínguez-García, J.L.; Rogers, D.J.; Ugalde-Loo, C.E.; Liang, J.; Gomis-Bellmunt, O. Effect of non-standard operating frequencies on the economic cost of offshore AC networks. Renew. Energy 2012, 44, 267–280. [Google Scholar] [CrossRef]
  21. Gierschner, S.; Eckel, H.; Bakran, M. A competitive medium frequency AC distribution grid for offshore wind farms using HVDC. In Proceedings of the 2013 15th European Conference on Power Electronics and Applications (EPE), Lille, France, 2–6 September 2013; pp. 1–10. [Google Scholar]
  22. Wu, B.; Lang, Y.; Zargari, N.; Kouro, S. Power Conversion and Control of Wind Energy Systems; Wiley-IEEE Press: Piscateway, NJ, USA, 2011. [Google Scholar]
  23. Xia, Y.; Ahmed, K.H.; Williams, B.W. A New Maximum Power Point Tracking Technique for Permanent Magnet Synchronous Generator Based Wind Energy Conversion System. IEEE Trans. Power Electron. 2011, 26, 3609–3620. [Google Scholar] [CrossRef] [Green Version]
  24. Tang, Y.; Zhang, Z.; Xu, Z. DRU Based Low Frequency AC Transmission Scheme for Offshore Wind Farm Integration. IEEE Trans. Sustain. Energy 2021, 1. [Google Scholar] [CrossRef]
  25. Xu, Z.; Xiao, H.; Zhang, Z. Selection methods of main circuit parameters for modular multilevel converters. IET Renew. Power Gener. 2016, 10, 788–797. [Google Scholar] [CrossRef]
  26. Chakraborty, S.; Weiss, M.D.; Simoes, M.G. Distributed Intelligent Energy Management System for a Single-Phase High-Frequency AC Microgrid. IEEE Trans. Ind. Electron. 2007, 54, 97–109. [Google Scholar] [CrossRef] [Green Version]
  27. Zhang, Y.; Wang, L.; Meng, L. An Analytical AC Resistance Calculation Method for Multiple-Conductor Feeder Cables in Aircraft Electric Power Systems. IEEE Trans. Ind. Electron. 2019, 67, 3340–3349. [Google Scholar] [CrossRef]
  28. Hasan, S.; Taib, S.; Hardi, S.; AR, A.R.; Shukri, A. Core loss characteristics analysis of power transformer under different frequencies excitation. In Proceedings of the 2013 IEEE 7th International Power Engineering and Optimization Conference (PEOCO), Langkawi, Malaysia, 3–4 June 2013; pp. 619–623. [Google Scholar]
  29. Lüth, T.; Merlin, M.M.C.; Green, T.C.; Hassan, F.; Barker, C.D. High-Frequency Operation of a DC/AC/DC System for HVDC Applications. IEEE Trans. Power Electron. 2014, 29, 4107–4115. [Google Scholar] [CrossRef] [Green Version]
  30. Zhang, Z.; Xu, Z.; Xue, Y. Valve losses evaluation based on piecewise analytical method for MMC–HVDC links. IEEE Trans. Power Deliv. 2014, 29, 1354–1362. [Google Scholar] [CrossRef]
  31. Zhang, Z.; Tang, Y.; Xu, Z. Medium frequency diode rectifier unit based HVDC transmission for offshore wind farm integration. IET Renew. Power Gener. 2021, 15, 717–730. [Google Scholar] [CrossRef]
Figure 1. The proposed medium-frequency wind farm and MMC-HVDC integration system.
Energies 14 02058 g001
Figure 2. Control system diagram for the HVDC transmission system converters.
Energies 14 02058 g002
Figure 3. Control system diagram for the back-to-back converter for the PMSG-WT.
Energies 14 02058 g003
Figure 4. Diagram of relationship between operating frequency f0, equivalent capacity discharging time constant H and SM capacitor C0.
Energies 14 02058 g004
Figure 5. Diagram of the relationship between operating frequency f0 and arm inductor L0.
Energies 14 02058 g005
Figure 6. Configurations for the PSCAD/EMTDC simulation models.
Energies 14 02058 g006
Figure 7. Steady-state operating characteristics of the rectifier-side converter station: (a) 50 Hz; (b) 150 Hz.
Energies 14 02058 g007
Figure 8. Steady-state operating characteristics of the wind turbine units: (a) 50 Hz; (b) 150 Hz.
Energies 14 02058 g008
Figure 9. Dynamic responses of the rectifier-side converter for wind power fluctuations: (a) 50 Hz; (b) 150 Hz.
Energies 14 02058 g009
Figure 10. Dynamic responses of the wind turbine units for wind power fluctuations: (a) 50 Hz; (b) 150 Hz.
Energies 14 02058 g010
Figure 11. Transient characteristics of the rectifier-side converter station for serious AC faults in the offshore wind farm: (a) 50 Hz; (b) 150 Hz.
Energies 14 02058 g011
Figure 12. Transient characteristics of the rectifier-side converter station for serious AC faults in the offshore wind farm: (a) 50 Hz; (b) 150 Hz.
Energies 14 02058 g012
Figure 13. Transient characteristics of the rectifier-side converter station for serious AC faults in the onshore grid: (a) 50 Hz; (b) 100 Hz.
Energies 14 02058 g013
Figure 14. Transient characteristics of the wind turbine unit for serious AC faults in the onshore grid: (a) 50 Hz; (b) 100 Hz.
Energies 14 02058 g014
Table 1. Simulation model parameters.
SubsystemElementParameterValue
50 Hz150 Hz
Land gridVoltage sourceLine voltage (kV)220220
ImpedanceInductance (H)0.0190.19
Resistance (Ω)0.750.75
HVDC systemConverter transformerRated capacity (MVA)12001200
Rated line voltage (kV)230/336230/336
Leakage reactance (p.u.)0.160.16
MMCSMs per arm291291
Capacitor (uF)94233141
Arm inductors (H)0.090.03
DC cableRated voltage (kV)±320±320
Rated current (kA)1.561.56
Length (kM)200200
Offshore AC systemAC feederGround capacitance (uF)0.320.32
Series inductance (H/m)3.23 × 10−73.23 × 10−7
Series resistance (Ω/m)4.76 × 10−54.76 × 10−5
Length (kM)2 × 3 + 2 × 42 × 3 + 2 × 4
Step-up transformerRated capacity (MVA)300300
Rated line voltage (kV)230/35230/35
Leakage reactance (p.u.)0.160.16
Equivalent
wind turbine
Wind turbine transformer’s rated capacity (MVA)300300
Wind turbine transformer’s rated line voltage (kV)35/0.6935/0.69
Wind turbine transformer leakage reactance (p.u.)0.160.16
Rated wind power (MW)250250
Publisher’s Note: MDPI stays neutral with regard to jurisdictional claims in published maps and institutional affiliations.

