Article

Life Cycle Assessment of Stationary Storage Systems within the Italian Electric Network

by
Maria Leonor Carvalho
*,
Andrea Temporelli
* and
Pierpaolo Girardi
*
Ricerca Sistema Energetico–RSE SpA, Via R. Rubattino 54, 20134 Milan, Italy
*
Authors to whom correspondence should be addressed.
Energies 2021, 14(8), 2047; https://doi.org/10.3390/en14082047
Submission received: 19 March 2021 / Revised: 3 April 2021 / Accepted: 5 April 2021 / Published: 7 April 2021
(This article belongs to the Special Issue Developing the World in 2021 with Clean and Safe Energy)

Abstract

:
The introduction of stationary storage systems into the Italian electric network is necessary to accommodate the increasing share of energy from non-programmable renewable sources and to reach progressive decarbonization targets. In this framework, a life cycle assessment is a suitable tool to assess environmental impacts during the entire life cycle of stationary storage systems, i.e., their sustainability. A Li-ion battery (lithium–iron–phosphate (LFP), nickel–manganese–cobalt (NMC) 532, and NMC 622) entire life cycle assessment (LCA) based on primary and literature data was performed. The LCA results showed that energy consumption (predominantly during cell production), battery design (particularly binder choice), inventory accuracy, and data quality are key aspects that can strongly affect results. Regarding the battery construction phase, LFP batteries showed better performance than the NMC ones, but when the end-of-life (EoL) stage was included, NMC cell performance became very close to those of LFPs. Sensitivity and uncertainty analyses, done using the Monte Carlo methodology, confirmed that the results (except for the freshwater eutrophication indicator) were characterized by a low dispersion and that the energy mix choice, during the different battery life phases, was able to greatly influence the overall impact. The use of primary and updated data related to battery cell production, like those used in the present paper, was necessary to obtain reliable results, and the application to a European production line is an item of novelty of this paper.

Graphical Abstract

1. Introduction

The Italian Integrated National Energy and Climate Plan (INECP), like many other national energy and climate plans, has established the national targets for energy efficiency, renewable sources, and the reduction of CO2 emissions to be reached by 2030 [1]. The ambitious environmental sustainability goals are achievable only thanks to the great penetration of renewable sources into national electricity mix production. Non-programmable renewable sources (wind and solar) will increase in importance in the energy mix, both in relative and absolute terms. Because of this growth, transmission and distribution networks will need to convey electricity with a greater flexibility, which can be achieved through investments into smart grids and storage capacity development. Storage system development is one of the INECP targets, not only to improve transmission and distribution networks safety but also to enhance renewable source integration into the electric system, reducing overgeneration as much as possible.
Battery storage systems are emerging as potential solutions to increase system flexibility due to their capability to quickly absorb, hold, and then re-inject electricity into the grid, which makes them key elements in a successful energy transition. For this reason, it is important to evaluate the environmental sustainability of such systems. The life cycle approach represents the most correct way to assess environmental impacts by using the life cycle assessment (LCA) method [2]. Given the relevance of energy consumption in Li-ion battery LCA [3], the year and the place of production of both batteries and cells have huge importance in assessing the environmental performance of batteries.
Even though numerous LCA studies on stationary batteries are available in the literature, only a few have focused on European systems [4,5,6], and no one, to our knowledge, has dealt with the Italian battery production chain. Figure 1 shows the geographical and temporal distribution of the thirteen LCA studies considered in the LCA stationary batteries review [7], and the target of the present study as “Italy, 2021”. In the graph, the geographical suitability is defined according to the data source (e.g., used electricity mix), while dotted lines indicate different locations (IT: Italia; EU: Europe; USA; United States of America; and CN: China). Two studies dated back to before 2010 [8,9] and most of the studies referred to Far East scenarios [10,11,12] or to production in the United States [13,14,15,16]. Many studies did not use very up-to-date information and employed secondary data. It is difficult to use primary data from published studies, since that requires re-using information that is not entirely available as it is protected by confidentiality agreements.
Global Warming was found to be the most investigated impact category, and LCA results showed great variability across the reviewed studies due to different assumptions and databases used, as well as battery chemistry considered. Depending on the different technologies, the greenhouse gas emissions of a Li-ion kWh stationary battery’s capacity could range from 16 to 157 kg CO2 eq/kWh; the authors of [11] reported 16 kg CO2 eq/kWh for lithium–iron–phosphate (LFP) and 28 kg CO2 eq/kWh for lithium–manganese (LMB) batteries, the authors of [12] reported 64 kg CO2 eq/kWh for lithium–manganese oxide (LMO) batteries, the authors of [14] reported 129 kg CO2 eq/kWh for Li-ion batteries, and the authors of both [5] and [13] reported 157 kg CO2 eq/kWh for Li-ion batteries. The same variability was observed for traction batteries: CO2eq emissions per kWh of battery capacity were found to range from 50 to 313 kg CO2 eq/kWh [17].
Batteries for stationary storage can be used for a range of applications. Some studies investigated their performance when used to store electricity overproduction from non-programmable renewable resources like wind [16] and solar photovoltaic [6,18]. Other studies considered different applications. The authors of [4] considered the German distribution of the electricity production mix from solar photovoltaic plants and the electricity production mix from 50% solar and 50% wind. Finally, a recent study [19] assessed the potential of battery storage to replace combined-cycle gas turbine (CCGT) plants in responding to variable peak demand for current and future energy scenarios in the UK.
The most recent critical literature review [20] surveyed the existing LCA studies on grid-scale, stationary Li-ion energy storage systems and highlighted research gaps concerning environmental impacts. The authors provided several recommendations for future LCA studies such as incorporating use phase impacts into full life cycle LCA, ensuring complete material inventories, using consistent primary data on the energy intensity of battery manufacturing, and including end-of-life impacts in environmental impact assessments.
In this context, the present work aimed to overcome these gaps by using a life cycle perspective to evaluate the sustainability of stationary storage systems within a scenario of production and use in the Italian context. Starting from these considerations, in this work, we performed life cycle assessment analysis for three different batteries produced by an Italian manufacturer (LFP, nickel–manganese–cobalt (NMC) 532, and NMC 622), and the results were compared to two of the most complete and transparent LCA studies available in the literature: NMC 111 from Ellingsen et al. [3] and NMC 221 and LFP from Majeau-Bettez [21].

2. Materials and Methods

2.1. Goal and Scope

The aim of this study was to analyze the potential environmental impacts of stationary storage systems equipped with three different Li-ion batteries: LFP, NMC 532, and NMC 622. Results were compared with two battery LCA studies from the literature: NMC 111 from Ellingsen et al. [3], NMC 221 and LFP from Majeau-Bettez [21]. On the basis of the hypotheses illustrated in both studies, it was possible to re-form and update the battery LCAs of both authors from the reference database of the study, Ecoinvent v2.2 to Ecoinvent v3.3 in the SimaPro software.

2.2. Functional Unit

The correct definition of the functional unit is a very important aspect in an LCA study. The International Organization for Standardization (ISO) 14040 [2] and ISO14044 [22] standards define the LCA functional unit as the quantified performance of a product system to be used as a reference unit. The functional unit must be consistent with the goal and the scope of the study and must provide a reference for normalizing data inputs and outputs. Considering that the service offered by a storage system is that of accumulating and releasing a given quantity of energy, the functional unit chosen for this LCA study was equal to 1 kWh of energy released, a value chosen by considering the entire useful lives of the batteries. In order to be able to compare our results with previous studies, we also present the cradle-to-gate portion of our LCA in terms of battery mass (1 kg) and nominal energy capacity (1 kWh).

2.3. System Definition

Figure 2 presents our system boundaries definition, which was built around the delivery of 1 kWh. It covers the whole production chain, the use phase, and the end-of-life phase.

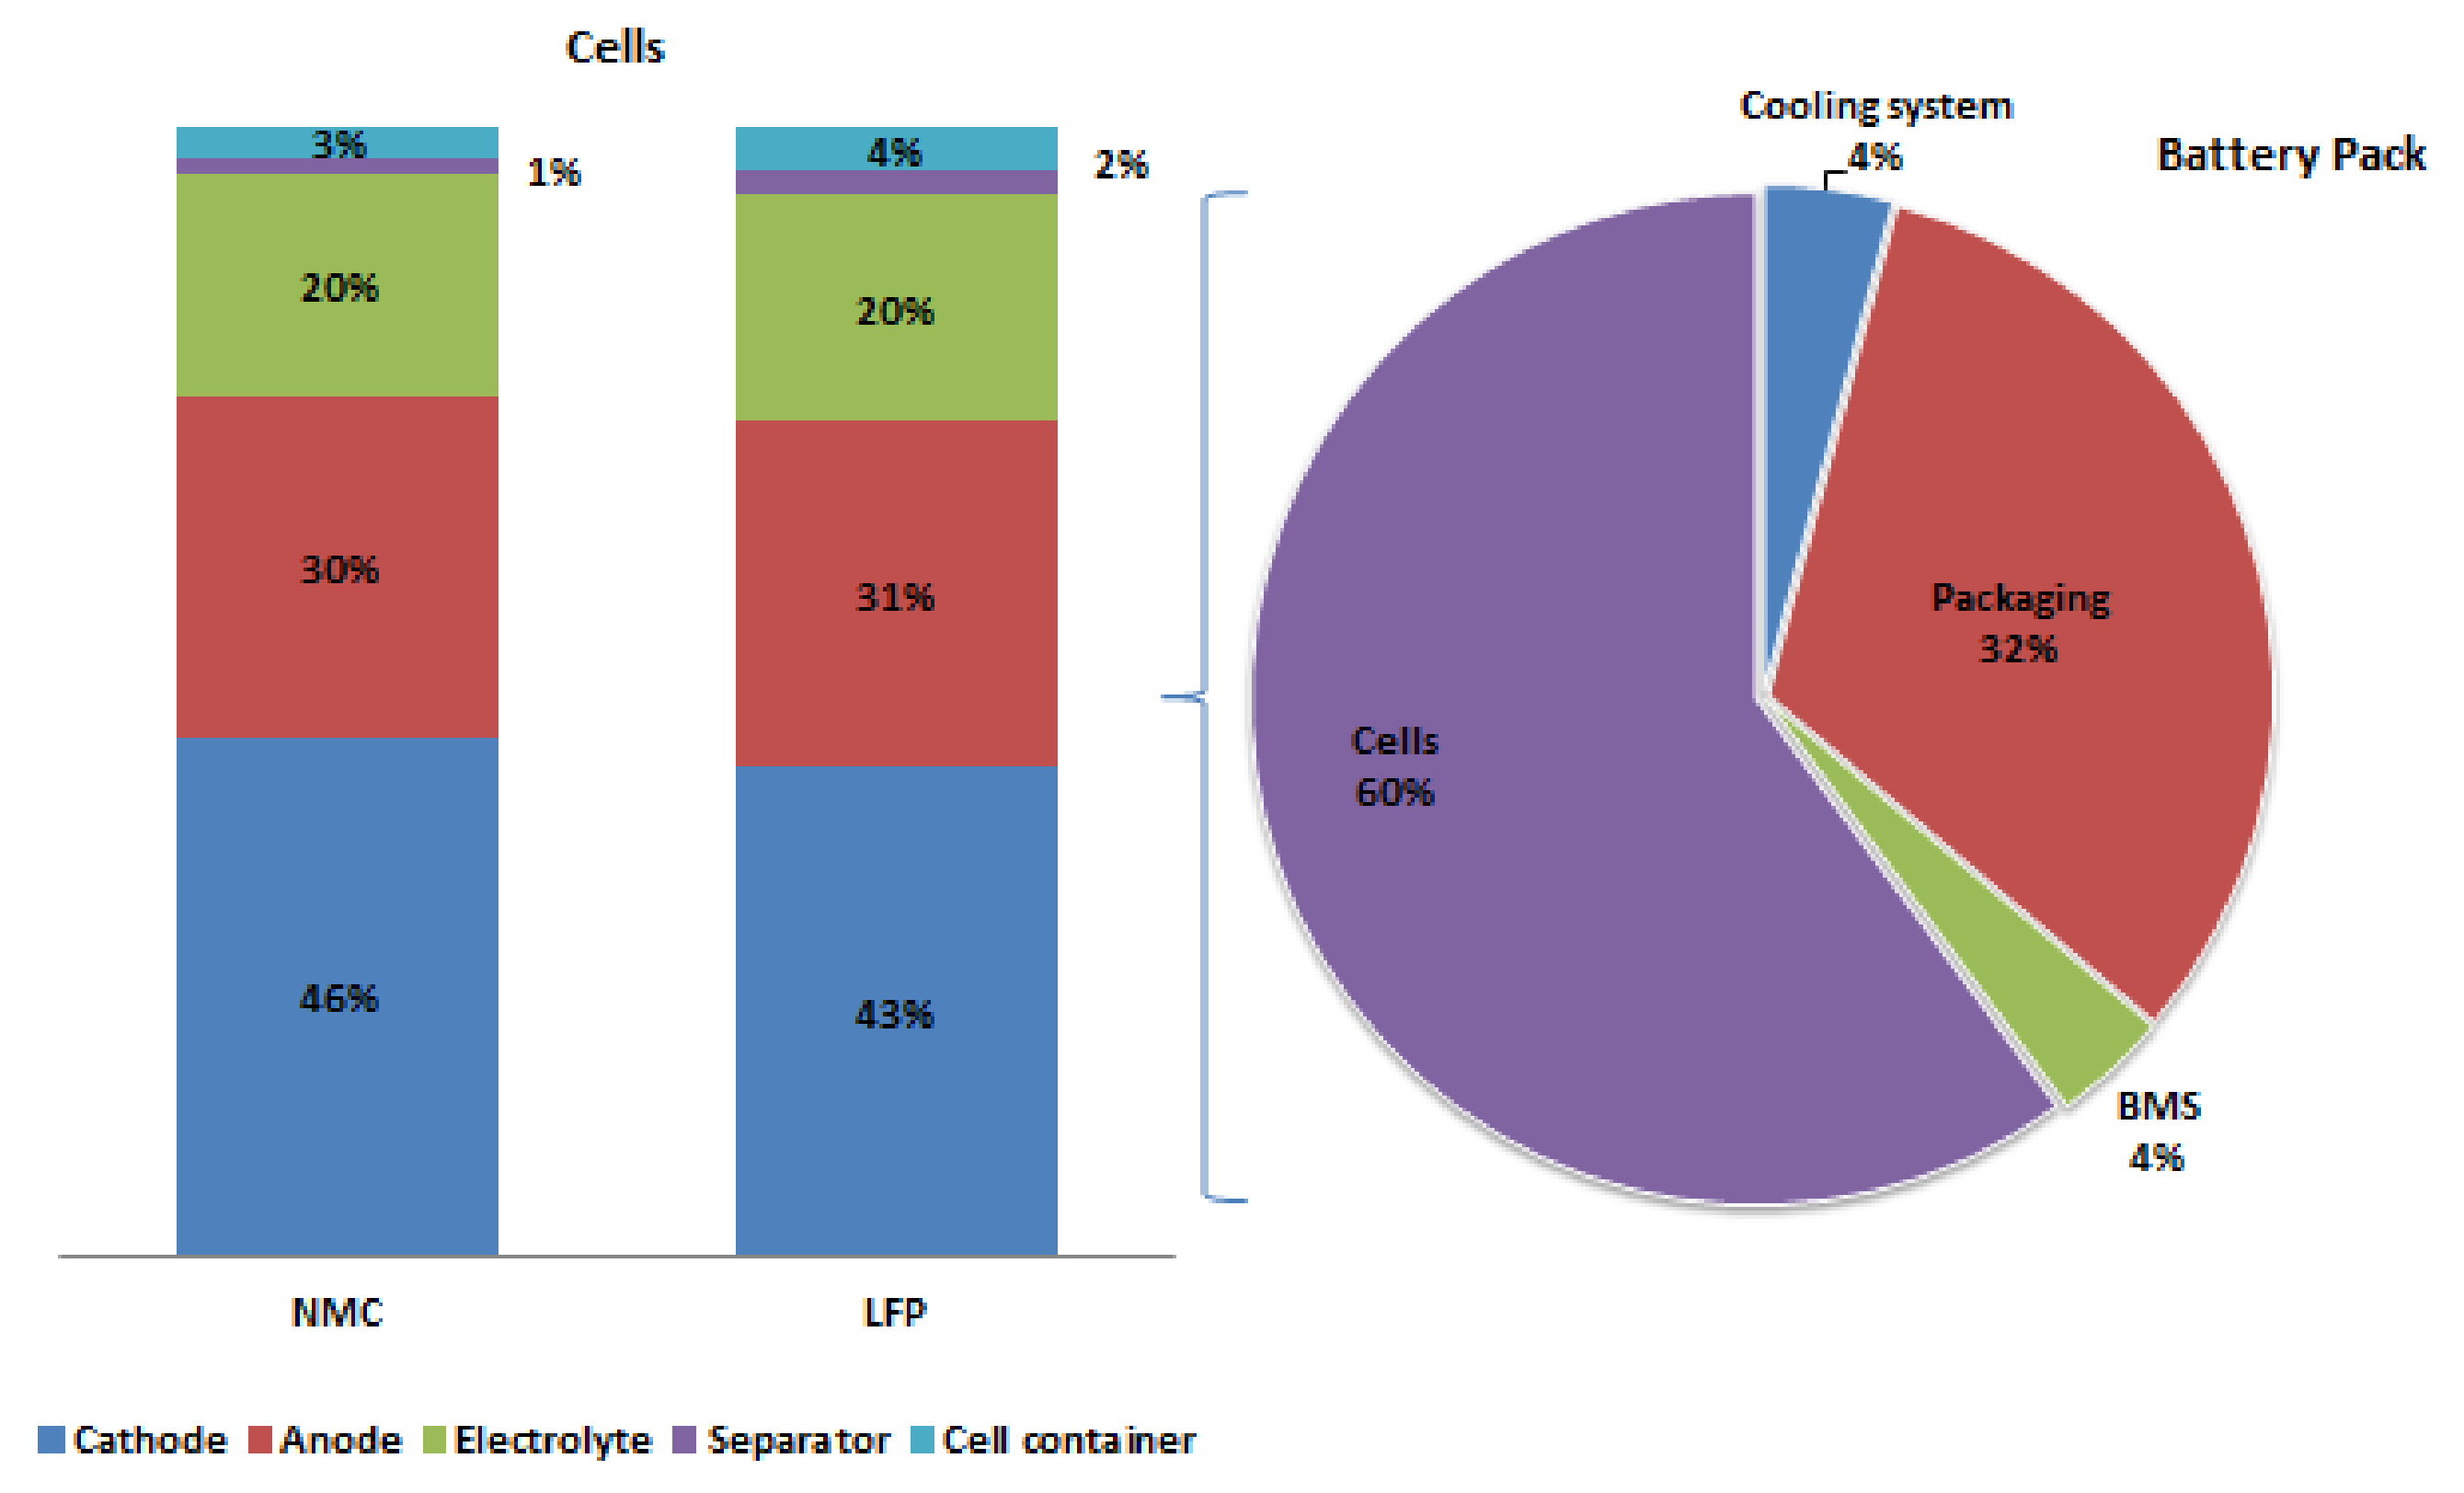
2.4. Battery Components and Technology

The battery pack composition considered in this study was the same as reported by Ellingsen et al. [3]. Battery components can be divided into four main macro groups: cooling system, cells, packaging, and BMS (battery management system). Three cell technologies were considered: one LFP kind and two NMC kinds. Battery mass composition, by components, is reported in Figure 3.
The BMS is responsible for the efficiency, safety, and longevity of lithium-ion batteries. It is an electronic system that manages rechargeable batteries by monitoring different parameters and battery states, e.g., cell voltage, current, temperature, and state of charge (SOC) [23]. One important factor is the efficient management of a battery’s SOC, i.e., the level of charge of a battery relative to its capacity. A fully charged battery has an SOC of 100%, while a fully discharged battery has an SOC of 0%. A good estimation of the SOC leads to longer battery life and helps to prevent battery failure. Nevertheless, SOC estimation is a difficult process because it is affected by various factors such as battery age and ambient temperature [24].
Battery simulation models are important in order to conduct a complete system analysis, understand a system’s behavior, and help design control and strategies. However, it is not easy to find a suitable model that behaves properly in different operating conditions. Different battery models have been developed and can be generally divided in three types: experimental, electrochemical, and electric circuit-based [25]. Experimental and electrochemical models are not very appropriate in representing cell dynamics to estimate the SOC of battery packs, but they can be useful to represent battery electrical characteristics [26]. A literature review regarding types of battery models was presented by [27]. The authors concluded that efficient battery models that can accurately monitor battery performance and other critical parameters (e.g., SOC, state of health (SOH), and time to run) are preferred. Nonetheless, the selection and application of the above-mentioned models goes far beyond the scope of a typical LCA study and the present analysis.

Cells Composition and Main Features

Batteries are made of cells that, in turn, consist of five main elements: anode, cathode, electrolyte, separator, and cell container. Thanks to the collaboration of an Italian producer of storage systems, it was possible to obtain primary data regarding the cell production phase. Three types of Li-ion cells were analyzed: LFP (LiFePO4), NMC 532, and NMC 622. Table 1 summarizes the characteristics of the considered Li-ion batteries.

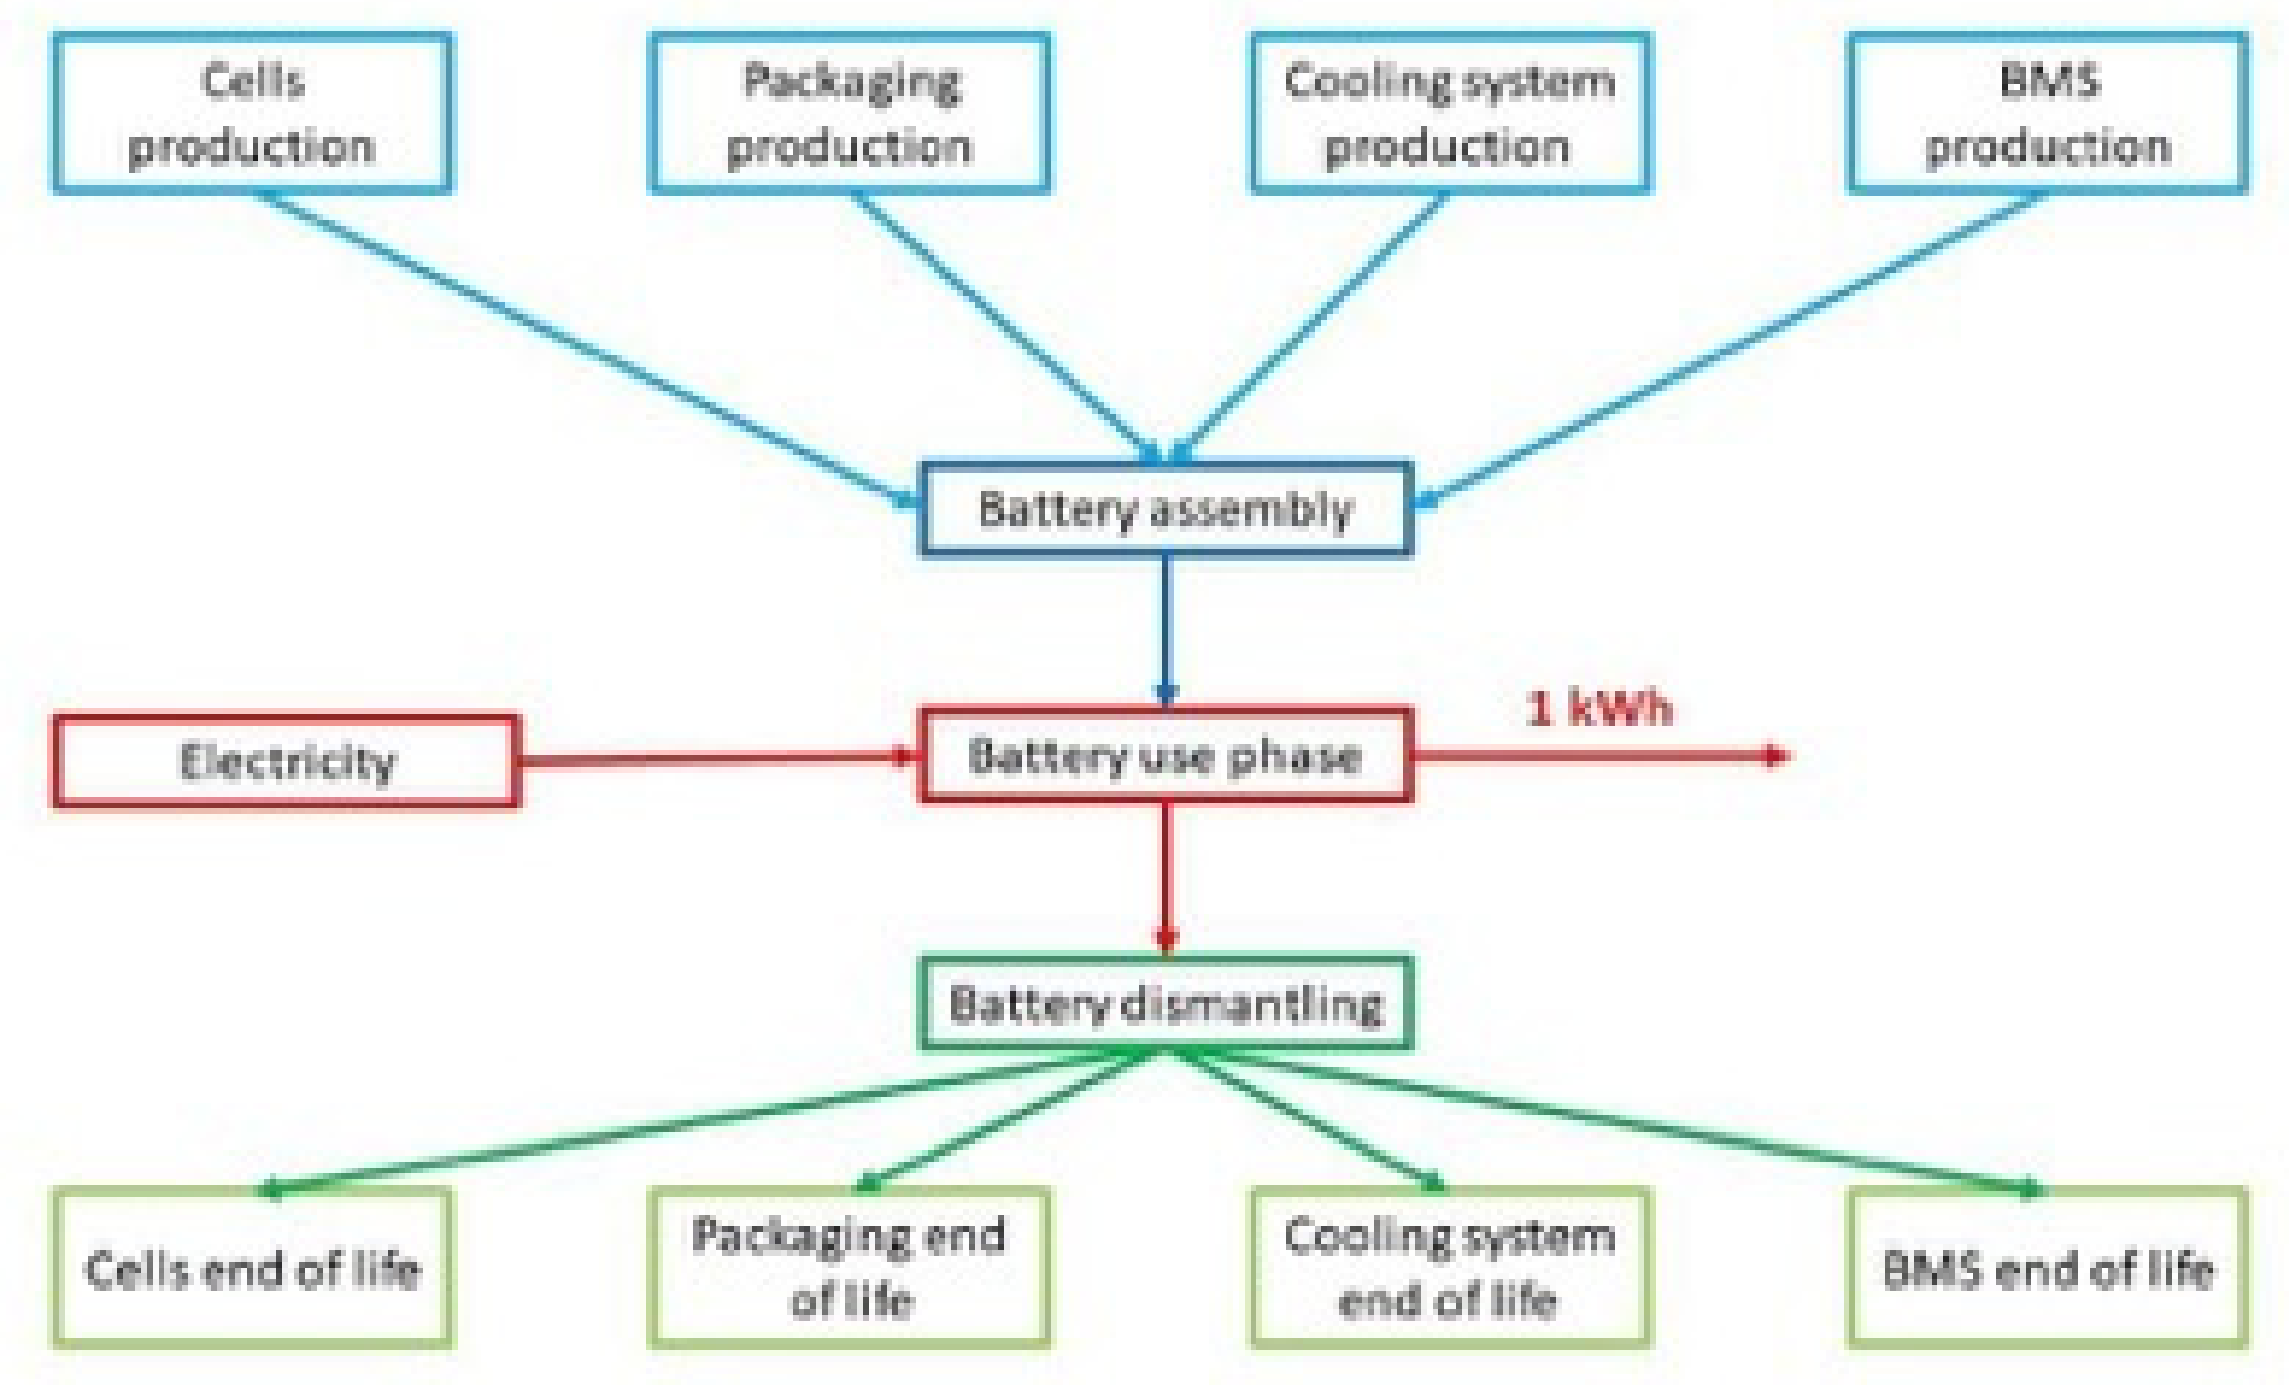
2.5. System Boundaries

The system boundaries determine which stages of the process must be included in the LCA, and this choice must be consistent with the objective of the study.
As suggested by the authors of [7], all battery life impacts were considered according to a cradle-to-grave perspective: the extraction and processing of raw materials, battery production, battery transport, use phase, end of life phase, and possible material recovery.

2.6. Allocation System

The allocation process splits the input and output flows of a multiple product process between the analyzed system product and one or more other system products. Both inputs and outputs must be allocated to different products following clear rules that are defined at the beginning of the analysis.
Allocation systems have been absent or not specified in almost all the works in the literature [7]. Additionally, in this study, it was not necessary to identify allocation systems for the foreground data because the analyzed system was the production of batteries, and other products or by-products were not considered. For background data (Ecoinvent database), the “cut-off” system was considered [28].

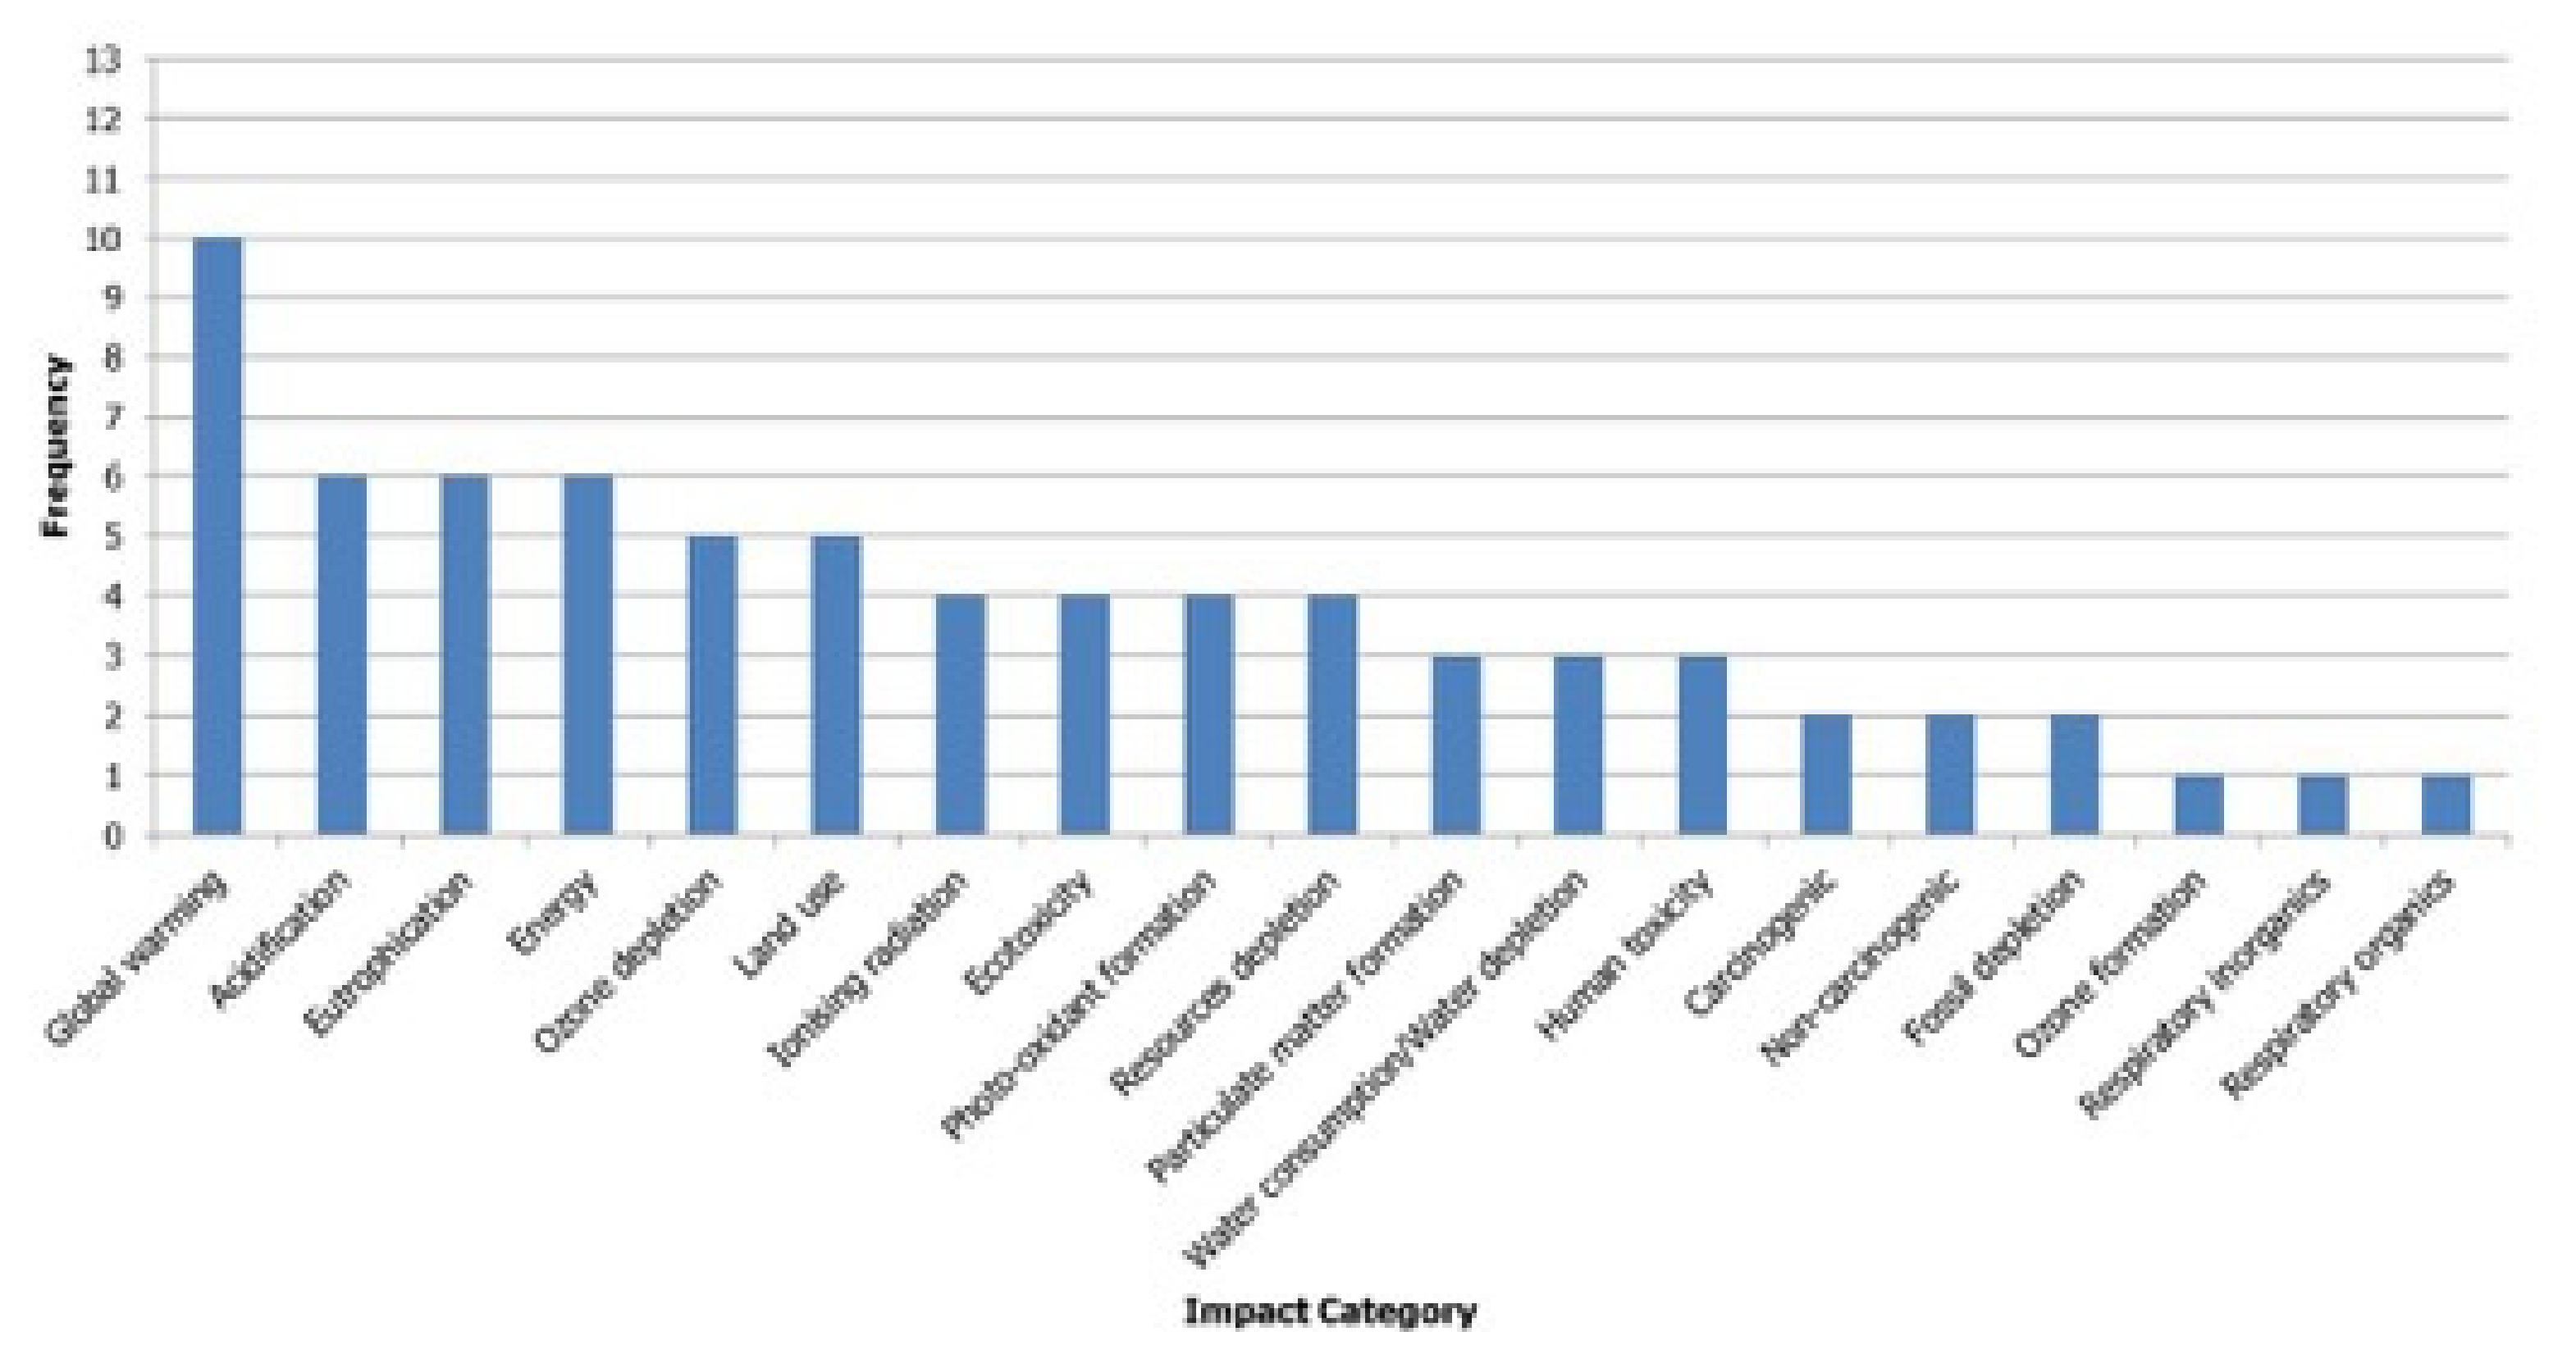
2.7. Impact Categories and Methods

As described in the European Commission International Reference Life Cycle Data System (ILCD) Handbook recommendations [29], impact category selection must be consistent with the goal of the study. Furthermore, impact category choice must be complete and should cover all the main environmental issues related to the system. Ten out of thirteen studies analyzed in a previous literature review [7] considered the climate change impact category, six considered the energy consumption (using indicator like cumulative energy demand), five considered ozone depletion and land use, and only four considered photo-oxidant formation, resource depletion, ionizing radiation, and ecotoxicity (Figure 4). The remaining categories were used with a lower frequency (Figure 4). Bearing the results of this analysis and the robustness of the different indicators in mind, the following midpoint indicator characterization factors were taken from the ILCD 2011 Midpoint impact assessment method: climate change; acidification; eutrophication (terrestrial, freshwater, and marine); and mineral, fossil, and renewable resource depletion. The Ecoinvent cumulative energy demand (CED) method was considered for the assessment of renewable and non-renewable primary energy consumption.
The life cycle assessment was performed using the SimaPro 8.3 software.

2.8. Life Cycle Inventory (LCI)

Our inventory was structured into three main phases: battery construction, use phase, and end of life.

2.8.1. Battery Construction

Cell production was modeled according to information and primary data provided by an Italian manufacturer. Regarding other battery pack components and active materials, secondary data were derived from the literature [3,21], and background data were taken from Ecoinvent v 3.3 [30]. The full inventory of components and materials can be found in the Supplementary Materials (Supplementary Materials; Section 2.1).

2.8.2. Use Phase

The use phase consists of battery charging and discharging. Due to internal resistance phenomena, during this process, a battery consumes 10% of its input energy (as stated by the cell manufacturer), releasing heat. Wasted electricity is accounted for as a requirement, and heat is accounted for as the only direct emission.
Two different scenarios were considered to model the batteries’ use phase: Scenario A (generic use) and Scenario B (Italian INECP scenario). In the latter, batteries are used to control overproduction from non-programmable renewable power plants below 1 TWh in 2030 and the energy used for charging batteries comes from wind and solar power plants. The battery-released energy avoids energy production from natural gas combined-cycle power plant (Supplementary Materials; Section 2.2).

2.8.3. End-of-Life

When batteries reach their end-of-life (EoL), two types of treatment for final disposal are possible: pyrometallurgical and hydrometallurgical treatment. The EoL modelling was carried out starting from the information reported in [31] and the Ecoinvent dataset related to the pyrometallurgical treatment (Ecoinvent dataset name: The pyrometallurgical treatment of a used Ni-metal hydride battery (GLO)) and hydrometallurgical treatment (Ecoinvent dataset name: The hydrometallurgical treatment of a used Li-metal hydride battery (GLO)) of exhausted batteries. Original datasets and literature information were modified according to the chemical composition of the cells analyzed in the present study (for details, see Supplementary Materials; Section 2.3).
It was assumed that batteries were subjected to 50% of the pyrometallurgical treatment and 50% of the hydrometallurgical one.
When applied to an LFP battery, the pyrometallurgical process allows for the recovery of aluminum and copper from the cells; when it is applied to NMC 532 and NMC 622 batteries, it allows for the recovery of cobalt, nickel, and manganese salts.
The hydrometallurgical process allows for the recovery of aluminum, copper, and lithium salts from all considered batteries, as well as the recycling of cobalt, nickel, and manganese salts for the NMC batteries only.
In this study, as suggested in [31], the recovery rate of metals and salts was equal to 93.6%.

3. Results and Discussion: Life Cycle Impact Assessment (LCIA)

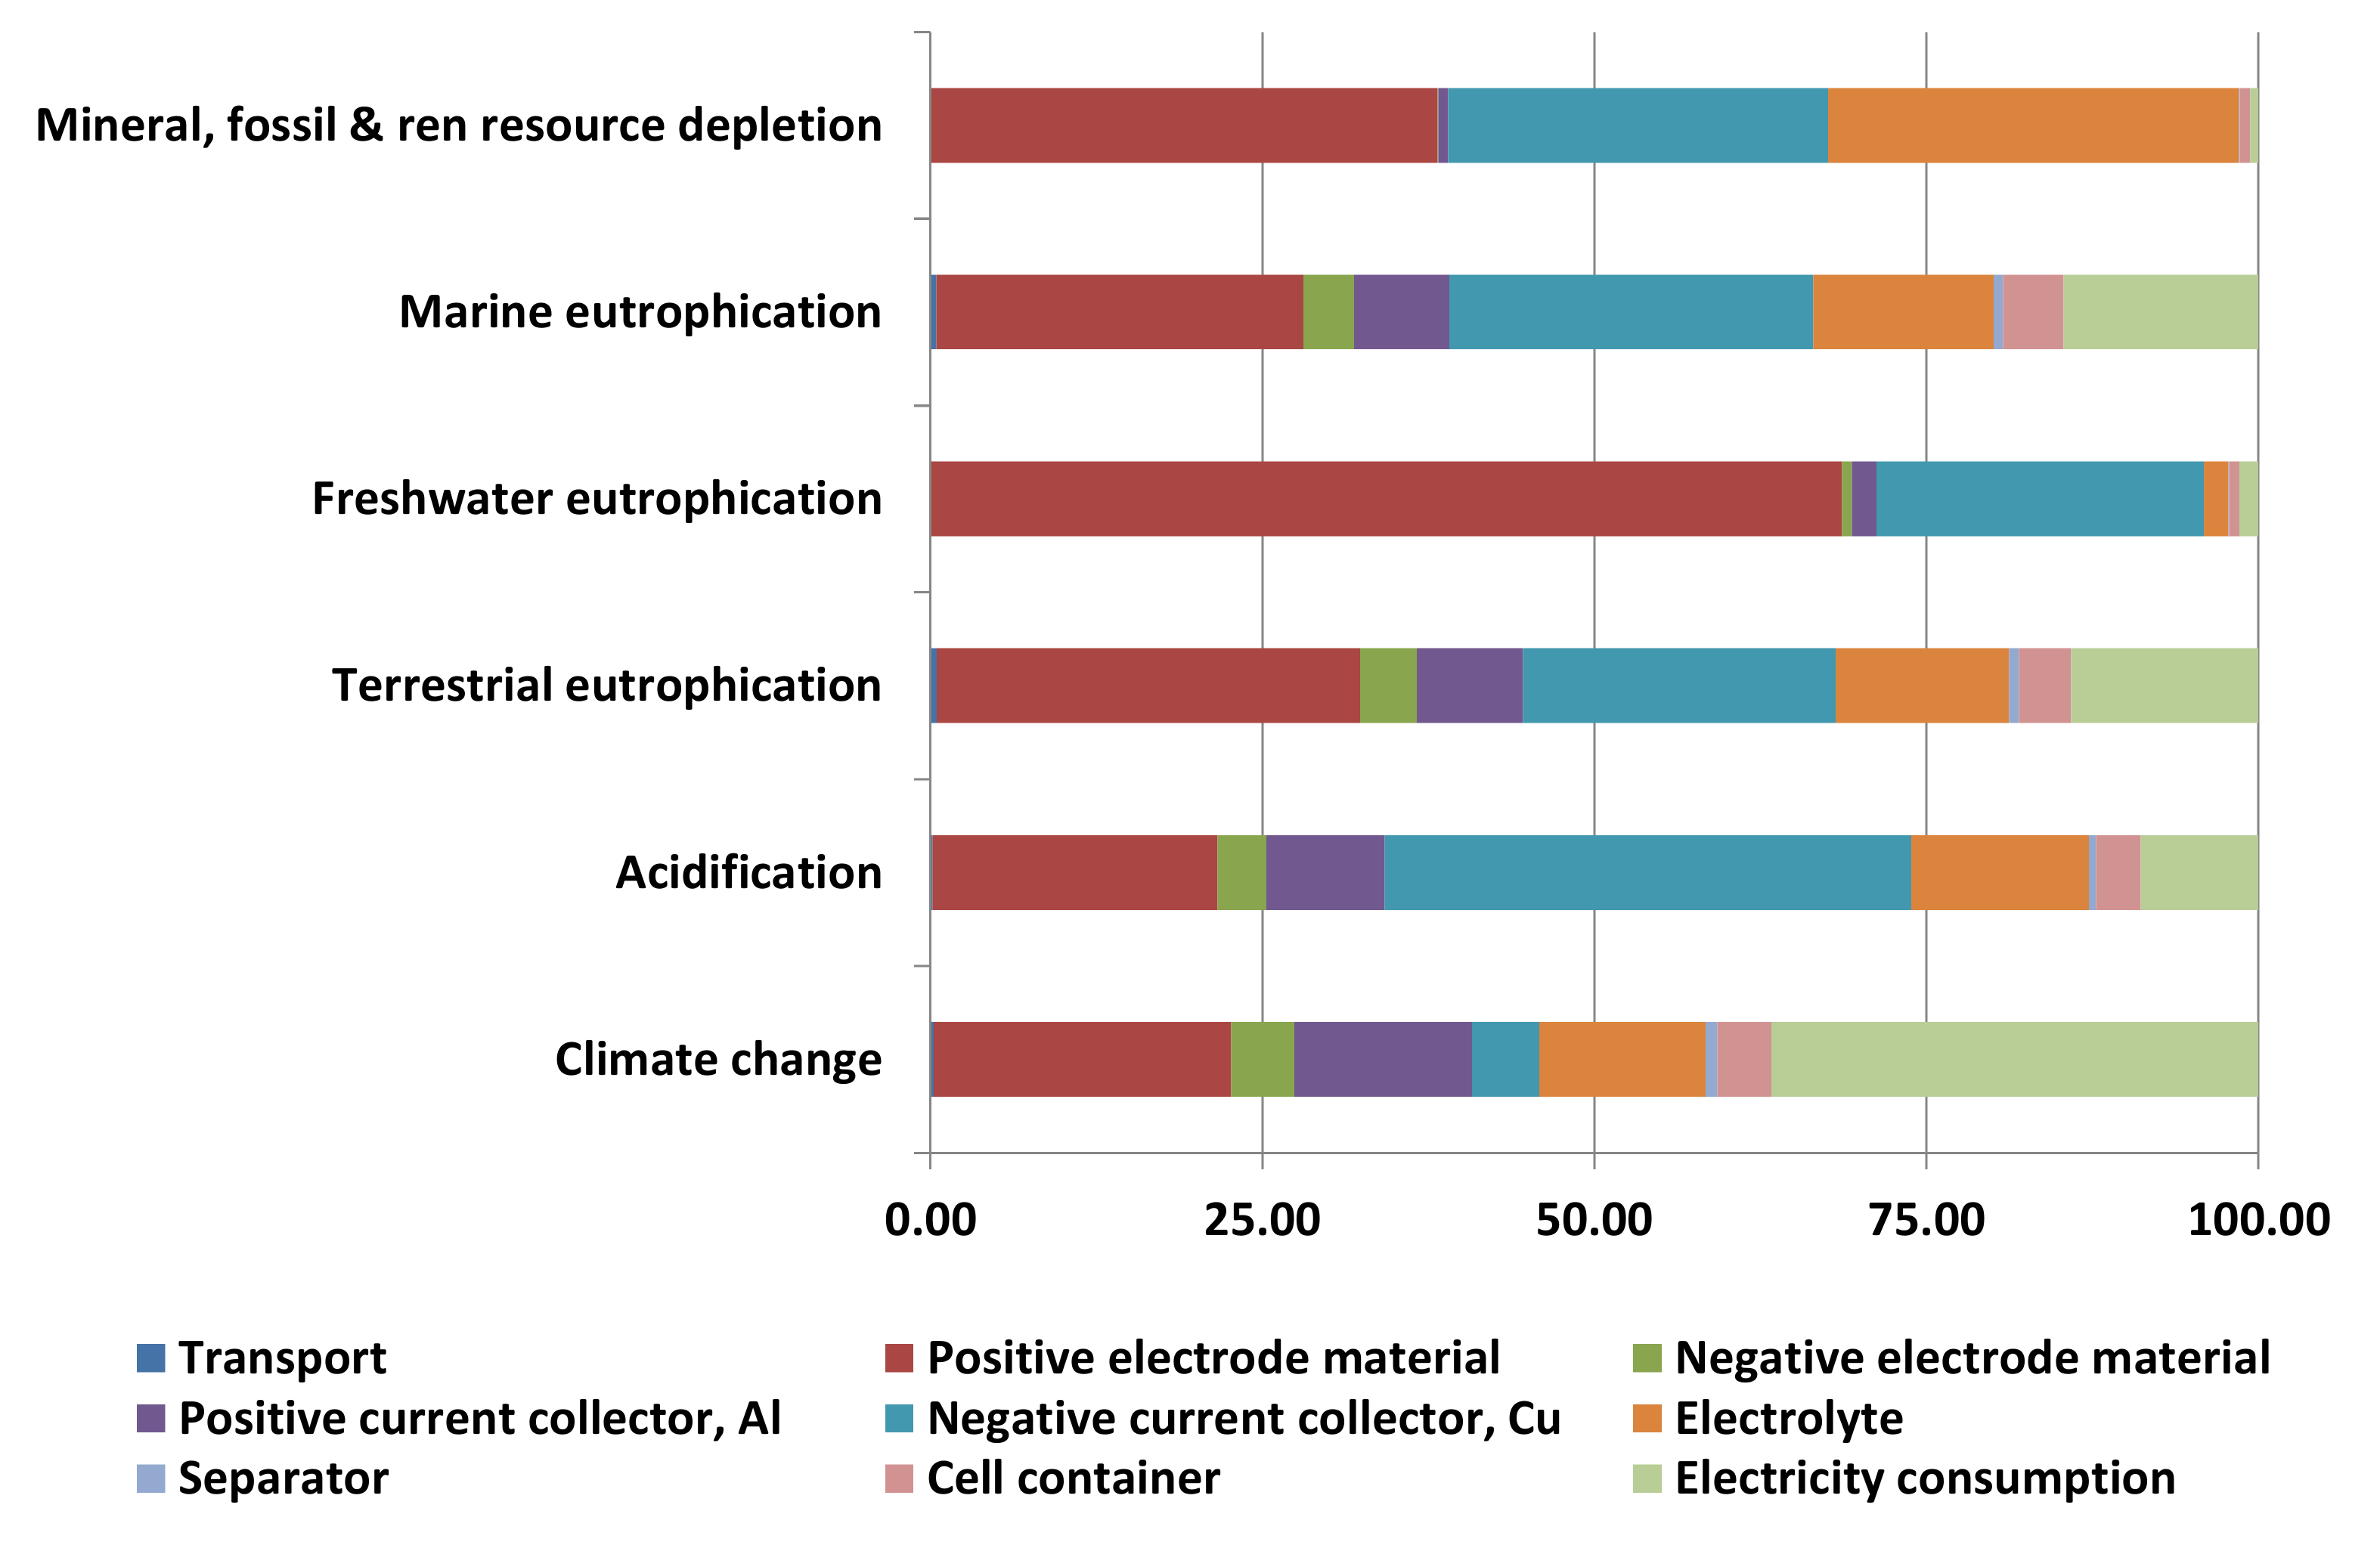
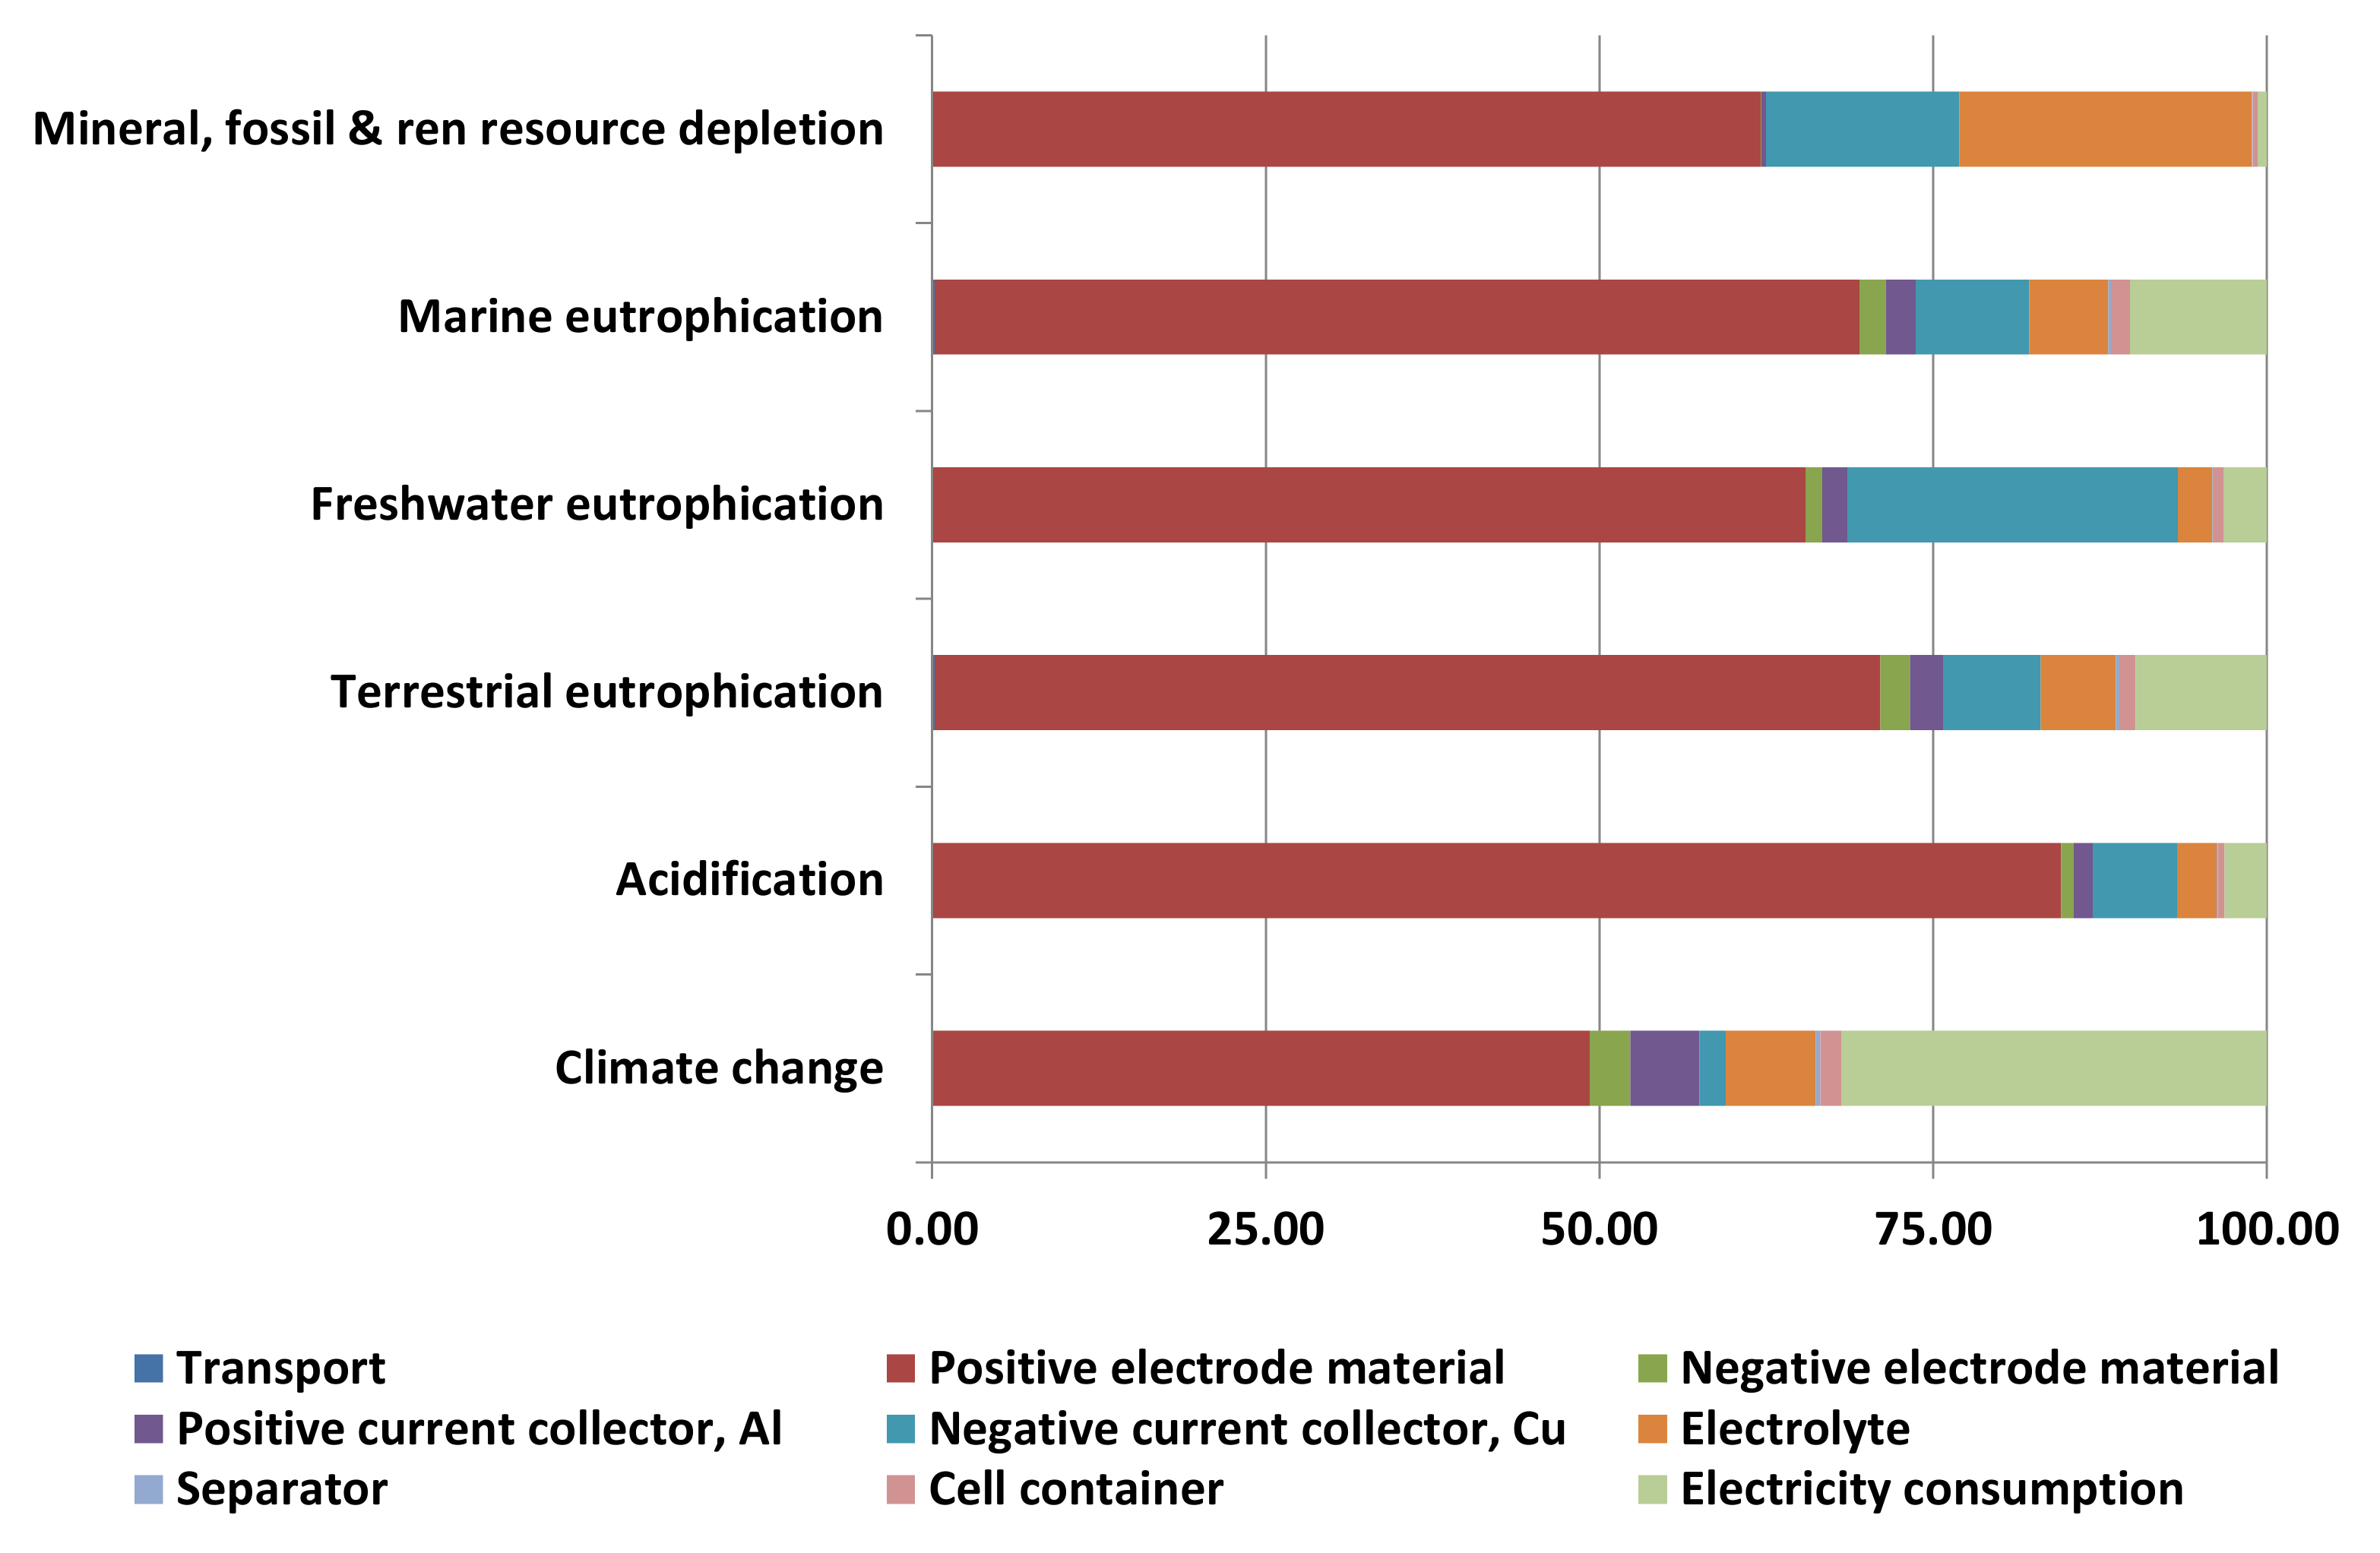
3.1. Cell Production and Assembly

The life cycle energy and environmental impacts of the battery cells are shown in Table 2.
The CED results showed that NMC cells had a higher energy intensity than LFP cells. NMC battery cell production required a 10% higher energy consumption than LFP cells (Table 3). This was due to the use of organic solvents during cell production and the use of a dry room for solvent evaporation. For both cells, non-renewable fossil fuels were mainly consumed.
Except for the freshwater eutrophication and mineral, fossil, and renewable resource depletion impact categories, the LFP cells showed better performance than the NMC cells. Among the NMC batteries, NMC 532 was characterized by lower impacts than NMC 622.
For all cells, the positive electrode material production was the most impacting process, especially for the NMC cells. The second most important process was the anode current collector (Cu) production. A noteworthy exception was the climate change impact category, where electricity consumption during cell production, was the most significant contribution for LFP cells and the second most significant contribution for NMC batteries. For the mineral, fossil, and renewable resource depletion category, electrolyte production also had a visible influence. For details, see Figure 5, Figure 6 and Figure 7.
For all analyzed cells (see Table 3), the energy necessary for the production of the cells was one of the main contributions to the Global Warming Potential (GWP) impact indicator, despite the energy consumption declared by manufacturer being substantially lower than literature data. As a matter of fact, according to Table 3, the energy required for battery cell manufacturing ranged between 371 and 960 MJ per kWh of cell capacity. The data reported by Majeau-Bettez [21] included battery assembly and cell production. It is therefore important to try to improve energy efficiency during the cell manufacturing/assembly process.
In comparison, Ellingsen et al. estimated a GWP indicator of 134.0 kg CO2 eq kWh−1 for NMC cells, which was higher than the values estimated in this study: 61.9, 78.4, and 80.4 kg CO2 eq kWh−1 for LFP, NMC 532, and NMC 622, respectively (Table 2). Moreover, for all the remaining impact categories, Ellingsen et al. cells showed higher values than the cells considered in the present paper.
In our study, the production of 1 kg of positive electrode material (lithium–nickel–cobalt–manganese oxide) for NMC cells accounted for about 60% of the climate change category, a figure that was comparable to that provided by Ellingsen et al. [3] for NMC batteries. Similarly, in the case of LFP cells, lithium–iron–phosphate oxide production was found to represent 90% of GWP impacts (Table 4).
Estimates from Majeau-Bettez [21] were somehow different. The authors report that in the case of LFP batteries, 80% and 13% of the impacts were due to the use of the binder (polytetrafluoroethylene—PTFE) and the production of the oxide of the active material, respectively, for LFP batteries; for NMC batteries, such percentages changed to 71% and 23% for the binder and the oxide of the active material, respectively (Table 4).
Both the present work and that of Ellingsen et al. [3] considered the same inventory (from Majeau-Bettez [21]) for the production of positive and negative active materials. However, in the case of the NMC batteries, the concentrations of the different metals and the type of binder used for both cells differed (Table 5 and Table 6).
Despite common data for active material production, the GWP impacts of 1 kg of binder production within the positive electrode in this study were equal to the following.
  • NMC 532: 72.3% of the binder considered by Ellingsen et al. [3] and 23.1% of that considered by Majeau-Bettez [21].
  • NMC 622: 76.3% of the binder considered by Ellingsen et al. [3] and 24.3% of that considered by Majeau-Bettez [21].
  • LFP: 8.09% of the binder considered by Majeau-Bettez [21] (Table 5).
    Additionally, for the negative electrode, the following important differences were observed.
  • NMC 532 and NMC 622: 23.9% of the binder considered by Ellingsen et al. [3] and 11.0% of that considered by Majeau-Bettez [21];
  • LFP: 11.0% of the binder considered by Majeau-Bettez [21] (Table 6).
Differences in cell design can lead to major variations in environmental impacts. In particular, the binder choice generated significant differences in the obtained results.

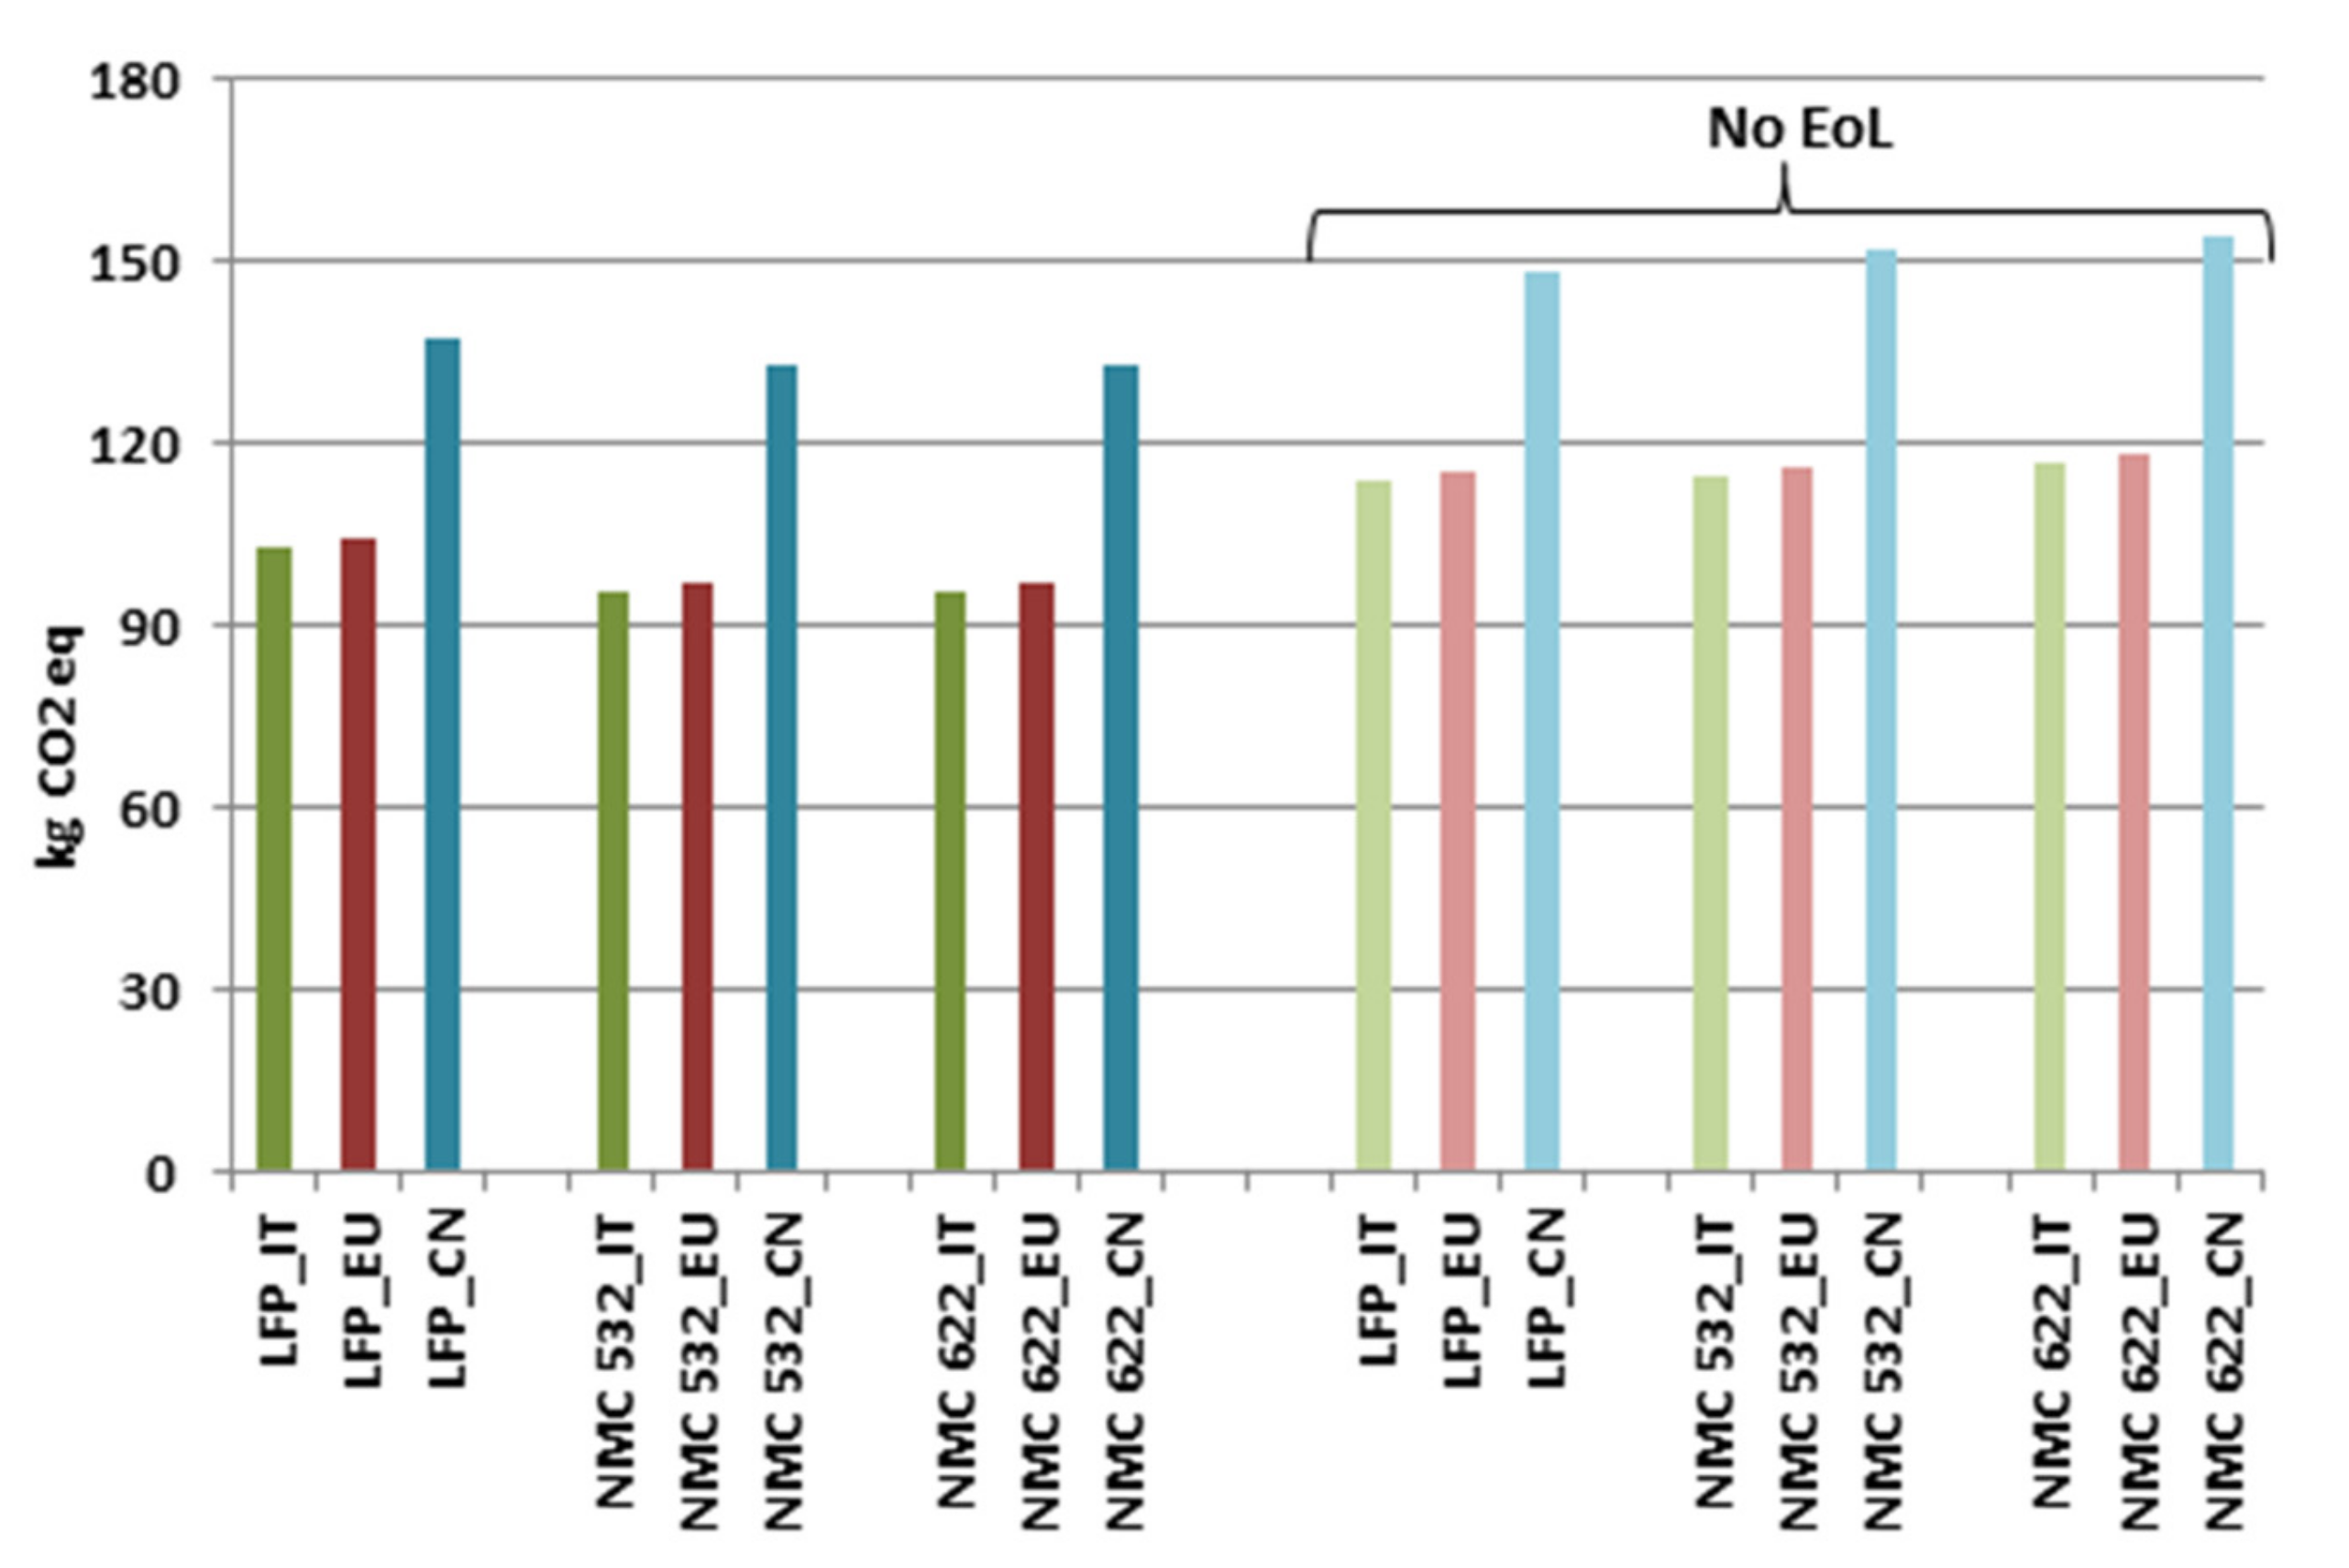
3.2. Battery Production and End-of-Life

The life cycle environmental impacts associated with battery production and the EoL phase of the three batteries are reported in Table 7. For each category, results are reported per 1 kg and 1 kWh of battery capacity. In the Supplementary Materials (Supplementary Materials; Section 3.1), results are broken down into the main considered processes.
When material recycling was considered during the EoL assessment, all batteries showed a general impacts reduction. When the EoL was taken into account, NMC batteries showed better performance than the LFP batteries, and the NMC 532 battery had better performance for all impact categories compared to NMC 622.
When the EoL was not considered, results showed that, except for the freshwater eutrophication and mineral, fossil, and renewable resource depletion categories, the LFP battery performed better than the NMC batteries Among NMC batteries, the NMC 532 battery performed best in all considered impact categories.
Recycling helps to avoid the use of virgin raw materials during battery production phase. In this case, especially the recycling of cobalt, nickel, and copper, leads to a significant reduction of the overall impact of batteries. The impact category that presented greatest benefit due to the EoL was acidification.
For NMC batteries, the positive active material production phase was the one that most affected the acidification category due to the production of lithium–nickel–cobalt–manganese oxide. Conversely, for LFP batteries, the negative current collector (Cu) production was the phase that most affected the acidification category. In this case, impacts were mainly linked to the consumption of copper.

Comparison with the Literature

In order to compare our results with those found in the literature, we chose to use two of the most complete and transparent LCA studies available for comparison: Ellingsen et al. for NMC batteries [3] and Majeau-Bettez for LFP and NMC batteries [21]. Due to the poor quality and limited availability of primary and secondary EoL data, EoL was not considered in the above-mentioned LCA studies. Hence, we did not include our EoL results in the comparison.
According to our results concerning climate change impact category, the production phase generated 114.81 and 116.84 kg CO2 eq per 1 kWh of battery capacity for NMC 532 and NMC 622 batteries, respectively. These values were lower than those reported by Ellingsen et al. (172.71 kg CO2 eq kWh−1) and Majeau-Bettez (264.97 kg CO2 eq kWh−1).
In the case of NMC batteries, the production impacts were mainly caused by three key processes: the cathode active materials, energy consumption, and battery packaging.
Additionally, for LFP batteries, the components/processes that had the greatest impacts were the cathode active materials, battery packaging, BMS, and energy consumption.
The battery cell production process was found to be one of the most impactful processes due to the production of cathode active materials and energy consumption during cell manufacturing. As already discussed, the amount of energy required to produce the cells analyzed in our study was lower than the literature values (Table 3).
The material amounts and components used to describe the packaging production and the BMS varied to a great extent according to the considered study and battery chemistry (see Table 8). For example, Majeau-Bettez did not consider the cooling system, and 80% of their battery was made up of cells, while the battery packaging was equivalent to 17% by weight (almost half compared to the other batteries (32%)) and 20% corresponded to the percentage of the cell packaging.
Differences in battery design and inventory considered to model the different components can have led to considerable variations in environmental impacts even if our packaging and BMS modeling were the same reported by Ellingsen et al. (per kg of packaging and BMS).

3.3. Including Use Phase

The total life cycle environmental impacts of the three batteries are reported in Table 9. Results are summarized by considering two different use phase scenarios (A and B; see Supplementary Materials; Section 2.2) and considering or not the EoL. Scenario A corresponded to a generic use scenario where batteries were charged by the grid and released energy by avoiding production from the grid in a generic moment. The battery lasted for 5000 cycles. The considered energy mix was the Italian one, updated to 2018, as defined in [32]. In Scenario B, batteries were used according to the Italian INECP to limit the overproduction from non-programmable renewable sources below 1 TWh in 2030 [33]. In this scenario, batteries were recharged with energy produced by photovoltaic and wind power plants. When energy was released by the batteries, it was supposed to avoid the production of energy from fossil sources, in particular from natural gas combined-cycle power. Under this scenario, no full charges and discharges were expected, and the battery life was therefore not limited by the number of cycles suggested by the manufacturer (5000) but by age (10 years).
When the EoL was not considered, the LFP battery performed better than the NMC batteries in both scenarios and in all impact categories except for freshwater eutrophication and mineral, fossil, and renewable resource depletion. Among NMC batteries, the NMC 532 battery had the best performance in all impact categories.
For Scenario A when the EoL was also accounted for, NMC batteries became those that perform better, especially the NMC 532 battery, which was the best performer in all impact categories except for climate change.
Under Scenario B with no EoL, NMC batteries performed better than the LFP battery except for the freshwater eutrophication category. Additionally, in this case, among NMC batteries, the NMC 532 performed best in all impact categories except for climate change.
When we also considered the EoL, impacts decreased for all batteries. Among NMC batteries, the EoL, which allowed for the recovery of most nickel and manganese, had the greatest effect in terms of impact reduction for the NMC 622 battery.
GWP impacts due to energy consumption during the use phase are presented in Table 10. In Scenario B, batteries were underutilized, as they performed a number of cycles in 10 years much lower than their maximum (5000). This implied an increase in impacts related to the construction phase, per kWh released by the battery, as they were distributed over a lower amount of released kWh.
Under Scenario B, batteries were charged with energy from non-fossil sources (photovoltaic and wind) and, by releasing energy into the grid, avoided the production of electricity from plants with non-renewable sources (natural gas from combined-cycle plants).
The environmental credits related to the avoided impacts (avoided use of electricity from natural gas) were such that, for the climate change impact category, benefits (reduction of emissions) exceed impacts due to battery production.
The same applied to the consumption of fossil resources. On the contrary, for all other impact categories, Scenario B presented increasing impacts, sometimes significantly, compared to Scenario A.
Similar results were found in a recent study that assessed the potential of battery storage in replacing CCGT plants in responding to variable peak demand for current and future energy scenarios in the UK [19]. Results showed that if batteries are used in place of CCGT, greenhouse gas emissions can be reduced by up to 87%.
For all batteries, the use phase is highly dependent on the used electricity production mix. This effect was found to be greater under Scenario A, where an Italian medium-voltage mix was used [32]. Local conditions could therefore significantly affect results.
The main result of this exercise was therefore that an increasing share of energy from renewable sources in the energy mix used in the different batteries’ life stages can greatly reduce environmental impacts.

3.4. Sensivity and Uncertainty Analysis

As the present LCA study compared different technologies, sensitivity and uncertainty analyses are highly recommended [2].
A Monte Carlo analysis was carried out to quantify the uncertainty in the final results caused by the variability and uncertainty of secondary data. In the Supplementary Materials (Supplementary Materials; Section 3.2), Table 26 (considering EoL) and Table 27 (no EoL) present the estimated distributions of the LCA results.
The highest uncertainties were found for the freshwater eutrophication impact category, as highlighted by the coefficient of variation (CV) values greater than 50%. The final results for this category were characterized by a high dispersion and were strongly influenced by the variability of the input data. The other impact categories had CVs lower than 50%, indicating that the medium value (MV) could correctly represent the result distribution and that the final results were characterized by a low dispersion.
Regarding sensitivity, the parameter that had the highest impact on the overall results was the energy mix, as discussed above. The energy mix used for the battery production and the EoL could significantly change overall impacts: a mix characterized by a high share of energy from renewable sources could help to reduce final impacts by a great extent. These results were in accordance with those of Majeau-Bettez [21], who pointed out that if the Chinese medium-voltage electricity mix is used for all inventoried production processes instead of the average European medium-voltage electricity mix, the life cycle impacts could increase from 10% to 16% for GWP.
In our sensitivity analysis, with respect to the electricity mix used in the production of the cells and battery, we assumed the following energy mixes.
  • IT: Italian medium-voltage mix at 2018 [32] (1 kWh mix medium-voltage IT has 4.55 × 10⁻¹ kg CO2 eq).
  • EU: European average medium-voltage mix ENTSO-E (European Network of Transmission Systems Operators for Electricity) from the Ecoinvent database (1 kWh mix medium-voltage EU has 4.76 × 10⁻¹ kg CO2 eq) [30].
  • CN: Chinese medium-voltage mix from the Ecoinvent database (1 kWh mix medium-voltage CN has 1.14 kg CO2 eq) [30].
Considering 1 kWh of battery capacity, Figure 8 shows the results for GWP while considering the above electricity mixes with or without EoL. The battery use phase was not considered.
When the EoL phase was considered, using the CN mix led life cycle impacts to increase by 33% and 39% for the LFP and NMC batteries, respectively. Conversely, using the EU mix only marginally changed the impacts (1% for both batteries). Similar results were observed when the EoL was not considered: GWP impacts increased by about 30% for both batteries when the CN mix was used, while the change was much smaller with the EU mix (+1%).
When the use phase was considered, the use and EoL phases were assumed to take place in Italy, and cell and battery construction/assembly were carried out in different locations (IT, EU, or CN), GWP impacts were found to increase by about 11% under Scenario A and by 16% under Scenario B when the CN mix was used. Impacts remained almost unchanged (≈0.3%) when the EU mix was used (Table 11).

4. Conclusions

An LCA study of lithium-ion batteries was carried out by modelling three types of batteries (LFP, NMC 532, and NMC 622). Primary data (provided by an Italian manufacturer of stationary storage systems) were used to model battery cell construction, thus filling a gap in the scientific literature, in which primary data are not often used and mainly refer to production based in East Asian countries. Primary data on battery cell production are very important to obtain reliable results.
Global Warming was found to be the most investigated impact category in the LCA literature, and the results showed great variability due to the different hypotheses, databases, and battery chemistries considered. In this category, we found impacts (expressed for 1 kWh of cell capacity) of 61.9 kg CO2 eq kWh−1 for the LFP cells, 78.4 kg CO2 eq kWh−1 for the NMC 532 cells, and 80.4 kg CO2 eq kWh−1 for the NMC 622 cells. Those values were lower than those found in literature for lithium batteries. This study showed that for all considered batteries, the energy consumption during cell production represented one of the main contributors to the climate change indicator. We therefore recommend improving energy efficiency, in terms of energy consumption, during the cell production and battery assembly processes. According to the literature, the energy required for the manufacturing of battery cells varies considerably from 371 to 960 MJ per kWh of cell capacity. The use of an energy mix with an important penetration of renewable sources can help to further decrease the GWP impact.
As shown by the sensitivity analysis, the choice of the energy mix used for the various battery life phases could significantly influence the overall climate change impacts. If the Italian electric mix was replaced by the Chinese one when the EoL phase is considered, the life cycle impacts substantially increased (33% and 39% for LFP and NMC batteries, respectively), but they remained almost unchanged (+1% for both LFP and NMC) when the EU mix was considered instead.
Differences in cell design could lead to significant variations in environmental impacts. This was found to be the case of the binder: the use of polyvinylidene difluoride (cathode) and carboxymethyl cellulose with styrene–butadiene rubber (anode) in lieu of polytetrafluoroethylene (PTFE) as a binder led to a significant decrease of GWP impacts. The GWP impacts of 1 kg of binder production within the positive electrode in this study were equal to 8.09% (LFP), 23.1% (NMC 532), and 24.3 % (NMC 622) of the PTFE binder. Additionally, for the negative electrode, results were only 11.0% (NMC and LFP batteries) of the PTFE binder.
Including the EoL in analyses can substantially reduce the gap in performance between LFP and NMC batteries, which are those that benefit the most from the recovery of materials through pyrometallurgical or hydrometallurgical processes. Among the NMC cells, NMC 532 presented the best chemistry per kWh of capacity. The recycling of cobalt, nickel, and copper was found to lead to a significant reduction in the overall impact of batteries because it avoids the use of virgin raw materials in the production phase.
When the EoL was considered, the dominant phase, in terms of generated impacts, became the production of energy lost during the charging and discharging of the cells.
When batteries were used to store energy produced from solar and wind sources, the energy release was shown to avoid energy production from fossil sources, which could generate a positive impact that more than offsets the negative impacts related to battery construction.

Supplementary Materials

The following are available online at https://www.mdpi.com/article/10.3390/en14082047/s1.

Author Contributions

All people who meet authorship criteria are listed as authors, and all authors certify that they have participated equally in the work to take public responsibility for the content, including participation in the concept, methodology definition, data collection, analysis, and manuscript writing and revision. All authors have read and agreed to the published version of the manuscript.

Funding

This research received no external funding.

Institutional Review Board Statement

Not applicable.

Informed Consent Statement

Not applicable.

Data Availability Statement

The data presented in this study is available within the article and in the Supplementary Materials.

Acknowledgments

This work has been financed by the Research Fund for the Italian Electrical System in compliance with the Decree of 16 April 2018.

Conflicts of Interest

The authors declare no conflict of interest.

References

  1. Economico, M.D.S.; Della Tutela, M.D.A.E.; del Territorio, E.M.D.I.; Dei Trasporti, E. Piano Nazionale Integrato per l’Energia e il Clima; Ministero dello Sviluppo Economico: Rome, Italy, 2019.
  2. ISO—The International Organization for Standardization. ISO 14040:2006: Environmental Management—Life Cycle Assessment—Principles and Framework; ISO: Geneva, Switzerland, 2006. [Google Scholar]
  3. Ellingsen, L.A.W.; Majeau-Bettez, G.; Singh, B.; Srivastava, A.K.; Valøen, L.O.; Strømman, A.H. Life Cycle Assessment of a Lithium-Ion Battery Vehicle Pack. J. Ind. Ecol. 2014, 18, 113–124. [Google Scholar] [CrossRef] [Green Version]
  4. Hiremath, M.; Siebenhuener, B.; Vogt, T.; Heinemann, D. Comparative Life Cycle Assessment of Stationary Battery Storage Technologies for Balancing Fluctuations of Renewable Energy Sources. Master’s Thesis, University of Oldenburg, Oldenburg, Germany, 2014. [Google Scholar]
  5. Hiremath, M.; Derendorf, K.; Vogt, T. Comparative Life Cycle Assessment of Battery Storage Sistems for Stationary Applications. Environ. Sci. Technol. 2015, 19, 4825–4833. [Google Scholar] [CrossRef] [PubMed]
  6. Longo, S.; Antonucci, V.; Cellura, M.; Ferraro, M. Life cycle assessment of storage systems: The case study of a sodium/nickel chloride battery. J. Clean. Prod. 2014, 85, 337–346. [Google Scholar] [CrossRef]
  7. Temporelli, A.; Mela, G. Analisi di Letteratura e Aspetti Metodologici per la LCA ed LCC delle Batterie Stazionarie; RSE SpA: Milano, Italy, 2019. [Google Scholar]
  8. Denholm, P.; Kulcinski, G.L. Life cycle energy requirements and greenhouse gas emissions from large scale energy storage systems. Energy Convers. Manag. 2004, 45, 2153–2172. [Google Scholar] [CrossRef]
  9. Rydh, C.J. Environmental assessment of vanadium redox and lead-acid batteries for stationary energy storage. J. Power Sour. 1999, 80, 21–29. [Google Scholar] [CrossRef]
  10. Wang, Q.; Liu, W.; Yuan, X.; Tang, H.; Tang, Y.; Wang, M.; Zuo, J.; Song, Z.; Sun, J. Life cycle assessment of lithium-ion batteries for greenhouse gas emissions. Resour. Conserv. Recycl. 2017, 117, 285–293. [Google Scholar]
  11. Wang, Q.; Liu, W.; Yuan, X.; Tang, H.; Tang, Y.; Wang, M.; Zuo, J.; Song, Z.; Sun, J. Environmental impact analysis and process optimization of batteries based on life cycle assessment. J. Clean. Prod. 2018, 174, 1262–1273. [Google Scholar] [CrossRef]
  12. Mahmud, M.A.; Huda, N.; Farjana, S.H.; Lang, C. Comparative life cycle environmental impact analysis of lithium-ion (LiIo) and nickel-metal hydride (NiMH) batteries. Batteries 2019, 5, 22. [Google Scholar] [CrossRef] [Green Version]
  13. Sullivan, J.L.; Gaines, L. Status of life cycle inventories for batteries. Energy Convers. Manag. 2012, 58, 134–148. [Google Scholar] [CrossRef]
  14. Sullivan, J.L.; Gaines, L. A Review of Battery Life-Cycle Analysis: State of Knowledge and Critical Needs; U.S. Department of Energy: Chicago, IL, USA, 2010.
  15. Spanos, C.; Turney, D.E.; Fthenakis, V. Life-cycle analysis of flow-assisted nickel zinc-, manganese dioxide-, and valve-regulated lead acid batteries designed for demand-charge reduction. Renew. Sustain. Energy Rev. 2015, 43, 478–494. [Google Scholar] [CrossRef]
  16. Vandepaer, L.; Colutiere, J.; Amor, B. Environmental impacts of Lithium Metal Polymer and Lithium-ion stationary batteries. Renew. Sustain. Energy Rev. 2017, 78, 46–60. [Google Scholar] [CrossRef]
  17. Temporelli, A.; Carvalho, M.L.; Girardi, P. Life Cycle Assessment of Electric Vehicle Batteries: An Overview of Recent Literature. Energies 2020, 13, 2864. [Google Scholar] [CrossRef]
  18. Salgado Delgado, M.A.; Usai, L.; Ellingsen, L.A.W.; Pan, Q.; Hammer Strømman, A. Comparative Life Cycle Assessment of a Novel Al-Ion and a Li-Ion Battery for Stationary Applications. Materials 2019, 12, 3270. [Google Scholar] [CrossRef] [Green Version]
  19. Chowdhury, J.I.; Balta-Ozkan, N.; Goglio, P.; Hu, Y.; Varga, L.; McCabe, L. Techno-environmental analysis of battery storage for grid level energy services. Renew. Sustain. Energy Rev. 2020, 131, 110018. [Google Scholar] [CrossRef]
  20. Pellow, M.A.; Ambrose, H.; Mulvaney, D.; Betita, R.; Shaw, S. Research gaps in environmental life cycle assessments of lithium ion batteries for grid-scale stationary energy storage systems: End-of-life options and other issues. Sustain. Mater. Technol. 2020, 23, e00120. [Google Scholar] [CrossRef]
  21. Majeau-Bettez, G.; Hawkins, T.R.; Strømman, A.H. Life Cycle Environmental Assessment of Lithium-Ion and Nickel Metal Hydride Batteries for Plug-In Hybrid and Battery Electric Vehicles. Environ. Sci. Technol. 2011, 45, 4548–4554. [Google Scholar] [CrossRef]
  22. ISO—The International Organization for Standardization. ISO 14044:2006: Environmental Management—Life Cycle Assessment—Requirements and Guidelines; ISO: Geneva, Switzerland, 2006. [Google Scholar]
  23. Cheng, K.W.E.; Divakar, B.P.; Wu, H.; Ding, K.; Ho, H.F. Battery-management system (BMS) and SoC development for electrical vehicles. IEEE Trans. Veh. Technol. 2011, 60, 76–88. [Google Scholar] [CrossRef]
  24. How, N.D.; Hannan, A.M.; Lipu, H.M.; Ker, J.P. State of Charge Estimation for Lithium-Ion Batteries Using Model-Based and Data-Driven Methods: A Review. IEEE Access. 2019, 7, 136116–136136. [Google Scholar] [CrossRef]
  25. Melentjev, S.; Lebedev, D. Overview of Simplified Mathematical Models of Batteries; Doctoral School of Energy and Geotechnology: Parnu, Estoni, 2013; pp. 231–235. [Google Scholar]
  26. Tremblay, O.; Dessaint, L.A. Experimental Validation of a Battery Dynamic Model for EV Applications. World Electr. Veh. J. 2009, 3, 2032–6653. [Google Scholar] [CrossRef] [Green Version]
  27. Sun, K.; Shu, Q. Overview of the types of battery models. In Proceedings of the 30th Chinese Control Conference, Yantai, China, 22–24 July 2011. [Google Scholar]
  28. Steubing, B.; Wernet, G.; Reinhard, J.; Bauer, C.; Moreno-Ruiz, E. The ecoinvent database version 3 (part II): Analyzing LCA results and comparison to version 2. Int. J. Life. Cycle Assess. 2016, 21, 1269–1281. [Google Scholar] [CrossRef] [Green Version]
  29. European Commission—Joint Research Centre—Institute for Environment and Sustainability, International Reference Life Cycle Data System (ILCD). Handbook—General Guide for Life Cycle Assessment—Detailed Guidance; EUR 24708 EN; Publications Office of the European Union: Luxemburg, 2010. [Google Scholar]
  30. Wernet, G.; Bauer, C.; Steubing, B.; Reinhard, J.; Moreno-Ruiz, E.; Weidema, B. The Ecoinvent database version 3 (Part I): Overview and methodology. Int. J. Life Cycle Assess. 2016, 21, 1218–1230. [Google Scholar] [CrossRef]
  31. Mohr, M.; Peters, J.F.; Baumann, M.; Weil, M. Toward a cell-chemistry specific life cycle assessment of lithium-ion battery recycling processes. J. Ind. Ecol. 2020, 24, 1310–1322. [Google Scholar] [CrossRef]
  32. Gargiulo, A.; Carvalho, M.L.; Girardi, P. Life Cycle Assessment of Italian Electricity Scenarios to 2030. Energies 2020, 13, 3852. [Google Scholar] [CrossRef]
  33. Lanati, F.; Gaeta, M.; Gelmini, A.; Gatti, A.; Mazzocchi, L. Studi a Supporto della Governance del Sistema Elettrico ed Energetico Nazionale; RSE SpA: Milano, Italy, 2019. [Google Scholar]
Figure 1. Geographical and temporal distribution of life cycle assessment (LCA) studies on stationary batteries. (Italy, 2021: the present study; IT: Italia; EU: Europe; USA: United States of America; and CN: China).
Energies 14 02047 g001
Figure 2. Schematic representation of the analyzed system. The functional unit is 1 kWh of energy delivered by the battery. BMS: battery management system.
Energies 14 02047 g002
Figure 3. Battery pack and battery cell mass composition, by components. LFP: lithium–iron–phosphate; NMC: nickel–manganese–cobalt.
Energies 14 02047 g003
Figure 4. Frequency of the different environmental impact categories considered in 13 LCA studies on stationary batteries [7].
Energies 14 02047 g004
Figure 5. Life cycle impacts of LFP battery cell production, broken down into key processes.
Energies 14 02047 g005
Figure 6. Life cycle impacts of NMC 532 battery cell production, broken down into key processes.
Energies 14 02047 g006
Figure 7. Life cycle impacts of NMC 622 battery cell production, broken down into key processes.
Energies 14 02047 g007
Figure 8. Impact assessment results for the climate change category (kg CO2 eq) for the different batteries while considering the following energy mixes: Italy (IT), Europe (EU), and China (CN). Data refer to 1 kWh of battery capacity. Battery use phase was not considered.
Energies 14 02047 g008
Table 1. Electrochemical characteristics and performance of the three analyzed stationary batteries.
Cell TechnologyCathodeAnodeCell VoltageNominal Cell CapacityTotal Battery Pack Energy Density
(V)(Ah)(kWh kg−1)
LFPLiFePO4Graphite3.3407.94 × 10−2
NMC 532LiNi5Mn3Co2O2Graphite3.6751.14 × 10−1
NMC 622LiNi6Mn2Co2O2Graphite3.6751.14 × 10−1
Table 2. Energy and environmental impacts of the battery cell’s life cycle. Data refer to 1 kg and 1 kWh of cell capacity. CED: cumulative energy demand.
Impact CategoriesUnitsLFPNMC 532NMC 622
1 kg1 kWh1 kg1 kWh1 kg1 kWh
Climate changekg CO2 eq8.196.19 × 1011.49 × 1017.84 × 1011.53 × 1018.04 × 101
Acidificationmolc H+ eq7.35 × 10−25.56 × 10−13.25 × 10−11.713.69 × 10−11.94
Terrestrial eutrophicationmolc N eq8.62 × 10−26.52 × 10−11.95 × 10−11.032.07 × 10−11.09
Freshwater eutrophicationkg P eq6.03 × 10−34.56 × 10−24.21 × 10−32.22 × 10−24.54 × 10−32.39 × 10⁻²
Marine eutrophicationkg N eq8.42 × 10−36.37 × 10−21.90 × 10−21.00 × 10−11.99 × 10−21.05 × 10⁻¹
Mineral, fossil, and renewable resource depletionkg Sb eq3.76 × 10−32.84 × 10−25.22 × 10−32.75 × 10−25.31 × 10−32.80 × 10⁻²
CED
Non-renewable and fossilMJ1.07 × 1028.10 × 1023.21 × 1021.69 × 1033.49 × 1021.84 × 103
Non-renewable and nuclearMJ9.206.96 × 1011.70 × 1018.97 × 1011.73 × 1019.10 × 101
Non-renewable and biomassMJ1.24 × 10−19.40 × 10−11.95 × 10−11.031.95 × 10−11.03
Renewable and biomassMJ4.783.61 × 1017.944.18 × 1018.034.23 × 101
Renewable, wind, solar, and geothermalMJ4.593.47 × 1017.483.94 × 1017.493.94 × 101
Renewable and waterMJ9.126.90 × 1011.69 × 1018.87 × 1011.76 × 1019.28 × 101
Table 3. Information related to the production of different cell types. GWP: Global Warming Potential, RSE: Ricerca sul Sistema Energetico, that refers to the present study.
StudyCell TypeCell Density
kWh kg−1
Direct Energy Use in Cell Manufacture
MJ kWh−1
GWP
kg CO2 eq kWh−1
Energy Reference
Majeau-Bettez [21]LFP
NMC
0.110
0.140
371–473-Reports
Ellingsen et al. [3]NMC0.174960134.0Primary
RSELFP0.13218061.9Primary
NMC 5320.19019878.4
NMC 6220.19019880.4
Table 4. Climate change contribution by process of different batteries technologies and authors (Majeau-Bettez (MB) [21]; Ellingsen et al. [3]) for the production of 1 kg of positive electrode material.
TransportLiFePO4 (LFP)
LiNixMnyCoz (NMC)
Carbon
Black
BinderSolventInfrastructure
WaterNmp
LFP6.06%90.11%1.10%2.71%0.02%--
LFP_MB0.95%13.02%0.39%79.86%-5.78%-
NMC 5321.71%57.54%0.48%1.60%-38.66%-
NMC 6221.63%59.67%0.46%1.52%-36.72%-
NMC_Ellingsen0.30%69.72%0.43%5.52%-23.47%0.55%
NMC_MB0.84%23.03%0.35%70.67%-5.12%-
Table 5. Positive electrode material composition for different cells and climate change (kg CO2 eq) impacts for the production of 1 kg of binder for the positive electrode (Nmp: N-methyl-2-pyrrolidone; PVDF: polyvinylidene difluoride; PTFE: polytetrafluoroethylene; CMC: carboxymethyl cellulose; MB: Majeau-Bettez; CB: carbon black).
Component
Impact Category
NMC532NMC622NMC_MBNMC_EllingsenLFPLFP_MB
Active materialLiNi5Mn3Co2LiNi5Mn3Co2LiNi2/5Mn2/5Co1/5LiNi1/3Mn1/3Co1/3LiFePO4LiFePO4
BinderPVDFPVDFPTFEPVDFPolyacrylate and CMCPTFE
Carbon blackCBCBCBCBCBCB
SolventNmpNmpNmpNmpH2ONmp
GWP
kg CO2 eq kg−1
8.458.923.66 × 1011.17 × 1012.623.24 × 101
Table 6. Negative electrode composition for different cells and climate change (kg CO2 eq) impacts for the production of 1 kg of binder for the negative electrode (BG: battery grade; Nmp: N-methyl-2-pyrrolidone; SBR: styrene–butadiene rubber; PTFE: polytetrafluoroethylene; CMC: carboxymethyl cellulose; PAA: poly-acrylic-acid; MB: Majeau-Bettez).
Component
Impact Category
NMC532NMC622NMC_MBNMC_EllingsenLFPLFP_MB
Active materialGraphite (BG)Graphite (BG)Graphite (baked 1100 °C)Graphite (BG)Graphite (BG)Graphite (baked 1100 °C)
BinderCMC
and
SBR
CMC
and
SBR
PTFECMC
and
PAA
CMC
and
SBR
PTFE
SolventH2OH2ONmpNmpH2ONmp
GWP
kg CO2 eq kg−1
2.072.071.88 × 1018.692.071.88 × 101
Table 7. Life cycle impacts of battery (LFP, NMC 532, and NMC 622) production and end-of-life (EoL) phase. Data are quantitatively reported for different functional units (1 kg and 1 kWh battery capacity).
ImpactUnitsLFPNMC 532NMC 622
No EoLEoLNo EoLEoLNo EoLEoL
1 kg1 kWh1 kg1 kWh1 kg1 kWh1 kg1 kWh1 kg1 kWh1 kg1 kWh
Climate changekg CO2 eq1.51 × 1011.14 × 1021.36 × 1011.03 × 1022.18 × 1011.15 × 1021.82 × 1019.56 × 1012.22 × 1011.17 × 1021.82 × 1019.56 × 101
Acidificationmolc H+ eq1.30 × 10−19.79 × 10−19.61 × 10−27.27 × 10−13.82 × 10−12.011.32 × 10−16.93 × 10−14.25 × 10−12.241.33 × 10−17.01 × 10⁻¹
Terrestrial eutrophicationmolc N eq1.66 × 10−11.251.36 × 10−11.032.75 × 10−11.451.72 × 10−19.03 × 10−12.86 × 10−11.511.72 × 10−19.05 × 10⁻¹
Freshwater eutrophicationkg P eq8.20 × 10−36.20 × 10−26.82 × 10−35.16 × 10−26.38 × 10−33.36 × 10−23.17 × 10−31.67 × 10−26.71 × 10−33.53 × 10−23.18 × 10−31.67 × 10⁻²
Marine eutrophicationkg N eq1.62 × 10−21.23 × 10−11.31 × 10−29.91 × 10−22.68 × 10−21.41 × 10−11.84 × 10−29.66 × 10−22.77 × 10−21.46 × 10−11.84 × 10−29.68 × 10⁻²
Mineral, fossil, and renewable resource depletionkg Sb eq1.08 × 10−28.18 × 10−29.47 × 10−37.16 × 10−21.23 × 10−26.46 × 10−29.13 × 10−34.81 × 10−21.24 × 10−26.51 × 10−29.14 × 10−34.81 × 10⁻²
CED
Non-renewable and fossilMJ1.86 × 1021.41 × 1031.72 × 1021.30 × 1034.01 × 1022.11 × 1032.46 × 1021.30 × 1034.28 × 1022.25 × 1032.47 × 1021.30 × 103
Non-renewable and nuclearMJ2.09 × 1011.58 × 1021.98 × 1011.49 × 1022.87 × 1011.51 × 1022.53 × 1011.33 × 1022.90 × 1011.52 × 1022.51 × 1011.32 × 102
Non-renewable and biomassMJ1.34 × 1011.021.42 × 10−11.072.05 × 10−11.082.11 × 10−11.112.05 × 10−11.082.10 × 10−11.11
Renewable and biomassMJ7.485.65 × 1017.025.31 × 1011.06 × 1015.60 × 1019.655.08 × 1011.07 × 1015.65 × 1019.635.07 × 101
Renewable, wind, solar, and geothermalMJ5.163.90 × 1015.394.08 × 1018.044.23 × 1018.154.29 × 1018.064.24 × 1018.134.28 × 101
Renewable and waterMJ1.95 × 1011.48 × 1021.69 × 1011.28 × 1022.73 × 1011.43 × 1022.13 × 1011.12 × 1022.80 × 1011.47 × 1022.13 × 1011.12 × 102
Table 8. Mass composition of the different batteries’ components (Majeau-Bettez (MB) [21]; Ellingsen et al. [3].
ComponentsLFPLFP_MBNMC 532NMC 622NMC_EllingsenNMC_MB
Positive electrode material21.8%24.8%24.5%24.5%22.8%23.2%
Positive current collector: Al4.2%3.6%3.0%3.0%2.9%3.6%
Negative electrode material11.2%8.0%13.2%13.2%9.9%9.4%
Negative current collector: Cu7.2%8.3%5.1%5.1%13.3%8.3%
Electrolyte12.0%12.0%11.8%11.8%9.5%12.0%
Separator1.2%3.3%0.8%0.8%1.3%3.3%
Cell packaging2.3%20.0%1.6%1.6%0.4%20.1%
Cooling system4.0%-4.0%4.0%4.1%-
Packaging32.4%17.0%32.4%32.4%32.1%17.0%
BMS3.7%3.0%3.7%3.7%3.7%3.0%
Table 9. Life cycle environmental impacts of storing and delivering 1 kWh of electrical energy in LFP, NMC 532, and NMC 622 stationary batteries. For the CED indicator, negative values indicate savings rather than energy consumption; for other impact categories, negative values indicate avoided impacts.
Impact CategoryUnitsScenario AScenario B
LFPNMC 532NMC 622LFPNMC 532NMC 622
EoLNo EoLEoLNo EoLEoLNo EoLEoLNo EoLEoLNo EoLEoLNo EoL
Climate changekg CO2 eq6.61 × 10−26.83 × 10−26.46 × 10−26.84 × 10−26.46 × 10−26.88 × 10⁻²−3.17 × 10⁻¹−3.04 × 10⁻¹−3.26 × 10⁻¹−3.03 × 10⁻¹−3.26 × 10⁻¹−3.01 × 10⁻¹
Acidificationmolc H+ eq2.44 × 10−42.94 × 10−42.37 × 10−45.00 × 10−42.39 × 10−45.46 × 10−44.82 × 10−47.85 × 10−44.41 × 10−42.02 × 10−34.51 × 10−42.30 × 10⁻³
Terrestrial eutrophicationmolc N eq3.90 × 10−44.35 × 10−43.65 × 10−44.74 × 10−43.65 × 10−44.86 × 10−46.23 × 10−48.96 × 10−44.75 × 10−41.13 × 10−34.77 × 10−41.20 × 10⁻³
Freshwater eutrophicationkg P eq1.16 × 10−51.37 × 10−54.65 × 10−68.03 × 10−64.66 × 10−68.38 × 10−66.94 × 10−58.19 × 10−52.75 × 10−54.78 × 10−52.76 × 10−54.99 × 10⁻⁵
Marine eutrophicationkg N eq3.85 × 10−54.32 × 10−53.80 × 10−54.69 × 10−53.80 × 10−54.78 × 10−56.64 × 10−59.49 × 10−56.35 × 10−51.17 × 10−46.37 × 10−51.22 × 10⁻⁴
Mineral, fossil, and renewable resource depletionkg Sb eq1.47 × 10−51.67 × 10−59.95 × 10−61.33 × 10−59.96 × 10−61.34 × 10−59.94 × 10−51.12 × 10−47.12 × 10−59.10 × 10−57.13 × 10−59.16 × 10⁻⁵
CED
Non-renewable and fossilMJ8.01 × 10−18.22 × 10−17.99 × 10−19.62 × 10−18.00 × 10−19.91 × 10⁻¹−6.26−6.13−6.26−5.29−6.26−5.12
Non-renewable and nuclearMJ8.55 × 10−28.72 × 10−28.22 × 10−28.59 × 10−28.21 × 10−28.61 × 10−29.58 × 10−21.06 × 10−17.60 × 10−29.77 × 10−27.50 × 10−29.93 × 10⁻²
Non-renewable and biomassMJ1.98 × 10−31.97 × 10−31.99 × 10−31.98 × 10−31.99 × 10−31.98 × 10−31.32 × 10−31.25 × 10−31.36 × 10−31.33 × 10−31.36 × 10−31.33 × 10⁻³
Renewable and biomassMJ4.93 × 10−25.00 × 10−24.89 × 10−24.99 × 10−24.88 × 10−25.00 × 10−27.66 × 10−28.07 × 10−27.38 × 10−28.01 × 10−27.37 × 10−28.07 × 10⁻²
Renewable, wind, solar, and geothermalMJ7.27 × 10−27.24 × 10−27.31 × 10−27.30 × 10−27.31 × 10−27.30 × 10−23.253.253.253.253.253.25
Renewable and waterMJ9.15 × 10−29.55 × 10−28.84 × 10−29.47 × 10−28.84 × 10−29.55 × 10−21.90 × 10−12.14 × 10−11.71 × 10−12.09 × 10−11.71 × 10−12.13 × 10⁻¹
Table 10. Life cycle environmental results for the impact category of climate change (kg CO2 eq) presented by the different processes during the use phase. Data are reported for 1 kWh of energy stored and delivered.
ScenarioBattery TypeBattery ProductionEnergy RequirementsAvoided Energy Consumption
(%)(%)(%)
ALFPEoL31.2068.80-
No EoL33.4566.55-
NMC 532EoL29.6270.38-
No EoL33.5666.44-
NMC 622EoL29.6170.39-
No EoL33.9566.05-
BLFPEoL38.9914.38−153.37
No EoL45.1215.02−160.13
NMC 532EoL35.1813.99−149.17
No EoL45.4315.05−160.48
NMC 622EoL35.1713.99−149.16
No EoL46.6115.17−161.79
Table 11. Impact assessment results for the climate change category (kg CO2 eq) for the different batteries while considering the following energy mixes: Italy (IT), Europe (EU), and China (CN). Data refer to 1 kWh of energy released while considering the entire useful life of the batteries.
Impact CategoryMixScenario A
LFPNMC 532NMC 622
EoLno EoLEoLno EoLEoLno EoL
Climate Change
[kg CO2 eq]
IT6.61 × 10−26.83 × 10−26.46 × 10−26.84 × 10−26.46 × 10−26.88 × 10⁻²
EU6.63 × 10−26.85 × 10−26.48 × 10−26.87 × 10−26.48 × 10−26.91 × 10⁻²
CN7.29 × 10−27.51 × 10−27.21 × 10−27.59 × 10−27.21 × 10−27.63 × 10⁻²
MixScenario B
LFPNMC 532NMC 622
EoLno EoLEoLno EoLEoLno EoL
IT−3.17 × 10⁻¹−3.04 × 10⁻¹−3.26 × 10⁻¹−3.03 × 10⁻¹−3.26 × 10⁻¹−3.01 × 10⁻¹
EU−3.16 × 10⁻¹ −3.03 × 10⁻¹−3.25 × 10⁻¹−3.02 × 10⁻¹−3.25 × 10⁻¹−2.99 × 10⁻¹
CN−2.76 × 10⁻¹ −2.63 × 10⁻¹−2.81 × 10⁻¹−2.58 × 10⁻¹−2.81 × 10⁻¹−2.56 × 10⁻¹
Publisher’s Note: MDPI stays neutral with regard to jurisdictional claims in published maps and institutional affiliations.

