Article

Studying the Complexity of Biomass Derived Biofuels

Max-Planck-Institut für Kohlenforschung, Kaiser-Wilhelm-Platz 1, 45470 Mülheim an der Ruhr, Germany
*
Author to whom correspondence should be addressed.
Energies 2021, 14(8), 2032; https://doi.org/10.3390/en14082032
Submission received: 10 March 2021 / Revised: 24 March 2021 / Accepted: 31 March 2021 / Published: 7 April 2021

Abstract

:
Biofuel produced from biomass pyrolysis is a good example of a highly complex mixture. Detailed understanding of its composition is a prerequisite for optimizing transformation processes and further upgrading conditions. The major challenge in understanding the composition of biofuel derived from biomass is the wide range of compounds with high diversity in polarity and abundance that can be present. In this work, a comprehensive analysis using mass spectrometry is reported. Different operation conditions are studied by utilizing multiple ionization methods (positive mode atmospheric pressure photo ionization (APPI), atmospheric pressure chemical ionization (APCI) and electrospray ionization (ESI) and negative mode ESI) and applying different resolving power set-ups (120 k, 240 k, 480 k and 960 k) and scan techniques (full scan and spectral stitching method) to study the complexity of a pyrolysis biofuel. Using a mass resolution of 960 k and the spectral stitching scan technique gives a total of 21,703 assigned compositions for one ionization technique alone. The number of total compositions is significantly expanded by the combination of different ionization methods.

Graphical Abstract

1. Introduction

The decrease of petroleum resources, in combination with the economic, environmental and political concerns associated with petroleum-based economies, drives a resurgence in the development of alternatives to fossil fuels [1]. Among the renewable energy resources, biofuel derived from biomass feedstock evokes the interest of the scientific community for its low price, high quantitative availability and the good reproducibility of feedstock, which allows transformation processes to be performed on an industrial scale. Lignocellulosic biomass is a complex material, mainly consisting of cellulose, hemicellulose and lignin, along with extractives (tannins, fatty acids and resins) and inorganic salts [2]. The mass fraction of each component is highly dependent on the type of biomass, typically containing about 40–47% cellulose, 25–35% hemicellulose and 16–31% lignin [3].
One of the most efficient ways to generate bio-oils is fast pyrolysis, generally carried out at temperatures of around 500 °C using a short residence time (several seconds), non-oxidative conditions and sometimes, additionally, a solid-state catalyst [4,5,6]. The mechanism behind this process is thermal cracking, which enables the breakdown of organic biopolymers into smaller molecules. However, biomass-derived oil usually contains up to 60% oxygen, which fundamentally limits its use as an energy source because of its correspondingly low heating value, high corrosiveness, high viscosity and instability. Such oils, therefore, need to be upgraded [2,7].
For an optimized upgrading procedure, it is important to understand the molecular diversity of such bio-oils since they are highly complex mixtures that contain tens of thousands of different compounds [8]. Accordingly, it is of tremendous importance to use cutting-edge tools for their evaluation. As a direct and efficient method, elemental analysis is commonly used to determine the overall composition of pyrolysis oils. Michael et al. [3] summarized the elemental composition of fast pyrolysis oils for various biomass feedstocks (pine, poplar, oak, etc.) from different regions, with varying mass fractions for carbon, hydrogen, oxygen, nitrogen and sulfur. Additionally, they found the ppm levels of K, Na and Cl. To address the bulk of the features in complex pyrolysis oils, infrared (IR) and nuclear magnetic resonance spectroscopy (NMR) have also been widely used [9,10,11]. However, being bulk methods, these analytical techniques show a lack of capability for revealing any information on a single molecule/compound level. Mass spectrometry, on the other hand, can detect individual compounds within a (complex) mixture. However, high mass resolving power and accuracy are typically needed for the analysis of complex mixtures that contain numerous isobaric compounds differing in mass by only a few mDa [12,13,14,15,16,17,18,19]. Prior to mass spectrometry, separation techniques such as liquid-liquid extraction [20] or liquid chromatography [21,22,23,24] can be used to simplify the complex mixture, which will ultimately increase the amount of information that can be gained from a given sample. One- or two-dimensional coupling between gas chromatography and mass spectrometry (GC×)GC-MS, which enables us to study structural details, has been widely used for complex mixture analysis and bio-oil upgrading [25,26,27]. However, these methods still show disadvantages in terms of separation efficiency when it comes to a wide variety of polar compounds in complex samples. Different response factors resulting in skewed abundances can always be limiting factors for in-depth compositional analyses when using all analytical methods with non-uniform responses.
ESI (electrospray ionization) in a negative mode has been widely used for the characterization of pyrolysis oils, considering their acidic character, while positive-mode ESI is more suitable for the analysis of basic compounds [28,29,30]. However, each single ionization technique generally shows the ionization discrimination for certain compounds. Therefore, multiple ionization techniques need to be considered for the comprehensive analysis of a complex sample [31,32,33]. In comparison with ESI, APCI (atmospheric pressure chemical ionization) and APPI (atmospheric pressure photo-ionization) are additional methods for the analysis of non- to medium-polar compounds, and are typically more suitable when ionizing compounds with aromatic moieties. Referring to the functionalities found in pyrolysis-derived biofuels, commonly both parts coexist: (1) polar sites including hydroxyl, carbonyl or carboxyl groups, and (2) non-polar sites including phenyl groups and aliphatic chains [34]. Based on the preferences provided by a single ionization technique, using diverse, complementary methods in combination with ultra-high resolution mass spectrometry can help to increase the compositions that are discovered and, therefore, provides a sound basis for in-depth data analysis. Fourier transform mass analyzers, ICR (ion cyclotron resonance) [35] and Orbitrap [36] are the most powerful mass analyzers in terms of mass accuracy and resolving power. In the past, only a few studies have dealt with the use of Orbitrap spectrometers for pyrolysis oil characterization, with few compositions discovered [37,38,39,40].
In this study, we assess the utility of different ionization techniques and the demand for mass resolving power for the characterization of pyrolysis-derived biofuels.
Three different ionization techniques (APPI, APCI and ESI) and two scan techniques (full and spectra stitching modes) at different transient times (0.38 s, 0.77 s, 1.53 s and 3.04 s at m/z 400) are compared in a detailed study of the molecular analysis of a biomass-derived pyrolysis fuel.

2. Materials and Methods

2.1. Sample Preparation

2.5 mg pyrolysis oil obtained from biomass was diluted with 10 mL methanol (LC-MS grade, J.T. Baker, Germany) to achieve a final concentration of 250 μg∙mL−1, which was used without further treatment.

2.2. Instruments and Methods

Mass spectra were recorded on a research-type Orbitrap Elite mass spectrometer (Thermo Fisher Scientific, Bremen, Germany) equipped with a standard ESI, APPI or APCI source. The mass spectrometer was externally calibrated prior to data collection, resulting in a mass accuracy error of less than 1 ppm. Spectra were collected in a positive mode using ESI, APPI or APCI and in a negative mode using ESI. For ESI measurements, the sample was infused at a flow rate of 5 μL∙min−1 and the ionization was performed at a needle voltage of 4 kV (positive mode) or 3.5 kV (negative mode). Additional parameters were sheath and auxiliary gas settings of 5 and 2 arbitrary units, a capillary temperature of 275 °C and an S-lens RF-level of 50%. In the case of APPI or APCI measurements, the sample was infused at a flow rate of 20 μL∙min−1, using a sprayer temperature of 350 °C with the sheath and auxiliary gas flow set to 20 and 10 (arbitrary units), respectively. For APCI, the discharge current was set to 5 µA. Photoionization was achieved using a Kr VUV lamp (Syagen Technologies, Tustin, CA, USA) with photon emission of 10.0 and 10.6 eV. Spectra were generally recorded at a resolving power of R = 960 k (FWHM at m/z 400) using spectral stitching (windows of 30 Da with 5 Da overlap) over a mass range of 100–1000 [41]. In the case of APPI measurements, additional experiments were performed at different resolution settings of 120 k, 240 k and 480 k and also using full-scan acquisition (R = 480 k).

2.3. Data Analysis

The acquired spectra were recombined (in the case of spectral stitching) and summarized using vendor software (Xcalibur 2.2, Thermo Fisher Scientific, Bremen, Germany). The summarized spectra were imported into Composer V1.5.0 (Sierra Analytics, Modesto, CA, USA) for recalibration and elemental composition assignment. The chemical constraints for assignment were chosen as C0–100H0–1000N0–3 O0–30Na0–1, with an allowed double bond equivalent (DBE) ranging from 0 to 40. The maximum allowed mass accuracy error was set to 1 ppm. The assignments of the most abundant ions were confirmed by their isotopic peaks. Ions were distinguished and denoted as X[Y] (with Y = H or Na). The assigned molecular formulas were sorted into heteroatom classes and exported to MS Excel 2016 (Microsoft Corporation, Redmont, WA, USA) and Origin (OriginLab, Northhampton, MA, USA) for data evaluation and figure preparation. Replicate analyses were performed using the online tool VENNY 2.1 [42] and associated plots were created with the Venn Diagram Plotter (PNNL, Richland, WA, USA) [43] from calculated data.

3. Results

Studying the complexity of pyrolysis biofuels is a challenging task. The wide range of combinations of C, H and O atoms per molecule, together with occasionally present N or S atoms, results in an extremely complex compositional mixture. The compounds present in a pyrolysis fuel are also spread over a wide range of polarities and abundances. The elucidation of as many elemental compositions as possible from such a complex mixture, by mass spectrometry, requires a high resolving power as well as a good instrument sensitivity.
As we have previously shown, the research-type Orbitrap Elite applied in this study can reach a resolving power of R = 960 k (FWHM at m/z 400) [44]. Improved sensitivity can be gained by using the spectral stitching method. In comparison with full scan acquisition, it reduces the sample complexity per scan, thus allowing a higher accumulation rate for less abundant compounds.
Given the presence of highly oxidized compounds (up to O26, as seen below) in a pyrolysis fuel, some critical mass splits need to be addressed to gain a good coverage of elemental compositions. These splits include the mass difference between H4O5 and C7 (∆m = 5.9 mDa), as well as between C18 and H8O13 (∆m = 3.5 mDa) [13]. A first overview of the different mass spectra within the mass range of 917.305 to 917.335 Da [13] (a) indicates that the amount of information changed depending on the resolution settings. A single peak, observed at the low resolving powers of 120 k and 240 k, split into four peaks at 960 k. Four more compositions were detected at 960 k, all of which were distinct signals that were lost at lower resolution settings. The most interesting discovery was that, at a mass range of above 900, some of the more difficult mass splits could be separated when using the high-resolution settings of 960,000. Here, both the split between C18 vs. H8O13 (mass difference of 3.5 mDa) and the much smaller split between H12O18 vs. C25 (2.4 mDa) could be separated. This is especially important when studying a biofuel that is not upgraded since here, still, a high number of oxygen atoms can be present, which are drastically reduced after hydration.
Generally, using APPI(+) as an ionization technique yields both radical cations and protonated molecules, by either charge or proton transfer. Figure 1b demonstrates the number of assigned compositions among different resolving powers and scan techniques for APPI. The result at a resolution of 480 k shows that spectral stitching measurements gave more than five times the number of detected compositions (16,793) in comparison with full scan acquisition (only 3013). Even in comparison with the spectral stitching result from the lowest resolution setting at 120 k (7385 detected compositions), full scan acquisition cannot yield the same amount of information. When using the highest resolution setting of 960 k, an additional increase in detected compositions of around 30% was obtained. It must be noted that mass spectrometry with mild ionization techniques cannot distinguish different isomers, i.e., the actual number of detected compounds (in comparison to compositions) will be much greater. Given these results, it is clear that a maximum of both instrument sensitivity and mass resolving power is needed for a comprehensive analysis of pyrolysis-derived fuels. For the remainder of this study, therefore, only results from spectral stitching acquisitions at resolution settings of 960 k are considered.

3.1. Ionization Effects

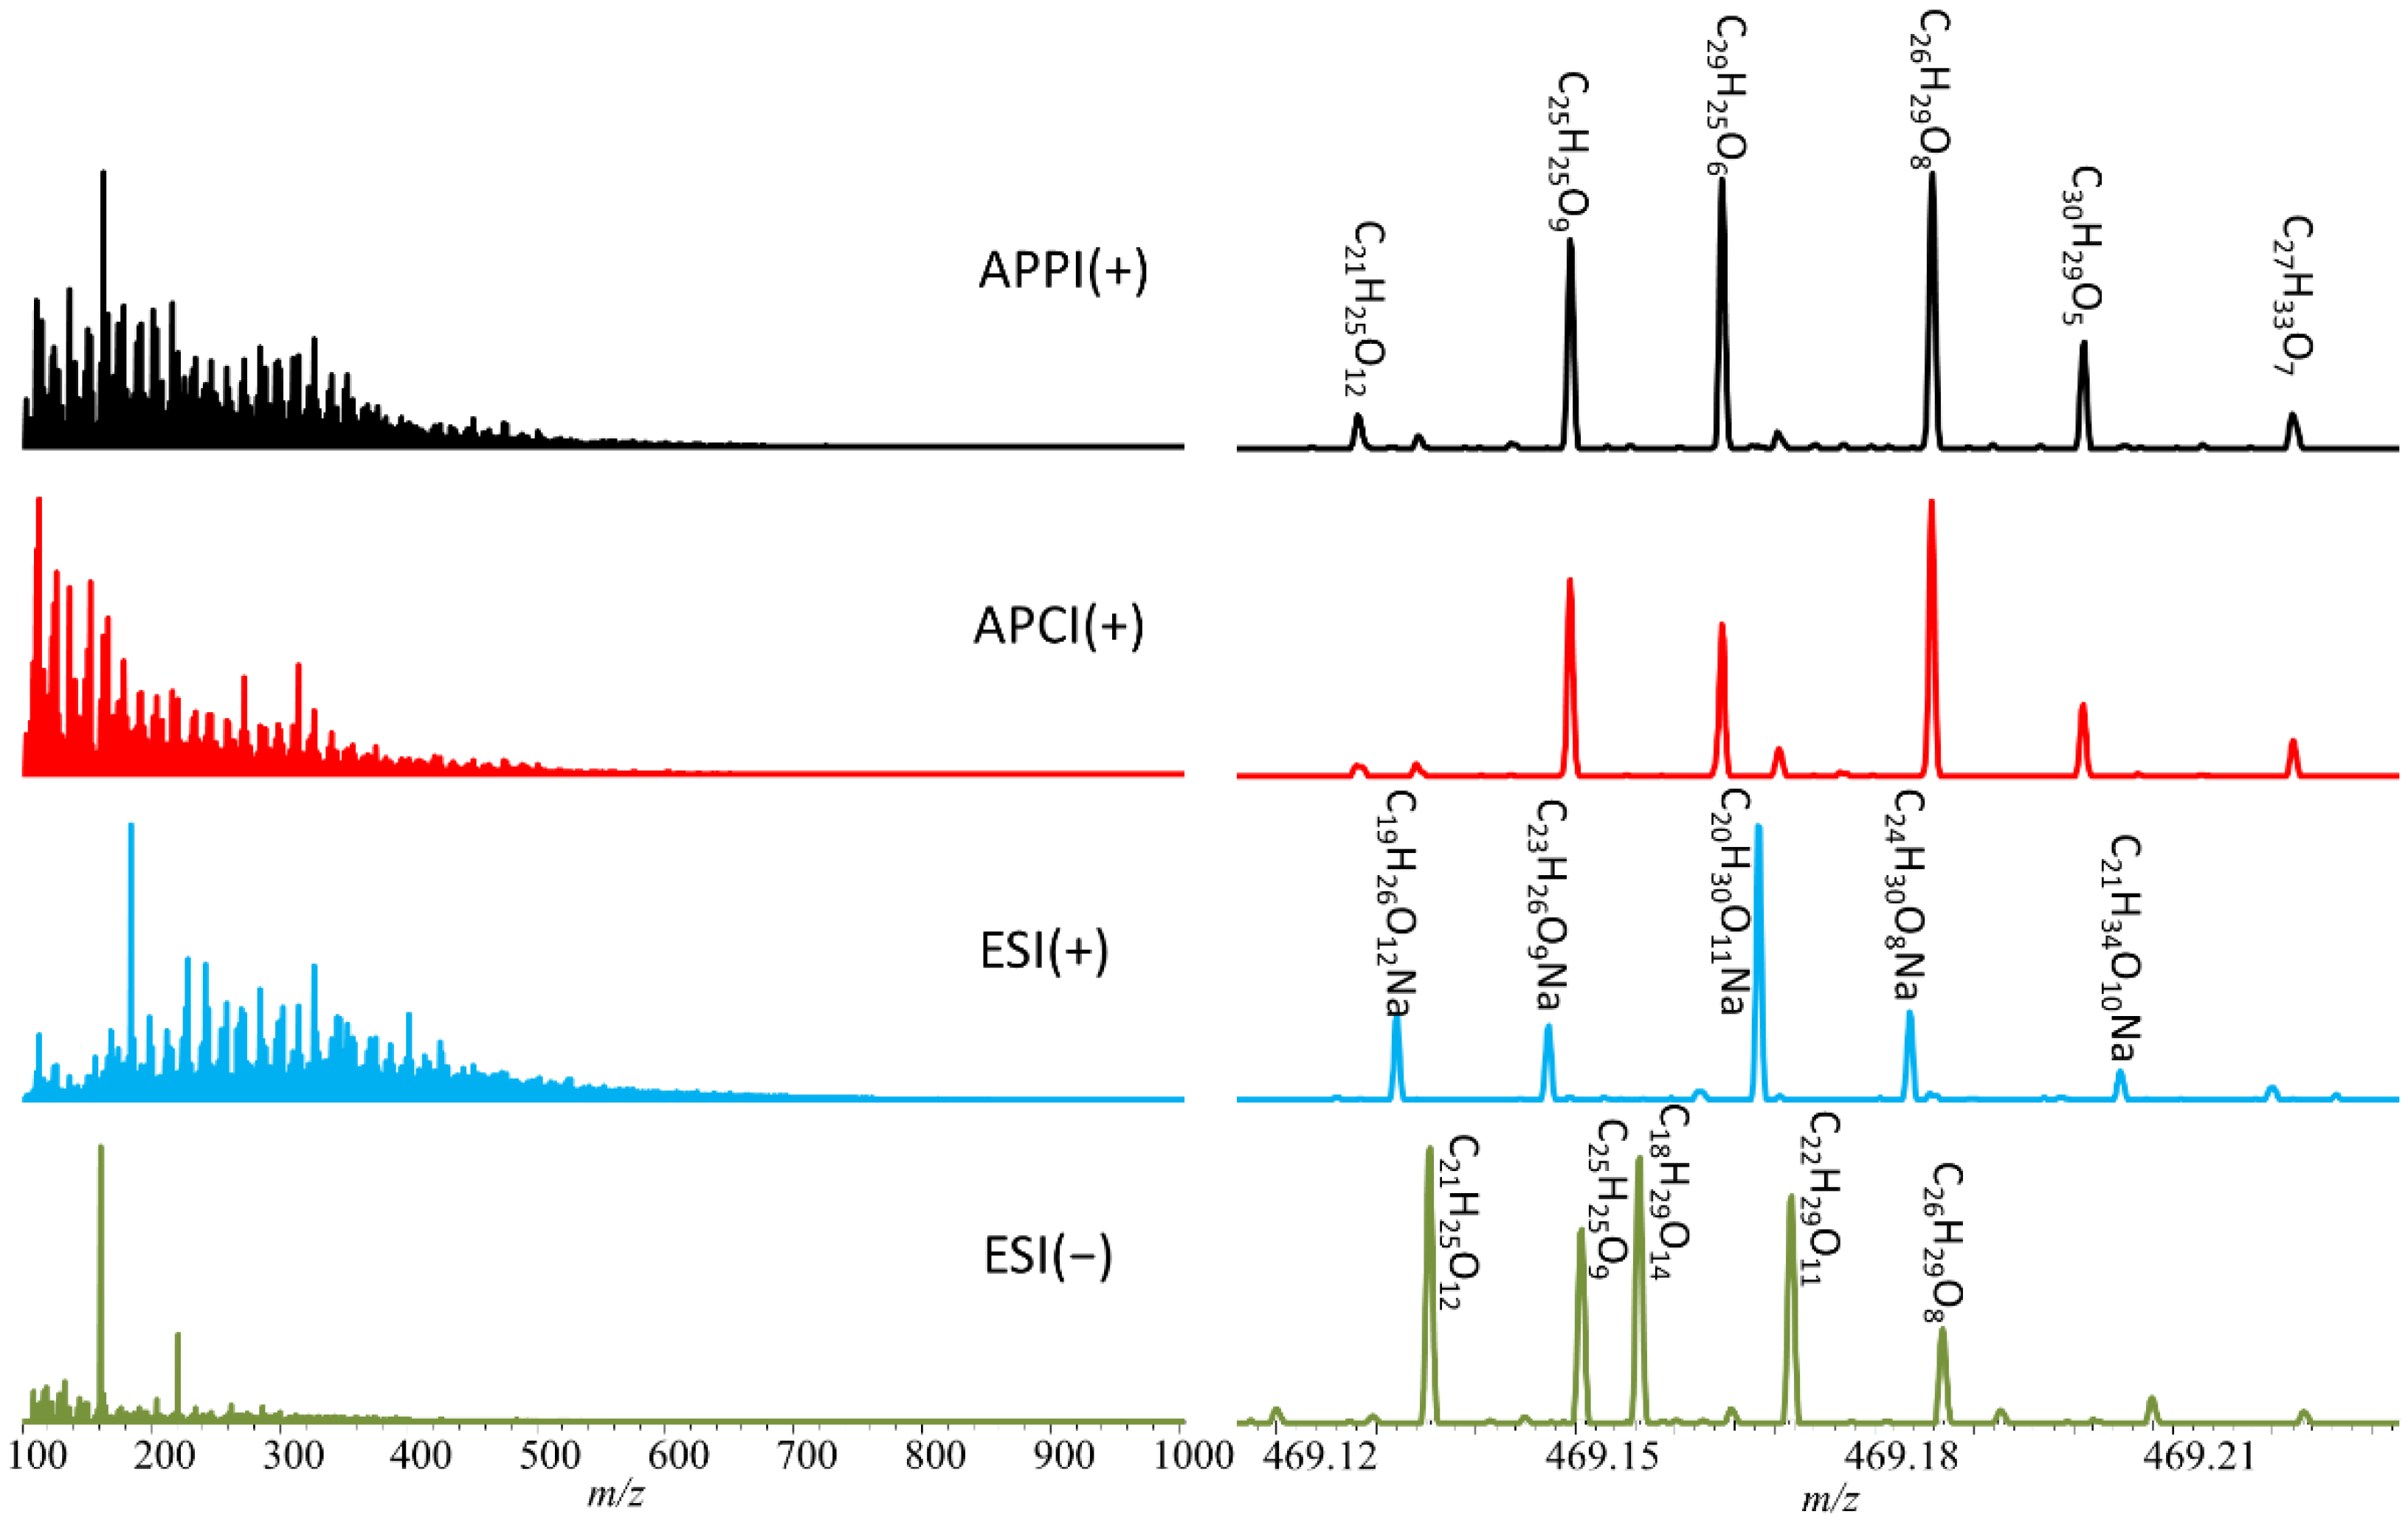
The results of a complex mixture characterization by mass spectrometry are highly dependent on the ionization technique applied for the study. For a broad view of the sample, it has been shown that multiple ionization techniques are required, due to the discrimination effects present for any single method [45]. In this study, four different ionization methods, APPI and APCI both in a positive ionization mode and ESI in both the positive and negative ionization modes are investigated. As can be seen from Figure 2, the mass spectra from each ionization technique are completely different, including the observed base peak of the highest intensity. This is observed at m/z 163.0756 for APPI(+), 113.0598 for APCI(+), 185.0423 for ESI(+) and 161.0457 for ESI(−), corresponding to the compositions of [C10H10O2+H]+, [C6H8O2+H]+, [C6H10O5+Na]+ and [C6H10O5-H], respectively. A mass scale-expanded segment around m/z 469.18 in Figure 2 gives a more detailed view of the differences between the individual methods. APPI(+) and APCI(+) show a similar pattern of major peaks belonging to protonated molecules from the Ox class. In ESI(+), sodium adducts are mostly observed throughout the entire spectrum, as can be expected from highly oxygen-containing compounds. In ESI(−), major peaks are detected as deprotonated molecules, as expected, probably associated with carboxylic acids.
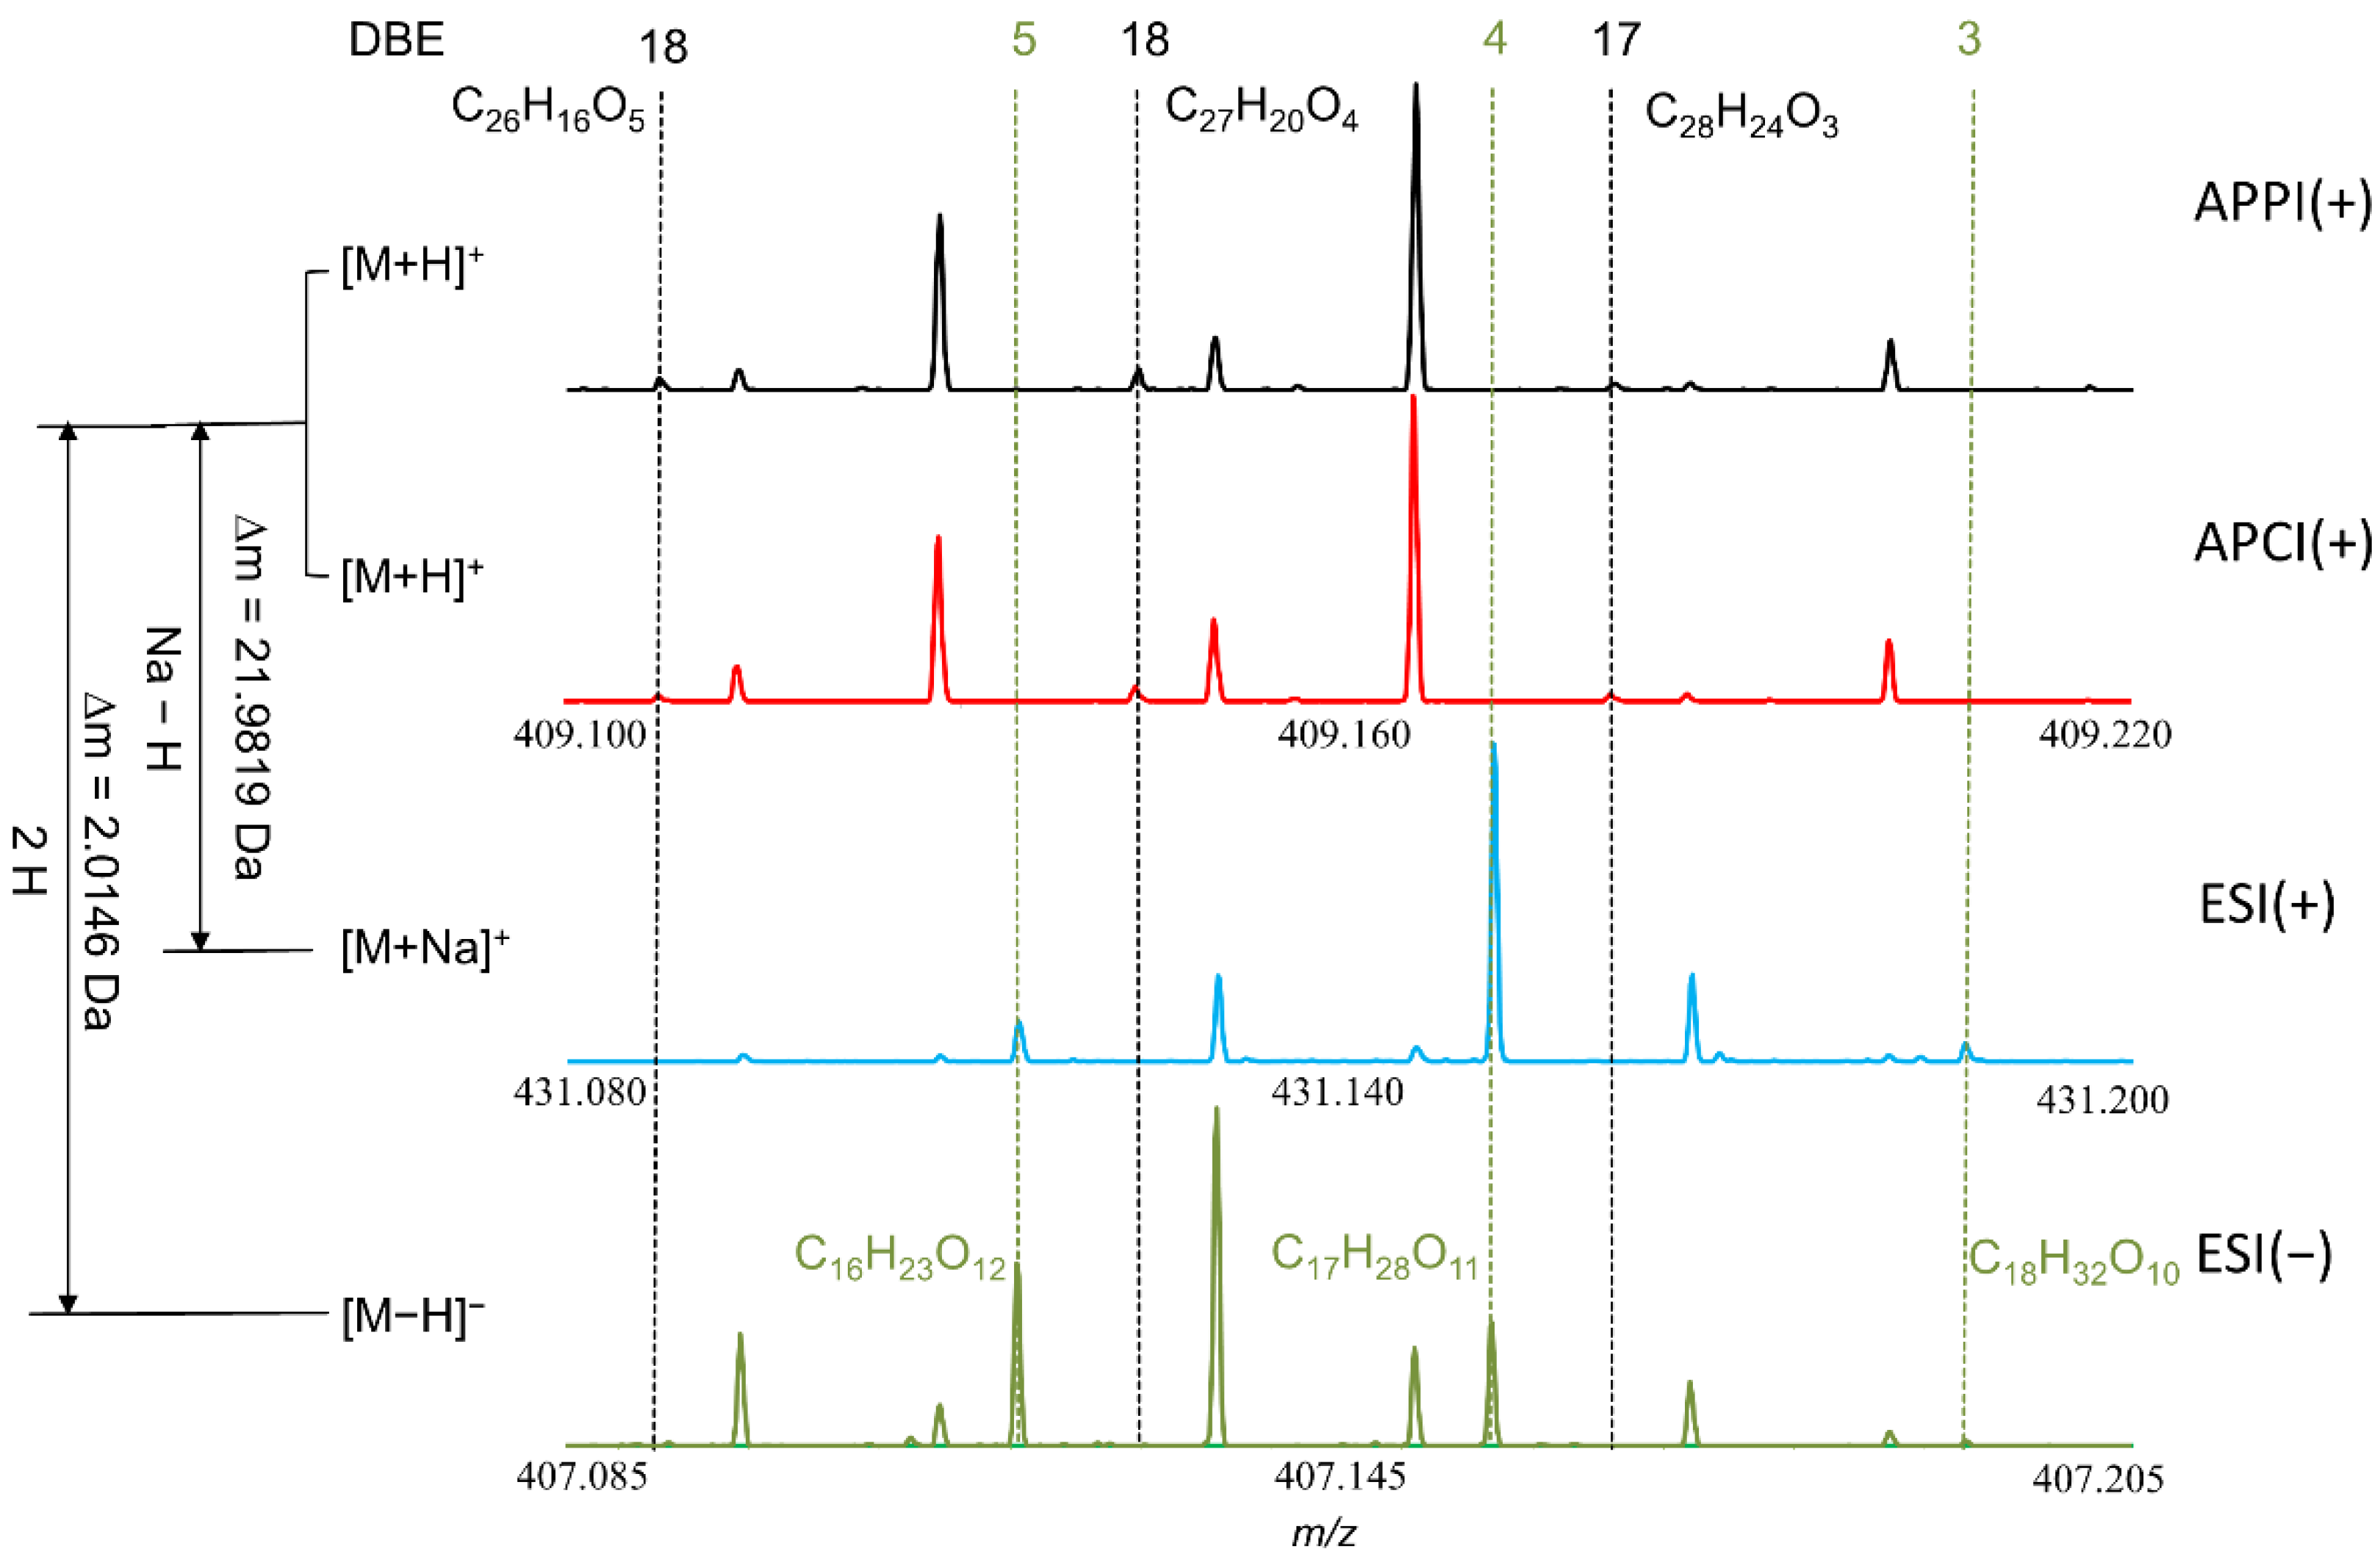
A more compound-centred way to assess these differences in ionization is shown in Figure 3. Considering the protonated species detected by APPI and APCI at m/z 469, the figure shows the portion of the corresponding spectrum for positive- and negative-mode electrosprays, where a compound of the same composition would be detected as a sodium adduct (positive mode, ∆m = m(Na) − m(H) = 21.9819 Da) or proton-abstracted molecule (negative mode, ∆m = −2∙m(H) = −2.0146 Da). A clear difference can be observed for these mass spectra. The assigned compositions C26H16O5, C27H20O4 and C28H24O3 are only detected in APPI(+) and APCI(+). The corresponding compounds contain low amounts of oxygen (5, 4 and 3 atoms, respectively) but show high DBE values (18, 18 and 17, respectively). DBE is the number of ring closures and double bonds in a molecule and can be associated with the aromaticity of a compound. Some compositions with high amounts of oxygen but low DBE values (C16H23O12 (DBE 5), C17H28O11 (DBE 4) and C18H32O10 (DBE 3)) are only detected in ESI(+) and ESI(−). A high amount of oxygen atoms in a molecule typically goes along with high polarity, rendering ionization by ESI more probable. Additionally, oxygen as an effective Lewis base easily interacts with sodium cations to form adducts in the positive mode. Also, a high degree of oxidation is often related to the presence of phenolic moieties, in the case of aromatic compounds or carboxylic groups, which allows the corresponding compounds to be easily deprotonated in negative-mode ESI.
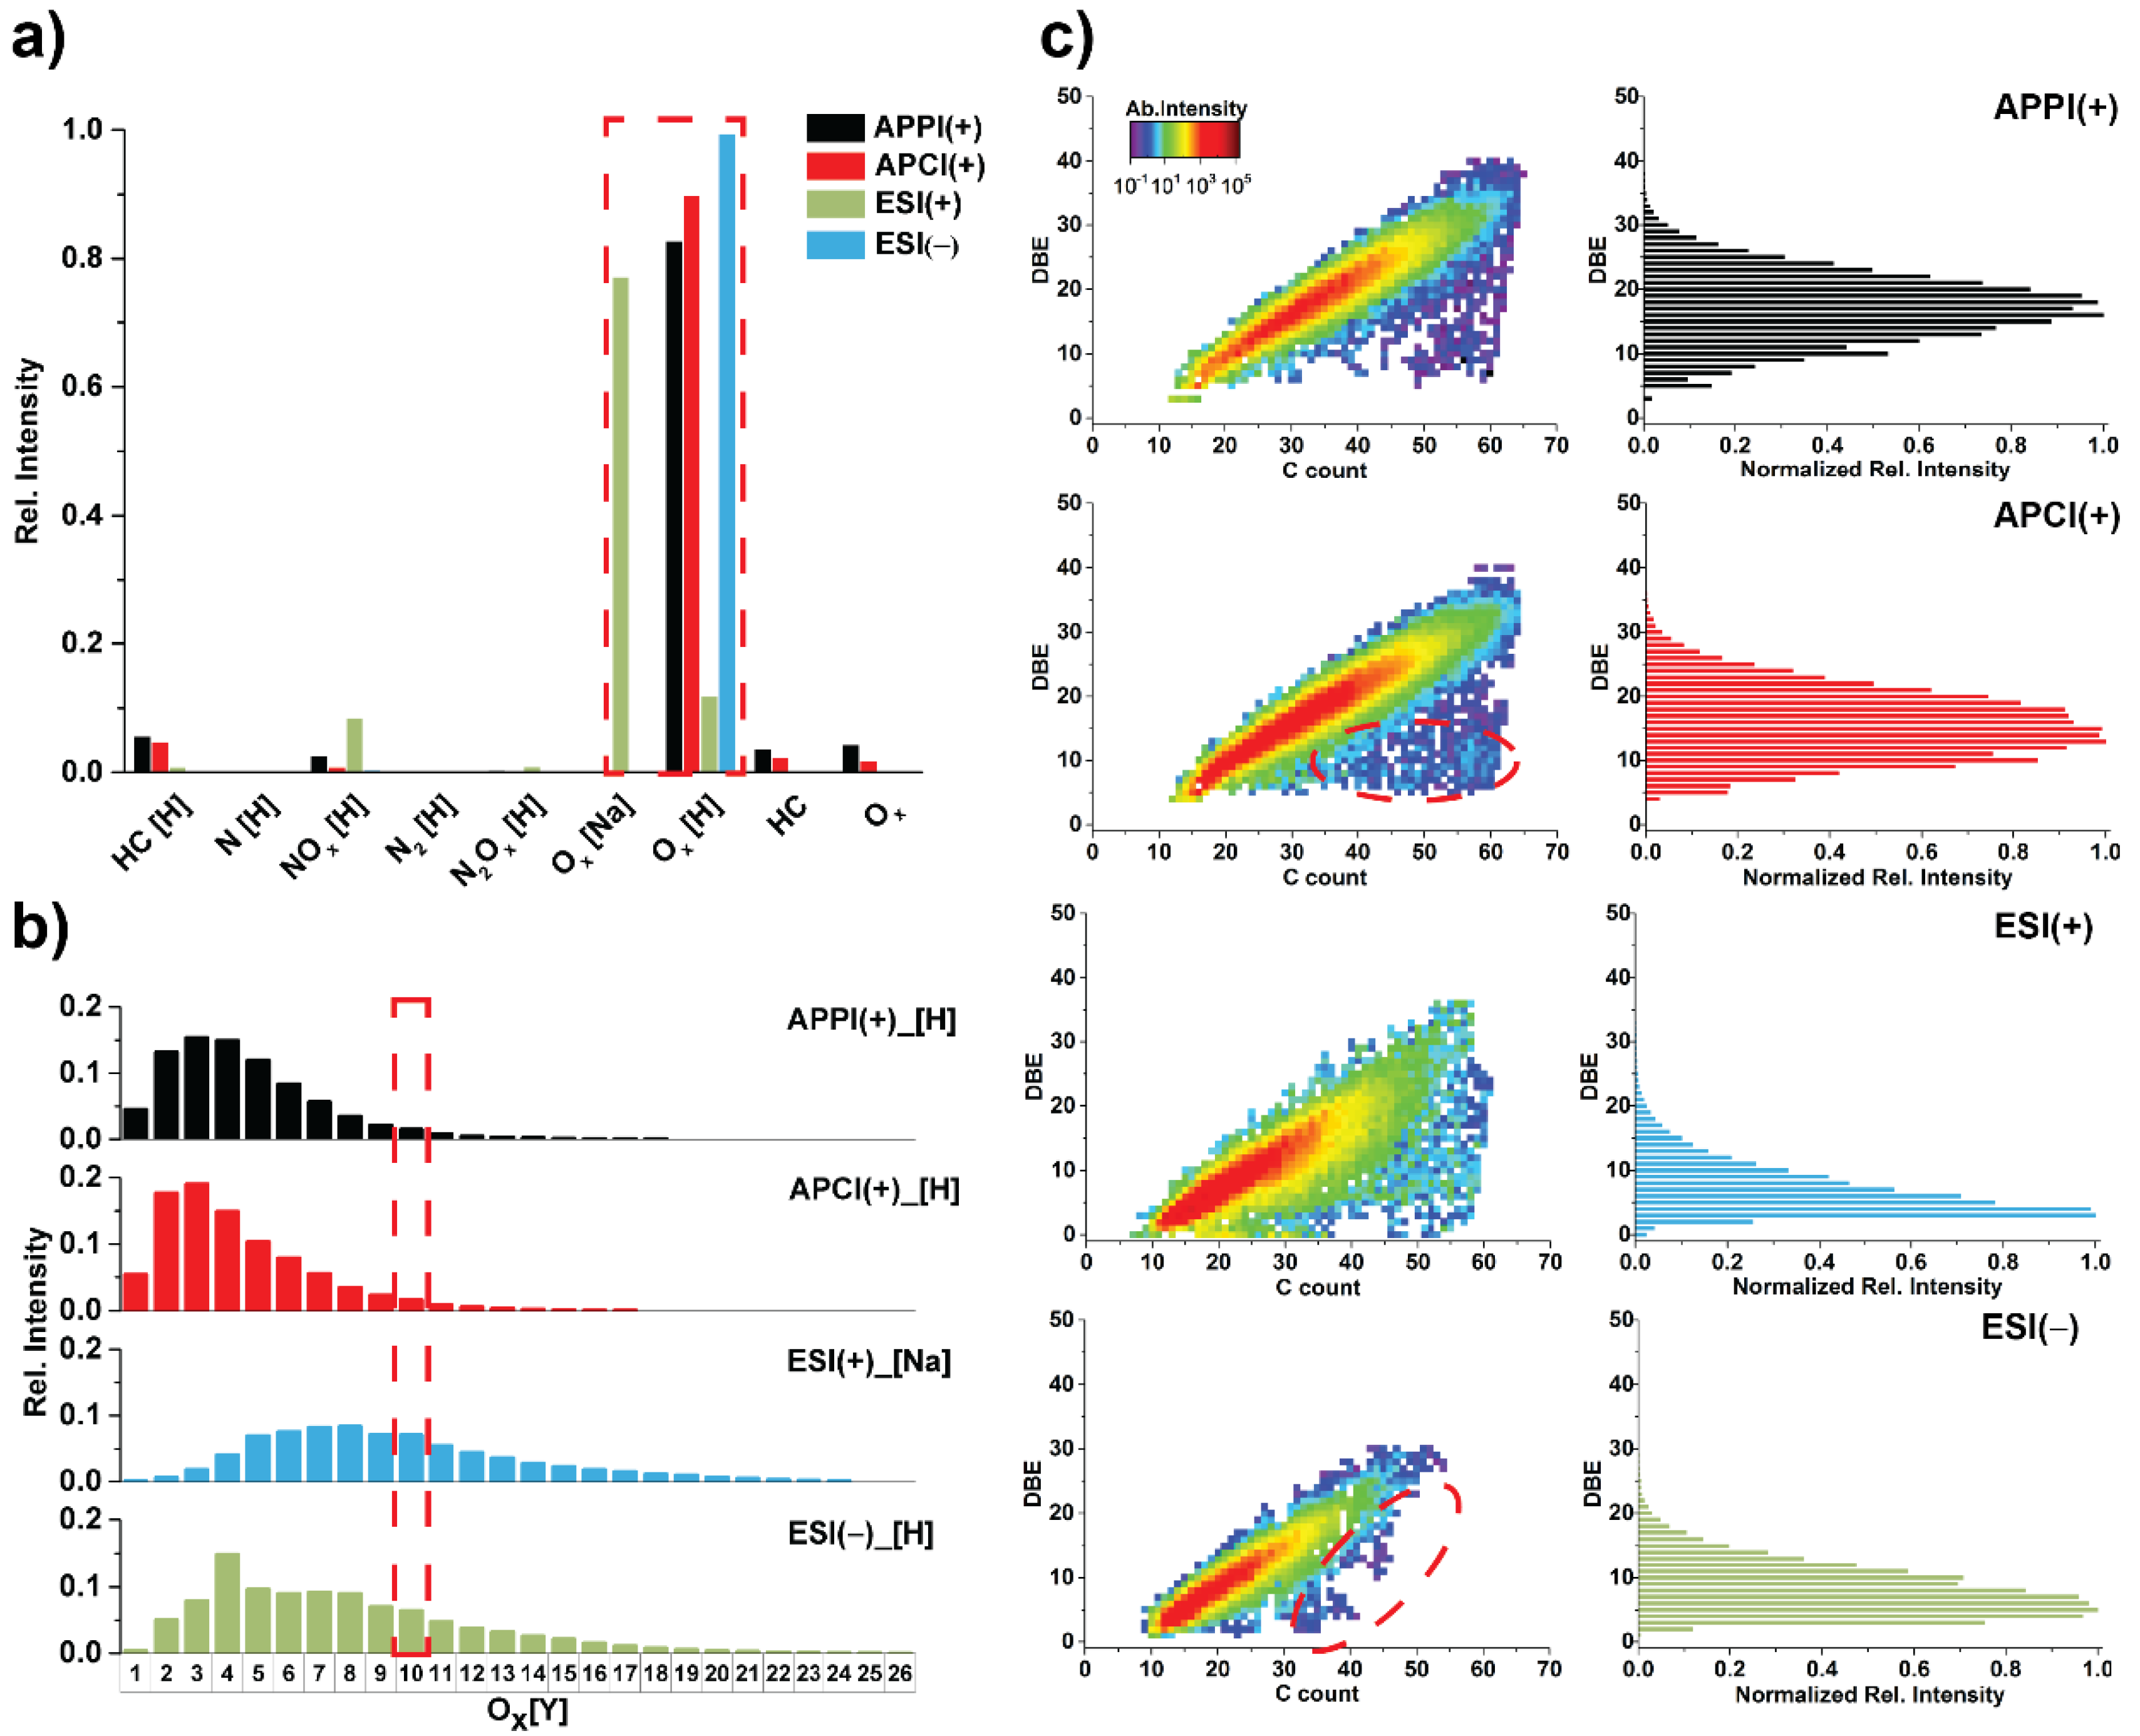
The assigned compositions for each ionization method are summarized and displayed in intensity-based class distributions in Figure 4a. No matter which ionization method was applied, the oxygenated species were detected as the most abundant classes. With ESI(−), the highest relative intensity of oxygenated species was detected with a contribution of 99.5%. For APPI(+) and APCI(+), the Ox species contributed 87.2% (protonated molecules: 82.8%, radical ions: 4.4%) and 91.7% (protonated molecules: 89.9%, radical ions: 1.83%) to the overall intensity, respectively. For positive ESI, Ox species were detected both as sodium adducts and as protonated molecules, which contributed 89.0% (sodium adducts: 77.1%, protonated molecules: 11.9%) to the total intensity. Heteroatom-free hydrocarbons were easier to detect with positive APPI (protonated molecules: 5.7%, radical ions: 3.8%) and APCI (protonated molecules: 4.8%, radical ions: 2.4%) than with ESI (protonated molecules: 0.9%), which indicates that in ESI, the large quantity of polar compounds discriminates against non-polar aromatic compounds. However, NxOy species (especially for NOx) showed the reversed case, with contributions of total ion current equal to 2.7%, 0.9% and 8.6% for positive APPI, APCI and ESI, respectively.
For the most abundant Ox species, which contribute around 90% to the total intensity, all ionization techniques provided data demonstrating a wide range of Ox distributions (Figure 4b). The maximum number of oxygen atoms per molecule observed by ESI was 24 (sodium adduct) in the positive and 26 in the negative mode, while for APPI(+) and APCI(+), only up to 18 and 17 oxygen atoms per molecule were detected, respectively. The Ox distribution was more widely spread and shifted to higher oxygen numbers for ESI than for APPI and APCI. This can be attributed to ESI being better capable of detecting polar compositions than APCI and APPI. Moreover, a higher amount of oxygen per molecule was detected here compared to data from recent reports [46]. This is most likely due to the increased sensitivity offered by the spectral stitching scan method and the ultra-high resolution applied in this study. Median and mean oxygen to carbon (O/C) values for the detected compositions are shown in Table 1. Slight differences between the median and mean values were observed throughout the ionization methods, with the median being slightly lower, by 0.01–0.04. In accordance with the previous discussion, significant differences were discovered for the Ox species. APPI and APCI showed the lowest median O/C values, with the results for ESI being significantly higher, with 0.29 (median over sodium adducts and protonated molecules) for the positive and 0.35 for the negative mode. In the positive mode, sodium adducts displayed a higher value than protonated molecules, by 0.06, which was in line with the tendency of oxygenated compounds to preferably form sodium adducts.
By going down to the molecular level within an individual class, more detailed information can be gained to understand how different ionization methods work. Figure 4c shows the O10 class, as an example, with plots of DBE vs. C-count (number of carbon atoms per molecule) and corresponding histograms of DBE vs. normalized intensity. Compared to APPI(+), the results for APCI(+) showed slightly greater assigned compositions at relatively low DBE, but with high carbon numbers. This was in agreement with the greater capability of APCI(+) to ionize aliphatic hydrocarbon moieties. The corresponding signals, however, were not of high intensities, such that the DBE histogram plots are, overall, comparable. APCI(+) and APPI(+) show similar DBE distribution patterns, with DBE values ranging from 4 to 40 for APPI(+) and 3 to 40 for APCI(+). Also, the highest intensities are observed in similar DBE regions for APCI(+) (13) and APPI (+) (16). With ESI(+), a similarly large quantity of compositions, as with APCI(+), was detected. This can be attributed to the high oxygen content that makes the molecules more polar, which results in a strong affinity to sodium ions for ionization. In contrast, ESI(−) showed the least number of detected compositions. Compared to APPI and APCI, ESI shows a significant DBE shift. ESI(+) and (−) both ionize compositions at lower DBE values (minima of 0 and 1, respectively), with the highest intensities observed at 5 and 3, respectively. Biomass is mainly composed of three components: lignin, cellulose and hemicellulose. Pyrolytic biofuel, therefore, can contain large amounts of phenolic and carbohydrate-derived compounds. Based on our results, the ionization efficiencies of the different ionization techniques are associated with distinct chemical properties. APPI(+) and APCI(+) are more capable of ionizing lignin-derived phenolic compounds with relatively high DBEs. The carbohydrate-derived compounds from cellulose and hemicellulose are more easily ionized by ESI.

3.2. Total Unique Compositions with Complementary Ionization Techniques

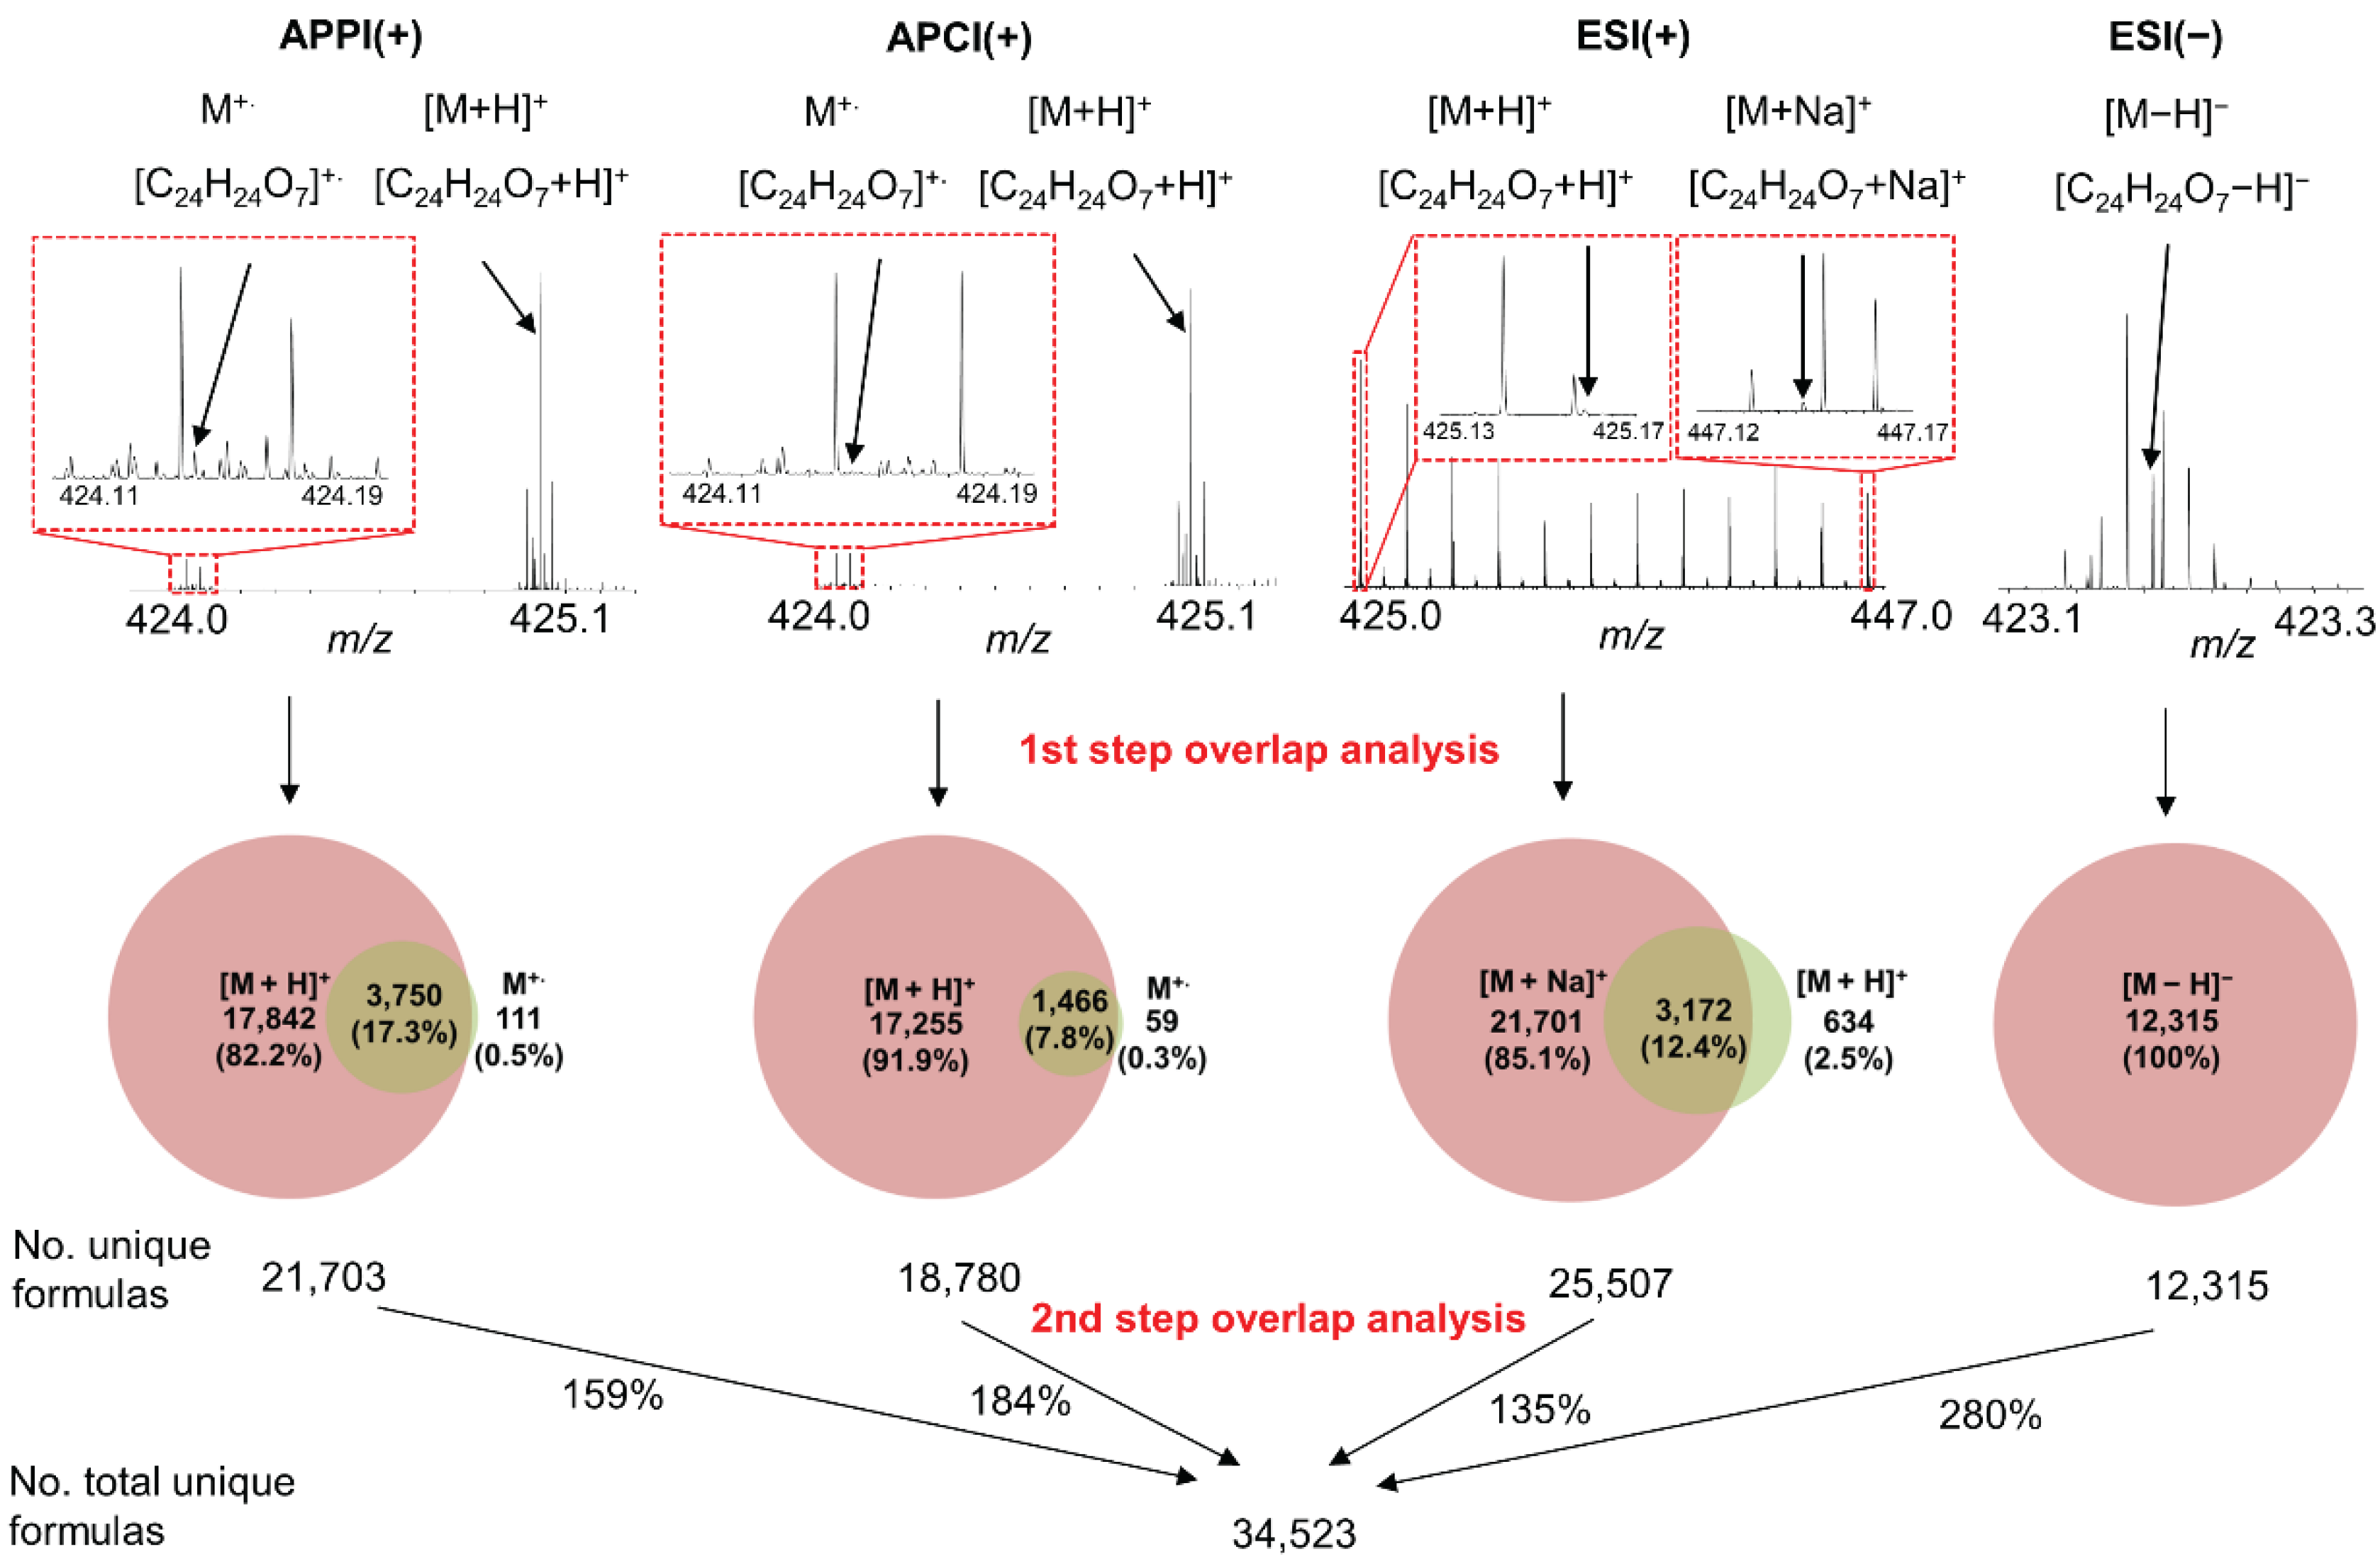
As discussed above, different ionization methods yield different results regarding the elemental compositions that are observed. This greatly improves the compositional coverage of pyrolysis-based biofuels. However, there are possible overlaps that need to be taken into account. Firstly, a given ionization method can yield different ion species from the same elemental composition (or compound). For example, a compound can potentially be detected as both a radical ion and protonated molecule when using APPI(+) or APCI(+). This presents an undesirable increase in spectrum complexity. Similarly, with ESI(+), compounds can be detected as protonated molecules and/or as sodium adducts (or different adducts, depending on the compounds and the matrix). Secondly, a given compound might be detected with more than one ionization method. To deal with these effects, a two-step replicate overlap analysis is used. The result is shown in Figure 5. The first overlap analysis is applied to each single ionization technique. The results are depicted as Venn diagrams. For example, in APPI(+), 21,592 compositions are detected as protonated molecules, 3750 of which are also detected as radical cations. A further 111 compositions are exclusively detected as protonated molecules, giving a total of 21,703 different elemental compositions of analytes that are detected (unique formulas). The corresponding totals for APCI(+), ESI(+) and ESI(−) are 18,780, 25,507 and 12,315, respectively. In a second overlap analysis, the replicates obtained by different ionizing techniques are trimmed to an overall total number of 34,523 unique compositions detected. Compared to the results obtained from the single ionization methods for APPI(+), APCI(+), ESI(+) and ESI(−), this corresponds to an increase in coverage of 159%, 184%, 135% and 280%, respectively.
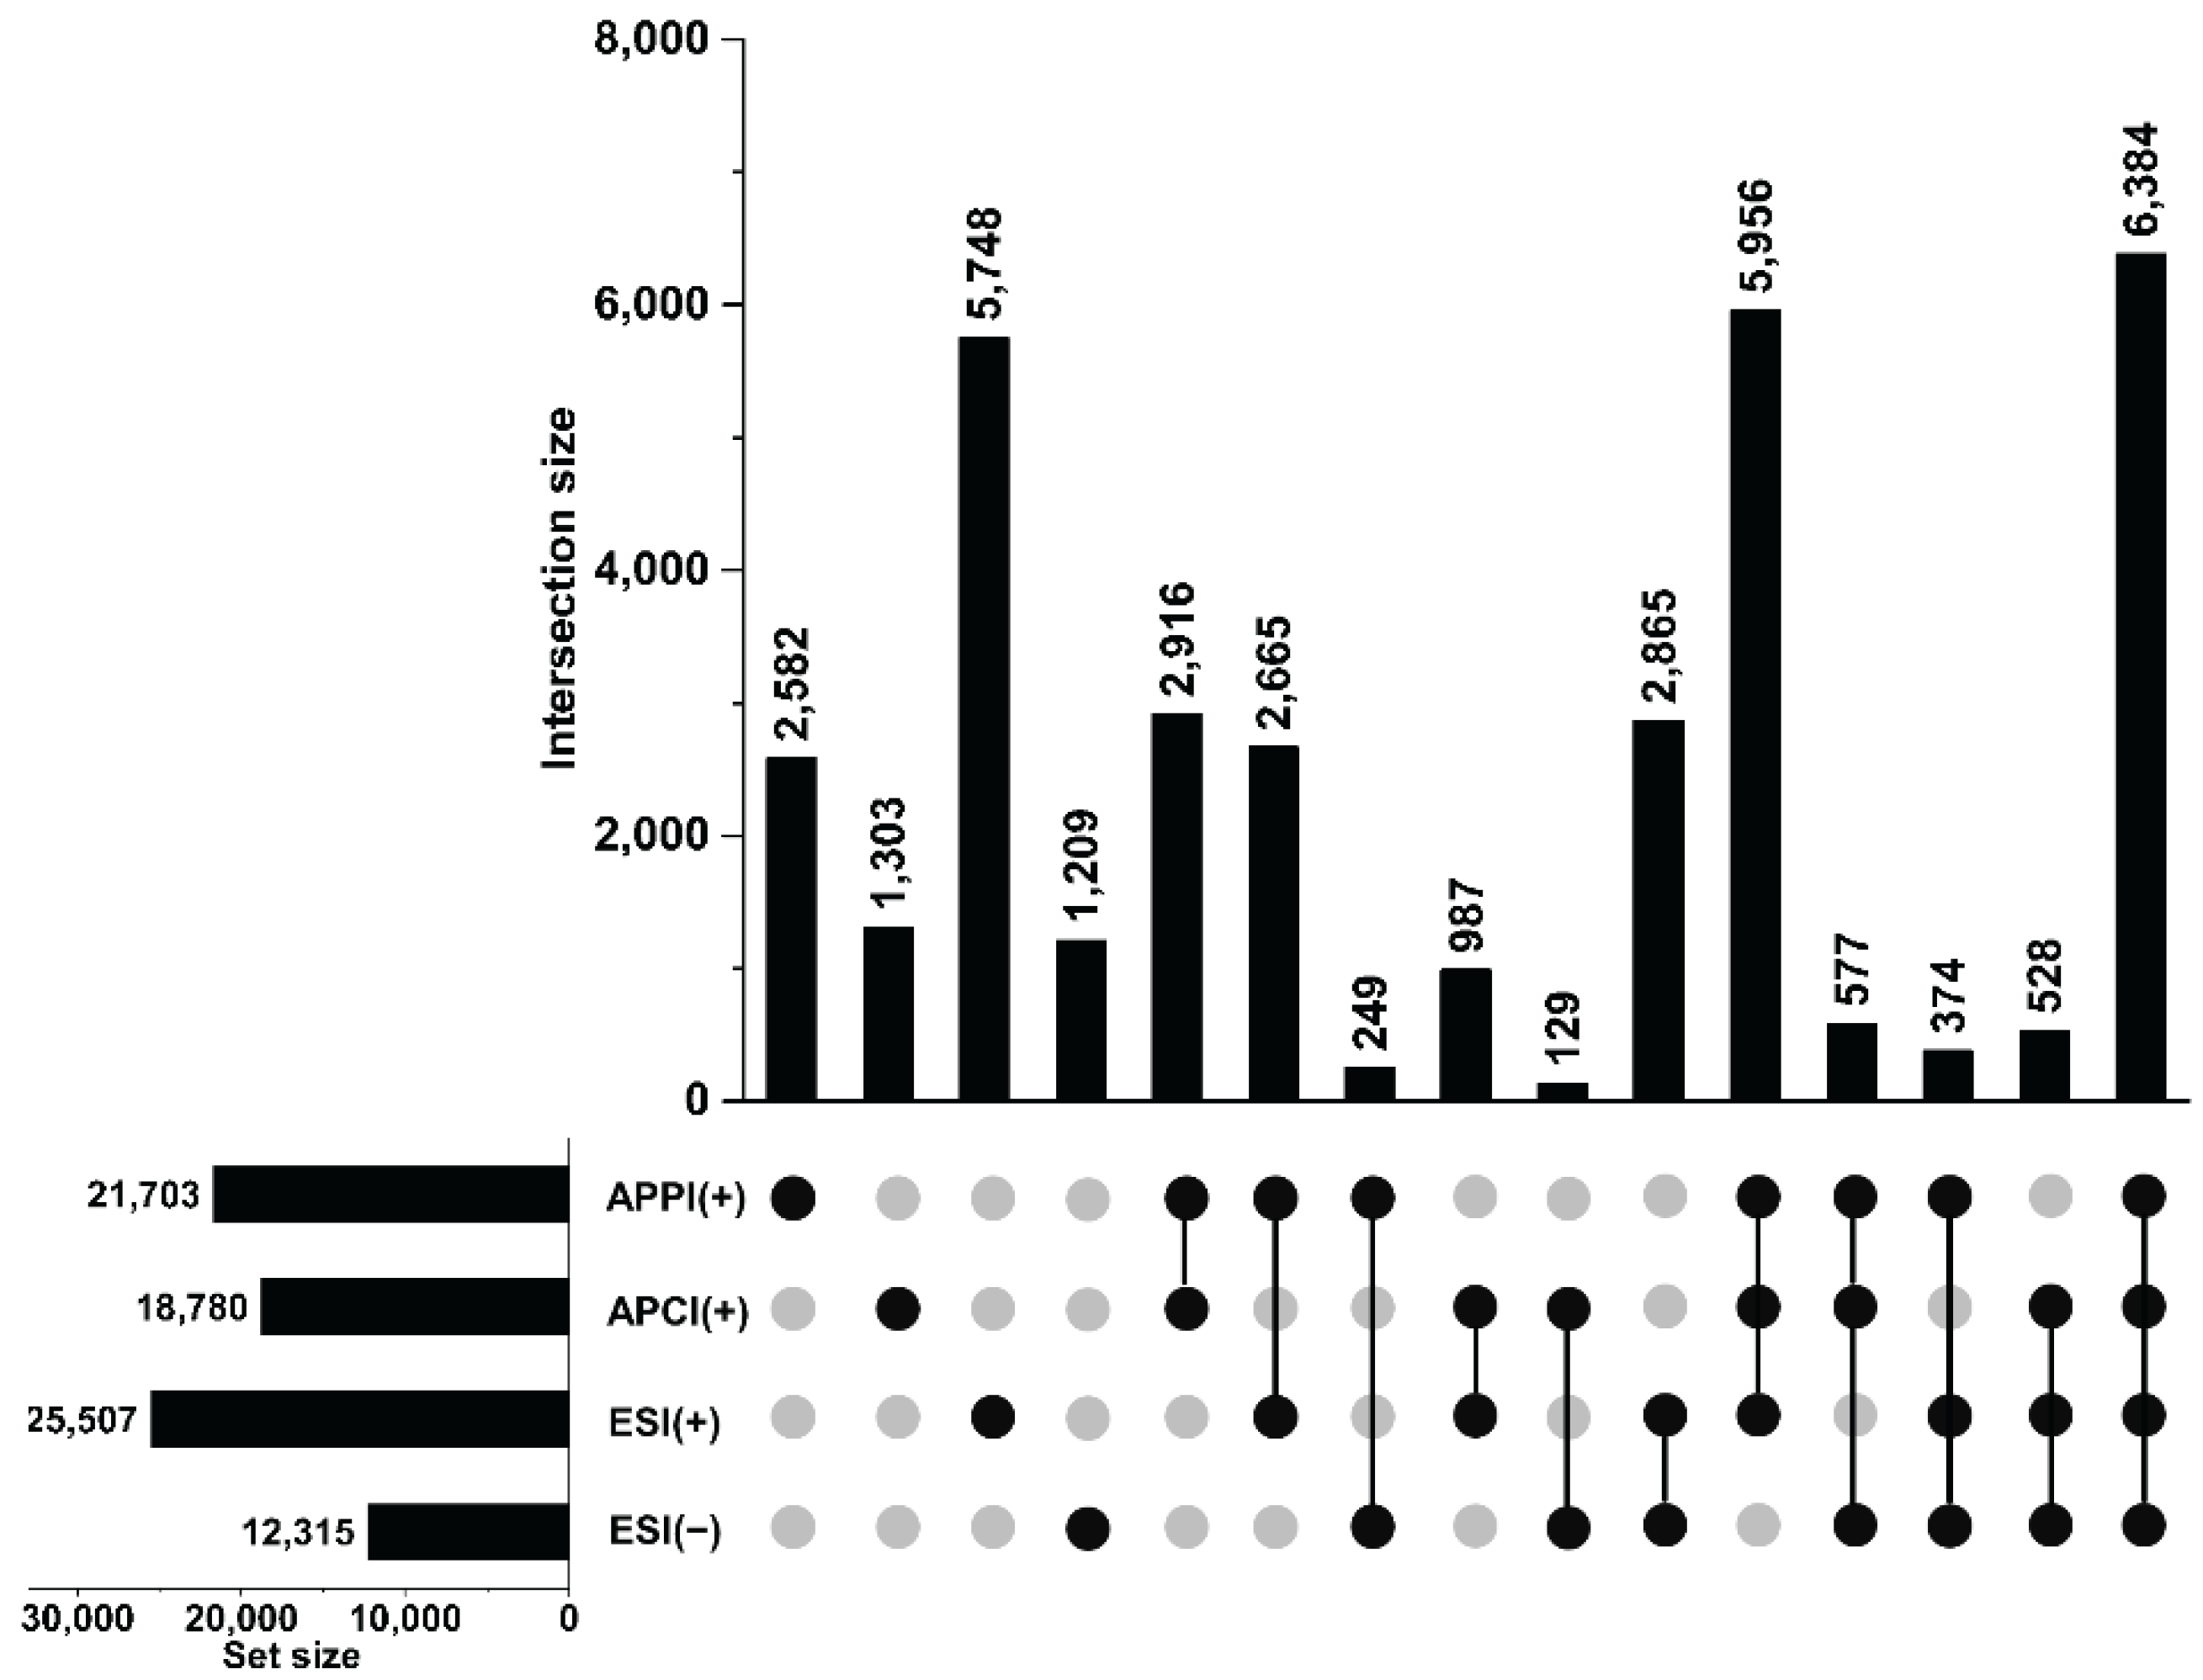
The composition overlaps between different ionization methods are depicted in Figure 6. The set-size plot on the left-hand side states the number of unique compositions found for each ionization method (see Figure 5). The top bar chart shows the number of compositions detected among all methods, indicated by black bullets at the bottom (intersection result). Among all ionization techniques, ESI(+) shows the most uniquely assigned compositions, while ESI(−) gives the least unique assignments (5748 vs. 1209 compositions). APCI(+) and ESI(−) provide the smallest pairwise intersection, with 129 compositions, while the largest overlap is observed between the APPI and APCI (2916) assignments. There are 6384 compositions that are observed with all ionization techniques. These correspond to compounds that exhibit multiple functionalities, such as aromatic moieties, phenols, hydroxyl and/or carboxyl groups within the same molecule, rendering them amenable to all ionization methods used. Alternatively, these correspond to different, isomeric compounds present in the mixture. Both cases apply to a certain extent.
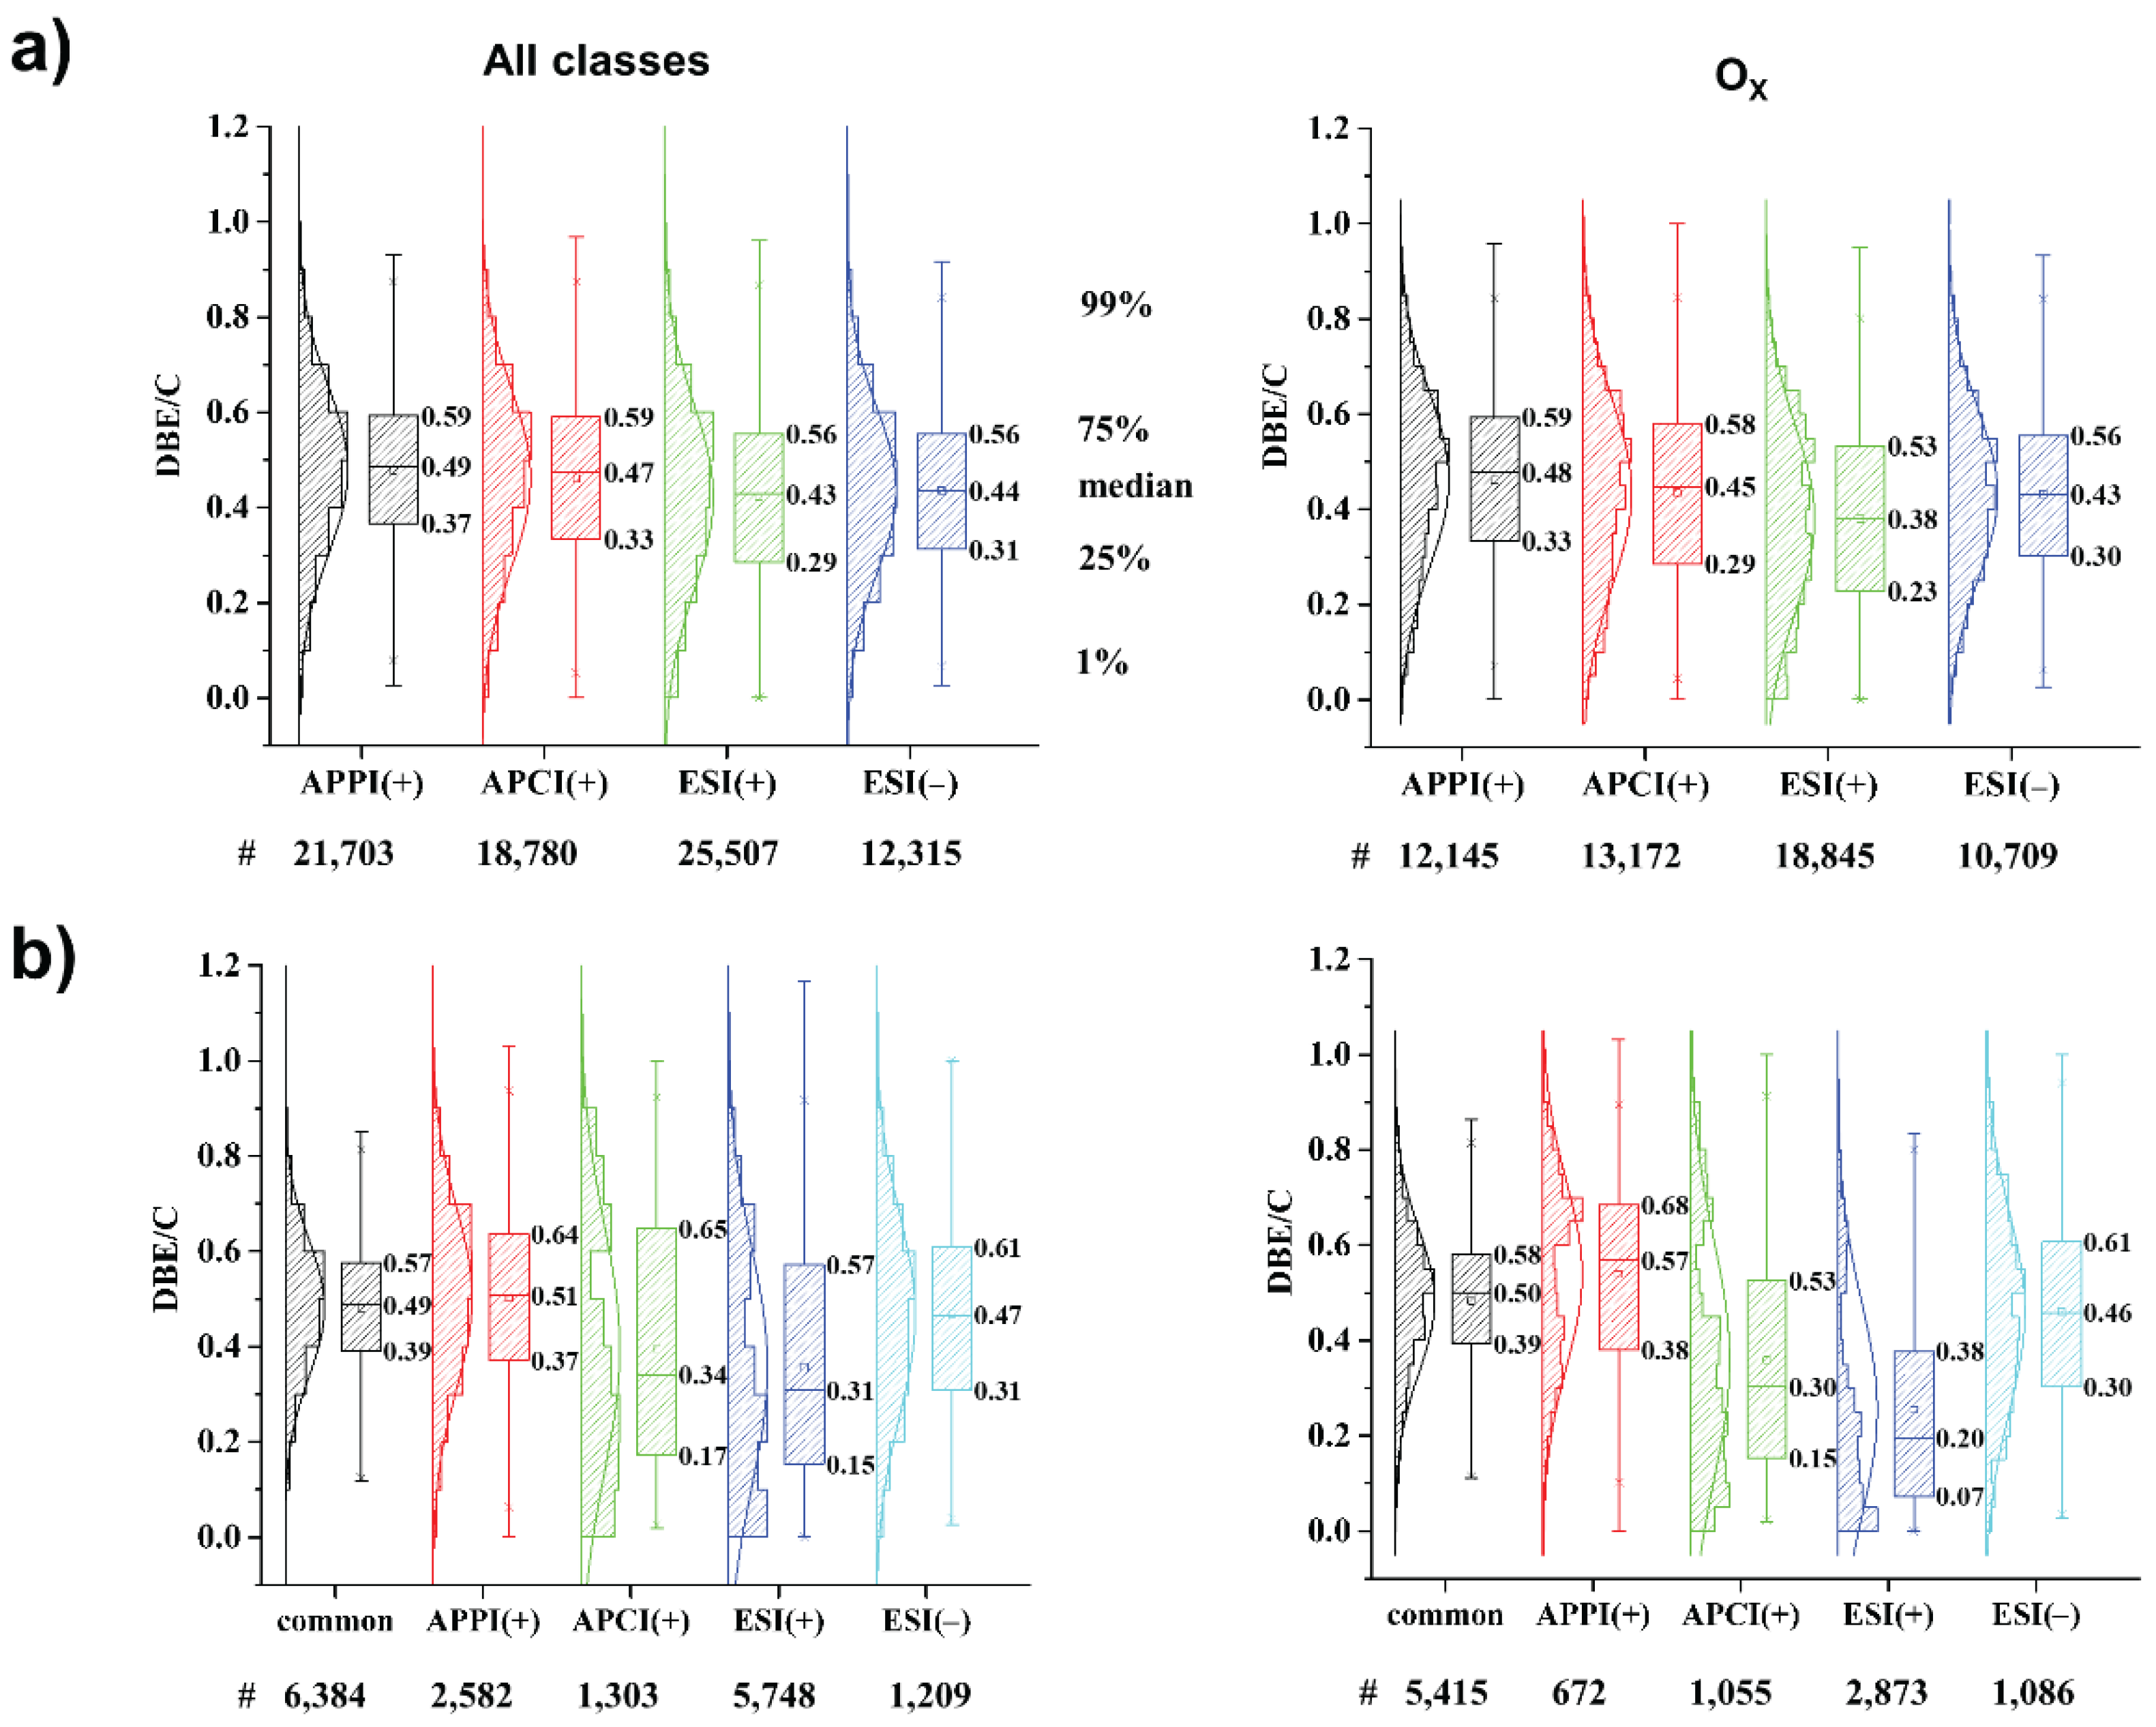
Differences in the uniquely detected compositions for each ionization method are shown in histogram boxplots of the DBE/C (ratio of DBE and number of carbon atoms within a given molecule) in Figure 7a. The overall results after the first step of overlap analysis are relatively similar, with median DBE/C values of 0.49, 0.47, 0.43 and 0.44, respectively. After the second step of overlap analysis, the DBE/C value differences for uniquely detected compositions has widened into the range of 0.03–0.2 (Figure 7b). The compositions common among all methods still show a relatively high median DBE/C value of 0.49. The value for APPI(+) (0.51) is now significantly higher than that for APCI(+) (0.34). This can be attributed to the difference in ionization, with APCI being more capable of ionizing aliphatic moieties than APPI, which is more efficient for aromatic compounds. ESI(+) shows the smallest median DBE/C value of 0.31, which can be attributed to hydrocarbon-derived components being easily ionized by this method. Taking into consideration only oxygen-containing species, as the most abundant classes in pyrolytic biofuels (right-hand side of the figure), a similar trend is shown.

4. Conclusions

In this work, a comprehensive analysis was performed to study the complexity of pyrolysis-derived biofuels. As was demonstrated using different resolution settings and scan methods, utmost instrument performance is a crucial aspect of pyrolysis oil analysis. By using resolving power settings of 960 k (FWHM at m/z 400) and the spectral-stitching technique, it was possible to detect up to 21,703 unique elemental compositions of analytes when using APPI in the positive mode as the ionization method. When adding positive-mode APCI and ESI and negative mode ESI, this number could even be increased to a total of 34,523 compositions. Ox species are the most abundant (around 90% signal intensity), no matter which ionization technique is used. ESI shows the broadest distribution of Ox, in line with the assumed high polarity of the corresponding compounds. This is also reflected by the higher O/C ratios observed for ESI in comparison with APPI and APCI, which in turn, are more efficient for compounds with high DBE values (up to 40) due to different ionization mechanisms. Altogether, this study shows that the utilization of multiple ionization methods allows a much broader overview of pyrolysis-derived fuels. Although complexity is increased by different types of ions being formed, ultrahigh-resolution mass spectrometry allows for a detailed understanding of them all as replicates can be identified. Here, a two-step overlap analysis helps with understanding the details.

Author Contributions

Investigation, data analysis, writing—original draft preparation, Y.X.; Conceptualization, supervision, project administration, writing—review and editing, W.S. Both authors have read and agreed to the published version of the manuscript.

Funding

External funding for a scholarship to Y.X. from the CSC (China Scholarship Council) is gratefully acknowledged.

Acknowledgments

The authors thank David Stranz, Sierra Analytics, Modesto, CA, USA, for providing access to software for MS data evaluation.

Conflicts of Interest

The authors declare no conflict of interest.

References

  1. Vispute, T.P.; Zhang, H.; Sanna, A.; Xiao, R.; Huber, G.W. Renewable chemical commodity feedstocks from integrated catalytic processing of pyrolysis oils. Science 2010, 330, 1222–1227. [Google Scholar] [CrossRef]
  2. Liu, C.; Wang, H.; Karim, A.M.; Sun, J.; Wang, Y. Catalytic fast pyrolysis of lignocellulosic biomass. Chem. Soc. Rev. 2014, 43, 7594–7623. [Google Scholar] [CrossRef]
  3. Talmadge, M.S.; Baldwin, R.M.; Biddy, M.J.; McCormick, R.L.; Beckham, G.T.; Ferguson, G.A.; Czernik, S.; Magrini-Bair, K.A.; Foust, T.D.; Metelski, P.D.; et al. A perspective on oxygenated species in the refinery integration of pyrolysis oil. Green Chem. 2014, 16, 407–453. [Google Scholar] [CrossRef]
  4. Bridgwater, A.; Peacocke, G. Fast pyrolysis processes for biomass. Renew. Sustain. Energy Rev. 2000, 4, 1–73. [Google Scholar] [CrossRef]
  5. Rinaldi, R.; Schüth, F. Design of solid catalysts for the conversion of biomass. Energy Environ. Sci. 2009, 2, 610. [Google Scholar] [CrossRef]
  6. Sharifzadeh, M.; Sadeqzadeh, M.; Guo, M.; Borhani, T.N.; Murthy Konda, N.V.S.N.; Garcia, M.C.; Wang, L.; Hallett, J.; Shah, N. The multi-scale challenges of biomass fast pyrolysis and bio-oil upgrading: Review of the state of art and future research directions. Prog. Energy Combust. Sci. 2019, 71, 1–80. [Google Scholar] [CrossRef]
  7. Czernik, S.; Bridgwater, A. Overview of applications of biomass fast pyrolysis oil. Energy Fuels 2004, 18, 590–598. [Google Scholar] [CrossRef]
  8. Cao, Z.; Xu, Y.; Lyu, P.; Dierks, M.; Morales-García, Á.; Schrader, W.; Nachtigall, P.; Schüth, F. Flexibilization of Biorefineries: Tuning Lignin Hydrogenation by Hydrogen Partial Pressure. ChemSusChem 2021, 14, 373–378. [Google Scholar] [CrossRef] [PubMed]
  9. Biswas, B.; Pandey, N.; Bisht, Y.; Singh, R.; Kumar, J.; Bhaskar, T. Pyrolysis of agricultural biomass residues: Comparative study of corn cob, wheat straw, rice straw and rice husk. Bioresour. Technol. 2017, 237, 57–63. [Google Scholar] [CrossRef] [PubMed]
  10. Pu, Y.Q.; Cao, S.L.; Ragauskas, A.J. Application of quantitative P-31 NMR in biomass lignin and biofuel precursors characterization. Energy Environ. Sci. 2011, 4, 3154–3166. [Google Scholar] [CrossRef]
  11. Ben, H.X.; Ragauskas, A.J. NMR Characterization of Pyrolysis Oils from Kraft Lignin. Energy Fuels 2011, 25, 2322–2332. [Google Scholar] [CrossRef]
  12. Hawkes, J.A.; D’Andrilli, J.; Agar, J.N.; Barrow, M.P.; Berg, S.M.; Catalán, N.; Chen, H.; Chu, R.K.; Cole, R.B.; Dittmar, T.; et al. An international laboratory comparison of dissolved organic matter composition by high resolution mass spectrometry: Are we getting the same answer? Limnol. Oceanogr. Methods 2020, 18, 235–258. [Google Scholar] [CrossRef]
  13. Hertkorn, N.; Frommberger, M.; Witt, M.; Koch, B.P.; Schmitt-Kopplin, P.; Perdue, E.M. Natural Organic Matter and the Event Horizon of Mass Spectrometry. Anal. Chem. 2008, 80, 8908–8919. [Google Scholar] [CrossRef] [PubMed]
  14. Xian, F.; Hendrickson, C.L.; Marshall, A.G. High resolution mass spectrometry. Anal. Chem. 2012, 84, 708–719. [Google Scholar] [CrossRef] [PubMed]
  15. Headley, J.V.; Barrow, M.P.; Peru, K.M.; Fahlman, B.; Frank, R.A.; Bickerton, G.; McMaster, M.E.; Parrott, J.; Hewitt, L.M. Preliminary fingerprinting of Athabasca oil sands polar organics in environmental samples using electrospray ionization Fourier transform ion cyclotron resonance mass spectrometry. Rapid Commun. Mass Spectrom. 2011, 25, 1899–1909. [Google Scholar] [CrossRef]
  16. Aebersold, R.; Mann, M. Mass spectrometry-based proteomics. Nature 2003, 422, 198–207. [Google Scholar] [CrossRef]
  17. Palacio Lozano, D.C.; Gavard, R.; Arenas-Diaz, J.P.; Thomas, M.J.; Stranz, D.D.; Mejía-Ospino, E.; Guzman, A.; Spencer, S.E.F.; Rossell, D.; Barrow, M.P. Pushing the analytical limits: New insights into complex mixtures using mass spectra segments of constant ultrahigh resolving power. Chem. Sci. 2019, 6966–6978. [Google Scholar] [CrossRef]
  18. Rüger, C.P.; Miersch, T.; Schwemer, T.; Sklorz, M.; Zimmermann, R. Hyphenation of Thermal Analysis to Ultrahigh-Resolution Mass Spectrometry (Fourier Transform Ion Cyclotron Resonance Mass Spectrometry) Using Atmospheric Pressure Chemical Ionization For Studying Composition and Thermal Degradation of Complex Materials. Anal. Chem. 2015, 87, 6493–6499. [Google Scholar] [CrossRef]
  19. Hockaday, W.C.; Purcell, J.M.; Marshall, A.G.; Baldock, J.A.; Hatcher, P.G. Electrospray and photoionization mass spectrometry for the characterization of organic matter in natural waters: A qualitative assessment. Limnol. Oceanogr. Methods 2009, 7, 81–95. [Google Scholar] [CrossRef] [Green Version]
  20. Wei, Y.; Lei, H.; Wang, L.; Zhu, L.; Zhang, X.; Liu, Y.; Chen, S.; Ahring, B. Liquid–Liquid Extraction of Biomass Pyrolysis Bio-oil. Energy Fuels 2014, 28, 1207–1212. [Google Scholar] [CrossRef]
  21. Kanaujia, P.K.; Sharma, Y.; Agrawal, U.; Garg, M. Analytical approaches to characterizing pyrolysis oil from biomass. TrAC Trends Anal. Chem. 2013, 42, 125–136. [Google Scholar] [CrossRef]
  22. Putman, J.C.; Moulian, R.; Barrere-Mangote, C.; Rodgers, R.P.; Bouyssiere, B.; Giusti, P.; Marshall, A.G. Probing Aggregation Tendencies in Asphaltenes by Gel Permeation Chromatography. Part 1: Online Inductively Coupled Plasma Mass Spectrometry and Offline Fourier Transform Ion Cyclotron Resonance Mass Spectrometry. Energy Fuels 2020, 34, 8308–8315. [Google Scholar] [CrossRef]
  23. Vetere, A.; Profrock, D.; Schrader, W. Quantitative and Qualitative Analysis of Three Classes of Sulfur Compounds in Crude Oil. Angew. Chem. Int. Edit. 2017, 56, 10933–10937. [Google Scholar] [CrossRef]
  24. Guricza, L.M.; Schrader, W. Argentation chromatography coupled to ultrahigh-resolution mass spectrometry for the separation of a heavy crude oil. J. Chromatogr. A 2017, 1484, 41–48. [Google Scholar] [CrossRef] [PubMed]
  25. Beccaria, M.; Siqueira, A.L.M.; Maniquet, A.; Giusti, P.; Piparo, M.; Stefanuto, P.H.; Focant, J.F. Advanced mono- and multi-dimensional gas chromatography-mass spectrometry techniques for oxygen-containing compound characterization in biomass and biofuel samples. J. Sep. Sci. 2020, 44, 115–134. [Google Scholar] [CrossRef]
  26. Zhao, C.; Lercher, J.A. Upgrading pyrolysis oil over Ni/HZSM-5 by cascade reactions. Angew. Chem. Int. Ed. Engl. 2012, 51, 5935–5940. [Google Scholar] [CrossRef] [PubMed]
  27. Zhao, C.; Kou, Y.; Lemonidou, A.A.; Li, X.; Lercher, J.A. Highly Selective Catalytic Conversion of Phenolic Bio-Oil to Alkanes. Angew. Chem. Int. Ed. Engl. 2009, 121, 4047–4050. [Google Scholar] [CrossRef]
  28. Hertzog, J.; Carre, V.; Le Brech, Y.; Dufour, A.; Aubriet, F. Toward Controlled Ionization Conditions for ESI-FT-ICR-MS Analysis of Bio-Oils from Lignocellulosic Material. Energy Fuels 2016, 30, 5729–5739. [Google Scholar] [CrossRef]
  29. Miettinen, I.; Mäkinen, M.; Vilppo, T.; Jänis, J. Compositional Characterization of Phase-Separated Pine Wood Slow Pyrolysis Oil by Negative-Ion Electrospray Ionization Fourier Transform Ion Cyclotron Resonance Mass Spectrometry. Energy Fuels 2015, 29, 1758–1765. [Google Scholar] [CrossRef]
  30. Kekäläinen, T.; Venäläinen, T.; Jänis, J. Characterization of Birch Wood Pyrolysis Oils by Ultrahigh-Resolution Fourier Transform Ion Cyclotron Resonance Mass Spectrometry: Insights into Thermochemical Conversion. Energy Fuels 2014, 28, 4596–4602. [Google Scholar] [CrossRef]
  31. Brecht, D.; Uteschil, F.; Schmitz, O.J. Development of a fast-switching dual (ESI/APCI) ionization source for liquid chromatography/mass spectrometry. Rapid Commun. Mass Spectrom. 2020, 34. [Google Scholar] [CrossRef] [PubMed]
  32. Lenzen, C.; Winterfeld, G.A.; Schmitz, O.J. Comparison of piracetam measured with HPLC-DAD, HPLC-ESI-MS, DIP-APCI-MS, and a newly developed and optimized DIP-ESI-MS. Anal. Bioanal. Chem. 2016, 408, 4103–4110. [Google Scholar] [CrossRef] [PubMed]
  33. Panda, S.K.; Andersson, J.T.; Schrader, W. Characterization of Supercomplex Crude Oil Mixtures: What Is Really in There? Angew. Chem. Int. Ed. 2009, 48, 1788–1791. [Google Scholar] [CrossRef] [PubMed]
  34. Akalın, M.K.; Karagöz, S. Analytical pyrolysis of biomass using gas chromatography coupled to mass spectrometry. TrAC Trends Anal. Chem. 2014, 61, 11–16. [Google Scholar] [CrossRef]
  35. Marshall, A.G.; Hendrickson, C.L.; Jackson, G.S. Fourier transform ion cyclotron resonance mass spectrometry: A primer. Mass Spectrom. Rev. 1998, 17, 1–35. [Google Scholar] [CrossRef]
  36. Hu, Q.; Noll, R.J.; Li, H.; Makarov, A.; Hardman, M.; Graham Cooks, R. The Orbitrap: A new mass spectrometer. J. Mass Spectrom. 2005, 40, 430–443. [Google Scholar] [CrossRef]
  37. Staš, M.; Chudoba, J.; Kubička, D.; Pospíšil, M. Chemical characterization of pyrolysis bio-oil: Application of Orbitrap mass spectrometry. Energy Fuels 2015, 29, 3233–3240. [Google Scholar] [CrossRef]
  38. Staš, M.; Chudoba, J.; Auersvald, M.; Kubička, D.; Conrad, S.; Schulzke, T.; Pospíšil, M. Application of orbitrap mass spectrometry for analysis of model bio-oil compounds and fast pyrolysis bio-oils from different biomass sources. J. Anal. Appl. Pyrolysis 2017, 124, 230–238. [Google Scholar] [CrossRef]
  39. Nunes, V.O.; Silva, R.V.S.; Romeiro, G.A.; Azevedo, D.A. The speciation of the organic compounds of slow pyrolysis bio-oils from Brazilian tropical seed cake fruits using high-resolution techniques: GC × GC-TOFMS and ESI(±)-Orbitrap HRMS. Microchem. J. 2020, 153, 104514. [Google Scholar] [CrossRef]
  40. Silva, R.V.S.; Pereira, V.B.; Stelzer, K.T.; Almeida, T.A.; Romeiro, G.A.; Azevedo, D.A. Comprehensive study of the liquid products from slow pyrolysis of crambe seeds: Bio-oil and organic compounds of the aqueous phase. Biomass Bioenergy 2019, 123, 78–88. [Google Scholar] [CrossRef]
  41. Gaspar, A.; Schrader, W. Expanding the data depth for the analysis of complex crude oil samples by Fourier transform ion cyclotron resonance mass spectrometry using the spectral stitching method. Rapid Commun. Mass Spectrom. 2012, 26, 1047–1052. [Google Scholar] [CrossRef]
  42. Oliveros, J.C. (2007–2015) Venny. An Interactive Tool for Comparing Lists with Venn’s Diagrams. Available online: https://bioinfogp.cnb.csic.es/tools/venny/index.html (accessed on 7 April 2021).
  43. Littlefield, K.; Monroe, M. Venn Diagram Plotter; PNNL: Richland, WA, USA, 2008. [Google Scholar]
  44. Vetere, A.; Schrader, W. Mass Spectrometric Coverage of Complex Mixtures: Exploring the Carbon Space of Crude Oil. ChemistrySelect 2017, 2, 849–853. [Google Scholar] [CrossRef]
  45. Gaspar, A.; Zellermann, E.; Lababidi, S.; Reece, J.; Schrader, W. Impact of different ionization methods on the molecular assignments of asphaltenes by FT-ICR mass spectrometry. Anal. Chem. 2012, 84, 5257–5267. [Google Scholar] [CrossRef] [PubMed]
  46. Ware, R.L.; Rowland, S.M.; Rodgers, R.P.; Marshall, A.G. Advanced Chemical Characterization of Pyrolysis Oils from Landfill Waste, Recycled Plastics, and Forestry Residue. Energy Fuels 2017. [Google Scholar] [CrossRef]
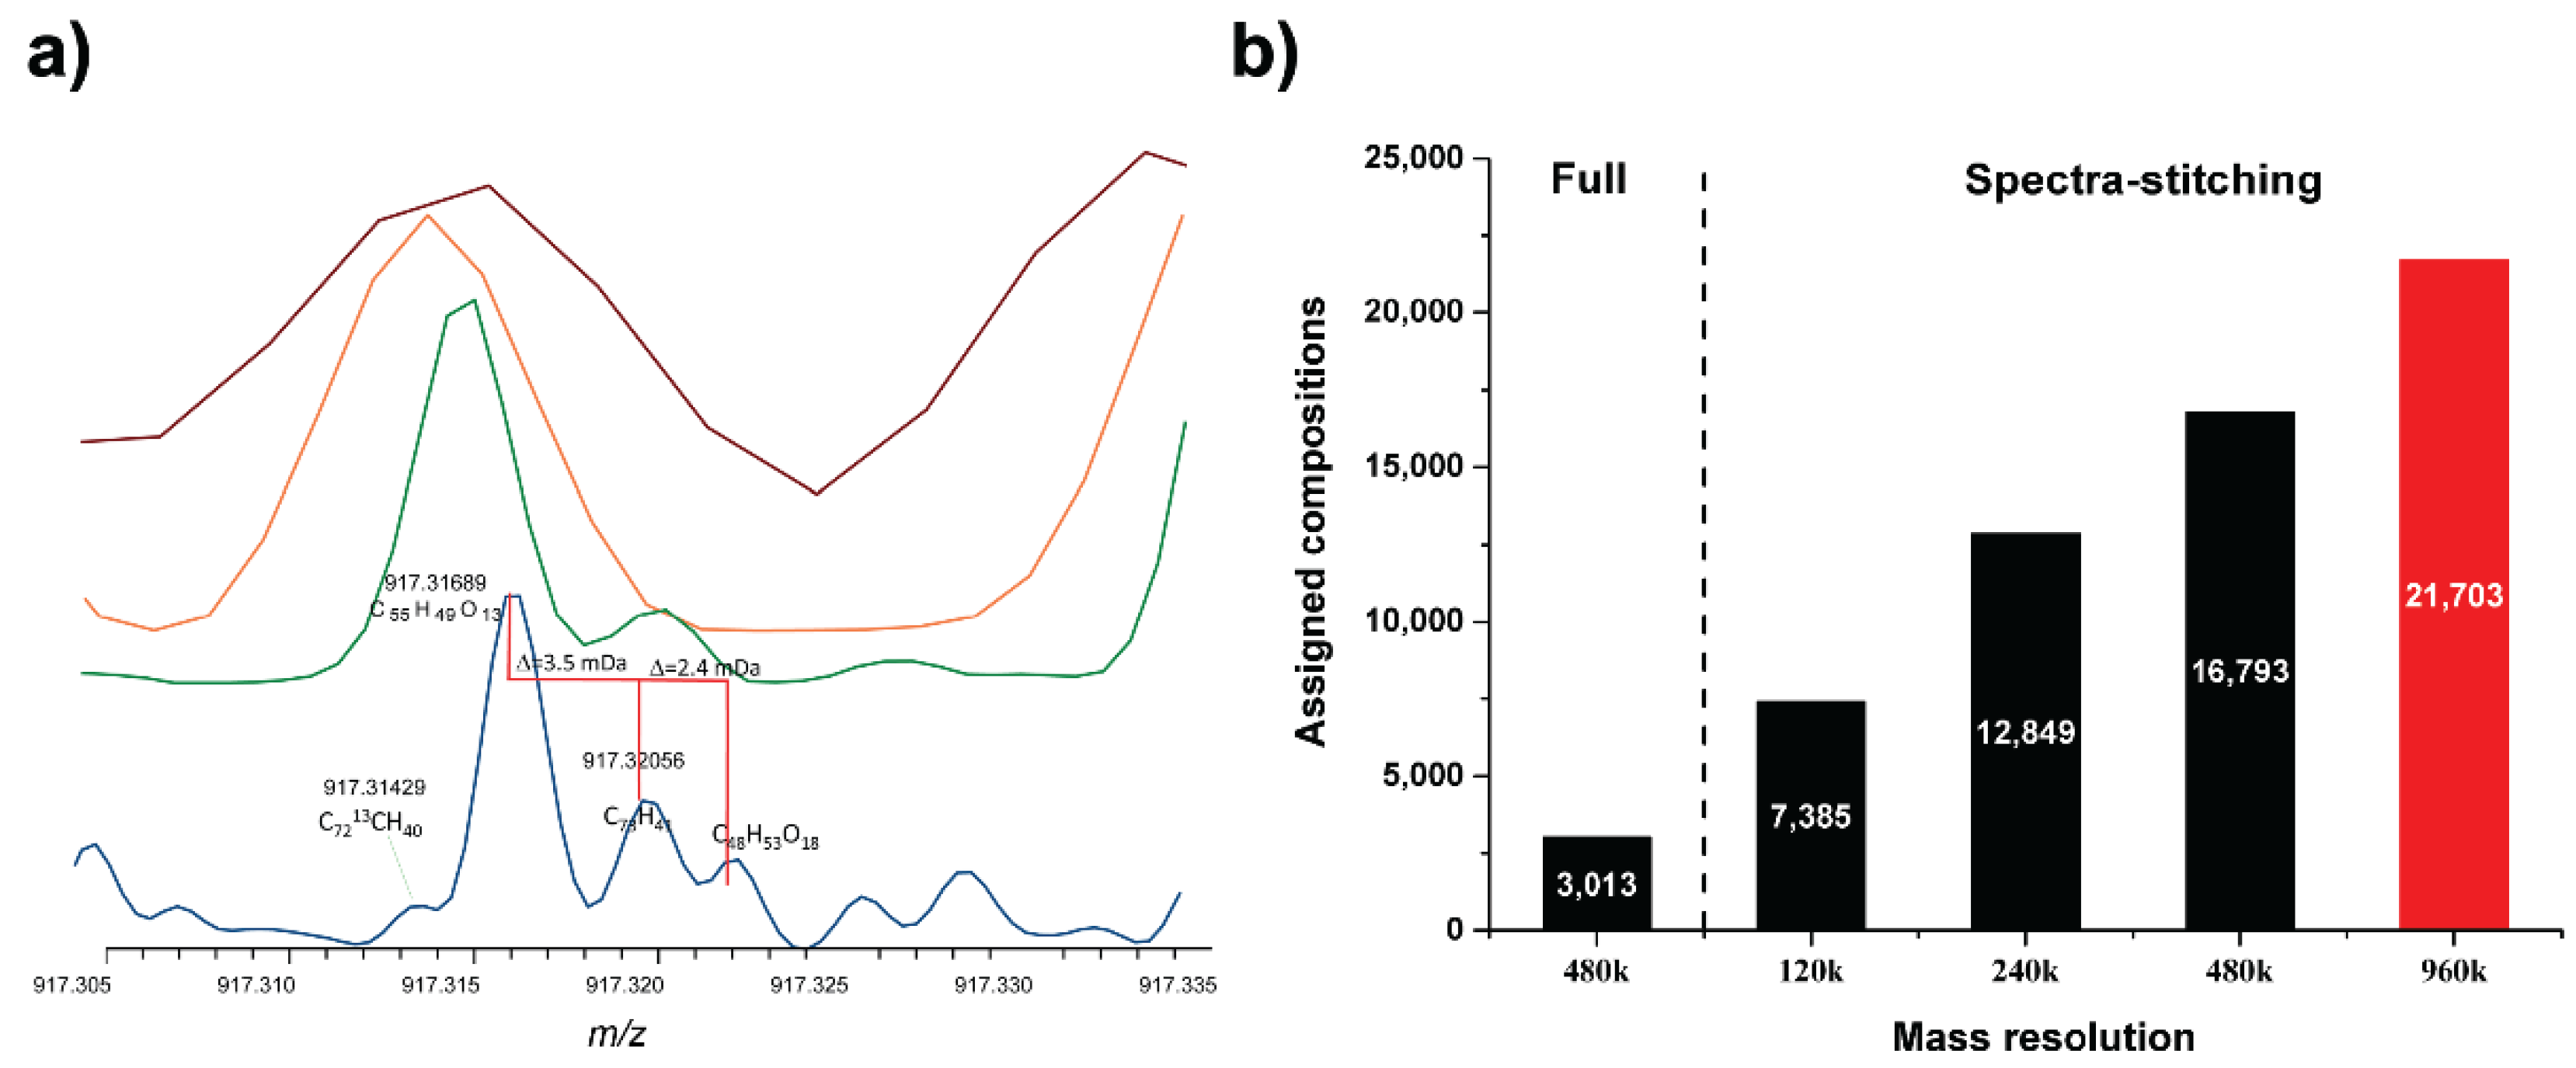
Figure 1. The impact of resolution and scan techniques on the detection of molecular compositions: (a) Mass spectra comparison from m/z 917.305 to 917.335 for resolution settings 120 k, 240 k, 480 k and 960 k (from top to down). (b) Summarized population distribution of different resolution data on spectral stitching acquisition for resolution settings 120 k, 240 k and 960 k. Shown are important mass splits for biofuels that contain a high number of oxygen atoms; in this case, the mass split between C18 and H8O13, which corresponds to a mass difference of 3.5 mDa, and the mass split of C25 and H12O18, which shows a difference of 2.5 mDa.
Energies 14 02032 g001
Figure 2. Comparison of mass spectra using multiple ionization techniques (left graph) and focused view of m/z 469.18 (right graph).
Energies 14 02032 g002
Figure 3. Mass scale-adjusted spectrum comparison, assuming the same elemental compositions to be observed as different types of ions by different ionization techniques: m/z range from 409.100 to 409.220 Da for APPI(+) and APCI(+), 431.080 to 431.200 Da for ESI(+) and 407.085 to 407.205 Da for ESI(−). The mass differences between different types of ions are shown on the left.
Energies 14 02032 g003
Figure 4. The impact of ionization techniques on the detection of molecular compositions: (a) Relative intensity-based class distribution for different ionization techniques. (b) Relative intensity-based class distribution for the Ox[Y] classes (x: number of oxygen atoms per molecule, Y: type of ion (de-/protonated molecule or sodium adduct)). (c) The left-hand graph shows the Kendrick plots for the O10 class and the right-hand graph presents histogram plots of DBE vs. normalized intensity.
Energies 14 02032 g004
Figure 5. Two-step procedure to remove elemental composition replicates. The first step is to achieve the number of unique formulas in a single ionization technique. An example using the composition of C24H24O7, which can be detected in multiple forms depending on the applied ionization technique, is shown in mass spectra. The second step is to remove composition replicates among multiple ionization techniques, to obtain a total number of unique formulas.
Energies 14 02032 g005
Figure 6. Set-size bar plot on the left displays the numbers of unique formulas detected by the individual ionization techniques. The UpSet plot shows the intersection of detected formulas, gained by using a combination of complementary ionization techniques, as depicted below.
Energies 14 02032 g006
Figure 7. (a) DBE/C distribution of unique compositions for all heteroatom classes (left) and for Ox only (right) for individual ionization methods. (b) DBE/C distribution for all heteroatom classes (left) and for Ox only (right) for compositions assigned commonly to all ionization methods and for compositions uniquely found with each method.
Energies 14 02032 g007
Table 1. Calculated median and mean O/C values for detected compositions.
Median/MeanAPPI(+)APCI(+)ESI(+)ESI(−)
All assigned compositions0.21/0.240.20/0.230.26/0.290.37/0.40
Ox0.19/0.220.19/0.220.29/0.33 ([M+Na]+)
0.23/0.28 ([M+H]+)
0.29/0.33 (total)
0.35/0.39
NOx0.26/0.300.24/0.270.25/0.260.43/0.45
N2Ox0.24/0.260.23/0.250.24/0.270.33/0.42
Publisher’s Note: MDPI stays neutral with regard to jurisdictional claims in published maps and institutional affiliations.