Article

Assessing the Level of Energy and Climate Sustainability in the European Union Countries in the Context of the European Green Deal Strategy and Agenda 2030

1
Faculty of Mining, Safety Engineering and Industrial Automation, Silesian University of Technology, 44-100 Gliwice, Poland
2
Faculty of Organization and Management, Silesian University of Technology, 44-100 Gliwice, Poland
3
Institute of Logistics and Transportation, Technical University of Košice, 042 00 Košice, Slovakia
*
Authors to whom correspondence should be addressed.
Energies 2021, 14(6), 1767; https://doi.org/10.3390/en14061767
Submission received: 26 February 2021 / Revised: 15 March 2021 / Accepted: 18 March 2021 / Published: 22 March 2021
(This article belongs to the Special Issue Energy Economic Analysis: Energy Transition and Sustainability)

Abstract

:
The concept of sustainable development integrates activities in the economic, environmental and social areas. Energy policy, which is very closely linked to climate protection, is of key importance for achieving the goals of the concept in question. All these elements are connected by the European Green Deal strategy and Agenda 2030. Their implementation requires the evaluation of previous actions undertaken within the framework of sustainable development and the diagnosis of the current state. Therefore, this article presents the results of such research in relation to the key industry connected with this process, which is the energy sector. The research methodology was based on the analysis of 14 indicators that characterize four basic areas (dimensions) related to energy and climate sustainability. These indicators concern energy and climate as well as social and economic issues. This approach makes it possible to comprehensively assess the actions taken so far in the implementation of sustainable economic development in the energy and climate area in the European Union (EU) countries. The entropy-complex-proportional-assessment (COPRAS) methodologies, which belong to the group of multiple criteria decision-making methods, were used for this study. The conducted research allowed for the assessment of the changes in the EU countries in terms of energy and climate sustainability between 2009–2018. In addition, the effects of the introduced changes in individual years and in relation to the studied areas (dimensions) were also evaluated. Based on the results, considering the adopted criteria, the EU countries were divided into groups similar to the level of energy and climate sustainability. The results constitute a valuable set of data, which allows for a wide and in-depth multicriteria analysis. This allows for a very objective and broad assessment of the effects of sustainable development policies in the EU countries and the current state in the context of the European Green Deal strategy and Agenda 2030.

1. Introduction

In Europe, the concept of sustainable development is a fundamental and overarching objective, which is contained in Article 2 of the Lisbon Treaty [1]. One of the most important tasks of this concept is to ensure a stable natural environment, sustainable consumption and production, and the eradication of poverty [2,3]. The result of these actions is to ensure that all citizens have access to sources of stable, sustainable, and modern energy at affordable prices [4,5]. Sustainable energy should be understood in this context as energy that is produced and used as much as possible from renewable energy sources (RES), as it is practically emission-free and, above all, does not emit greenhouse gases (GHG) into the atmosphere [5,6]. At present, the emission from the energy sector accounts for approximately 80% of the total emission [7].
Ensuring the security of energy supply and limiting the negative impact of the sector on the environment are the paramount objectives set by the EU on the way to the sustainable future [8]. Therefore, it can be assumed that both energy and climate are the main areas of sustainable economic development introduced in the EU. In order to implement them, develop a low-carbon economy, and increase the energy security of the EU countries, a number of strategies has been developed, e.g., [9,10,11].
One of the most groundbreaking solutions in this regard is a pioneering European climate strategy proposed by the European Commission and presented at the 2019 UN COP25 Climate Summit in Madrid [10], referred to as the European Green Deal [9]. Its goal for the EU’s economy is to become “zero-emission”, i.e., climate neutral by 2050. And by 2030, carbon dioxide (CO2) emissions are to be reduced by at least 55% versus the 1990 emissions. Obviously, this concerns the entire economy, including sectors not covered by the EU Emissions Trading Scheme (EU ETS), such as transport, construction, agriculture, and waste management.
Many actions have been taken over the years to strive for the sustainable development of the EU countries, especially in the field of climate protection. This indicates that the energy sector is of key importance in this matter [12,13,14]. Currently, any changes in the energy sector are closely linked to climate policy and dependent on its assumptions. Therefore, it can be concluded that, especially in the EU countries, a new energy and climate sector has emerged. These areas, in the current reality, need to be considered together. Thus, the notion of energy and climate sector (area of activity) is used in this paper.
The close link between energy and climate protection, as the basis of sustainable economic development, enforces certain activities to assess the effects of the introduced changes. It seems most reasonable to use sustainable development indicators, including energy and climate, to monitor this state, e.g., [4,15,16,17,18,19,20]. The analysis of changes in the values of these indicators makes it possible to assess the effects of actions undertaken to achieve sustainable development by individual countries.
The monitoring of the sustainable energy and climate development of the EU countries covers two main goals of the Agenda 2030: goal 7—“Affordable and Clean Energy” and goal 13—“Climate Action”. However, the monitoring process itself is possible due to the data contained in the database of the European Statistical Office [21].
Previous publications devoted to the issues of the EU sustainable development provide a lot of information related to the concept of sustainable development in energy and climate protection e.g., [22,23,24,25,26,27,28]. However, these studies lack the analyses of the ranking of the EU countries in terms of sustainable energy and climate development, considering the social dimensions for the EU-27 countries. The simultaneous inclusion of these four dimensions, which are inter-related and key to the process of implementing economic sustainability, makes it possible to comprehensively assess individual countries and compare them.
Due to the lack of such studies, there is a research gap in the assessment and examination of similarities between countries regarding the level of sustainable energy and climate development, considering a broader view of this development and its effects.
In order to fill this gap and to broaden the knowledge of the energy and climate state in the EU countries, including social and economic factors, a method was developed, and research was carried out, the results of which are presented in this paper.
The main objective of the research was to rank the EU countries in terms of sustainable energy development and its level.
An additional aim was to identify groups of countries similar in terms of the level of sustainable energy and climate development. These objectives were accomplished using the set of 14 selected indicators representing the main areas of the EU energy policy and being consistent with the objectives of the Agenda 2030. With regard to the analysis, the entropy–complex-proportional-assessment (COPRAS) hybrid method was used.
A wide range of research, considering many factors from different areas and using analytical tools, makes this work both a new and original approach to the presented subject. The basis of the assessment was the performance index (Pi) of sustainable development determined on the basis of 14 indicators representing energy, climate (environmental), social, and economic dimensions. The four main dimensions of sustainable energy and climate development enabled a comprehensive assessment, including the most important elements of this development, of 27 EU countries in the period between 2009–2018. The utilitarian purpose of this research was to show the diversity of the development of individual EU countries in this area. The results show that the comprehensive energy and climate policy of the EU, in the operational scope, should consider the specificity of groups of countries and be dedicated to those with similar problems. This approach should ensure its greater effectiveness and efficiency.
The presented approach to the problem of the implementation of economic sustainability should be considered novel. The analysis of energy and climate protection has not been carried out in such a wide range, using many factors.
A number of factors can be formulated to prove the originality of this work in relation to both existing and published studies.
The first such factor is the selection of 14 indicators that characterize countries in terms of their energy and climate sustainability. These indicators characterize the key economic and social areas (dimensions) of life in these countries, namely energy, climate, social, and economic.
The second factor concerns the ranking of the EU countries in terms of energy and climate sustainability from 2009 to 2018 and the assessment of this level for each of these countries. This assessment was also made for individual studied areas (dimensions). The findings made it possible to trace the changes in these countries in each year and in the studied areas. Moreover, this approach allows a broad analysis in terms of comparing the level of development of these countries among themselves and in relation to the EU as a whole.
The third factor concerns the assessment of the level of energy and climate sustainability and the division of the EU countries into four classes in terms of this level. The basis for the division was the value of the Pi index for sustainable development. The determination of these classes (groups) creates great opportunities for cooperation between countries in these groups. This relates primarily to applying for EU funds, implementing common energy and climate policy and taking initiatives in many other areas related to activities for modern energy and climate protection.
Another (fourth) factor proving the originality of this work concerns the use of the entropy–COPRAS method to assess the level of the EU countries in terms of their sustainable energy and climate development. This method is the combination of a method used to determine the weights of indicators (entropy) and a method used for the multicriteria analysis of various types (COPRAS). The Pi index can be treated as an objective measure of sustainability level. The use of this method in the presented analysis increases its scientific value and makes the results more credible.

2. Literature Review

2.1. Sustainable Energy and Climate Development

The concept of sustainable development was presented in the UN report “Our Common Future” in 1987 [29]. This report emphasized the role of energy in achieving sustainable development. In Agenda 21, energy development is mentioned in conjunction with sustainable development in the chapter on atmosphere protection [30]. The relationship between the atmosphere, greenhouse gas emissions, and energy is also emphasized in the 1992 UN Framework Convention on Climate Change and the 1997 Kyoto Protocol. Both documents call for a new, sustainable approach to energy development with special emphasis on reducing greenhouse gas emissions [31,32]. In these documents, energy is regarded as the basis for achieving sustainable development and is linked mainly to climate issues as well as energy security and the scarcity of fossil fuel resources [29]. The 1997 UN General Assembly recognized the need for more sustainable patterns of energy use and took initial steps toward a sustainable energy development program [4]. In 2000, the UN Millennium Declaration was adopted, and the associated Millennium Development Goals were introduced [33]. However, no energy-related targets were contained in this declaration [4]. Energy for sustainable development was a leading topic for the first time at the UN meeting in 2001 [34]. This meeting discussed the importance of energy access to reduce poverty and achieve the Millennium Development Goals, as well as the need to change energy production and consumption patterns [4,35,36]. A follow-up resolution was adopted in 2010, which outlined the energy issues necessary to achieve the Millennium Goals. Particular emphasis was placed on access, efficiency, and sustainable global energy development [37]. In 2011, another initiative was introduced, namely the Sustainable Energy for All [38]. The overarching goal of this initiative is to provide sustainable energy for all by 2030. The main emphasis is placed on energy availability, energy efficiency, and sustainable energy sources. In 2015, the 2030 Agenda for Sustainable Development and its associated Sustainable Development Goals (SDGs) were ratified. The objectives of the Sustainable Energy for All initiatives were aligned with Sustainable Development Goal 7: “Ensure access to affordable, reliable, sustainable, and modern energy for all”. With the introduction of SDG7, it was recognized that energy is essential for climate protection (SDG13: Climate Action) and for achieving sustainable development [39]. All these documents testify to the great importance of sustainable energy development of both individual countries and the whole world. Therefore, the idea to study this subject is fully justified and is part of this very current and important problem of the modern world.

2.2. Research about Sustainable Energy and Climate Development

The energy and climate sustainability of countries and/or groups of countries constitutes a vast area of scientific research. Studies that look at the concept of sustainable development can be found in the available literature [23,40,41,42,43,44,45,46,47,48,49,50].
Many of them deal with issues related to sustainable energy and environmental development. The popularity of this topic is due to the fact that environmental protection and energy development concern practically all countries worldwide. The dominant themes of these papers are issues related to sustainable energy and environmental development in the context of climate protection. They mainly focus on the analysis of the operation and assessment of energy systems in terms of their impact on economy, society, and environment.
Research on sustainable energy development and its level has concerned various countries [40,41,42,43,44,45,46,47] or groups of countries [23,48,49,50]. However, the available literature lacks studies devoted to the assessment of the level of sustainable energy development in the EU-27 over the past 10 years.
This is confirmed by the presented review of published works on energy and climate sustainability of individual countries and regions.
Wang et al. in their paper [40] presented research results on the importance of RES in sustainable energy and climate security in China. They used the Divisia index method for their study. Zhao and Guo [41] presented research results on the evaluation of RES in China. They conducted the research using the hybrid Multiple-criteria decision-making (MCDM) method and found that it is necessary to promote photovoltaics to promote this source of sustainable energy.
Erdil and Erbıyık [42] used the SWOT analysis to investigate the sustainable character of solar, biomass, geothermal, wind, or hydro energy in Turkey. On the other hand, Petinrin and Shaaban analyzed the sustainability of renewable energy in Malaysia by discussing different policies for these energy sources [43]. Yu et al. [44] examined the sustainable energy development of 30 provinces in China. They used the ANP method for their study. The evaluation concerned a 5 year time frame. In turn, Fang et al. [45] used the TOPSIS method to evaluate China’s sustainable energy security. Saraswat and Digalwar [46] evaluated both conventional and renewable energy sources to achieve sustainable energy development in India. The results showed that solar, wind, and hydro energy are best for this development in India. Adenle [47] evaluated solar energy technology in Africa to identify both opportunities and challenges in achieving Agenda 2030 and sustainable development goals.
García-Álvarez et al. in work [23] presented the synthetic energy sustainability index for 15 EU countries. The indicator also includes the environmental aspect related to cli-mate change in the form of the intensity of the emitted CO2 indicator.
Chudy-Laskowska et al. [47] utilized the Technique for Order of Preference by Similarity to Ideal Solution (TOPSIS) method to classify the EU countries in terms of the differentiation of wind energy development levels in the EU. The results indicate that Denmark is the leader in wind energy development in the EU, while Malta is at the other end of the list—the country with the lowest level of sustainable wind energy.
Su et al. [48] compared the sustainability status of the energy sector in 21 EU member states and China. For this purpose, they used the Vlse Kriterijuska Optimizacija I Komoromisno Resenje (VIKOR) method. The results showed that China lags behind the EU countries in terms of energy sector sustainability.
The results of the study showed that Denmark, the Netherlands, France, Portugal, and the United Kingdom performed best in energy sustainability in 2012. On the other hand, Sobczyk and Sobczyk in their study [50] conducted the analysis of the diversity of the energy mix of Poland and the EU-28 in the context of achieving sustainable development of this country.
The results showed that the use of renewable energy in Poland is below the EU average, but the country made progress in increasing RES in the energy mix between 2010 and 2018.

2.3. Research Gap

The presented works in Section 2.2 show that the subject matter of this article is current and concerns an important issue. The concept of sustainable economic development must be associated with both energy and climate issues.
The cited works do not present the results of comprehensive studies on the assessment of sustainable energy and climate development in all EU countries in the long term. This particularly concerns the simultaneous inclusion of indicators describing the key areas of this development, which was done in this article. In addition, these publications failed to refer to the important social dimension of sustainable development, which is the energy poverty of citizens of a given country. This aspect may be crucial in gaining social acceptance for the changes related to energy transition.
Moreover, the discussed publications failed to discuss the changes in the studied areas over a period of, for example, 10 years, to indicate the leaders of these changes, or to designate groups of countries with similar indicators. The quantitative and comprehensive studies of the sustainable energy and climate development of the EU countries in this field provide an opportunity for objective assessment and the use of the results to create effective and socially acceptable climate and energy policy.
Therefore, it can be concluded that this paper fills the research gap in the field of sustainable energy and climate development of the EU-27 and provides new and valuable knowledge in this area.
The diversity of the EU countries and, despite a common policy, a certain independence in the creation of internal policy—also in the field of environmental protection—makes it necessary to conduct a broad and, as far as possible, objective assessment of their energy and climate development.
In the context of the presented literature review, the research approach proposed in this paper is novel, and the obtained results should enrich the knowledge of the assessment of the state of energy and climate sustainability in the EU countries. The adoption of as many as 14 indicators for the analysis makes this approach comprehensive and gives great opportunities for the objective assessment of changes reported in this area. In order to rank and evaluate the level of energy and climate sustainability, the entropy–COPRAS hybrid method was used, which, according to the authors, is adequate for the analysis of this complex and multicriteria research problem.

3. Materials and Methods

3.1. Data

The analysis presented in the article was carried out on the basis of indicators monitoring the implementation of the Sustainable Development Goals, published by the European Statistical Office Eurostat for the years 2009–2018. In general, these indicators allow for monitoring the progress in achieving the sustainable economy of the EU countries. The analysis was conducted for 27 countries that are currently members of the EU (excluding the United Kingdom).
Each country was characterized by 14 indicators, which are also the determinants of energy and climate sustainability. These indicators are both stimulants (the higher their value, the better) and destimulants (the lower their value, the better). These variables are discussed and presented in Table 1. Source documents related to the indicators are also presented in Table 1.
The set of indicators also includes the economic factor, namely GDP per capita, which is the measure of wealth in societies and, as shown by research, has a significant impact on sustainable energy and climate development, e.g., [34,47,48,51,52].
As already mentioned, the assessment of sustainable energy and climate development of the EU countries was conducted in four dimensions (areas): energy, climate (environmental), social, and economic. It was assumed that these dimensions are key to the evaluation of this development and prove its coherence.
Table 1. Variables, units, and the explanation of statistical data (own elaboration based on [27]).
DimensionIndicatorExplanationDirection of ImpactThe Source
Papers
Corresponding to Indicators
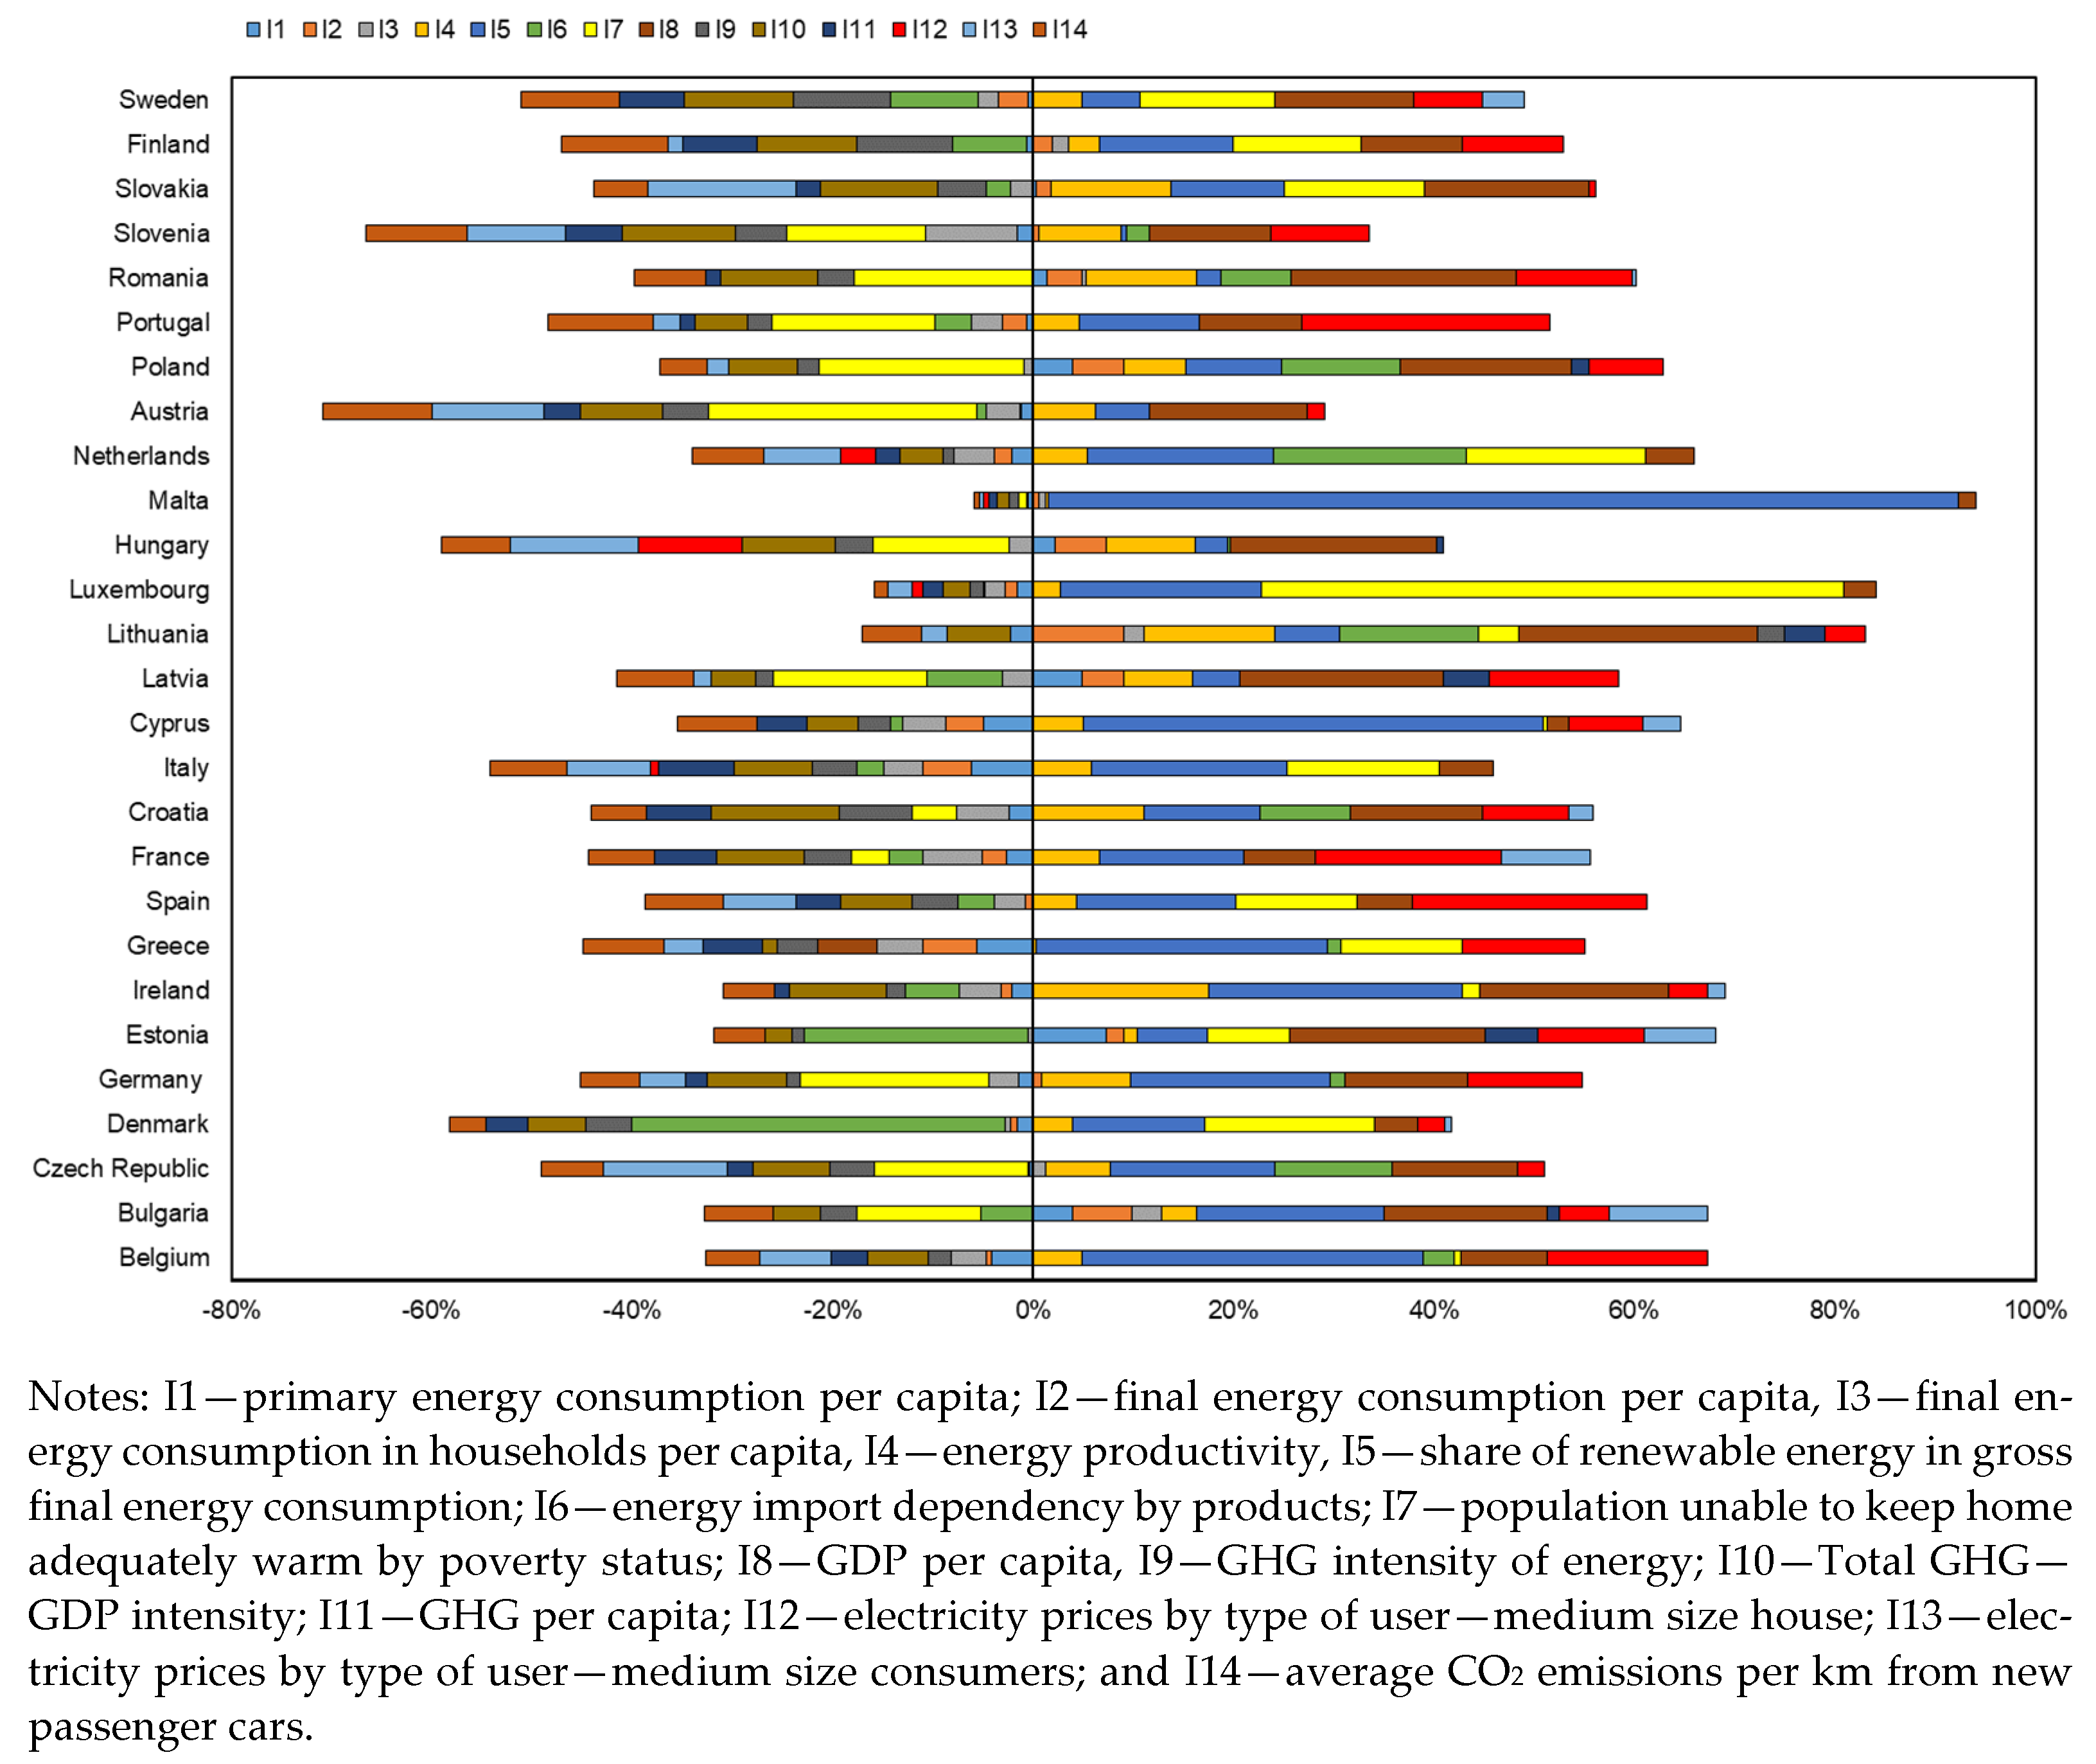
EnergyPrimary energy
consumption, tons of oil equivalent per capita
This indicator measures the total energy needs of each country excluding all nonenergy use of energy carriers.Destimulant[53]
Final energy consumption, tons of oil equivalent per capitaThis indicator measures the energy end-use in each country excluding all nonenergy use of energy carriers.Destimulant[54]
Final energy consumption in households per capita, kg of oil equivalentThis indicator measures how much electricity and heat every citizen consumes at home (excluding energy used for transportation). This indicator considers only energy used by end consumers.Destimulant-
Energy productivity, euro per kilogram of oil
equivalent
This indicator refers to the energy consumed by the production unit of GDP.Stimulant[55,56]
Share of renewable energy in gross final energy
consumption, %
This indicator measures how extensive is the use of renewable energy in EU countries.Stimulant[28]
Energy import
dependency by products, % of imports in total gross available energy
This indicator measures the share of total
energy needs of a country met by imports from other countries.
Destimulant[15,28,57]
EconomicGDP per capitaThis indicator measures the value of total
final output of goods and services produced by an economy within a certain period of time.
Stimulant[28,52,58]
Electricity prices by type of user (medium size house), euro per kilowatt-hourThis indicator presents electricity prices charged to final consumers—medium size house.Destimulant[15,59]
Electricity prices by type of user (medium size
consumers),
euro per kilowatt-hour
This indicator presents electricity prices charged to final consumers—medium size consumers.Destimulant[15,59]
Climate
(Environmental)
Greenhouse gas emissions, tons per capitaThis indicator measures total national
emissions of the so called “Kyoto basket” of GHG, including CO2, CH4, N2O, and the gases—the so-called F-gases per capita
Destimulant[60]
GHG intensity of energy, kg CO2 eq./toeThis indicator is calculated as the ratio
between energy related GHG emissions and gross inland consumption of energy
Destimulant[61]
Total GHG—GDP Intensity, tons CO2 eq./M€’15This indicator measures ratio between GHG emissions and GDPDestimulant[5,15,23]
Average CO2 emissions per km from new passenger cars, g CO2 per kmThis indicator is defined as the average CO2 emissions per km by new passenger cars.Destimulant-
SocialPopulation unable to keep home adequately warm by poverty status
% of population
This indicator measures the share of population who are unable to keep home adequately warm.Destimulant-

3.2. The Entropy–COPRAS Decision-Making Method

The entropy–COPRAS method was used to assess the energy and climate sustainability of the EU countries. It is the combination of two methods: the method of indicator weighting (entropy) and the COPRAS method, belonging to the group of multicriteria decision-making methods.
The complex proportional assessment (COPRAS) method was developed by Zavadskas, Kaklauskas, and Sarka in 1994 [62]. It is used to evaluate the values of maximizing (stimulants) and minimizing (destimulants) indicators; the influence of which on the results is examined separately. In turn, the entropy method makes it possible to objectively determine the values of the weights for the indicators included in the research [63,64].
The algorithm for this method involves the following steps:
  • To construct the decision matrix for n alternatives and d evaluation criteria:
    r i j = | x 11 x 1 d x n 1 x n d |
  • To construct the normalized decision matrix:
    r i j * = r i j i = 1 m r i j
  • To determine weights by the entropy weighting method for each indicator, according to relations (3) and (4):
    E j = k t = 1 m r i j l n ( r i j )
    w j = 1 E j j = 1 n ( 1 E j )
    where:
    k = 1 l n ( n )
  • To construct the weighted decision matrix:
    r i j * ^ = r i j * · w j
  • To determine the maximizing or minimizing index of each criterion given its negative or positive mode:
    S + i = j = 1 g r i j * ^ ;   i = 1 , . , . m
    S i = j = 1 g r i j * ^ ;   i = 1 , . , . m
    where g indicates the number of positive attributes, n − g represents the number of negative attributes, and Si describes the maximizing and minimizing indices of i-th attribute, according to its type.
  • To calculate the relative importance value (Qi) of each alternative:
    Q i = S + i + m i n i ( S i ) i = 1 m S i S i i = 1 m m i n i ( S i ) S i
  • To select the best alternative:
    Q m a x = max i ( Q i ) ,   i = 1 ,   2 . n
  • To determine the performance index for each alternative (the performance index is 1 for the best alternative):
    P i = Q i Q m a x
The COPRAS method makes it possible to make the ranking from the best to the worst alternative (solution). In this case, the alternatives are individual EU countries assessed by the performance indices.
In order to assess the level of the EU sustainable energy and climate development, the Pi efficiency index was used. On this basis, four levels of this development were delineated.
These levels were determined on the basis of the average value of the Pi index and its standard deviation. The obtained values allow for the division of the EU countries into four classes. Obviously, this division is dependent on the level of energy and climate development of a given country.
The division into classes takes into account the following values of the Pi index:
  • Class 1: High level of energy and climate sustainability (safe level):
    P i P i ¯ + s P i
  • Class 2: Medium-high level of energy and climate sustainability (medium level):
    P i ¯ + s P i > P i P i ¯
  • Class 3: Medium-low level of energy and climate sustainability (warning level):
    P i ¯ > P i P i ¯ s P i
  • Class 4: Low level of energy and climate sustainability (dangerous level):
    P i ¯ > P i P i ¯ s P i
    where P i ¯ is the mean and s P i is the standard deviation.
By obtaining the homogeneous and disjoint groups of objects most similar to each other, the separation and substantive analysis of their essential characteristics is much easier. Objects (countries) belonging to a given typological group are ordered according to the value of the synthetic measure—the Pi index.
Figure 1 shows the general scheme of the entropy–COPRAS method.
All calculations were performed using MATLAB 9.4 software.

4. Results

4.1. Preliminary Analysis

In order to determine the changes reported in the values of the indicators of the EU sustainable energy and climate development between 2009 and 2018, a comparative analysis was performed. The results are presented in the form of a cumulative diagram in Figure 2. It was assumed that 2009 was the base year for which the percentage changes of the indicators adopted for the study were calculated.
When analyzing the percentage changes in the studied indicators of sustainable energy and climate development in individual EU countries (Figure 2), significant differences in this process can be noted.
In the case of the reduction of primary energy consumption per capita, the best progress was achieved by Greece, which decreased this consumption by almost 21% in the studied period. The opposite result was obtained by Estonia, where the primary energy consumption per capita increased by about 32%. In addition, in the case of final energy consumption per capita, among the EU-27 countries, the highest reduction was achieved by Greece, with a decrease of about 20%, while Lithuania’s final energy consumption was found to have increased by almost 35%. With regard to the indicator for the final energy consumption of households per capita, the highest reduction was achieved by Luxemburg (−20.46%), while in Malta, it increased by 23.72%. In the case of the share of renewable energy in gross final energy consumption, Malta showed the best result between 2009–2018—an increase of more than 3000% (from 0.021% to 7.968%), while in Slovenia the increase was only 1.21% and was the smallest in the entire EU-27. As far as energy import dependency is concerned, the greatest improvement was reported for the Netherlands (by more than 70%). In terms of the energy poverty indicator, the best result was achieved by Poland (reduction of poverty in 2018 versus 2009 by almost 70%), and the worst by Luxembourg, where the indicator increased by 600% (from 0.3% to 2.1%). With regard to the GHG emissions per capita, Malta was found to have a reduction of more than 28%, while Estonia increased its GHG emissions in 2018 versus 2009 by more than 20%.
Malta also saw the largest reduction in the GHG emission intensity of over 35%, while Latvia saw an increase of nearly 10%.
In terms of energy prices for medium-sized houses, the best result was achieved by Malta, where the price fell by over 24%, while in Spain energy prices increased by over 50%. In the case of GDP per capita, the highest increase was reported in Lithuania at more than 90%, and a negative result was noted in Greece, where the value of GDP per capita decreased by more than 20% when compared to 2009, which is mainly due to the economic crisis in the country [65].

4.2. The Common Assessment of the EU-27 Countries in Terms of Their Energy as well as Energy and Climate Sustainable Development between 2009–2018

4.2.1. Assessing the Overall Level of Energy and Climate Sustainability of All EU-27 Countries

Based on the algorithm described in Equations (1)–(5), the weights for individual indicators of energy and climate sustainability in the studied period were determined (Figure 3).
The delineated weights made it possible in the next stage to perform calculations and determine the Pi index of energy and climate sustainable development and to create the ranking (R) of all EU-27 countries in terms of this development between 2009–2018 (Table 2).
It was found that the clear leader of the ranking throughout the studied period was Sweden, and the country that was last in the ranking was Bulgaria. Between 2009–2018, Spain (from the 13th place in 2009 to the 6th place in 2018) and Lithuania (from the 24th to the 17th) achieved the biggest rise in the ranking. Malta, on the other hand, saw the biggest decline, from the 9th place in 2009 to the 22nd in 2018, and Luxembourg from the 18th to the 25th place.
In general, the EU countries were reported to improve the values of energy and climate sustainability indicators between 2009 and 2018, yet each country showed its own dynamics of change in this regard.
In the next stage, the determined values of the Pi index made it possible to divide the EU countries into four classes. Each EU country in successive years, from 2009 to 2018, was classified into one of the four classes of sustainable energy and environmental development in terms of the level of this development. In order to assess this level, a 4-point scale was used, with the arithmetic mean and standard deviation calculated from the values of the Pi index (Equations (10)–(13)) (Table 3). Table 3 and Figure 4 show the groups of similar countries in terms of the level of energy and climate sustainable development.
When analyzing the results (Table 3 and Figure 4), the highest level of energy and climate sustainable development was found for three countries: Sweden, Denmark France, and the lowest for Bulgaria and Cyprus. In 2009, 2011, and 2012, the high level of sustainable development was also reported for Austria and the low level for Poland (2009, 2010, 2011, and 2018), Greece (2014, 2015, 2016, and 2017), Lithuania (2015 and 2018), Luxembourg (2009 and 2010), the Czech Republic (2010), Estonia (2013), and Malta (2011, 2012, 2013, and 2014). Other countries in each analyzed year were characterized by medium-high (Finland, Spain, Slovenia, and Latvia) and medium-low (e.g., Germany, Slovakia, and Belgium) development levels.
Based on the results, the average value of the Pi index for individual EU-27 countries and for the whole studied period (2009–2018) in terms of energy and climate sustainability was also determined (Figure 5).
Based on the analysis of the whole period, it was found that the high level of energy and climate sustainable development was reported for three countries: Sweden, Denmark, and France and Austria, and the low level (dangerous) for Poland, Cyprus, and Bulgaria. The remaining countries were characterized by the high medium level and low medium (warning) levels. In the case of Sweden, Denmark, and Austria, this result is completely understandable, because, as the authors [66,67,68,69,70,71] indicate, these countries already embarked on the path of energy transition toward green energy and climate protection in the 1970s and 1980s.

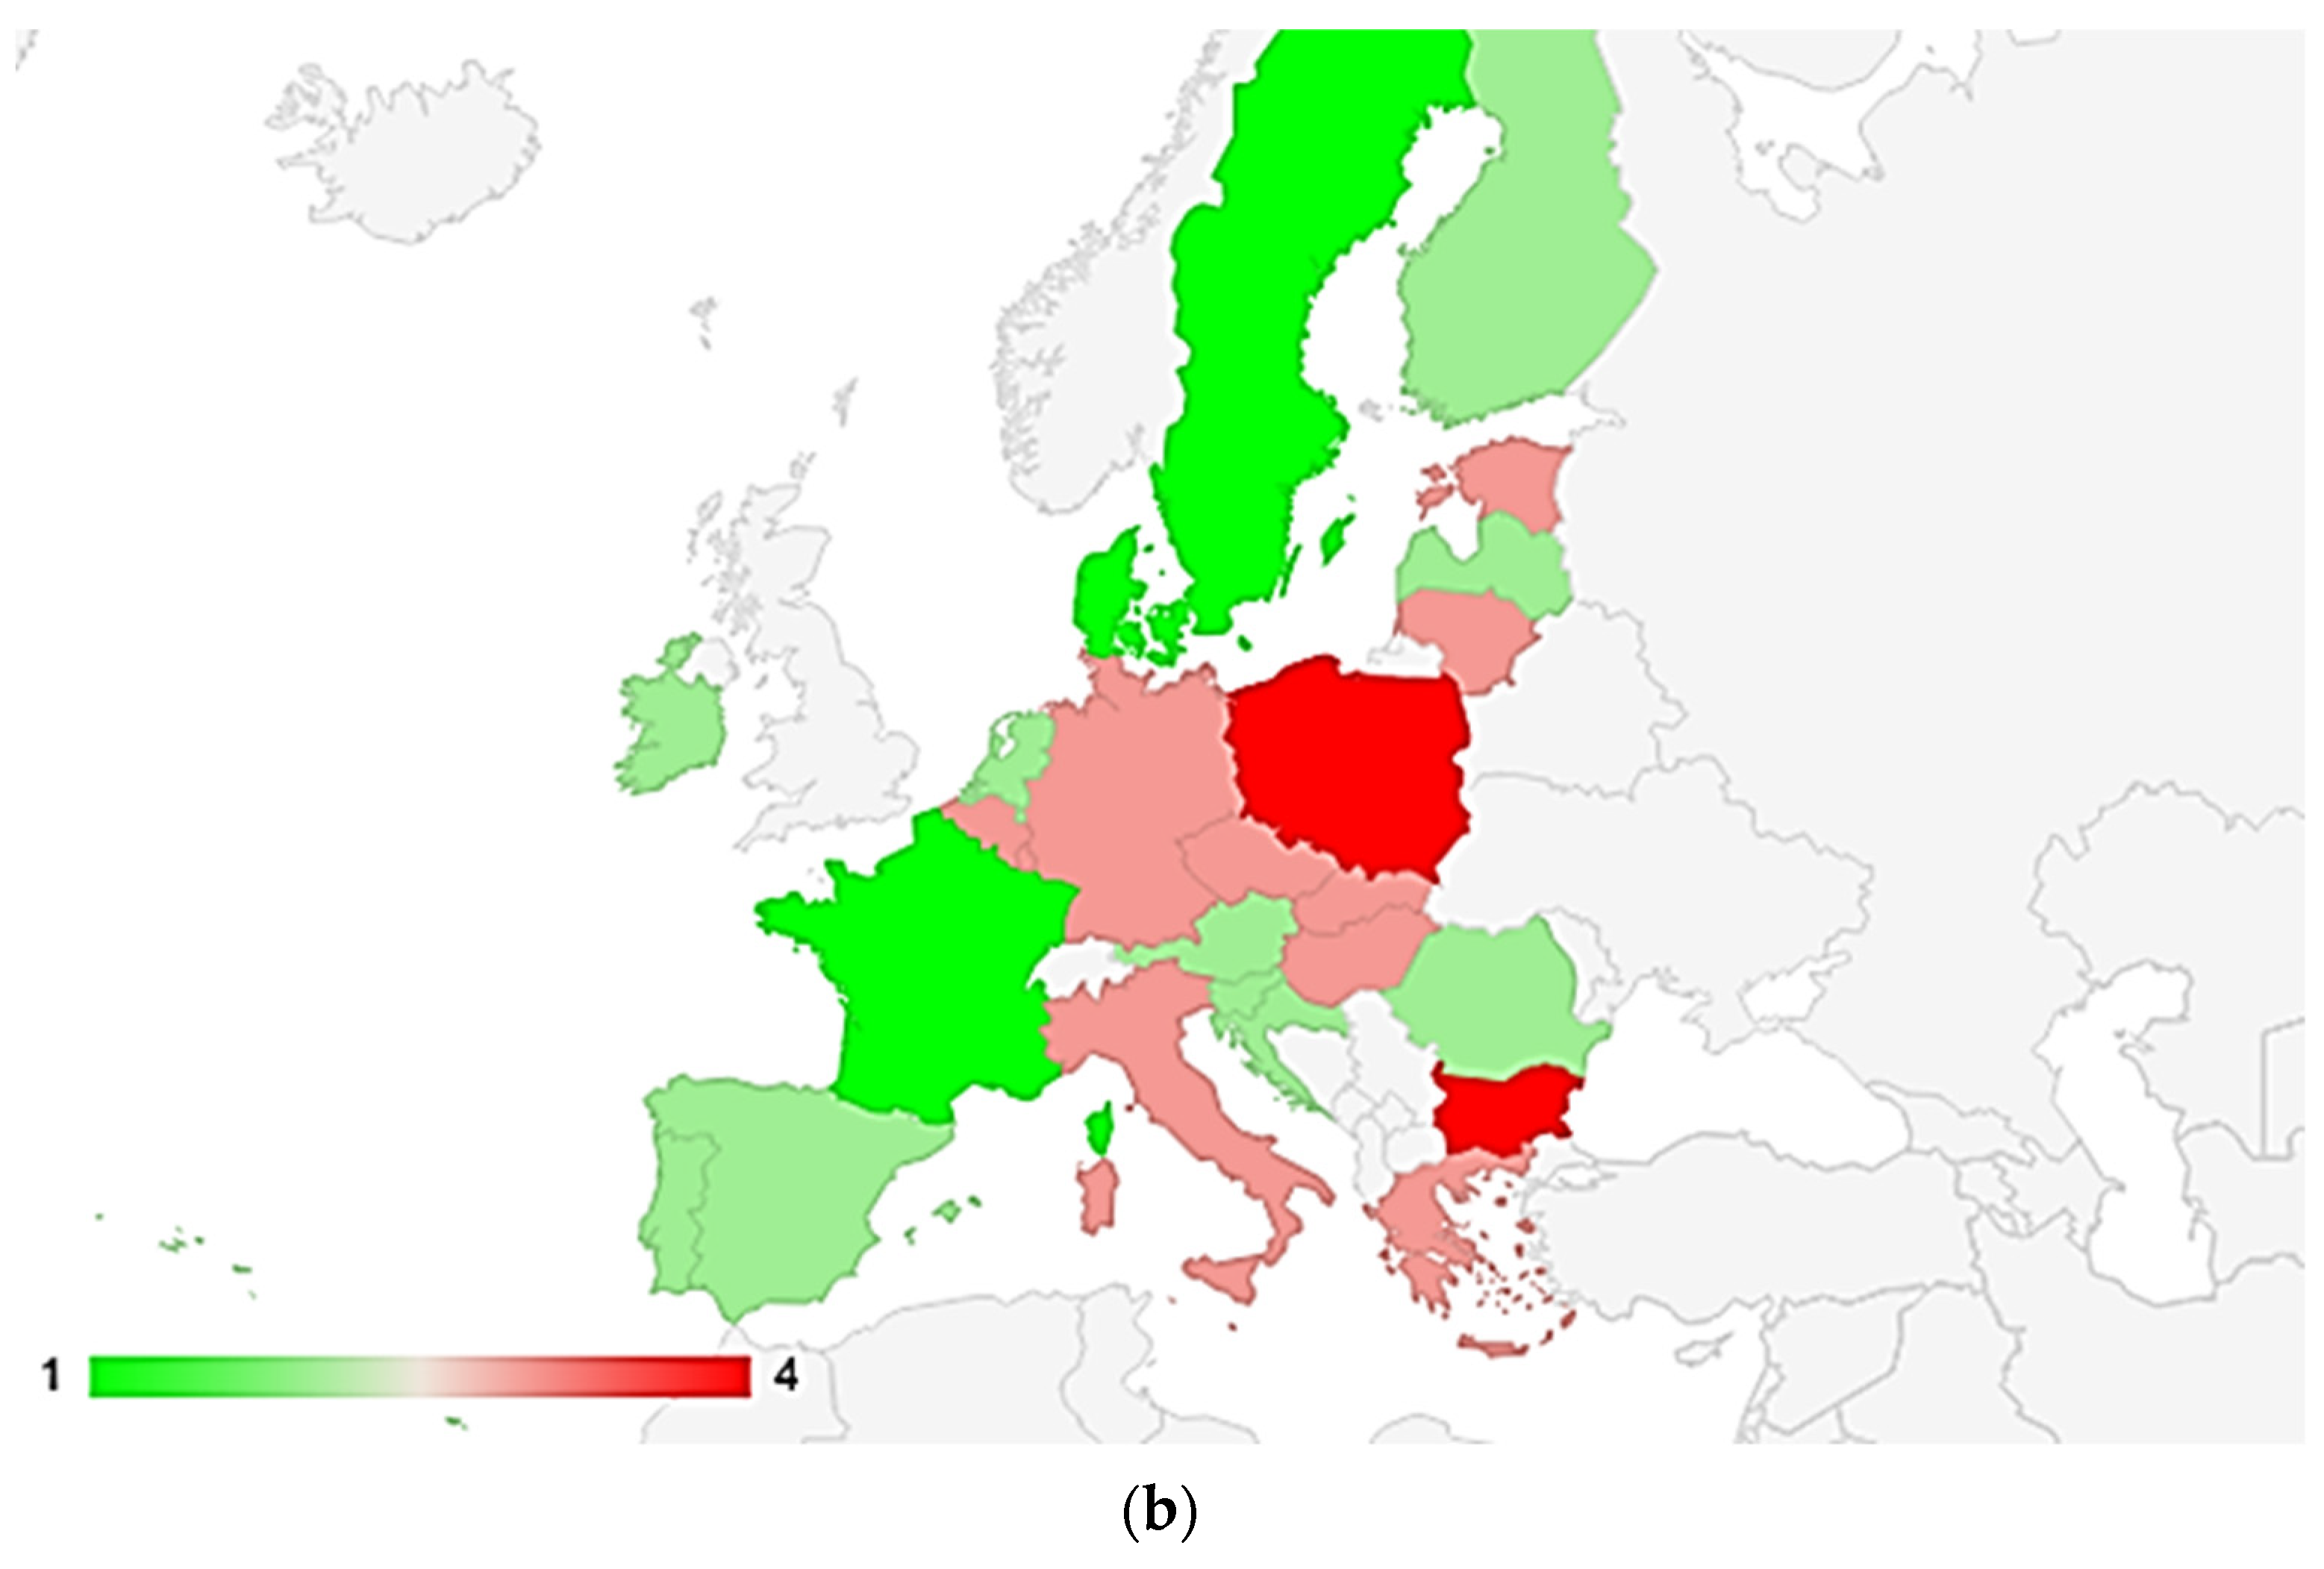
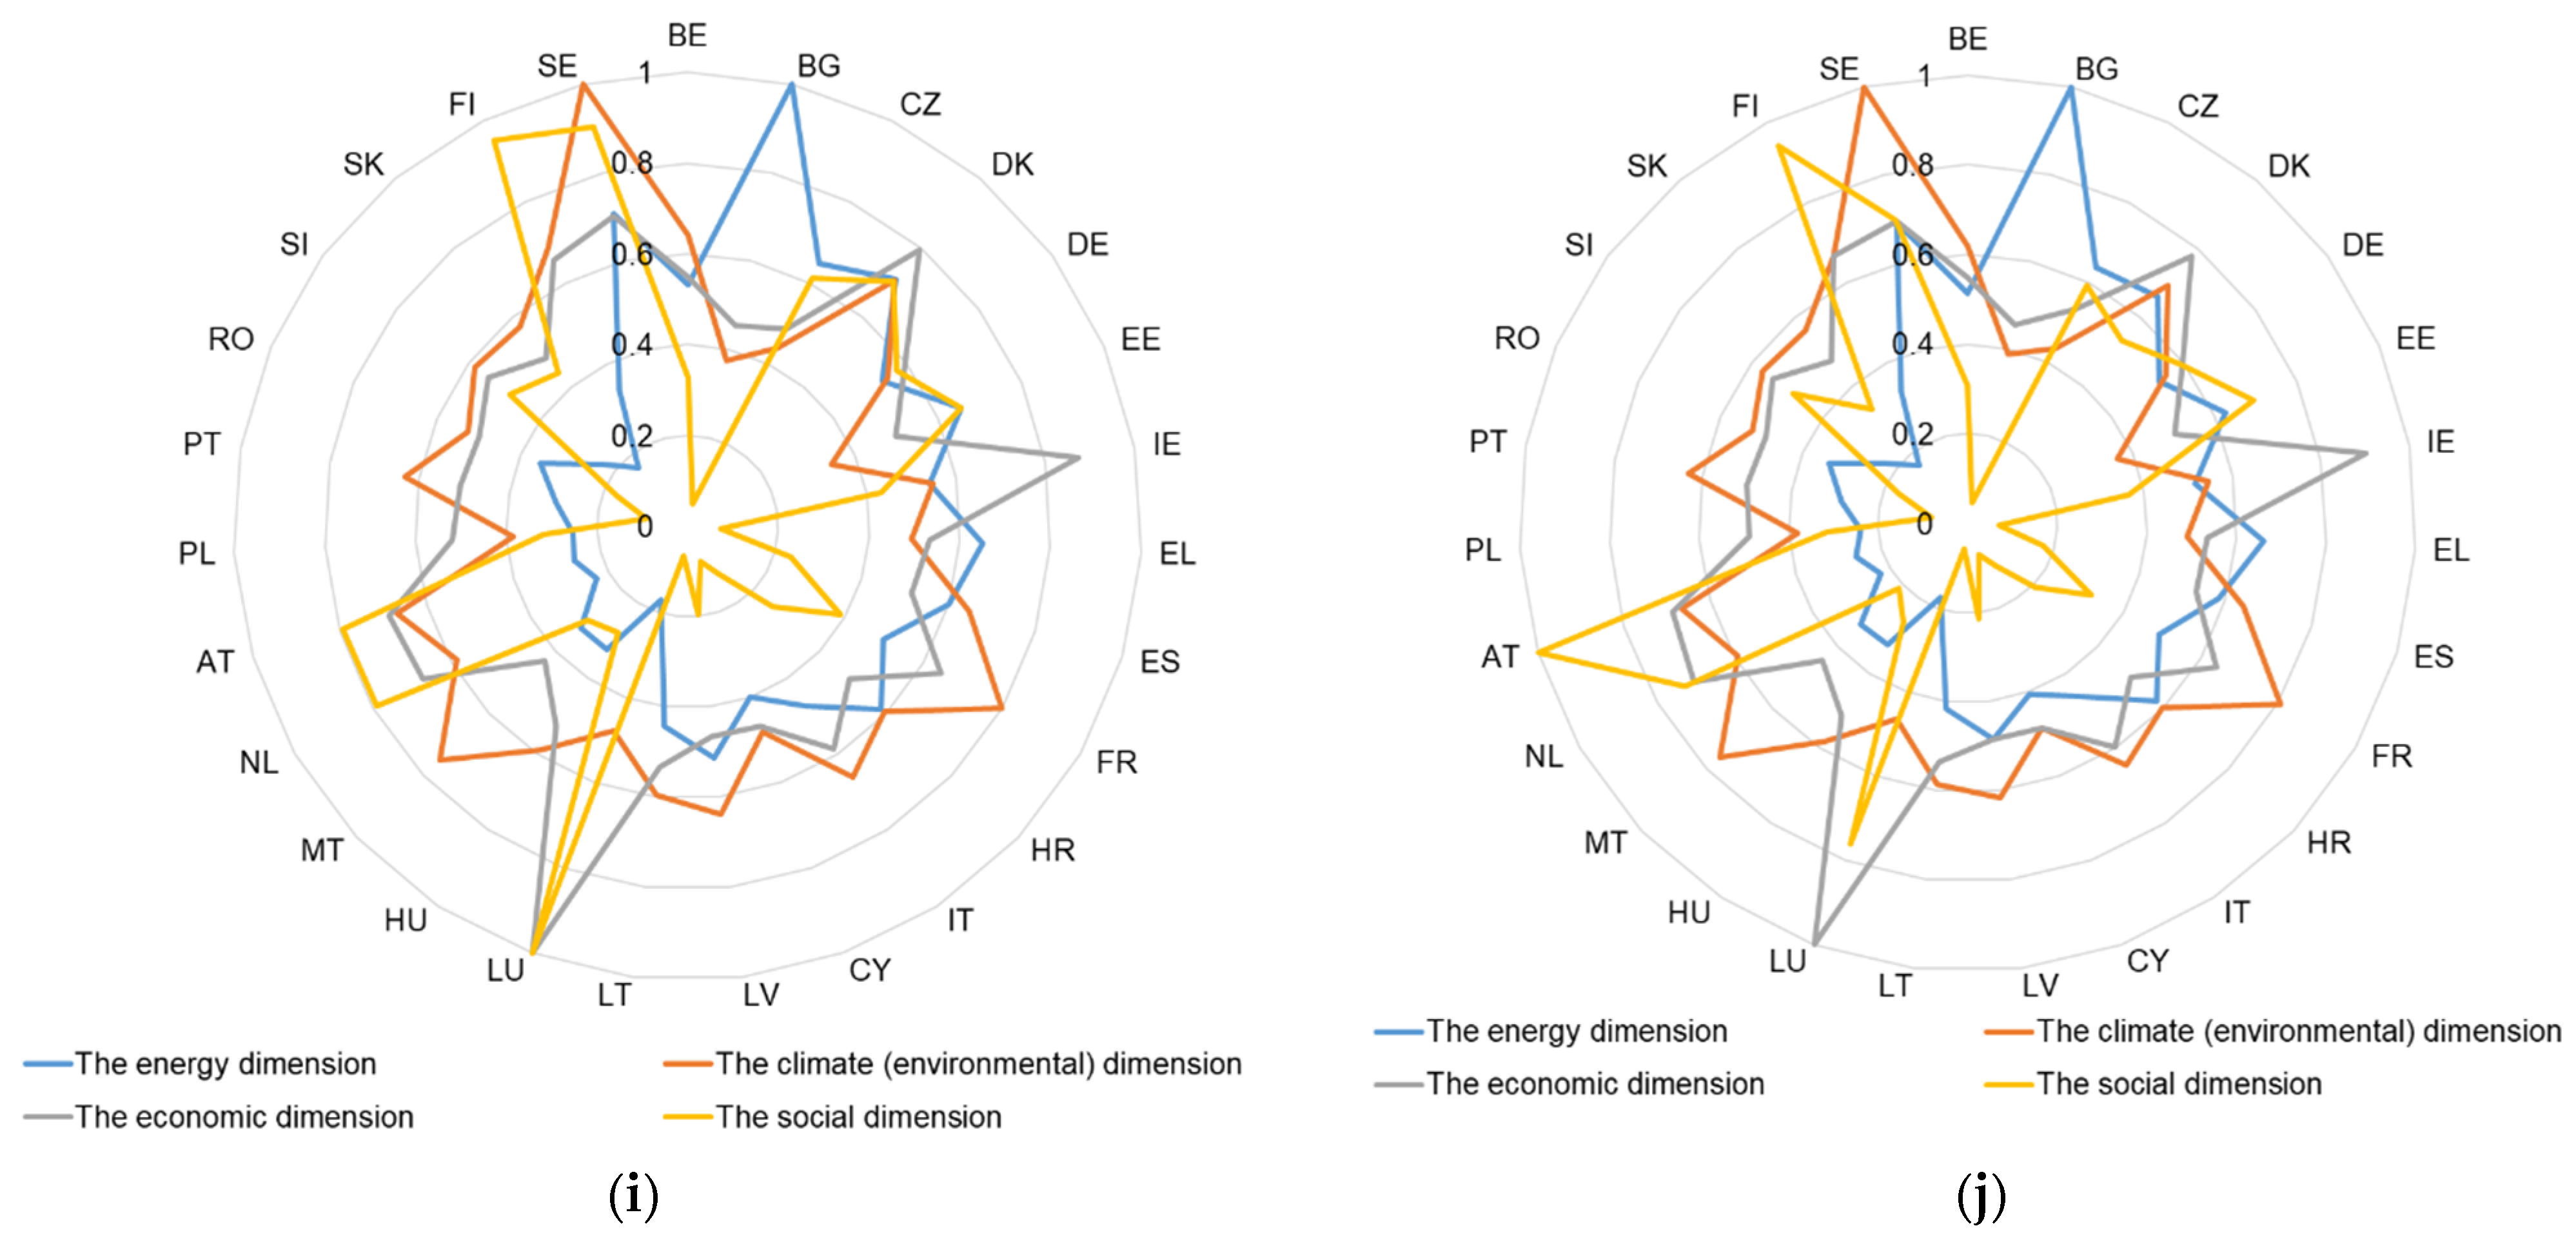
4.2.2. Assessing the EU Sustainability in the Energy, Climate (Environmental), Economic, and Social Dimensions.

According to the model presented in Section 2, which enables the ranking and assessment of the EU countries in terms of the level of energy and climate sustainable development, an analysis of this development was made for each studied dimension, i.e., energy, climate, economic, and social.
The calculated values of the Pi index for each of these dimensions in individual years and for each country are presented in Figure 6, while the division of the EU countries into individual groups, taking into account the four examined dimensions, is presented in Table 4.
The conducted research showed that in terms of sustainability only in the energy dimension, the high level in individual years was shown by Bulgaria (2010–2018), as well as Romania (2009), Sweden (2010–2012, 2014–2018), Denmark (2010–2018), the Czech Republic (2010–2012, 2014–2016), and Greece (2013–2014, 2018). In the case of Bulgaria, the favorable result was influenced by the very low values of primary energy consumption per capita and final energy consumption per capita, as well as by the low value of the final energy consumption indicator in households versus the EU average. This country was also found to have one of the lowest energy-import dependency rates in the EU.
By contrast, the low level of sustainable development considered only in the energy dimension was reported for Luxembourg (2009–2018), Slovakia, the Netherlands (2010–2018), Poland (2017–2018), Slovenia (2011–2018), Austria (2014–2017), and Cyprus (2012–2014). In the case of Luxembourg, this assessment was influenced by almost total dependence on the energy import and the highest final energy consumption in households per capita in the whole EU. The situation was found to be similar for Slovakia. In the case of Poland, for example, this assessment was influenced by the low level of energy consumption from RES and the increasing dependence on imported energy sources.
Based on the results of the ranking of the EU countries only for the climate (environmental) dimension, in the period between 2009–2018, Sweden and France were characterized by the high level of GHG emissions. In 2010, this level was also reached by Austria and Portugal, while in recent years (2013, 2016–2018), Malta was also found to show the high level of these emissions. Sweden, which is the clear leader of the ranking (Figure 6), was found to have the lowest GHG emissions from the energy sector and the total GHG—GDP intensity, as well as some of the lowest total GHG emissions per capita. In addition, the average CO2 emissions per km from new passenger cars were found to be among the lowest of all EU countries. Among the industrialized countries, Sweden was reported to have relatively low GHG emissions not only within the EU group but also worldwide. It is crucial to note that Sweden has a lot of trees planted, which further reduces carbon dioxide. Therefore, the emissions balance is close to zero [72]. It is also important to note that Sweden is predicted to become fully climate neutral by 2045.
The worst situation regarding sustainable development only in the climate dimension was found to be in Bulgaria, Poland, the Czech Republic, and Estonia. As far as Estonia is concerned, it belongs to the countries where GHG emissions per capita have been the highest in the EU for many years. In addition, the average CO2 emissions per km from new passenger cars are among the highest in the EU. A similar situation was reported in Bulgaria, where the total GHG–GDP intensity is the least favorable among all the EU countries.
With regard to the economic dimension of energy and climate sustainable development, the best results in the whole analyzed period were achieved by Luxembourg, a country which not only has the highest GDP per capita among the EU countries but also one of the highest in the world [73]. This result was also influenced by the very favorable value of the energy productivity indicator, which is one of the highest in the EU. The high level of development in the economic dimension was also observed in Sweden (2009, 2013–2016), Denmark (2009–2018), Ireland (2010–2015, 2016–2018), and France (2009–2012). The lowest level of development in the economic dimension was found in Malta (2009–2018), Bulgaria (2016–2017), Slovakia (2009–2013), Hungary (2009–2011), Cyprus (2012–2014), and the Czech Republic (2009–2011), among other countries.
The last immensely important, studied aspect was the social dimension, which concerned the issue of energy poverty of the EU countries’ inhabitants. The high level of sustainable development was found in Luxembourg, Sweden, Finland, the Netherlands (2009–2011, 2016–2018), and Denmark (2009, 2016). An exceptionally unfavorable situation in this dimension was reported in many EU countries, for example, in Bulgaria, Romania, Cyprus, Greece, Lithuania, Portugal, and Malta.
The inclusion of this indicator in the assessment of energy and climate sustainable development seems fully justified, although it has not been considered so far. However, according to the assumptions of the concept of sustainable development, this indicator is extremely important. Energy poverty is a situation in which a household or a person does not have the possibility of financing basic energy services (lighting, heating, cooling, mobility, and electricity), ensuring a decent standard of living. This is the consequence of low income, high energy costs, and poor energy efficiency of buildings, the heating of which is also a major environmental hazard [74,75]. In the EU as a whole, there are approximately 50 million families living in energy poverty, which is unbelievable. This is an immensely unfavorable situation that affects a large part of the EU population. Therefore, the social dimension seems fully justified to be included in the presented analysis.

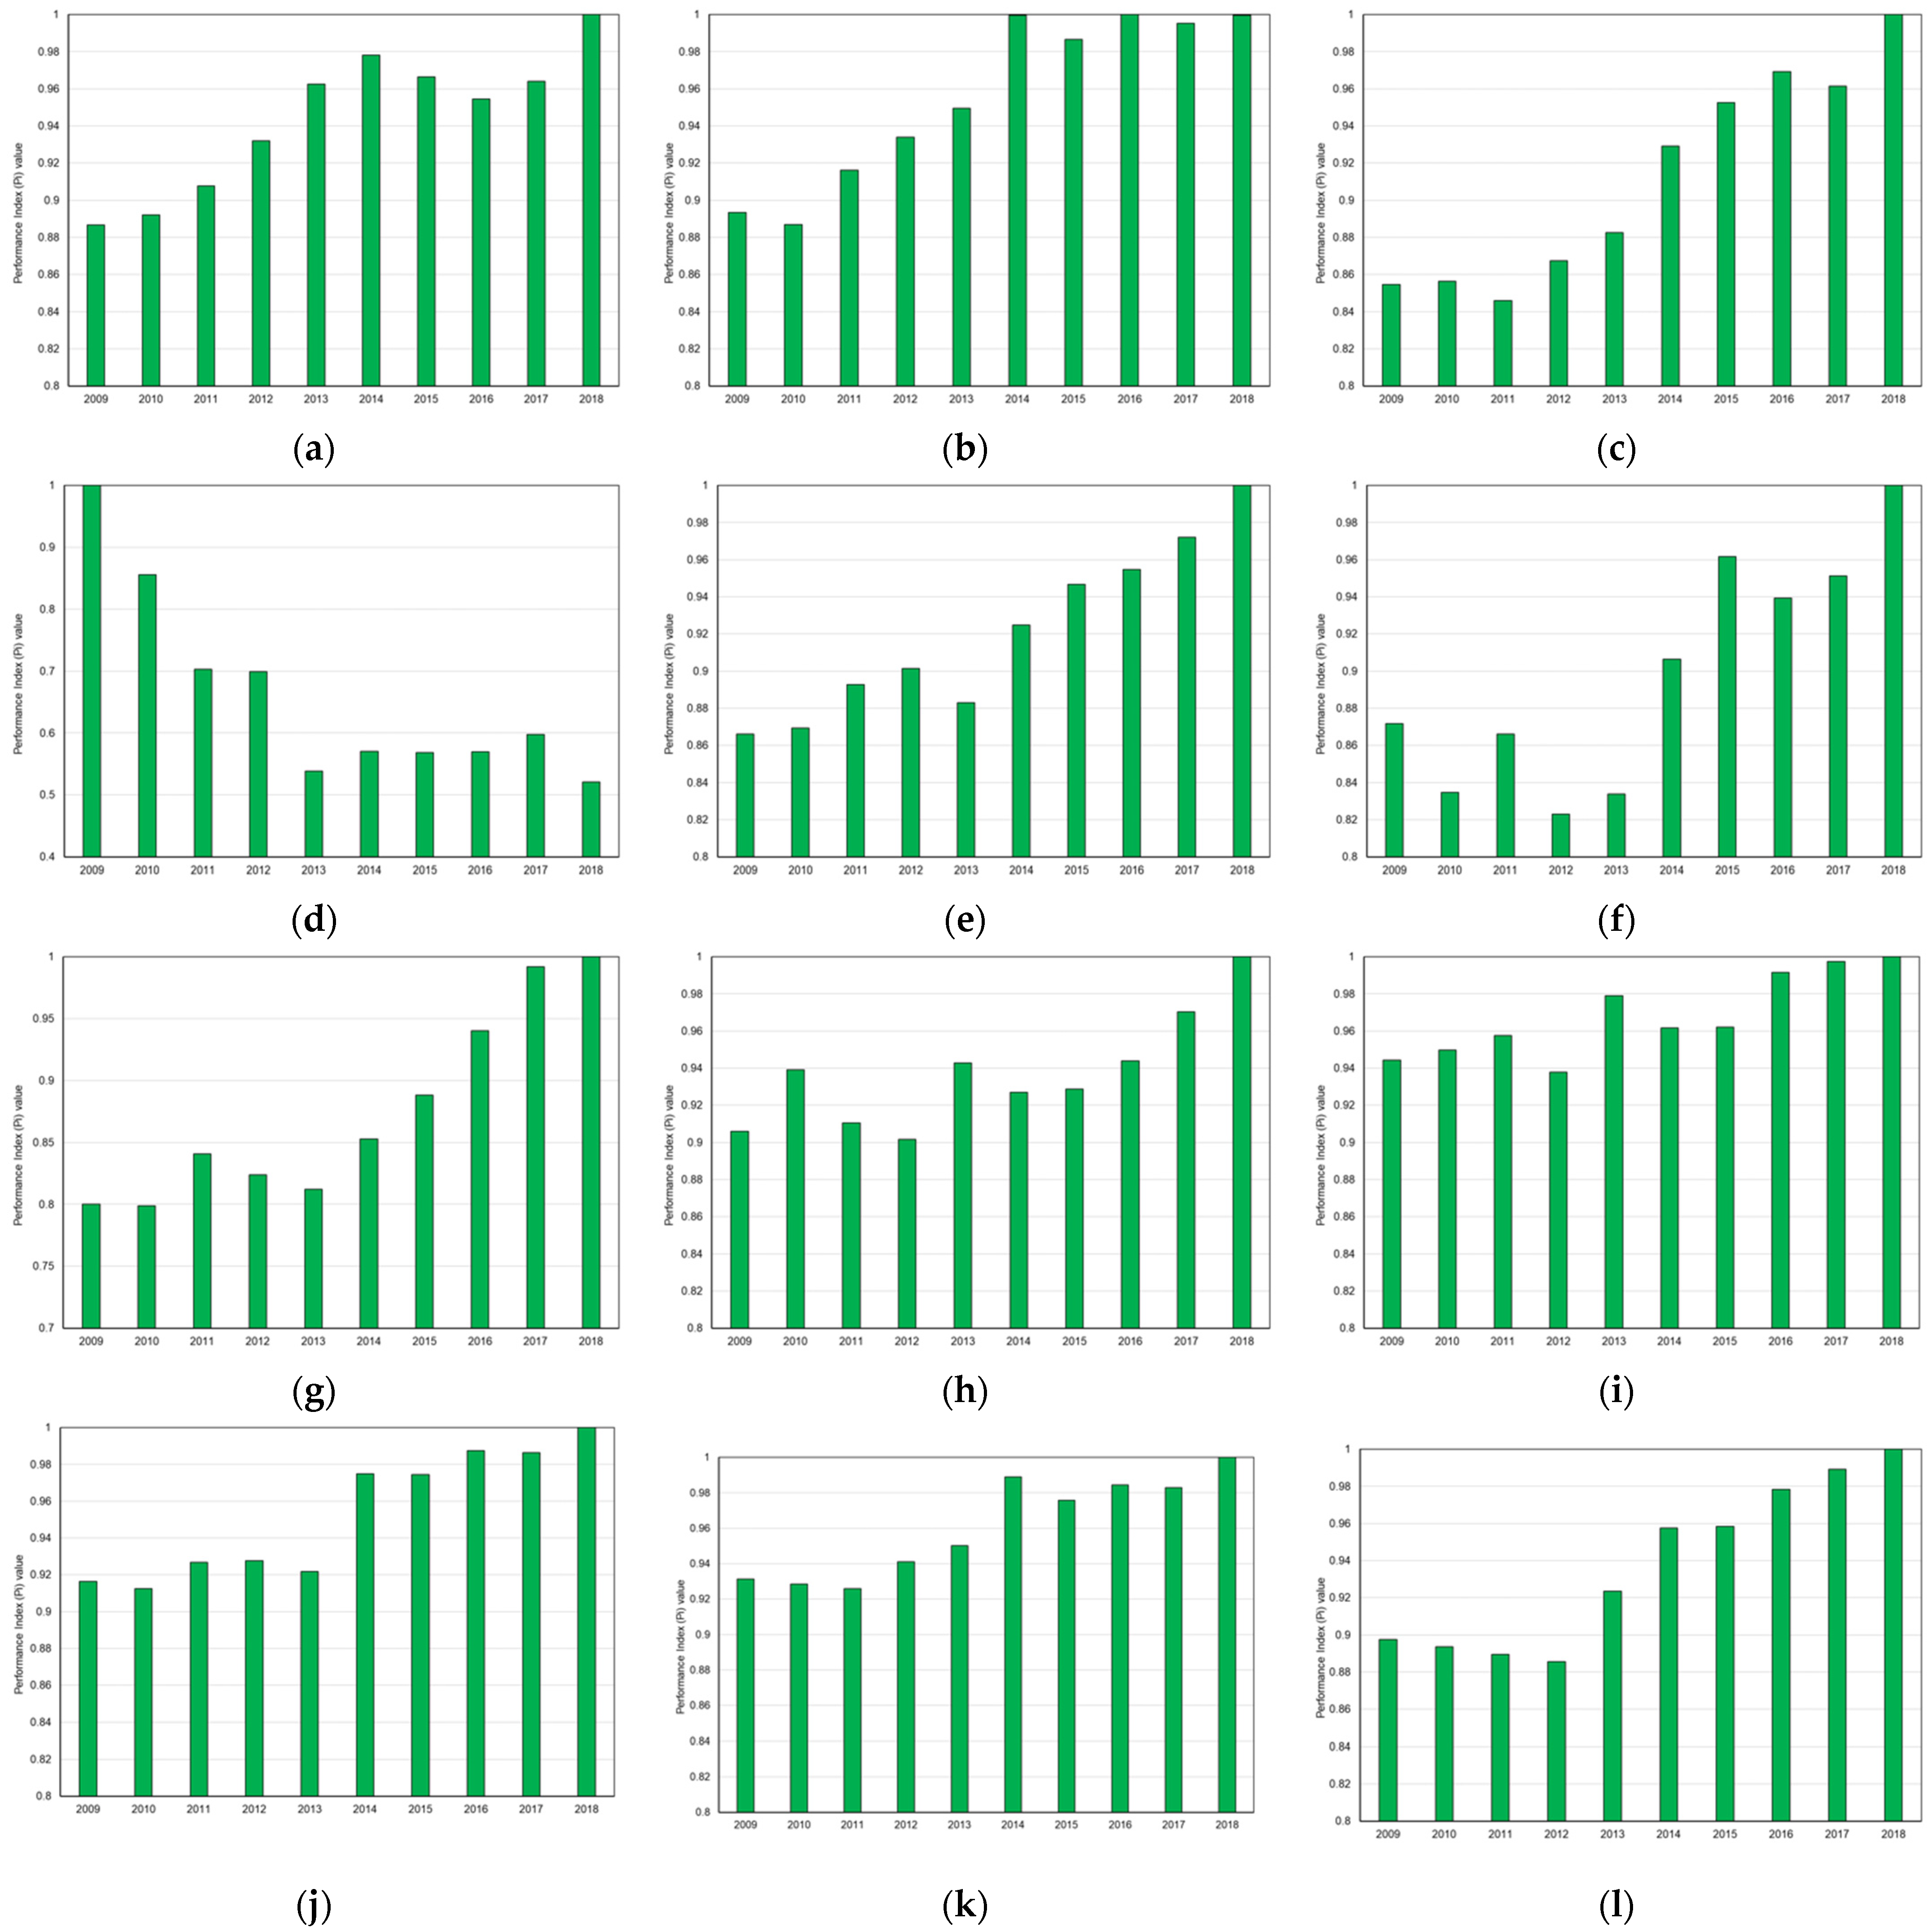
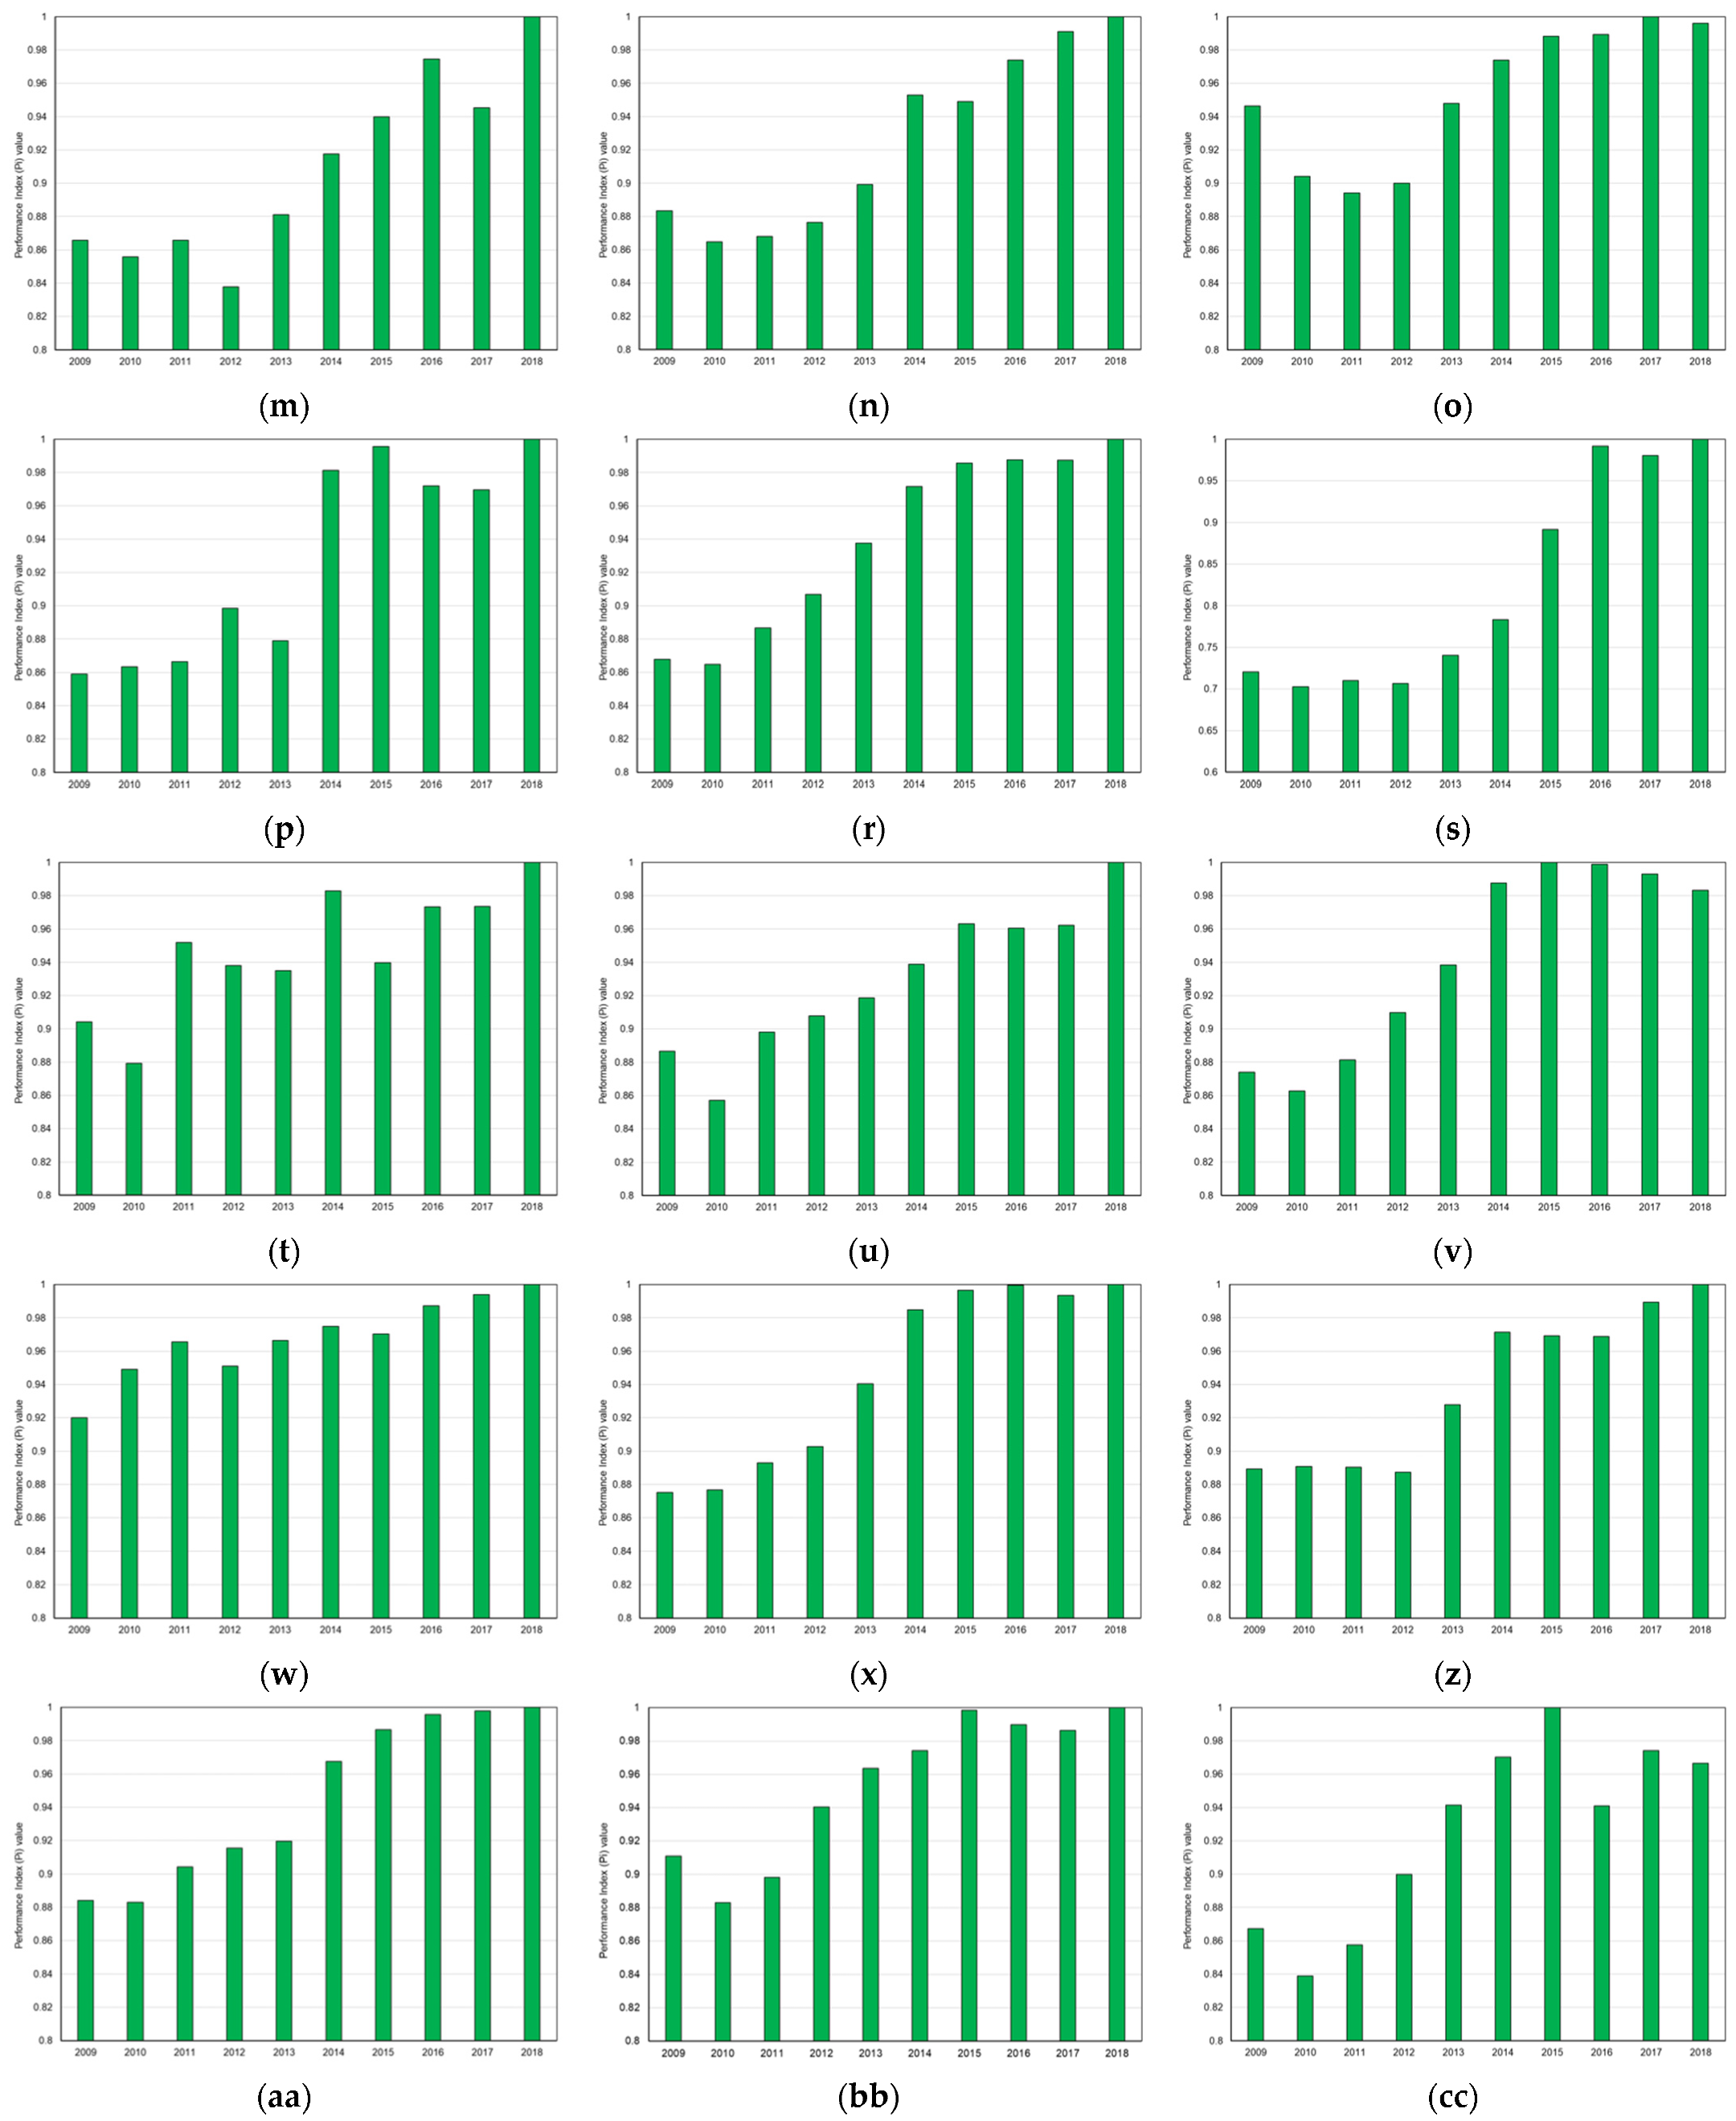
4.3. Assessing Individual EU27 Countries in Terms of Their Energy and Climate Sustainability between 2009–2018

This section presents the analysis of the trends of changes in energy and climate sustainability in individual EU countries for each study year. The purpose of this analysis was to show the trends of changes reported in these countries during the 10-year period.
Figure 7 presents the values of the Pi index of energy and climate sustainability in each EU-27 country in the studied years.
The results show a large variation in the trends of changes across countries. In many countries, there has been an upward trend since 2009, which is undoubtedly related to the EU energy and climate policy. The framework of this policy was adopted by the European Council in 2007, and the 2020 strategy, which is to stimulate sustainable economic development of the EU countries, was adopted by the European Commission only in 2010. It was in this strategy that the targets to be achieved by 2020 were set: namely, a reduction of at least 20% in GHG emissions compared to 1990 levels; an increase to 20% of renewable energy in all sources of energy consumed; and a 20% improvement in energy efficiency [11,76].
The results also show that in most EU countries, the largest increases were reported between 2011 and 2012, which may be the result of the implementation and execution of this strategy. In general, it can be seen that in many countries, 2018 was the best year for energy and climate sustainability. This is because the EU attaches particular importance to energy transition and protecting the environment from climate change. The results show that all EU countries are implementing the goals of the Europe 2020 strategy and the 2030 Agenda, albeit to varying degrees.
It can be concluded that very significant progress in sustainable development in the studied years was achieved by the Czech Republic, Germany, Estonia, Ireland, Lithuania, Hungary, Luxembourg, Malta, Poland, Slovakia, Romania, and Italy. These are countries, which have clearly reduced GHG emissions (both in total and from the energy sector), increased the share of RES in the energy mix [77], improved energy productivity, and reduced the level of energy poverty.
Among all the EU countries, Denmark clearly stands out. It is the only country where energy and climate sustainability does not show an upward trend. The main reason for this is the fact that in Denmark, between 2009–2012, the index of energy dependence on imports was characterized by a negative value, and since 2013, the energy dependence of the country on energy imports has been steadily increasing, which negatively affects the value of the Pi index of energy and climate sustainability.

5. Discussion

For many years, energy and climate policy has been the priority area of activity for the EU, and in recent years, it has become increasingly important [77,78]. Currently undertaken activities are closely related to the European Green Deal and are part of the implementation of the objectives of Agenda 2030 (goals: 7 on “Clean and Accessible Energy” and 13 on “Climate Action”), adopted in 2015 by the UN General Assembly. It resulted in very ambitious sustainability assumptions that focus on the transformation of the energy sector and the achievement of climate neutrality.
The main objectives of introducing sustainable economic development is to ensure the economic development of the EU and improve the state of the environment and the welfare of societies [79]. In these processes, energy policy, which is closely related to climate protection activities, is of great importance. It has resulted in a number of legislative acts, including the white paper with respect to renewable energy (1997), aimed at encouraging the implementation of sustainable energy and climate development [80]. They are designed to promote a market for renewable energy, encourage energy efficiency, and reduce GHG emissions into the atmosphere. A landmark year for this process was 2009, when the first groundbreaking legislation on climate change was adopted (Europe 2020 strategy). Therefore, the study presented in this paper includes data from that year onwards.
The aim of this study was to assess the level of the sustainable energy and climate development of the EU countries over a 10-year period based on 14 selected indicators characterizing the four main areas (dimensions) of the economic life of the EU countries (energy, environment, economy, and society).
The adopted set of indicators made it possible to assess the sustainable energy and climate development of the EU countries in a very broad range, considering many factors characterizing the diversity of the countries in question. Moreover, the values of the indicators like final energy consumption, primary energy consumption, final energy consumption in households, GHG emissions, and GDP were compared to the population of a given country, which additionally allowed us to consider the demographic factor. The classification and division of the EU countries was based on the value of the Pi index of sustainable energy and climate development determined on the basis of the adopted indicators by means of the entropy–COPRAS method.
The study showed significant changes in the values of the indicators adopted for the research in the examined period, which also translates into the results of the evaluation of the level of the EU sustainable energy and climate development. Particular variability was observed in the indicators of energy productivity, the share of renewable energy in gross final energy consumption, GHG emissions per capita, average CO2 emissions per km from new passenger cars, or population unable to keep home adequately warm by poverty status.
The findings showed that among all the EU countries, in the studied period, the high level of sustainable energy and climate development was reported for Sweden and France. Apart from 2010, Denmark can also be included in this group.
The low level of this development was reported for Bulgaria and Cyprus. The averaging of the assessment results confirmed the low level of this development in these countries during the whole studied period. Moreover, it also showed that the problem of the low level of sustainable energy and climate development also concerns Poland. The low level of sustainable development between 2014–2017 was also found in Greece, between 2011–2014 in Malta, between 2009–2011 and in 2018 in Poland, and for single years also in the Czech Republic, Estonia, Lithuania, and Luxembourg (the country with the highest values of GDP per capita [81]). The economic and social indicators were found to be really low in these countries, which results in the high exposure of their inhabitants to energy exclusion caused by the low quality of energy supplied, its availability, and high price [82,83]. These results show some differences versus the results presented in another work [15], in which the leaders in energy sustainability for 2017 included Denmark, Luxembourg, Austria, and Sweden, respectively, with Cyprus and Bulgaria ranking last. Luxembourg’s high position in this study was due to its wealth rather than energy or climate factors. The differences in terms of assessment were influenced by the different set of indicators adopted for the study and the fact that the authors did not take into account the weights for individual indicators of sustainable energy development.
Another study [66] also presents the results of the research on the ranking of the EU countries in terms of energy development. They were shown to differ from those obtained in this article. However, the analysis in this paper was conducted only for 18 countries, and the best results were achieved by Denmark and France.
Completely different results are presented in another paper [28], which evaluated sustainable energy development in the context of the share of RES in the energy mix. In this study, Germany was the leader of the ranking made for data from 2007–2016.
The results also made it possible to identify countries and the leaders of the ranking, in terms of the level of sustainable energy and climate development in individual dimensions (energy, climate, economic, and social) (Table 4). The results of this part of the study showed that the richest country in the EU in terms of GDP per capita was Luxembourg [60]. It was found to have reached a high development level in the economic and social dimensions, but for all indicators related to energy and climate dimensions, it was found to show only an average low level. The reasons include the highest energy consumption per capita in the EU (primary energy consumption, final energy consumption, and final energy consumption in households per capita), the low share of renewable energy in the energy mix, high dependence on energy imports, the highest GHG emissions per capita in the EU, and high energy prices.
When analyzing the results of the assessment of the level of sustainability of each country over the studied 10 years, it can be concluded that most of them showed an increasing trend. The only exception is Denmark, which is related to the deterioration of its energy independence [21]. In general, however, in most countries the values of the studied indicators were found to have improved. In some countries, such as Poland, Finland, and Sweden, it was noted that the best evaluated year was 2015. Unfortunately, after this year, in these countries, a temporary increase was reported in the values of indicators characterizing GHG emissions per capita—Poland, Finland (2015–2016, 2017–2018); final energy consumption—Sweden, Finland, Poland (2015–2018); and energy imports—Sweden (2015–2016) and Poland (2015–2018).
Sweden was found to be the clear leader in sustainable energy and climate development among the EU-27 countries during the studied period (Table 2), as well as in terms of the climate dimension. This is due to the energy transition that started in the 1970s. Moreover, Sweden has a long tradition of developing an ambitious environmental policy [67,68,69,83,84]. In this case, several issues are worth noting. Only two countries (Luxembourg and Finland) consume more primary energy per capita than Sweden, and yet the carbon dioxide emissions per capita are relatively low when compared to other EU-27 countries. The average carbon dioxide emissions between 2009–2018 were reported to be 6.0 tons per capita (only Latvia showed lower emissions—5.9), while in the richest country like Luxembourg, these emissions were found to be 23 tons per capita (almost four times higher). At the same time, the low emissions of harmful substances are accompanied by the economic growth of the country. Between 2009 and 2018, Sweden ranked fourth among all EU countries in terms of average GDP per capita. This result also has an impact on the problem of energy poverty, which is very low in Sweden. On average, just over 1.8% of the population was affected during the studied period, while in Bulgaria, a country with the low level of energy and climate sustainability, the problem affected on average over 44% of the country’s population during the period in question.
Another country that showed favorable results is Denmark. This country’s high level of energy and climate sustainability is the result of the long process of energy transition that began in the 1970s. The oil crisis, dependence on imports, and environmental pollution were the main determinants of this process consisting in moving away from fossil fuels toward RES, mainly wind energy [69,85]. Denmark’s high score was influenced by the fact that between 2009–2012, it was the only net exporter of energy among the EU member states, but in 2013 Danish energy imports exceeded exports, and this trend was confirmed in the following five years until 2018.
By contrast, very poor results were reported for Bulgaria. It is a country with the lowest average value of GDP per capita, among the EU countries in the studied years, which amounted to only 6165 Euros (it is slightly better in Romania, where the level of sustainable energy and environmental development in the studied period was assessed as medium low). However, this country is gradually developing a renewable energy sector based on domestic energy sources [86]. Their development is visible in the presented results, and it should be assumed that in the coming years, Bulgaria’s indicators will significantly improve. While in 2009, the country imported about 45% of energy, and in 2018, this indicator dropped to just over 36%, which is the fifth lowest result in the entire EU-27. The increase in electricity production from RES reduced the environmental footprint of the country’s energy system in terms of GHG emissions. However, the total environmental footprint in terms of GHG emissions increased from 7.9 to 8.1 tons per capita. Nevertheless, Bulgaria still remains a country where the problem of energy poverty affects a large number of inhabitants (an average value for 2009–2018 amounts to 44%).
A country that is heavily dependent on imported energy (nearly 93% in 2018) is Cyprus. However, the country is gradually increasing the use of RES. As the Cypriot energy system is based on conventional energy sources, the country also has one of the highest GHG emissions from the energy sector and total GHG emissions per capita. In addition, it also has one of the highest average CO2 emissions per km from new passenger cars. By contrast, the energy poverty rate of the country’s residents—which affects nearly 22% of citizens—remained unchanged between 2009 and 2018.
When looking at the listed countries in terms of energy and climate sustainability, Luxembourg should be highlighted. This country was found to be the richest in terms of GDP per capita of all EU countries. However, despite the best economic conditions and the lowest degree of energy poverty (high level of development of the country in economic and social dimensions—Figure 6, Table 4), it is a country with an average low level of energy and climate sustainability. This is influenced by several factors. Luxembourg’s energy system is characterized by high import and fossil fuel dependence. The country’s renewable energy share between 2009–2018 was one of the lowest in the EU countries, with only 2.9% in 2009 and 9.1% in 2018 (only Malta and the Netherlands had a lower share in 2018). Therefore, Luxembourg has implemented a renewable energy transfer policy to achieve the EU RES targets. These transfers (from Estonia and Lithuania) will be used to close the gap to the 2020 target of 11% renewable energy in gross final energy consumption. Luxembourg’s energy-efficiency improvements were reported to be positive until 2016 but have recently been increasing again. Poland, Portugal, Hungary, the Czech Republic, and Denmark are also facing similar problems. However, Luxembourg has a policy aimed at introducing stricter targets and a more robust approach to energy transition in the EU [87].
In general, the countries studied comply with the EU’s commitments contained in the climate and energy package, for example, increasing the share of renewable energy and improving energy efficiency, mainly in order to reduce greenhouse gas emissions. However, the level of effectiveness in this area varies in individual countries.
Nevertheless, as the authors of one paper [88] indicate, the EU countries should make much more effort to reduce energy consumption and increase the share of RES to achieve the goal of reducing greenhouse gas emissions, which is set out in the Paris Agreement.
Due to the comprehensiveness of the paper, the discussion of the results concerned only the most important issues, according to the authors. The findings enable a much broader discussion. This is because it is possible to refer to the analysis of the variability of individual indicators for the studied countries, the analysis of trends in their changes, the analysis of similarity, and many other aspects. The possibilities of studying these results and making conclusions based on them are very large. The choice in this area is left to the readers of the article, especially since the available literature lacks the approach presented in this paper for the analysis of the state of sustainable energy and climate development for any group of countries.

6. Conclusions, Policy Implications, and Direction of Future Research

The results presented in the paper add value to the current state of knowledge and may contribute to other possibilities of monitoring progress in the implementation of the EU Sustainable Development Strategy for modern energy and climate activities.
The issues related to the implementation of the principles of sustainable economic development is currently one of the most interesting research topics. The legitimacy of undertaking this subject stems from the need for changes in the global economy to protect the environment and provide development opportunities for future generations. These goals are becoming increasingly dominant in individual regions of the world. The unquestionable leader in the process of transforming the economy in accordance with the idea of sustainable development is the European Union. Of key importance for the effectiveness of this process are changes in the energy sector, which significantly influenced the current climate problems. Therefore, the EU is undertaking, to a significant extent, actions aimed at improving the state of the environment, through the implementation of ambitious goals related to the sustainable development idea, included in the concept of the European Green Deal and Agenda 2030.
As a result of these activities, the EU is currently the absolute leader in implementing concepts and ideas related to both climate protection and sustainable development.
The findings presented in this paper fit well into this area of the EU activity. The Pi index, adopted in the study, enabled an objective assessment of the EU countries for the period 2009–2018 in terms of sustainable energy and climate development. It can be assumed that the value of this index, determined on the basis of 14 indicators representing energy, climate, social, and economic dimensions, is an objective measure of sustainable energy and climate development. Therefore, this analysis considered the priority areas of the EU’s activities in terms of the latest concept of the European Green Deal and goals 7 and 13 of the 2030 Agenda for Sustainable Development.
The results show that throughout the studied assessment period, significant changes were observed in the values of input indicators, which directly affected the value of their weights and thus the value of the Pi index—which was the basis for the assessment of this level. They also show the trends and effects of actions undertaken by the countries in the examined areas and years.
In addition, both leaders in transformation and countries that still have a lot to do in the field of energy transition and climate protection were reported.
The created ranking of the EU countries and their division into four groups clearly identifies countries that require more intensive assistance, both in terms of content and finance. It is obvious that changes related to sustainable economy require investments and not all EU countries are able to finance them. Among the countries that require special attention in this regard are Bulgaria, Cyprus, Poland, Estonia, Greece, Lithuania, Malta, the Czech Republic, and Luxembourg. Climate protection is a global problem, and its implementation requires solidarity from the more affluent countries for the benefit of those with problems. It seems that in the case of the EU, this solidarity and cooperation is generally considered the standard, without which the very ambitious plans contained in the concept of the European Deal Green and the 2030 Agenda cannot be achieved.
It should be emphasized that the transition paths of individual countries to achieve sustainable energy and climate development in the EU differ between member states. Despite the overarching goal of the entire EU, individual countries, depending on their internal situation, implement their own policies. This is due to the great economic diversity of individual countries, their economic potential, geopolitical location, and other factors. It should also be remembered that the EU consists of as many as 27 rather small countries. Therefore, it seems obvious to target financial actions to groups of countries with similar conditions and problems, as well as to use the experience of the leaders in the field of energy transition and climate protection. The presented analysis covers both these elements. On the one hand, it identifies countries with the best results in order to benefit from their experience (e.g., Sweden, Denmark, France, and Austria), and on the other hand, it identifies groups of countries that should cooperate to achieve the assumed objectives (e.g., Poland and Bulgaria). These analyses also point to the possibility of specializing in certain elements of energy policy by individual countries, such as obtaining energy from RES.
In addition, the time requirements for achieving certain goals must be adjusted to the economic possibilities of all member states. Researchers working on this topic point out, for example, that in some countries of Central and Eastern Europe, the energy and climate transition will generate enormous and much higher costs than in more developed countries [89,90,91]. This is the result of a different energy structure and outdated energy systems (e.g., in Poland and Bulgaria). These challenges may cause many adverse effects, such as an increase in energy prices, loss of jobs, and thus slow down economic development, while at the same time hindering social acceptance of the new energy and climate policy.
The conducted research has also confirmed the great diversity of the EU countries, which, on the one hand, is an unquestionable advantage and testifies to its size but on the other hand, may also constitute a serious barrier to the implementation of common policies, such as energy and climate policy.
Energy and climate sustainability is the essential component of sustainable development. It is the process of sustainable, safe, and effective provision of energy and climate protection for present and future generations.
The application of the entropy–COPRAS method for multicriteria analysis, which belongs to the group of multicriteria assessment methods, should be evaluated positively. The results define a new dimension of research on the sustainable energy and climate development of the EU countries. This method is universal and can be successfully used to analyze other groups of countries.
In terms of the sustainable energy and climate development of individual countries and groups of countries from different regions worldwide, it is necessary to conduct further research, especially on the methodology of the construction of indicators that allow the most objective assessment of the changes made.
It should also be borne in mind that these indicators consider factors specific to individual countries. This means that the set of indicators must be adjusted in terms of their meaning and practical usefulness. At the same time, they should be balanced in terms of representing all the necessary dimensions that make up the sustainable energy and climate development of countries, i.e., the energy, climate, economic, and social dimensions.
Therefore, it is advisable to carry out further research in the field of the implementation of energy and climate policies of both countries and their groups in order to continuously evaluate the introduced changes and identify problems in their implementation.

Author Contributions

Conceptualization, M.T. and J.B.; methodology, J.B. and M.T.; software, M.T. and J.B.; formal analysis, J.B. and M.T.; investigation, J.B. and M.T.; resources, M.T., J.B., and P.B.; data curation, M.T. and J.B.; writing—original draft preparation, M.T. and J.B.; writing—review and editing, J.B. and M.T.; visualization, M.T.; supervision, M.T. and J.B.; project administration, M.T. and J.B.; funding acquisition, M.T. All authors have read and agreed to the published version of the manuscript.

Funding

This publication was funded by the Silesian University of Technology, grant number 06/030/RGJ20/0050 (Rector’s Grants in Research and Development) and by the statutory research performed at Silesian University of Technology, Department of Safety Engineering, Faculty of Mining, Safety Engineering and Industrial Automation (06/030/BK/BKM_21).

Institutional Review Board Statement

Not applicable.

Informed Consent Statement

Not applicable.

Data Availability Statement

All data retrieved from Eurostat datasets: https://ec.europa.eu/eurostat/data/database (accessed on 5 January 2021).

Conflicts of Interest

The authors declare no conflict of interest.

References

  1. Treaty of Lisbon Amending the Treaty on European Union and the Treaty Establishing the European Community. Available online: https://eur-lex.europa.eu/legal-content/EN/TXT/?uri=CELEX:12007L/TXT (accessed on 11 January 2021).
  2. Tucki, K.; Orynycz, O.; Mitoraj-Wojtanek, M. Perspectives for Mitigation of CO2 Emission due to Development of Electromobility in Several Countries. Energies 2020, 13, 4127. [Google Scholar] [CrossRef]
  3. Tucki, K.; Orynycz, O.; Wasiak, A.; Świć, A.; Mieszkalski, L.; Wichłacz, J. Low Emissions Resulting from Combustion of Forest Biomass in a Small Scale Heating Device. Energies 2020, 13, 5495. [Google Scholar] [CrossRef]
  4. Vera, I.; Langlois, L. Energy indicators for sustainable development. Energy 2007, 32, 875–882. [Google Scholar] [CrossRef]
  5. Streimikiene, D.; Ciegis, R.; Grundey, D. Energy indicators for sustainable development in Baltic States. Renew. Sustain. Energy Rev. 2007, 11, 877–893. [Google Scholar] [CrossRef]
  6. WTI. What Is Green Energy? (Definition, Types and Examples). Available online: https://www.twi-global.com/technical-knowledge/faqs/what-is-green-energy (accessed on 11 January 2021).
  7. Greenhouse Gas Emissions by Country and Sector. Available online: https://www.europarl.europa.eu/news/en/headlines/society/20180301STO98928/greenhouse-gas-emissions-by-country-and-sector-infographic (accessed on 11 January 2021).
  8. Kaygusuz, K. Energy for sustainable development: A case of developing countries. Renew. Sustain. Energy Rev. 2012, 16, 1116–1126. [Google Scholar] [CrossRef]
  9. A European Green Deal. Available online: https://ec.europa.eu/info/strategy/priorities-2019-2024/european-green-deal_en (accessed on 11 January 2021).
  10. Energy Union. Available online: https://ec.europa.eu/info/energy-climate-change-environment/overall-targets/2030-targets/energy-union_en (accessed on 11 January 2021).
  11. Directive 2009/28/EC of the European Parliament and of the Council of 23 April 2009 on the Promotion of the Use of Energy from Renewable Sources and Amending and Subsequently Repealing Directives 2001/77/EC and 2003/30/EC. Available online: https://eur-lex.europa.eu/legal-content/EN/ALL/?uri=CELEX%3A32009L0028 (accessed on 10 October 2020).
  12. UN Climate Change Conference. Available online: https://unfccc.int/cop25 (accessed on 10 October 2020).
  13. Mideksa, T.T.; Kallbekken, S. The impact of climate change on the electricity market: A review. Energy Policy 2010, 38, 3579–3585. [Google Scholar] [CrossRef]
  14. Shaik, S.; Yeboah, O.-A. Does climate influence energy demand? A regional analysis. Appl. Energy 2018, 15, 691–703. [Google Scholar] [CrossRef]
  15. Ligus, M.; Peternek, P. The Sustainable Energy Development Index—An Application for European Union Member States. Energies 2021, 14, 1117. [Google Scholar] [CrossRef]
  16. Gunnarsdottir, I.; Davidsdottir, B.; Worrell, E.; Sigurgeirsdottir, S. Review of indicators for sustainable energy development. Renew. Sustain. Energy Rev. 2020, 133, 110294. [Google Scholar] [CrossRef]
  17. Shortall, R.; Davidsdottir, B. How to measure national energy sustainability performance: An Icelandic case-study. Energy Sustain. Dev. 2017, 39, 29–47. [Google Scholar] [CrossRef]
  18. Narula, K.; Reddy, B.S. Three blind men and an elephant: The case of energy indices to measure energy security and energy sustainability. Energy 2015, 80, 148–158. [Google Scholar] [CrossRef]
  19. Nerini, F.F.; Tomei, J.; To, L.S.; Bisaga, I.; Parikh, P.; Black, M.; Borrion, A.; Spataru, C.; Broto, V.; Anandarajah, G.; et al. Mapping synergies and trade-offs between energy and the sustainable development goals. Nat. Energy 2018, 3, 10–15. [Google Scholar] [CrossRef] [Green Version]
  20. Wang, J.J.; Jing, Y.Y.; Zhang, C.; Zhao, J. Review on multi-criteria decision analysis aid in sustainable energy decision-making. Renew. Sustain. Energy Rev. 2009, 13, 2263–2278. [Google Scholar] [CrossRef]
  21. Eurostat Database. Available online: https://ec.europa.eu/eurostat/data/database (accessed on 11 January 2021).
  22. Streimikiene, D.; Klevas, V.; Bubeline, J. Use of EU structural funds for sustainable energy development in new EU member states. Renew. Sustain. Energy Rev. 2007, 11, 1167–1187. [Google Scholar] [CrossRef]
  23. Garcia-Alvarez, M.T.; Moreno, B.; Soares, I. Analyzing the sustainable energy development in the EU-15 by an aggregated synthetic index. Ecol. Indic. 2016, 60, 996–1007. [Google Scholar] [CrossRef]
  24. Su, W.; Ye, W.; Zhang, C.; Balezentis, T.; Streimikiene, D. Sustainable energy development in the major power-generating countries of the European Union: The Pinch Analysis. J. Clean. Prod. 2020, 256, 120696. [Google Scholar] [CrossRef]
  25. Streimikiene, D.; Siksnelyte, I.; Zavadskas, E.K.; Cavallaro, F. The Impact of Greening Tax Systems on Sustainable Energy Development in the Baltic States. Energies 2018, 11, 1193. [Google Scholar] [CrossRef] [Green Version]
  26. Lu, J.; Ren, L.; Yao, S.; Qiao, J.; Strielkowski, W.; Streimikis, J. Comparative Review of Corporate Social Responsibility of Energy Utilities and Sustainable Energy Development Trends in the Baltic States. Energies 2019, 12, 3417. [Google Scholar] [CrossRef] [Green Version]
  27. Momete, D.C. Measuring Renewable Energy Development in the Eastern Bloc of the European Union. Energies 2017, 10, 2120. [Google Scholar] [CrossRef] [Green Version]
  28. Wang, Q.; Zhan, L. Assessing the sustainability of renewable energy: An empirical analysis of selected 18 European countries. Sci. Total Environ. 2019, 692, 529–545. [Google Scholar] [CrossRef]
  29. Brundtland, G.H. World Commission on Environment and Development. In Our Common Future; Brundtland Commission: New York, NY, USA, 1987. [Google Scholar]
  30. United Nations Sustainable Development, Agenda 21; United Nations: Rio de Janeiro, Brazil, 1992.
  31. United Nations United. Nations Framework Convention on Climate Change, New York. 1992. Available online: https://unfccc.int/resource/docs/convkp/conveng.pdf (accessed on 15 March 2021).
  32. United Nations. Kyoto Protocol to the United Nations Framework Convention on Climate Change. 1998. Available online: https://unfccc.int/resource/docs/convkp/kpeng.pdf (accessed on 15 March 2021).
  33. United Nations. General Assembly A/RES/55/2 United Nations Millennium Declaration, New York. 2000. Available online: https://www.un.org/en/development/desa/population/migration/generalassembly/docs/globalcompact/A_RES_55_2.pdf (accessed on 15 March 2021).
  34. United Nations. E/2001/29 Commission on Sustainable Development: Report on the Ninth Session. 2001. Available online: https://www.un.org/esa/sustdev/csd/ecn172001-19e.htm (accessed on 15 March 2021).
  35. United Nations. Report of the World Summit on Sustainable Development A/CONF.199/20*, Johannesburg. 2002. Available online: https://digitallibrary.un.org/record/478154 (accessed on 15 March 2021).
  36. United Nations Development Programme; United Nations Department of Economic and Social Affairs; World Energy Council. World Energy Assessment: Overview 2004 Update, New York. 2004. Available online: https://sustainabledevelopment.un.org/content/documents/2420World_Energy_Assessment_Overview_2004_Update.pdf (accessed on 15 March 2021).
  37. United Nations General Assembly. A/RES/65/1 Keeping the Promise: United to Achieve the Millennium Development Goals. 2010. Available online: https://www.unwomen.org/en/docs/2010/10/un-general-assembly-resolution-65-1 (accessed on 15 March 2021).
  38. Ki-moon, B. Sustainable Energy for All: A Vision Statement by Ban Ki-Moon Secretary-General of the United Nations. New York. 2011. Available online: https://www.seforall.org/system/files/gather-content/SG_Sustainable_Energy_for_All_vision.pdf (accessed on 15 March 2021).
  39. United Nations. General Assembly Transforming Our World: The 2030 Agenda for Sustainable Development. New York. 2015. Available online: https://sdgs.un.org/2030agenda (accessed on 15 March 2021).
  40. Wang, B.; Wang, Q.; Wei, Y.-M.; Li, Z.-P. Role of renewable energy in China’s energy security and climate change mitigation: An index decomposition analysis. Renew. Sustain. Energy Rev. 2018, 90, 187–194. [Google Scholar] [CrossRef]
  41. Zhao, H.; Guo, S. External Benefit Evaluation of Renewable Energy Power in China for Sustainability. Sustainability 2015, 7, 4783–4805. [Google Scholar] [CrossRef] [Green Version]
  42. Erdil, A.; Erbıyık, H. Renewable energy sources of Turkey and assessment of sustainability. Procedia Soc. Behav. Sci. 2015, 207, 669–679. [Google Scholar] [CrossRef] [Green Version]
  43. Petinrin, J.O.; Shaaban, M. Renewable energy for continuous energy sustainability in Malaysia. Renew. Sustain. Energ. Rev. 2015, 50, 967–981. [Google Scholar] [CrossRef]
  44. Yu, S.; Zheng, Y.; Li, L. A comprehensive evaluation of the development and utilization of China’s regional renewable energy. Energy Policy 2019, 127, 73–86. [Google Scholar] [CrossRef]
  45. Fang, D.; Shi, S.; Yu, Q. Evaluation of Sustainable Energy Security and an Empirical Analysis of China. Sustainability 2018, 10, 1685. [Google Scholar] [CrossRef] [Green Version]
  46. Saraswat, S.K.; Digalwar, A.K. Evaluation of energy alternatives for sustainable development of energy sector in India: An integrated Shannon’s entropy fuzzy multi-criteria decision approach. Renew. Energy 2021, 171, 58–74. [Google Scholar] [CrossRef]
  47. Adenle, A.A. Assessment of solar energy technologies in Africa-opportunities and challenges in meeting the 2030 agenda and sustainable development goals. Energy Policy 2020, 137, 111180. [Google Scholar] [CrossRef]
  48. Chudy-Laskowska, K.; Pisula, T.; Liana, M.; Vasa, L. Taxonomic Analysis of the Diversity in the Level of Wind Energy Development in European Union Countries. Energies 2020, 13, 4371. [Google Scholar] [CrossRef]
  49. Su, W.; Zhang, D.; Zhang, C.; Streimikiene, D. Sustainability assessment of energy sector development in China and European Union. Sustain. Dev. 2020, 28, 1063–1076. [Google Scholar] [CrossRef]
  50. Sobczyk, W.; Sobczyk, E.J. Varying the Energy Mix in the EU-28 and in Poland as a Step towards Sustainable Development. Energies 2021, 14, 1502. [Google Scholar] [CrossRef]
  51. Coccia, M. Energy metrics for driving competitiveness of countries: Energy weakness magnitude, GDP per barrel and barrels per capita. Energy Policy 2010, 38, 1330–1339. [Google Scholar] [CrossRef]
  52. Cîrstea, S.D.; Moldovan-Teselios, C.; Cîrstea, A.; Turcu, A.C.; Darab, C.P. Evaluating Renewable Energy Sustainability by Composite Index. Sustainability 2018, 10, 811. [Google Scholar] [CrossRef] [Green Version]
  53. Yu, L.; Xue, B.; Stückrad, S.; Thomas, H.; Cai, G. Indicators for energy transition targets in China and Germany: A text analysis. Ecol. Indic. 2020, 111, 106012. [Google Scholar] [CrossRef]
  54. Reuter, M.; Patel, M.; Eichhammer, W. Applying ex post index decomposition analysis to final energy consumption for evaluating European energy efficiency policies and targets. Energy Effic. 2019, 12, 1329–1357. [Google Scholar] [CrossRef] [Green Version]
  55. Onat, N.; Bayer, H. The sustainability indicators of power production systems. Renew. Sustain. Energy Rev. 2010, 14, 3108–3115. [Google Scholar] [CrossRef]
  56. Kulei Pak, B.; Albayrak, Y.; Erenslal, Y. Renewable Energy Perspective for Turkey Using Sustainability Indicators. Int. J. Comput. Intell. Syst. 2015, 8, 187–197. [Google Scholar] [CrossRef] [Green Version]
  57. Streimikiene, D.; Šivickas, G. The EU sustainable energy policy indicators framework. Environ. Int. 2008, 34, 1227–1240. [Google Scholar] [CrossRef]
  58. Zhao, Z.-Y.; Chen, Y.-L. Critical factors affecting the development of renewable energy power generation: Evidence from China. J. Clean. Prod. 2018, 184, 466–480. [Google Scholar] [CrossRef]
  59. Aguirre, M.; Ibikunle, G. Determinants of renewable energy growth: A global sample analysis. Energy Policy 2014, 69, 374–384. [Google Scholar] [CrossRef] [Green Version]
  60. Andrejiová, M.; Grincova, A.; Marasová, D. Study of the Percentage of Greenhouse Gas Emissions from Aviation in the EU-27 Countries by Applying Multiple-Criteria Statistical Methods. Int. J. Environ. Res. Public Health 2020, 17, 3759. [Google Scholar] [CrossRef]
  61. Ghenai, C.; Albawab, M.; Bettayeb, M. Sustainability indicators for renewable energy systems using multi-criteria decision-making model and extended SWARA/ARAS hybrid method. Renew. Energy 2020, 146, 580–597. [Google Scholar] [CrossRef]
  62. Zavadskas, E.K.; Kaklauskas, A.; Peldschus, F.; Turskis, Z. Multi-attribute assessment of road design solutions by using the COPRAS method. Balt. J. Road Bridge. Eng. 2007, 2, 193–203. [Google Scholar]
  63. Zhu, Y.; Tian, D.; Yan, F. Effectiveness of Entropy Weight Method in Decision-Making. Math. Probl. Eng. 2020, 2020, 3564835. [Google Scholar] [CrossRef]
  64. Song, M.; Zhu, Q.; Peng, J.; Santibanez Gonzalez, E. Improving the evaluation of cross efficiencies: A method based on Shannon entropy weight. Comput. Ind. Eng. 2017, 112, 99–106. [Google Scholar] [CrossRef]
  65. Campos, N.F.; Coricelli, F.; Moretti, L. Institutional integration and economic growth in Europe. J. Monet. Econ. 2019, 103, 88–104. [Google Scholar] [CrossRef]
  66. Vavrek, R.; Chovancová, J. Energy Performance of the European Union Countries in Terms of Reaching the European Energy Union Objectives. Energies 2020, 13, 5317. [Google Scholar] [CrossRef]
  67. Hultman, N.l.; Malone, E.; Runci, P.; Carlock, G.; Anderson, K. Factors in low-carbon energy transformations: Comparing nuclear and bioenergy in Brazil, Sweden, and the United States. Energy Policy 2012, 40, 131–146. [Google Scholar] [CrossRef]
  68. Lindmark, M.; Bergquist, A.-K.; Andersson, L.F. Energy transition, carbon dioxide reduction and output growth in the Swedish pulp and paper industry: 1973–2006. Energy Policy 2011, 39, 5449–5456. [Google Scholar] [CrossRef]
  69. Parajuli, R. Looking into the Danish energy system: Lesson to be learned by other communities. Renew. Sustain. Energy Rev. 2012, 16, 2191–2199. [Google Scholar] [CrossRef]
  70. Eikeland, P.; Hakon, T.; Inderberg, J. Energy system transformation and long-term interest constellations in Denmark: Can agency beat structure? Energy Res. Soc. Sci. 2016, 11, 164–173. [Google Scholar] [CrossRef] [Green Version]
  71. Komendantova, N. Energy transition in the Austrian Climate and Energy model regions: A multi-risk participatory governance perspective on regional resilience. Procedia Eng. 2018, 212, 15–21. [Google Scholar] [CrossRef]
  72. Climate Change Performance Index. Available online: https://germanwatch.org/sites/germanwatch.org/files/publication/16482.pdf (accessed on 10 October 2020).
  73. EU Protects. Our Society. Escaping Energy Poverty: How the EU Is Making Sure Families Aren’t Left Out in the Cold. Available online: https://europa.eu/euprotects/our-society/escaping-energy-poverty-how-eu-making-sure-families-arent-left-out-cold_enpdf (accessed on 10 December 2020).
  74. Phoumin, H.; Kimura, F. Cambodia’s energy poverty and its effects on social wellbeing: Empirical evidence and policy implications. Energy Policy 2019, 132, 283–289. [Google Scholar] [CrossRef]
  75. Jessel, S.; Sawyer, S.; Hernández, D. Energy, Poverty, and Health in Climate Change: A Comprehensive Review of an Emerging Literature. Front Public Health 2019, 7, 357. [Google Scholar] [CrossRef] [PubMed] [Green Version]
  76. 2020 Climate & Energy Package. Available online: https://ec.europa.eu/clima/policies/strategies/2020_enpdf (accessed on 10 December 2020).
  77. Rokicki, T.; Perkowska, A. Diversity and Changes in the Energy Balance in EU Countries. Energies 2021, 14, 1098. [Google Scholar] [CrossRef]
  78. Matláry, J.A. Energy Policy in the European Union; The European Union Series; Palgrave: London, UK, 1997. [Google Scholar] [CrossRef]
  79. Chovancová, J.; Vavrek, R. Decoupling analysis of energy consumption and economic growth of v4 countries. Problemy Ekorozwoju—Probl. Sustain. Dev. 2019, 14, 159–165. [Google Scholar]
  80. Renewable Energy: White Paper Laying Down a Community Strategy and Action Plan. Available online: https://eur-lex.europa.eu/legal-content/EN/TXT/?uri=LEGISSUM%3Al27023 (accessed on 10 December 2020).
  81. Simionescu, M.; Bilan, Y.; Krajňáková, E.; Streimikiene, D.; Gędek, S. Renewable Energy in the Electricity Sector and GDP per Capita in the European Union. Energies 2019, 12, 2520. [Google Scholar] [CrossRef] [Green Version]
  82. Bouzarovski, S.; Herrero, S.T. The energy divide: Integrating energy transitions, regional inequalities and poverty trends in the European Union. Eur. Urban Reg. Stud. 2017, 24, 69–86. [Google Scholar] [CrossRef] [Green Version]
  83. Bouzarovski, S.; Petrova, S.; Sarlamanov, R. Energy poverty policies in the EU: A critical perspective. Energy Policy 2012, 49, 76–82. [Google Scholar] [CrossRef]
  84. Jacobsson, S.; Bergek, A. Transforming the energy sector: The evolution of technological systems in renewable energy technology. Ind. Corp. Chang. 2004, 13, 815–849. [Google Scholar] [CrossRef]
  85. Petrović, S.; Colangelo, A.; Balyk, O.; Delmastro, C.; Gargiulo, M.; Simonsen, M.; Karlosson, K. The role of data centres in the future Danish energy system. Energy 2020, 194, 116928. [Google Scholar] [CrossRef]
  86. Andreas, J.J.; Burns, C.; Touza, J. Overcoming energy injustice? Bulgaria’s renewable energy transition in times of crisis. Energy Res. Soc. Sci. 2018, 42, 44–52. [Google Scholar] [CrossRef] [Green Version]
  87. Luxembourg 2020. Available online: https://www.iea.org/reports/luxembourg-2020 (accessed on 10 December 2020).
  88. Liobikienė, G.; Butkus, M. The European Union possibilities to achieve targets of Europe 2020 and Paris agreement climate policy. Renew. Energy 2017, 106, 298–309. [Google Scholar] [CrossRef]
  89. Pakulska, T. Green Energy in Central and Eastern European (CEE) Countries: New Challenges on the Path to Sustainable Development. Energies 2021, 14, 884. [Google Scholar] [CrossRef]
  90. Maśloch, P.; Maśloch, G.; Kuźmiński, Ł.; Wojtaszek, H.; Miciuła, I. Autonomous Energy Regions as a Proposed Choice of Selecting Selected EU Regions—Aspects of Their Creation and Management. Energies 2020, 13, 6444. [Google Scholar] [CrossRef]
  91. Schmid, D.; Korkomaz, P.; Blesl, M.; Fahl, U.; Friedrich, R. Analyzing transformation pathways to a sustainable European energy system—Internalization of health damage costs caused by air pollution. Energy Strategy Rev. 2019, 26, 100417. [Google Scholar] [CrossRef]
Figure 1. Procedure scheme using the entropy–complex-proportional-assessment (COPRAS) method.
Energies 14 01767 g001
Figure 2. The percentage changes of the indicators of the EU sustainable energy and climate development between 2009–2018.
Energies 14 01767 g002
Figure 3. Indicator weight.
Energies 14 01767 g003
Figure 4. The classification of the EU countries in terms of the level of energy and climate sustainable development (a—2009, b—2010, c—2011, d—2012, e—2013, f—2014, g—2015, h—2016, i—2017, and j—2018).
Energies 14 01767 g004
Figure 5. The average value of the Pi index for individual EU-27 countries and for the entire study period (a) and the division of countries into similar groups (b).
Energies 14 01767 g005aEnergies 14 01767 g005b
Figure 6. The value of the Pi index for the studied EU countries and for individual dimensions in the studied period (a—2009, b—2010, c—2011, d—2012, e—2013, f—2014, g—2015, h—2016, i—2017, and j—2018; BE—Belgium, BG—Bulgaria, CZ—Czech Republic, DK—Denmark, DE—Germany, EE—Estonia, IE—Ireland, EL—Greece, ES—Spain, FR—France, HR—Croatia, IT—Italy, CY—Cyprus, LV—Latvia, LT—Lithuania, LU—Luxembourg, HU—Hungary, MT—Malta, NL—The Netherlands, AT—Austria, PL—Poland, PT—Portugal, RO—Romania, SI—Slovenia, SK—Slovakia, FI—Finland, and SE—Sweden).
Energies 14 01767 g006aEnergies 14 01767 g006bEnergies 14 01767 g006c
Figure 7. The value of the Pi index of energy and climate sustainability in each EU country in the studied years (a—Belgium, b—Bulgaria, c—The Czech Republic, d—Denmark, e—Germany, f—Estonia, g—Ireland, h—Greece, i—Spain, j—France, k—Croatia, l—Italy, m—Cyprus, n—Latvia, o—Lithuania, p—Luxembourg, r—Hungary, s—Malta, t—The Netherlands, u—Austria, v—Poland, w—Portugal, x—Romania, z—Slovenia, aa—Slovakia, bb—Finland, and cc—Sweden).
Energies 14 01767 g007aEnergies 14 01767 g007b
Table 2. The value of the Pi index of sustainable development for the EU countries between 2009–2018 and the ranking (R) of the EU countries.
EU Countries2009201020112012201320142015201620172018
PiRPiRPiRPiRPiRPiRPiRPiRPiRPiR
BE0.684210.707210.72190.709180.701190.721160.655190.688200.681200.67822
BG0.503270.535260.568270.575260.589260.584260.508270.544270.537270.55727
CZ0.657230.69220.672230.668220.666220.703190.649210.677210.666210.68720
DK0.94720.9820.97120.98720.94720.9120.87220.94920.96820.9412
DE0.737140.77150.771140.752150.725170.722150.668180.727180.73180.74317
EE0.736150.715190.714200.691190.65240.697200.654200.676220.662230.6821
IE0.734170.777140.792120.761130.742150.689210.74680.80670.83440.8415
EL0.709200.768140.723180.683200.688200.621240.605240.64250.646250.66323
ES0.81860.85950.84460.80880.82570.744130.721120.782110.773130.77413
FR0.89330.93320.92730.89830.87630.87730.82630.87630.86530.8733
HR0.84150.8830.85750.84850.8450.84540.7570.81260.79780.8058
IT0.763120.79780.77150.745170.761140.718170.678170.751150.745150.75114
CY0.612260.62160.615260.571270.584270.562270.568260.611260.58260.60226
LV0.79570.81550.79130.781120.783110.82470.726110.80480.80870.8167
LT0.734170.727110.676210.673210.703180.703190.577250.674230.664220.65224
LU0.634250.671120.672230.664230.675210.681230.69150.705190.695190.719
HU0.718180.752100.754160.753140.763130.774110.709130.751150.74170.74715
MT0.668220.674100.655250.628250.631250.619250.632230.79390.779100.7929
NL0.771110.80660.83370.8170.80480.8100.738100.789100.775120.78910
AT0.86140.88320.88240.87240.85540.84350.78640.84540.83350.8514
PL0.636240.66180.659240.659240.662230.682220.641220.661240.653240.64725
PT0.76130.81540.81790.783100.779120.723140.704140.751150.747140.74616
RO0.772100.82520.82780.81960.82960.83160.75260.82350.81260.8167
SI0.7880.8220.803100.782110.79590.80890.74490.781120.78390.78411
SK0.71190.75540.75170.747160.738160.744130.681160.747170.744160.7418
FI0.77990.79120.794110.78990.789100.8280.76450.779130.778110.77512
SE11111111111111111111
P i ¯ 0.750 0.779 0.772 0.758 0.756 0.750 0.705 0.757 0.752 0.7570.750
s P i 0.104 0.106 0.104 0.107 0.101 0.101 0.099 0.098 0.103 0.0980.104
Notes: BE—Belgium, BG—Bulgaria, CZ—Czech Republic, DK—Denmark, DE—Germany, EE—Estonia, IE—Ireland, EL—Greece, ES—Spain, FR—France, HR—Croatia, IT—Italy, CY—Cyprus, LV—Latvia, LU—Lithuania, LU—Luxembourg, HU—Hungary, MT—Malta, NL—The Netherlands, AT—Austria, PL—Poland, PT—Portugal, RO—Romania, SI—Slovenia, SK—Slovak Republic, FI—Finland, and SE—Sweden.
Table 3. The groups of similar countries in terms of energy and climate sustainable development.
YearClass 1Class 2Class 3Class 4
2009Sweden, Denmark,
France, Austria
Croatia, Spain, Latvia, Slovenia, Finland, Romania, The Netherlands, Italy, PortugalGermany, Estonia, Lithuania, Ireland, Hungary, Slovakia, Greece, Belgium, Malta, Czech RepublicPoland,
Luxembourg
Cyprus,
Bulgaria
2010Sweden, Denmark, FranceAustria, Croatia, Spain, Romania, Slovenia, Portugal, Latvia, The Netherlands, Italy, FinlandIreland, Germany, Greece, Slovakia, Hungary, Lithuania,
Estonia, Belgium,
Czech Republic, Malta
Luxembourg, Poland, Cyprus, Bulgaria
2011Sweden, Denmark, France, AustriaCroatia, Spain, the Netherlands, Romania, Portugal, Slovenia,
Finland, Ireland, Latvia
Germany, Italy, Hungary, Slovakia, Greece, Belgium, Estonia, Lithuania, Luxembourg, Czech RepublicPoland, Malta, Cyprus,
Bulgaria
2012Sweden, Denmark,
France, Austria
Croatia, Romania, The
Netherlands, Spain, Finland,
Portugal, Slovenia, Latvia, Ireland
Hungary, Germany, Slovakia,
Italy, Belgium, Estonia, Greece, Lithuania, Czech Republic,
Luxembourg, Poland
Malta, Bulgaria, Cyprus
2013Sweden, Denmark, FranceAustria, Croatia, Romania, Spain, The Netherlands, Slovenia,
Finland, Latvia, Portugal,
Hungary, Italy
Ireland, Slovakia, Germany, Lithuania, Belgium, Greece,
Luxembourg, Czech Republic, Poland
Estonia, Malta, Bulgaria,
Cyprus
2014Sweden, Denmark, FranceCroatia, Austria, Romania, Latvia, Finland, Slovenia,
The Netherlands, Hungary,
Spain, Slovakia, Portugal, Germany, Belgium, Italy, Czech
Republic, Lithuania, Estonia,
Ireland, Poland, Luxembourg
Greece, Malta, Bulgaria,
Cyprus
2015Sweden, Denmark, FranceAustria, Finland, Romania, Croatia, Ireland, Slovenia,
The Netherlands, Latvia, Spain, Hungary
Portugal, Luxembourg, Slovakia, Italy, Germany, Belgium,
Estonia, Czech Republic, Poland, Malta
Greece,
Lithuania,
Cyprus,
Bulgaria
2016Sweden, Denmark,
France
Austria, Romania, Croatia,
Ireland, Latvia, Malta,
The Netherlands, Spain, Slovenia, Finland
Hungary, Portugal
Italy, Slovakia, Germany,
Luxembourg, Belgium
Czech Republic, Estonia,
Lithuania, Poland
Greece, Cyprus,
Bulgaria
2017Sweden, Denmark, FranceIreland, Austria,
Romania, Latvia, Croatia,
Slovenia, Malta, Finland,
The Netherlands,
Spain
Portugal, Italy, Slovakia,
Hungary, Germany,
Luxembourg, Belgium
Czech Republic, Lithuania,
Estonia, Poland
Greece, Cyprus, Bulgaria
2018Sweden, Denmark,
France
Austria, Ireland, Romania, Latvia, Croatia, Malta, The Netherlands, Slovenia, Finland, SpainItaly, Hungary, Portugal,
Germany
Slovakia, Luxembourg, Czech Republic, Estonia, Belgium, Greece
Lithuania,
Poland, Cyprus, Bulgaria
Table 4. The level of the EU development in individual dimensions of energy and climate sustainable development between 2009–2018.
EU CountriesDimension2009201020112012201320142015201620172018
BelgiumEnergy4222222222
Climate2222222222
Economic3432222333
Social2333223233
BulgariaEnergy1111111111
Climate4444444444
Economic3333333443
Social4444444444
Czech RepublicEnergy3111211122
Climate4344444444
Economic4443333333
Social3333333332
DenmarkEnergy2111111111
Climate2222222222
Economic1111111111
Social1222222122
GermanyEnergy3222222222
Climate3333333333
Economic2222222222
Social3222222332
EstoniaEnergy2222222222
Climate4444444444
Economic3222333133
Social2222221131
IrelandEnergy4222222222
Climate3333333333
Economic4111111311
Social2333333333
GreeceEnergy3222112221
Climate3333333333
Economic2223333333
Social3434444444
SpainEnergy3222222222
Climate2122222222
Economic2333333333
Social3333333333
FranceEnergy3222222222
Climate1111111111
Economic1112222222
Social3333333333
CroatiaEnergy2222222222
Climate2222222222
Economic3333333333
Social3333333333
ItalyEnergy3333223222
Climate2222222222
Economic2222222222
Social3334443333
CyprusEnergy4333333333
Climate3333333333
Economic3334443343
Social3444444444
LatviaEnergy2222222222
Climate2222222222
Economic3333333443
Social3434443333
LithuaniaEnergy2333233333
Climate2222322222
Economic3333333333
Social3444444444
LuxembourgEnergy4444444444
Climate4344343333
Economic1111111111
Social1111111111
HungaryEnergy3333333333
Climate2222322232
Economic4443333333
Social3333333333
MaltaEnergy3333333333
Climate2223132111
Economic4444444444
Social3334443333
The NetherlandsEnergy3444444444
Climate2222223332
Economic2222222222
Social1112222111
AustriaEnergy3333344443
Climate2122222222
Economic2222222222
Social2222222111
PolandEnergy2333333344
Climate4444444444
Economic3443333333
Social3333333333
PortugalEnergy2333333333
Climate2122222222
Economic3333333333
Social3444444444
RomaniaEnergy1333333333
Climate3333333333
Economic3333333333
Social3333343333
SloveniaEnergy2344444444
Climate3233322333
Economic3333333333
Social3323233222
SlovakiaEnergy3444444444
Climate3333333333
Economic4444433333
Social2222233323
FinlandEnergy3333333333
Climate2222222222
Economic2222222222
Social1111111111
SwedenEnergy2111211111
Climate1111111111
Economic1222111122
Social1111111111
Notes: 1—High level of energy and climate sustainability (safe level); 2—Medium-high level of energy and climate sustainability (medium level); 3—Medium-low level of energy and climate sustainability (warning level); 4—Low level of energy and climate sustainability (dangerous level).
Publisher’s Note: MDPI stays neutral with regard to jurisdictional claims in published maps and institutional affiliations.

