Article

Developing a Methodology for Aggregated Assessment of the Economic Sustainability of Pig Farms

1
Institute of Economics and Finance, Warsaw University of Life Sciences—SGGW, 02-787 Warsaw, Poland
2
Institute of Management, Warsaw University of Life Sciences—SGGW, 02-787 Warsaw, Poland
3
Wageningen Economic Research, Wageningen University and Research (WUR), NL-6700 AA Wageningen, The Netherlands
4
Department of Sustainable Agricultural Systems, University of Natural Resources and Life Sciences (BOKU), A-1180 Vienna, Austria
5
Centro Ricerche Produzioni Animali—C.R.P.A. S.p.A., 42121 Reggio Emilia, Italy
6
School of Agriculture and Food Science, University College Dublin, Belfield, Dublin 4, Ireland
*
Author to whom correspondence should be addressed.
Energies 2021, 14(6), 1760; https://doi.org/10.3390/en14061760
Submission received: 15 February 2021 / Revised: 17 March 2021 / Accepted: 17 March 2021 / Published: 22 March 2021

Abstract

:
The economic sustainability of agricultural production is a crucial concern for most farmers, especially for pig producers who face dynamic changes in the market. Approaches for economic sustainability assessment found in the literature are mainly focused on the short-term economic viability of the farm and rarely take a long-term perspective. In this paper, we propose and test a new, innovative assessment and aggregation method, which brings about a broader view on more long-term aspects of economic sustainability. This wider view on economic sustainability, in addition to classical concepts such as technical efficiency, labor productivity, and farm profitability, incorporates the assessment of the levels of entrepreneurship, risk management, and the resilience of the invested resources. All indicators were scaled and aggregated using scaling and weighting procedures proposed by experts into subthemes and themes. The methodology was tested on a sample of 131 pig farms located in 6 EU countries: Germany, Italy, the Netherlands, Poland, Finland, and Austria. We hypothesized that closed-cycle farms might be economically more sustainable than those farms that are specialized in pig breeding or finishing. The results showed that closed-cycle farms do indeed have advantages in terms of raising healthy animals and having slightly better overall resilience of resources, however specialized breeding and finishing farms appeared to be more sustainable in the areas of profitability, risk management, and reproductive efficiency. Our approach supports evidence-based economic sustainability assessments of pig farms and provides a tool that can be used for economic sustainability improvement strategies for farms.

1. Introduction

The Amsterdam Treaty (1997) introduced the concept of sustainable development as a core objective of the European Union [1]. In 2001, the EU published its Sustainable Development Strategy [2]. Since then, sustainable development has been a key objective for all European Community policies. The concept of sustainable development is based on the definition set in the Brundtland Report, and is defined as “development that meets the needs of the present without compromising the ability of future generations to meet their own needs” [3]. The impacts of agriculture on the environment and exploitation of natural resources is an important concern in the EU countries, particularly within the context of agricultural policy reform and the abovementioned sustainable development objectives. The basic challenge for agriculture is to produce food efficiently, profitably, and safely, and to meet growing food demands without exploitation of natural resources and the environment. In this context, sustainability assessments of pig farms have gained increased attention in recent years, especially in relation to sustainable meat consumption [4], precision feeding causing lower emissions [5,6], development towards sustainable intensification versus extensification of production in the context of climate change [7], and the possible sustainable use of animal residues in biogas production [8,9,10]. Different pillars of sustainable development can be measured, such as the environmental, social, and economic aspects, with the objective of providing a holistic assessment. In this paper, we specifically address the economic pillar of the sustainability of pig farms, which assumes that farms should remain economically viable in the long term [3]. Without the ability to deliver a stable and rewarding income, farmers would not be able to deliver their essential services to society or preserve the environment and natural resources.
For many reasons the assessment of the economic sustainability of pig farms is a complex exercise, as many contrasting factors play significant roles. The technical, economic, and institutional environments are characterized by, among others, price volatility, environmental constraints, increasing animal welfare requirements, and weak bargaining power in the supply chain, creating continuous challenges for pig farmers. Conventionally, the economic sustainability of pig farms has been measured by means of a series of technical parameters of the performance of sows and finishing pigs and by the evaluation of costs and revenues, which result in the calculations of gross margins, net profits, and returns on labor and equity. Many public and private accountancy systems operate with similar methodological approaches (for example the Farm Accountancy Data Network funded by the EU). International comparisons are facilitated by the InterPIG network and Agribenchmark Pig, which benchmark either the national average economic results of pig farming or appraise typical representative pig farms in different countries of the world [11,12]. Economic sustainability is also a subject of assessment within more complex tools and methodologies, used for integrative analysis of multiple pillars of sustainability. Examples of such assessment systems are the Sustainability Assessment of Food and Agriculture (SAFA) systems [13], Indicateurs de Durabilité des Exploitations Agricoles (IDEA) [14], Monitoring Tool for Aggregated Farm Sustainability (MOTIFS) [15,16], Sustainability Assessment of Farming and the Environment (SAFE) [17], Response Inducing Sustainability Evaluation (RISE) [18]. However, the economic pillars of assessment within these methodologies are mainly focused on the short-term viability of farms and rarely take a long-term perspective.
This paper extends the concept of the assessment of the economic pillar of sustainability to include a longer term perspective. The quality of entrepreneurship, the level of risk management, the profitability of invested resources, and the capacity to adapt to sudden changes in the environment and upcoming diseases are essential for resilient pig farms of the future in order to be able to meet the changing requirements of consumers and society. In order to assess the overall economic sustainability, an evaluation needs to include the ability of pig farmers to innovate or to cover possible risks of the market and in animal health management. This paper presents a focus on a methodology that goes beyond the classical assessments of economic pillars of the sustainability of pig farms and proposes to integrate short-term farm viability with a long-term farm resilience perspective. We propose and test a new, innovative assessment and aggregation method. The methodology was tested on a sample of 131 pig farms located in 6 EU countries: Germany, Italy, the Netherlands, Poland, Finland, and Austria. An extended economic data protocol based on the new methodology was applied to these pig farms. When testing our methodology, the hypothesis that closed-cycle farms are more economically sustainable than those farms that are either specialized in piglet production (breeding) or in growing–finishing pigs was investigated. We assumed that closed-cycle farms have advantages in terms of raising healthier animals, due to having their own piglet production systems. Additionally, they are not exposed to the spot price variations for piglets that affect specialist breeding farms and finishing farms. Instead, their market price risks are largely confined to the sales value of their slaughter pigs. To the best of our knowledge, such comparisons have not been carried out for different pig farm types. Our hypothesis was based on discussions with experts during stakeholder workshops and our own observations based on the Farm Accountancy Data Network data and the InterPIG network.

2. Literature Review

The economic sustainability of agricultural production is a crucial concern for most farmers [19]. According to De Roest, Ferrari, and Knickel [20], “modern” farmers put farm revenues and profitability above other objectives. The financial result of agricultural production is a primary condition for farm survival over time [21]. For this reason, the traditional approach for assessing the economic pillar of farm sustainability is based on a set of commonly used indicators, which refer to a farm’s profitability [13,18,22]. There is a common agreement that economic indicators are related to a relatively limited number of themes, such as the profitability and productivity of resources. The economic indicators are quantitative, expressed in monetary terms [14,23], and used by pig farmers to improve their management. The estimation of those economic indicators is smooth, transparent, and objective; however, these indicators were not initially developed to measure economic sustainability [24].
Many approaches for assessment of the economic pillars of the sustainability of farms are found in the literature. Some of the assessment indicators are focused on “short-term” sustainability, while others take a more long-term perspective of the economic viability of the farm into account. In the next section, we will analyze the importance of these different perspectives.
One of the basic economic assessment indicators is profitability, which commonly is the difference between the value of goods and services produced and the costs of resources used in their production [25]. Often as an indicator for profitability, authors use the net farm income [22,26,27,28], while others suggest using the gross margin, calculated as the difference between revenue and operational costs as a measure of profitability [29,30]. Many studies have attempted to review factors that influence farm profitability, and thereby impact on farm economic sustainability. Tey and Brindal [31] mentioned several factors covering financial capacity, farm management and skills, farm resource quality, and farm operation. The important finding of this analysis was that at the operational scale, efficiency and output prices have positive impacts on earnings.
Pannell and Glenn [32] stress the importance of a sound conceptual framework to underpin the choice of economic sustainability indicators. They argue that the utility of sustainability indicators relates to their value as an input for better managerial decision-making. Technical performance indicators concerning feed efficiency, animal health, and fecundity are crucial because of their accepted contributions to financial performance in pig production.
Technical performance is a pivotal driver of productivity and profitability in agriculture [33]. This is especially true in pig production systems, where slender profit margins elevate the need for farmers to maximise technical performance in order to maintain competitiveness. The most important technical performance metrics include feed conversion ratios, reproductive performance benchmarks, and herd health indicators. Boland and Patrick [34] noted that feed efficiency and the number of pigs sold yearly per sow had the largest impacts on returns from labor and management in closed-cycle pig farms in the USA. Other studies have quantified strong correlations between technical and economic performance [35,36,37]. Jack [38] emphasized that performance benchmarking is a motivator that can encourage farmers to make sustainable changes in their business. Technical performance measures often provide leading indicators, defining focus areas for continuous managerial control, such as feed efficiency, reproduction parameters, and healthiness of animals. Healthier animals require less veterinary treatment, resulting in lower veterinary costs and lost production, while also reducing the risk of meat contamination with drug residues in meat products for the final consumer [39]. Studies related to pig production have typically used aggregated measures comprising overall input or output efficiencies derived using data envelopment analysis (DEA) or stochastic frontier methods. Notable examples include Asmild and Hougaard [40], Labajova et al. [41], Galanopoulos et al. [42], Oude Lansink and Reinhard [43], Latruffe et al. [44], Piot-Lepetit and Vermersch [45], Sharma et al. [46,47], Tonsor and Featherstone [48], Henningsen et al. [49], and Heshmati et al. [50]. These papers reveal the variations in technical performance among pig farms and the potential benefits to farms from improving resource-use efficiency.
Recent research on economic sustainability indicators has tended to prioritise higher-level financial metrics rather than more granular technical efficiency parameters. For example, Ilari-Antoine et al. [51] and Zahm et al. [14] define economic efficiency as operating expenses related to production value. Hennessy et al. [30] and Ryan at al. [52] include labor productivity (defined as farm income as per unpaid labor unit) and land productivity (gross output per hectare) as economic sustainability indicators.
Labor costs are a relevant cost factor in pig production, representing about 8–9% of the total production costs in European countries [11]. The labor input per sow or per slaughter pig varies largely among farms and among countries. For example, the average labor input varies from 4.9 h per ton carcass weight on a closed-cycle farm in the Netherlands to 24.8 h in Hungary.
Hoste [11] states that high labor market wage rates typically result in lower labor inputs, as expensive labor stimulates efficiency. He also found a clear negative relationship between farm size and labor input per sow or per produced slaughter pig.
According to Hoste and Benus (in press), farm size on Dutch pig farms explained 21% of the variation in labor input per animal on breeding farms and 46% on growing–finishing farms. Hoste and Wisman [53] analyzed the bandwidths of labor input per raised piglet on breeding farms, ranging from 0.16 to 0.49 h per piglet (0.3 on average), and on growing–finishing farms, ranging from 0.21 to 0.65 h per produced slaughter pig (0.36 on average). Zonderland [54] analyzed factors related to high labor productivity on breeding farms. He found a large variation in labor input in the farrowing rooms on the breeding farms, ranging from 26 to 64% of the total labor input on those farms. Within the farrowing rooms, piglet-related activities took the largest share of time (23%), followed by daily control of feed intake and health of the sows (15%). Commandeur [55] studied pig farming styles and differentiated, among others, between entrepreneurs, typically increasing labor productivity through scaling up, and craftsman, who typically increase labor productivity through intensification.
Until now, we have analyzed a traditional approach to the assessment of the economic pillar of sustainability. A broader view, which we propose in our methodology, incorporates the levels of entrepreneurship, risk management, and the resilience of the invested resources into the economic pillar of sustainability. These longer-term aspects were raised by experts and stakeholders during the workshops organized as a part of the SusPigSys project as those that should be considered in the assessment of economic pillars of farm sustainability. They are also proposed by FAO-SAFA guidelines under the economic resilience indicators for farm sustainability assessment [13]. The core of entrepreneurship is taking responsibility for and making decisions that affect the location, form, and use of the goods and resources of a business [56]. These decisions result among others in the bargaining position of farmers versus their contractors, which depend not only on the classical factors such as resources, quality attributes, and scales of operation or location, but also on qualitative determinants as relationships, both vertically within the chain, as well horizontally with other farmers [57,58]. The issue of farmers’ power in the agri-food chain is widely discussed [59,60,61]. It is frequently emphasized that farmers (especially small ones) are usually poorly capitalized, and thus have limited bargaining power. Woohyun et al. [62] underline that when experiencing internal scarcity of strategic resources, farmers have to rely also on external resources to perform. Actors involved in a business relationship will search for ways to obtain the best terms of trade from their contractors, thus we may suppose that their efforts will focus on getting the most favorable contract conditions [63,64]. As suggested by approaches drawing on transaction costs and property rights theory, exercising power in the supply chain depends on the substitutability of contractors (see, e.g., [65]). Following this approach, in our economic sustainability assessment, we assume that a farm’s dependence on its buyers or suppliers increases if the farm is facing difficulty in finding alternative buyers or suppliers [57,58]. Since many authors [57,62,66] have shown that a company with greater power tends to exercise its power to achieve higher performance (extra financial gains, better prices), we may assume that farms experiencing higher bargaining position in the supply chain, and thus potentially performing, better are more economically sustainable than farmers with lower positions in the chain.
Farmers are relatively small players compared to other companies in the supply chain with limited bargaining power. Therefore, farmers often cooperate, both horizontally (with other farmers) and vertically (with suppliers or processors). Bijman [67] mentions certain following characteristics of horizontal cooperation, namely democratic decision-making, collective ownership, pooled interdependence, coordination by standardization, and homogeneous member interests. One reason for cooperative sales is the need to countervail power vis-a-vis the next stage in the supply chain, as products are perishable, placing time pressure on bargaining processes [68]. However, the advantages of horizontal cooperation are manifold: sales guarantees resulting in stable market relationships; economic benefits due to higher sales prices, cheaper inputs, and lower transaction costs as consequences of economies of scale and improved purchasing and bargaining power; greater access to credit; improving production standards; dissemination of new technologies [67,69,70,71].
The ability to cooperate is a major factor determining the competitiveness of companies [71]. Horizontal and vertical cooperation is interlinked, as farmers’ cooperatives also hold advantages for players downstream in the supply chain, “as they coordinate the supply of large volumes of products of homogeneous quality” [67]. The institutional development towards both horizontal and vertical cooperation of farmers is interlinked. Biro et al. [71] found that due to a low level of horizontal cooperation in Hungary, vertical cooperation is stimulated, which in turn decreases the development potential of horizontal cooperation in Hungary.
Risk management has an increasingly important role in competitive pig production networks. While looking for efficiency gains through increasing specialization and the scale of production, pig farmers enhance risk management through innovative contract coordination mechanisms. The increased volatility of input and output prices can further increase producer incentives to enter into risk-reducing and price-fixing coordination contracts [72]. Previous results have indicated that farmers with higher risk aversion are more likely to participate in production contracts, less likely to adopt new technology, adopt technology later, and invest less in technology [72]. These findings jointly suggest that contract terms that help alleviate credit constraints may be more effective at promoting technology adoption [73].
Risk management may have relevant consequences for the efficiency of the production process [74]. In an analysis of 278 pig fattening farms, pig farms with a low degree of specialization achieved higher efficiency scores when output risk was explicitly accounted for. By means of data envelope analysis, it was shown that an efficiency increase can be ascertained in pig farms that belong to the lower classes of specialization. This result contrasts with several other research findings demonstrating a positive correlation between the degree of specialization and the technical efficiency of the production process. Risk-averse pig farmers may be reluctant to invest or may invest later than those who are less risk-averse [75].
Finally, the resilience of resources, which is related to the capacity to invest and potential for innovation, is a highly relevant factor for the long-term economic sustainability of pig farms [13]. Investment refers to the adaptive capability of farms [76], namely the allocation and use of farm resources to improve the farm performance at the governance, environmental, social, or economic level. Without proper investment and innovation, it is less probable that a farm will make significant progress and be sustainable in the long term [13]. The resilience of farms, in general, can be understood as covering the buffer capability, adaptive capability, and transformative capability [77], or in other words the robustness, adaptability, and transformability [76]. The buffer capability denotes the ability to assimilate a perturbation without substantial changes on the farm. Adaptive capability implies changes that lead to the introduction of new technologies or the establishment of new marketing channels. Transformative capability relates to the ability to implement radical changes, the ability “to create untried beginnings from which to evolve a new way of living” [78]. Meuwissen et al. [76] emphasize the synergies and trade-offs between these three capacities. Translated into management of the pig farm, the buffer capacity refers to the tactical management decisions taken during the year to cope with sudden drops in pig prices or strong increases in feed prices. By delaying sales or by anticipating the purchase of feed by creating buffer stocks, pig farmers may mitigate the effects of price shocks of inputs and outputs. Adaptive capability directly relates to the strategic medium- or long-term management of the pig farm. Examples are investments in innovative technologies, which may either be triggered by new legislation, such as new free farrowing boxes or limits on emissions on ammonia, or stimulated by the desire to improve labor productivity by investing in automatic feeding systems. Transformative capability is inherent to the shift of the pig farm to a completely new way of production. Radical changes are the conversion to a new certification scheme, such as organic pig production, to an animal welfare label, or to an environmental sustainability scheme [79]. Additionally, the deliberate decision to diversify by introducing other new production lines is a part of the transformative capability of the pig farm [20]. Hence, the economic resilience of pig farms can be enhanced in different ways. In our approach, we decided to assess the extent to which the different types of pig farms in Europe activate their adaptive capability and enhance the resilience of their resources via innovativeness and investments.

3. Methodological Approach

3.1. Assessment of Economic Sustainability—From Indicators to Subthemes and Themes of Economic Sustainability

For the quantitative assessment of the economic pillars of sustainability of pig farms, a set of indicators was proposed. The selection of indicators was based on the extended literature review (presented in Section 2), FAO-SAFA guidelines [13], and expert consultation during stakeholder workshops organized within the framework of the SusPigSys project. The assessment methodology development process was described in the project report [80]. Six workshops with stakeholders were organized in 2019 (in Austria, Finland, Germany, the Netherlands, Poland, United Kingdom), attended by over 80 farmers and experts in the field of pig production. The indicators were adapted to the specifics of pig production systems analysis to the extent necessary and grouped into specific subthemes and themes related to different factor groups that influence both the short- and long-term economic sustainability of farms (see Figure 1). General descriptions of the selected themes and subthemes are presented in Table 1, whereas a specific list of indicators is given in Table A1 in the Appendix A.
The two distinguished themes of economic sustainability assessment were “technical performance” and “economic resilience”. Each of those two themes included certain subthemes relating to different areas that have an impact on the farm’s economic performance. Each of the subthemes is represented by certain indicators, calculated using the data collected at the farm level. The first theme of assessment is related to the technical performance parameters of the farm. As indicated in the literature review, the technical performance is very important in terms of the operational economics of the farm and forms the backbone of short-term farm sustainability.
Three subthemes of “technical performance” were analyzed: “reproductive efficiency”, “feed efficiency”, and “health management”.
The “reproductive efficiency” assessment was performed in breeding and closed-cycle farms and referred to the breeding parameters described in Table 1. The “feed efficiency” assessment was performed on all types of farms, including breeding, finishing, and closed-cycle farms, and was based on parameters related to the quantity of feed being used to produce meat. Herein, we use the feed conversion rate, which is the quantity of feed in kg necessary to produce one kg of pig meat. An important indicator of efficiency is also the average daily gain, which is influenced by the feeding strategy and the genetics the farmer is using. The third subtheme of assessment of the “technical performance” is “health management”. This refers to the main pig mortality parameters, namely pre-weaning mortality, mortality of sows and finishers (post-weaning mortality was also included in the methodology, however due to the lack of reliable data on this parameter and quite low importance given by experts to this indicator in the integrative analysis, it was removed from the protocol) and veterinary costs per pig, which reflect combined aspects of pig health. Pig farms with low veterinary costs per sow or per finishing pigs will have optimal external biosecurity facilities to prevent pathogens from entering the farm or pass from one compartment to another compartment of the pig farms. These costs may also be low due to good conditions for pig welfare, determined by good housing facilities, adequate feeding, and good stockmanship.
The second assessment theme for economic sustainability is “economic resilience”. As indicated in the literature review, economic resilience takes account of both short- and long-term perspectives of farm performance. In order to stay in business, the farm has to be able to overcome economic shocks such as sharp declines in pig prices, sudden changes in interest rates, and steep increases in feed prices. The economic resilience of pig farmers is enhanced by having strong entrepreneurial skills, maintaining sufficient annual profitability levels, adopting effective risk management, attaining good levels of labor productivity, and utilizing efficient pig housing systems. The farm has to have good investment and innovation potential with acceptable debt rates.
Five subthemes of the “economic resilience” assessment were analyzed—two related to a farm’s ability to generate profit, namely “profitability” and “labor productivity”, and three related more to long-term farm sustainability aspects, namely “entrepreneurship”, “risk management”, and “resilience of resources”. As indicated in Table 1, “profitability” refers to basic financial performance indicators of the farm, including gross margins, as well as the costs per kg of meat. “Labor productivity” is based on the quantity of output produced per unit of labor, which here we refer to as AWU. “Entrepreneurship” is based on the evaluation of the farmer’s relations in the chain and ability for vertical and horizontal cooperation; this assessment is based on four detailed questions (see Appendix A). “Risk management” expresses the farmer’s exposure to different risks. Here, we base our assessment on the reliance on the external production factors, such as land (rented) and labor (external employment), as well as the farm specialization level, which affects its flexibility in terms of adjustment to changes in the farming environment. The last subtheme of the “economic resilience” assessment is “resilience of resources”. Here, a series of questions relates to the degrees of farm modernity, capital intensity, investment, and innovation potential, which all relate to the long-term sustainability perspective of the farm.

3.2. Weighting Procedures for Aggregated Assessment

In order to move from the level of economic indicators presented in Table 1 to the level of subthemes, scaling and weighting procedures were applied (see Figure 1). The aggregation procedure consisted of three stages:
  • Collected indicators were scaled by experts from the consortium based on the literature review and available data, in order to receive a common measure of assessment (the scale ranged from 0% to 100%, where 100% was the best score for sustainability assessment and 0% was the worst level; scaling parameters are presented in Table A1 in Appendix A);
  • A set of weights was applied in order to assess the contributions of certain detailed indicators to certain subthemes of sustainability assessment (weights are presented in Table A2 in Appendix A);
  • The subthemes were again weighted in order to assess the level of sustainability within a certain theme (these weights are presented in Table 2).
Both scaling (including defining the cut-off values) and weighting of indicators were based on expert assessments and literature reviews. A Delphi-like [81,82] procedure was used to identify weighting factors. The questionnaire was filled out by 11 experts (in the field of pig production and farm economics) from 7 countries. Two rounds of consultations were performed, where in the first round experts were asked to assess the weights based on their personal knowledge. In the second round they were informed about the results of the first round (averages) and could change their assessments accordingly, providing justification for changes. The final weights applied for each level of indicators within subthemes are reported in Table A2 in Appendix A, whereas weights used in aggregation from subthemes to themes are reported in Table 2 below.

3.3. Research Design—Selection of Farms and Protocols

The economic sustainability assessment was conducted in 6 countries: Germany, Italy, The Netherlands, Poland, Finland, and Austria. Data collection for the main study took place between June and December 2019 on 131 farms (see Table 3). Farms were recruited via pig producer organizations, agricultural advisory boards, agricultural journal announcements, and personal contacts. Data collection took 4–6 h, depending on the size of farm.
The farm selection was based on the analysis of the typical pig production systems in each country. Based on interviews with pig production experts in each country and desk research data analysis, 4–6 production systems were identified per country. The systems were characterized by certain attributes, such as the production type (breeding, finishing, closed-cycle), production system (conventional, organic, or other certified system); husbandry system (indoor or outdoor), housing parameters (warm or cold, type of flooring, type of feeding bedding, etc.), and other factors. Among the selected systems were country-specific (typical) production systems (representing a large share of pig herd in the country) and 2–3 niche systems. The sample of farms was selected in order to cover all typical systems present in the country and to achieve a large variation of farm characteristics to test the economic sustainability assessment method for a large variety of scenarios. The aggregated results (scaled and weighted) can be compared in terms of the level of sustainability of different farm types. Due to the sampling method described above, country-level analyses were not possible. Non-parametric statistical tests (in Statistica 13.3) were used to identify differences in the level of indicators for selected farm types. The results of the evaluation indicated potential relationships that could be further analyzed in more in-depth studies and in much larger samples, which would allow for the use of more advanced statistical methods of analysis.
The data collection protocol was designed to assess overall farm sustainability considering four dimensions: economics, social acceptance, the environment, and animal welfare. In this paper, we refer only to the results of the economic sustainability assessment. In order to test the approach, a pilot survey was conducted, which took place between April and November 2018 on 68 pilot farms in 7 European countries. Experiences from pilot data collection and data analysis facilitated the development of a final version of the protocol, which was used to collect data from the sample of 131 farms. The average breeding unit size was 783 sows in specialized breeding farms vs. 169 sows in the closed-cycle farms. The average size of a finishing unit was 1793 finishing places in the specialized finishing farms vs. 1221 finishing places in the closed-cycle farms.

4. Results and Discussion of the Economic Sustainability of Pig Farms

4.1. Detailed Assessment Based on Indicators

The main results of the sustainability assessment at the indicator level are presented in Table 4 and are discussed in the following sections. Based on the analysis of all indicators broken down by farm type (breeding, finishing, closed-cycle,), the results are presented to demonstrate the method of assessment, as well as the performance across all farm types. Furthermore, a group of indicators is selected to test the working hypothesis concerning farm type, as defined in the introduction.

4.1.1. Theme: Technical Performance

For the “technical performance” subthemes of “feed efficiency”, “reproductive efficiency”, and “health management”, certain broad tendencies were apparent across the systems (Table 4). Average feed conversion efficiencies were similar for finishing and closed-cycle farms, however “health management” indicators were superior for the closed-cycle farms. The lower average veterinary costs and mortality rates of finishing pigs in the closed-cycle farms suggest that potentially due to having better biosecurity, the closed-cycle system performs better, as no pigs have to be bought in. In contrast, the specialized breeding farms showed superior performance for the “reproductive efficiency” indicators compared to the closed-cycle farms. Specifically, the specialized breeding farms weaned on average 3.7 (16%) more piglets per sow per year than the closed-cycle farms. This advantage seems indicative of the capacity for specialized breeding farms to provide more focused managerial attention to the reproductive efficiencies that underpin the competitiveness of such system. Regarding the health indicators, the specialized breeding farms had slightly higher average piglet and sow mortality and veterinary costs than closed-cycle farms, however the differences appeared to relate to higher productivity per sow in the specialized breeding units. Additionally, a higher weaning age might contribute to lower veterinary costs. It has to be mentioned that in the group of closed-cycle farms, 13 organic farms were included (22.4% out of 58 closed-cycle farms in total), whereas only 3 of the specialized breeding farms were organic (16.7%), which also explains the higher average weaning age and weight.

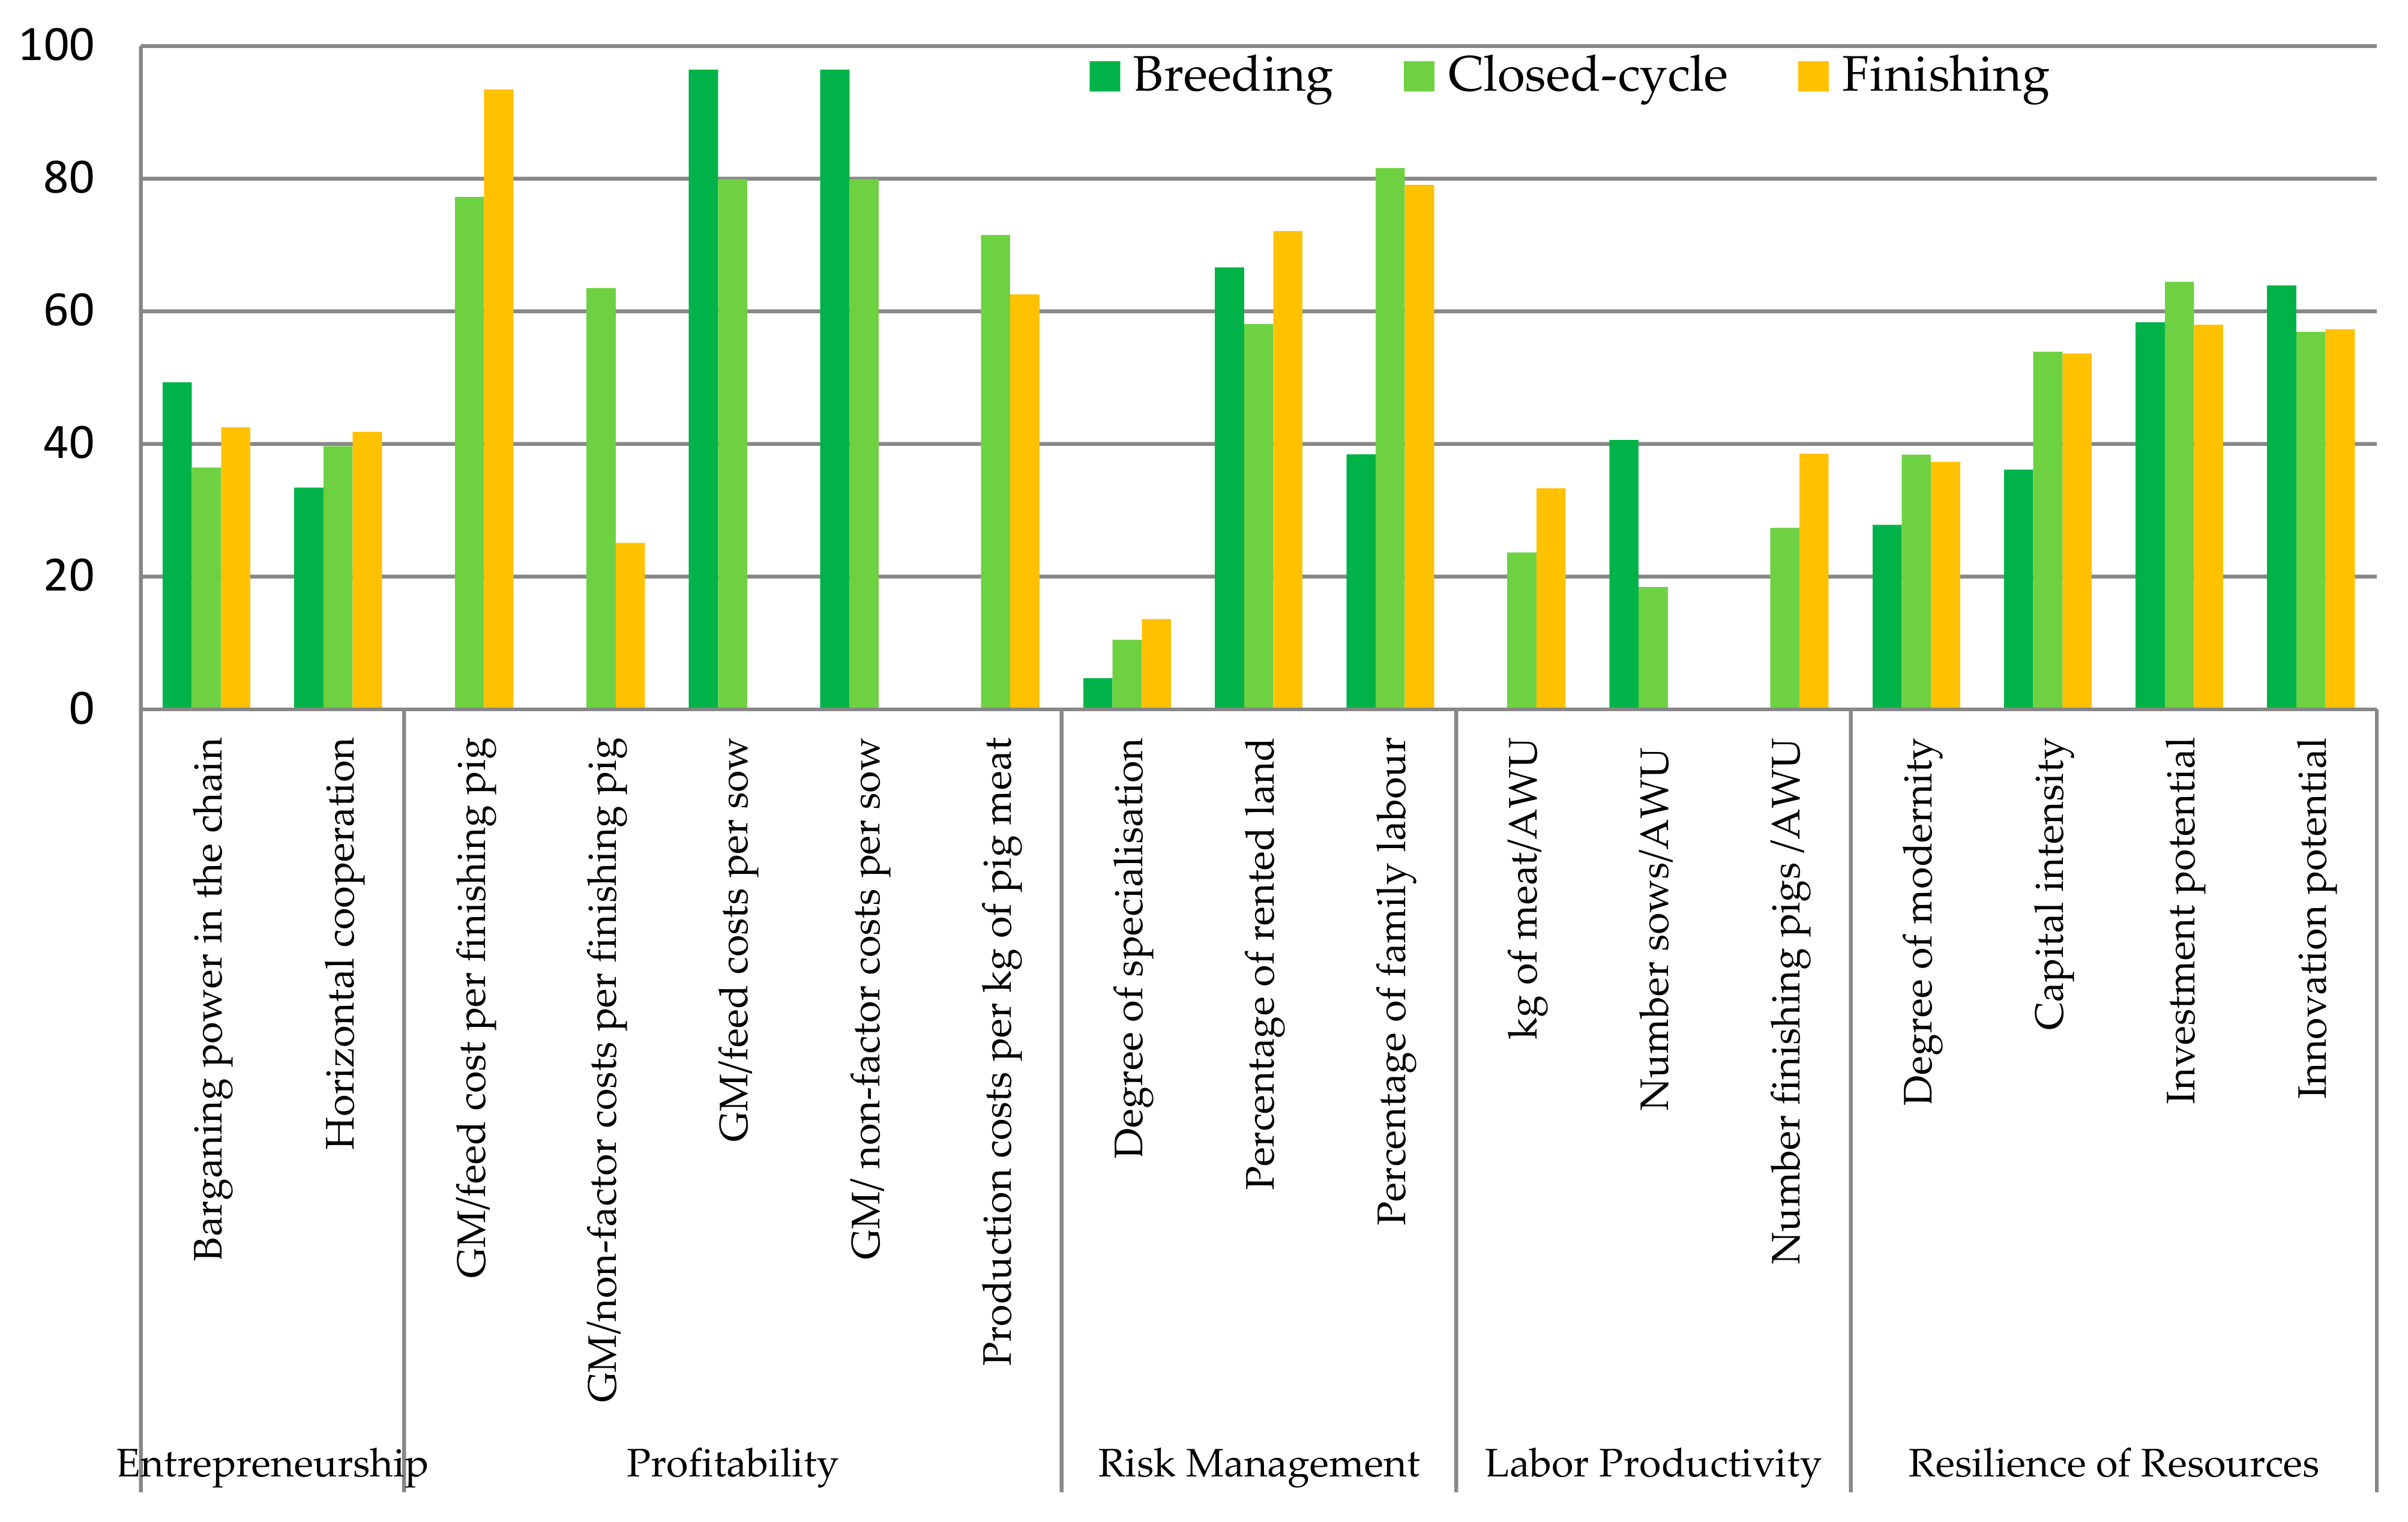
4.1.2. Theme: Economic Resilience

“Profitability” and “labor productivity” subthemes: The “profitability” of pig farms was measured by three indicators: gross margin over feed costs, gross margin over all non-factor costs, and as production (non-factor) costs per kg of meat (Table 5). In our assessment, the specialized breeding and finishing farms showed better profitability parameter results than closed-cycle farms. Regarding finishing farms versus the closed-cycle farms, finishing farms showed higher gross margins of 10 percent points (pp.) over feed costs as a percentage of turnover and 6 pp. lower production costs as a percentage of price, leaving a larger space for profit margin. The better performance of finishing farms might be related to the more efficient use of labor resources, which are important cost factors in pig production. Only the gross margin over the non-factor costs was lower in the case of finishing farms, due to the inclusion in the total costs of the purchase costs of piglets (weaners), which are produced on the farm in the case of whole-cycle farms. Additionally, specialized breeding units performed better than whole cycle farms, as measured by gross margins. Despite the fact the gross margins were slightly lower in value, the relation to the total turnover per sow was better for breeding farms.
“Labor productivity” was higher on specialized finishing farms and specialized breeding farms than on closed-cycle farms (Table 5). Pairwise comparison of specialized finishing farms and closed-cycle farms showed 35% higher carcass weight produced per AWU and 24% higher number of finishers per AWU on average on the specialized farms. In specialized breeding farms, the number of sows per AWU was 58% higher than on closed-cycle farms. Although it might be expected that labor efficiency would be higher on specialized (sow and finishing) farms than on closed-cycle farms due to the larger number of different tasks on the closed-cycle farms, another very likely explanation is farm size. Specialized breeding farms had 783 sows while closed-cycle farms had 169 sows on average; specialized finishing farms had 1690 finishers present on the farm on average, but closed-cycle farms had only 1044. Another potential explanation is the share of family labor, which is obviously related to farm size as well, accounting for 82% on closed-cycle farms and 79% on specialized finishing farms, but only 38% on specialized breeding farms. From the data set, it cannot be concluded whether labor efficiency is significantly different on closed-cycle farms than on specialized sow or finishing farms.
“Entrepreneurship”: Following the organizational economics approaches, in our economic sustainability assessment, we assumed that a farm’s bargaining position in the downstream supply chain increases if purchasers have difficulty finding alternatives for the farm supplies (see literature review). With such an approach, we could control for the broader determinants of farmers’ bargaining position, beyond scale or quality, to include factors such as having personal contacts, the length of the relationship, and negotiating skills. We also analyzed the subjective assessment of the farmers’ bargaining position, asking them about their ability to influence the terms of the transactions. It turned out that the highest bargaining position was attained by the specialized breeding farms, followed by the finishing farms, however these differences were not statistically significant. In general, this position was moderate in the case of breeding and finishing farms and low for the closed-cycle farms (Table 5).
When it comes to horizontal cooperation, finishing farmers showed higher participation in producer groups (25%) (especially those oriented at joint sales) than closed-cycle farmers (24% participation in purchase-oriented producer groups) or specialized breeding farmers (20%). A larger volume of pigs for sale will lead to a stronger sales position. This explains the higher participation of finishing farms in sales-oriented producer groups. Sales of weaner pigs are typically more fragmented, with sales being made to traders or directly to finishing farmers. Joint sales are not always beneficial. One difference was in the shares of membership of purchase (feed, machinery)-oriented producer groups, whereby closed-cycle farms showed the highest share of membership (34%), compared to breeding (17%) and closed-cycle (20%) farms. Overall, the breeding farms in the data set were larger (in economic terms) than the closed-cycle and specialized finishing farms; there, joining a producer group might be less beneficial for them. Differences are also likely to be related to farm size and national trade patterns.
“Risk management” was measured using three indicators: the degree of specialization, the percentage of family labor, and the percentage rented land (Table 5). The degree of specialization was calculated through the share of pig returns in the total returns of the farm. It turned out that the pig finishing farms were slightly less specialized than the breeding and closed-cycle farms. This may be attributed to the fact that finishing farms are more exposed to the volatility of output prices than closed-cycle farms or breeder farms. Pig finishing is also a less labor-intensive activity than breeding, which allows labor resources to be allocated to the other activities, such as the production of crops and other livestock. In several countries, pig finishing farms may also enter into contract farming to reduce price risks.
The percentage of family labor heavily depends on the size of a farm in terms of the number of pigs. The average size of the breeding farms of 783 sows requires much more labor than a finishing farms, with an average size of 1793 finisher pigs. This explains the high reliance on paid labor on the breeder farms with respect to the finishing and closed-cycle farms.
The “resilience of resources” was measured by means of a few questions related to the age of the buildings and of the equipment, to the propensity to adopt new technologies or management practices, and to the access to bank loans (Table 5). From the comparison between the three farm types, it turned out that the closed-cycle farms had more up-to-date equipment and buildings. Most likely this difference was due to the more complex facilities in breeding farms with farrowing and gestation pens, which require continuous investments to comply with updated legislation in the fields of animal welfare and environmental sustainability. Access to bank loans may also be easier for closed-cycle farms, facilitating on-farm investment (and better investment potential). The access to capital of closed-cycle farms may be attributed to their slightly higher level of diversification, as these farms may sell both weaners and finishing pigs. In this way, these farms operating in two different markets, which may allow higher economic resilience and lower risk and which may be evaluated positively by credit institutes.

4.2. Aggregated Analysis: Scaling Indicators

After calculation of all assessment indicators, the results were scaled in order to receive common measures of assessment. Scaled results are presented in Figure 2 and Figure 3.
The results for the scaled indicators show the level of sustainability for a given indicator and can be compared between farm types. Figure 2 shows that within the theme “technical performance”, farms achieve the highest sustainability level for the subtheme “health management”, especially in the case of closed-cycle farms, where the majority of indicators are above 50% sustainability. The highest sustainability score was recorded for the mortality of finishing pigs at over 80% (“health management” subtheme) and for the number of litters per sow was around 70% (“reproductive efficiency” subtheme). Figure 2 also shows the differences between the average results for each type of farm across the individual indicators. As shown in Section 4.1, for four out of the six indicators of the subtheme “reproductive efficiency”, specialized breeding farms had an advantage over closed-cycle farms. In contrast, in the case of “health management”, closed-cycle farms showed better results than both breeding and finishing farms.
Within the theme of “economic resilience”, the highest level of sustainability was recorded for the subtheme “profitability”, where most of the farms achieved scores above 60% on average. The farms also achieved fairly high levels of economic sustainability in the case of “risk-management”, especially in terms of managing their own land and using their own labor resources. The highest level of economic sustainability was recorded for gross margin per sow and finishing pig for farms specializing in breeding (above 96%) and finishing (above 93%). The lowest level of the indicator was characteristic of the degree of specialization, which was caused by the fact that most of the visited farms were highly specialized, and thus associated with higher economic risk for the activity of these farms. When making a comparison between the types of farms, it can be seen that the results for individual indicators are very diverse and no general conclusions can be drawn as to the differences between the farm types within the subthemes. In order to make more general conclusions, an assessment must be based on a more aggregated approach (Figure 4).

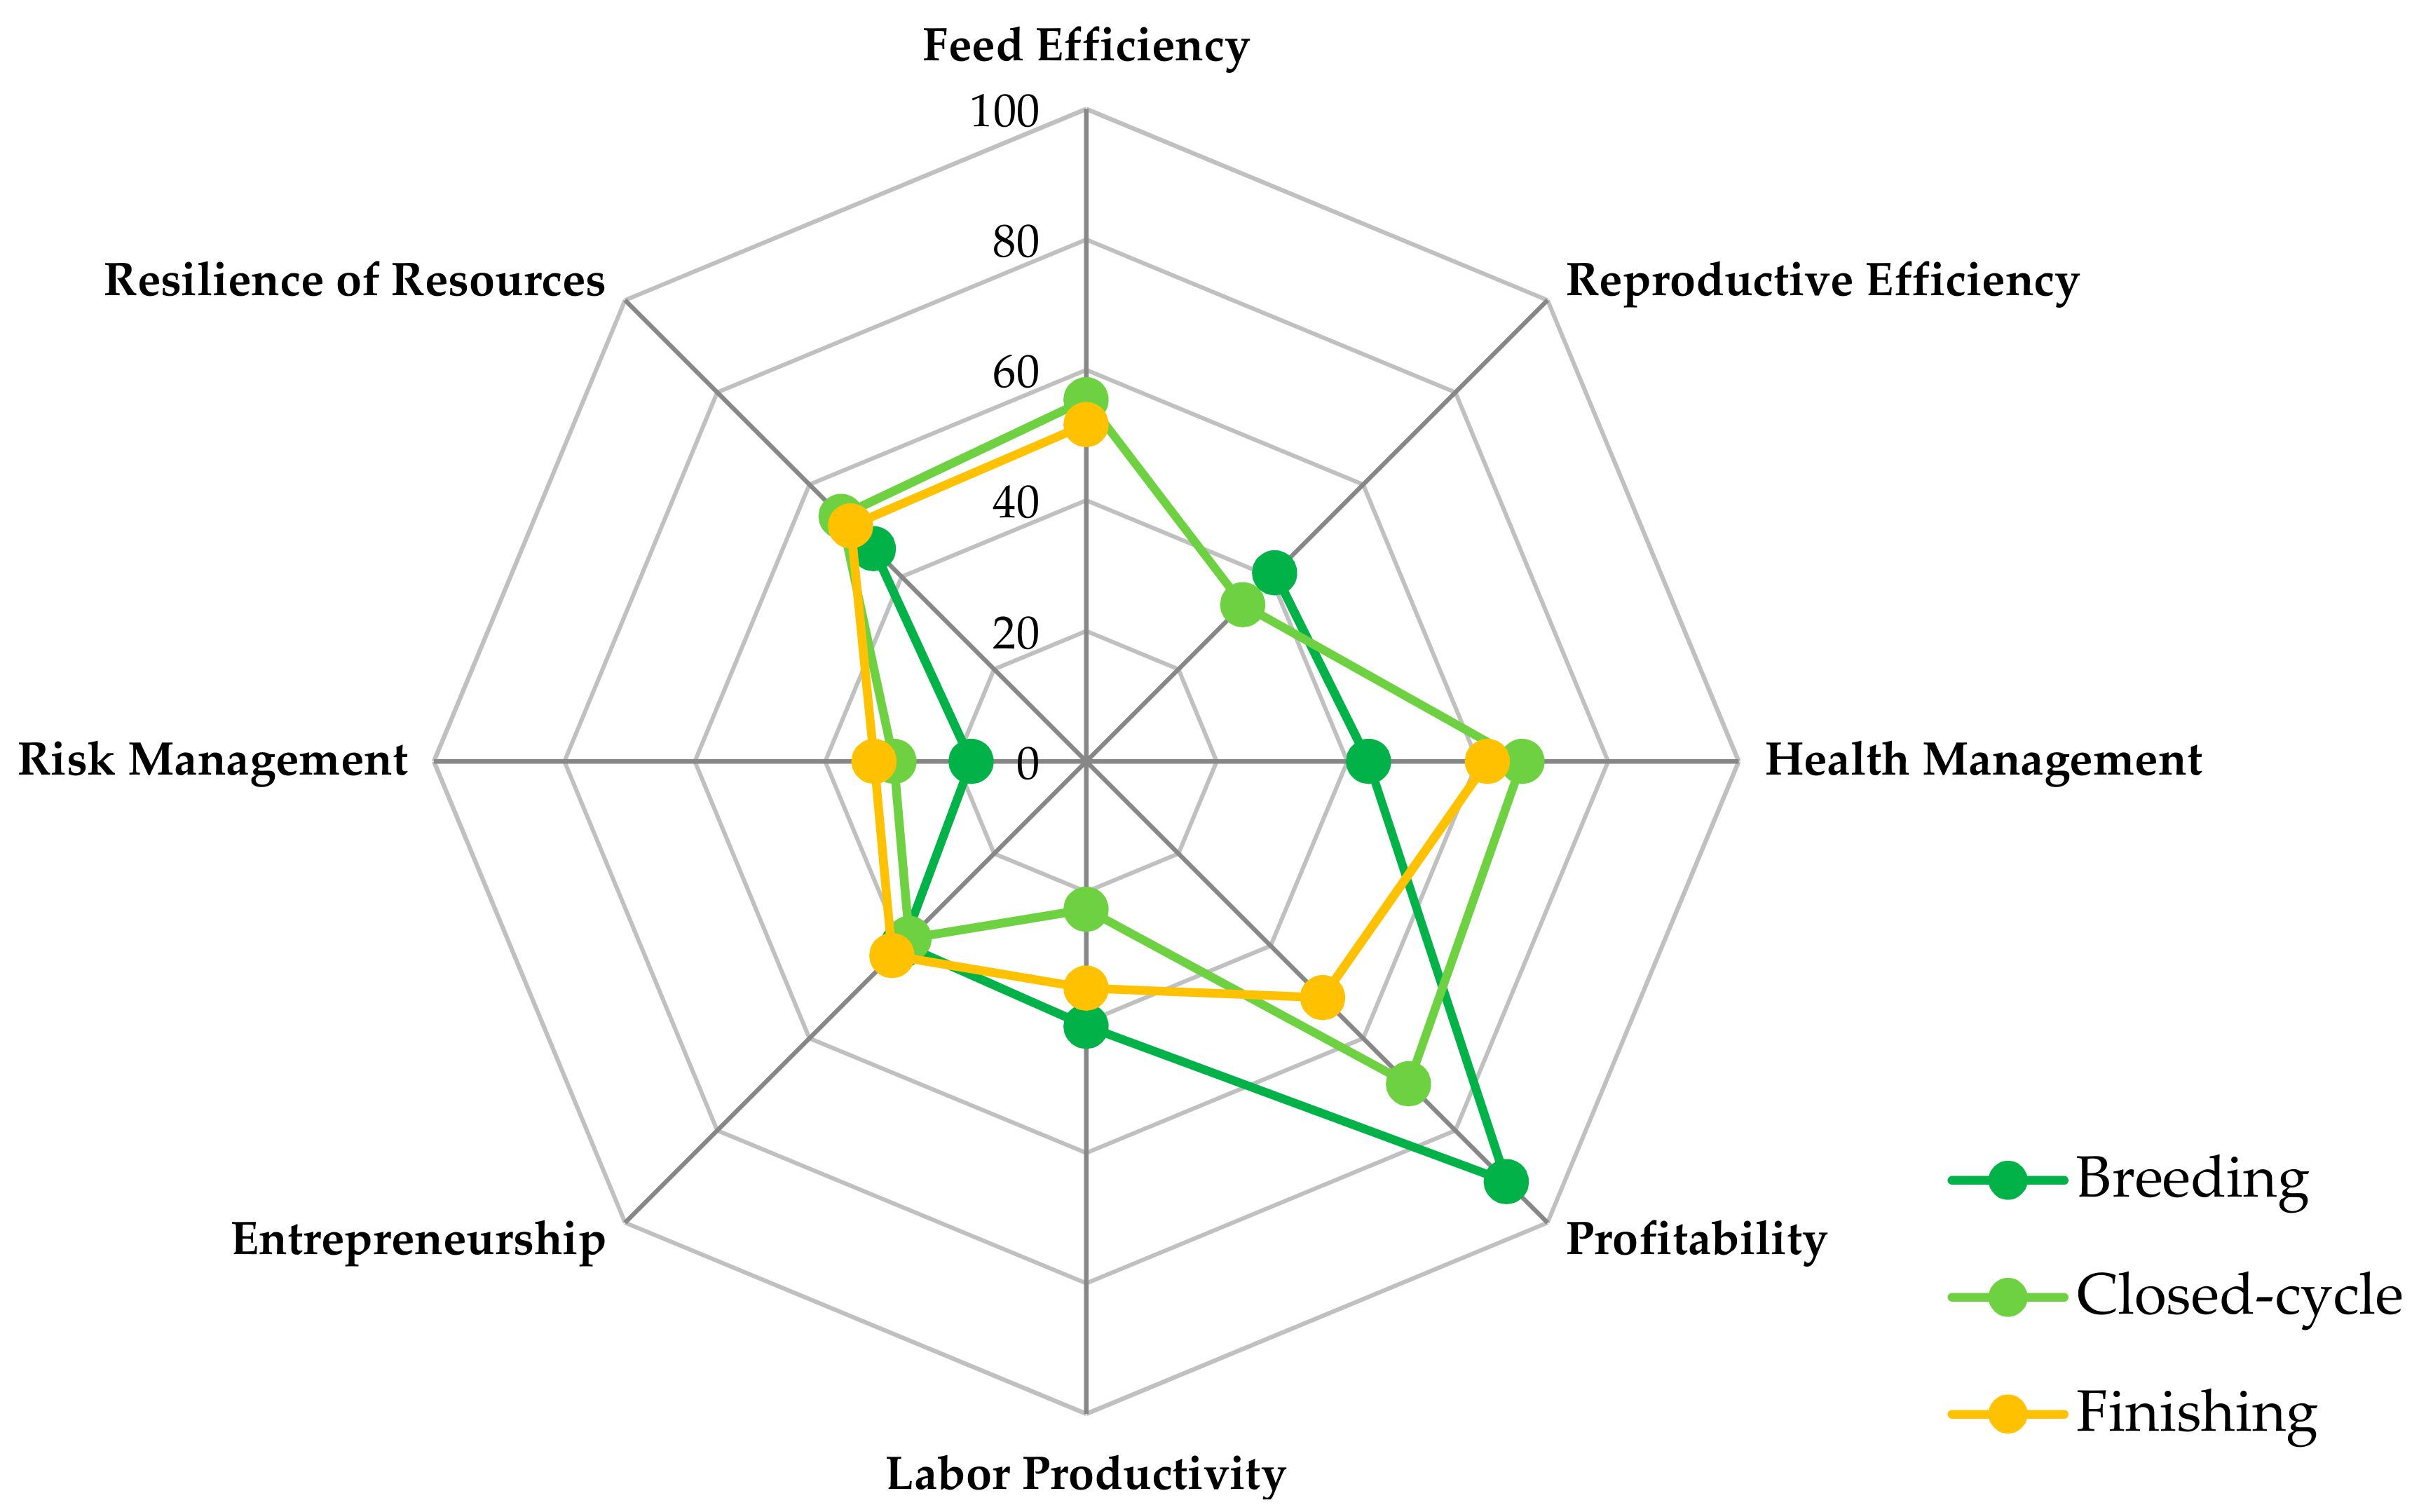
4.3. Aggregated Analysis: Aggregation of Scaled Indicators to Subthemes and Themes

After calculation of all scaled indicators (Figure 2 and Figure 3), the results were further aggregated to the levels of subthemes and themes. The approach was based on the two weighting procedures performed by experts (as described in the methodology), first to aggregate results from the scaled indicators to the subtheme level, then secondly from the subtheme level to the theme result. The results of the aggregation process are presented in Figure 4 and Figure 5.
As already noted at the level of scaled indicators within the theme “technical performance”, after taking the weights into account, it was also observed that in the subtheme of “reproductive efficiency”, specialized breeding farms had an advantage over closed-cycle farms. In contrast, in the case of “health management”, closed-cycle farms had an advantage compared to both breeding and finishing farms. It can also be noticed that at the level of individual indicators in subthemes in the area of “economic resilience”, it was not possible to notice a clear difference in favor of any of the farm types. However, at the aggregated level it was possible to observe that specialized breeding farms had an advantage over closed-cycle farms in three (“profitability“, “labor productivity“, “entrepreneurship“) out of 5 subthemes in this theme. However, finishing farms had a slight advantage over closed-cycle farms in three (“labor productivity“, “entrepreneurship“, “risk management“) out of 5 subthemes, while full-cycle farms have much better scores in the areas of “profitability” and “resilience of resources”.
Finally, taking into account the weights from the second level of aggregation between subthemes and themes, it can be seen that overall, our study farms represent an average level of economic sustainability, scoring between 42 and 57% (Figure 4). In the case of the theme “technical performance”, specialized finishing farms were characterized by a slightly higher level of sustainability (56.2%), followed by closed-cycle farms (52.6%), whereas the lower scores were registered for breeding farms (42.1%). In the case of the theme “economic resilience”, a different situation was observed, where the highest level of sustainability was achieved by specialized breeding farms (59.6%), followed by closed-cycle farms (49.1%), then by finishing farms (44.1%). The reason was the high importance of the subtheme “profitability” in the overall assessment of this theme (weight equal to 40%), as well as a considerable variation in its assessment between individual types of farms. Outcomes of the sustainability assessment for different subthemes per farm type can also be expressed as a spider web (Figure 5), which is suggested as a method of feedback to farmers, which can also include a comparison with other farms as a benchmark.

5. Discussion of Scientific Hypothesis

When we take an aggregated view of the economic sustainability, our results show, as assumed by our hypothesis, that closed-cycle pig farms have advantages in terms of producing healthier animals, due to having their own piglet production facilites and slightly better overall “resilience of resources“. However, in opposition to our hypothesis, breeding and finishing farms were more economically sustainable in the areas of “reproductive efficiency“, “labor productivity“, “profitability, “risk management“, and “entrepreneurship“ (Figure 4 and Figure 5).
In the area of “entrepreneurship“, the assessed bargaining position of pig farmers in the food chain was moderate for breeding and finishing and low for the closed-cycle farms. This confirms the general opinion about the weak position of farms in the supply chain, as discussed in literature [57,59,60,61,83]. We also observed that as indicated by [57,62,66], farms with stronger positions in the supply chain perform better than farmers with lower positions in the chain. Indeed, in our study breeding and finishing farms showed better profitability results than closed-cycle farms (they had higher gross margins as % of turnover, higher labor productivity, and lower costs per kg of meat). The better performance of finishing farms could be related to better utilization of labor, and in the case of breeding units, better reproductive efficiency parameters than for closed-cycle farms. Purdy et al. [84] noted that more specialized farms have an advantage of “improved strategic control” due to being more focused in managerial contexts. They found a significant positive relationship between specialization and mean financial performance in US pig production.
Little research is available on labor productivity on pig farms. This is likely related to the fact that labor is predominantly an implicit cost due to the prevalence of family labor on many farms. However, as farms grow over time, hired labor becomes more and more relevant, and so does the importance of analyzing labor productivity. Unfortunately, labor inputs in terms of hours per pig are not easily comparable, as tasks for different pig categories differ in complexity (e.g., artificial insemination versus pen cleaning). Additionally, farm layouts, levels of modernity, degrees of mechanization, and worker specifications (such as age or level of responsibility) are different among farms. As farms show a large variety of labor inputs [53], comparisons among farm types are even more complicated. As farm sizes (and therefore shares of hired labor) were different among farm types in our analysis, it is hard to draw conclusions on labor efficiency differences among farm types, despite our results showing statistically significant differences among them. Therefore, from a labor productivity point of view, the main hypothesis that closed-cycle farms are assumed to be more economically sustainable than those farms who are involved in both piglet production and growing–finishing cannot be supported.
Finishing farms in our sample are slightly less specialized compared to the other pig farm types. Finishing requires less stockmanship skills than piglet production and is less labor-intensive, and thus in such farms it is easier to manage other production activities aside from pig production. In contrast with other findings [74], these less specialized pig farms did not show higher technical performance than the more specialized farms, such as the closed-cycle farms. Regarding the adaptive capability [77], the closed-cycle farms are more resilient.

6. Conclusions

The assessment of the economic sustainability of pig farms is a complex problem, since many different factors influence the economic performance of a farm in the short and long run. Many systems and tools have been put in place, however such methodologies are mainly focused on short-term farm viability. Our methodology, which goes beyond the classical assessments of the economic pillars of sustainability of pig farms and proposes the integration of short-term farm performance with long-term farm resilience perspectives, seems to be useful. In our opinion, aggregated economic sustainability assessments should include several groups of indicators, capturing both short- and long-term time horizons, and reflecting technical farm performance (e.g., feed efficiency, health management, and reproductive efficiency), as well as economic farm resilience aspects (profitability, labor productivity, entrepreneurship, risk management, and resilience of resources). In the aggregation process for the “technical performance” theme, all three analyzed subthemes almost equally contributed to the aggregated sustainability results, whereas in cases of economic resilience, experts emphasized the roles of profitability and risk management as the most important elements in determining economic farm sustainability.
As a part of the test for the newly developed methodological approach, the hypothesis that closed-cycle farms might be more economically sustainable than those farms that are specialized in piglet production (breeding) or growing–finishing was tested. The results showed that closed-cycle farms do indeed have advantages in terms of raising healthy animals and having slightly better overall resilience of resources, however breeding and finishing farms appeared to be more sustainable in the areas of profitability, risk management, and reproductive efficiency. Thus, our hypothesis was not fully confirmed and requires further investigation.
When interpreting our results, one should keep in mind that the sample of farms was selected in order to test the developed methodology. Thus, we tried to ensure appropriate coverage of all typical systems present in the studied countries and to purposefully achieve a representative variety of farm types. Therefore, due to potential limitations of the selected sample, the results obtained should be further investigated in more targeted studies and on more balanced and broader datasets. The observations indicate, however, some interesting relationships, which could be further analyzed in more in-depth research.
Our newly developed method brings about a broader view on more long-term aspects of economic sustainability, which go beyond concepts such as technical performance, labor productivity, and their impacts on the returns to capital, land, and labor. This wider view of economic sustainability incorporates the levels of entrepreneurship, risk management, and the resilience of the invested resources. Thus, our approach supports evidence-based economic sustainability assessments of pig farms and allows for better targeting of farmers activities towards possible sustainability improvements. This methodological approach may be used in other branches of livestock farming as well.

Author Contributions

Conceptualization, A.M.-R., K.d.R., methodology, A.M.-R., K.d.R., M.G., R.H.; software, A.M.-R., M.G. resources, A.M.-R., K.d.R., M.G., C.L., R.H., M.W.; data curation, A.M.-R., M.G., C.M.; validation: A.M.-R., C.M.; writing—original draft preparation, A.M.-R., K.d.R., C.L., M.G., R.H., C.M., M.W.; writing—review and editing A.M.-R., K.d.R., C.L., M.G., R.H., C.M., M.W.; supervision, A.M.-R., K.d.R. All authors have read and agreed to the published version of the manuscript.

Funding

This research was made possible by funding from SusAn, an ERA-Net co-funded under European Union’s Horizon 2020 research and innovation programme (www.era-susan.eu, accessed o 21 March 2021), under Grant Agreement 696231. This research received funding from the European Union’s ERA-NET SUSAN project SusPigSys.

Institutional Review Board Statement

Not applicable.

Informed Consent Statement

Informed consent was obtained from all subjects involved in the study.

Data Availability Statement

The data presented in this study are available on request from the corresponding author.

Acknowledgments

We would like to thank to our colleagues who contributed to data collection for this paper: Paolo Ferrari and Claudio Montanari for Italy, Monika Gębska and Agata Malak-Rawlikowska for Poland, Juliane Helmerichs for Germany, Antonia Ruckli for Austria, Kirsi Swan for Finland and Herman Vermeer for the Netherlands. Software development was performed by TAXUS IT with support of Monika Gębska, Aleksandra Górecka, and Agata Malak-Rawlikowska. The SusPigSys project was coordinated by Sabine Dippel.

Conflicts of Interest

The authors declare no conflict of interest.

Appendix A

Table A1. Details of indicators under subthemes and themes of the economic sustainability of pig farms.
Sustainability Theme: Technical PerformanceScale Minimum Value
0% = Not Sustainable
Scale
Maximum Value 100% = Very Sustainable
SubthemesIndicators:0% if:100% if
Feed EfficiencyFeed conversion rate for finishing pigs≥3.8≤2.2
Reproductive EfficiencyNumber of litters per sow≤1.5≥2.45
Number of piglets born alive per litter≤10≥20
Number of piglets weaned per litter≤8≥16
Number of piglets weaned per sow≤18≥36
Age of piglets at weaning≤21≥55
Weight of piglets at weaning≤6≥15
Health ManagementPre-weaning mortality rate≥22%≤6%
Sow mortality≥12%≤2%
Mortality rate finishing pigs≥5%≤1%
Veterinary+medicine costs per sow≥10%≤2%
Veterinary+medicine costs per finishing pig≥1.5%≤0.1
Sustainability Theme: Economic ResilienceScale Minimum Value
0% = Not Sustainable
Scale
Maximum Value 100% = Very Sustainable
SubthemesIndicators:0% if:100% if
EntrepreneurshipBargaining power in the chain
Qualitative based on 2 questions: How easy would it be for your meat processor to find a substitute for your pig deliveries? (5 points scale where 0%—very easy; 100%—very difficult); My position in the chain—to which extent can you influence things (price, quantities, quality, payments, discounts, etc.) (0% = very weak; 100%—very strong)
Q1: 0%—very easy;
Q2: 0%—very weak
Q1: 100%—very difficult
Q2: 100%—very strong
Horizontal cooperation between farmers
Qualitative based on 2 questions: Are you a member of a producer (group) organization for the sale of your products? Y = 100%/N = 0%; Are you member of an organization (producer group) purchasing feed or using machinery etc. Y = 100%/N = 0%)
0% = no100% = yes
ProfitabilityGross margin over feed costs per finishing pig expressed as % of turnover (value) per finishing pig≤20%≥50%
Gross margin over non-factor costs per finishing pig expressed as % of turnover (value) per finishing pig≤10%≥40%
Gross margin over feed costs per sow expressed as % of turnover (value) per sow≤20%≥50%
Gross margin over non-factor costs per sow expressed as % of turnover (value) per sow≤10%≥40%
Production costs per kg of pig meat (dead weight) as % of price≥100%≤80%
Risk ManagementDegree of specialization
(Qualitative based on question: What is % share of the pig production turnover in the total farm turnover)
76–100%0–25%
Share (percentage) of rented land76–100%0–25%
Share (percentage) of family labor0–25%76–100%
Labor ProductivityProduction Kg of pig meat (dead weight) per annual working unit (1AWU = 1800 h/year)≤80,000≥800,000
Number of sows per annual working unit (1AWU = 1800 h)≤60≥250
Number of finishing pigs per annual working unit (1AWU = 1800 h)≤1000≥6000
Resilience of ResourcesDegree of modernity
Qualitative based on 2 questions: How old is on average your pig production equipment? ((100%—0–5 years; 50%—5–10 years, 0%—more than 10 years); How old are on average your pig production buildings? (100%—0–10 years, 50% = 10–25 years, 0% = over 25 years)
Q1: 0%—more than 10 years
Q2: 0%—over 25 years
Q1: 100%—0–5 years
Q2: 100%—0–10 years
Capital intensity
Qualitative based question: How big is the invested value of your farm compared to farms that are similar to your farm? (100%—Much bigger than average, 75%—bigger than average, 50%—equal, 25%—smaller than average, 0%—much smaller than average)
0%—much smaller than average100%—Much bigger than average
Investment potential
Qualitative based on 2 questions: Does your financial position allow for large investments? (5 points scale where 0%—definitely not; 100%—certainly yes); How easy would it be for you to receive a bank loan to keep your farm-up- date? (5 points scale where 0%—almost impossible; 100%—very easy)
Q1: 0%—definitely not
Q2: 0%—almost impossible
Q1: 100%—certainly yes Q2: 100%—very easy
Innovation potential
Qualitative question: How soon will you adopt new products, technologies or management practices when they are developed? (100%—early adopter; 0%—late follower)
0%—late follower100%—early adopter
Source: own elaboration.
Table A2. Weights used in aggregation of indicators into subthemes of economic sustainability.
Sustainability Theme: Technical Performance
SubthemesIndicators:Breeding FarmsFinishing FarmsClosed-Cycle
Feed EfficiencyFeed conversion rate finishing pigs 100100
Total 100100
Reproductive EfficiencyNumber of litters per sow6 6
Number of piglets born per litter0 0
Number of piglets weaned per litter12 12
Number of piglets weaned per sow52 52
Age of piglets at weaning12 12
Weight of piglets at weaning18 18
Total 100100
Health ManagementPre-weaning mortality rate46 26.3
Sow mortality22 12.5
Mortality rate finishing pigs 5623.8
Veterinary costs per sow33 18.7
Veterinary costs per finishing pig 4418.7
Total100100100
Sustainability Theme: ECONOMIC Resilience
SubthemesIndicators:Breeding FarmsFinishing FarmsClosed-Cycle
ProfitabilityGross margin over feed costs
per finishing pig
-00
Gross margin over non-factor costs
per finishing pig
-5019
Gross margin over feed costs per sow30-19
Gross margin over non-factor costs
per sow
70-19
Production non-factor costs per kg of pig meat-5043
Total100100100
Labor ProductivityProduction Kg of pig meat per AWU-7249
Number of sows per AWU100-32
Number of finishing pigs per AWU 2819
Total100100100
EntrepreneurshipBargaining power in the chain404040
Horizontal cooperation between farmers606060
Total100100100
Risk ManagementDegree of specialization707070
Share (percentage) of rented land101010
Share (percentage) of family labor202020
Total100100100
Resilience of ResourcesDegree of modernity282828
Capital intensity222222
Investment potential282828
Innovation potential222222
Total100100100
Source: own elaboration.

References

  1. European Commission. Communication from the Commission to the Council and the European Parliament: Draft Declaration on Guiding Principles for Sustainable Development. Communities 2005, 1–6, 200. [Google Scholar]
  2. European Commission. Communication from the Commission: A Sustainable Europe for a Better World: A European Union Strategy for ‘Sustainable Development’. Brussels 2002, 14, 261–264. [Google Scholar] [CrossRef]
  3. Brundtland, G.H. Our Common Future (‘The Brundtland Report’): World Commission on Environment and Development; United Nations: Oslo, Norway, 1987. [Google Scholar] [CrossRef]
  4. Dagevos, H.; Voordouw, J. Sustainability and meat consumption: Is reduction realistic? Sustain. Sci. Pract. Policy 2013, 9, 60–69. [Google Scholar] [CrossRef]
  5. Hauschild, L.; Lovatto, P.A.; Pomar, J.; Pomar, C. Development of sustainable precision farming systems for swine: Estimating real-time individual amino acid requirements in growing-finishing pigs. J. Anim. Sci. 2012, 90, 2255–2263. [Google Scholar] [CrossRef] [PubMed]
  6. Pomar, C.; Remus, A. Precision pig feeding: A breakthrough toward sustainability. Anim. Front. 2019, 9, 52–59. [Google Scholar] [CrossRef]
  7. Rauw, W.M.; Rydhmer, L.; Kyriazakis, I.; Øverland, M.; Gilbert, H.; Dekkers, J.C.; Hermesch, S.; Bouquet, A.; Izquierdo, E.G.; Louveau, I.; et al. Prospects for sustainability of pig production in relation to climate change and novel feed resources. J. Sci. Food Agric. 2020, 100, 3575–3586. [Google Scholar] [CrossRef] [Green Version]
  8. Cucchiella, F.; D’Adamo, I.; Gastaldi, M. An economic analysis of biogas-biomethane chain from animal residues in Italy. J. Clean. Prod. 2019, 230, 888–897. [Google Scholar] [CrossRef]
  9. Shurson, G.C. “What a Waste”—Can We Improve Sustainability of Food Animal Production Systems by Recycling Food Waste Streams into Animal Feed in an Era of Health, Climate, and Economic Crises? Sustain. J. Rec. 2020, 12, 7071. [Google Scholar] [CrossRef]
  10. Fiorese, G.; Guariso, G. Energy from Agricultural and Animal Farming Residues: Potential at a Local Scale. Energies 2012, 5, 3198–3217. [Google Scholar] [CrossRef] [Green Version]
  11. Hoste, R. International Comparison of Pig Production Costs 2018; Results of InterPIG: Wageningen, The Netherlands, 2020. [Google Scholar] [CrossRef]
  12. Verhaagh, M.; Deblitz, C.; Rohlmann, C. A Standard Operating Procedure to Define Typical Farms; AgriBenchmark Pigs: Braunscweig, Germany, 2018. [Google Scholar]
  13. FAO-SAFA. Sustainability Assessment of Food and Agriculture Systems, Sustainability Indicators—SAFA. 2013. Available online: http://www.fao.org/fileadmin/templates/nr/sustainability_pathways/docs/SAFA_Indicators_final_19122013.pdf (accessed on 1 April 2019).
  14. Zahm, F.; Viaux, P.; Vilain, L.; Girardin, P.; Mouchet, C. Assessing farm sustainability with the IDEA method—From the concept of agriculture sustainability to case studies on farms. Sustain. Dev. 2008, 16, 271–281. [Google Scholar] [CrossRef]
  15. De Mey, K.; D’Haene, K.; Marchand, F.; Meul, M.; Lauwers, L. Learning through stakeholder involvement in the implementation of MOTIFS: An integrated assessment model for sustainable farming in Flanders. Int. J. Agric. Sustain. 2011, 9, 350–363. [Google Scholar] [CrossRef]
  16. Meul, M.; Passel, S.; Nevens, F.; Dessein, J.; Rogge, E.; Mulier, A.; Hauwermeiren, A. MOTIFS: A monitoring tool for integrated farm sustainability. Agron. Sustain. Dev. 2008, 28, 321–332. [Google Scholar] [CrossRef] [Green Version]
  17. Van Cauwenbergh, N.; Biala, K.; Bielders, C.; Brouckaert, V.; Franchois, L.; Cidad, V.G.; Hermy, M.; Mathijs, E.; Muys, B.; Reijnders, J.; et al. SAFE—A hierarchical framework for assessing the sustainability of agricultural systems. Agric. Ecosyst. Environ. 2007, 120, 229–242. [Google Scholar] [CrossRef]
  18. Häni, F.; Braga, F.; Stämpfli, A.; Keller, T.; Fischer, M.; Porsche, H. RISE, a tool for holistic sustainability assessment at the farm level. Int. Food Agribus. Manag. Rev. 2003, 6, 2003. [Google Scholar]
  19. Grande, J. New venture creation in the farm sector—Critical resources and capabilities. J. Rural. Stud. 2011, 27, 220–233. [Google Scholar] [CrossRef]
  20. de Roest, K.; Ferrari, P.; Knickel, K. Specialisation and economies of scale or diversification and economies of scope? Assessing different agricultural development pathways. J. Rural. Stud. 2018, 59, 222–231. [Google Scholar] [CrossRef]
  21. Lien, G.; Hardaker, J.B.; Flaten, O. Risk and economic sustainability of crop farming systems. Agric. Syst. 2007, 94, 541–552. [Google Scholar] [CrossRef] [Green Version]
  22. Lebacq, T.; Baret, P.V.; Stilmant, D. Sustainability indicators for livestock farming. A review. Agron. Sustain. Dev. 2013, 33, 311–327. [Google Scholar] [CrossRef]
  23. Briquel, V.; Vilain, L.; Bourdais, J.L.; Girardin, P.; Mouchet, C.; Viaux, P. La Méthode IDEA (Indicateurs de Durabilité des Exploitations Agricoles): Une Démarche Pédagogique; IRSTEA; CEMAGREF; Lavoisier: Paris, France, 2001. [Google Scholar]
  24. Latruffe, L.; Diazabakana, A.; Bockstaller, C.; Desjeux, Y.; Finn, J.; Kelly, E.; Ryan, M.; Uthes, S. Measurement of sustainability in agriculture: A review of indicators. Stud. Agric. Econ. 2016, 118, 123–130. [Google Scholar] [CrossRef]
  25. Barry, C.B.B.; Peter, J.; Ellinger, P.N.; Hopkin, J.A. Financial Management in Agriculture, 6th ed.; Interstate Publishers: Danville, IL, USA, 2000. [Google Scholar] [CrossRef]
  26. Blank, S.C.; Erickson, K.W.; Nehring, R.; Hallahan, C. Agricultural Profits and Farm Household Wealth: A Farm-level Analysis Using Repeated Cross Sections. J. Agric. Appl. Econ. 2009, 41, 207–225. [Google Scholar] [CrossRef] [Green Version]
  27. Shadbolt, N.; Kelly, T.; Holmes, C. Organic dairy farming: Cost of production and profitability. AFBM J. 2005, 2, 136–145. [Google Scholar]
  28. Van Calker, K.; Berentsen, P.; Romero, C.; Giesen, G.; Huirne, R. Development and application of a multi-attribute sustainability function for Dutch dairy farming systems. Ecol. Econ. 2006, 57, 640–658. [Google Scholar] [CrossRef]
  29. Sadok, W.; Angevin, F.; Bergez, J.-E.; Bockstaller, C.; Colomb, B.; Guichard, L.; Reau, R.; Messéan, A.; Doré, T. MASC, a qualitative multi-attribute decision model for ex ante assessment of the sustainability of cropping systems. Agron. Sustain. Dev. 2009, 29, 447–461. [Google Scholar] [CrossRef] [Green Version]
  30. Hennessy, T.; Buckley, C.; Dillon, E.; Donnellan, T.; Hanrahan, K.; Moran, B.; Ryan, M. Measuring Farm Level Sustainability with the Teagasc National Farm Survey; Rural Economy and Development Programme, Teagasc Athenry, Co.: Galway, Ireland, 2013. [Google Scholar]
  31. Tey, Y.S.; Brindal, M. Factors Influencing Farm Profitability. In Sustainable Agriculture Reviews. Sustainable Agriculture Reviews; Lichtfouse, E., Ed.; Springer: Cham, Switzerland, 2015; Volume 15, pp. 235–255. [Google Scholar] [CrossRef]
  32. Pannell, D.J.; Glenn, N.A. A framework for the economic evaluation and selection of sustainability indicators in agriculture. Ecol. Econ. 2000, 33, 135–149. [Google Scholar] [CrossRef]
  33. O’Donnell, C.J. Measuring and decomposing agricultural productivity and profitability change. Aust. J. Agric. Resour. Econ. 2010, 54, 527–560. [Google Scholar] [CrossRef] [Green Version]
  34. Boland, M.A.; Patrick, G.F. Measuring Variability of Performance among Individual Swine Producers. Rev. Agric. Econ. 1994, 16, 75–82. Available online: https://econpapers.repec.org/RePEc:oup:revage:v:16:y:1994:i:1:p:75-82 (accessed on 1 May 2020). [CrossRef]
  35. Edwards, W.M.; Van Der Sluis, G.T.; Stevermer, E.J. Determinants of Profitability in Farrow-to-Finish Swine Production. North Central J. Agric. Econ. 1989, 11, 17. Available online: https://econpapers.repec.org/RePEc:oup:revage:v:11:y:1989:i:1:p:17-25 (accessed on 1 May 2020). [CrossRef]
  36. Stein, T.E.; Duffy, S.J.; Wickstrom, S. Differences in production values between high- and low-productivity swine breeding herds. J. Anim. Sci. 1990, 68, 3972–3979. [Google Scholar] [CrossRef] [PubMed]
  37. Wilson, M.R.; Friendship, R.M.; McMillan, I.; Hacker, R.R.; Pieper, R.; Swaminathan, S. A Survey of Productivity and its Component Interrelationships in Canadian Swine Herds. J. Anim. Sci. 1986, 62, 576–582. [Google Scholar] [CrossRef]
  38. Jack, L. Benchmarking in Food and Farming Creating Sustainable Change, 1st ed.; Routledge: Abingdon-on-Thames, UK, 2009. [Google Scholar]
  39. Wang, B.; Xie, K.; Lee, K. Veterinary Drug Residues in Animal-Derived Foods: Sample Preparation and Analytical Methods. Foods 2021, 10, 555. [Google Scholar] [CrossRef]
  40. Asmild, M.; Hougaard, J.L. Economic versus environmental improvement potentials of Danish pig farms. Agric. Econ. 2006, 35, 171–181. [Google Scholar] [CrossRef]
  41. Labajova, K.; Hansson, H.; Asmild, M.; Göransson, L.; Lagerkvist, C.-J.; Neil, M. Multidirectional analysis of technical efficiency for pig production systems: The case of Sweden. Livest. Sci. 2016, 187, 168–180. [Google Scholar] [CrossRef]
  42. Galanopoulos, K.; Aggelopoulos, S.; Kamenidou, I.; Mattas, K. Assessing the effects of managerial and production practices on the efficiency of commercial pig farming. Agric. Syst. 2006, 88, 125–141. [Google Scholar] [CrossRef]
  43. Lansink, A.O.; Reinhard, S. Investigating technical efficiency and potential technological change in Dutch pig farming. Agric. Syst. 2004, 79, 353–367. [Google Scholar] [CrossRef]
  44. Latruffe, L.; Desjeux, Y.; Bakucs, Z.; Fertő, I.; Fogarasi, J. Environmental Pressures and Technical Efficiency of Pig Farms in Hungary. Manag. Decis. Econ. 2013, 34, 409–416. [Google Scholar] [CrossRef]
  45. Piot-Lepetit, I.; Vermersch, D. Pricing Organic Nitrogen Under the Weak Disposability Assumption: An Application to the French Pig Sector. J. Agric. Econ. 1998, 49, 85–99. [Google Scholar] [CrossRef]
  46. Sharma, K.R.; Leung, P.; Zaleski, H.M. Productive Efficiency of the Swine Industry in Hawaii: Stochastic Frontier vs. Data Envelopment Analysis. J. Prod. Anal. 1997, 8, 447–459. [Google Scholar] [CrossRef]
  47. Sharma, K.R.; Leung, P.; Zaleski, H.M. Technical, allocative and economic efficiencies in swine production in Hawaii: A comparison of parametric and nonparametric approaches. Agric. Econ. 1999, 20, 23–35. [Google Scholar] [CrossRef]
  48. Tonsor, G.T.; Featherstone, A.M. Production Efficiency of Specialized Swine Producers. Rev. Agric. Econ. 2009, 31, 493–510. Available online: https://econpapers.repec.org/RePEc:oup:revage:v:31:y:2009:i:3:p:493-510 (accessed on 1 May 2020). [CrossRef]
  49. Henningsen, A.; Czekaj, T.G.; Forkman, B.; Lund, M.; Nielsen, A.S. The Relationship between Animal Welfare and Economic Performance at Farm Level: A Quantitative Study of Danish Pig Producers. J. Agric. Econ. 2017, 69, 142–162. [Google Scholar] [CrossRef] [Green Version]
  50. Heshmati, A.; Kumbhakar, S.C.; Hjalmarsson, L. Efficiency of the Swedish pork industry: A farm level study using rotating panel data 1976–1988. Eur. J. Oper. Res. 1995, 80, 519–533. Available online: https://econpapers.repec.org/RePEc:eee:ejores:v:80:y:1995:i:3:p:519-533 (accessed on 1 May 2020). [CrossRef]
  51. Ilari-Antoine, E.; Bonneau, M.; Klauke, T.N.; Gonzàlez, J.; Dourmad, J.-Y.; De Greef, K.; Houwers, H.W.J.; Fabrega, E.; Zimmer, C.; Hviid, M.; et al. Evaluation of the sustainability of contrasted pig farming systems: Economy. Animal 2014, 8, 2047–2057. [Google Scholar] [CrossRef] [PubMed] [Green Version]
  52. Ryan, M.; Hennessy, T.; Buckley, C.; Dillon, E.J.; Donnellan, T.; Hanrahan, K.; Moran, B. Developing farm-level sustainability indicators for Ireland using the Teagasc National Farm Survey. Ir. J. Agric. Food Res. 2016, 55, 112–125. [Google Scholar] [CrossRef] [Green Version]
  53. Hoste, R.; Wisman, A. Large differences in labour input in the pig sector. Grote verschillen in arbeidsinzet in de varkenshouderij. Agri-Monitor 2012, 11, 2–4. [Google Scholar] [CrossRef]
  54. Zonderland, J. Arbeidsproductiviteit in Relatie Tot Ondernemerschap; Wageningen UR: Wageningen, The Netherlands, 2007; Available online: https://edepot.wur.nl/17209 (accessed on 1 May 2020).
  55. Commandeur, M.A.M. Styles of Pig Farming and Family Labour in the Netherlands. J. Comp. Fam. Stud. 2005, 36, 391–398. [Google Scholar] [CrossRef]
  56. Link, A.N. In search of the meaning of entrepreneurship. Small Bus. Econ. 1989, 1, 39–49. [Google Scholar] [CrossRef]
  57. Fałkowski, J.; Malak-Rawlikowska, A.; Milczarek-Andrzejewska, D. Farmers’ self-reported bargaining power and price heterogeneity. Br. Food J. 2017, 119, 1672–1686. [Google Scholar] [CrossRef]
  58. Malak-Rawlikowska, A.; Milczarek-Andrzejewska, D.; Fałkowski, J. Farmers’ Bargaining Power and Input Prices: What Can We Learn from Self-Reported Assessments? Soc. Sci. 2019, 8, 63. [Google Scholar] [CrossRef] [Green Version]
  59. Swinnen, J.F.M. The dynamics of vertical coordination in agri-food supply chains in transition countries. In Global Supply Chains, Standards and the Poor: How the Globalization of Food Systems and Standards Affects Rural Development and Poverty; CABI: Wallingford, UK, 2007; pp. 42–58. [Google Scholar]
  60. Csaki, C.; Forgacs, C.; Milczarek-Andrzejewska, D.; Wilkin, J. Restructuring Market Relations in Food and Agriculture in Central and Eastern Europe: Impacts upon Small Farmers; Agroinform: Budapest, Hungary, 2008. [Google Scholar]
  61. Hingley, M.; Angell, R.; Lindgreen, A. The current situation and future conceptualization of power in industrial markets. Ind. Mark. Manag. 2015, 48, 226–230. [Google Scholar] [CrossRef] [Green Version]
  62. Cho, W.; Ke, J.-Y.F.; Han, C. An empirical examination of the use of bargaining power and its impacts on supply chain financial performance. J. Purch. Supply Manag. 2019, 25, 100550. [Google Scholar] [CrossRef]
  63. Meyer, J.; Cramon-Taubadel, S. Asymmetric Price Transmission: A Survey. J. Agric. Econ. 2004, 55, 581–611. [Google Scholar] [CrossRef] [Green Version]
  64. Bakucs, Z.; Fałkowski, J.; Fertő, I. Does Market Structure Influence Price Transmission in the Agro-food Sector? A Meta-analysis Perspective. J. Agric. Econ. 2014, 65, 1–25. [Google Scholar] [CrossRef] [Green Version]
  65. Antras, P. Global Production. Firms, Contracts and Trade Structure; Princeton University Press: Princeton, NJ, USA, 2016. [Google Scholar]
  66. Binmore, K.; Rubinstein, A.; Wolinsky, A. The Nash Bargaining Solution in Economic Modelling. RAND J. Econ. 1986, 17, 176. Available online: https://econpapers.repec.org/RePEc:rje:randje:v:17:y:1986:i:summer:p:176-188 (accessed on 1 May 2020). [CrossRef]
  67. Bijman, J.; Iliopoulos, C.; Poppe, K.J.; Gijselinckx, C. Support for Farmers’ Cooperatives; Case Study Report European Fruit Co-operation (EFC); Wageningen UR: Wageningen, The Netherlands, 2012; Available online: https://edepot.wur.nl/244999 (accessed on 1 May 2020).
  68. Hendrikse, G.W.J.; Veerman, C.P. Marketing cooperatives and financial structure: A transaction costs economics analysis. Agric. Econ. 2001, 26, 205–216. [Google Scholar] [CrossRef]
  69. Camp, W.R. Agricultural Pools in Relation to Regulating the Movement and Price of Commodities. Proc. Acad. Politic Sci. City N. Y. 1926, 11, 183. [Google Scholar] [CrossRef]
  70. Chlebicka, A.; Fałkowski, J.; Łopaciuk-Gonczaryk, B. Horizontal integration between farmers—Governing cooperation through different enforcement mechanisms. In It’s a Jungle out There—The Strange Animals of Economic Organization in Agri-Food Value Chains; Wageningen Academic Publishers: Wageningen, The Netherlands, 2017; pp. 85–104. [Google Scholar]
  71. Biró, S.; Hamza, E.; Rácz, K. Economic and social importance of vertical and horizontal forms of agricultural cooperation in Hungary. Stud. Agric. Econ. 2016, 118, 77–84. [Google Scholar] [CrossRef] [Green Version]
  72. Niemi, J.K. Designing Coordination Contracts to Support Efficient Flow-Scheduling in Pork Chain. 2012. Available online: https://econpapers.repec.org/RePEc:ags:aaea12:125208 (accessed on 1 May 2020).
  73. Mao, H.; Zhou, L.; Ifft, J.; Ying, R. Risk preferences, production contracts and technology adoption by broiler farmers in China. China Econ. Rev. 2019, 54, 147–159. [Google Scholar] [CrossRef]
  74. Tiedemann, T.; Breustedt, G.; Latacz-Lohmann, U. Risikoberücksichtigung in der nicht parametrischen Effizienzanalyse: Auswirkungen auf die Effizienzbewertung von deutschen Schweinemastbetrieben. Ger. J. Agric. Econ. 2011, 60, 215–229. [Google Scholar]
  75. Hermann, D.; Agethen, K.; Mußhoff, O. Investment behavior of organic and conventional pig farmers in Germany—An experimental approach. Ger. J. Agric. Econ. 2015, 64, 1–15. [Google Scholar] [CrossRef]
  76. Meuwissen, M.P.M.; Feindt, P.H.; Spiegel, A.; Termeer, C.J.A.M.; Mathijs, E.; De Mey, Y.; Finger, R.; Balmann, A.; Wauters, E.; Urquhart, J.; et al. A Framework to Assess the Resilience of Farming Systems. Agric. Syst. 2019, 176, 102656. [Google Scholar] [CrossRef]
  77. Darnhofer, I. Resilience and why it matters for farm management. Eur. Rev. Agric. Econ. 2014, 41, 461–484. [Google Scholar] [CrossRef]
  78. Walker, B.; Holling, C.S.; Carpenter, S.R.; Kinzig, A.P. Resilience, Adaptability and Transformability in Social-ecological Systems. Ecol. Soc. 2004, 9, 5. [Google Scholar] [CrossRef]
  79. Oostindie, H.A.; Horlings, L.G.; van Broekhuizen, R.E.; Hees, E. GLAMUR Case-Study Report: The Comparison of Three Dutch Pork Cases (Tasks 3.5); Wageningen UR: Wageningen, The Netherlands, 2015; Available online: https://edepot.wur.nl/360370 (accessed on 1 May 2020).
  80. Munsterhjelm, C.; de Roest, K.; Dippel, S.; Guy, J.; Hörtenhuber, S.; Hubbard, C.; Kasperczyk, N.; Leeb, C.; Ruckli, A.; Valros, A. Sustainable Pig Production Systems Deliverable 2.1 Publishable Report on Development of Detailed and Condensed Pro-Tocols; SusPiGSys Project: Celje, Germany, 2021. [Google Scholar] [CrossRef]
  81. Dalkey, N.; Helmer, O. An Experimental Application of the DELPHI Method to the Use of Experts. Manag. Sci. 1963, 9, 458–467. [Google Scholar] [CrossRef]
  82. Linstone, H.A.; Turoff, M. The Delphi Method: Techniques and Applications; Addison-Wesley: Boston, MA, USA, 1975; Volume 1. [Google Scholar]
  83. Reardon, T.; Timmer, C.P. Chapter 55 Transformation of Markets for Agricultural Output in Developing Countries Since 1950: How Has Thinking Changed? In Agricultural Development: Farmers, Farm Production and Farm Markets; Evenson, R., Pingali, P., Eds.; Elsevier: Amsterdam, The Netherlands, 2007; Volume 3, pp. 2807–2855. [Google Scholar]
  84. Purdy, B.M.; Langemeier, M.R.; Featherstone, A.M. Financial Performance, Risk, and Specialization. J. Agric. Appl. Econ. 1997, 29, 149–161. [Google Scholar] [CrossRef] [Green Version]
Figure 1. General methodological approach taken to aggregate indicators into subthemes and themes of the economic sustainability assessment. Source: Own elaboration.
Energies 14 01760 g001
Figure 2. Results of economic sustainability assessment of the theme “technical performance” on the pig farms according to scaled indicators (results of indicators recalculated to a scale ranging from 0% to 100%, where 100% is the highest sustainability level and 0% is the lowest sustainability level. Source: Own calculations.
Energies 14 01760 g002
Figure 3. Results of the economic sustainability assessment of the theme “resilience” on the pig farms according to scaled indicators (results of indicators recalculated to a scale ranging from 0% to 100%, where 100% is the highest sustainability level and 0% is the lowest sustainability level. Source: Own calculations.
Energies 14 01760 g003
Figure 4. Results of the sustainability assessment of pig farms according to different subthemes and themes (weighted results). Note: results of scaled indicators were weighted in order to integrate results to the subtheme level. Source: Own calculations.
Energies 14 01760 g004
Figure 5. Spider web presenting the results of the economic sustainability assessment for different subthemes per farm type.
Energies 14 01760 g005
Table 1. Indicators, subthemes, and themes of economic sustainability and relevance (+) for three different types of pig farms.
Sustainability Theme: Technical Performance
SubthemesIndicators:Breeding FarmsFinishing FarmsClosed-Cycle
Feed EfficiencyFeed conversion rate for finishing pigs ++
Reproductive EfficiencyNumber of litters per sow+ +
Number of piglets born per litter+ +
Number of piglets weaned per litter+ +
Number of piglets weaned per sow+ +
Age of piglets at weaning+ +
Weight of piglets at weaning+ +
Health ManagementPre-weaning mortality rate+ +
Sow mortality+ +
Mortality rate finishing pigs ++
Veterinary costs per sow+ +
Veterinary costs per finishing pig ++
Sustainability Theme: Economic Resilience
SubthemesIndicators:Breeding FarmsFinishing FarmsClosed-Cycle
ProfitabilityGross margin over feed costs
per finishing pig
++
Gross margin over non-factor costs
per finishing pig
++
Gross margin over feed costs per sow+ +
Gross margin over non-factor costs
per sow
+ +
Production non-factor costs per kg of pig meat ++
Labor ProductivityProduction Kg of pig meat per annual working unit (AWU) ++
Number of sows per AWU+ +
Number of finishing pigs per AWU ++
EntrepreneurshipBargaining power in the chain+++
Horizontal cooperation between farmers+++
Risk ManagementDegree of specialization+++
Share (percentage) of rented land+++
Share (percentage) of family labor+++
Resilience of ResourcesDegree of modernity+++
Capital intensity+++
Investment potential+++
Innovation potential+++
Source: Own elaboration.
Table 2. Weights used in aggregation of subthemes into themes of economic sustainability.
ThemesSubthemesBreeding FarmsFinishing FarmsClosed-Cycle
TECHNICAL PERFORMACNEFeed Efficiency-5438
Reproductive Efficiency48-30
Health Management524632
Total100100100
ECONOMIC RESILIENCEProfitability 404040
Labor Productivity151515
Entrepreneurship101010
Risk Management202020
Resilience of Resources151515
Total100100100
Source: Own elaboration.
Table 3. Number of farms in the sample per country and farm type.
CountryAustriaFinlandGermanyItalyThe NetherlandsPolandTotal
Number of farms 25725242525131
Out of which:
Breeding131103018
Closed-cycle182112101558
Finishing621312121055
Source: Own elaboration.
Table 4. Technical performance indicators across farm types (values and standard deviations).
Sustainability Theme: Technical Performance
SubthemesIndicators:Breeding Farms
(n = 18)
Finishing Farms
(n = 55)
Closed-Cycle
(n = 58)
Feed EfficiencyFeed conversion rate finishing pigs (FCRfp)-2.98
(0.47)
2.91
(0.52)
Reproductive EfficiencyNumber of litters per sow **2.23
(0.21)
-2.15
(0.19)
Number of piglets born per litter ***14.04
(1.27)
-12.56
(2.01)
Number of piglets weaned per litter ***12.06
(1.28)
-10.73
(1.60)
Number of piglets weaned per sow ***26.96
(4.19)
-23.31
(4.74)
Age of piglets at weaning (days)28.0
(1.50)
-32.63
(9.64)
Weight of piglets at weaning (kg) ***6.85
(0.41)
-9.17
(3.67)
Health ManagementPre-weaning mortality rate (%)14.11
(5.18)
-13.84
(7.43)
Sow mortality (%)6.60
(2.57)
-5.48
(4.34)
Mortality rate finishing pigs (%) *** 2.78
(1.36)
1.63
(1.44)
Veterinary costs per sow (€/sow)130.46
(59.12)
-99.78
(71.28)
Veterinary costs per finished pig ***
(€/finished pig)
-2.13
(1.79)
1.17
(1.17)
Source: Own elaboration. Differences significant at the following levels: *** p < 0.01, ** p < 0.05.
Table 5. Economic resilience indicators across farm types.
Sustainability Theme: ECONOMIC RESILIENCE
SubthemesIndicators:Breeding Farms
(n = 18)
Finishing Farms
(n = 55)
Closed-Cycle
(n = 58)
ProfitabilityGross margin over feed costs per finishing pig (value €) ***
(as % of turnover for pig) ***
-115.8€
58.6
92.3€
48.7
Gross margin over non-factor costs per finisher (value €) ***
(as % of turnover per pig) ***
-32.3€
13.8
63.4€
32.1
Gross margin over feed costs per sow
((value €)
(as % of turnover per sow)

1406.6€
58.5

-

1746.7€
50.1
Gross margin over non-factor costs
per sow (value €)
(as % of turnover per sow)

959.3€
39.1

-

1173.7€
31.7
Production (non-factor) costs per kg of pig meat (deadweight) (value €)
(as % of price per kg) *
-1.49€
84.0
1.56€
89.9
Labor ProductivityProduction Kg of pig meat (deadweight) per annual working unit (kg/AWU) **-347,474.9257,072.4
Number of sows per AWU ***138.4-87.4
Number of finishing pigs per AWU *-3152.62538.4
EntrepreneurshipBargaining power in the chain (0%=weak; 100%=strong)49.342.536.4
Horizontal cooperation between farmers (0%=weak; 100%=strong)33.441.839.7
Risk ManagementDegree of specialization—share of pigs in total farm turnover (%)88.179.484.9
Share of rented land (%)36.731.241.7
Share of family labor (%) ***38.479.081.6
Resilience of ResourcesDegree of modernity—qualitative (%)27.837.338.4
Capital intensity- qualitative (%) ***36.153.653.9
Investment potential—qualitative (%)58.358.064.4
Innovation potential—qualitative (%)63.957.356.9
Source: Own elaboration. Significance levels: *** p < 0.01, ** p < 0.05, * p < 0.1.
Publisher’s Note: MDPI stays neutral with regard to jurisdictional claims in published maps and institutional affiliations.

