Article

Enhancement of Biogas Production from Macroalgae Ulva latuca via Ozonation Pretreatment

1
Marine Pollution Laboratory, National Institute of Oceanography and Fisheries, Alexandria 21556, Egypt
2
Advanced Technology and New Materials Research Institute, City for Scientific Research and Technological Applications, Alexandria 21934, Egypt
3
Department of Agriculture and Environmental Sciences, Bari University, 70121 Bari, Italy
*
Author to whom correspondence should be addressed.
Energies 2021, 14(6), 1703; https://doi.org/10.3390/en14061703
Submission received: 20 February 2021 / Revised: 13 March 2021 / Accepted: 15 March 2021 / Published: 18 March 2021

Abstract

:
One of the dominant species of green algae growing along the Mediterranean coast of Egypt is Ulva lactuca. Pretreatment can have a major effect on biogas production because hydrolysis of the algae cell wall structure is a rate-limiting stage in the anaerobic digestion (AD) process. The use of ozone, a new pretreatment, to boost biogas production from the green algae Ulva lactuca was investigated in this study. Ozonation at various dosages was used in contrast to untreated biomass, and the effect on the performance of subsequent mesophilic AD using two separate inoculums (cow manure and activated sludge) was examined. The findings indicated that, in different studies, ozonation pretreatment showed a substantial increase in biogas yield relative to untreated algae. With an ozone dose of 249 mg O3 g–1 VS algal for Ulva lactuca, the highest biogas output (498.75 mL/g VS) was achieved using cow manure inoculum. The evaluation of FTIR, TGA, SEM, and XRD revealed the impact of O3 on the structure of the algal cell wall and integrity breakage, which was thus established as the main contributor to improving the biogas production.

Graphical Abstract

1. Introduction

To recycle organic waste into biogas, anaerobic digestion (AD) is a widespread technology. Compared with other biomass pretreatment methods such as mechanical, sonication and chemical, the cost of AD is relatively low [1,2]. In AD [3,4], energy crops, agricultural runoff, manure, sewage sludge, waste oils, animal fat, food scraps, wastewater, and a number of high organic industrial effluents can also be used. Biogas has now evolved into the third generation after decades of development. Biofuels of the first generation were produced from food, such as grain, maize, or soybeans, resulting in food-energy competition problems and high demand for land [5]. The second generation of biofuels were made from rich lignocellulosic feedstocks, which required complicated pretreatment and expensive catalysts; such processes are expensive and offer little market advantage over fossil fuels [6]. Marine biomass has relatively high yields compared to lignocellulosic feedstocks [7] and removes algae from the body of water, or eutrophication of lakes, rivers, and oceans can be minimized by the beach [8]. Ulva lactuca belongs to the family of green algae and, on the rocky shores of Alexandria in the Mediterranean Sea, is one of the dominant species.
The decomposition of the complex algae cell wall structure is a rate-limiting step that has a major impact on the AD bioconversion process [9]. Anaerobic co-digestion of varied feedstocks increases the biogas revenues because of its superior stability of nutrients in the digestion media. An appropriate select for increasing biogas revenues from the AD of municipal solid wastes is the co-digestion with lignocellulosic ingredients. Anaerobic co-digestion is believed to be the rapid digestion of more than one substrate and co-substrate mixes. Generally, AD procedures are intended for a particular substrate. Conversely, using a several of substrates creates the procedure more constant [10]. As a result, effective and sufficient pretreatment is critical for increasing biogas production [11]. After pretreatment, the substance may be strongly fermented [12]. Pretreatment methods include sonication [13], acid [14], thermal [15], thermochemical [16], beating [17], milling, grinding, and extrusion [18], biological, and ozone [19]. However, the evaluation of unique, powerful oxidative pretreatments, in particular those applying ozone, has not received much attention so far. Ozonation is a method that has already been successfully used (i) to encourage excess solubilization of activated sludge and consecutive anaerobic digestion [20], (ii) to improve the efficiency of enzymatic digestion [20], and to produce biohydrogen from lignocellulosic organic matter [21]. The emission of biogas from sewage sludge in psychrophilic conditions has been reported [22]. The study found that the amount of biogas produced in psychrophilic conditions could be equal to, if not greater than, that produced in mesophilic conditions under the same conditions [22]. The energy demand in each process scheme was contrasted between a modified anaerobic digestion process with partial ozonation of digested sludge to increase biological degradability and a traditional anaerobic digestion process. One choice for making good use of biogas was to use it for power generation, and another was to use it for recovery instead of natural gas. Since the extra energy output from this scheme was supposed to meet all of the energy demand for the plant activity, the partial ozonation process with power production resulted in minimal greenhouse gas emissions, according to the report. Furthermore, the final amount of dewatered sludge cake generated was only 40% of what was predicted from the conventional process, reducing the potential for greenhouse gas emissions in subsequent sludge incineration processes significantly [23,24,25,26].
Different authors showed that, regardless of the form of pretreatment, biogas capacity of micro and macroalgae can be significantly different from species to species due to variations in structure and composition of cell walls [3,7,8,9,11,16,18]. In addition, a recent exciting study by Nguyen et al. [23] stated that ozone pre-oxidation of microalgae can induce cell lysis and, consequently, intracellular organic matter release. Green-blue ozone has also been shown to degrade efficiently.
A high biomass yield and high photosynthetic ability are demonstrated in the green Macroalgae Ulva lactuca as contrasted with terrestrial plants. Furthermore, the AD of wet biomass in methane seems promised and more highways [3] Ulva lactuca’s economic and environmental viability in the development of bioenergy will benefit from the use of Ulva lactuca bioremediation capability during production and the extraction of high-value biomass products before energy generation [3]. In order to increase the digestiveness of the biomass in methane, three micro algae cultures have been pretreated with ozonation at various doses [18]. As a result, O3 has increased the biogas capacity of all three algal cultures tested in contrast with the untreated biomass experiments [18].
From the previous findings of different biotechnology fields, it is safe to assume that the promise of ozone can also be used in the anaerobic digestion process to enhance the fermentability of the macroalgic biomass. The mathematical kinetic model used for the AD process is critical in optimizing, forecasting, simulating, and monitoring process performance under various conditions [27,28]. To reflect and replicate the experimental results, two kinetic models were reported: the modified Gompertz and the logistic function models. Statistical study of correlation coefficients (R2) contrasted the accuracy of these models. It is anticipated that the findings will provide theoretical guidance for studying the impact of nanoparticles and modeling the anaerobic fermentation process research. A techno-economic evaluation of the ozonation treatment for the production of biogas from the AD of Ulva lactuca must be carried out in order to understand the conditions for wider penetration of such a technique. In the experiments, the effects of different ozonation dosages on the production of macroalgal-based biogas were investigated. The results were also in contrast to those obtained with non-treated macroalgae. According to the best of our knowledge, this is the first study to describe the effect of combining mechanical and ozonation treatment for the production of biogas from Ulva lactuca. However, as far as we are aware, this research has not yet been investigated, so it has been focused on filling the existing gap.

2. Materials and Methods

2.1. Collection of Green Algae Ulva lactuca

From the Mediterranean coast, Alexandria, Egypt, Fresh Marine Green Algae Ulva lactuca was hand collected. The biomass collected was washed a number of times with seawater, tap water, and then with distilled water. The clean algae underwent sun-drying for several days, followed by oven-drying for 24 h at 50 °C. To obtain a fine and homogeneous powder, the dried samples were milled to a size of about 0.5 mm using (Fritsch, Pulverisette 2, and Filtra vibracion S.L.) for 5 min. For further research, the milled seaweed samples were placed in plastic bags at room temperature.

2.2. Chemical Analysis of Algae Powder

According to literature [29,30], dry matter has been calculated. By ashing the ground dried samples overnight in a muffle furnace at 550 °C, the ash content was measured. The elemental analyzer was used to calculate C, H, and N (Model CHN 628).

2.3. Ozonation Pretreatment of Ulva lactuca

Using a 0.2 L cylindrical glass containing 150 mL of Ulva lactuca algal suspension as the working volume, ozonation pretreatments were carried out at a flow rate of 8.3 mg O3 min–1, ozone was guided into the column via a porous glass sparger. Using an ozone generator, O3 was produced (N 1668 A power: 18 W, Vol AC 220 V/50 HZ). All ozonation experiments were performed at pH 8, since when the pH is greater than 7.0, the ozone decomposition rate increases dramatically at room temperature (23 ± 2 °C) due to hydroxyl radical formation and three curing times (t) (10, 15, and 30 min) were checked. Once pretreatment with ozonation was completed, a sufficient quantity of Ulva lactuca was consequently subjected to anaerobic digestion under the conditions set out in the biogas test section.

2.4. Inoculum and Substrates Preparation

2.4.1. Source of Manure

Cow manure was collected from a slaughterhouse in Alexandria city, Egypt. The manure was collected from the cage, stored inside a black plastic trash bag and stored in a plastic box container and was used the day after collection. The cow manure was diluted with water 1:1 (w/v).

2.4.2. Source of Activated Sludge

The sludge sample was taken from a mesophilic anaerobic digester at a waste pump station in East Alexandria. Triplicate 1L samples were obtained from the mid-section of the digester simultaneously and combined thoroughly. At 35 °C, the samples were incubated and used as an inoculum within 72 h. Samples of digester sludge (50 mL) were centrifuged at 1500 rpm for 2 min before being resuspended in 100 mL of an anaerobic 0.2 M phosphate buffer (pH 7.2) after being purified with ultra-high purity (99.999%) N2 gas [31].

2.5. Biogas Tests

Laboratory tests were conducted on reactors in similar digesters of cylindrical syringes [32,33,34]. The syringes are reversed directly onto the reactor lid [35,36]. A plastic syringe was used to sample the fuel that was equipped with a three-way valve and re-injected into the waste. In all tests, 100 mL glass syringes were applied. As feedstock, 1.5 g of milled Ulva lactuca (dried weight) was used. In each of the syringes, 20 g (wet weight) of each manure or activated sludge was applied to the untreated and treated Ulva lactuca. For 10 min, the working volume was flushed with N2. For each anaerobic degradation set-up, three replicates were performed. Until no apparent methane was produced, the inoculum was pre-incubated for 3 days. At 37 °C with continuous shaking at 150 rpm, the digesters were incubated. Table 1 offers an overview of the substrates used in batch experiments to estimate the Ulva lactuca biogas yield.

2.6. Characterization and Measurement

Ulva lactuca samples were analyzed by the following instrument before and after ozone pretreatment: Fourier transform infrared (FT-IR) spectroscopy V-100 VERTEX70 connected with platinum ATR (model-100) using wave number between 400 and 4000 cm−1. The surface structure was examined by the scan electron microscope FEI QUANTA 250 (SEM). Thermogravimetric (TGA) analysis of the Ulva lactuca sample was performed by TERIOS SDT650 instrument. Using a Bruker 2D Phaser, X-ray diffractograms (XRD) run at 30 kV, 10 mA with a Cu tube (λ = 1.54060 Å) ranging from 0 to 100°.

2.7. Kinetics Study and Statistical Analysis

Numerous researchers have used the nonlinear regression models, the modified Gompertz and logistic function models Equations (1) and (2) were applied to determine the cumulative biogas production [37,38,39,40]. Both models are mostly used to determine the lag phase, biomethane potential, and the max biogas production rate. The biogas production data and the kinetic parameters were defined under Equations (1) and (2) [37,38,39,40], which are widely recognized.
M = Pb × exp {−exp [(Rm.e)/Pb (λ − t) + 1]}
M = Pb/((1 + exp {4.Rm.(λ − t))/pb + 2)
where M is the biogas yield (L/g VS added) over time t (days), Pb is the maximum biogas capacity of the sub-strate (L/g VS added), t is the duration (day), Rm is the maximum biogas rate, and e is 2.7183. The coefficient of determination (R2) and root mean square error (RMSE) for both models were calculated in order to compare the accuracy of the studied models determined using SPSS 20, Origin 2020 b, and Excel 2010 methods. The standard deviation is interpreted as the RMSE, with a lower RMSE implying a better match between predicted and measured values [40].
RMSE = √(∑_(i = 1)n ((PVi − MVi)2)/n)
PVi is the estimated biogas volume value, MVi is the measured biogas volume value, and n is the number of measurements.

3. Results and Discussion

3.1. Characterization for Ulva lactuca

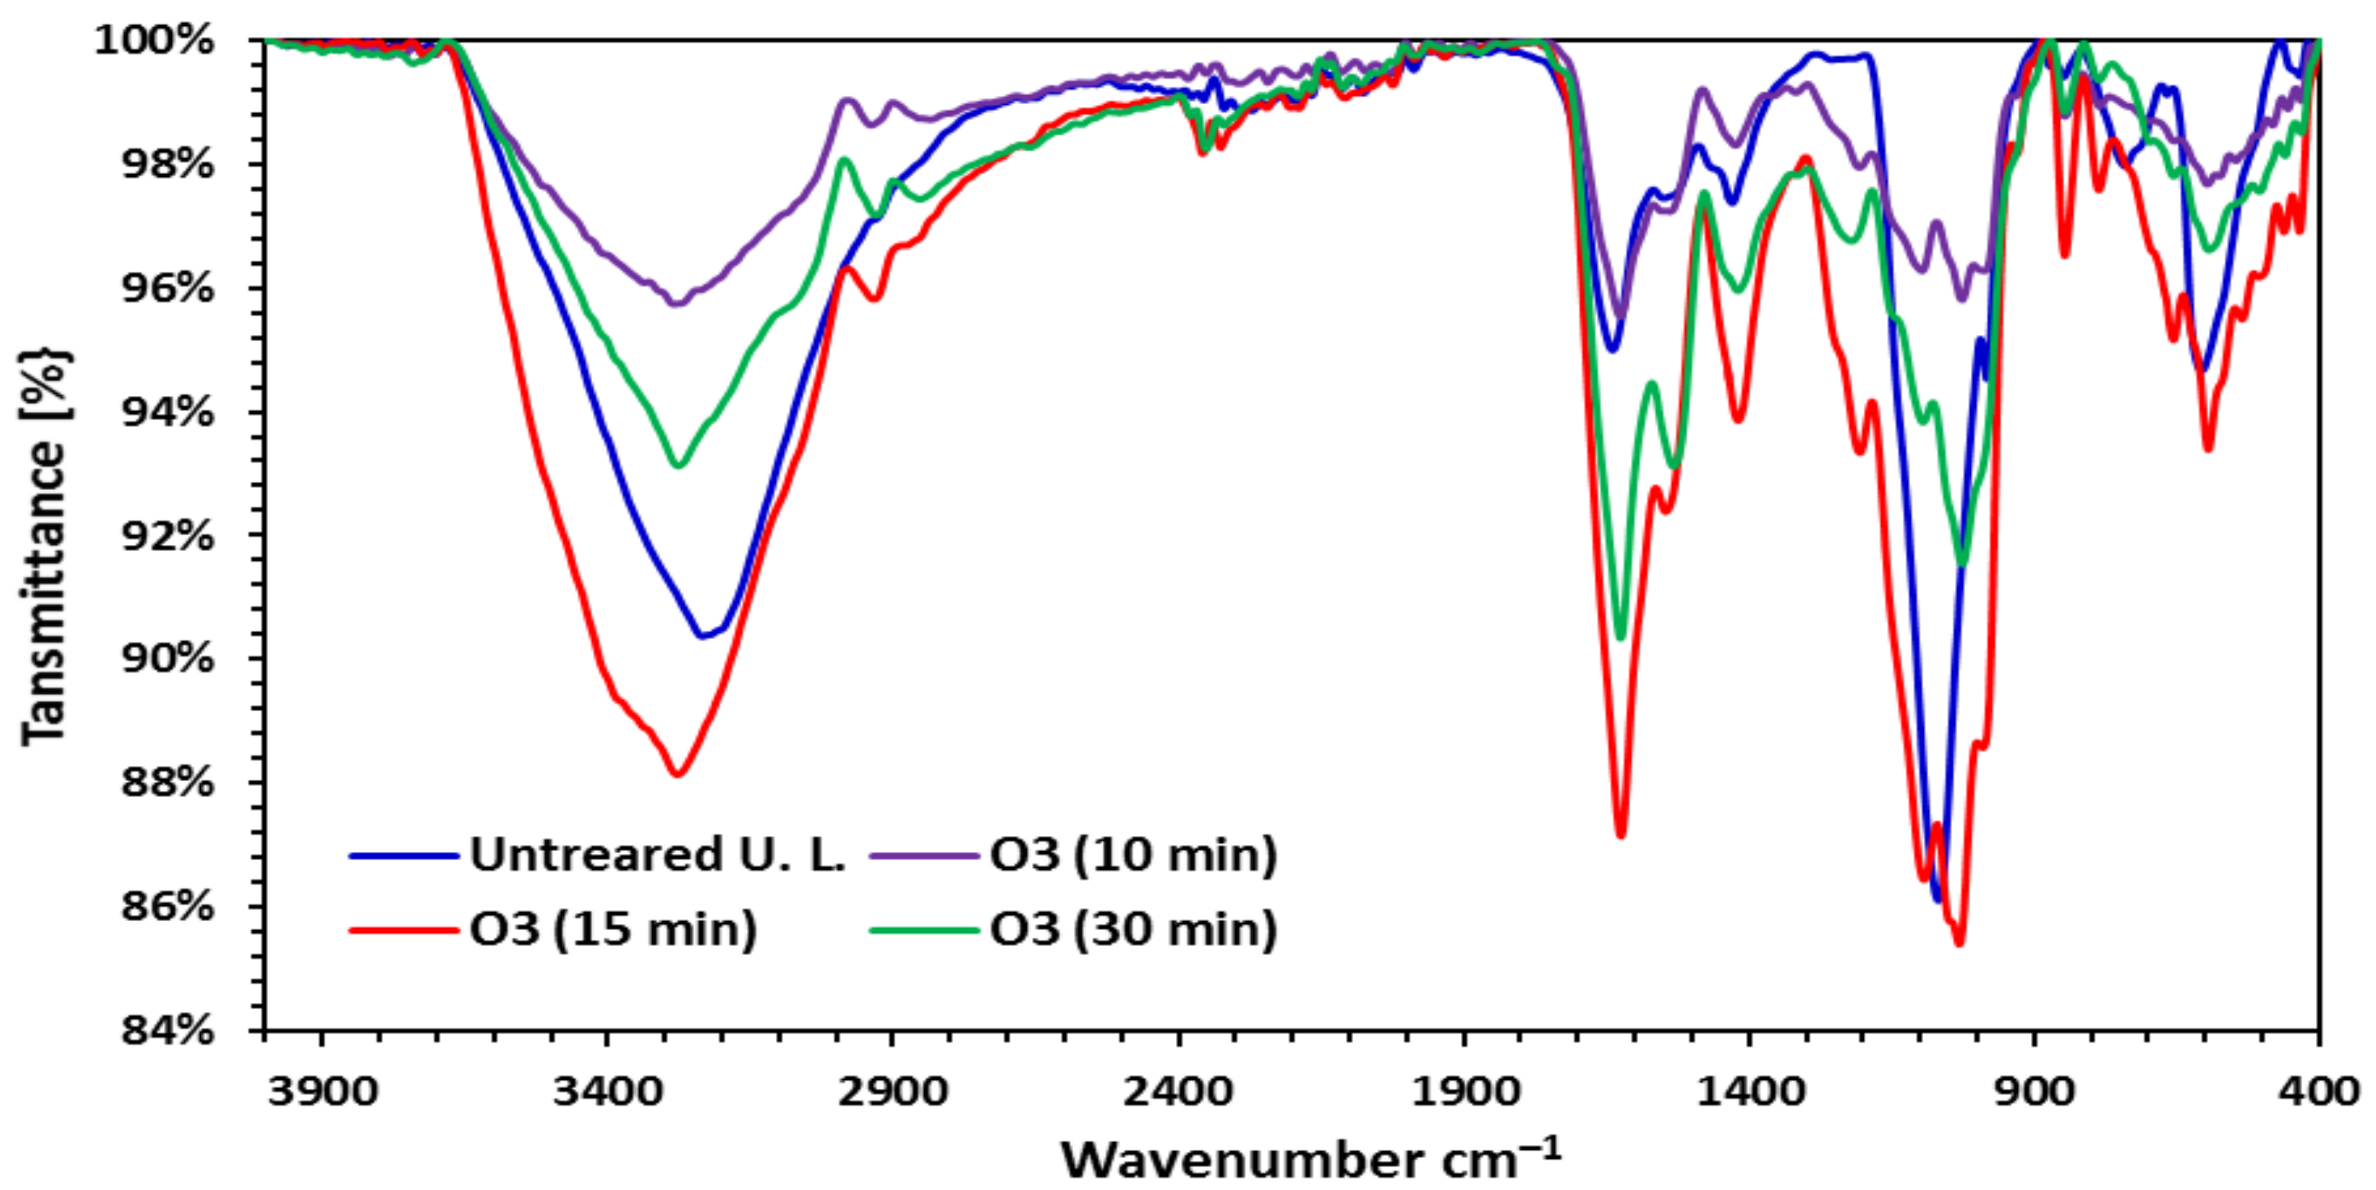
3.1.1. Fourier Transform Infrared Spectra (FTIR)

The FTIR displays alternating raw and ozonated Ulva lactuca pretreated spectra, (Figure 1). Compared to raw Ulva lactuca in the peaks at 1035–1627 cm–1 and the wide band at 3288 cm–1, the decrease in the strength range of pretreated algae indicates that the pretreated Ulva lactuca chemical structure deforms as a result of the treatment of lignocellulose by ozonation degradation [41,42,43]. The peak at 1627 cm–1 is due to O-H stretching vibration of H-O-H from the literature, while the broader band at 3288 cm–1 was assigned for the phenolic compounds O-H stretching vibration [44]. The stretching vibrations present at 1419 and 1035 cm−1 were identified as C-OH band of carboxylic acid and ester bond in tannin, respectively [44].

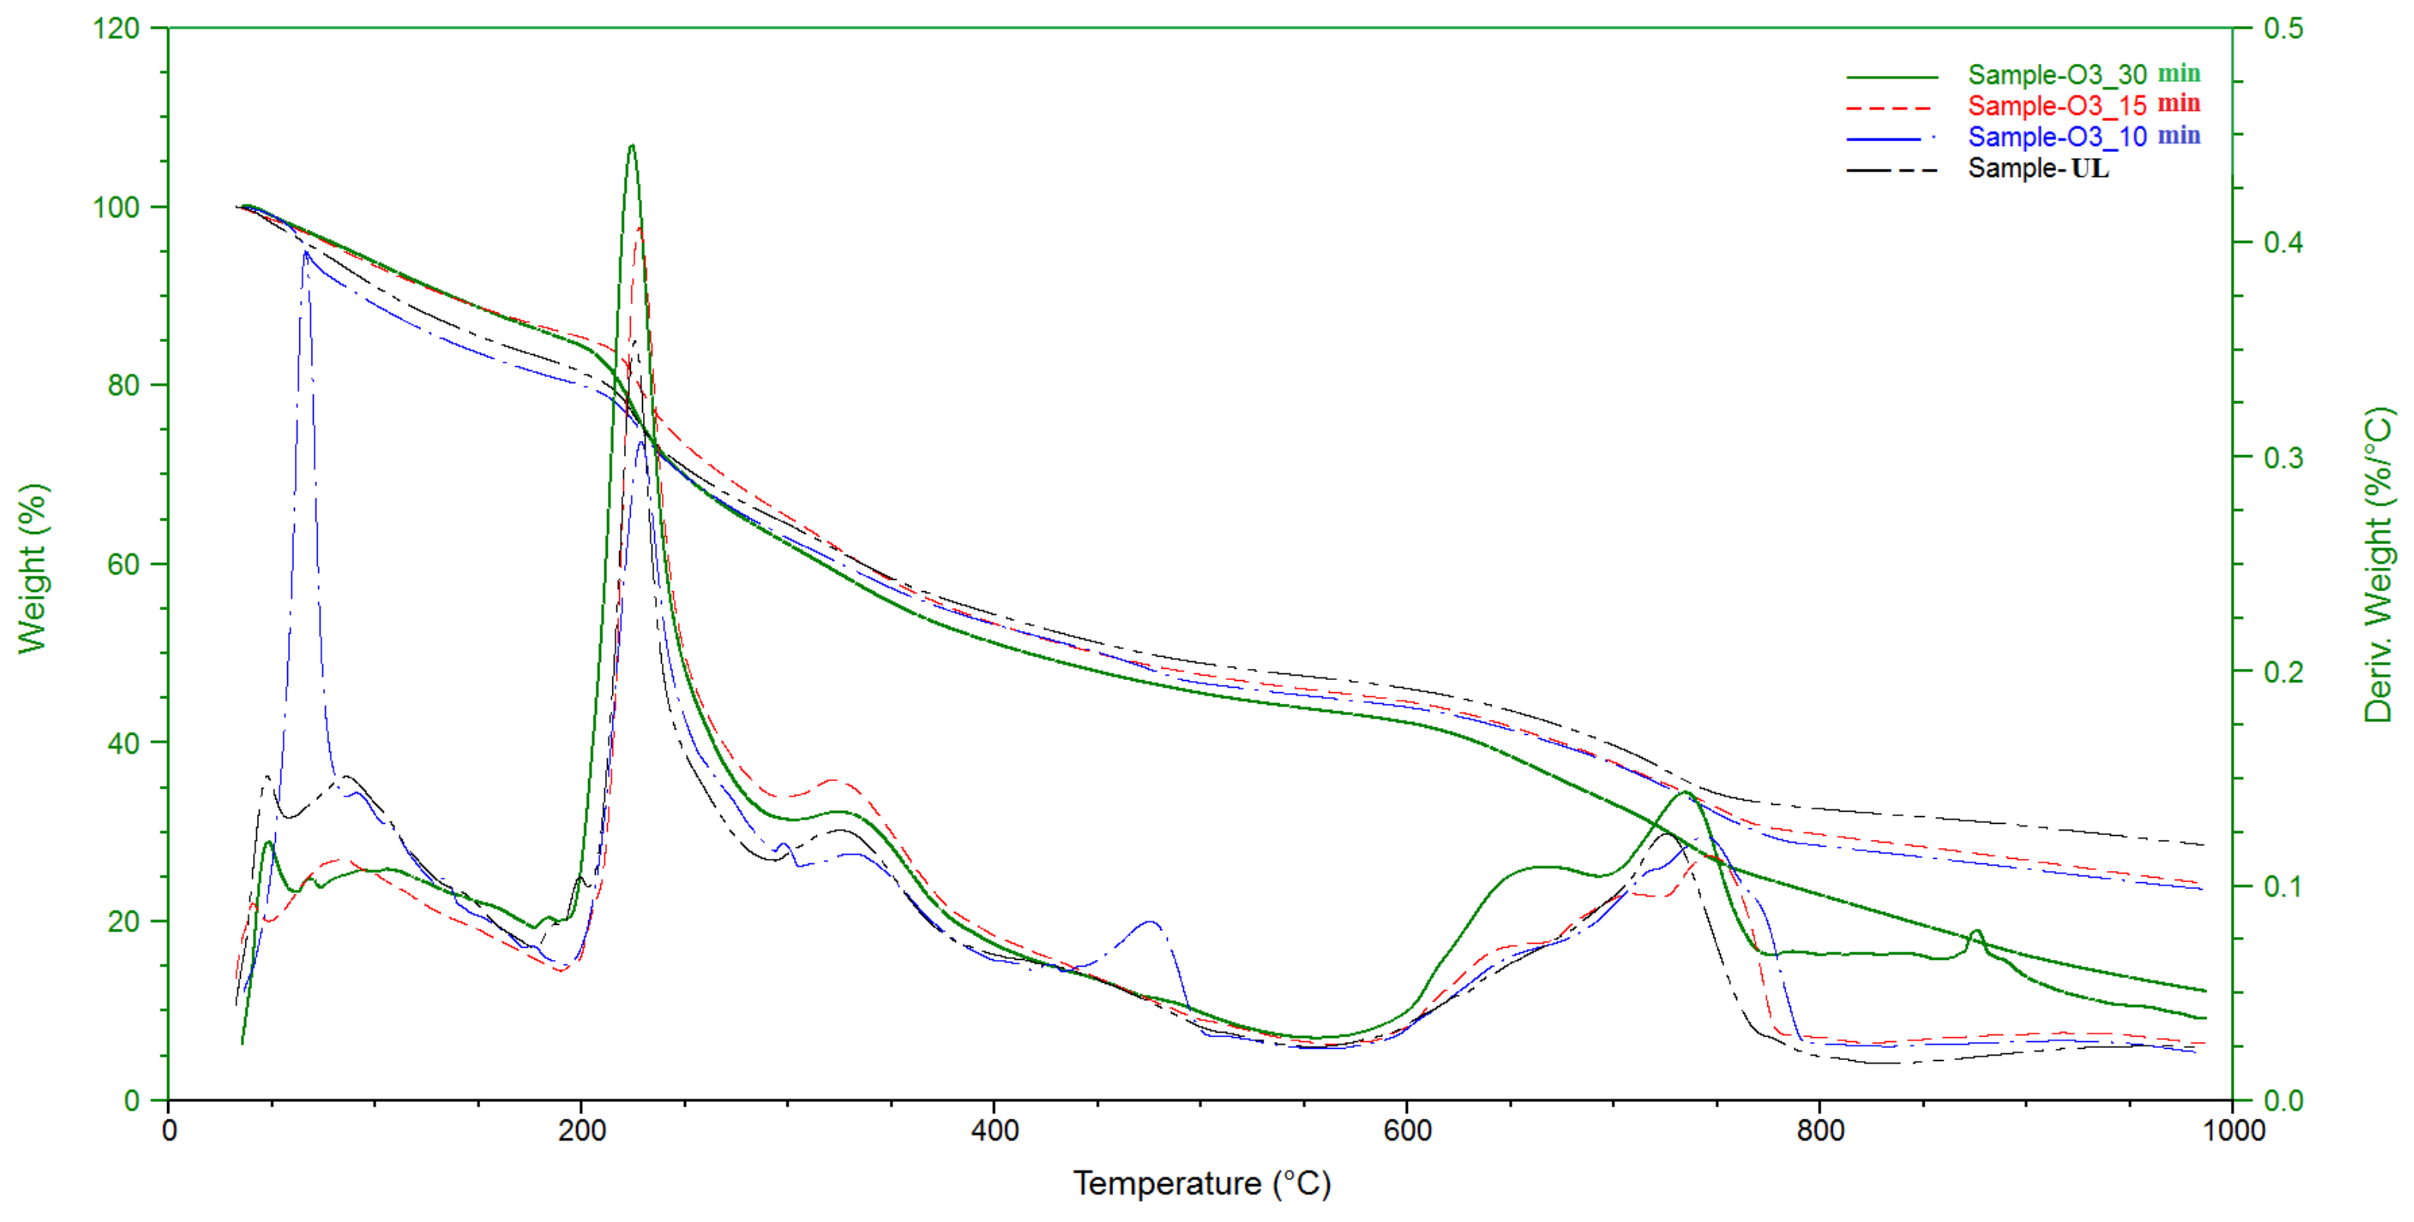
3.1.2. Thermal Analysis (TGA)

Biomass thermal stability is analyzed using TGA, a commonly adopted technique for assessing biomass thermal degradation [45,46]. The TG graphs (Figure 2) display along with the method, the relationship between the temperature and the weight percentage of the sample. The thermal decomposition can be easily distinguished from the TGA graph (Figure 2), however, and the individual phases of mass change can also be clearly defined. The experiment was performed up to 1000 °C with 10 °C per minute under 100 mL/min N2 gas flow for this study. The graphs were, however, only plotted up to 1000 °C, but after this point, the weight of the samples was constant. The thermal degradation of three algae samples occurred in a three-step reaction, based on the findings. At the first stage, one represents the evaporation of moisture desorption extractives or some light volatile issues at 100–200 °C [47,48,49], while the other two phases at 300–350 and 300–500 °C reflect the cellulose and lignin degradation, respectively (Figure 2). In the second and third phases, there was a significant weight loss due to the main degradation mechanism. This loss causes the decomposition and/or depolymerization of algae’s organic components, such as carbohydrates, protein, and lipids. Carbohydrate decomposition occurs between 180 and 270 °C due to algae mass loss, while protein degradation occurs between 320 and 450 °C [50].

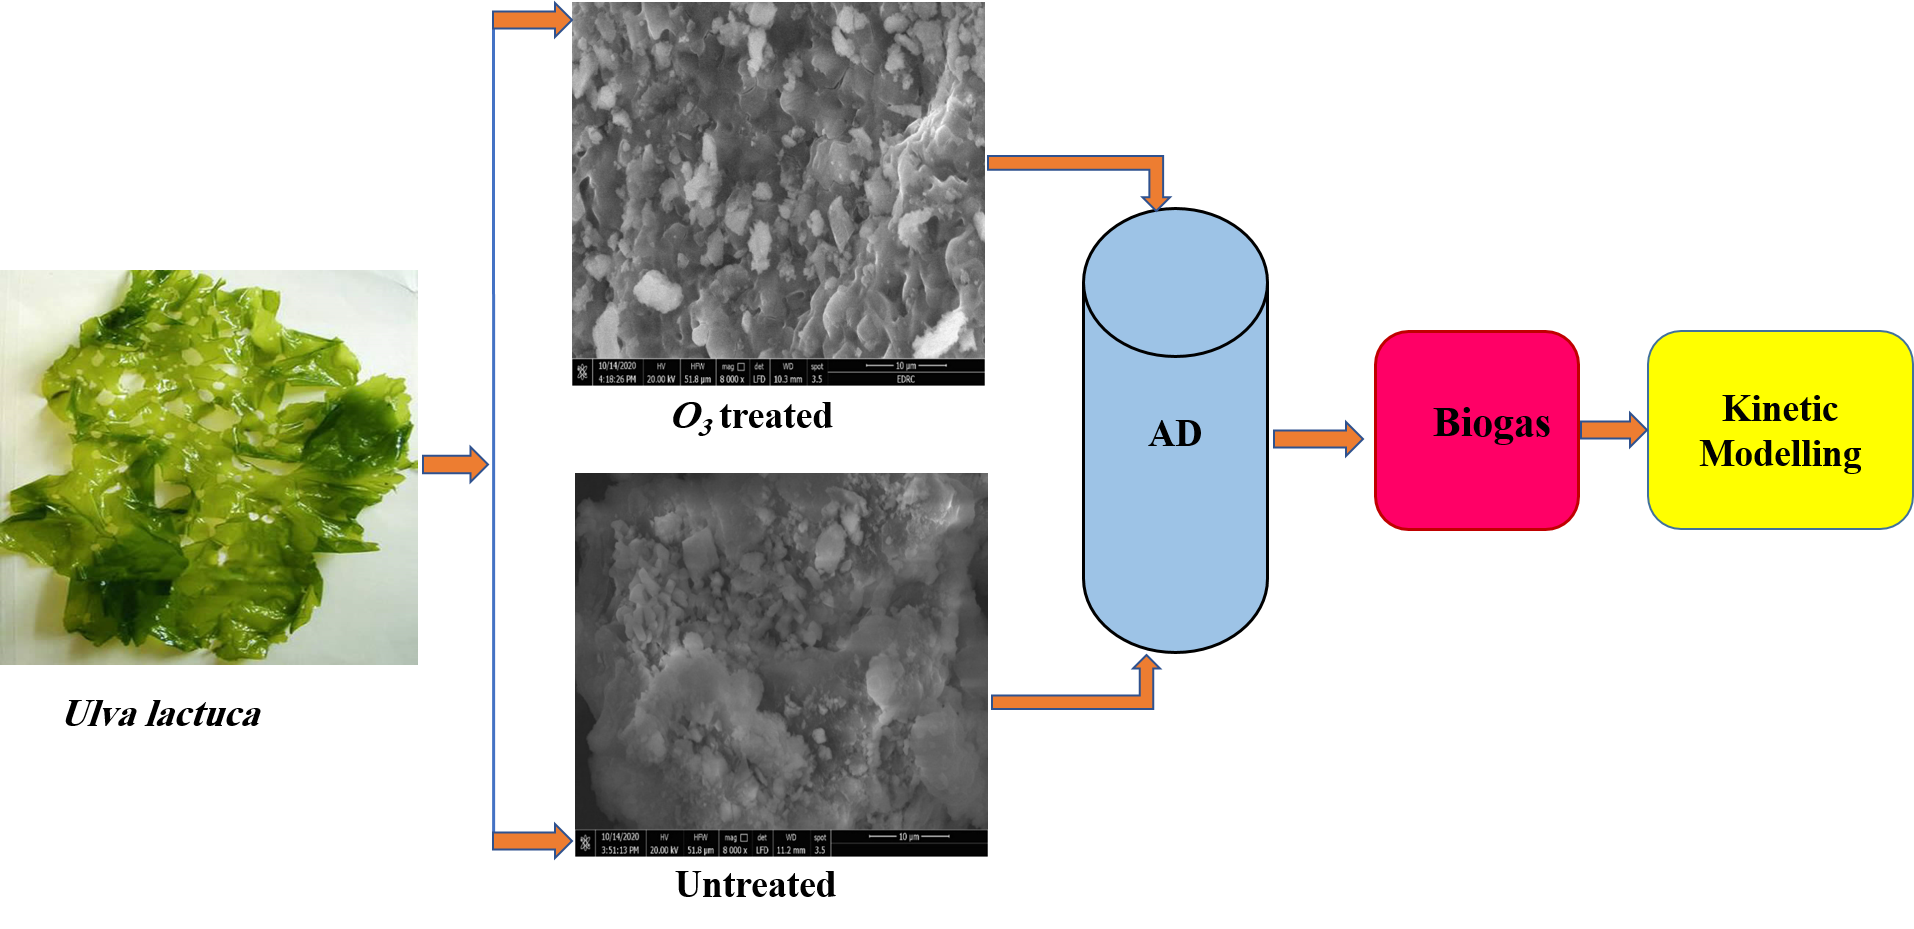
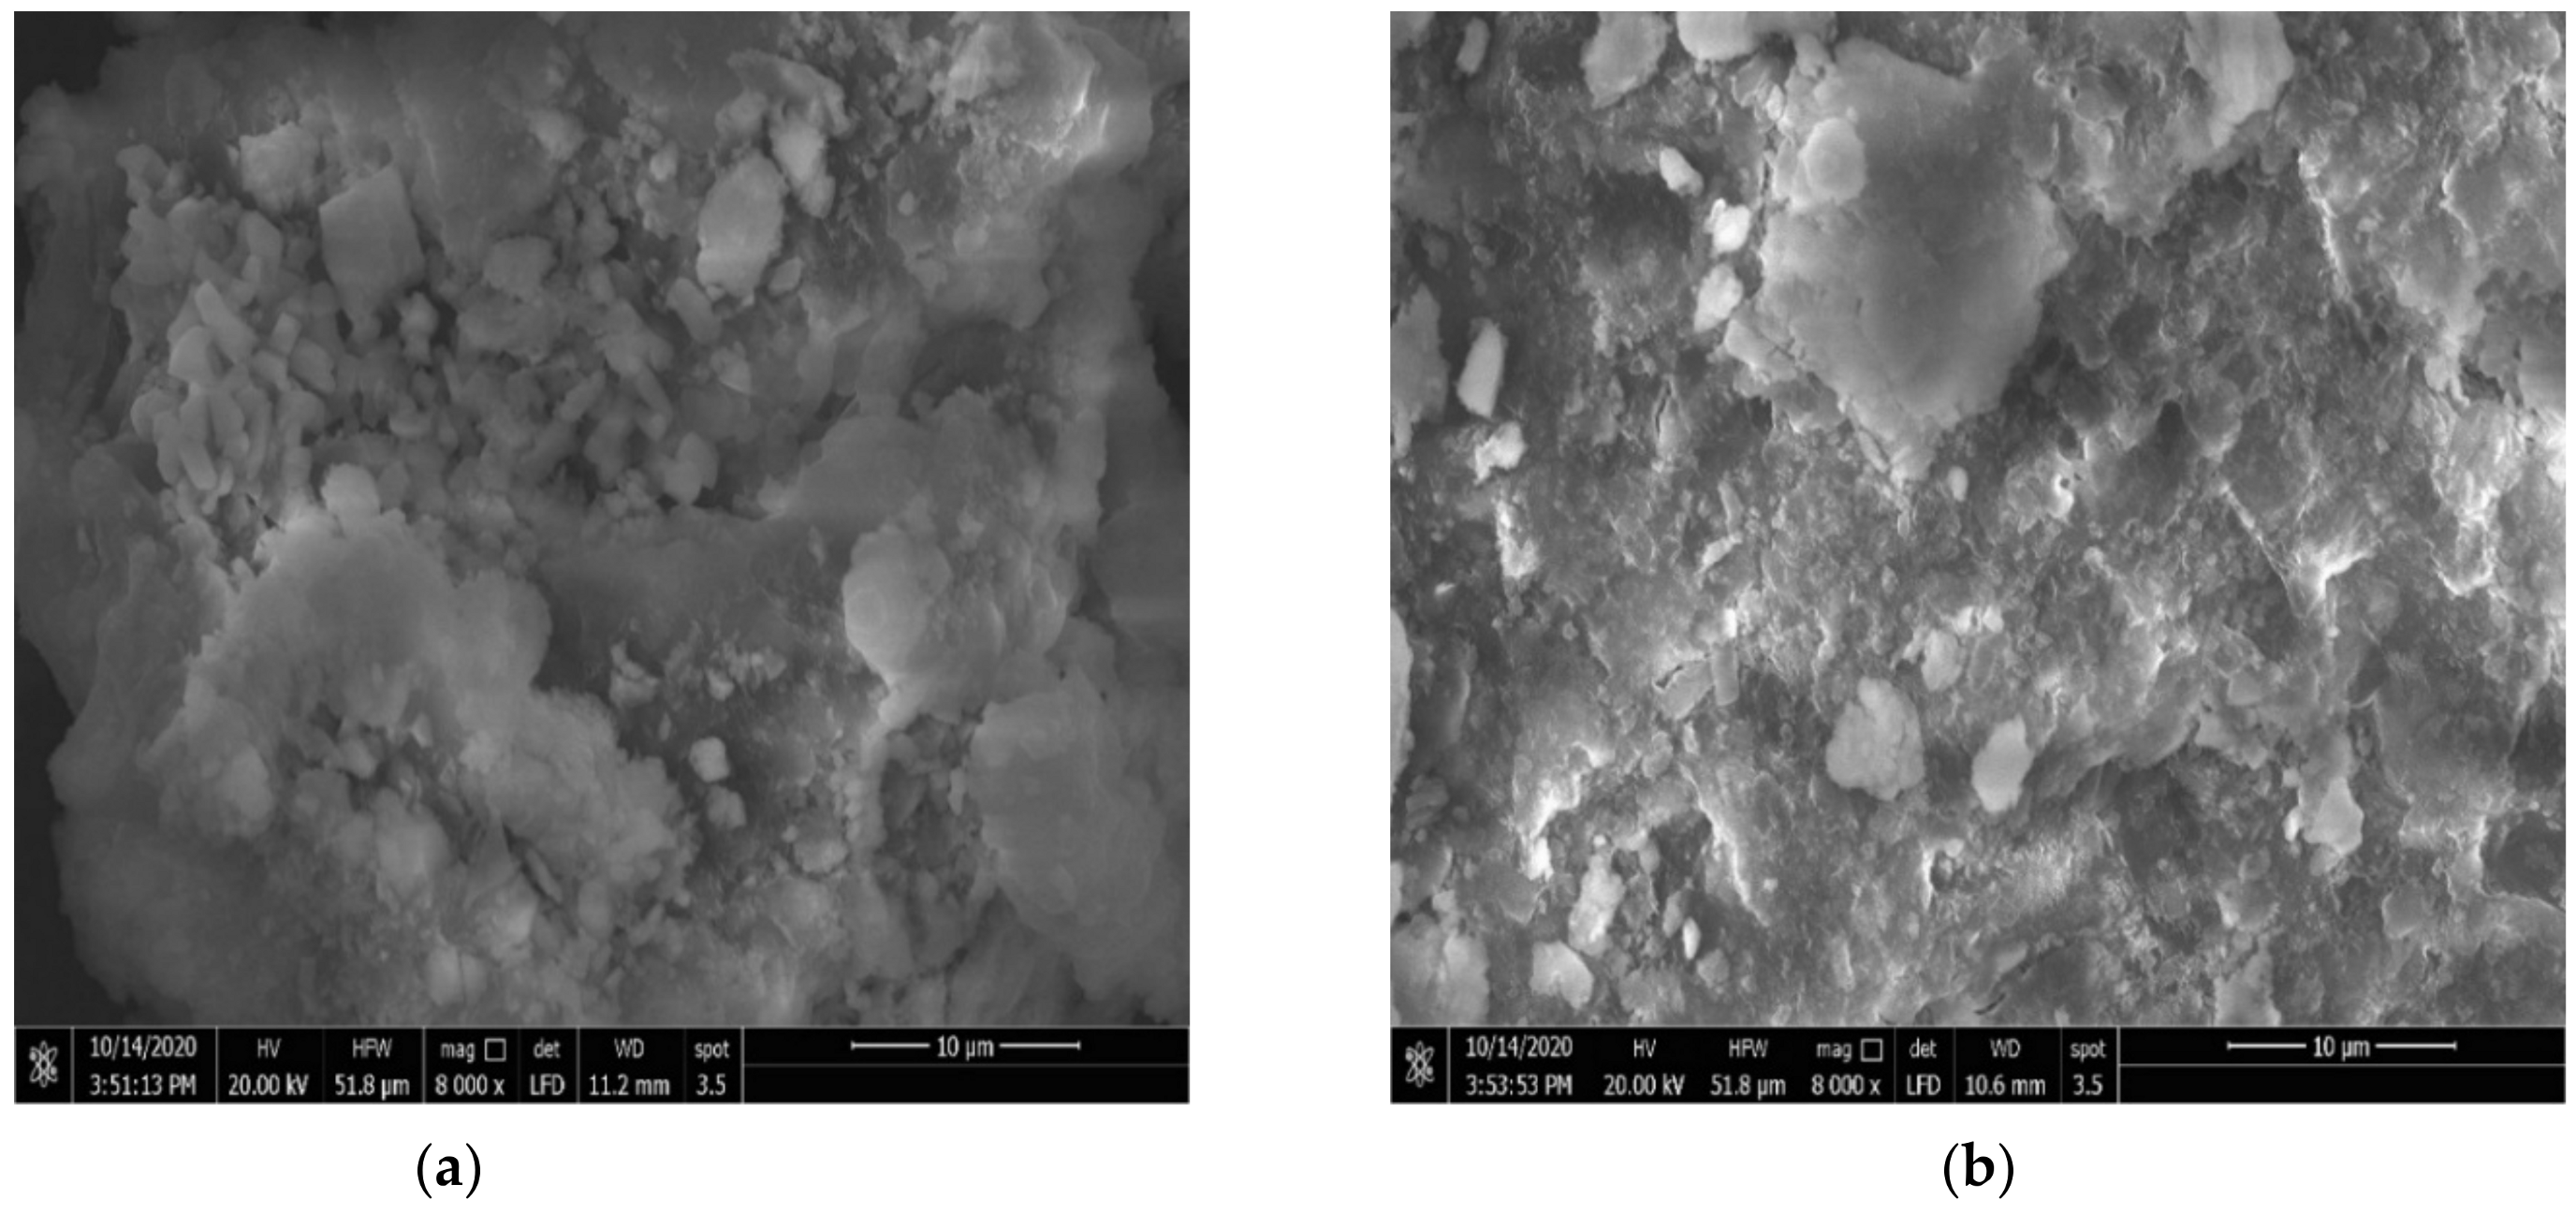
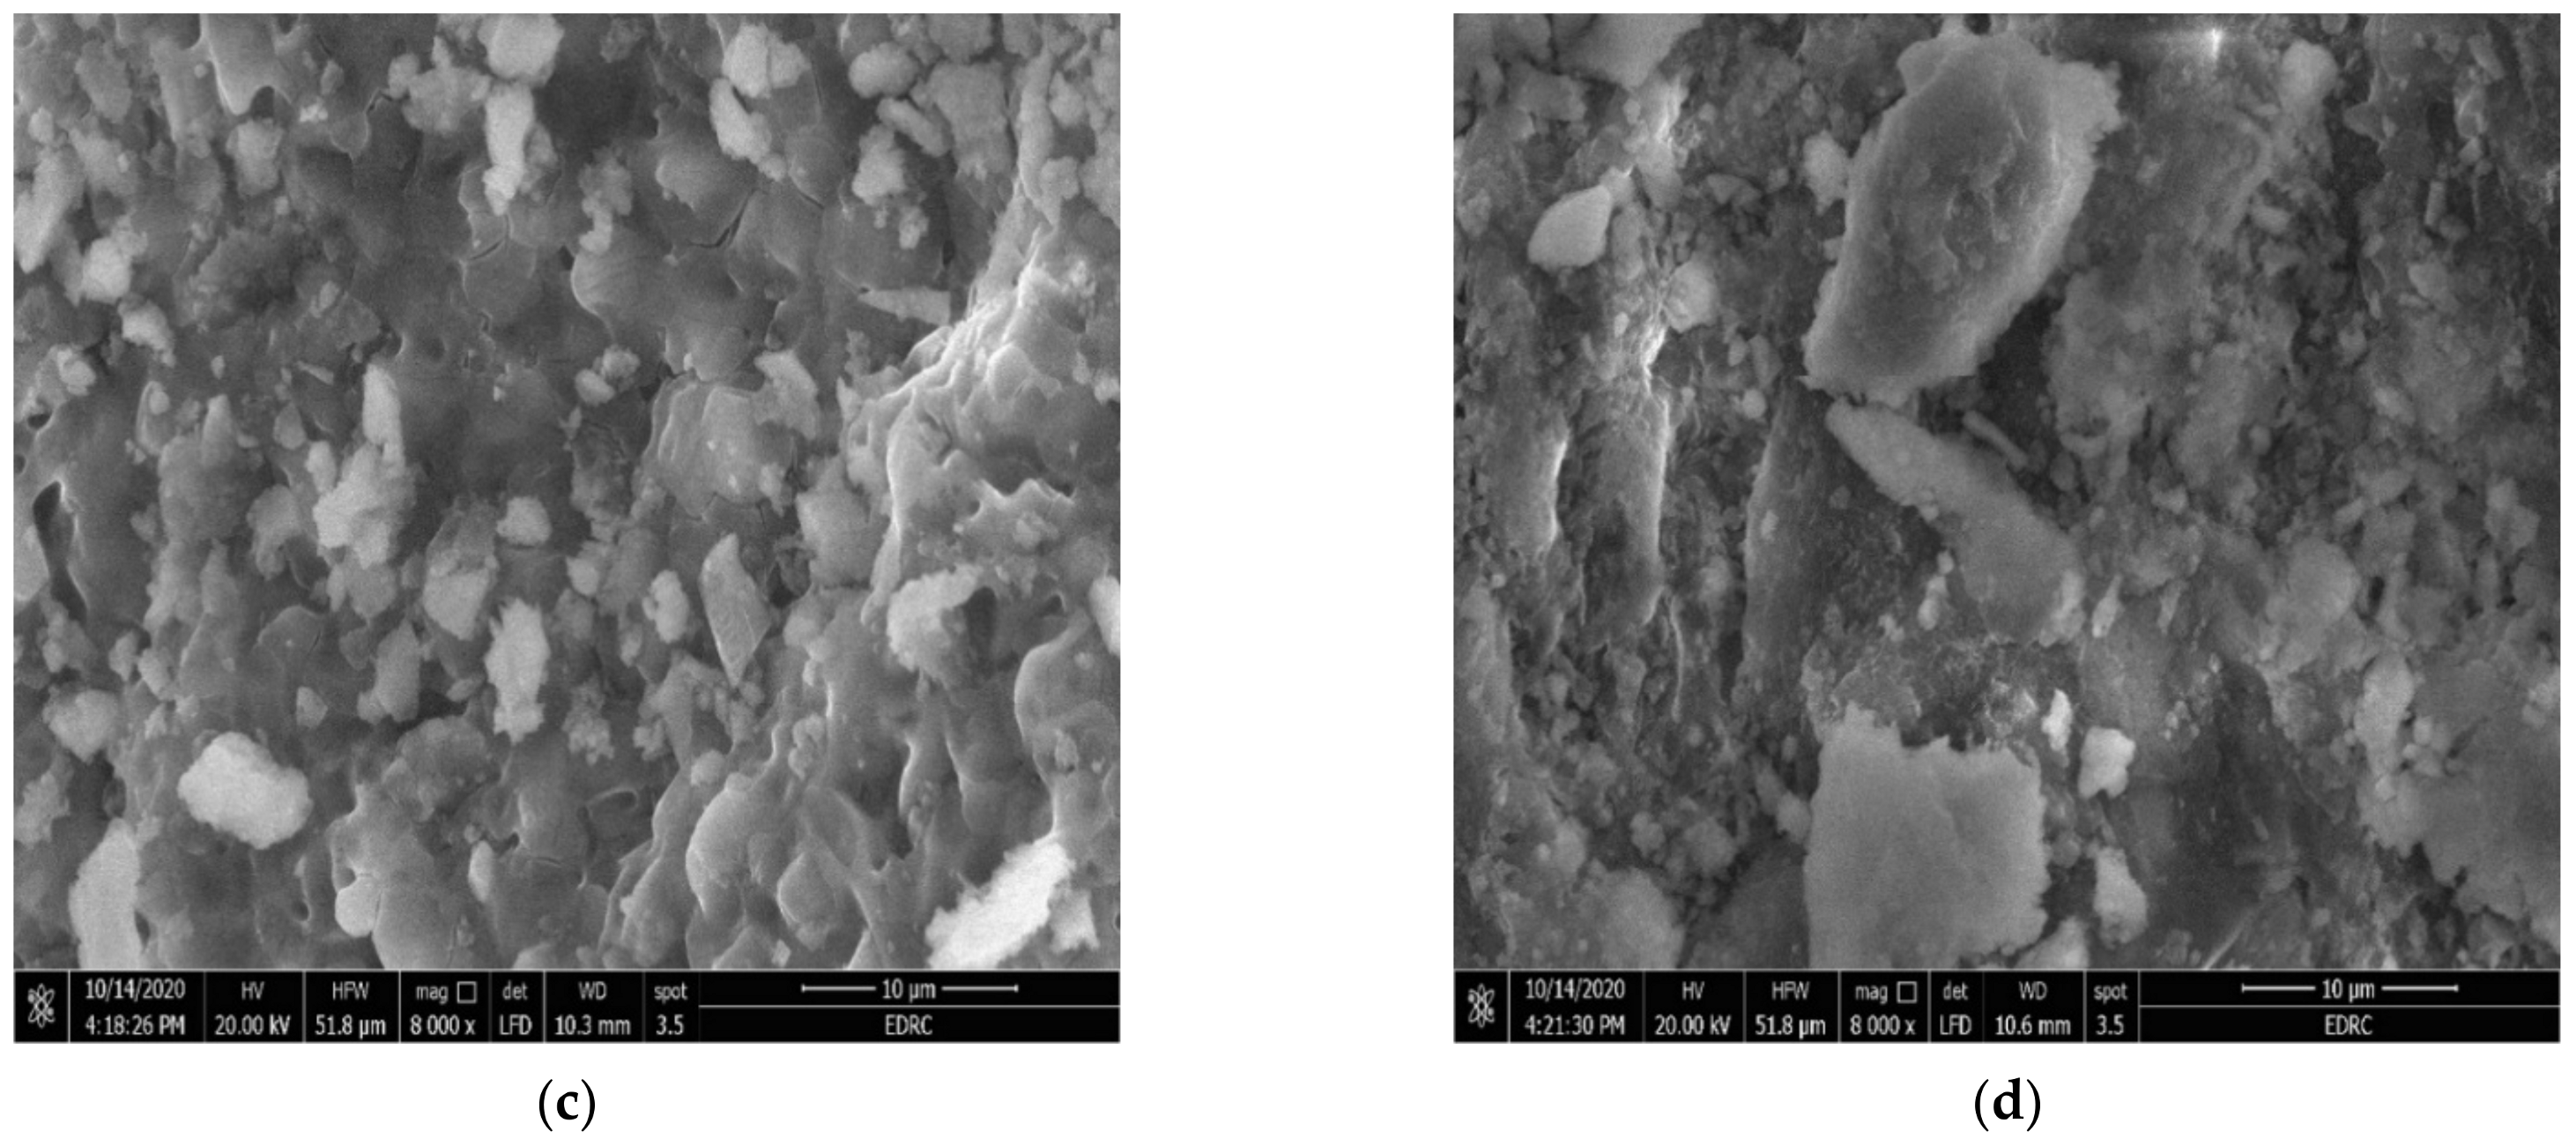
3.1.3. Scanning Electron Microscopy (SEM)

Untreated Ulva lactuca and ozonated Ulva lactuca to better understand the effect of O3 pretreatment on the AD of the green macroalgae Ulva lactuca, samples of Ulva lactuca (8.3 mg O3 min–1 VS) were analysed using electron microscopy. Figure 3a–d display identical-scale macroalgae images before and after pretreatment, respectively. In general, the cell wall in Figure 3a is well-defined and does not display any fragmentation. However, in the latter case (Figure 3c,d), the clearly changed structure of the cell wall appears to be fragmented and it is possible to distinguish broken cell walls. This suggests, therefore, that O3 was capable of harming the algae and greatly disrupting its integrity [18]. Figure 3c,d, in other words, are clear visual evidence of effective ozone pretreatment.

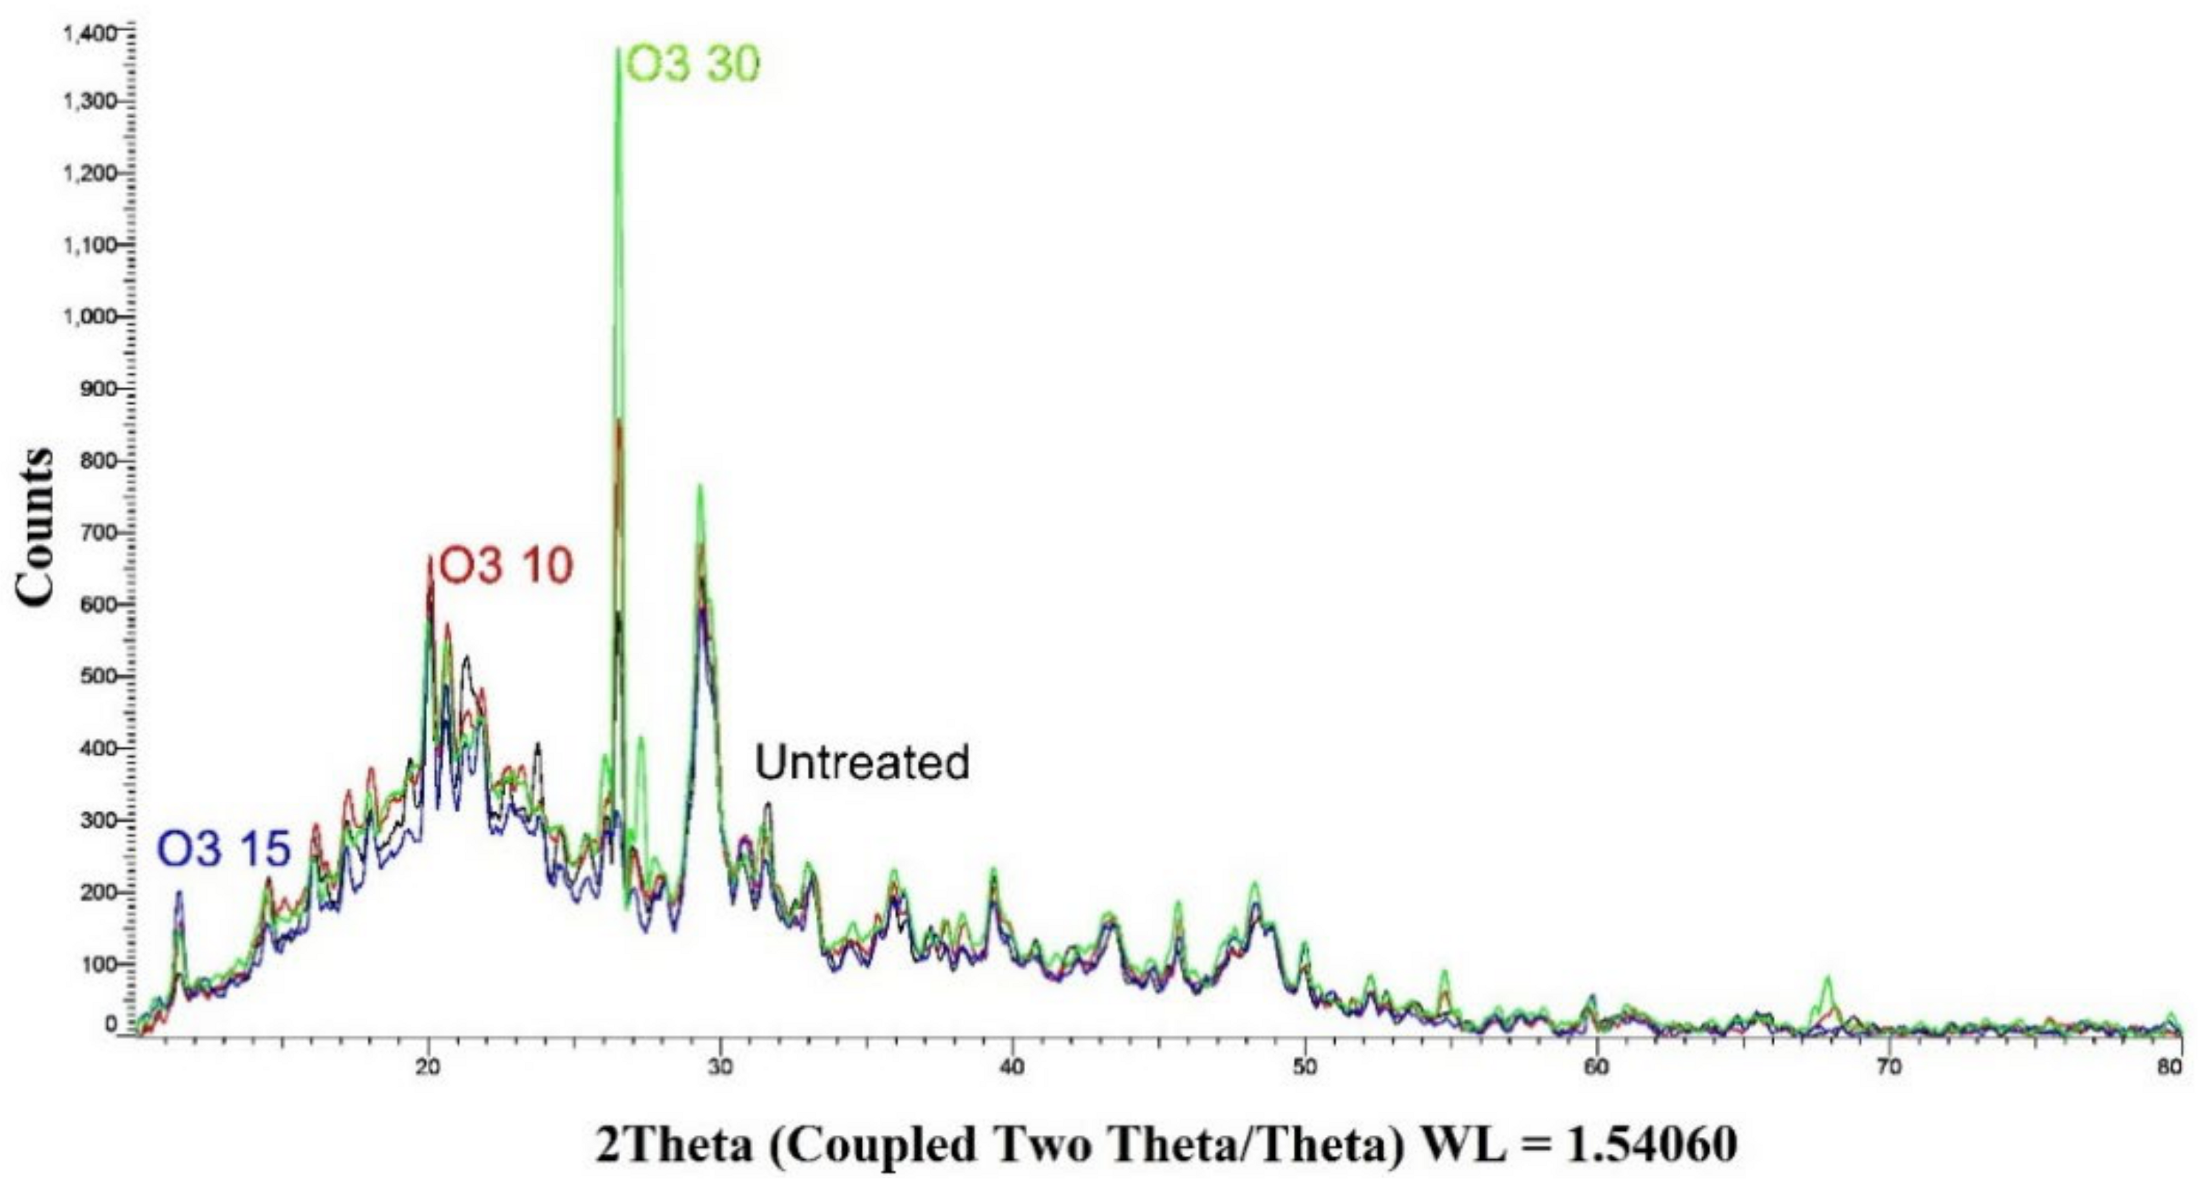
3.1.4. X-ray Diffraction (XRD)

The degree of crystallinity of raw and pretreated Ulva lactuca was determined using X-ray diffraction analysis (Figure 4). The crystallography showed that after ozonation pretreatment, the peak strength of the raw Ulva lactuca sample became sharper at 2, 20, 26, 27, and 30, Figure 4. These peaks tend to conform to crystalline cellulose after pretreatment. This may be proof that the pretreated Ulva lactuca crystallinity increased when pretreated with ozone [34].

3.2. Chemical Compositions of Ulva lactuca

As shown in Table 2, the VS content of the investigated Ulva lactuca is about 71%. On the other hand, by means of an elemental analyzer, the determination of the C and N material is detected and the measurement procedure is followed [51]. Table 2 shows a C/N ratio of about 9.42%. In most literature, a working C/N ratio of 20 to 30, with an optimal ratio of 25, is recommended for anaerobic bacterial growth in the AD system [52]. Inappropriate C/N ratios in substrate AD can result in high total ammonia nitrogen and/or VFA accumulation in the digester [53]. However, reported literature [54,55,56] indicated that the optimum C/N ratio is 16–19% for better methanogenic efficiency when considering hardly degradable complexes such as lignin [52], which is near the same ration for the studied biomass Ulva lactuca.

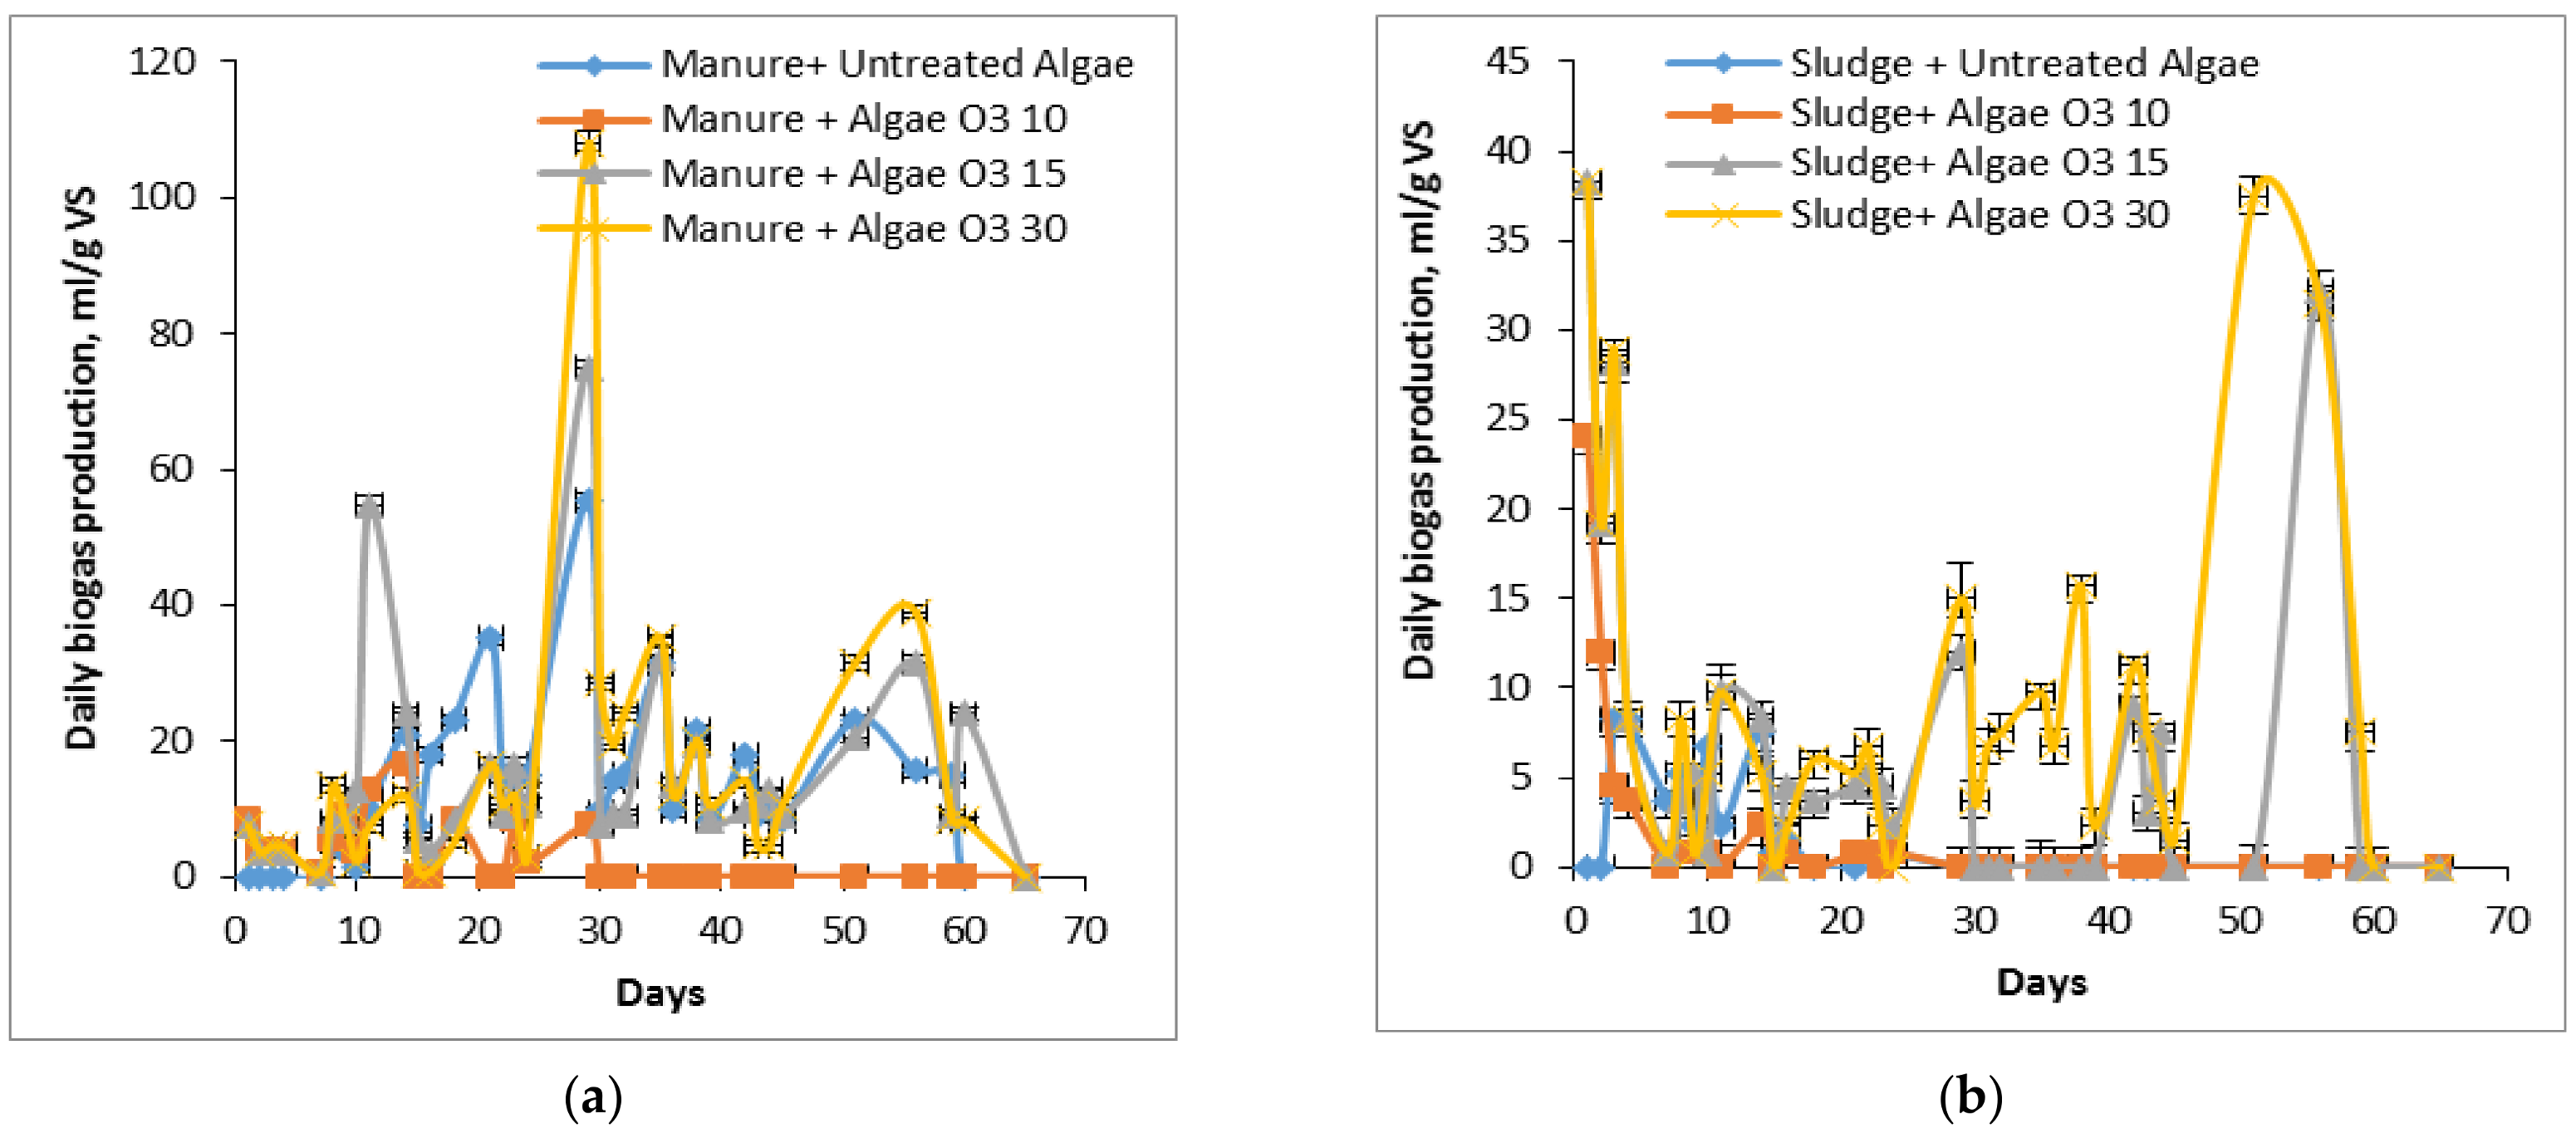
3.3. Impact of Pretreatment with Ozone on Anaerobic Digestion by Batch
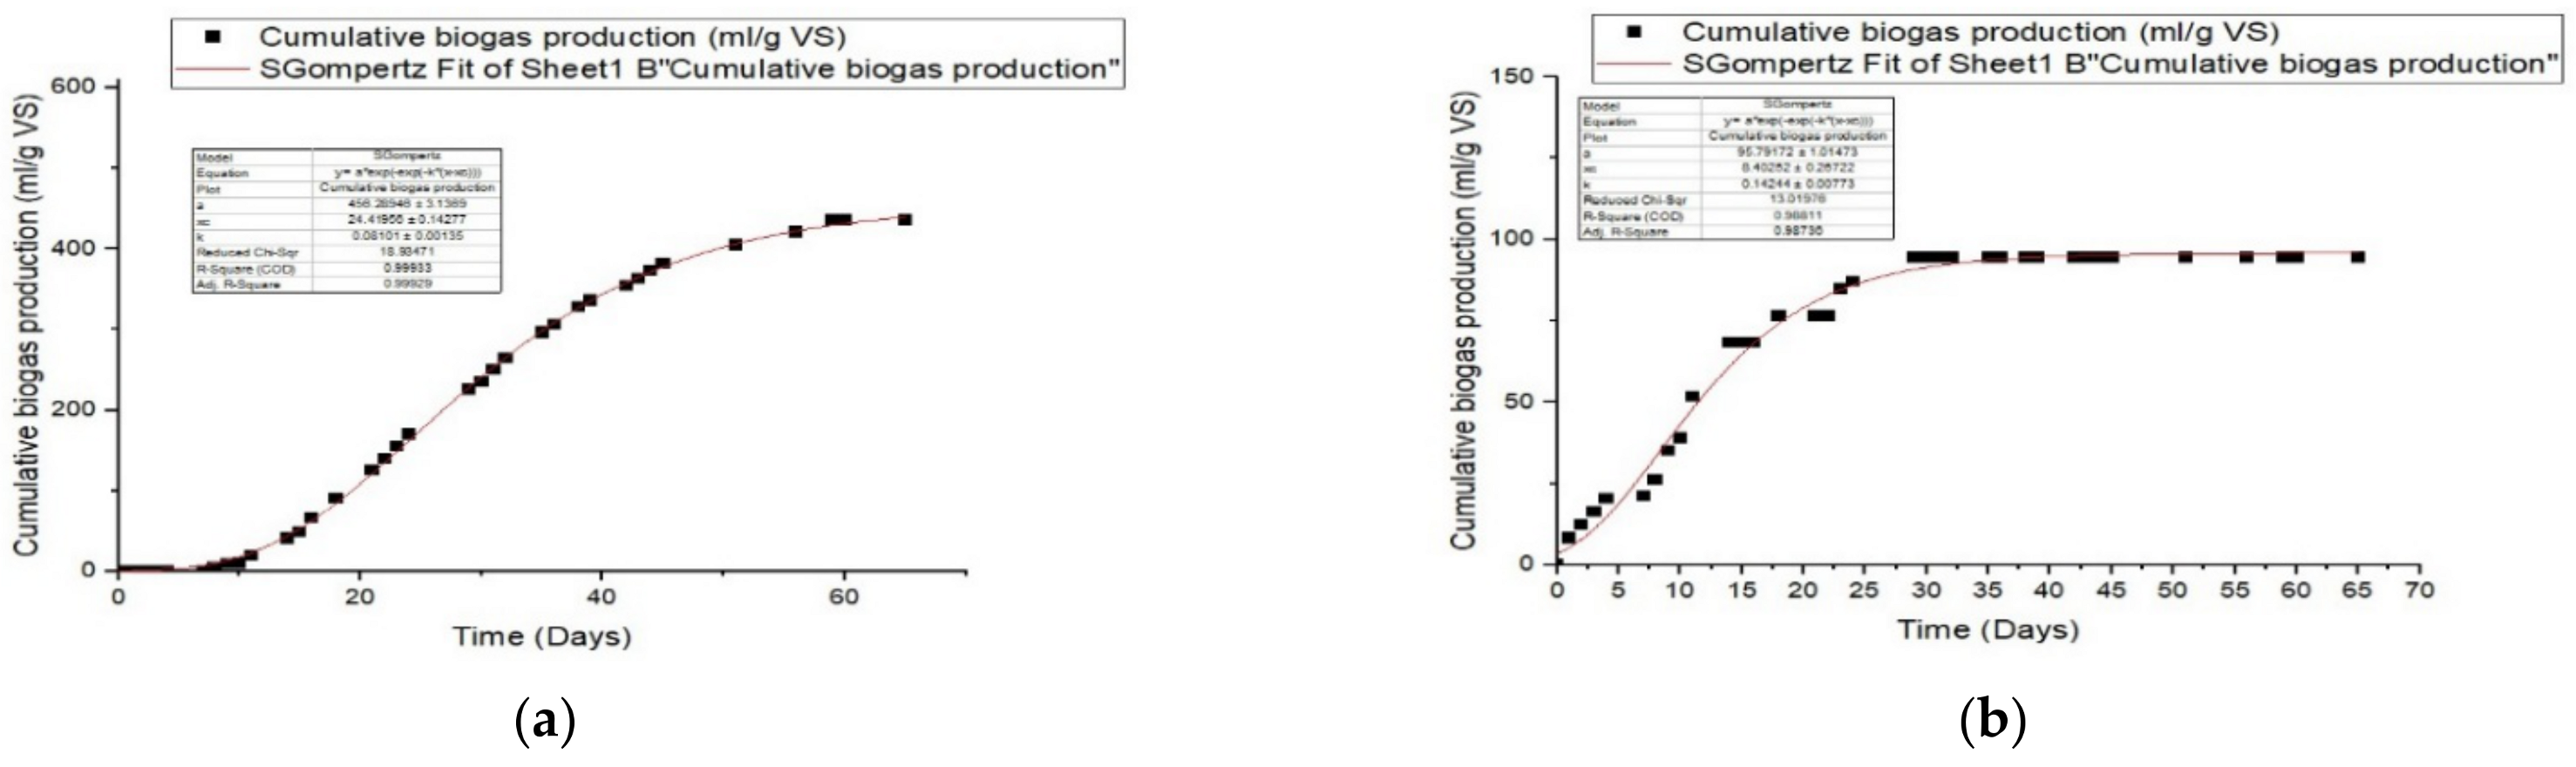
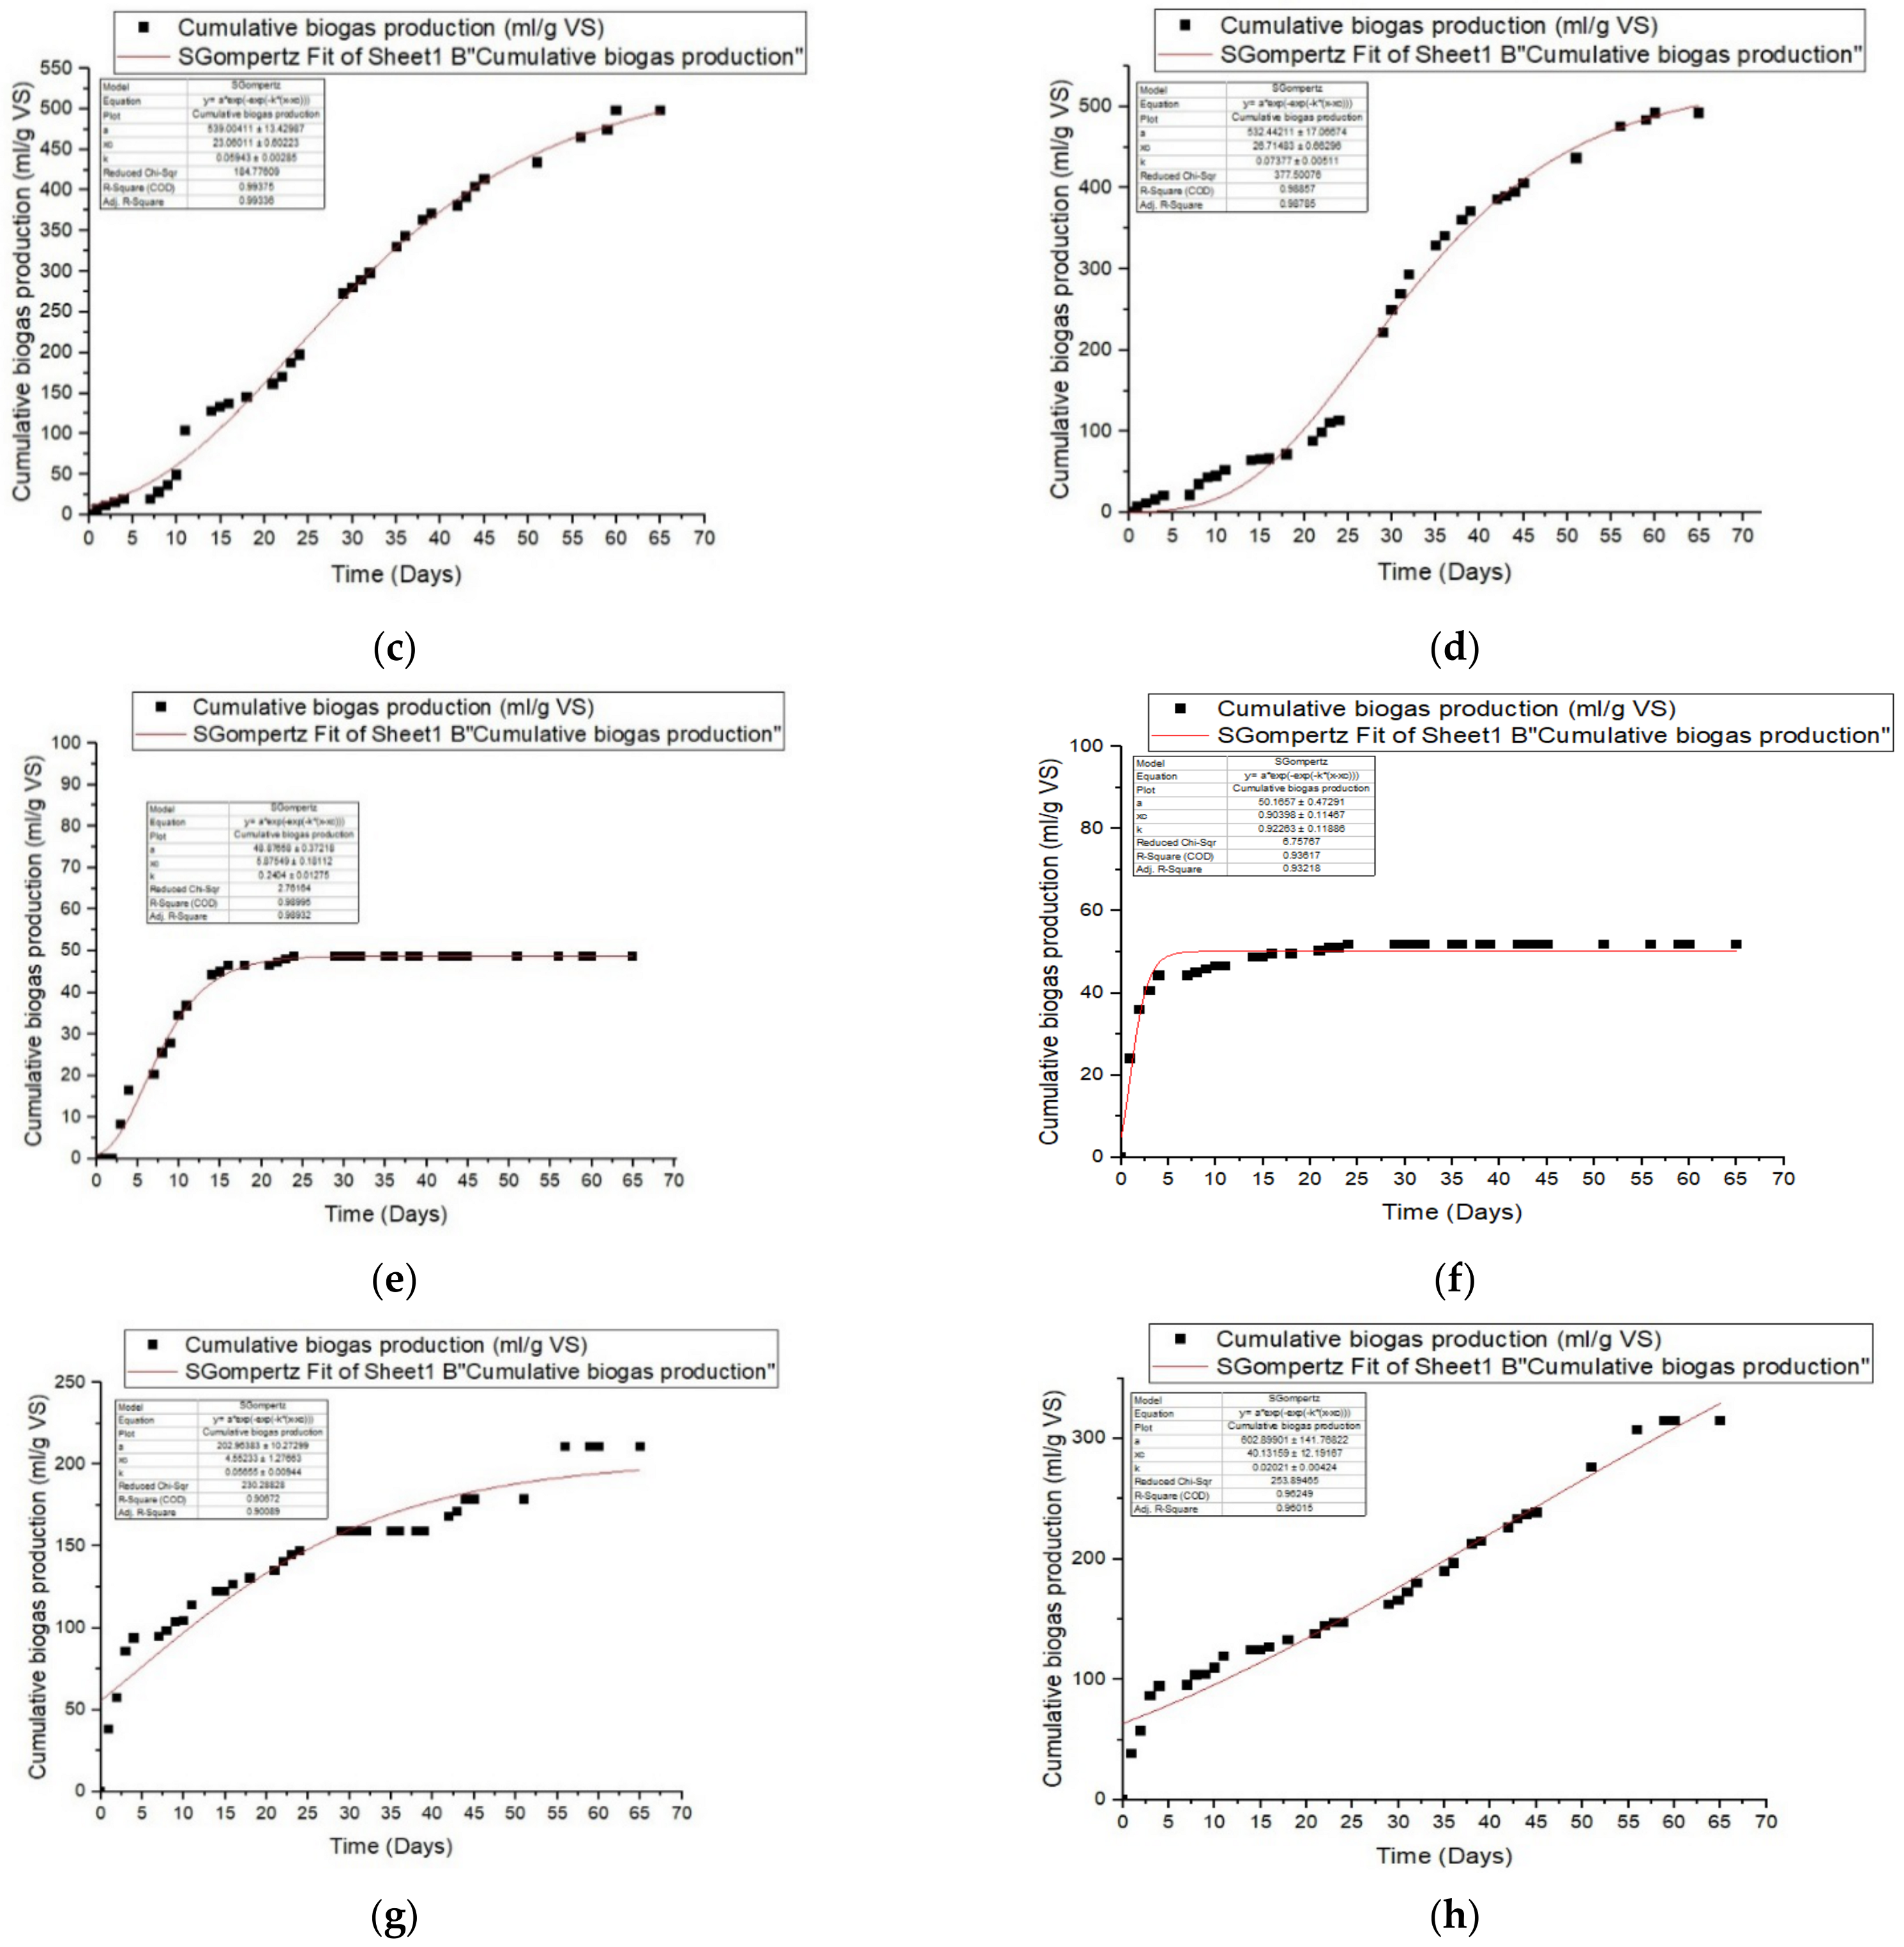
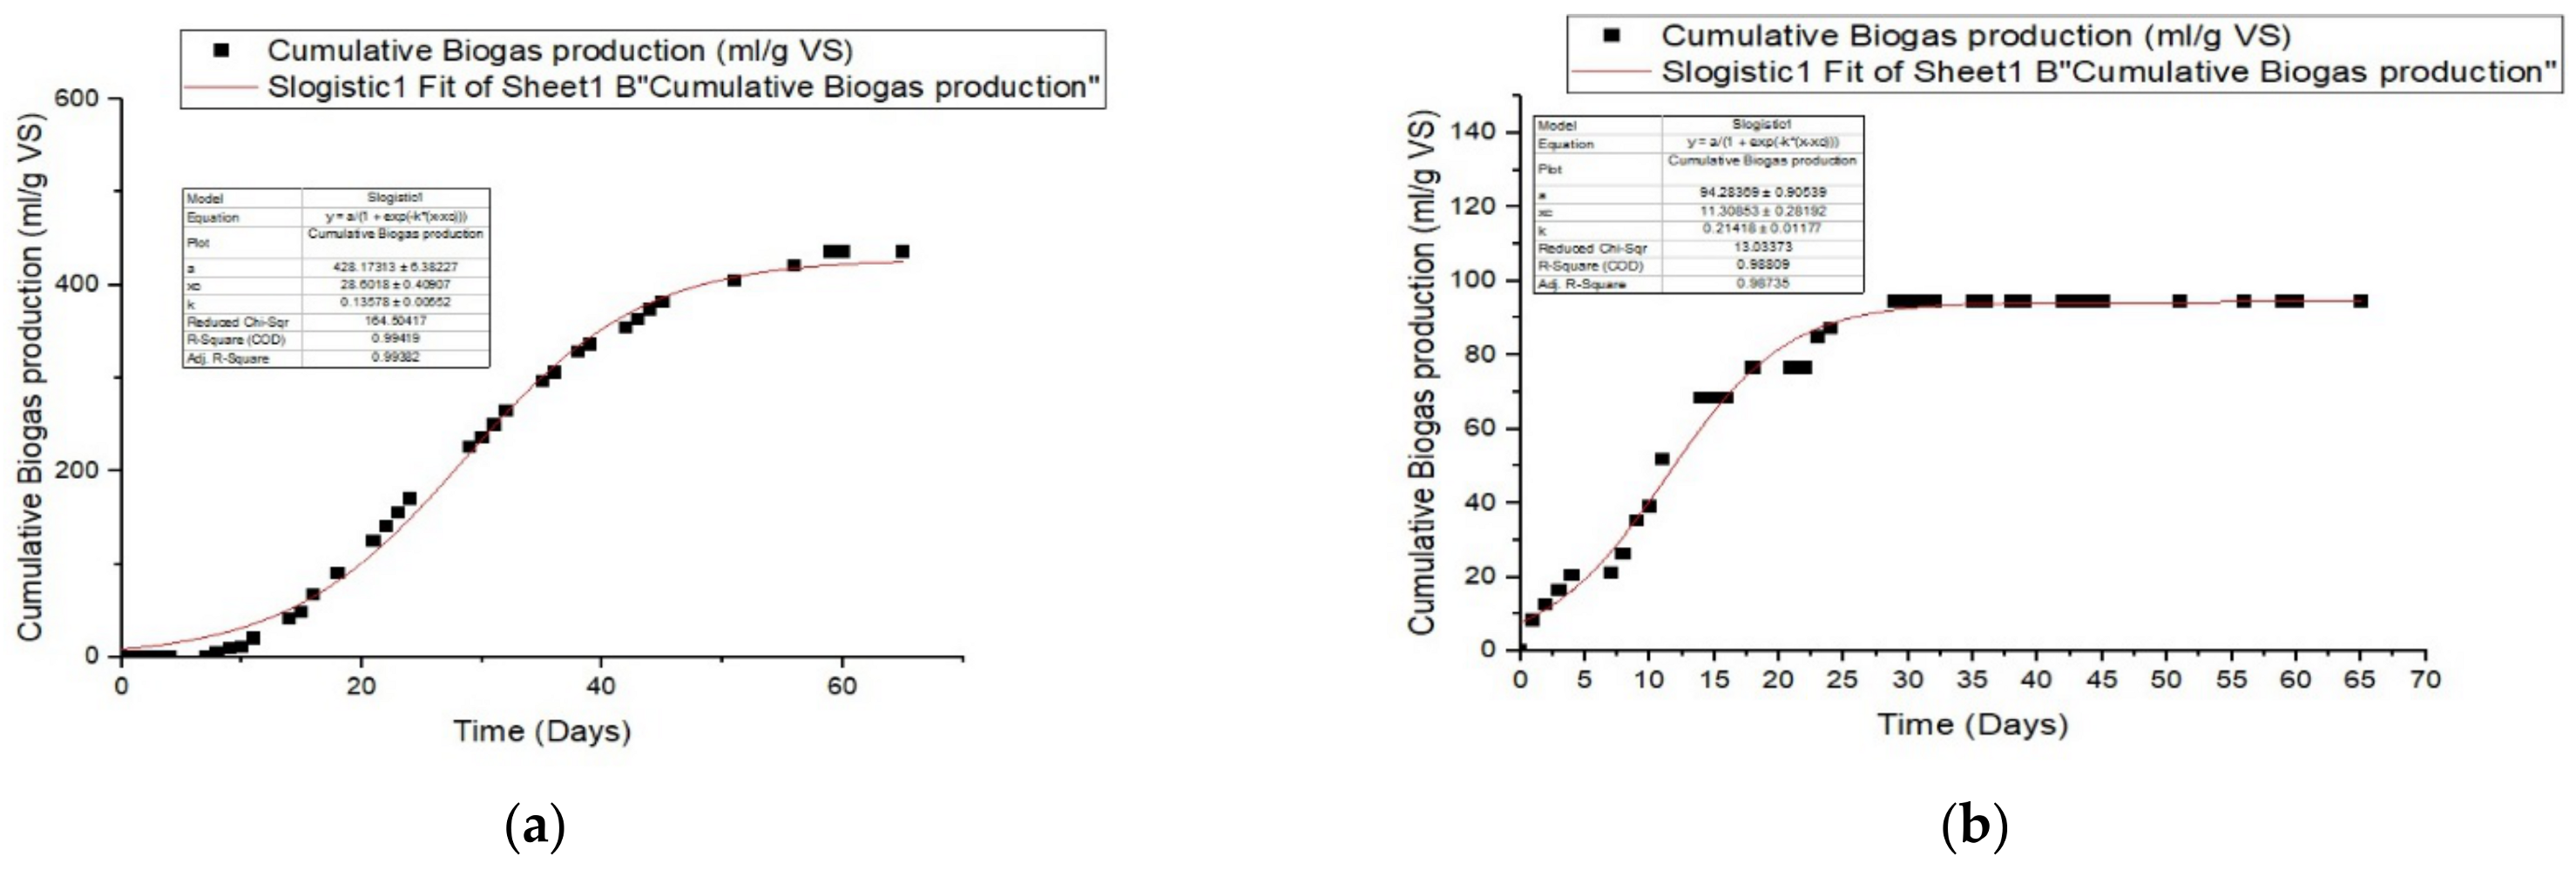
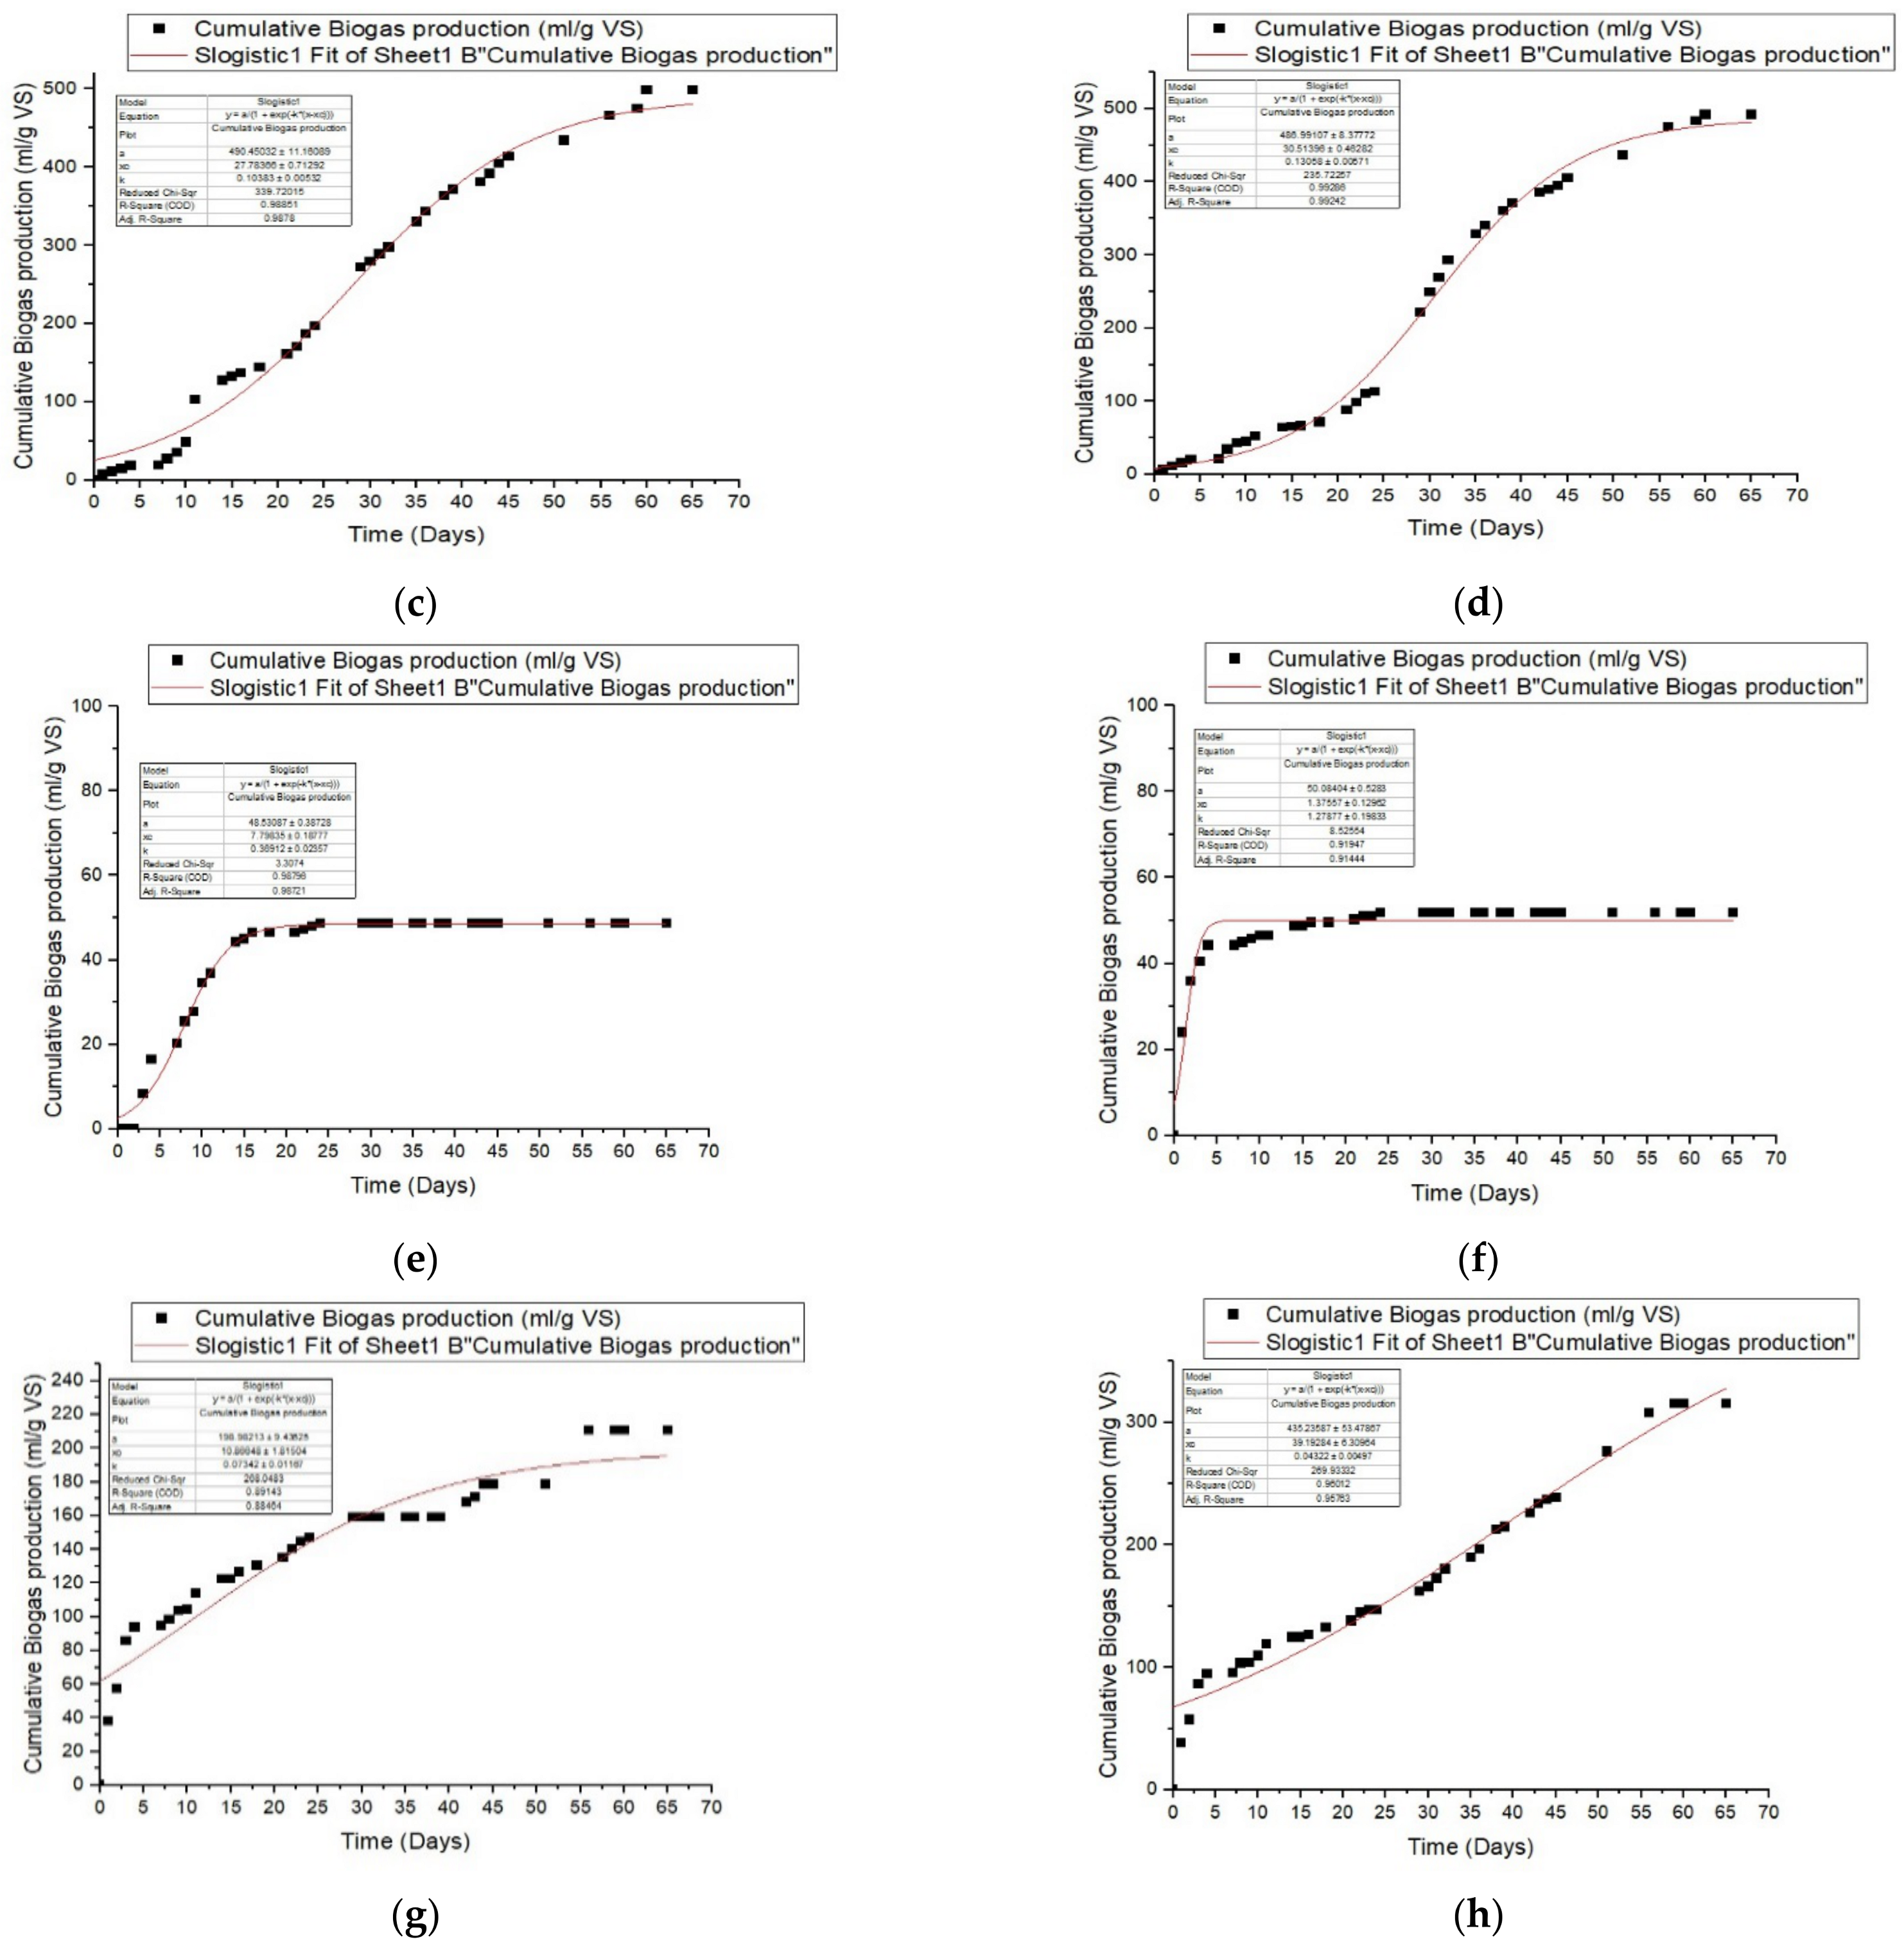
During a period of 65 days, the experimental results of biogas output yields were collected and shown in Figure 5. Inactivity, possibly as a result of the methanogens undergoing a methamorphic growth phase, follows the initial anaerobic process that yielded high biogas yields in the first step [57,58]. When the treated Ulva lactuca was treated with an ozone dose (8.3 mg O3 min–1 VS) for 15 and 30 min, the average biogas production yield was marginally increased compared to the biogas production yield without ozonation treatment and ozonation treatment for 10 min with the same ozone dosage, as shown in Figure 5.
High ozone doses have a major positive effect on the production of biogas (p < 0.05). The ozonation time 15 min and 30 min produces higher biogas yield with 498.75 mL/g VS and 492 mL/g VS, respectively for Ulva lactuca in combination with manure. Same results with obtained for Ulva lactuca in combination with activated sludge, where the ozonation time 15 min and 30 min produces higher biogas yield with 210 mL/g VS and 315 mL/g VS, respectively. It is also clear to notice that concentration of ozone dosage (8.3 mg O3 min–1 VS) or 10 min time both manure and activated sludge has inhibitory effects on the biogas production.
Phenols, which are a complex group of phloroglucinol polymerization products (1,3,5-trihydroxybenzene), widely distributed in plants and algae, isolated from terrestrial and marine species by >8000 phenolic compounds [59,60]. Tabassum et al. [61], found a strong phenolic content association in the brown algae Ascophyllum nodosum (A. nodosum) and reduced yields of methane. Moen et al. [62], found that polyphenols inhibited the methanogenesis process of AD, and increased biogas production during AD of A. nodosum as formaldehyde “fixed” the polyphenols.
This may be the reason for the inhibitory effect of ozonation time of 10 min which can explains as the following: at the first stage of the ozonation and after 10 min the cell wall of Ulva lactuca was not completely destroyed as shown in Figure 3 and the phenolic compounds is still existing as degradation byproducts of Ulva lactuca which may inhibit the methanogenesis bacteria and after 15 or 30 min the phenolic compounds were degraded to form CO2 and the cell wall will be weakened by ozone to help release organic matter.
Biogas output tests have been completed when, as seen in Figure 6, the regular production of biogas is <1% of the total production of most of the tests conducted. It is clear that the biogas output of mechanically treated algae without ozonation is around 435 mL/g VS higher than that of ozonated Ulva lactuca with activated sludge in combination, which may indicate that the manure is favorable as incoculum for marine macroalgae or the activated sludge I/S ratio need to be optimized in the future studies.
The mechanical and ozonation pretreatment of macro algae, which is linked to the hydrogen bonds that strongly bind the cellulose chain in crystal form, obstructing the breakdown of cellulose into glucose [63,64,65], is the first step in the separation of the components of lignocellulose, which are lignin, cellulose, hemicellulose, and other extracted components. This research is also the first study to examine the impact of mixing mechanically and ozonally treated macroalgae in conjunction with two distinct inoculums, resulting in a higher biogas yield than untreated macroalgae. As verified by FTIR, XRD, SEM, and TGA, ozonation pretreatment in combination with manure has enhanced the surface area of reaction and biogas production.
Interestingly, the 10-min ozonation time activity was very distinguishable compared to the other 15 and 30 periods. In fact, when the O3 dose was increased to the highest level investigated, a significant difference was observed in this situation (249 mg O3 g–1 VS). It is important to remember that the ozone dose cannot be increased above the threshold level; otherwise, not only will the cell wall be weakened and organic matter released, but the organic matter will also be oxidized [18].
Figure 3b,d show SEM analysis, which shows that ozone treatment is safe. The broken (oxidized) wall structure, faster cell lysis, and better accessibility of hydrolytic enzymes/fermenting bacteria to the cell material all contributed to the improved conversion of this renewable feedstock to biogas. Supporting results were stated by Miao and Tao [37], who discussed the removal of green-blue algae and the depletion of their toxins by an ozone-based peroxidation method. The algal cells were found to be impaired to varying degrees depending on the dosage of O3, resulting in an increase in dissolved organic carbon in the algae suspension. Cardeña et al. [18] suggested that the biogas capacity of three separate algal cultures was enhanced by O3. SEM pictures helped to imagine the potential ozonation mode of action and to grasp it. Allen et al. [66] from West Cork, Ireland, collected Ulva lactuca and evaluated the biomethane capacity of fresh Ulva lactuca as 183 L CH4/kg VS Allen et al. [66] with cattle slurry co-digested of both dried and fresh green algae Ulva lactuca. In mono-digestion, the results showed synergistic effects, with Ulva lactuca and slurry providing on the order of 17% more biomethane yield.

3.4. Kinetic Study

The data of the gas production kinetic study have been summarized in the Table 3. It is reported that the Gompertz and logistic feature models matched well with the experimental findings. For the logistic feature model and the modified Gompertz model, a production rate (Rm) of 28.60 L/g VS and 24.42 L/g VS of composite biofuel were observed. The late reaction and eventual microorganisms adaptation to the fluctuating atmosphere is expressed in the lag phase (λ) [37,67]. The revised Gompertz and logistic models functional received λ values of 0.923 and 1.28 days, respectively. In this study, the value of λ is reasonably close to the published λ of 1.2–1.8 days and 1.5–2.1 days (by Deepanraj et al. [68]) and 0.9 and 1.23 days [34] reported, respectively, for the modified Gompertz and logistic function models. The calculated values for biofuel production are plotted against the observed values, as seen in Figure 7 and Figure 8, to assess the reliability of the model results in the two tested models. The low values of RMSE (1.59) and (1.74) reflect modified Gompertz, and the potential of logistic function models to reliably predict bioactivity is high. To provide an image of the kinetics study, the statistical indicators (R2) are given in Table 3. Nguyen et al. [37] reported that the higher R2 (0.999 and 0.994) and lower RMSE values for the updated Gompertz models and the logistic feature models, respectively, indicated a more suitable kinetic model.

4. Conclusions

The biomass of the green algae Ulva lactuca was pre-treated with ozonation at various doses in order to increase its digestibility for biogas production in this study. As a result, higher doses of O3 (15 and 30 min) increased the biogas ability of the studied green algae Ulva lactuca, in comparison to untreated biomass studies. SEM, FTIR, TGA, and XRD images aided in visualizing and comprehending the future ozonation mode of action. In light of previously published literature, ozone appears to be an excellent alternative candidate for significantly increasing the formation of biomethane from the renewable green algae Ulva lactuca. The updated Gompertz model (R2 = 0.999) and the logistic function model (R2 = 0.994) were appropriate models to match the calculated biogas production, and could be used more reasonably to characterize the kinetics of the AD phase. Based on the findings collected, algae is a very high-yielding biomass that does not interfere with the production of fruit. Ulva lactuca may have an output of dry matter that is more than ten times greater than that of crops. The ozonated treated Ulva lactuca is an appropriate source of biomass for the production of biogas and has a higher outcome than the untreated one. Emission of Biogas, cost–benefit analysis (CBA) and leveled energy cost (LCOE) could also be required as a future development to evaluate the compatibility of the entire Ulva lactuca bioprocess.

Author Contributions

Methodology, M.A.H., A.P. and A.E.N.; Software, M.A.H., A.P., A.E.N. and M.R.E.; Supervision, A.P. and A.E.N.; Writing—original draft, M.A.H., A.P., A.E.N. and M.R.E.; Writing—review and editing, M.A.H., A.P., M.R.E., A.E.N., A.E., S.R. and A.E.S. All authors have read and agreed to the published version of the manuscript.

Funding

This work was partially supported by the National Institute of Oceanography and Fisheries, Environmental Division, Alexandria, Egypt and by STDF project number CB-22816.

Conflicts of Interest

The authors declare no conflict of interest.

Abbreviations

O3Ozone
ADAnaerobic digestion
FTIRFourier transform infrared
SEM Scanning electron microscope
TGAThermo gravimetric analysis
XRDX-ray diffraction
TSTotal solids
VSVolatile solids
RmThe maximum biogas production rate (L/g VS added.d)
λThe lag phase time (days)

References

  1. Påledal, S.N.; Hellman, E.; Moestedt, J. The effect of temperature, storage time and collection method on biomethane potential of source separated household food waste. Waste Manag. 2018, 71, 636–643. [Google Scholar] [CrossRef] [PubMed]
  2. Sarvari Horvath, I.; Tabatabaei, M.; Karimi, K.; Kumar, R. Recent Updates on Biogas Production Review. Biofuel Res. J. 2016, 3, 394–402. [Google Scholar] [CrossRef] [Green Version]
  3. Bruhn, A.; Dahl, J.; Nielsen, H.B.; Nikolaisen, L.; Rasmussen, M.B.; Markager, S.; Olesen, B.; Arias, C.; Jensen, P.D. Bioenergy potential of Ulva lactuca: Biomass yield, methane production and combustion. Bioresour. Technol. 2011, 102, 2595–2604. [Google Scholar] [CrossRef] [PubMed]
  4. Lora Grando, R.; de Souza Antune, A.M.; da Fonseca, F.V.; Sanchez, A.; Barrena, R.; Font, X. Technology Overview of Bio-gas Production in Anaerobic Digestion Plants: A European Evaluation of Research and Development. Renew. Sustain. Energy Rev. 2017, 80, 44–53. [Google Scholar] [CrossRef] [Green Version]
  5. Hao, H.; Liu, Z.; Zhao, F.; Ren, J.; Chang, S.; Rong, K.; Du, J. Biofuel for vehicle use in China: Current status, future potential and policy implications. Renew. Sustain. Energy Rev. 2018, 82, 645–653. [Google Scholar] [CrossRef]
  6. Cheng, J.J.; Timilsina, G.R. Status and barriers of advanced biofuel technologies: A review. Renew. Energy 2011, 36, 3541–3549. [Google Scholar] [CrossRef]
  7. Montingelli, M.; Tedesco, S.; Olabi, A. Biogas production from algal biomass: A review. Renew. Sustain. Energy Rev. 2015, 43, 961–972. [Google Scholar] [CrossRef] [Green Version]
  8. Zhu, L.; Li, Z.; Hiltunen, E. Theoretical Assessment of Biomethane Production from Algal Residues after Biodiesel Production: Biogas Production from Algal Residues. Wiley Interdiscip. Rev. Energy Environ. 2017, 7, e273. [Google Scholar] [CrossRef]
  9. Kwietniewska, E.; Tys, J. Process characteristics, inhibition factors and methane yields of anaerobic digestion process, with particular focus on microalgal biomass fermentation. Renew. Sustain. Energy Rev. 2014, 34, 491–500. [Google Scholar] [CrossRef]
  10. Siddique, M.N.; Wahid, Z.A. Achievements and perspectives of anaerobic co-digestion: A review. J. Clean. Prod. 2018, 194, 359–371. [Google Scholar] [CrossRef]
  11. Kumar, G.; Sivagurunathan, P.; Zhen, G.; Kobayashi, T.; Kim, S.-H.; Xu, K. Combined Pretreatment of Electrolysis and Ul-traSonication towards Enhancing Solubilization and Methane Production from Mixed Microalgae Biomass. Bioresour. Technol. 2017, 245, 196–200. [Google Scholar] [CrossRef] [PubMed]
  12. Montingelli, M.; Benyounis, K.; Stokes, J.R.; Olabi, A. Pretreatment of macroalgal biomass for biogas production. Energy Convers. Manag. 2016, 108, 202–209. [Google Scholar] [CrossRef]
  13. Ayala-Parra, P.; Liu, Y.; Sierra-Alvarez, R.; Field, J.A. Pretreatments to Enhance the Anaerobic Biodegradability of Chlorella Protothecoides Algal Biomass. Environ. Prog. Sustain. Energy 2017, 37, 418–424. [Google Scholar] [CrossRef]
  14. Barbot, Y.; Thomsen, L.; Benz, R. Thermo-Acidic Pretreatment of Beach Macroalgae from Rügen to Optimize Biomethane Production-Double Benefit with Simultaneous Bioenergy Production and Improvement of Local Beach and Waste Management. Mar. Drugs 2015, 13, 5681–5705. [Google Scholar] [CrossRef] [Green Version]
  15. Jard, G.; Dumas, C.; Delgenes, J.P.; Marfaing, H.; Sialve, B.; Steyer, J.P.; Carrere, H. Effect of Thermochemical Pretreatment on the Solubilization and Anaerobic Biodegradability of the Red Macroalga Palmaria Palmata. Biochem. Eng. J. 2013, 79, 253–258. [Google Scholar] [CrossRef]
  16. Montingelli, M.; Benyounis, K.; Quilty, B.; Stokes, J.; Olabi, A. Influence of mechanical pretreatment and organic concentration of Irish brown seaweed for methane production. Energy 2017, 118, 1079–1089. [Google Scholar] [CrossRef] [Green Version]
  17. Tedesco, S.; Barroso, T.M.; Olabi, A. Optimization of mechanical pre-treatment of Laminariaceae spp. biomass-derived biogas. Renew. Energy 2014, 62, 527–534. [Google Scholar] [CrossRef]
  18. Cardeña, R.; Moreno, G.; Bakonyi, P.; Buitrón, G. Enhancement of methane production from various microalgae cultures via novel ozonation pretreatment. Chem. Eng. J. 2017, 307, 948–954. [Google Scholar] [CrossRef]
  19. Goel, R.; Tokutomi, T.; Yasui, H. Anaerobic digestion of excess activated sludge with ozone pretreatment. Water Sci. Technol. 2003, 47, 207–214. [Google Scholar] [CrossRef] [PubMed]
  20. Yasui, H.; Komatsu, K.; Goel, R.; Matsuhashi, R.; Ohashi, A.; Harada, H. Minimization of greenhouse gas emission by application of anaerobic digestion process with biogas utilization. Water Sci. Technol. 2005, 52, 545–552. [Google Scholar] [CrossRef] [PubMed]
  21. Wu, S.; Upreti, F. Ein-Mozaffari, Ozone pretreatment of wheat straw for enhanced biohydrogen production. Int. J. Hydrogen Energy 2013, 38, 10270–10276. [Google Scholar] [CrossRef]
  22. Pilarski, G.; Kyncl, M.; Stegenta, S.; Piechota, G. Emission of Biogas from Sewage Sludge in Psychrophilic Conditions. Waste Biomass Valorization 2020, 11, 3579–3592. [Google Scholar] [CrossRef]
  23. Nguyen, T.L.; Lee, D.; Chang, J.; Liu, J. Effects of ozone and peroxone on algal separation via dispersed air flotation. Colloids Surfaces B Biointerfaces 2013, 105, 246–250. [Google Scholar] [CrossRef]
  24. Miao, H.; Tao, W. The mechanisms of ozonation on cyanobacteria and its toxins removal. Sep. Purif. Technol. 2009, 66, 187–193. [Google Scholar] [CrossRef]
  25. Huang, Y.; Hong, A.; Zhang, D.; Li, L. Comparison of cell rupturing by ozonation and ultrasonication for algal lipid extraction fromChlorella vulgaris. Environ. Technol. 2014, 35, 931–937. [Google Scholar] [CrossRef]
  26. Cea-Barcia, G.; Buitrón, G.; Moreno, G.; Kumar, G. A cost-effective strategy for the bio-prospecting of mixed microalgae with high carbohydrate content: Diversity fluctuations in different growth media. Bioresour. Technol. 2014, 163, 370–373. [Google Scholar] [CrossRef]
  27. Kalpana, V.N.; Rajeswari, V.D. A Review on Green Synthesis, Biomedical Applications, and Toxicity Studies of ZnO NPs. Bioinorg. Chem. Appl. 2018, 2018, 1–12. [Google Scholar] [CrossRef]
  28. Tian, Y.; Yang, K.; Zheng, L.; Han, X.; Xu, Y.; Li, Y.; Li, S.; Xu, X.; Zhang, H.; Zhao, L. Modelling Biogas Production Kinetics of Various Heavy Metals Exposed Anaerobic Fermentation Process Using Sigmoidal Growth Functions. Waste Biomass Valorization 2020, 11, 4837–4848. [Google Scholar] [CrossRef]
  29. AOAC. Official Methods of Analysis of AOAC International, 17th ed; AOAC International: Gathersberg, MD, USA, 2000. [Google Scholar]
  30. Ortiz, J.; Romero, N.; Robert, P.; Araya, J.; Lopez-Hernández, J.; Bozzo, C.; Navarrete, E.; Osorio, A.; Rios, A. Dietary fiber, amino acid, fatty acid and tocopherol contents of the edible seaweeds Ulva lactuca and Durvillaea antarctica. Food Chem. 2006, 99, 98–104. [Google Scholar] [CrossRef]
  31. Wilkins, D.; Rao, S.; Lu, X.; Lee, P.K. Effects of sludge inoculum and organic feedstock on active microbial commu-nities and methane yield during anaerobic digestion. Front. Microbiol. 2015, 6, 1114. [Google Scholar] [CrossRef] [Green Version]
  32. Hassaan, M.A.; Pantaleo, A.; Tedone, L.; Elkatory, M.R.; Ali, R.M.; Nemr, A.E.; Mastro, G.D. Enhancement of biogas produc-tion via green ZnO nanoparticles: Experimental results of selected herbaceous crops. Chem. Eng. Commun. 2019, 208, 1–14. [Google Scholar]
  33. Amirante, R.; Demastro, G.; Distaso, E.; Hassaan, M.A.; Mormando, A.; Pantaleo, A.M.; Tamburrano, P.; Tedone, L.; Clodo-veo, M.L. Effects of ultrasound and green synthesis ZnO nanoparticles on biogas production from Olive Pomace. Energy Proced. 2018, 148, 940–947. [Google Scholar]
  34. Hassaan, M.A.; Pantaleo, A.; Santoro, F.; Elkatory, M.R.; De Mastro, G.; El Sikaily, A.; Ragab, S.; El Nemr, A. Techno-Economic Analysis of ZnO Nanoparticles Pretreatments for Biogas Production from Barley Straw. Energies 2020, 13, 5001. [Google Scholar] [CrossRef]
  35. Remigi, E.U.; Buckley, C.A. Co-Digestion of High Strength/Toxic Organic Effluents in Anaerobic Digesters at Wastewater Treatment Works; Water Research Commission: Pretoria, South Africa, 2016. [Google Scholar]
  36. Hassaan, M.A.; Pantaleo, A.; Tedone, L.; Demastro, G. Biogas production from silage flour wheat influenced by chemical and green synthesized ZnO nanoparticles. In Proceedings of the XLVII Conference of Italian Society for Agronomy, Marsala, Italy, 12–14 September 2018. [Google Scholar]
  37. Nguyen, D.D.; Jeon, B.-H.; Jeung, J.H.; Rene, E.R.; Banu, J.R.; Ravindran, B.; Vu, C.M.; Ngo, H.H.; Guo, W.; Chang, S.W. Thermophilic anaerobic digestion of model organic wastes: Evaluation of biomethane production and multiple kinetic models analysis. Bioresour. Technol. 2019, 280, 269–276. [Google Scholar] [CrossRef] [PubMed]
  38. Kafle, G.K.; Chen, L. Comparison on Batch Anaerobic Digestion of Five Different Livestock Manures and Prediction of Bio-chemical Methane Potential (BMP) Using Different Statistical Models. Waste Manag. 2016, 48, 492–502. [Google Scholar] [CrossRef] [PubMed] [Green Version]
  39. Donoso-Bravo, A.; Pérez-Elvira, S.; Fdz-Polanco, F. Application of simplified models for anaerobic biodegradability tests. Evaluation of pre-treatment processes. Chem. Eng. J. 2010, 160, 607–614. [Google Scholar] [CrossRef]
  40. Li, L.; He, Q.; Zhao, X.; Wu, D.; Wang, X.; Peng, X. Anaerobic digestion of food waste: Correlation of kinetic parameters with operational conditions and process performance. Biochem. Eng. J. 2018, 130, 1–9. [Google Scholar] [CrossRef]
  41. Soliman, E.A.; Elkatory, M.R.; Hashem, A.I.; Ibrahim, H.S. Synthesis and performance of maleic anhydride copolymers with alkyl linoleate or tetra-esters as pour point depressants for waxy crude oil. Fuel 2018, 211, 535–547. [Google Scholar] [CrossRef]
  42. Ali, R.M.; Elkatory, M.R.; Hamad, H.A. Highly active and stable magnetically recyclable CuFe2O4 as a heterogenous catalyst for efficient conversion of waste frying oil to biodiesel. Fuel 2020, 268, 117297. [Google Scholar] [CrossRef]
  43. Schneider, L.; Haverinen, J.; Jaakkola, M.; Lassi, U. Pretreatment and fractionation of lignocellulosic barley straw by mecha-nocatalysis. Chem. Eng. J. 2017, 327, 898–905. [Google Scholar] [CrossRef] [Green Version]
  44. Priya, D.B.; Asharani, I.V. Catalytic reduction in 4-nitrophenol using Actinodaphne madraspatana Bedd leaves-mediated palladium nanoparticles. IET Nanobiotechnol. 2018, 12, 116–126. [Google Scholar] [CrossRef]
  45. Sanchez-Silva, L.; López-González, D.; Villaseñor, J.; Sánchez, P.; Valverde, J.L. Thermogravimetric-mass spectrometric analysis of lignocellulosic and marine biomass pyrolysis. Bioresour. Technol. 2012, 109, 163–172. [Google Scholar] [CrossRef]
  46. Carrier, M.; Loppinet-Serani, A.; Denux, D.; Lasnier, J.-M.; Ham-Pichavant, F.; Cansell, F.; Aymonier, C. Thermogravimetric analysis as a new method to determine the lignocellulosic composition of biomass. Biomass Bioenergy 2011, 35, 298–307. [Google Scholar] [CrossRef]
  47. Chen, Z.; Hu, M.; Zhu, X.; Guo, D.; Liu, S.; Hu, Z.; Xiao, B.; Wang, J.; Laghari, M. Characteristics and kinetic study on pyrol-ysis of five lignocellulosic biomass via thermogravimetric analysis. Bioresour. Technol. 2015, 192, 441–450. [Google Scholar] [CrossRef] [PubMed]
  48. Gai, C.; Zhang, Y.; Chen, W.T.; Zhang, P.; Dong, Y. Thermogravimetric and kinetic analysis of thermal decomposition char-acteristics of low-lipid microalgae. Bioresour. Technol. 2013, 150, 139–148. [Google Scholar] [CrossRef] [PubMed]
  49. Ong, M.Y.; Latif, N.-I.S.A.; Leong, H.Y.; Salman, B.; Show, P.L.; Nomanbhay, S. Characterization and Analysis of Malaysian Macroalgae Biomass as Potential Feedstock for Bio-Oil Production. Energies 2019, 12, 3509. [Google Scholar] [CrossRef] [Green Version]
  50. Carpio, R.B.; Zhang, Y.; Kuo, C.-T.; Chen, W.-T.; Schideman, L.C.; De Leon, R.L. Characterization and thermal decomposition of demineralized wastewater algae biomass. Algal Res. 2019, 38, 101399. [Google Scholar] [CrossRef]
  51. Friis, J.; Holm, C.; Halling-Sørensen, B. Evaluation of elemental composition of algal biomass as toxical endpoint. Chemosphere 1998, 37, 2665–2676. [Google Scholar] [CrossRef]
  52. Pang, Y.Z.; Liu, Y.P.; Li, X.J.; Wang, K.S.; Yuan, H.R. Improving Biodegradability and Biogas Production of Corn Stover through Sodium Hydroxide Solid State Pretreatment. Energy Fuels 2008, 22, 2761–2766. [Google Scholar] [CrossRef]
  53. Feng, L.; Perschke, Y.M.L.; Fontaine, D.; Ward, A.J.; Eriksen, J.; Sorensen, P.; Moller, H.B. Co-ensiling of cover crops and bar-ley straw for biogas production. Renew. Energy 2019, 142, 677–683. [Google Scholar] [CrossRef]
  54. Nyns, E.J. Biomethanation Processes; Wiley-VCH: Berlin, Germany, 1986; pp. 207–267. [Google Scholar]
  55. Kivaisi, A.K.; Mtila, M. Production of biogas from water hyacinth (Eichhorniacrassipes) in a two stage bioreactor. World J. Microbiol. Biotechnol. 1997, 14, 125–131. [Google Scholar] [CrossRef]
  56. Mshandete, A.; Kivaisi, A.; Rubindamayugi, M.; Mattiasson, B. Anaerobic batch co-digestion of sisal pulp and fish wastes. Bioresour. Technol. 2004, 95, 19–24. [Google Scholar] [CrossRef] [PubMed]
  57. Ganzoury, M.A.; Allam, N.K. Impact of nanotechnology on biogas production: A mini-review. Renew. Sustain. Energy Rev. 2015, 50, 1392–1404. [Google Scholar] [CrossRef]
  58. Elijah, T.; Ibifuro, A.; Yahaya, S.M. The study of cow dung as co-substrate with rice husk in biogas production. Sci. Res. Essay 2009, 9, 861–866. [Google Scholar]
  59. Savithramma, N.; Linga Rao, M.; Venkateswarlu, P. Isolation and Identification of Phenolic Compounds from Boswellia ovalifoliolata Bal. & Henry and Their Free Radical Scavenger Activity. Int. J. Drug Deliv. Technol. 2014, 4, 14–21. [Google Scholar]
  60. Pérez, M.J.; Falqué, E.; Domínguez, H. Antimicrobial Action of Compounds from Marine Seaweed. Mar. Drugs 2016, 14, 52. [Google Scholar] [CrossRef] [Green Version]
  61. Tabassum, M.R.; Xia, A.; Murphy, J.D. Seasonal variation of chemical composition and biomethane production from the brown seaweed Ascophyllum nodosum. Bioresour. Technol. 2016, 216, 219–226. [Google Scholar] [CrossRef]
  62. Moen, E.; Horn, S.; Østgaard, K. Biological degradation of Ascophyllum nodosum. Environ. Biol. Fishes 1997, 9, 347–357. [Google Scholar] [CrossRef]
  63. Tsapekos, P.; Kougias, P.; Angelidaki, I. Biogas production from ensiled meadow grass; effect of mechanical pretreatments and rapid determination of substrate biodegradability via physicochemical methods. Bioresour. Technol. 2015, 182, 329–335. [Google Scholar] [CrossRef]
  64. Tsapekos, P.; Kougias, P.G.; Egelund, H.; Larsen, U.; Pedersen, J.; Trenel, P.; Angelidaki, I. Mechanical pretreatment at har-vesting increases the bioenergy output from marginal land grasses. Renew. Energy 2017, 111, 914–921. [Google Scholar] [CrossRef] [Green Version]
  65. Balsari, P.; Menardo, S.; Airoldi, G. Effect of Physical and Thermal Pre-Treatment on Biogas Yield of Some Agricultural By-Products. Progress in Biogas II; German Society for Sustainable Biogas and Bioenergy Utilisation: Stuttgart, Germany, 2011. [Google Scholar]
  66. Allen, E.; Browne, J.; Hynes, S.; Murphy, J. The potential of algae blooms to produce renewable gaseous fuel. Waste Manag. 2013, 33, 2425–2433. [Google Scholar] [CrossRef]
  67. Deepanraj, B.; Sivasubramanian, V.; Jayaraj, S. Experimental and Kinetic Study on Anaerobic Digestion of FoodWaste: The Effect of Total Solids and PH. J. Renew. Sustain. Energy 2015, 7, 063104. [Google Scholar] [CrossRef]
  68. Mao, C.; Wang, X.; Xi, J.; Feng, Y.; Ren, G. Linkage of Kinetic Parameters with Process Parameters and Operational Condi-tions during Anaerobic Digestion. Energy 2017, 135, 352–360. [Google Scholar] [CrossRef]
Figure 1. Fourier Transform Infrared (FTIR) spectrum of raw and ozonated pretreated Ulva lactuca.
Energies 14 01703 g001
Figure 2. Thermal Analysis (TGA) and Differential thermal analysis (DTA) thermographs of raw and ozonated pretreated Ulva lactuca.
Energies 14 01703 g002
Figure 3. Scanning electron microscope (SEM) of raw and ozonated pretreated Ulva lactuca; (a) untreated, (b) O3 10 min., (c) O3 15 min. and (d) O3 30 min.
Energies 14 01703 g003aEnergies 14 01703 g003b
Figure 4. X-ray diffractograms of Ulva lactuca pretreated in raw and ozonated form.
Energies 14 01703 g004
Figure 5. Average production of cumulative net biogas using (a) Manure and (b) Sludge.
Energies 14 01703 g005
Figure 6. Average production of daily biogas using (a) Manure and (b) Sludge.
Energies 14 01703 g006
Figure 7. Cumulative biogas yield from Gompertz model, Manure (ad) and Sludge (eh).
Energies 14 01703 g007aEnergies 14 01703 g007b
Figure 8. Cumulative biogas yield from Logistic model, Manure (ad) and Sludge (eh).
Energies 14 01703 g008aEnergies 14 01703 g008b
Table 1. Overview of substrates and pretreatment processes used for the estimation of the biogas yield of Ulva lactuca in batch experiments.
Experiment PretreatmentIncubation Temp. (°C)I/S Ratio
Batch 1Manure + algae untreated37 ± 120:1.5
Batch 2Sludge + Untreated Algae37 ± 120:1.5
Batch 3Manure + Algae O3 (10 min)37 ± 120:1.5
Batch 4Manure + Algae O3 (15 min)37 ± 120:1.5
Batch 5Manure + Algae O3 (30 min)37 ± 120:1.5
Batch 6Sludge + Algae O3 (10 min)37 ± 120:1.5
Batch 7Sludge + Algae O3 (15 min)37 ± 120:1.5
Batch 8Sludge + Algae O3 (30 min)37 ± 120:1.5
Table 2. The proximate values of different substrates.
Proximate TestsUlva lactucaManureActivated Sludge
DM%84.90 79.6780.51
Ash%29.2117.7816.85
VS%70.7982.2283.15
C%22.9949.80-
N%2.444.25-
H%4.555.43-
C/N9.4213.70-
Table 3. Data of kinetic analysis using the modified models of Gompertz and logistic features.
Modified Gompertz Model
Manure
R2Predicted
P (ml/g VS)
Differences (%)Rmax
mL/gVS.day
λ(day)RMSE
untreated0.999456.290.8724.420.0814.16
10 O30.98795.791.338.400.1423.45
15 O30.993539.000.4323.060.05912.98
30 O30.988532.441.9826.710.07418.58
Sludge
untreated0.98948.880.265.880.2401.59
10 O30.93250.173.060.900.9232.49
15 O30.901202.966.804.550.05714.51
30 O30.960602.904.5340.130.02015.24
Logistic function model
Manure
R2Predicted
P (ml/g VS)
Differences
(%)
Rmax
mL/gVS.day
λ(day)RMSE
untreated0.994428.172.4428.600.13612.26
10 O30.98794.280.2311.310.2143.45
15 O30.988490.453.6127.780.10417.62
30 O30.992486.992.1030.510.13114.68
Sludge
untreated0.98748.530.457.800.3691.74
10 O30.91450.083.221.381.282.79
15 O30.885198.987.3210.870.07315.56
30 O30.958435.244.0639.190.04315.71
Publisher’s Note: MDPI stays neutral with regard to jurisdictional claims in published maps and institutional affiliations.

