Article

Performance Improvement Plan of Air Circulation-Type Solar Heat-Storage System Using Ventilated Cavity of Roof

1
Faculty of Human-Environment Studies, Kyushu University, Fukuoka 819-0395, Japan
2
Graduate School of Human-Environment Studies, Kyushu University, Fukuoka 819-0395, Japan
*
Author to whom correspondence should be addressed.
Energies 2021, 14(6), 1606; https://doi.org/10.3390/en14061606
Submission received: 12 February 2021 / Revised: 10 March 2021 / Accepted: 11 March 2021 / Published: 14 March 2021

Abstract

:
Indoor solar-heating systems that use ventilated roofs have drawn attention in recent years. The effectiveness and efficiency of such air-heating systems vary depending on the design and operation methods. In Japan, by introducing outside air into a ventilated roof cavity and circulating the air indoors, systems that simultaneously obtain ventilation, solar heating, and heat-storage effects have been actively developed. The conventional systems intake a large volume of outside air to increase the solar heat collection effect. However, there is a risk of heat loss and over-drying when a large amount of cold dry air during winter is introduced. In this paper, plans are presented for improving these solar heating and heat-storage effects by preventing over-drying using indoor air circulation via ventilated cavities in the roof and indoor wall. By comparing the results of the proposed system with those of the conventional system via numerical simulation, the heating load is found to be reduced by 50% or more by circulating indoor air to the ventilated roof and storing the heat in the indoor wall. Moreover, an increased relative humidity of approximately 10% was confirmed by reducing the intrusion of the outside air and keeping the moisture indoors.

1. Introduction

The use of renewable energy is urgently needed to conserve energy use in homes. Technology using air circulation in ventilated cavities has been actively researched to directly utilize solar heat for indoor heating and hot water. Solar air heat can be effectively utilized by designing the exterior surfaces and spaces of a building and its air circulation paths. Furthermore, during the hot season, a cooling effect can be obtained by exhausting heat to the outside [1]. Depending on the design method and the researcher, solutions have taken the form of ventilated facades, trombe walls, double skins, etc., and various methods have been applied according to the climate and the building’s function.
Balocco [2] analyzed the typology of a ventilated facade in a simple steady-state situation using the finite element method. Jiru et al. [3] applied a calculation method to an application of the zonal approach to model airflow and temperature in a ventilated double-skin facade, which was confirmed to provide fast information at low computational costs. Open-joint ventilated facades have also been suggested, which provide a method of introducing air into a ventilated facade, as opposed to the conventional method of introducing air into a sealed cavity. This method creates an air cavity using an open joint by installing a metal frame on the exterior face of the wall. Via computational fluid dynamics analysis, it was revealed that the cooling load in the summer at high temperatures was more effective than the conventional air introduction method [4,5]. Moreover, Sanchez et al. [6] reported an analysis of the velocity field and turbulent structures of open-joint-ventilated facades. Full-scale ventilated roof-model tests in the laboratory were conducted to experimentally assess the thermal performance and physical phenomenon in detail [7,8,9]. Maurer et al. suggested a new detailed simulation model of solar collection [10]. Kosny et al. [11] conducted an experiment to evaluate a ventilated solar roof with photovoltaic (PV) laminates and phase-change materials (PCM). The roofing technology, a PV–PCM roof/attic, was compared with an asphalt shingle roof, and 30% heating- and 50% cooling-load reductions were confirmed. Lee et al. installed a PCM box between the air circulation paths to facilitate the maintenance of the PCM and combined it with the entire building air circulation, central air conditioning, and ventilated roof system. As a result, the energy-saving effect was approximately 30%, and the reduction effect of peak heat load compared with that of a general house structure was confirmed via radiant cooling and cooling storage during summer and solar heat collection and heat storage during winter [12,13]. Additionally, the authors have reported a novel system capable of passive dehumidification and radiative cooling during hot and humid summer months alongside solar heat collection and humidity control during cold and dry winter months using roof-ventilated cavities and indoor air circulation [14,15]. Martin-Escudero et al. [16] estimated the energy capabilities of a photovoltaic ventilated façade coupled to an air-source heat-pump system for heating and domestic hot water. They reported that the system improved the seasonal performance factor by 14.8%. Mingotti et al. [17] developed a system that provided buoyancy to induce natural ventilation by combining a horizontal room-heat source similar to floor heating and the vertical heat source of a ventilated facade in a multistory building. Using this system, ventilation was enhanced during hot seasons, and solar heat from the facade was used indoors during cold seasons. There have been many basic studies on the use of solar heat in ventilated cavities. Research on design and performance evaluation, which can be effectively applied to an actual building in combination with other architectural elements, such as floor spaces and storage methods of heat collected by solar heat, should be continued.
Recently, a technology that circulates heated air through a roof-ventilated cavity to a space under the floor and uses it for floor and indoor space heating has been developed in Japan [18]. This system simultaneously performs ventilation and floor and indoor heating during winter by heating fresh outside air in the roof-ventilated cavity and blowing the air under the floor. As an example of research on an air-heat collection type floor-heating system [19,20,21], outside air was introduced with a very large ventilation volume of 1.8–2.5 air-change per hour (ACH) when collecting solar heat during the winter. The heat in the air was stored under the floor and was then naturally exhausted. The conventional solar air-heating system with a roof-ventilated cavity had a large heat loss and could not optimize the usage and storage of solar heat. Additionally, excessive introduction of dry outside air caused the indoor air to dry during heating.
Therefore, the purpose of this study was to propose plans to improve the solar air-heating and thermal storage effects of the conventional solar heat-air collection-type heating system and to clarify the enhanced energy-saving effect and thermal environment of the proposed system. A conventional system that collects solar heat by introducing a large amount of outside air into the roof ventilation layer and collects solar heat to store it in the space under the floor is referred to as a Type N system, and one that reduces the volume of outdoor air and introduces it into a ventilated cavity is a Type A system. A Type B system is one that stores the collected solar heat in the interior wall instead of the space under the floor. A Type C system is one that combines Type A and B systems. By combining these systems, the improved temperature and humidity control effects, including those of heating-load reduction and heat-storage, are examined. The proposed system is expected to be applicable to existing houses having a roof-ventilated cavity or a conventional Type N system.

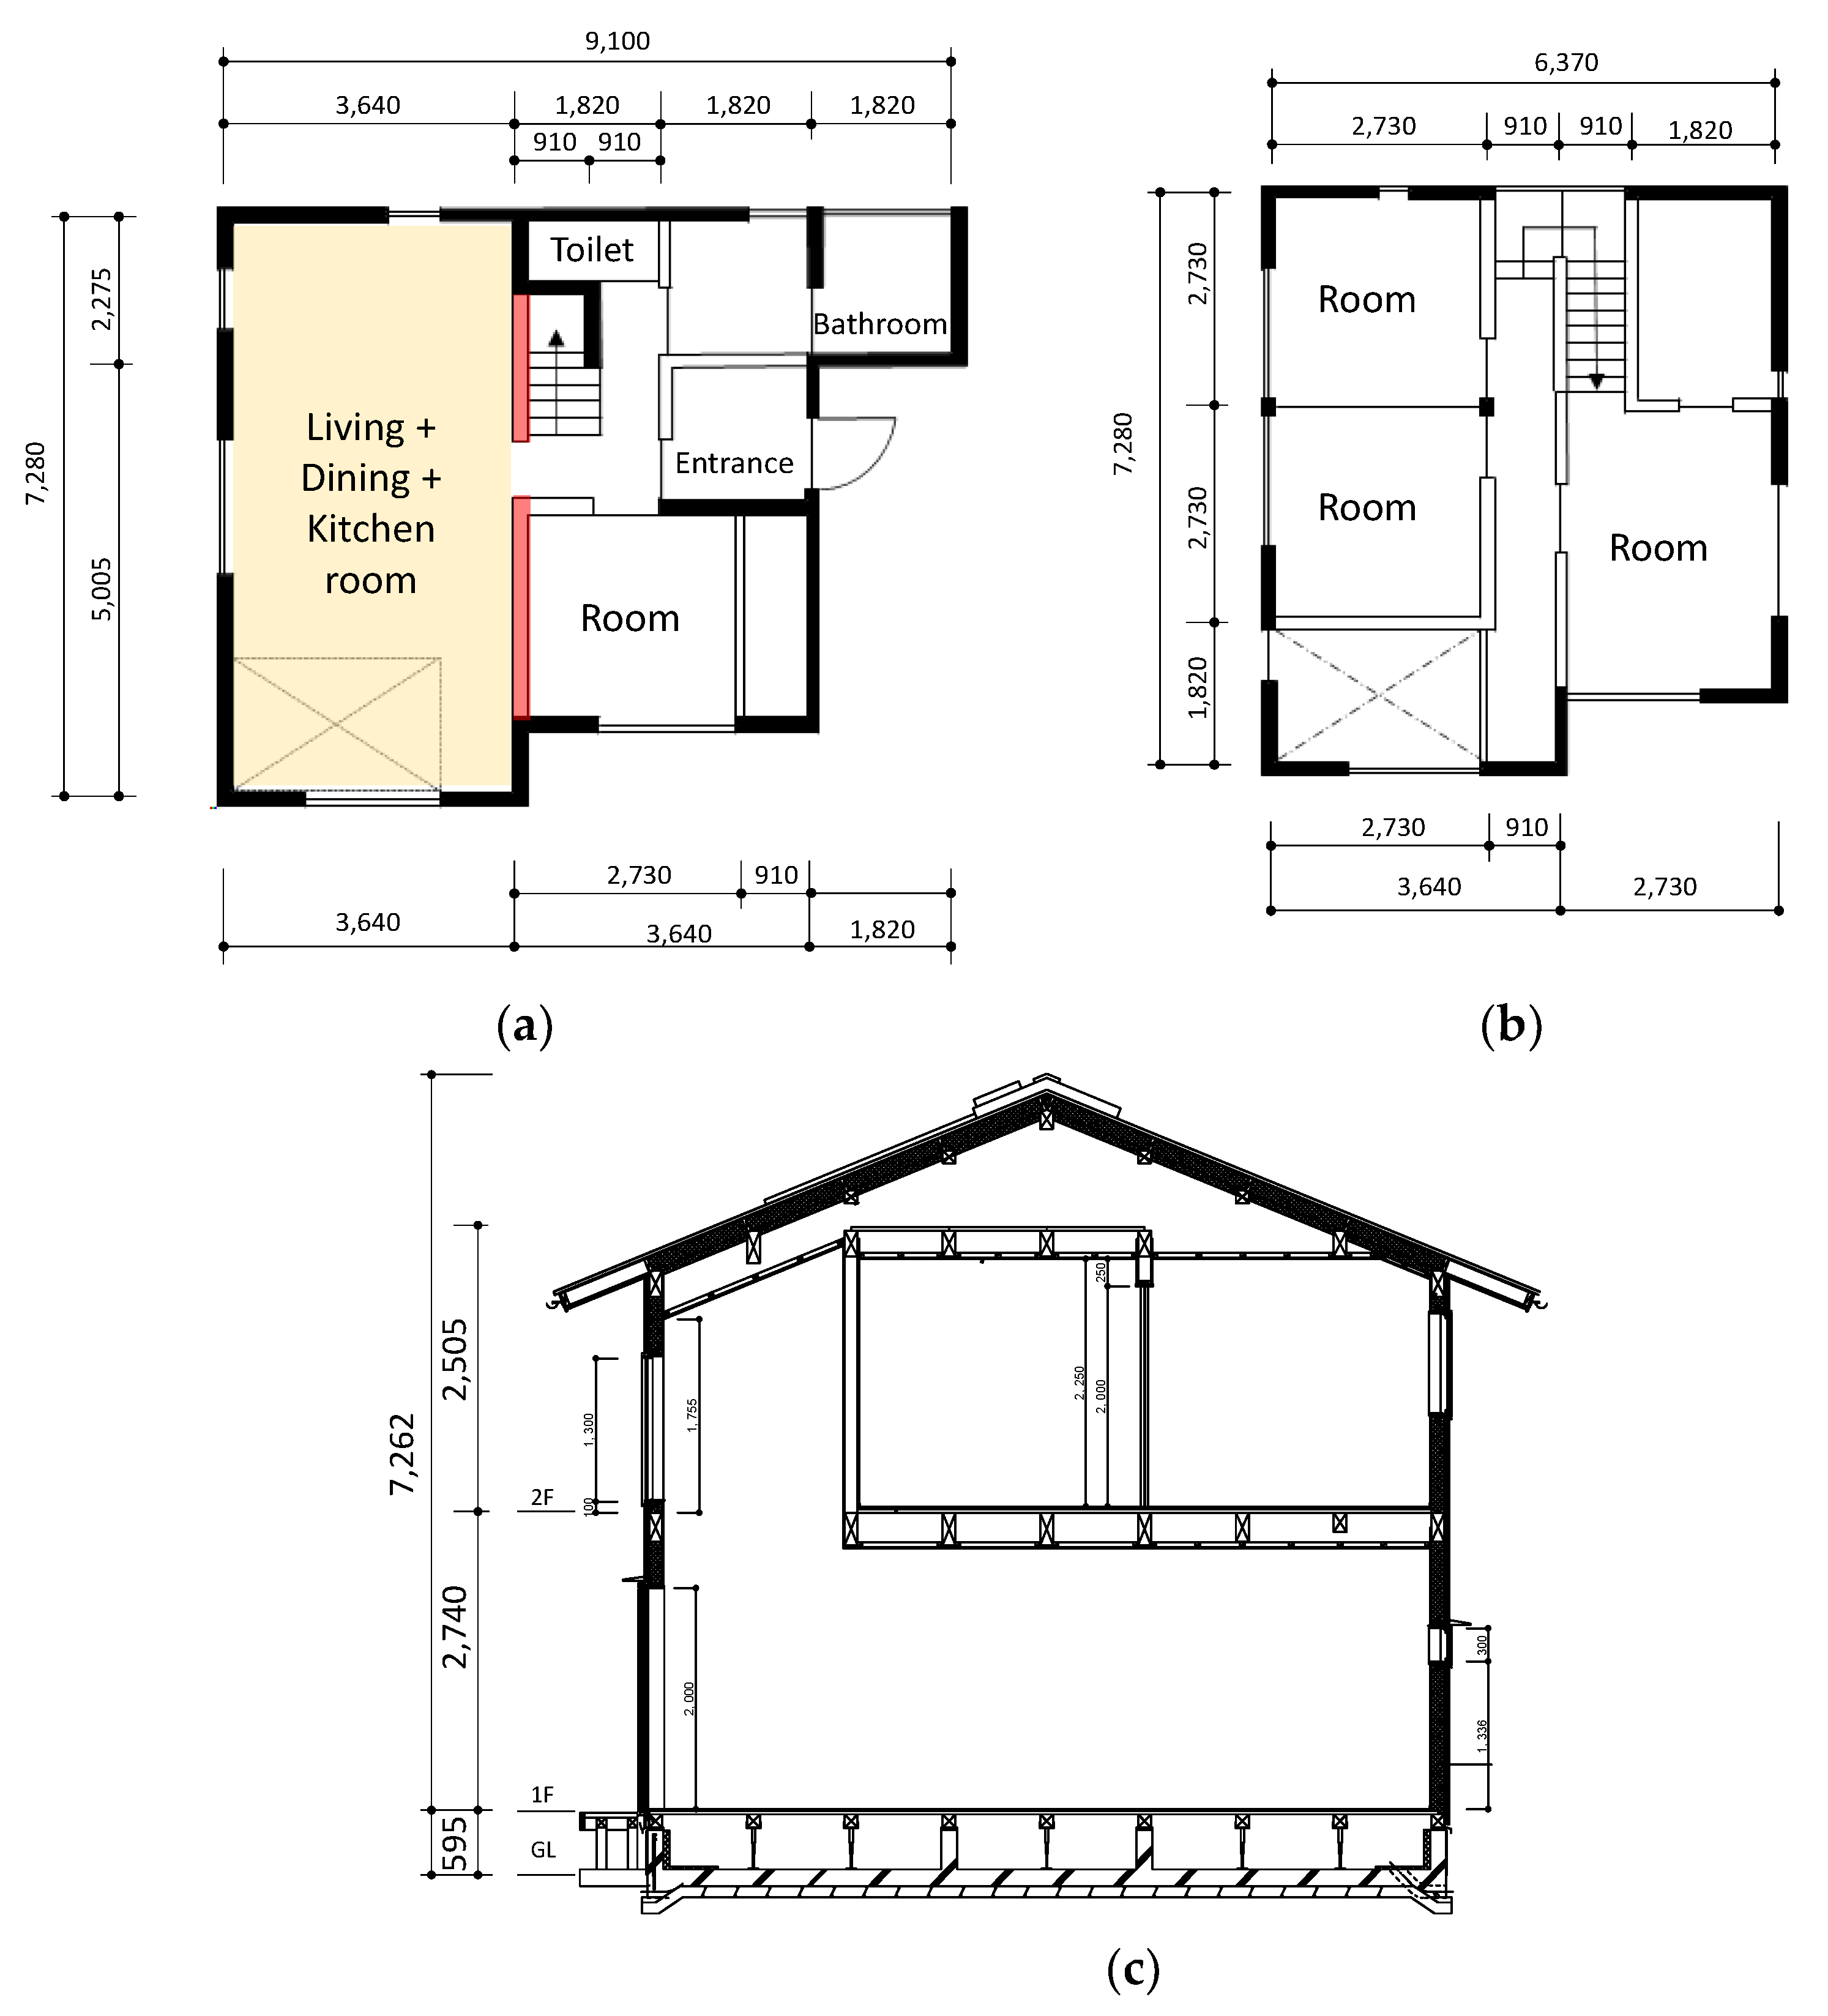
2. Overview of the System under Consideration

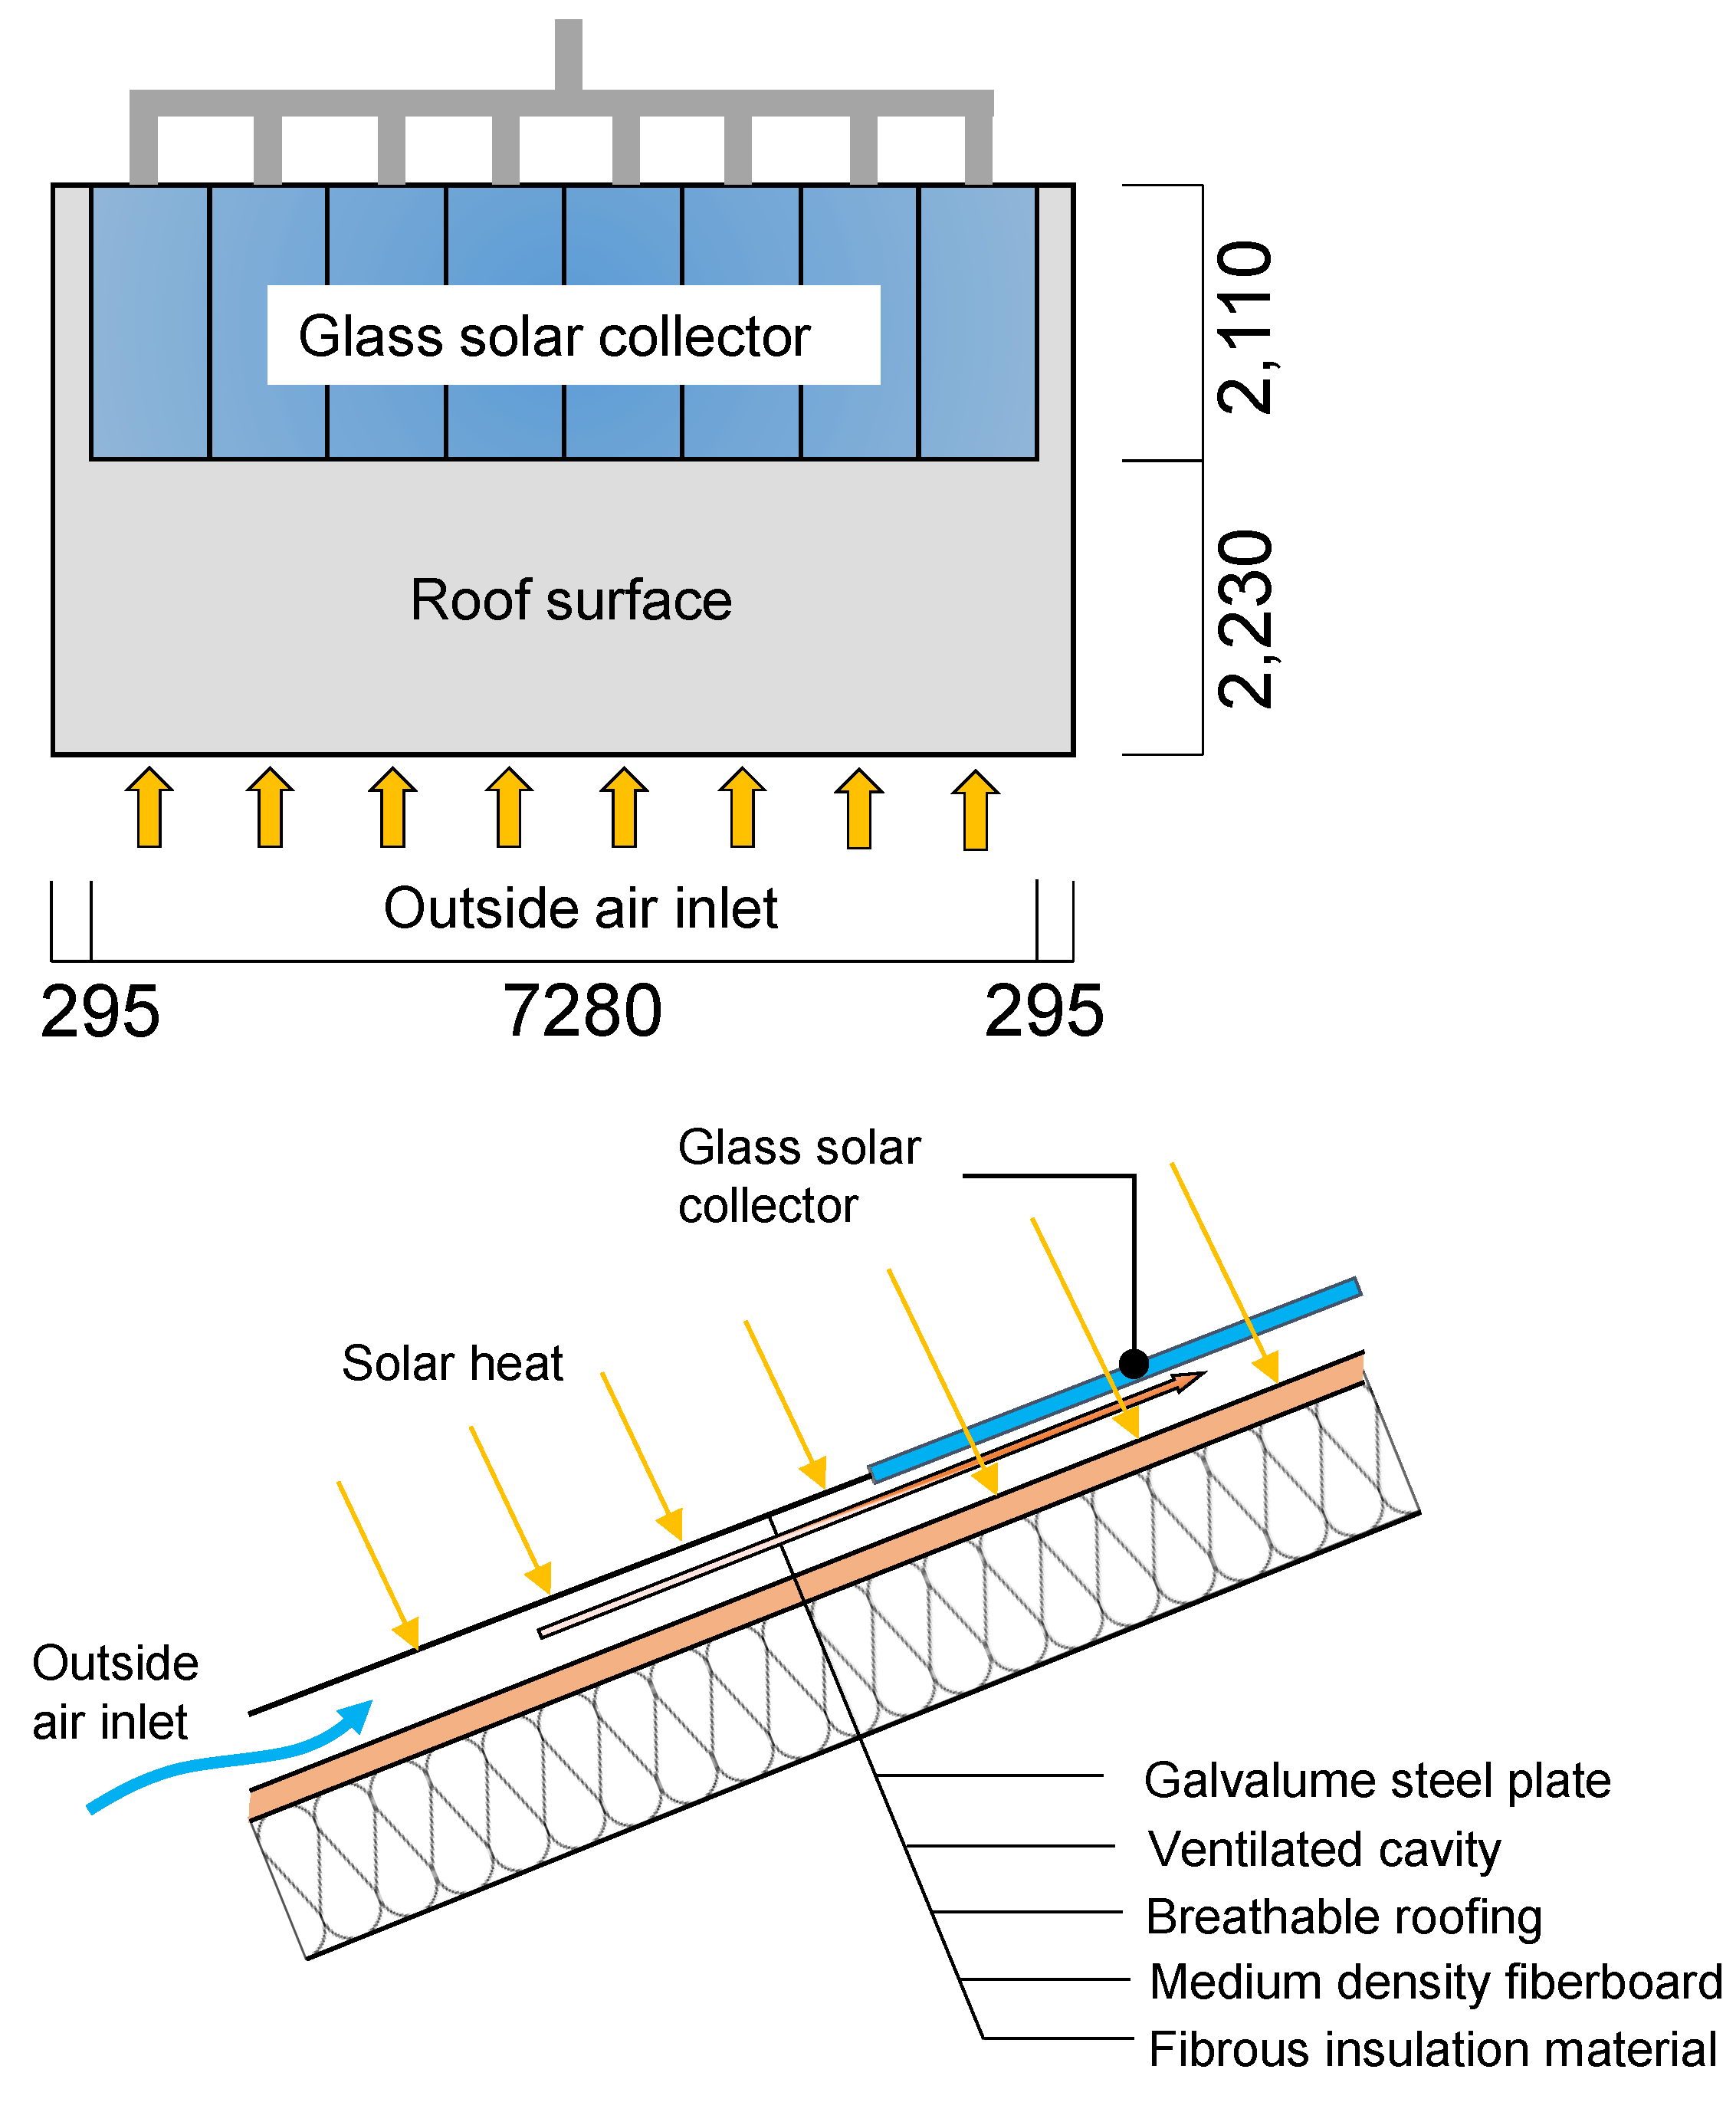
2.1. Conventional System with Glass Solar Thermal Collector

Figure 1 shows the roof composition of an installed glass solar thermal collector. First, the temperature of the ventilated roof cavity increases, because the roof’s surface, which is finished with a black steel plate, and the glass solar thermal collector are exposed to sunlight during the daytime on a sunny day. The glass solar thermal collector is a roof surface in which the ridge side is replaced with a glass heat collector panel. Hence, the outside air introduced into the ventilated cavity is warmed under the eaves. The outside air warmed in this fashion is exhausted during the summer and is blown under the floor through a duct during the winter.
Figure 2a shows the system diagram of the conventional Type N system during the daytime when collecting heat. The solar heat is collected and distributed by the air flowing through areas (1)–(6) in order. (1) When the temperature on the ridge side of the ventilated roof cavity increases above 30 ℃ during winter, ~2.5 ACH outside air is introduced from the eaves to the ventilated roof cavity. (2) The outside air is warmed by the solar heat as it passes through the ventilated roof cavity and the glass solar thermal collector. (3) The collected outside air is blown under the floor through a duct. (4) The heat is stored in the foundation concrete and floor slab. (5) The air under the floor moves into the room through a floor outlet in each. (6) The room air is then exhausted by a supply-only ventilation system. Steps (1)–(6) reflect the daytime airflow for a Type N system.
Figure 2b shows a Type N nighttime (non-heat-collection) system diagram. At night, the air flows in the order of (1) to (4). (1) Indoor air is taken into the attic space through the return duct. (2) This air is blown under the floor through the duct. (3) The indoor air receives the heat stored under the floor from the daytime collection. (4) The air that receives heat from under the floor returns to the room through the floor outlet. At night, to secure the required ventilation volume, 0.5-ACH air is moved by exhaust-only ventilation.

2.2. Improvement Plan 1: Type A (Indoor Air Intake)

Figure 3 shows the Type A (indoor air intake) system diagram. The volume of outside air introduced into the roof ventilation layer in (1) is suppressed to 0.5 ACH, the required ventilation amount. (1′) the remaining ~2-ACH ventilation air enables an increase in the amount of heat storage by increasing the collected heat, owing to the introduction of indoor air into the roof ventilation layer. Additionally, the nighttime operation of the Type A system uses the heat stored from the daytime as with the Type N system.

2.3. Improvement Plan 2: Type B (Heat Storage Wall + Indoor Ventilation)

Figure 4a shows a daytime system diagram of the Type B (heat storage wall + indoor ventilation) system. With Type B, steps (3)–(5) are changed from Type N. With Type N, the heat collection air is blown under the floor for storage. However, in Type B (3), the heat collection air is blown to the ventilated cavity in the indoor heat-storage wall (4). Table 1 summarizes the thermal properties of the normal wall (indoor Type N wall, plasterboard) and the indoor thermal storage wall (indoor Types-B and -C wall, concrete). (5) The air is then blown directly into the room from the outlet opened at the bottom of the wall. This system aims to prevent the collected heat from being lost under the floor while directly using the radiant heat from the heat-storage wall.
Figure 4b shows a nighttime system diagram of the Type B system. At night, as with Type N systems, indoor air is first taken into the attic space through the return duct. Then, (3) the indoor air receives the heat stored in the indoor heat-storage wall from the daytime heat collection operation, and (4) the air is returned to the room.

2.4. Improvement Plan 3: Type C (Type A + Type B)

Figure 5a shows the Type C system diagram during the daytime, and Figure 5b shows the system diagram of Type C during the nighttime. Type C is a combination of Type A and Type B, and additional energy-saving effects can be expected by taking indoor air into the ventilated roof cavity and using the indoor heat-storage wall.

3. Simulation Accuracy Verification

Temperature and relative humidity of houses installed with Type N systems operated in Fukuoka City, Japan, were measured. The housing model for the numerical analysis was based on an example of a real house with a Type N system installed. The accuracy of the simulation was verified by comparing it with measured values. The numerical simulation was conducted using the temperature, humidity, and heat-load prediction software, THERB for HAM [22]. Figure 6 shows the floor plan of the reviewed house, which is a two-story wooden home located in Fukuoka, Japan. Table 2 and Table 3 summarize the overview and building envelope information of the reviewed house. Table 4 summarizes the simulation conditions. To verify the accuracy of the simulation compared with the measured values, the 2020 Fukuoka meteorological data provided by the Japan Meteorological Agency were used, and standard year (2001–2010) data were used for numerical analysis using the simulation presented in the next section. The amount of heat and moisture generated indoors is based on Japanese energy-saving standards [23]. Figure 7 shows the results of the comparison of the simulated values with the measured temperature and humidity values of the living room (living + dining + kitchen room). The measured values were expressed at 1 h intervals using a circle mark. Because the field measurement was conducted with residents living in the homes, the various ventilation preferences and living schedules caused slight differences in measurements. However, the simulated values agreed sufficiently for numerical analyses. In those, only the spaces in which the air circulation path could be clearly grasped were assumed to be the indoor room volume: under-floor space, 1st floor, and open ceiling space of the 1st and 2nd floors.

4. Simulation Results

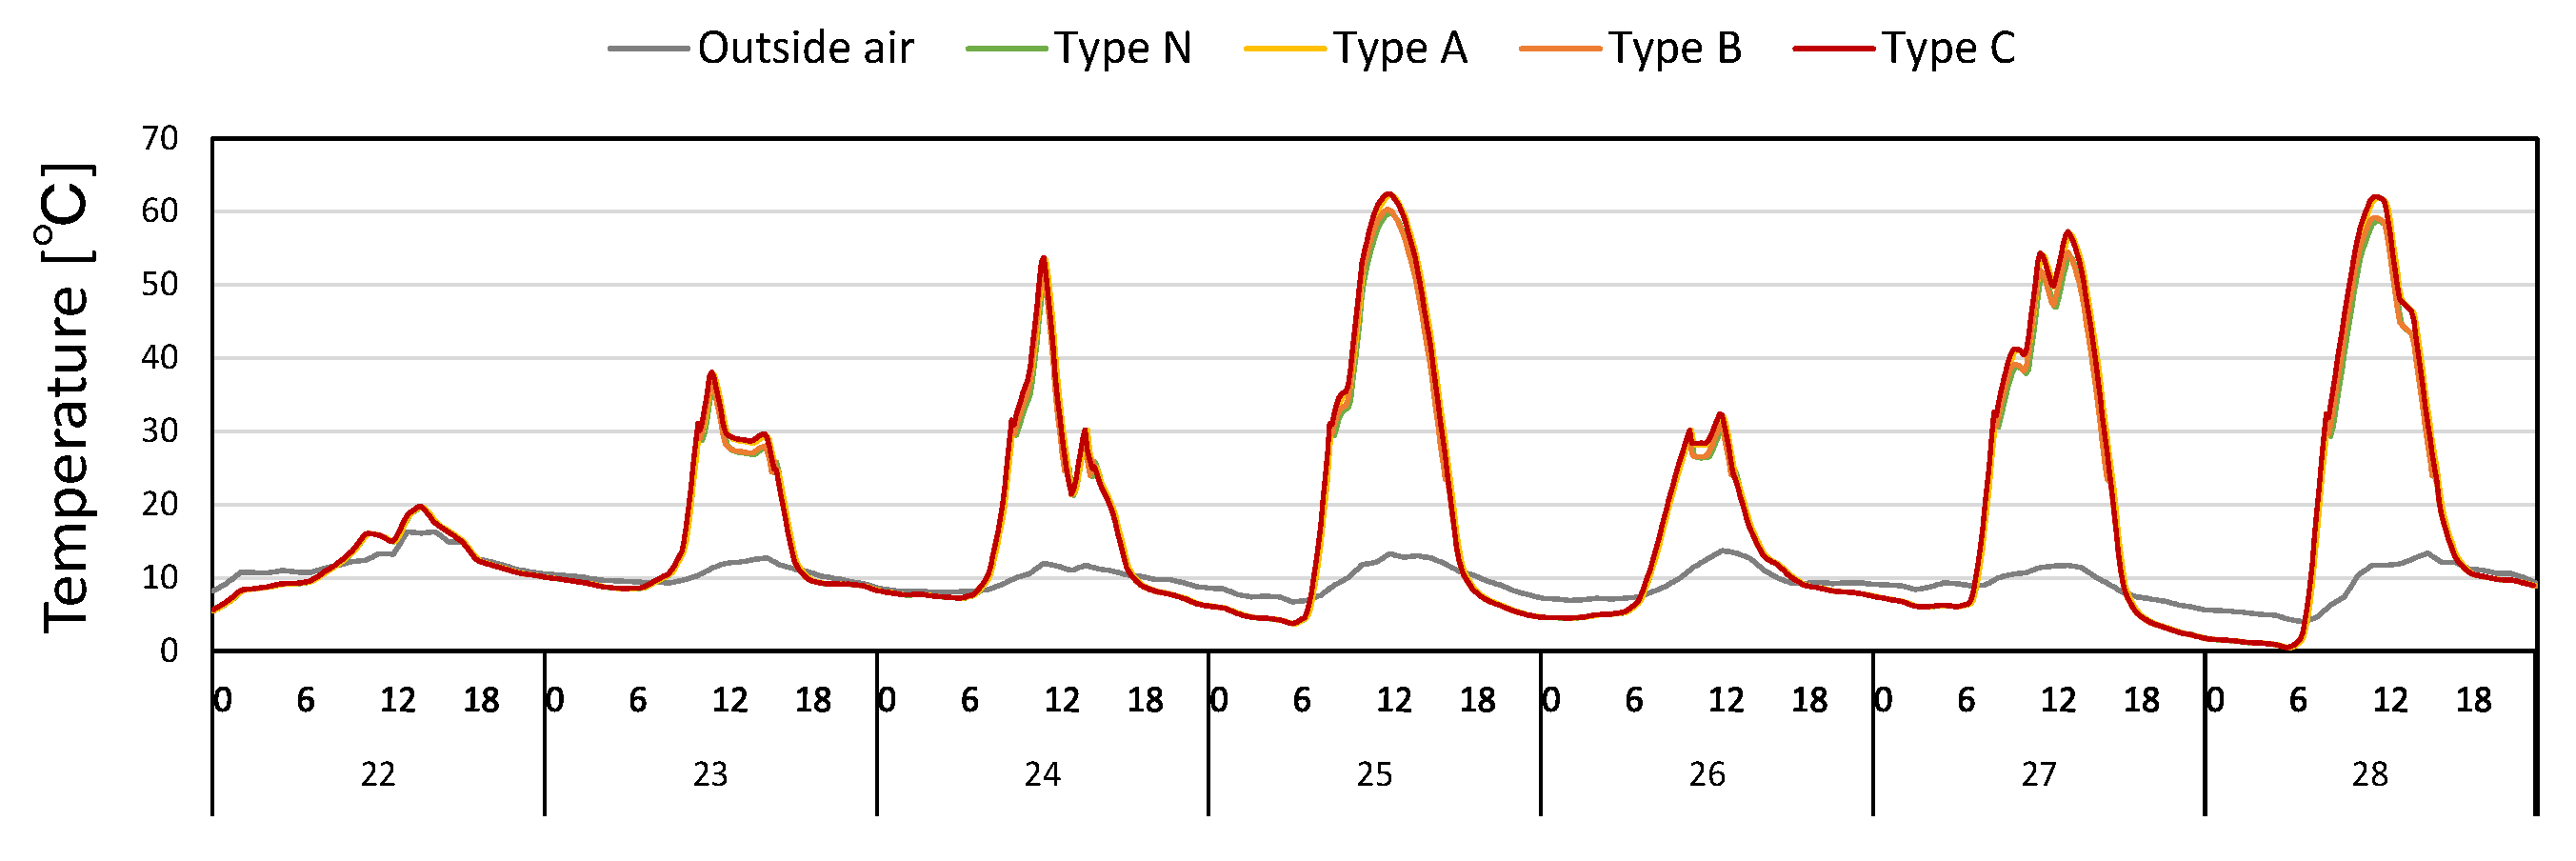
4.1. Comparison of Roof Ventilation Layer and Room Temperature

Figure 8 and Figure 9 present graphs that compare the ventilated roof cavity and living-room air temperatures of Types A, B, and C with those of Type N. The Expended AMeDAS weather data of Fukuoka (standard year) were used. In Type C systems, which are more effective than Type N, the ventilated cavity temperature increased by ~2.0–4.1 ℃, and the room temperature increased by ~1.0–3.6 ℃. Additionally, in February, as shown in Figure 10, it was found that the heat-load reduction was the highest with Type C, and it was possible to reduce the load by ~54% compared with Type N.

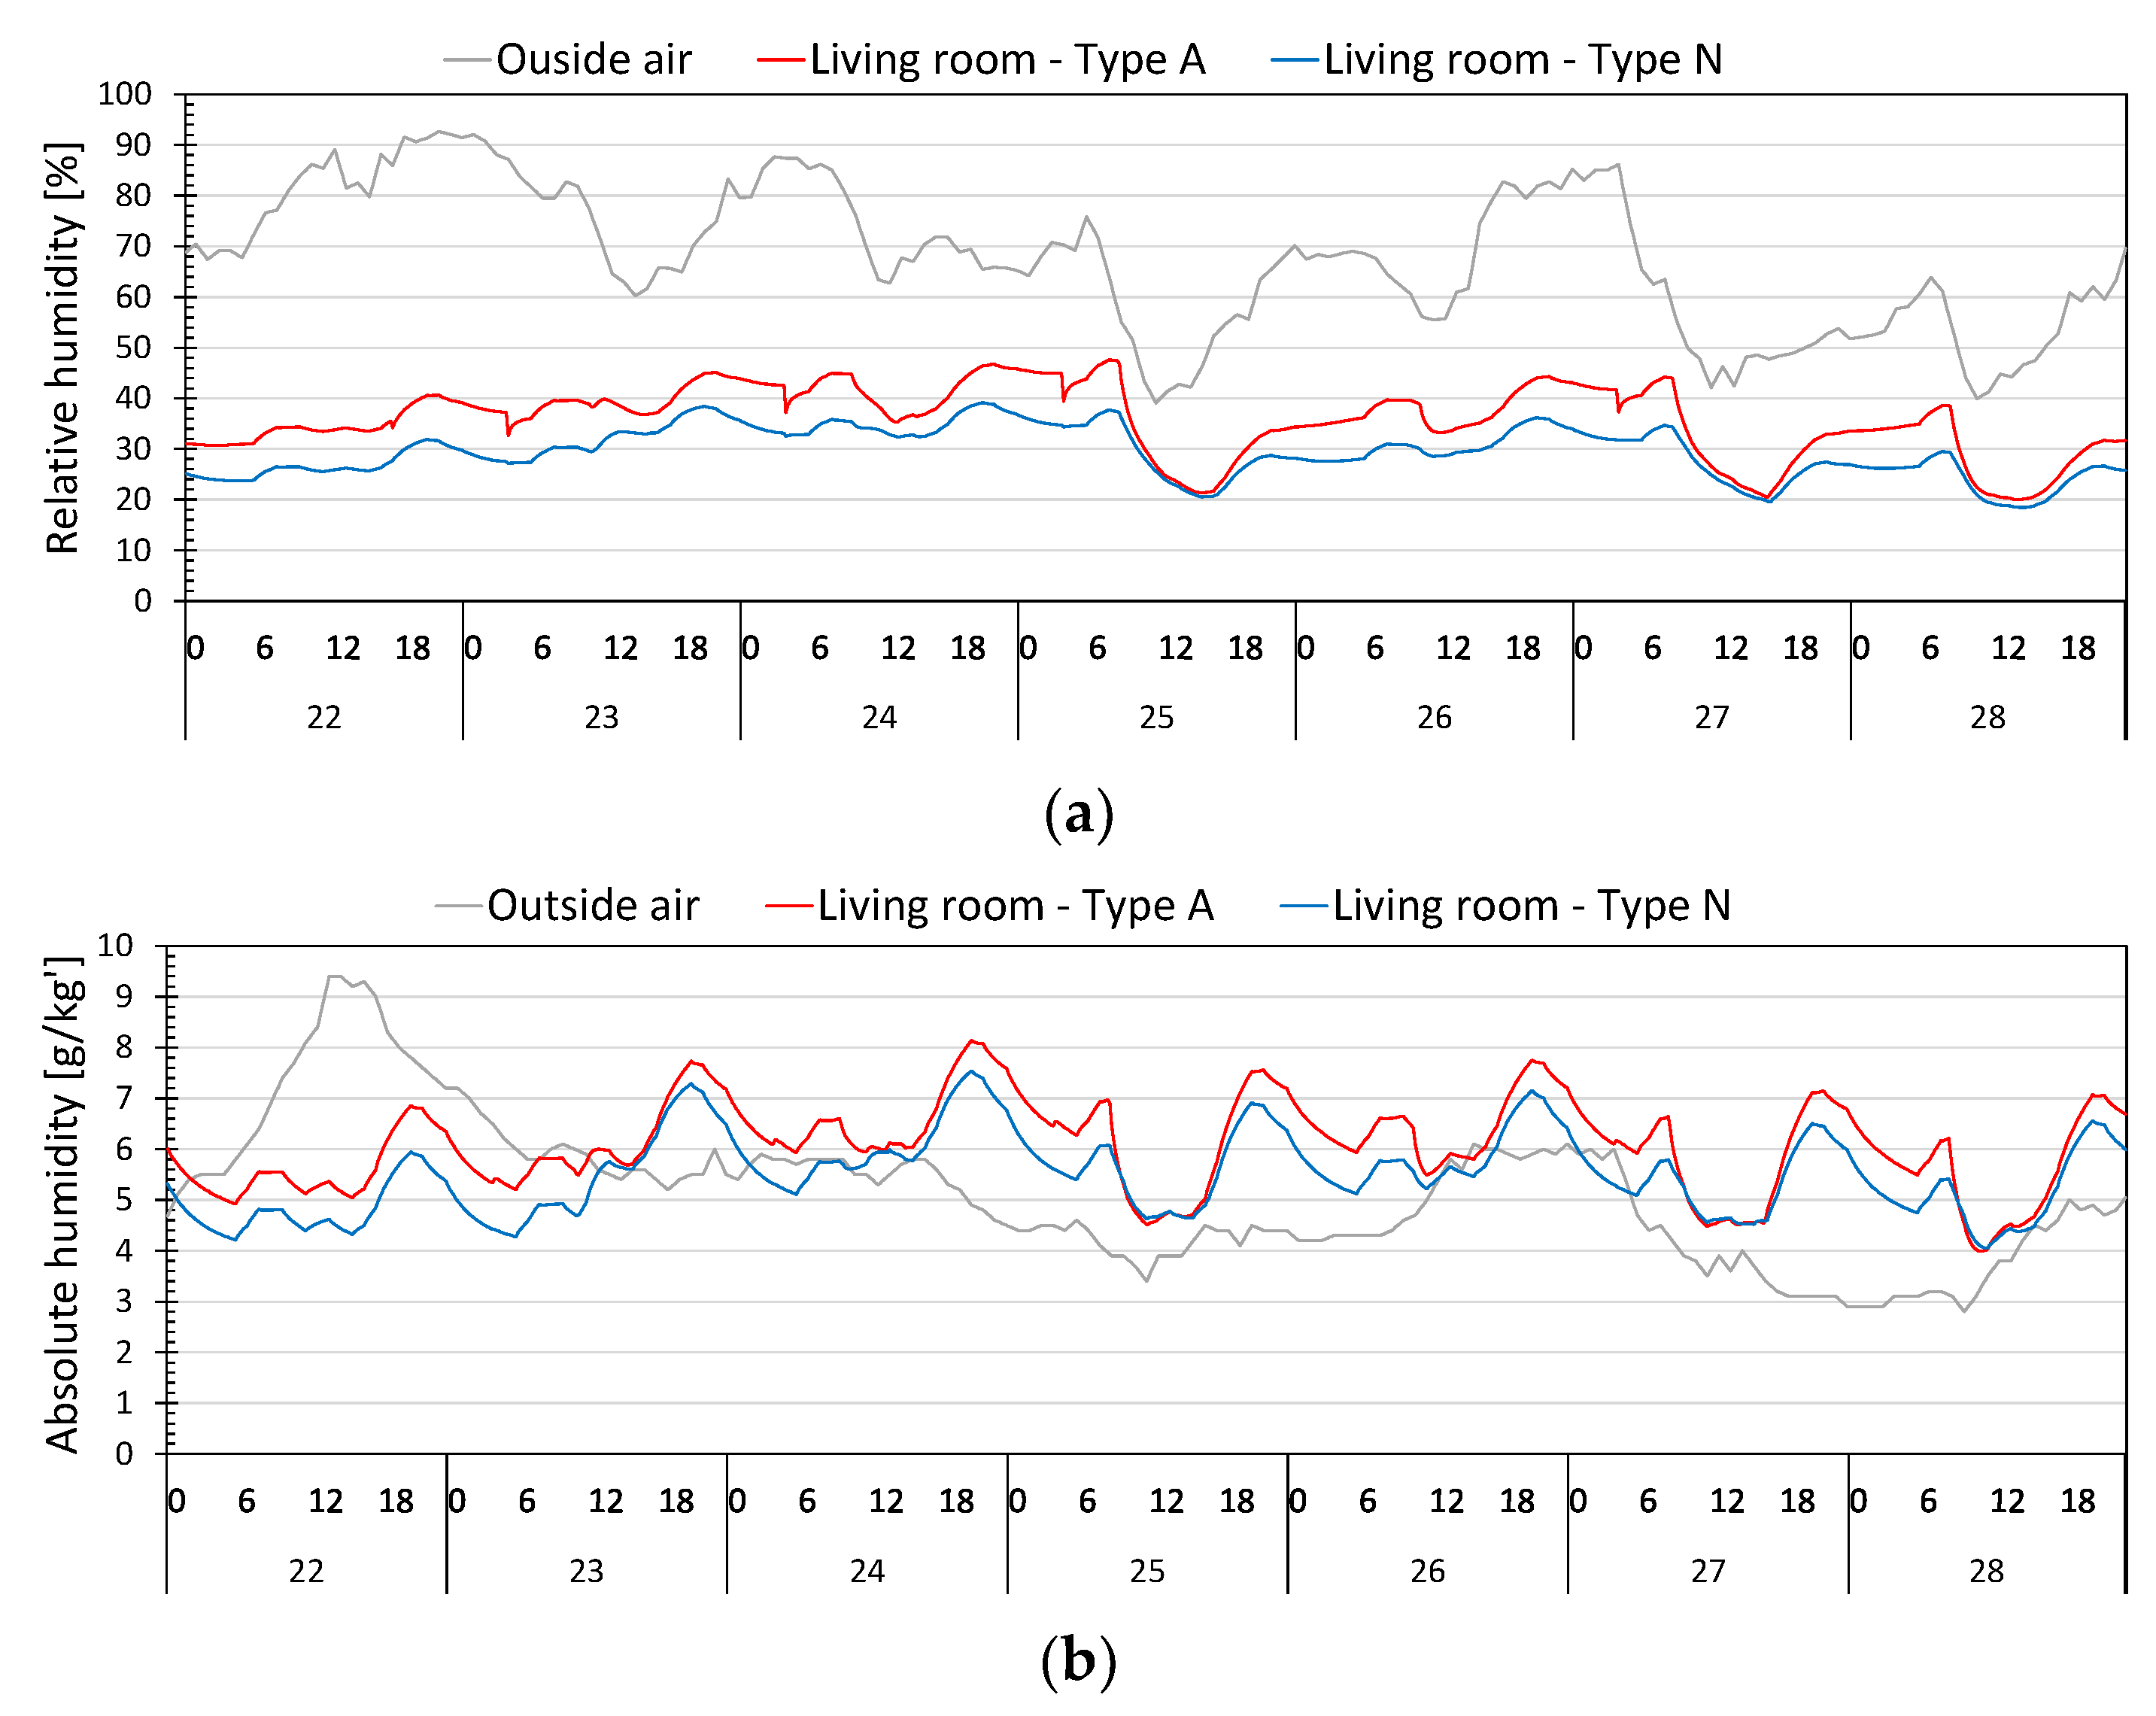
4.2. Examination of Overdrying Prevention Effect

Figure 11 shows the relative and absolute humidity of Type N and A living rooms. The amount of moisture generated indoors is reflected using energy-saving standards [20]. Compared with Type N, Type A, which circulates indoor air through the ventilated roof cavity, increased the absolute humidity by approximately 1 g/kg′ and the relative humidity by about 10%. Japan’s winter months are cold and dry. Thus, the absolute humidity of the outside air is low. Reducing the amount of dry outside air introduced to circulate indoors enables the control of the indoor humidity by recovering the moisture generated in the room during the cold and dry seasons.

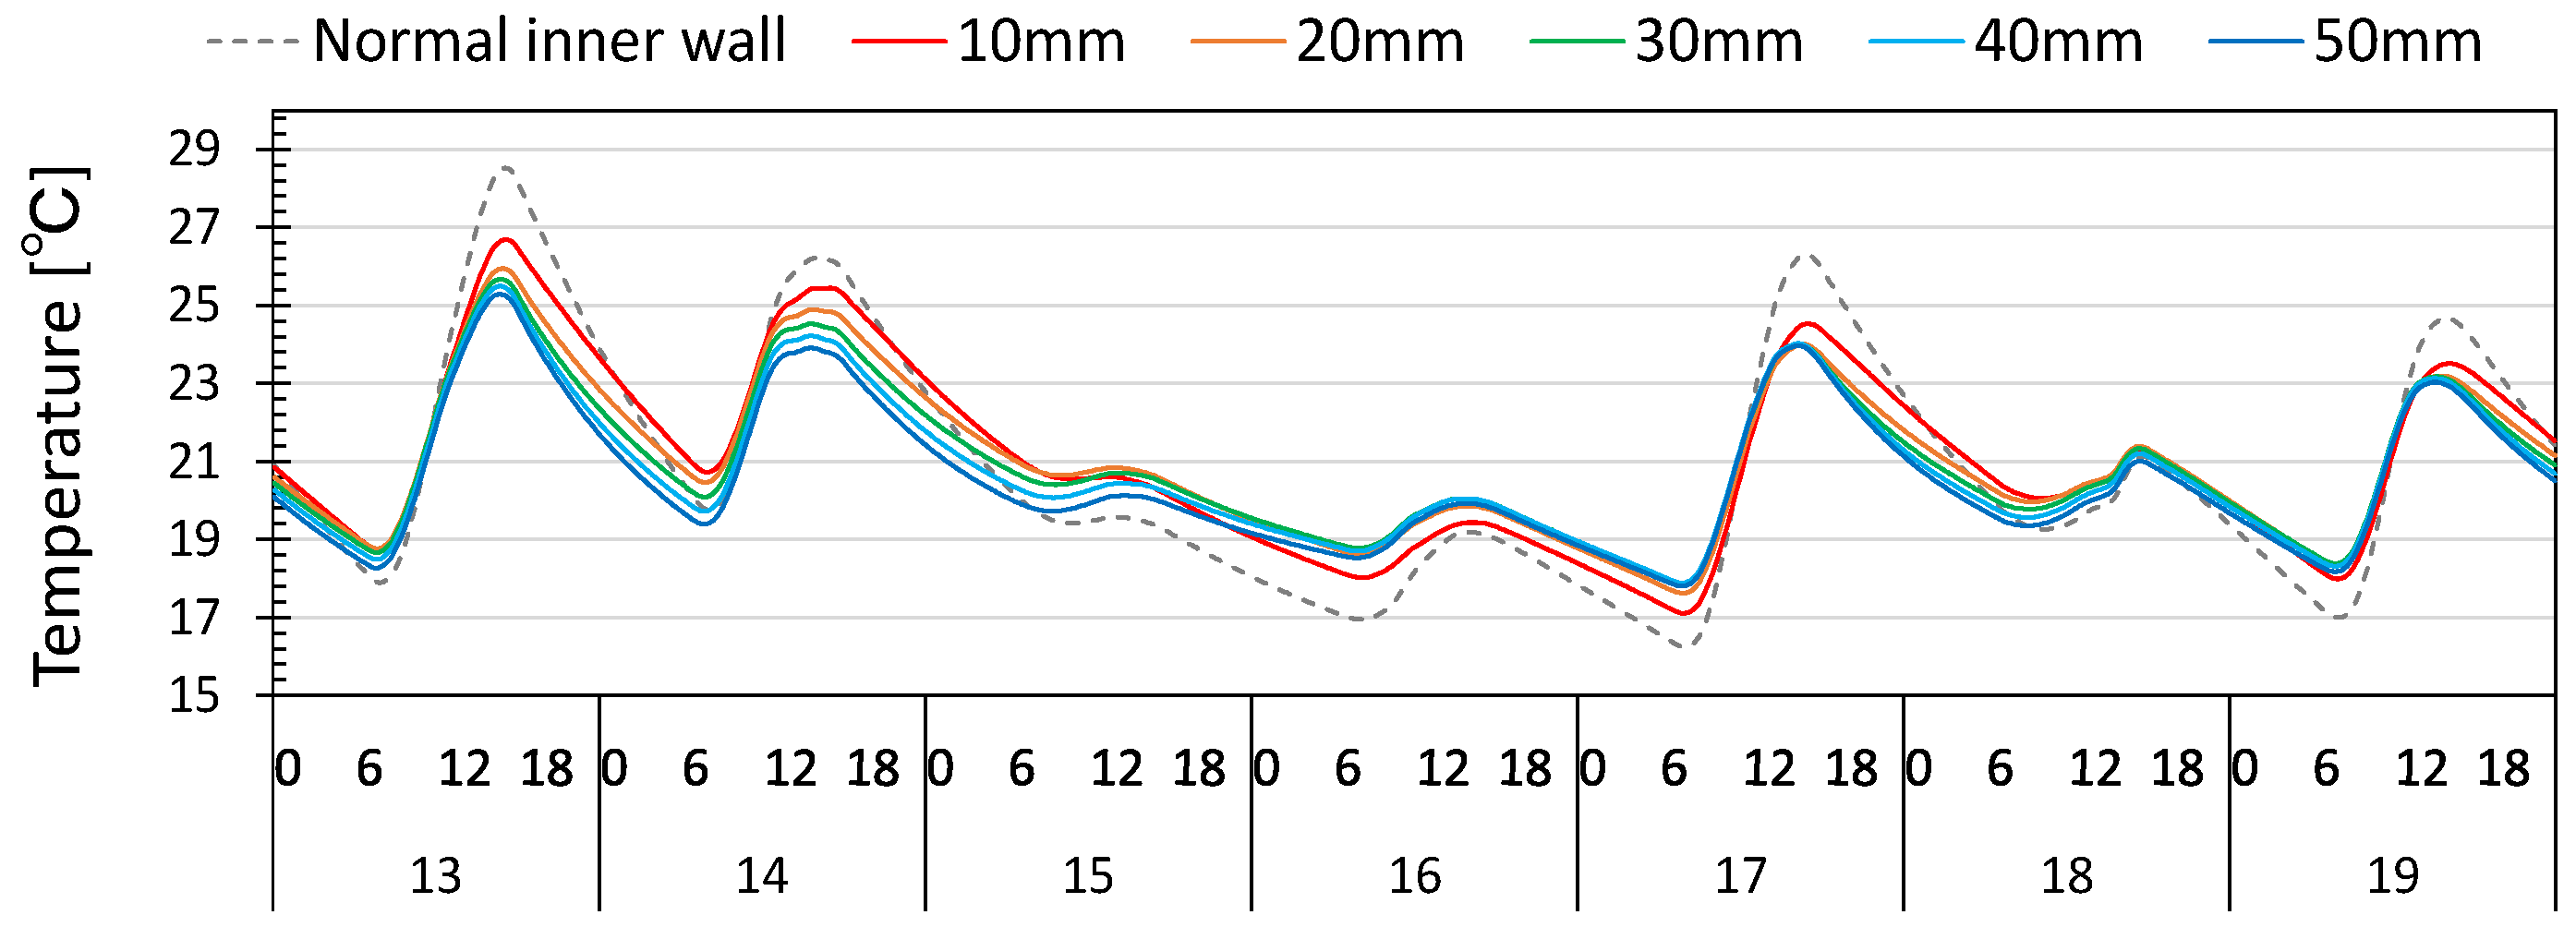
4.3. Difference Caused by the Thickness of the Heat-Storage Wall

Figure 12 shows the room-side surface temperature of the heat-storage wall when its thickness is changed within the range of 10–50 mm, and Figure 13 shows the difference in heating load (22 ℃ for 24 h). The internal temperature of the Type N interior wall is expressed as the normal inner wall. It was found that the thicker the wall, the higher the heat storage effect up to a thickness of 25 mm. However, if it is too thick, the temperature of the wall will not easily increase; the heat load may instead increase.

4.4. Difference Caused by the Thickness of the Heat-Storage Wall

According to Japan’s Energy-saving standard-area classification, Japan is divided into eight areas based on the demand for insulation performance. The colder the area, the lower the number. Additionally, the areas are classified according to the amount of insolation from the Heating-period solar radiation area classification (H category). The higher the number, the higher the solar radiation. Among the regions in areas 1–7 of the energy-saving standard-area classification, regions belonging to the same regional classification but also belonging to a different heating-period solar radiation area classification (H1–H3) were selected as the target areas for the numerical analysis.
Figure 14 shows the difference in heating load (22 ℃ for 24 h) depending on the area. Even in areas having the same energy conservation standards, the amount of load reduction was greater in areas having more solar radiation. It was confirmed quantitatively that the sensible heat-load reduction effect of this system increased in areas enjoying more solar radiation.

5. Conclusions

We proposed an improvement plan for the effects of solar heat collection and storage of the Type N floor-heating system. The simulation accuracy was confirmed using field-measurement values, and a numerical analysis was conducted to examine the improved effects of the improved system. When utilizing solar heat by introducing outside air into a ventilated roof, ventilation and heating effects were obtained simultaneously, but the heat collection decreased as the flow rate increased during cold and dry winters. Additionally, the heat-storage effect was reduced via heat loss when the air was blown into the space under the floor to store heat. An increase in the amount of dry outside-air intake was shown to create an overdried indoor environment during heating. Therefore, in the proposed plan, the introduction of outside air was limited to a standard ventilation volume of 0.5 ACH, and indoor air was circulated to the ventilated roof. Furthermore, the collected heat was stored in the ventilated cavity of the indoor wall, thereby increasing the amount of solar heat collected and heat stored by reducing heat loss. Moreover, the indoor humidity was increased by minimizing the introduction of dry outdoor air and keeping the moisture that was generated indoors.
As a result, the room temperature was increased by 3.6 ℃, and the relative humidity of the room was increased by approximately 10% compared with that of the conventional Type N. Furthermore, it was found that in the southern area (Area 7), having very high amounts of solar radiation (H-3), it was possible to reduce the load on Type C systems by ~80% compared with that of Type N. Because the installation costs depend on the contractor’s skill, as reported in our previous paper [11,14] regarding the construction case of introducing indoor air instead of outside air into the roof’s ventilated cavity, it is judged that there will be no significant difference in installation cost provided the installer has the required technical skill. The difference in electricity bill related to power consumption will vary depending on the specifications of the air conditioner and the characteristics of the equipment; however, it will be similar to the reduction ratio of the heat load between the proposed and conventional systems.
In this study, a simulation model was verified using the measured values. However, to better clarify the effect of the proposed system, it is necessary to also perform an experimental review by actually measuring a house in which a conventional system is installed and another in which the proposed system is installed under the same conditions. It is also necessary to examine the clear differences according to the amount of heat and moisture in the room, as well as to measure the temperature and humidity of the ventilated cavity in the roof and interior walls, which include the paths for air circulation and the indoor air.

Author Contributions

All authors contributed equally to all parts of the report. All authors have read and agreed to the published version of the manuscript.

Funding

This study was supported by JSPS KAKENHI (grant number JP19J11417).

Conflicts of Interest

The authors declare no conflict of interest.

References

  1. Ibañez-Puy, M.; Vidaurre-Arbizu, M.; Sacristán-Fernández, J.A.; Martín-Gómez, C. Opaque Ventilated Façades: Thermal and energy performance review. Renew. Sustain. Energy Rev. 2017, 79, 180–191. [Google Scholar] [CrossRef]
  2. Balocco, C. A simple model to study ventilated facades energy performance. Energy Build. 2002, 34, 469–475. [Google Scholar] [CrossRef]
  3. Jiru, T.E.; Haghighat, F. Modeling ventilated double skin façade-A zonal approach. Energy Build. 2008, 40, 1567–1576. [Google Scholar] [CrossRef]
  4. Sanjuan, C.; Suárez, M.J.; González, M.; Pistono, J.; Blanco, E. Energy performance of an open-joint ventilated façade compared with a conventional sealed cavity façade. Sol. Energy 2011, 85, 1851–1863. [Google Scholar] [CrossRef]
  5. Suárez, M.J.; Sanjuan, C.; Gutiérrez, A.J.; Pistono, J.; Blanco, E. Energy evaluation of an horizontal open joint ventilated faade. Appl. Therm. Eng. 2012, 37, 302–313. [Google Scholar] [CrossRef]
  6. Sánchez, M.N.; Sanjuan, C.; Suárez, M.J.; Heras, M.R. Experimental assessment of the performance of open joint ventilated façades with buoyancy-driven airflow. Sol. Energy 2013, 91, 131–144. [Google Scholar] [CrossRef]
  7. Susanti, L.; Homma, H.; Matsumoto, H.; Suzuki, Y.; Shimizu, M. A laboratory experiment on natural ventilation through a roof cavity for reduction of solar heat gain. Energy Build. 2008, 40, 2196–2206. [Google Scholar] [CrossRef]
  8. Bunkholt, N.S.; Säwén, T.; Stockhaus, M.; Kvande, T.; Gullbrekken, L.; Wahlgren, P.; Lohne, J. Experimental study of thermal buoyancy in the cavity of ventilated roofs. Buildings 2020, 10, 8. [Google Scholar] [CrossRef] [Green Version]
  9. Lee, S.; Park, S.H.; Yeo, M.S.; Kim, K.W. An experimental study on airflow in the cavity of a ventilated roof. Build. Environ. 2009, 44, 1431–1439. [Google Scholar] [CrossRef]
  10. Maurer, C.; Baumann, T.; Hermann, M.; Di Lauro, P.; Pavan, S.; Michel, L.; Kuhn, T.E. Heating and cooling in high-rise buildings using facade-integrated transparent solar thermal collector systems. J. Build. Perform. Simul. 2013, 6, 449–457. [Google Scholar] [CrossRef]
  11. KoŚny, J.; Biswas, K.; Miller, W.; Kriner, S. Field thermal performance of naturally ventilated solar roof with PCM heat sink. Sol. Energy 2012, 86, 2504–2514. [Google Scholar] [CrossRef]
  12. Lee, H.; Ozaki, A.; Lee, M. Energy saving effect of air circulation heat storage system using natural energy. Build. Environ. 2017, 124, 104–117. [Google Scholar] [CrossRef]
  13. Lee, H.; Ozaki, A. Sensitivity analysis for optimization of renewable-energy-based air-circulation-type temperature-control system. Appl. Energy 2018, 230, 317–329. [Google Scholar] [CrossRef]
  14. Lee, H.; Ozaki, A.; Lee, M.; Cho, W. A fundamental study of intelligent building envelope systems capable of passive dehumidification and solar heat collection utilizing renewable energy. Energy Build. 2019, 195, 139–148. [Google Scholar] [CrossRef]
  15. Lee, H.; Ozaki, A. Housing design methodology for passive hygrothermal control and effect verification via field measurements. Build. Environ. 2020, 185, 107241. [Google Scholar] [CrossRef]
  16. Martin-Escudero, K.; Salazar-Herran, E.; Campos-Celador, A.; Diarce-Belloso, G.; Gomez-Arriaran, I. Solar energy system for heating and domestic hot water supply by means of a heat pump coupled to a photovoltaic ventilated façade. Sol. Energy 2019, 183, 453–462. [Google Scholar] [CrossRef]
  17. Mingotti, N.; Chenvidyakarn, T.; Woods, A.W. The fluid mechanics of the natural ventilation of a narrow-cavity double-skin facade. Build. Environ. 2011, 46, 807–823. [Google Scholar] [CrossRef]
  18. Okumura, A. The present and future OM solar system. PLEA 1997, 1, 69–74. [Google Scholar]
  19. Kuwasawa, Y.; Akamine, Y.; Mae, M.; Nakamura, S.; Roh, H. Study on Energy Saving Effect of Air-Based Solar Heating System Part 1 Outline of Field-Survey and Measurement Results in Summer and Winter. Soc. Heat. Air-Cond. Sanit. Eng. Jpn. 2010, 2063–2066. (In Japanese) [Google Scholar] [CrossRef]
  20. Choi, Y.; Takase, K.; Mae, M. System performance of a residential building using the air-based solar heating system. Sol. Energy 2018, 171, 47–63. [Google Scholar] [CrossRef]
  21. Choi, Y.; Mae, M.; Bae Kim, H. Thermal performance improvement method for air-based solar heating systems. Sol. Energy 2019, 186, 277–290. [Google Scholar] [CrossRef]
  22. Ozaki, A.; Tsujimaru, T. Prediction of hygrothermal environment of buildings based upon combined simulation of heat and moisture transfer and airflow. IBPSA 2005—Int. Build. Perform. Simul. Assoc 2005, 899–906. [Google Scholar]
  23. Calculation Conditions of the Housing Scenario for Energy Saving. Available online: http://www.heat20.jp/grade/manu_rev2.pdf (accessed on 1 February 2021). (In Japanese).
Figure 1. Roof composition with ventilated cavity and glass solar thermal collector (unit: mm).
Energies 14 01606 g001
Figure 2. Air circulation route of Type N: (a) heat collection operation during daytime; (b) heat release during nighttime.
Energies 14 01606 g002
Figure 3. Air circulation route of Type A: (a) heat collection operation during daytime; (b) heat release during nighttime.
Energies 14 01606 g003
Figure 4. Air circulation route of Type B: (a) heat collection operation during daytime; (b) heat release during nighttime.
Energies 14 01606 g004
Figure 5. Air circulation route of Type C: (a) heat collection operation during daytime; (b) heat release during nighttime.
Energies 14 01606 g005
Figure 6. Plans and sections of reviewed house (unit: mm): (a) first-floor plan; (b) second-floor plan; red squares indicate the indoor wall where the heat storage wall is to be considered for Types B and C. In this paper, “Living + Dining + Kitchen room” refers to the Living room (yellow square, room volume: 63.53 m3); (c) schematic cross-section.
Energies 14 01606 g006
Figure 7. Comparison of measured value and simulated value: (a) temperature; (b) relative humidity; (c) absolute humidity.
Energies 14 01606 g007
Figure 8. Comparison of ventilated roof-cavity temperature between Types N and A (February).
Energies 14 01606 g008
Figure 9. Comparison of living-room temperature by each type (February).
Energies 14 01606 g009
Figure 10. Comparison of sensible heat load by type (living room, February).
Energies 14 01606 g010
Figure 11. Over-drying prevention effect: (a) relative humidity; (b) absolute humidity (February).
Energies 14 01606 g011
Figure 12. Influence of heat-storage wall thickness on room temperature (February).
Energies 14 01606 g012
Figure 13. Effect of heat-storage wall thickness on heat load (living room, February).
Energies 14 01606 g013
Figure 14. Regional heating load (living room, February).
Energies 14 01606 g014
Table 1. Thermal properties of normal indoor wall (Type N) and indoor heat-storage wall (Types B and C).
Normal Wall (Type N)Heat-Storage Wall
(Types B and C)
Thickness [mm]1220
Conductivity
[W/m K]
0.1051.2
Specific heat
[J/kg K]
1880840
Specific weight [kg/m3]7242220
Moisture conductivity
[kg/m∙s∙Pa]
7.610 × 10−127.610 × 10¹²
Moisture capacity
[kg/m3(kJ/kg)]
1.910 × 10−21.905 × 102
Table 2. Overview of the reviewed house.
Overview
Target areaFukuoka, Japan
Total floor area [m2]92.82
StructureWooden construction
Year of completion2018
Family structure [people]four people
Table 3. Building envelope overview of the reviewed house (the top is the outdoor side; the bottom is the indoor side).
Building Envelope OverviewRoof Overview
Siding (14 mm)Galvalume steel plate (0.4 mm)
Ventilated cavity (21 mm)Ventilated cavity (45 mm)
Moisture-permeable sheetMoisture-permeable sheet
Plywood (9 mm)Plywood (9.2 mm)
Cellulose fiber insulation
(120 mm, 55 kg/m3)
Moisture-permeable sheet
Moisture-permeable sheetCellulose fiber insulation
(185 mm, 55 kg/m3)
Moisture-permeable sheet
Table 4. Simulation conditions.
Condition
Target areaFukuoka, Japan
Weather conditionEA weather data 1
Air-flow rate
of ventilated roof
250 m3/h
Roof ventilation start temperature30 ℃
Roof ventilation stop temperature25 ℃
1 Expanded AMeDAS weather data of Japan.
Publisher’s Note: MDPI stays neutral with regard to jurisdictional claims in published maps and institutional affiliations.

