Article

MTI-YOLO: A Light-Weight and Real-Time Deep Neural Network for Insulator Detection in Complex Aerial Images

1
College of Electronic and Information Engineering, Nanjing University of Aeronautics and Astronautics, Nanjing 211106, China
2
College of Mechanical and Electrical Engineering, Chizhou University, Chizhou 247000, China
3
College of Automation Engineering, Nanjing University of Aeronautics and Astronautics, Nanjing 211100, China
*
Authors to whom correspondence should be addressed.
Energies 2021, 14(5), 1426; https://doi.org/10.3390/en14051426
Submission received: 30 January 2021 / Revised: 26 February 2021 / Accepted: 26 February 2021 / Published: 5 March 2021

Abstract

:
Insulator detection is an essential task for the safety and reliable operation of intelligent grids. Owing to insulator images including various background interferences, most traditional image-processing methods cannot achieve good performance. Some You Only Look Once (YOLO) networks are employed to meet the requirements of actual applications for insulator detection. To achieve a good trade-off among accuracy, running time, and memory storage, this work proposes the modified YOLO-tiny for insulator (MTI-YOLO) network for insulator detection in complex aerial images. First of all, composite insulator images are collected in common scenes and the “CCIN_detection” (Chinese Composite INsulator) dataset is constructed. Secondly, to improve the detection accuracy of different sizes of insulator, multi-scale feature detection headers, a structure of multi-scale feature fusion, and the spatial pyramid pooling (SPP) model are adopted to the MTI-YOLO network. Finally, the proposed MTI-YOLO network and the compared networks are trained and tested on the “CCIN_detection” dataset. The average precision (AP) of our proposed network is 17% and 9% higher than YOLO-tiny and YOLO-v2. Compared with YOLO-tiny and YOLO-v2, the running time of the proposed network is slightly higher. Furthermore, the memory usage of the proposed network is 25.6% and 38.9% lower than YOLO-v2 and YOLO-v3, respectively. Experimental results and analysis validate that the proposed network achieves good performance in both complex backgrounds and bright illumination conditions.

1. Introduction

Insulators are one of the essential devices in overhead power transmission systems which play an important role in electrical isolation and mechanical support [1,2]. However, insulators are usually exposed to outdoor scenes and have to suffer from hard weathers, bird droppings, and human external interference. Insulator defects can threaten the security and stability of a power transmission system. Statistically, almost 81.3% power accidents in power transmission systems are caused by insulator defects [3]. Therefore, it is necessary to regularly conduct visual inspections on power transmission systems; it is especially quite important to detect insulator defects timely and in an intelligent way. In recent years, power transmission system inspections have typically been performed using traditional methods, such as manual patrol [4], manned helicopter patrol, and climbing robot patrol [5]. Compared with unmanned aerial vehicle (UAV) patrol, these traditional methods are costly and time-consuming [6]. The inspection methods of existing power transmission systems are shown in Figure 1. With the developments of image processing techniques, insulator detection based on aerial images is drawing increasing attention from power utilities. Meanwhile, insulator detection based on image processing techniques is regarded to be an important task [7].
Insulator inspection on aerial images can be divided into insulator detection and defect recognition [8]. Specifically, insulator detection is the most important process of insulator defect recognition. However, aerial images usually contain complex backgrounds, which are composed of vegetation, rivers, power towers, etc. Most importantly, these complex backgrounds make the existing insulator detection methods suffer from low accuracy and poor robustness. Existing methods usually adopt color, shape, and texture features to detect insulators. Zhai et al. [9] proposed an insulator detection algorithm based on visual saliency and adaptive morphology. To detect the insulator, the gradient and color features are used to distinguish the insulator from complex image backgrounds. However, this method will fail when the background interference’s color is similar to that of the insulator. In the work of [10], a texture-based insulator segmentation algorithm is presented by using principal component analysis (PCA) and an active contour model (ACM). Although an insulator’s texture features are usually different from most of the background interference, they are quite similar to leaves on a tree. Liao et al. [11] put forward an efficient insulator detection algorithm based on multi-scale and multi-feature descriptors. Firstly, the local features of an insulator are extracted by multi-scale and multi-feature descriptors. Secondly, spatial sequence features are obtained by trained local features of the insulator. Finally, a coarse-to-fine matching strategy is proposed to locate the region of the insulator. However, due to the complexity of the coarse-to-fine matching strategy adopted in this method, this method is time-consuming and cannot meet real-time applications. Li et al. [12] propose a novel approach for insulator detection by combining the PCA algorithm and contour projection scheme. To overcome the influence of image noise, a threshold-based method is designed to pre-process aerial images, and then, the insulator regions can be obtained by using the contour projection scheme directly. To improve the accuracy of the insulator detection, some researches explore some novel insulator features and then propose the corresponding detection methods [13,14].
Recently, with the rapid development of deep learning theories, convolution neural networks (CNNs) have been successfully applied in image classification and object detection [15,16]. Naturally, the existing object detection networks can be adopted to detect insulators by using the transfer learning strategy. The existing object detection networks can be divided into two categories: one-stage networks and two-stage networks. You Only Look Once (YOLO) [17,18,19] and Single Shot multibox Detector (SSD) [20] are the typical one-stage networks, while the Regions with Convolutional Neural Network (R-CNN) [21], Fast R-CNN [22], and Faster R-CNN [23] are two-stage networks. Specifically, the two-stage networks achieve a slightly higher accuracy than part of the one-stage networks in some public datasets. However, the two-stage networks are time-consuming and hard to train. In contrast, the one-stage networks can achieve a real-time performance which can meet the requirements of the real-time applications. Therefore, it is possible to apply deep learning algorithms for insulator detection and obtain satisfactory detection results. In [24], the Faster R-CNN is adopted and trained to detect the insulator in aerial images. Compared with traditional image processing methods, the experimental results verify that the efficiency and accuracy of the defect recognition have been significantly improved. To solve the problem that the traditional manual feature extraction methods are usually inefficient, Miao et al. [25] propose an automatic multi-level feature extraction model based on an SSD network to extract insulator features. To obtain a model suitable for insulator detection, a two-stage fine-tuning strategy is implemented on the proposed model training. However, the aerial images in the testing set contain only forest background and building background, which cannot reflect the diversity of real aerial image scenes. To obtain the fine contour of the insulator, Ling et al. [26] present a real-time and accurate method that combines the Faster R-CNN and U-net as a pipeline framework. In the proposed framework, the Faster R-CNN is used for insulator locating and the U-net is used for insulator pixels classification. In the work of [27], a cascaded CNN is designed for insulator localization and defect detection. First of all, an insulator is located by a trained VGG-16 network, and then, a ResNet-101 network is trained to recognize the insulator and its defects. Last but not the least, the authors collect and construct an insulator public dataset named Chinese Power Line Insulator Dataset (CPLID), and it can be downloaded from git-hub. To improve the efficiency of insulator detection, a YOLO-v2 network is adopted as a deep learning model for insulator detection in [28]. Experimental results demonstrate that using the YOLO-v2 network can achieve a good trade-off between detection accuracy and real-time performance (0.04 s/per image and 88% accuracy in testing set). Han et al. [29] propose a cascaded model for insulator multi-defect detection. Firstly, a deep learning network is proposed for locating the regions of interest (ROIs) that contain insulator strings, and then, a YOLO-tiny network is trained to detect the insulator multi-defects. The experimental results show that the proposed model can be used for on-line insulator detection. To improve the efficiency and effectiveness of the insulator detection, in the work of [30], a YOLO-v3-based model is explored to detect both an insulator and its defects. Experimental results validate that the explored model is quite efficient and can process 45 frames per second.
In summary, it can be concluded that using a deep learning model to detect insulators can achieve good performance and has the potential to meet the requirements of actual applications. Compared with two-stage target detection networks, one-stage target detection networks, such as YOLO-v2 and YOLO-v3, are much faster [31]. However, some of the one-stage target detection networks’ weight files are too large and require much memory storage in actual applications. Although YOLO-tiny achieves good performance in both running time and memory storage [32], it is difficult to detect insulators accurately in complex backgrounds. To achieve a good trade-off among the accuracy, running time, and memory storage, this work proposes the MTI-YOLO network for insulator detection in complex aerial images. To improve the detection accuracy of different sizes of insulator, multi-scale feature detection headers are presented in the MTI-YOLO network. To obtain different scales of the insulator semantic features, a structure of multi-scale feature fusion is proposed in the architecture of the MTI-YOLO network. To improve the feature expression of specific sizes of insulator, the SPP is introduced in the detection headers of the MTI-YOLO network. To solve the problem of the lack of insulator aerial images, a novel composite insulator dataset named the “CCIN_detection” dataset is constructed in this work.
The rest of this paper is organized as follows. (1) Section 1 reports the existing works of insulator detection. (2) Section 2 introduces the framework of YOLO-tiny. (3) Section 3 details the proposed MTI-YOLO network. (4) Section 4 gives experimental results and analysis. (5) Finally, Section 5 presents the conclusion of this paper.

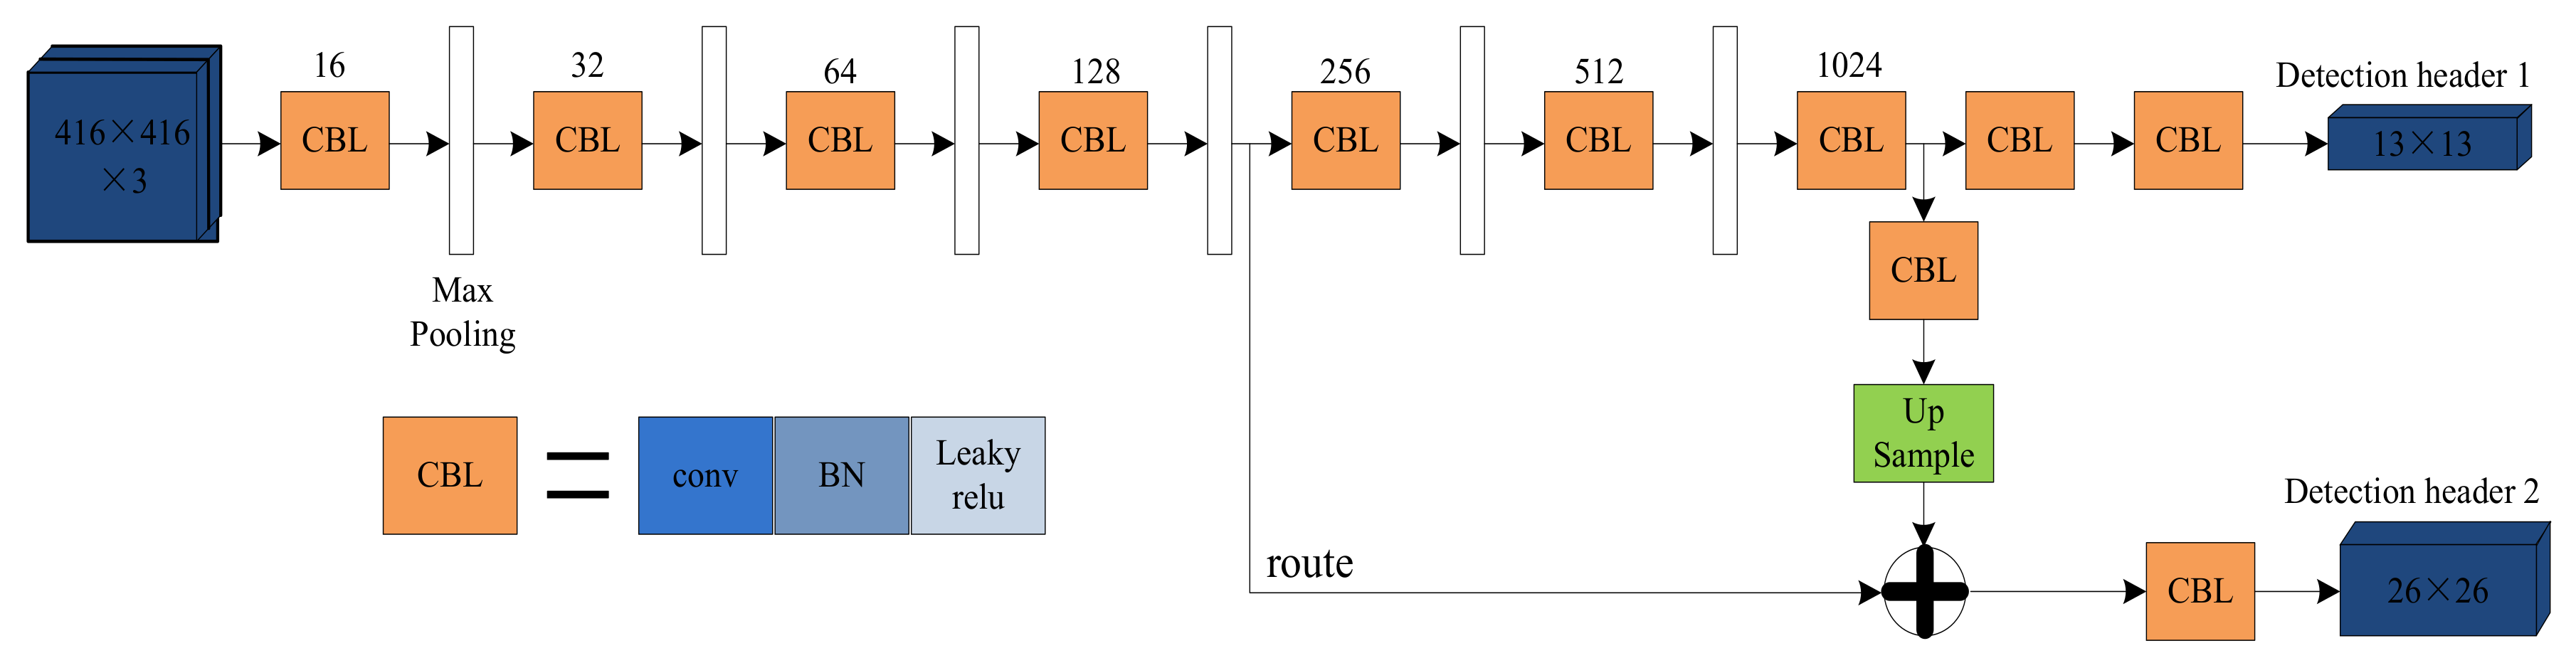
2. The Framework of YOLO-Tiny

As mentioned in Section 1, YOLO is one of the excellent one-stage object detection networks. Specifically, the existing YOLO-v2 and YOLO-v3 networks adopt large numbers of convolution operations and pooling operations, which utilize large computing resources and memory storage, making the networks hard to train and difficult to apply in embedded platforms [33,34]. Compared with YOLO-v2 and YOLO-v3, YOLO-tiny can be seen as a simplified version of YOLO-v3, which has fewer parameters and less memory storage [35,36]. The backbone network of YOLO-v3 is composed of 53 convolution layers, while YOLO-tiny includes only seven convolution layers and six max-pooling layers, as shown in Figure 2. The Convolutional Batch Normalization Leaky Relu (CBL) module is composed of a convolution layer, a batch normalization layer, and a Leaky Relu. The convolution core of filters in the convolution layer is 3 × 3, and the number of filters is increased from 16 to 1024. To realize the fusion of low-level feature maps and high-level feature maps, a two-scale prediction approach is adopted. Concretely, two-scale prediction of 13 × 13 feature maps and 26 × 26 feature maps prediction are used for the feature extraction network, as follows: (1) after the 13th feature layer, two convolution layers are connected to a detection header (13 × 13), which is inclined to detect large objects. (2) To reduce the dimension of feature maps (13 × 13), the 1 × 1 convolution layer is connected to the 13th feature layer. After that, an up-sampling operation is performed to obtain feature maps (26 × 26). Finally, the eighth feature layer is added to the above feature maps (26 × 26) to obtain a detection header (26 × 26), which is prone to detect relatively small objects. Generally, two types of features in CNNs are used for feature extraction. The first few layers of CNNs learn low-level features, and the last few layers learn high-level features. The low-level features usually contain details and information of an image, such as edge, corner, color, pixels, gradients, etc. Compared to low-level features, high-level features have more abundant semantic information, which can be used to identify and detect the shape of objects in the image.
To achieve the detection of multiple objects, the input image (416 × 416) of the YOLO-tiny network is divided into S × S grid cells. The grid cell is not only responsible for detecting the class of the objects but also generating three predict boxes, which include position and class information x ¯ , y ¯ , w ¯ , h ¯ , C ¯ . Specifically, x ¯ , y ¯ are the center coordinates of a predict box, while x , y are the center coordinates of ground truth. w ¯ , h ¯ are the width and height of a predict box, while w , h are the width and height of ground truth. C ¯ is the confidence of the corresponding predict objects, while C is the confidence of true objects. The loss function of YOLO-tiny can be divided into three parts: the predict coordinate error, the confidence error, and classification error, as defined in Formulas (1)–(3).
E r r o r c o o r d = i = 0 S 2 j = 0 B 1 i j o b j x i j x ¯ i j 2 + y i j y ¯ i j 2 + i = 0 S 2 j = 0 B 1 i j o b j w i j w ¯ i j 2 + h i j h ¯ i j 2
E r r o r c o n = i = 0 S 2 j = 0 B 1 i j o b j C i j C ¯ i j 2 + λ n o o b j i = 0 S 2 j = 0 B 1 i j n o o b j C i j C ¯ i j 2
E r r o r c l a s s = i = 0 S 2 1 i j o b j c c l a s s p i c p ¯ i c 2
In Formulas (1)–(3), B denotes the number of bounding boxes of each grid cell; 1 i , j o b j refers to whether an object falls in the jth bounding box of the ith grid cell; p i c and p i ¯ c denote the probability of object classification and predicted probability of object classification, respectively; E r r o r c o o r d is the loss function of predict coordinate error, E r r o r c o n is loss function of confidence error including confidence error with objects and without objects, and E r r o r c l a s s is the loss function of classification error; λ c o o r d is the confidence weights when there is an object, λ n o o b j refers to the confidence penalty when there is no object, and the total loss function of YOLO-tiny is shown in Formula (4):
l o s s = λ c o o r d × E r r o r c o o r d + E r r o r c o n + E r r o r c l a s s = λ c o o r d × i = 0 S 2 j = 0 B 1 i j o b j x i j x ¯ i j 2 + y i j y ¯ i j 2 + λ c o o r d × i = 0 S 2 j = 0 B 1 i j o b j w i j w ¯ i j 2 + h i j h ¯ i j 2 + i = 0 S 2 j = 0 B 1 i j o b j C i j C ¯ i j 2 + λ n o o b j × i = 0 S 2 j = 0 B 1 i j n o o b j C i j C ¯ i j 2 + i = 0 S 2 1 i j o b j c c l a s s p i c p ¯ i c 2

3. Methodology

In the network of YOLO-tiny, the feature extraction network is composed of few convolution layers and max-pooling layers, and the accuracy of object detection can be affected by insufficient feature extraction, while the weight files of YOLO-v2 and YOLO-v3 are too large and require much memory storage in actual applications. Inspired by these excellent networks, it is worth investigating how to achieve a good trade-off among the accuracy, running time, and memory storage. This work proposes the MTI-YOLO network for insulator detection in complex aerial images. To improve the detection accuracy of different sized insulators, several improvements are implemented in the MTI-YOLO network. (1) Multi-scale feature detection headers are adopted in the MTI-YOLO network. (2) A structure of multi-scale feature fusion is proposed in the architecture of the MTI-YOLO network. (3) The SPP model is introduced in the detection headers of the MTI-YOLO network. Figure 3 shows the entire structure of the MTI-YOLO network, including the backbone network, the feature pyramid network, the spatial pyramid pooling network, and the detection network.

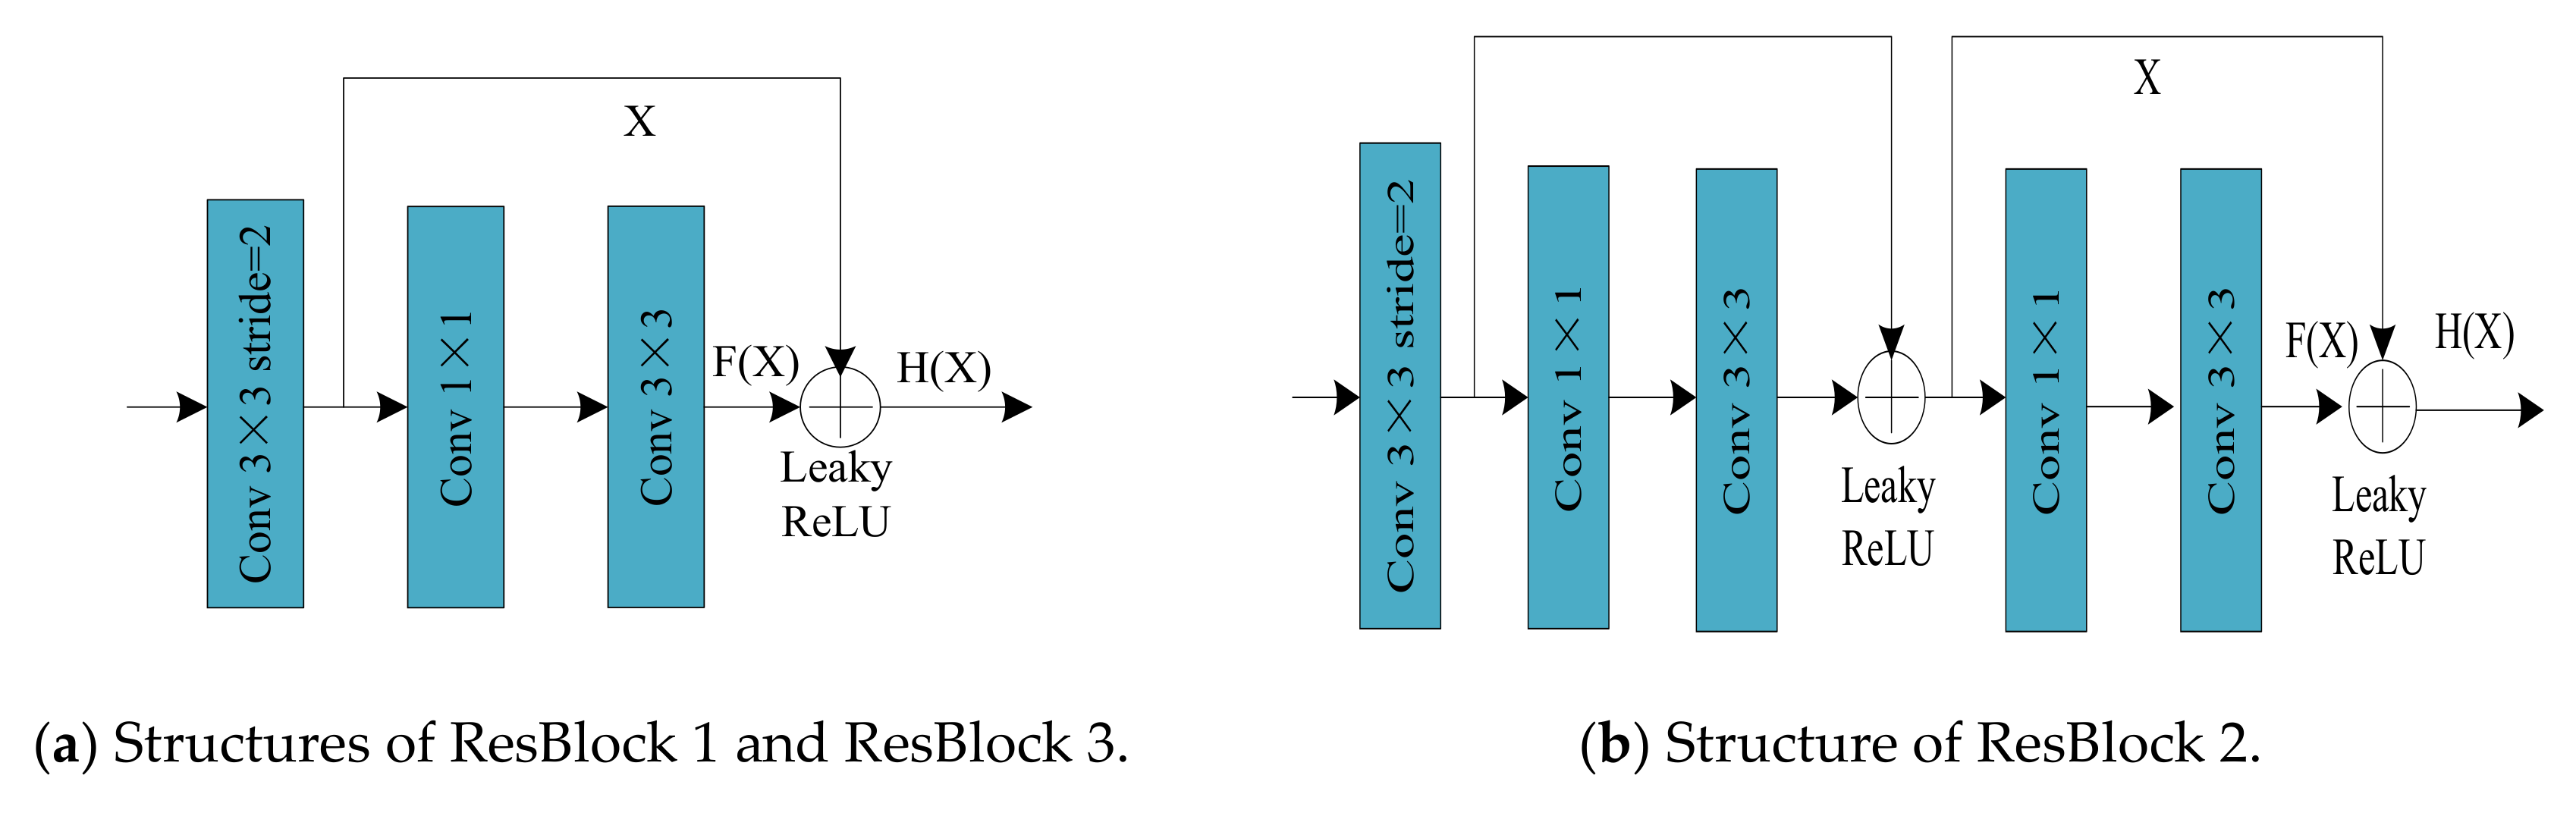
3.1. Structure of Backbone Network

In the YOLO-tiny network, scales of 13 × 13 and 26 × 26 are introduced to detect objects; large objects can be accurately detected, while small objects cannot obtain good detection results. As is known to all, with the increase in the network depth, the performance of deep learning networks can be enhanced and the detection results become more and more accurate. However, the deeper the network layers, the more the network parameters and the more complex the detection network. To enhance the feature reuse of the YOLO-tiny network, residual blocks (ResBlocks) are introduced to the feature extracting network in this work, and the MTI-YOLO network is proposed based on the network of YOLO-tiny. Figure 4 shows the backbone network of the proposed network.
As shown in Figure 4, the backbone network is composed of 15 convolution layers, 3 max-pooling layers, 2 up-sample layers, 4 route layers, 3 detection headers, and 3 ResBlocks. The convolution layers, max-pooling layers, and ResBlocks are combined to extract different sizes of feature maps; ResBlock 1 is responsible for extracting 52 × 52 feature maps, ResBlock2 is responsible for extracting 26 × 26 feature maps, and ResBlock 3 is responsible for extracting 13 × 13 feature maps, respectively. Moreover, a route layer is connected between the two ResBlocks, i.e., one layer in ResBlock1 can skip over several layers directly and superimpose to the other layer in ResBlock2, which improves the prediction performance of the network. The high-level feature maps are connected to the low-level feature maps by the combination of the up-sample and route layer, which adds semantic information of the high-level feature maps. Three scale feature detection headers are adopted to the network, and the detection accuracy of different sized insulators can be improved effectively. Specifically, the detection header of feature maps 52 × 52 is used to detect small-size insulators, the detection header of feature maps 26 × 26 is used to detect medium-size insulator, and the detection header of feature maps 13 × 13 is used to detect large-size insulator.
In deep learning networks, the performance of feature extraction can be improved by increasing the width and depth of networks, and networks with deep layers are commonly better than those with shallow layers. However, with the increase in network layers, gradient vanishing and gradient exploding occur easily during the process of backpropagation, which results in the network being hard to train. To solve the problem of performance degradation caused by the deepening of network, Residual Network (ResNet) is proposed by He et al. [37] to optimize the training process. A shortcut connection is used every three layers in the whole network, and the output feature of the first layer is added to the third one so that the gradient cannot be zero in the backpropagation. Therefore, the whole network can be trained effectively. The ResNet is composed of residual blocks, as shown in Figure 5. The structure of Figure 5a is adopted to ResBlock 1 and ResBlock 3, and the structure of Figure 5b is adopted to ResBlock 2.
Take ResBlock 1 for example—this residual block is composed of two Conv 3 × 3 and a Conv 1 × 1. Specifically, the first Conv 3 × 3 is responsible for reducing the dimensions of the input layer, and then, the feature maps X are obtained. The Conv 1 × 1 is responsible for channel compression, and its input is connected to the feature maps X. The second Conv 3 × 3 is responsible for enhancing feature extraction and channel expansion, and its input is connected to the output of Conv 1 × 1. The output of the second Conv 3 × 3 is feature maps F(X), and feature maps F(X) are connected to feature maps X by a shortcut. The residual block learns the feature maps F(X) through convolution layers and adds them to the input feature maps X to obtain the output feature maps H(X), expressed as H(X) = F(X) + X. The ResNet introduces shortcut connections to increase the depth of the network, which alleviates the gradient vanishing problem and accelerates the training of the networks. The accuracy of the detection network can be improved by adding ResBlocks to YOLO-tiny network.

3.2. The Feature Pyramid Network

For the input image (416 × 416), with the increase in the network depth, the semantic information is strengthened continuously after down-sampling, and the position information of the corresponding feature maps (13 × 13, 26 × 26, and 52 × 52) are weakened. Therefore, the higher the level, the richer the semantic information contained in the network layers. To recognize insulators of different sizes requires feature maps of different layers, and high-level semantic information can commonly achieve object detection accurately. However, in the network of YOLO-tiny, only the feature maps of the last convolution layer are adopted to predict, and other low-level feature maps are ignored, which loses many feature maps of the insulators (shape, color, texture, etc.). This results in feature maps for prediction that do not have good ability to recognize insulators, which will seriously affect the accuracy of insulator detection. Feature pyramid networks (FPNs) provide a good route for multi-scale object prediction. To obtain different scales of insulator semantic feature maps, being motivated by the works of [38,39,40], a structure of multi-scale feature fusion is proposed in this work, as shown in Figure 6. In the proposed model, high-level semantic feature maps are fused with low-level feature maps, and three feature maps of different scales are fused as the prediction layer. The detection accuracy of the network is improved by fusing multi-resolution feature maps.
The process of multi-scale prediction is as follows: Firstly, three scale feature maps (52 × 52, 26 × 26, and 13 × 13) are extracted by the backbone of the proposed network from top to bottom, obtaining 52 × 52 large-scale feature maps LF0, 26 × 26 medium-scale feature maps MF0, and 13 × 13 small-scale feature maps SL0, respectively. The large-scale feature maps LF1, medium-scale feature maps MF1, and small-scale feature maps SF1 are obtained by 1 × 1 convolution operation with the above extracted feature maps. The feature maps SF1 are up-sampled and then fused with the feature maps MF1 to obtain 26 × 26 feature maps MF2. Subsequently, the feature maps MF2 are up-sampled and then fused with the large-scale feature maps LF1 to obtain 52 × 52 feature maps LF2. The 52 × 52 feature maps LF2 are the prediction feature maps for scale 52 × 52. Secondly, the 52 × 52 feature maps LF2 are down-sampled and then fused with the feature maps MF2 to obtain 26 × 26 feature maps MF3, and the 26 × 26 feature maps MF3 are the prediction feature maps for scale 26 × 26. Finally, the feature maps MF3 are down-sampled and then fused with the small-scale feature maps SF1 to obtain 13 × 13 feature maps SF2, and the 13 × 13 feature maps SF2 are the prediction feature maps for scale 13 × 13.
In this work, the final feature maps of three different scales (13 × 13, 26 × 26, and 52 × 52) were obtained from the proposed multi-scale feature fusing structure. Through the feature fusing operation, the feature maps for prediction have both higher semantics and higher resolution, which will be more effective in predicting insulators of different scales. The detection accuracy of small insulators can also be improved by the proposed feature fusing structure.

3.3. Spatial Pyramid Pooling

To solve the problem of input image sizes not meeting the requirements in the practical application, the work of [41] proposes an SPP network. SPP-net is a structure to fuse feature maps into a fixed-length feature vector by multi-scale pooling operation. As is known to all, the receptive field of high-level features strongly expresses semantic information, and the receptive field of low-level features has a good expression ability of spatial position information and high resolution. SPP is one of the important methods in deep learning-based networks [42,43,44,45,46], and to increase the receptive field of high-level semantic feature, an SPP model is introduced to obtain multi-scale local region feature maps, as shown in Figure 7.
The SPP model can be divided into three parts, i.e., SPP1, SPP2, and SPP3. The structure of SPP1 is used for the 13 × 13 detection header, the structure of SPP2 is used for the 26 × 26 detection header, and the structure of SPP3 is used for the 52 × 52 detection header. Each part of the SPP is composed of three different scale max-pooling layers; the kernel of max-poolings is 13 × 13, 9 × 9, and 5 × 5, and the stride is 1. The local region feature maps are obtained by three scale max-pooling operations. The input feature maps are fused with the local region feature maps as the final prediction feature maps, i.e., 13 × 13 × 2048, 26 × 26 × 1024, and 52 × 52 × 512, respectively. The use of the SPP model can greatly increase the receptive field of the local region feature maps, obtain more abundant local feature information, and improve the accuracy of the prediction.

4. Experiments Results and Discussion

To validate the effectiveness of the proposed network, the “CCIN_detection” dataset was constructed. For a fair comparison, both the proposed network and the compared networks were trained and then tested on “CCIN” dataset.

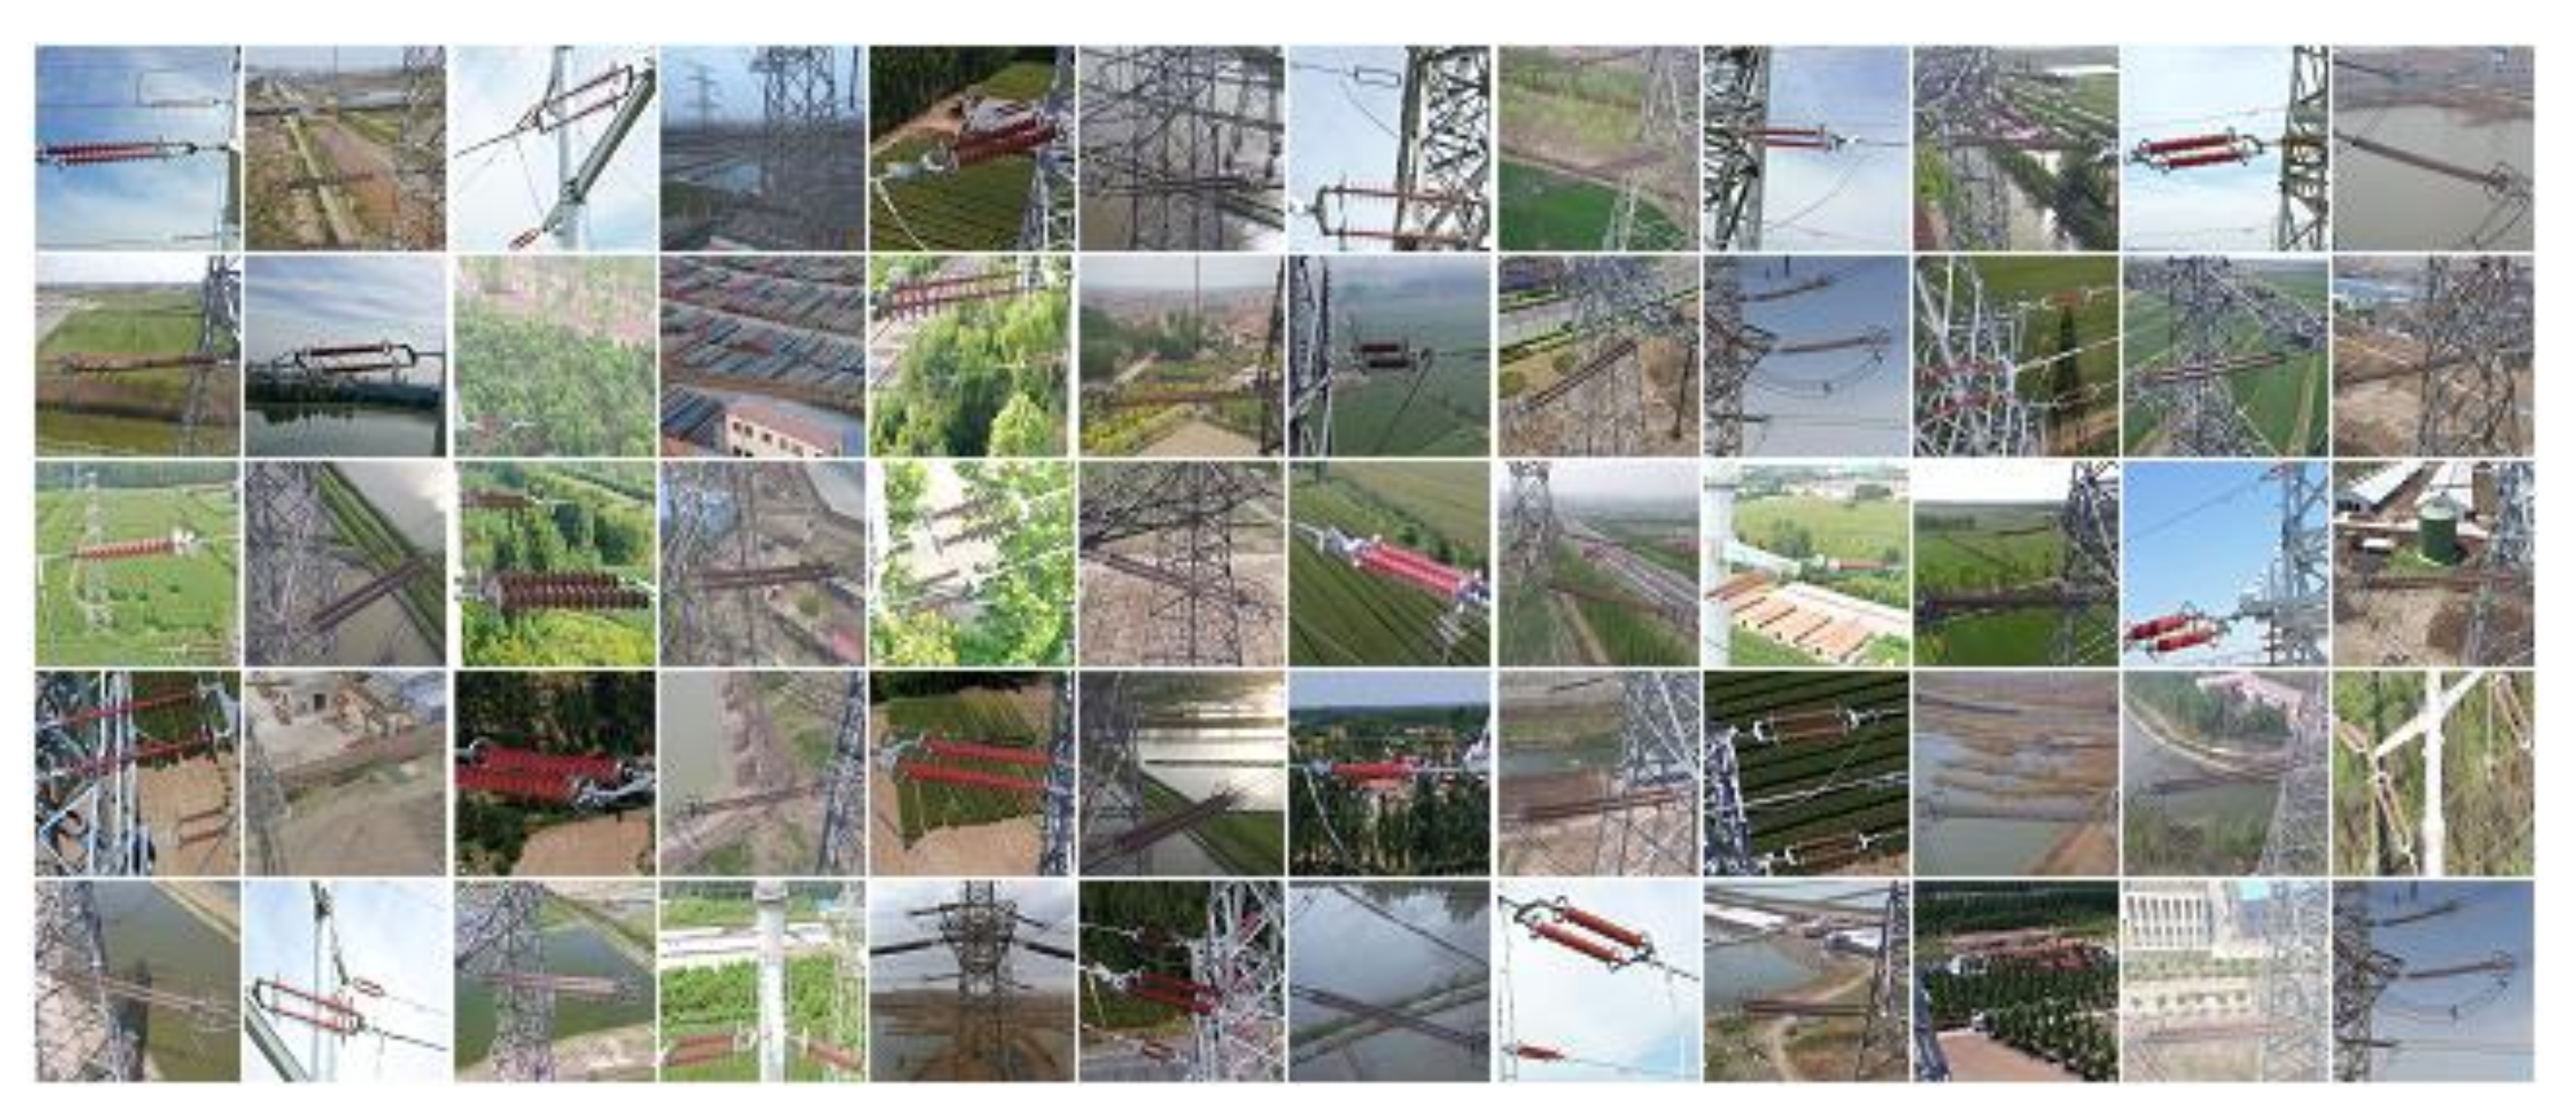
4.1. Dataset Preparation

Currently, there is only one public dataset available for insulator detection, which is named the “CPLID” dataset [47], and it is composed of 600 images captured by a UAV. Based on the work of Tao et al., another 900 aerial images of composite insulator were collected to construct a novel dataset named the “CCIN_detection” dataset. Compared with the aerial images in the “CPLID” dataset, the aerial images in the “CCIN_detection” dataset are more diverse and contain more common aerial scenes, as shown in Figure 8.
To improve the generalization ability of the proposed network and to avoid over-fitting, image augmentation technology was used in this work. Specifically, noise adding and image rotating were adopted to change the original image styles. Finally, the “CCIN_detection” dataset contains 4500 aerial images in total; inspired by the previous work of Han et al. [46], 3000 images were randomly selected to be a training set, while the other 1500 images were used for testing, as shown in Table 1. All the images in the “CCIN_detection” dataset were set to be 416 pixels × 416 pixels.

4.2. Anchor Boxes Clustering

Anchor boxes are prediction boxes that guide network model training. During model training, if the initial anchor box is closer to the ground truth, the model will be easier to train and converge faster. To make the models of the MTI-YOLO network and the YOLO-tiny network easier to train, a K-means clustering algorithm was adopted in the “CCIN_detection” dataset to obtain anchor boxes, and the results are shown in Table 2.
As shown in Table 2, the number K of cluster centers and the average intersection over union (IOU) were obtained from the K-means algorithm; it can be seen from the table that when K is taken as 9, the value of IOU is 74.90%, and the average IOU changes slowly after K = 9. Finally, the number K of clustering centers for the “CCIN_detection” dataset was set to be K = 9, and the responding anchor boxes for three-scale feature detection are obtained as follows: (78 × 20), (71 × 45), (122 × 32), (63 × 116), (154 × 67), (250 × 47), (267 × 83), (159 × 120), and (279 × 153). Among them, (78 × 20), (71 × 45), and (122 × 32) are the anchor boxes for Scale 3; (63 × 116), (154 × 67), and (250 × 47)are the anchor boxes for the Scale 2; (267 × 83), (159 × 120), and (279 × 153) are the anchor boxes for the Scale 1. Meanwhile, in the YOLO-tiny network, the sizes of six anchor boxes for two-scale feature detection are obtained as follows: (85 × 21), (94 × 43), (228 × 47), (127 × 99), (258 × 81), and (260 × 147). Among them, (85 × 21), (94 × 43), and (228 × 47)are the anchor boxes for Scale 2; (127 × 99), (258 × 81), and (260 × 147) are the anchor boxes for the Scale 1.

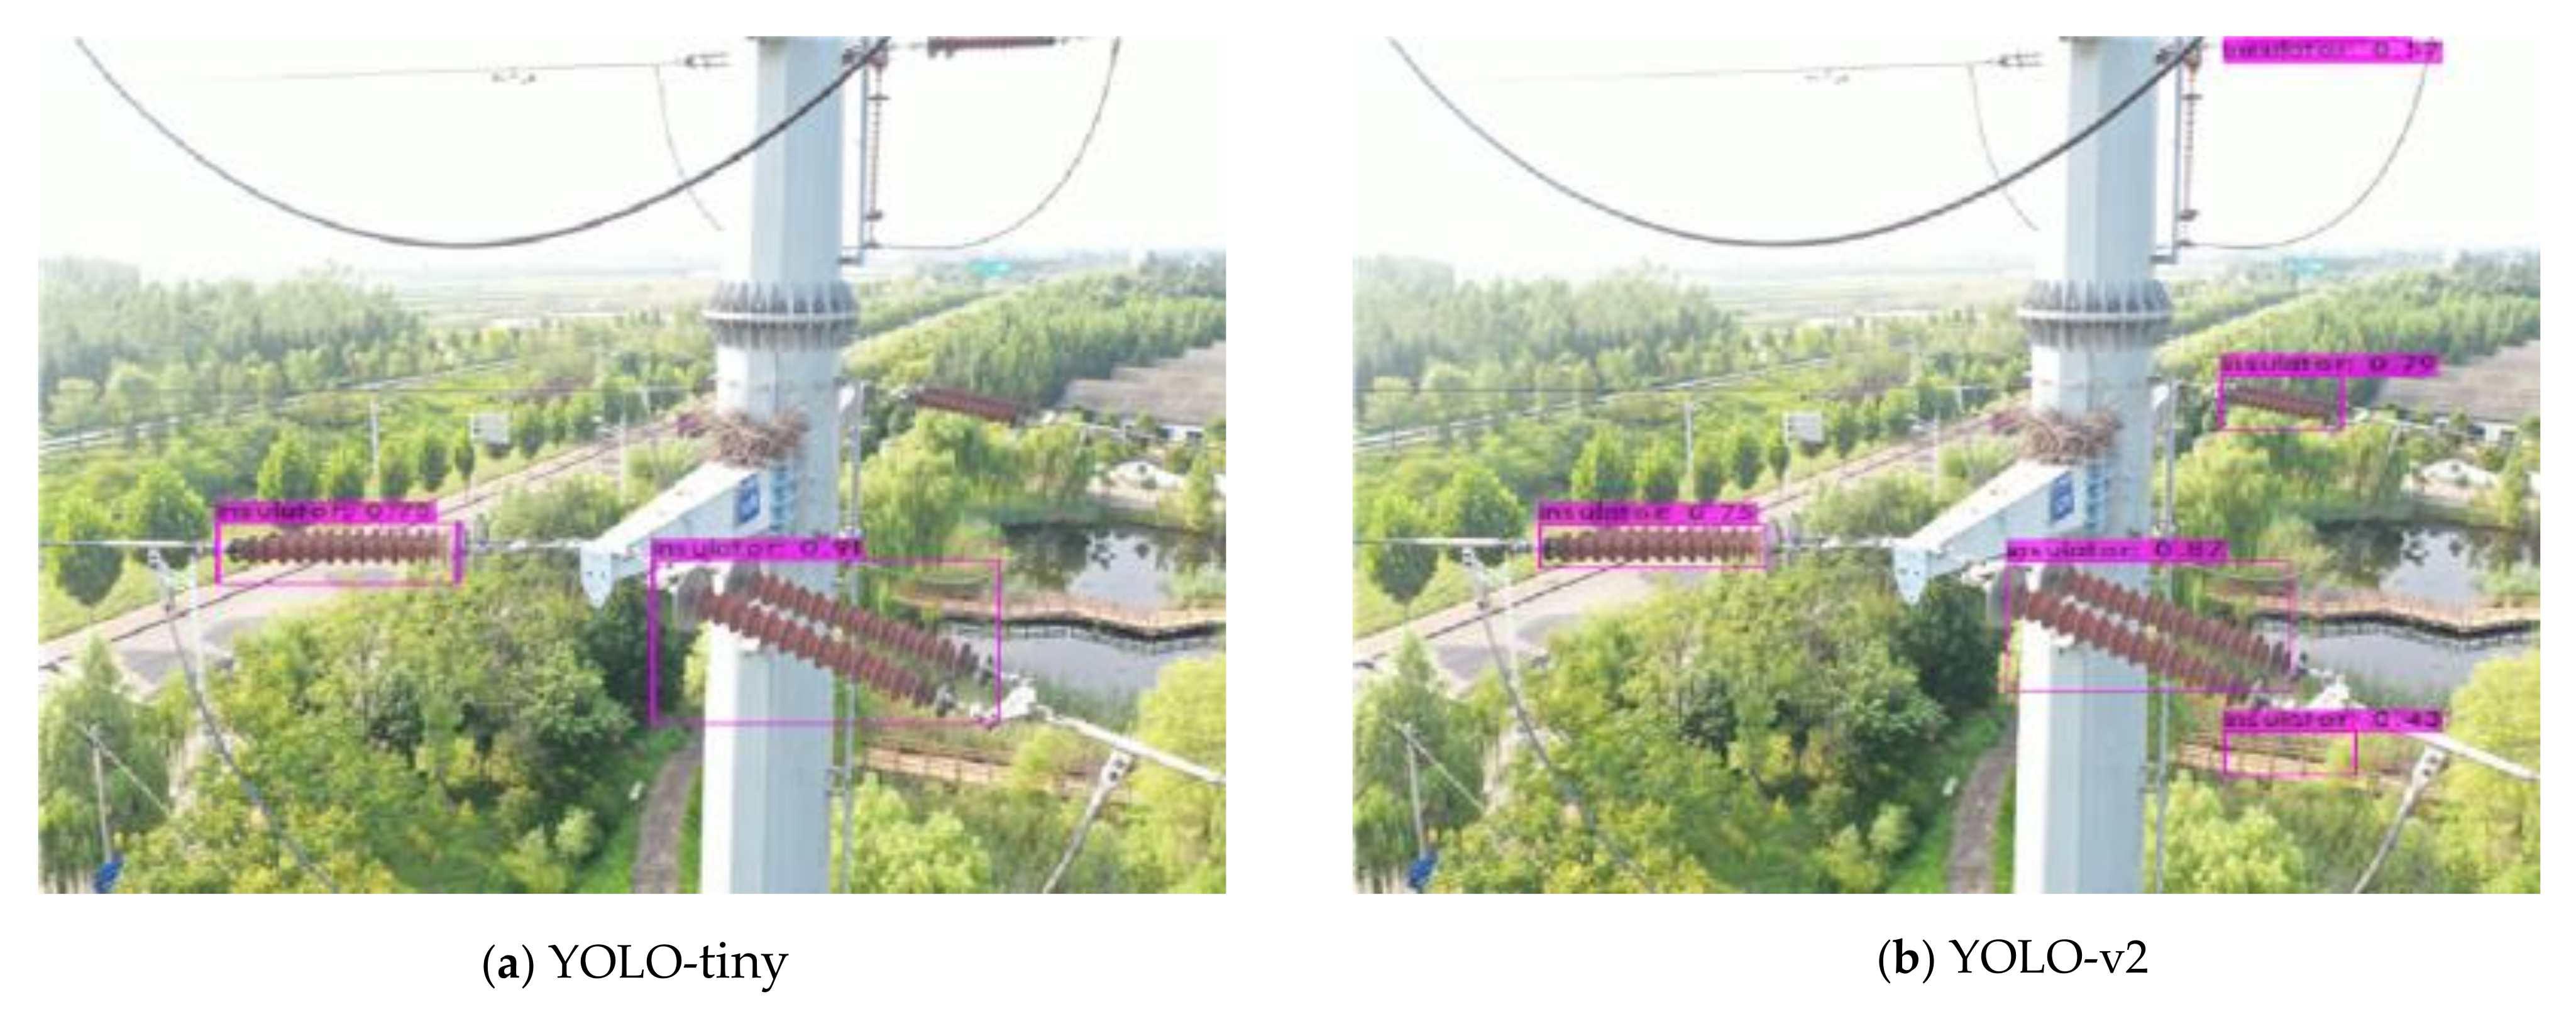
4.3. Quantitative and Qualitative Analysis

The experiments were conducted on a PC with an Intel-CPU-i9-9900K, 8 GHz of CPU, 32 GB of RAM, and a Nvidia GeForce GTX 3080 (10GB). The experiment environment parameters are shown in Table 3. In the process of training, the number of iterations of our proposed network and the compared networks was set to be 38,000, and the initialization of the learning rates was set as 0.001. The learning rates were reduced to 0.0001 and 0.00001 after 25,000 and 32,000 iterations, respectively. Random shift of saturation, hue, and exposure were adopted to achieve sample augmentation during the training. The experiment parameters’ configuration is shown in Table 4. The proposed network and the compared networks were trained on the Dark-net framework [48], and the final models of insulator detection were evaluated on the Visual studio framework.
To evaluate the effectiveness of the proposed MTI-YOLO network, the ”CCIN_detection” dataset was divided into a training set and a testing set. Specifically, in the “CCIN_detection” dataset, 3000 images were set as a training set, while the other 1500 images were adopted as a testing set. The proposed network was compared with three existing networks: YOLO-tiny, YOLO-v2, and YOLO-v3. For a fair comparison, YOLO-tiny, YOLO-v2, YOLO-v3, and our proposed network were trained and tested on the “CCIN_detection” dataset. Moreover, four measurements of average precision (AP), running times, floating point operations (FLOPs), and memory usage were introduced to verify the effectiveness of the proposed network quantitatively.
In the machine learning field, to evaluate the binary classification model, all the results can be divided into four categories: True Positive (TP), False Positive (FP), True Negative (TN), and False Negative (FN). Specifically, TP indicates that the sample is positive in actuality and positive in the predicted result; FP indicates that the sample is negative in actuality and positive in the predicted result, TN indicates that the sample is positive in actuality and negative in the predicted result, and FN indicates that the sample is negative in actuality and negative in the predicted result.
As is known to all, Precision, Recall, and AP are the indicators commonly used in the field of target detection and classification. The definitions of Precision and Recall are given in Formulas (5) and (6), respectively.
Precision = T P T P + F P
Recall = T P T P + F N
Specifically, a two-dimensional precision–recall (P-R) curve is drawn by the values of the Precision and Recall. The AP is calculated by enclosed area of the P-R curve, which is defined as:
A P = 0 1 P R d R
Figure 9 shows the P-R curves of the proposed network and three compared networks, and they were conducted on the testing set of “CCIN_detection”. According to the observation of Figure 9, the AP values of the four networks are as follows: YOLO-tiny (72.78%), YOLO-v2 (80.88%), YOLO-v3 (90.29%), and MTI-YOLO (89.72%). It can be seen that the AP value of our proposed network is 17% higher than that of YOLO-tiny and 9% higher than that of YOLO-v2, while just a little (0.57%) lower than that of YOLO-v3. Compared with the networks of YOLO-tiny, YOLO-v2, and YOLO-v3, the performance of our proposed MTI-YOLO is superior to the YOLO-tiny and YOLO-v2 networks and almost consistent with that of the YOLO-v3 network. Therefore, our proposed network is more accurate than the networks of YOLO-tiny and YOLO-v2.
Moreover, the performances of the four networks were also evaluated by running time, memory usage, and FLOPs of the models [49]. To prove the effectiveness of our proposed network, the experimental results of the MTI-YOLO network were compared with those of three networks (YOLO-tiny, YOLO-v2, and YOLO-v3), and the results are listed in Table 5. It was found that the running times of the four networks are as follows: YOLO-tiny (3.96), YOLO-v2 (4.56), YOLO-v3 (11.67), and MTI-YOLO (6.44); the FLOPs of the four networks are YOLO-tiny (5.45), YOLO-v2 (29.34), YOLO-v3 (65.30), and MTI-YOLO (26.39); and the memory usages of the four networks are YOLO-tiny (33.89), YOLO-v2 (197.57), YOLO-v3 (240.53), and MTI-YOLO (146.93). Comparing our proposed network with the other three networks, the running time of the proposed MTI-YOLO network (6.44) is a bit little higher than those of YOLO-tiny (3.96) and YOLO-v2 (4.56), which means that our proposed network can run in real time. Furthermore, the FLOPs of the proposed MTI-YOLO network (26.39) are 10% and 59.6% lower than those of the YOLO-v2 (29.34) and the YOLO-v3 (65.30), respectively, and the memory usage of the proposed network MTI-YOLO (146.93) is 25.6% and 38.9% lower than those of YOLO-v2 (197.57) and YOLO-v3 (240.53), respectively. Therefore, considering the AP, running times, FLOPs, and memory usages, our proposed network is more advantageous and can be deployed on embedded devices.
UAV-based insulator images usually contain various background interferences, such as the presence of buildings, vegetation, sky, power towers, etc. However, due to the different filming angles and filming distances in real applications, insulators in aerial images are extremely diverse in appearance, shapes, and sizes. Moreover, in an actual detection environment, aerial images capture the views of different environmental and illumination conditions. Most of the existing image processing methods cannot achieve good performance with complex background interference. Therefore, processing these images is complicated and may lead to decreasing the accuracy of detection. In order to solve the problem and reduce the impact of backgrounds’ interference on insulator detection, a deep neural network is proposed to detect insulator in aerial images.
To validate the accuracy and robustness of our proposed network in different aerial scenes, some typical images with complex backgrounds were selected to exhibit the visualization performances of four networks: YOLO-tiny, YOLO-v2, YOLO-v3, and MTI-YOLO, as shown in Figure 10, Figure 11, Figure 12, Figure 13 and Figure 14. Specifically, each figure shows the detection results for insulator detection including the detection box, prediction name (insulator), and predicted confidence. Figure 10 shows an experimental scene with a background of buildings. Due to the color of buildings being similar to that of the insulator, it is hard for YOLO-tiny (Figure 10a) and YOLO-v2 (Figure 10b) to distinguish insulators from the buildings scene, and as a result, only two insulators were detected by YOLO-tiny and YOLO-v2. Meanwhile, three insulators were detected by the proposed network MTI-YOLO, and four insulators were detected by YOLO-v3. Compared with the networks of YOLO-tiny and YOLO-v2, the network of MTI-YOLO (Figure 10d) exhibits slightly better detection results, and the network of YOLO-v3 (Figure 10c) works best. The background of Figure 11 is vegetation, it can be found that the networks of YOLO-v2 (Figure 11b), YOLO-v3 (Figure 11c), and MTI-YOLO (Figure 11d) can detect all the insulators in the image, while YOLO-tiny (Figure 11a) can detect just two insulators. In addition, there is a misdetection in YOLO-v2. As the shape of the bridge is similar to that of the insulator, the network of YOLO-v2 detected the bridge as an insulator. Figure 12 exhibits an experimental scene with a background of sky. Because the background of sky is relatively simple, all the insulators (except for vertical insulators) in the image can be detected correctly by the networks of YOLO-v3 (Figure 12c) and MTI-YOLO (Figure 12d). Compared with YOLO-v3 and MTI-YOLO, because the networks of YOLO-tiny (Figure 12a) and YOLO-v2 (Figure 12b) are not able to detect the small-size insulators, they can detect just half of all the insulators. The experimental scene with a background of power tower is shown in Figure 13. The network of YOLO-v3 (Figure 13c) works best, and it can detect all the insulators in the image. The network of YOLO-tiny (Figure 13a) works worst, because it can detect only one insulator in the image. The network of YOLO-v2 (Figure 13b) can detect all the insulators in the image, but one of the prediction boxes is inconsistent with the ground truth of an insulator. Most insulators in the image can be detected by the network of MTI-YOLO (Figure 13d). Figure 14 shows the experimental results with bright lighting conditions. Although the lighting in the image is bright, the networks of YOLO-v3 (Figure 14c) and MTI-YOLO (Figure 14d) can still detect all the insulators (except for vertical insulators) in the image. While the networks of YOLO-tiny (Figure 14a) and YOLO-v2 (Figure 14b) are susceptible to lighting conditions, they can detect most of the insulators in the image. Based on the observation of Figure 10, Figure 11, Figure 12, Figure 13 and Figure 14, the proposed network MTI-YOLO achieves good performances in all four common scenes and bright lighting conditions.

5. Conclusions

In this paper, to achieve a good trade-off among the accuracy, running time, and memory storage, a novel deep neural network (MTI-YOLO) is proposed to detect insulators in complex aerial images. First of all, insulator images captured by a UAV were collected and a composite insulator dataset “CCIN_detection” was constructed, which contains more common aerial scenes than that of the “CPLID” dataset. After that, to improve the accuracy and robustness of different-sized insulator detection, three improvements were implemented in the MTI-YOLO network. Finally, the proposed MTI-YOLO network and the compared networks were trained and tested on the “CCIN_detection” dataset. Experimental results and analysis validated that the proposed network achieves better performances than some YOLO networks. Specifically, compared with the network of YOLO-tiny, the AP value of our proposed network is 17% higher, and the precision is 16% higher. Compared with the network of YOLO-v2, the AP value of our proposed network is 9% higher, the precision is 21% higher, the memory usage is 25.6% lower, and the FLOPs are 10% lower. Compared with the network of YOLO-v3, the AP value of our proposed network is just a little lower, the precision is 1% higher, the memory usage is 38.9% lower, the FLOPs are 59.6% lower, and the running time is far less than that of YOLO-v3. Therefore, it can be concluded that using the proposed network to detect insulators can achieve good performance and it has the potential to be deployed on embedded devices.
For a future study, the proposed model will be used for UAV-based real-time transmission line inspection. In addition, the “CCIN_detection” dataset will be further improved and the proposed MTI-YOLO detection network will be optimized to obtain better performances.

Author Contributions

Writing, finished the experiment and this paper, C.L.; methodology, Y.W.; experiments, J.L.; labeling the ground truth for each image in our dataset, J.H. All authors have read and agreed to the published version of the manuscript.

Funding

This research was funded by the National Nature Science Founding of China under grant 61573183; Open Project Program of the National Laboratory of Pattern Recognition (NLPR) under grant 201900029; Excellent Young Talents support plan in Colleges of Anhui Province Grant gxyq 2019109, gxgnfx 2019056.

Institutional Review Board Statement

Not applicable.

Informed Consent Statement

Not applicable.

Data Availability Statement

Not applicable.

Acknowledgments

The authors wish to thank the editor and reviewers for their suggestions and thank Yiquan Wu for his guidance.

Conflicts of Interest

The authors declare no conflict of interest.

References

  1. Park, K.C.; Motai, Y.; Yoon, J.R. Acoustic Fault Detection Technique for High-Power Insulators. IEEE Trans. Ind. Electron. 2017, 64, 9699–9708. [Google Scholar] [CrossRef]
  2. Wang, J.; Liang, X.; Gao, Y. Failure analysis of decay-like fracture of composite insulator. IEEE Trans. Dielectr. Electr. Insul. 2015, 21, 2503–2511. [Google Scholar] [CrossRef]
  3. Yuan, J.; Tong, W.; Li, B. Application of image processing in patrol inspection of overhead transmission line by helicopter. J. Power Sys. Technol. 2010, 12, 204–208. [Google Scholar]
  4. Nguyen, V.N.; Jenssen, R.; Roverso, D. Automatic autonomous vision-based power line inspection: A review of current status and the potential role of deep learning. Int. J. Electr. Power Energy Syst. 2018, 99, 107–120. [Google Scholar] [CrossRef] [Green Version]
  5. Katrasnik, J.; Pernus, F.; Likar, B. A Survey of Mobile Robots for Distribution Power Line Inspection. IEEE Trans. Power Del. 2010, 25, 485–493. [Google Scholar] [CrossRef]
  6. Yang, L.; Fan, J.; Liu, Y.; Li, E.; Peng, J.; Liang, Z. A Review on State-of-the-Art Power Line Inspection Techniques. IEEE Trans. Instrum. Meas. 2020, 69, 9350–9365. [Google Scholar] [CrossRef]
  7. Menendez, O.; Auat Cheein, F.A.; Perez, M.; Kouro, S. Robotics in Power Systems: Enabling a More Reliable and Safe Grid. IEEE Ind. Electron. Mag. 2017, 11, 22–34. [Google Scholar] [CrossRef]
  8. Zhao, Z.; Liu, N.; Wang, L. Localization of multiple insulators by orientation angle detection and binary shape prior knowledge. IEEE Trans. Dielectr. Electr. Insul. 2015, 22, 3421–3428. [Google Scholar] [CrossRef]
  9. Zhai, Y.; Wang, D.; Zhang, M.; Wang, J.; Guo, F. Fault detection of insulator based on saliency and adaptive morphology. Multimed. Tools Appl. 2017, 76, 12051–12064. [Google Scholar] [CrossRef]
  10. Wu, Q.; An, J.; Lin, B. A Texture Segmentation Algorithm Based on PCA and Global Minimization Active Contour Model for Aerial Insulator Images. IEEE J. Sel. Topics Appl. Earth Observ. Remote Sens. 2012, 5, 1509–1518. [Google Scholar] [CrossRef]
  11. Liao, S.; An, J. A robust insulator detection algorithm based on local features and spatial orders for aerial images. IEEE Geosci. Remote Sens. Lett. 2017, 12, 963–967. [Google Scholar] [CrossRef]
  12. Li, B.F.; Wu, D.L.; Cong, Y.; Xia, Y.; Tang, Y. A Method of Insulator Detection from Video Sequence. In Proceedings of the 2012 Fourth International Symposium on Information Science and Engineering, Shanghai, China, 14–16 December 2012; pp. 386–389. [Google Scholar] [CrossRef]
  13. Cheng, H.; Zhai, Y.; Chen, R.; Wang, D.; Dong, Z.; Wang, Y. Self-Shattering Defect Detection of Glass Insulators Based on Spatial Features. Energies 2019, 12, 543. [Google Scholar] [CrossRef] [Green Version]
  14. Zhai, Y.; Chen, R.; Yang, Q.; Li, X.; Zhao, Z. Insulator fault detection based on spatial morphological features of aerial images. IEEE Access 2018, 6, 35316–35326. [Google Scholar] [CrossRef]
  15. Masita, K.L.; Hasan, A.N.; Shongwe, T. Deep Learning in Object Detection: A Review. In Proceedings of the 2020 International Conference on Artificial Intelligence, Big Data, Computing and Data Communication Systems (icABCD), Durban, South Africa, 6–7 August 2020. [Google Scholar] [CrossRef]
  16. Zhao, Z.; Zhen, Z.; Zhang, L.; Qi, Y.; Kong, Y.; Zhang, K. Insulator Detection Method in Inspection Image Based on Improved Faster R-CNN. Energies 2019, 12, 1204. [Google Scholar] [CrossRef] [Green Version]
  17. Redmon, J.; Divvala, S.; Girshick, R.; Farhadi, A. You only look once: Unifified, real-time object detection. In Proceedings of the IEEE Conference on Computer Vision and Pattern Recognition, Las Vegas, NV, USA, 26 June–1 July 2016; pp. 779–788. [Google Scholar] [CrossRef] [Green Version]
  18. Redmon, J.; Farhadi, A. YOLO9000: Better, faster, stronger. In Proceedings of the IEEE Conference on Computer Vision and Pattern Recognition, Honolulu, HI, USA, 21–26 July 2017; pp. 7263–7271. [Google Scholar] [CrossRef] [Green Version]
  19. Redmon, J.; Farhadi, A. Yolov3: An incremental improvement. arXiv 2018, arXiv:1804.02767. [Google Scholar]
  20. Liu, W.; Anguelov, D.; Erhan, D.; Szegedy, C.; Reed, S.; Fu, C.Y.; Berg, A.C. Ssd: Single shot multibox detector. In Proceedings of the European Conference on Computer Vision, Amsterdam, The Netherlands, 8–16 October 2016; Springer: Cham, Switzerland, 2016; pp. 21–37. [Google Scholar] [CrossRef] [Green Version]
  21. Girshick, R.; Donahue, J.; Darrell, T.; Malik, J. Rich feature hierarchies for accurate object detection and semantic segmentation. In Proceedings of the IEEE Conference on Computer Vision and Pattern Recognition, Dalian, China, 26–28 July 2014; pp. 580–587. [Google Scholar]
  22. Girshick, R. Fast r-cnn. In Proceedings of the IEEE International Conference on Computer Vision, Santiago, Chile, 7–13 December 2015; pp. 1440–1448. [Google Scholar] [CrossRef]
  23. Ren, S.; He, K.; Girshick, R.; Sun, J. Faster R-CNN: Towards Real-Time Object Detection with Region Proposal Networks. IEEE Trans. Pattern Anal. Mach. Intell. 2017, 39, 1137–1149. [Google Scholar] [CrossRef] [Green Version]
  24. Wang, Y.; Wang, J.; Gao, F.; Hu, P.; Xu, L.; Zhang, J.; Yu, Y.; Xue, J.; Li, J. Detection and Recognition for Fault Insulator Based on Deep Learning. In Proceedings of the 11th International Congress on Image and Signal Processing, BioMedical Engineering and Informatics (CISP-BMEI), Beijing, China, 13–15 October 2018. [Google Scholar] [CrossRef]
  25. Miao, X.; Liu, X.; Chen, J.; Zhuang, S.; Fan, J.; Jiang, H. Insulator Detection in Aerial Images for Transmission Line Inspection Using Single Shot Multibox Detector. IEEE Access 2019, 9945–9956. [Google Scholar] [CrossRef]
  26. Ling, Z.; Zhang, D.; Qiu, R.; Jin, Z.; Zhang, Y.; He, X.; Liu, H. An accurate and real-time self-blast glass insulator location method based on faster R-CNN and U-net with aerial images. CSEE J. Power Energy Syst. 2019, 5, 474–482. [Google Scholar]
  27. Tao, X.; Zhang, D.; Wang, Z.; Liu, X.; Zhang, H.; Xu, D. Detection of Power Line Insulator Defects Using Aerial Images Analyzed With Convolutional Neural Networks. IEEE Trans. Syst. Man Cybern. Syst. 2018, 1486–1498. [Google Scholar] [CrossRef]
  28. Sadykova, D.; Pernebayeva, D.; Bagheri, M.; James, A. IN-YOLO: Real-time Detection of Outdoor High Voltage Insulators using UAV Imaging. IEEE Trans. Power Del. 2019, 35, 1599–1601. [Google Scholar] [CrossRef]
  29. Han, J.; Yang, Z.; Xu, H.; Hu, G.; Zhang, C.; Li, H.; Lai, S.; Zeng, H. Search Like an Eagle: A Cascaded Model for Insulator Missing Faults Detection in Aerial Images. Energies 2020, 13, 713. [Google Scholar] [CrossRef] [Green Version]
  30. Adou, M.W.; Xu, H.; Chen, G. Insulator Faults Detection Based on Deep Learning. In Proceedings of the International Conference on Anti- Counterfeiting, Security, and Identification, Xiamen, China, 25–27 October 2019. [Google Scholar] [CrossRef]
  31. Wang, X.; Xu, T.; Zhang, J.; Chen, S. SO-YOLO Based WBC Detection with Fourier Ptychographic Microscopy. IEEE Access 2018, 6, 51566–51576. [Google Scholar] [CrossRef]
  32. Fang, W.; Wang, L.; Ren, P. Tinier-YOLO: A Real-time Object Detection Method for Constrained Environments. IEEE Access 2019, 1–10. [Google Scholar] [CrossRef]
  33. Zhang, Z.; Wang, H.; Zhang, J.; Yang, W. A vehicle real-time detection algorithm based on YOLOv2 framework. In Proceedings of the International Conference on Real-time Image & Video Processing, Orlando, FL, USA, 16–17 April 2018. [Google Scholar] [CrossRef]
  34. Liu, M.; Wang, X.; Zhou, A.; Fu, X.; Ma, Y.; Piao, C. UAV-YOLO: Small Object Detection on Unmanned Aerial Vehicle Perspective. Sensors 2020, 20, 2238. [Google Scholar] [CrossRef] [PubMed] [Green Version]
  35. Li, T.; Ma, Y.; Endoh, T. A Systematic Study of Tiny YOLO3 Inference: Toward Compact Brainware Processor with Less Memory and Logic Gate. IEEE Access 2020, 8, 142931–142955. [Google Scholar] [CrossRef]
  36. Sha, G.; Wu, J.; Yu, B. Detection of Spinal Fracture Lesions Based on Improved Yolo-tiny. In Proceedings of the 2020 IEEE International Conference on Advances in Electrical Engineering and Computer Applications (AEECA), Dalian, China, 25–27 August 2020. [Google Scholar] [CrossRef]
  37. He, K.; Zhang, X.; Ren, S.; Sun, J. Identity mappings in deep residual networks. In Proceedings of the 14th European Conference on Computer Vision, Scottsdale, AZ, USA, 3–7 November 2014; pp. 630–645. [Google Scholar] [CrossRef] [Green Version]
  38. Liu, S.; Qi, L.; Qin, H.; Shi, J.; Jia, J. Path Aggregation Network for Instance Segmentation. In Proceedings of the 2018 IEEE/CVF Conference on Computer Vision and Pattern Recognition (CVPR), Salt Lake City, UT, USA, 18–23 June 2018. [Google Scholar] [CrossRef] [Green Version]
  39. Lin, T.Y.; Dollar, P.; Girshick, R.; He, K.; Hariharan, B.; Belongie, S. Feature Pyramid Networks for Object Detection. In Proceedings of the 2017 IEEE Conference on Computer Vision and Pattern Recognition (CVPR), Honolulu, HI, USA, 21–26 July 2017. [Google Scholar] [CrossRef] [Green Version]
  40. Li, Y.; Pei, X.; Huang, Q.; Jiao, L.; Shang, R.; Marturi, N. Anchor-Free Single Stage Detector in Remote Sensing Images Based on Multiscale Dense Path Aggregation Feature Pyramid Network. IEEE Access 2020, 8, 63121–63133. [Google Scholar] [CrossRef]
  41. He, K.; Zhang, X.; Ren, S.; Sun, J. Spatial Pyramid Pooling in Deep Convolutional Networks for Visual Recognition. IEEE Trans. Pattern Anal. Mach. Intell. 2015, 37, 1904–1916. [Google Scholar] [CrossRef] [Green Version]
  42. Huang, Z.; Wang, J. DC-SPP-YOLO: Dense Connection and Spatial Pyramid Pooling Based YOLO for Object Detection. arXiv 2019, arXiv:1903.08589. [Google Scholar] [CrossRef] [Green Version]
  43. Zhang, P.; Zhong, Y.; Li, X. SlimYOLOv3: Narrower, Faster and Better for Real-Time UAV Applications. In Proceedings of the 2019 IEEE/CVF International Conference on Computer Vision Workshop (ICCVW), Seoul, Korea, 27–28 October 2020. [Google Scholar] [CrossRef] [Green Version]
  44. Kim, K.J.; Kim, P.K.; Chung, Y.S.; Choi, D.-H. Performance Enhancement of YOLOv3 by Adding Prediction Layers with Spatial Pyramid Pooling for Vehicle Detection. In Proceedings of the 2018 15th IEEE International Conference on Advanced Video and Signal Based Surveillance (AVSS), Auckland, New Zealand, 27–30 November 2018. [Google Scholar] [CrossRef]
  45. Wang, X.; Wang, S.; Cao, J.; Wang, Y. Data-driven based tiny-YOLOv3 method for front vehicle detection inducing SPP-net. IEEE Access 2020. [Google Scholar] [CrossRef]
  46. Han, J.; Yang, Z.; Zhang, Q.; Chen, C.; Li, H.; Lai, S.; Hu, G.; Xu, C.; Xu, H.; Wang, D.; et al. A Method of Insulator Faults Detection in Aerial Images for High-Voltage Transmission Lines Inspection. Appl. Sci. 2019, 9, 2009. [Google Scholar] [CrossRef] [Green Version]
  47. Available online: https://github.com/InsulatorData/InsulatorDataSet (accessed on 15 September 2020).
  48. Project of the Dark-Net Framework. Available online: https://github.com/AlexeyAB/darknet (accessed on 25 October 2020).
  49. Zhao, H.; Zhou, Y.; Zhang, L.; Peng, Y.; Hu, X.; Peng, H.; Cai, X. Mixed YOLOv3-LITE: A Lightweight Real-Time Object Detection Method. Sensors 2020, 20, 1861. [Google Scholar] [CrossRef] [PubMed] [Green Version]
Figure 1. The existing inspection methods of power transmission systems.
Energies 14 01426 g001
Figure 2. The network structure of You Only Look Once (YOLO)-tiny.
Energies 14 01426 g002
Figure 3. The entire structure of the modified YOLO-tiny for insulator (MTI-YOLO) network.
Energies 14 01426 g003
Figure 4. The structure of backbone network.
Energies 14 01426 g004
Figure 5. Two structures of residual blocks (ResBlocks).
Energies 14 01426 g005
Figure 6. The structure of multi-scale feature fusing.
Energies 14 01426 g006
Figure 7. The structure of introduced spatial pyramid pooling.
Energies 14 01426 g007
Figure 8. Sample images of the “CCIN_detection” dataset.
Energies 14 01426 g008
Figure 9. The precision–recall curves of the proposed network and the three compared networks.
Energies 14 01426 g009
Figure 10. Experimental scene with background of buildings.
Energies 14 01426 g010
Figure 11. Experimental scene with background of vegetation.
Energies 14 01426 g011aEnergies 14 01426 g011b
Figure 12. Experimental scene with background of sky.
Energies 14 01426 g012
Figure 13. Experimental scene with background of power tower.
Energies 14 01426 g013
Figure 14. Experimental results with bright lighting conditions.
Energies 14 01426 g014aEnergies 14 01426 g014b
Table 1. The insulator of “CCIN_detection” dataset.
Images NumberTraining SetTesting SetImage SizeInsulator Number
450030001500416 × 4168165
Table 2. The anchor boxes for the training models.
KK = 1K = 3K = 5K = 7K = 9K = 11K = 12K = 13K = 14K = 15
IOU38.98%62.79%67.57%71.76%74.90%75.81%76.74%77.18%77.99%78.46%
modelYOLO-tiny networkMTI-YOLO network
Anchor boxesScale 1(127 × 99), (258 × 81), (260 × 147)(267 × 83), (159 × 120), (279 × 153)
Scale 2(85 × 21), (94 × 43), (228 × 47)(63 × 116), (154 × 67), (250 × 47)
Scale 3 (78 × 20), (71 × 45), (122 × 32)
Table 3. Experiment environment.
ParametersConfiguration
CPUIntel-CPU-i9-9900K, CPU/8 GHz, RAM/32 GB
GPUNvidia GeForce GTX 3080(10G)
Operating SystemWindows 10
Accelerated EnvironmentCUDA 11.1, cuDNN 8.0.5
Training FrameworkDark-net
Visual Studio FrameworkVisual Studio 2017, Open CV 3.4
Table 4. Experimental parameters configuration.
Input SizeChannelBatch SizeBatch SizeLearning Rate
416 × 416364160.001–0.00001
MomentumSaturationExposureHueTraining Step
0.91.51.50.138,000
Table 5. The measurements indexes of different networks.
NetworksPrecisionRecallAPRunning Times (ms)FLOPsMemory Usage (MB)
YOLO-tiny79%67%72.78%3.965.4533.89
YOLO-v274%85%80.88%4.5629.34197.57
YOLO-v394%95%90.29%11.6765.30240.53
Our network95%91%89.72%6.4426.39146.93
Publisher’s Note: MDPI stays neutral with regard to jurisdictional claims in published maps and institutional affiliations.

