
A Diagnosis Method of Bearing and Stator Fault in Motor Using Rotating Sound Based on Deep Learning


Abstract
1. Introduction
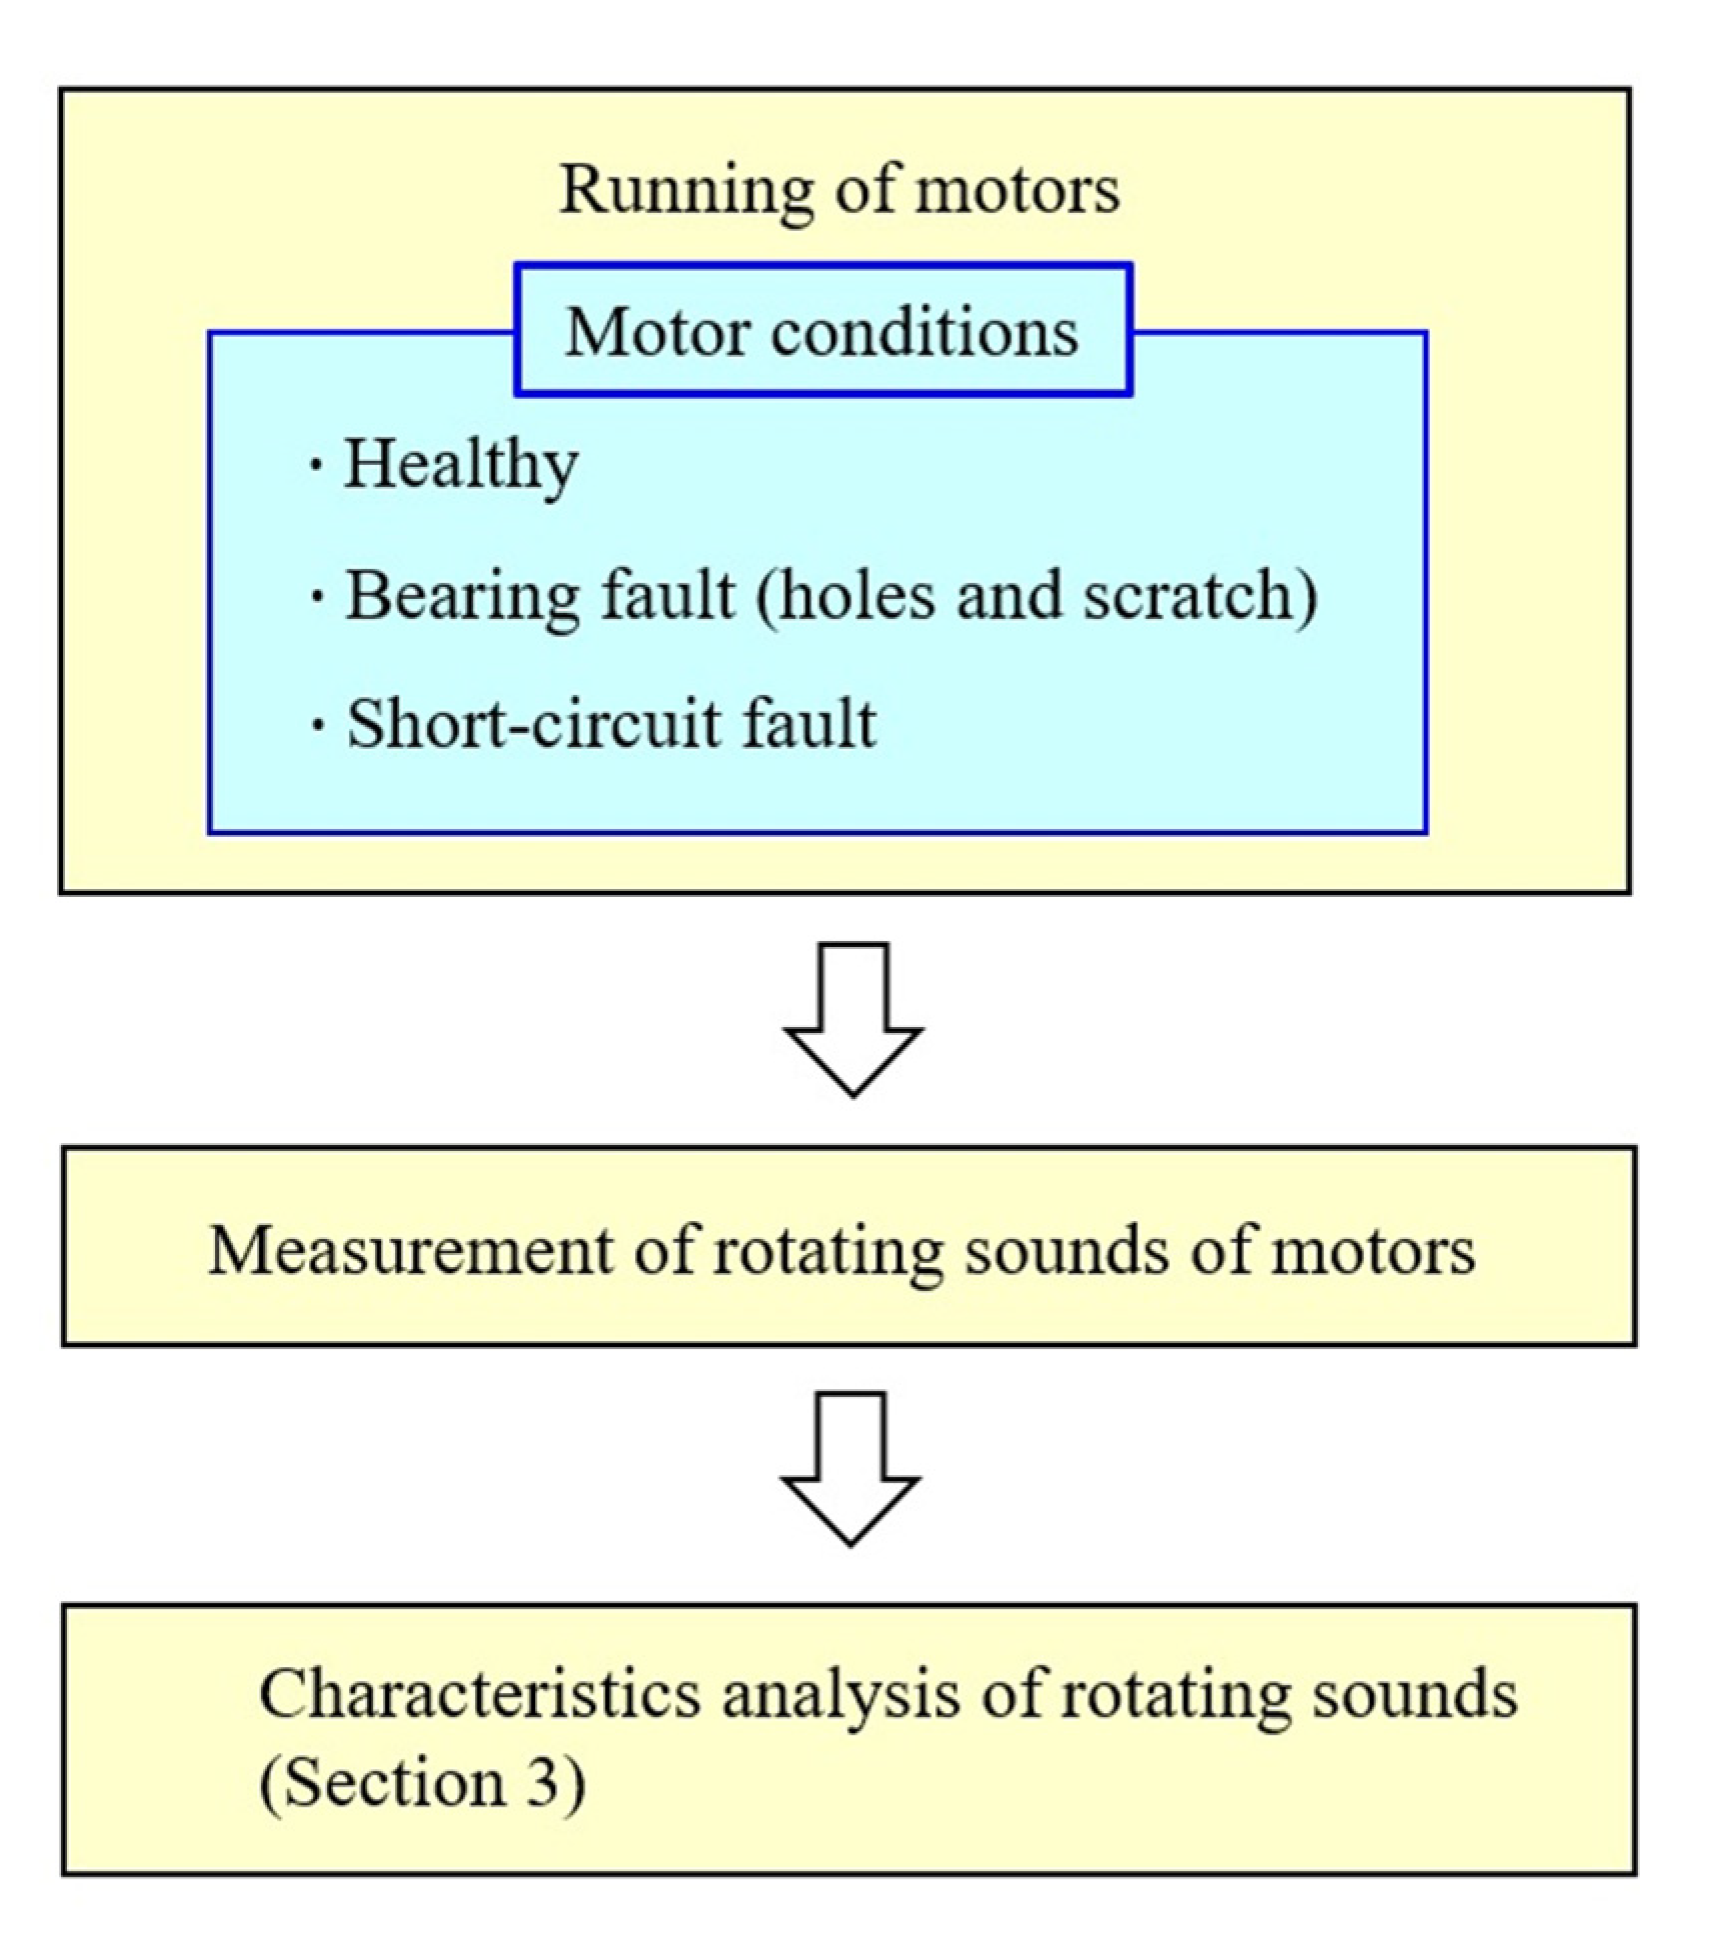
2. Experiments
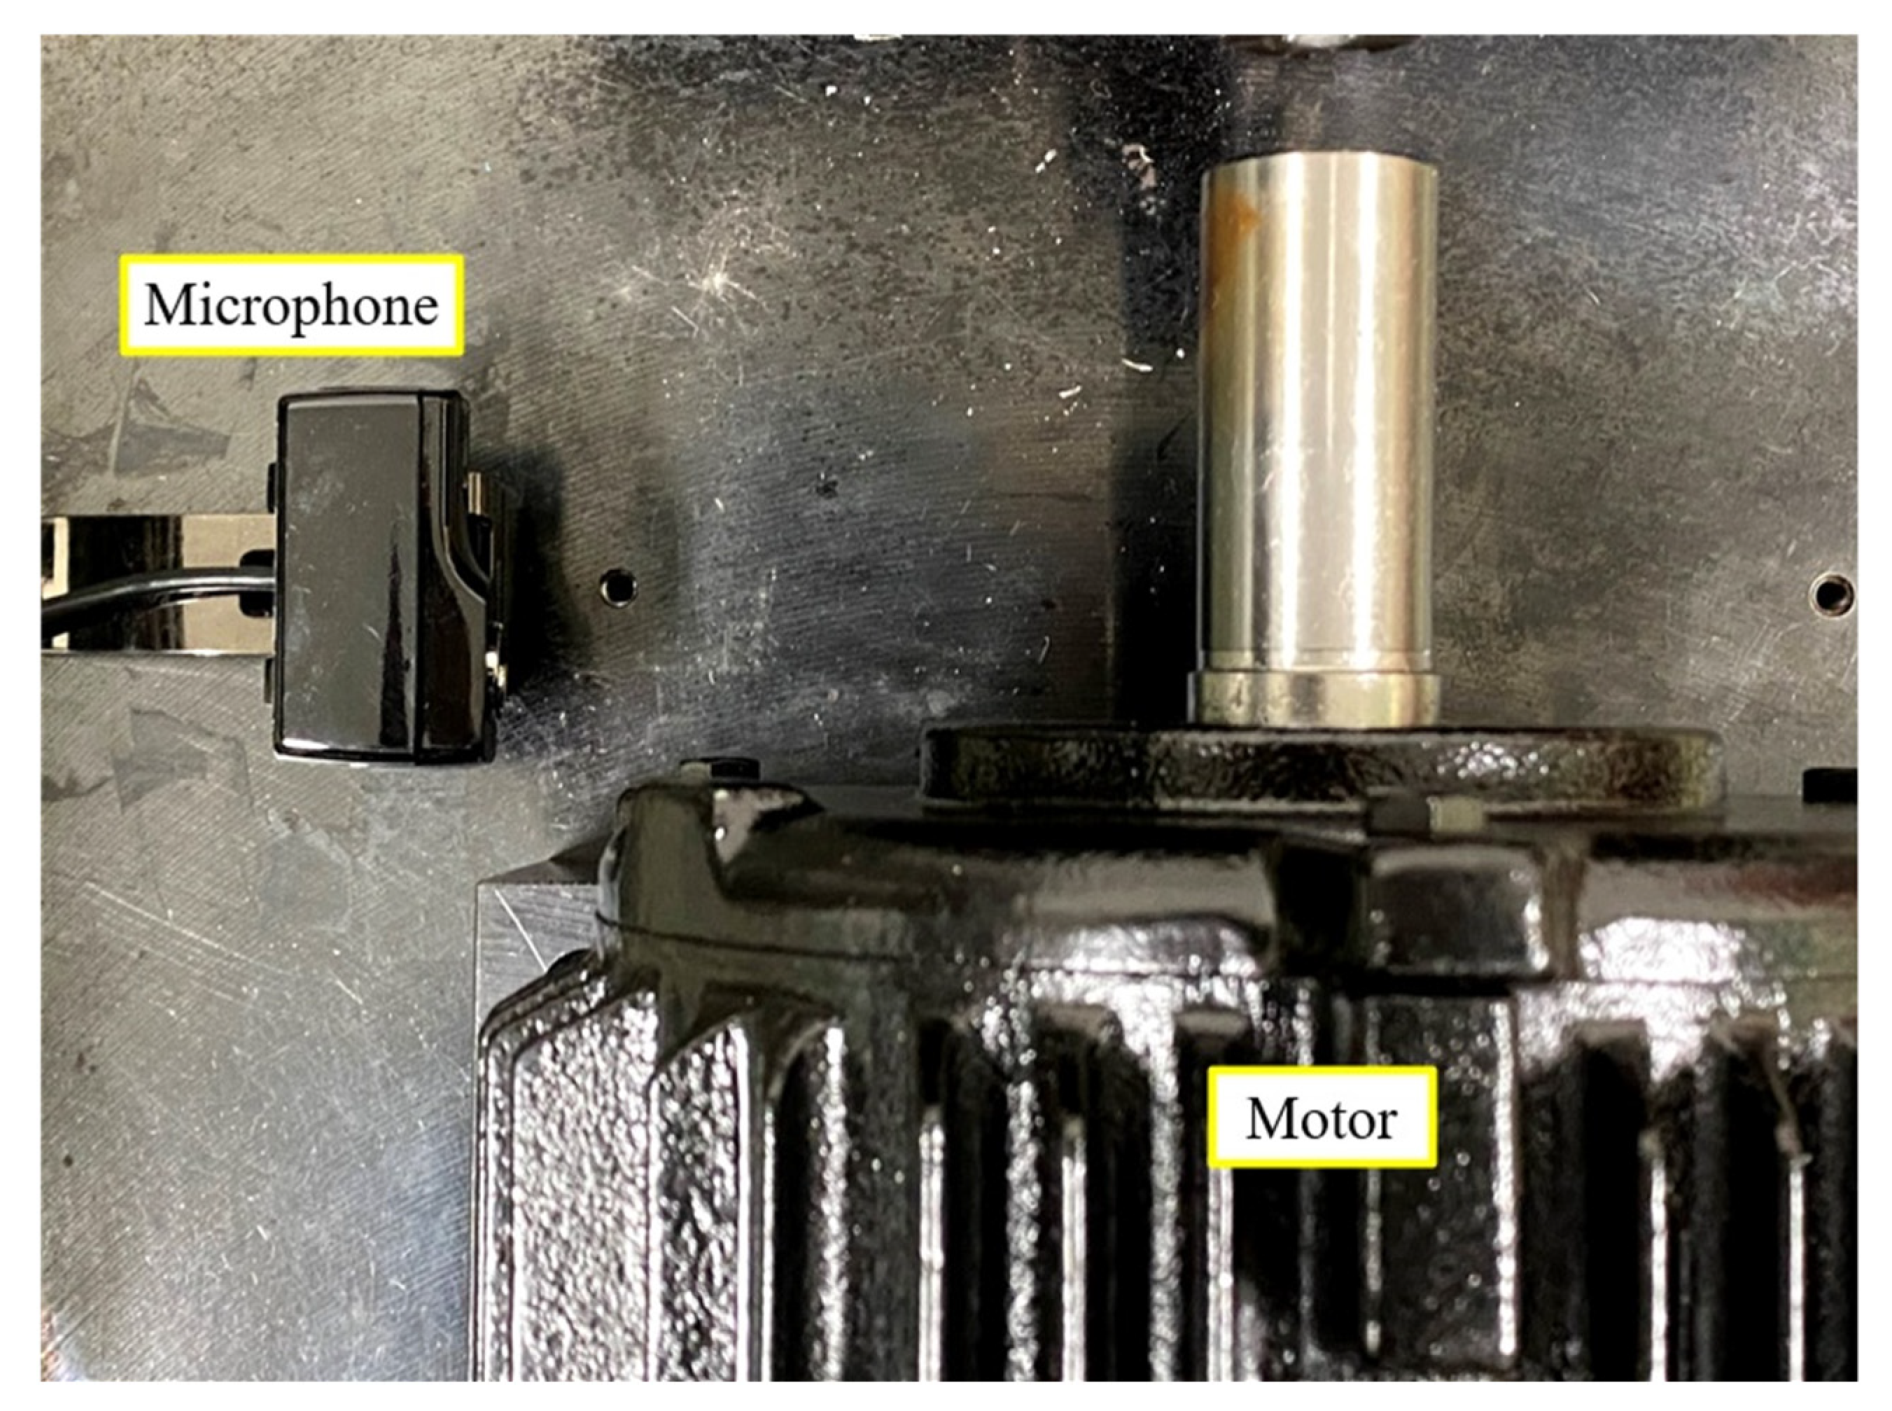
2.1. Experimental Setup
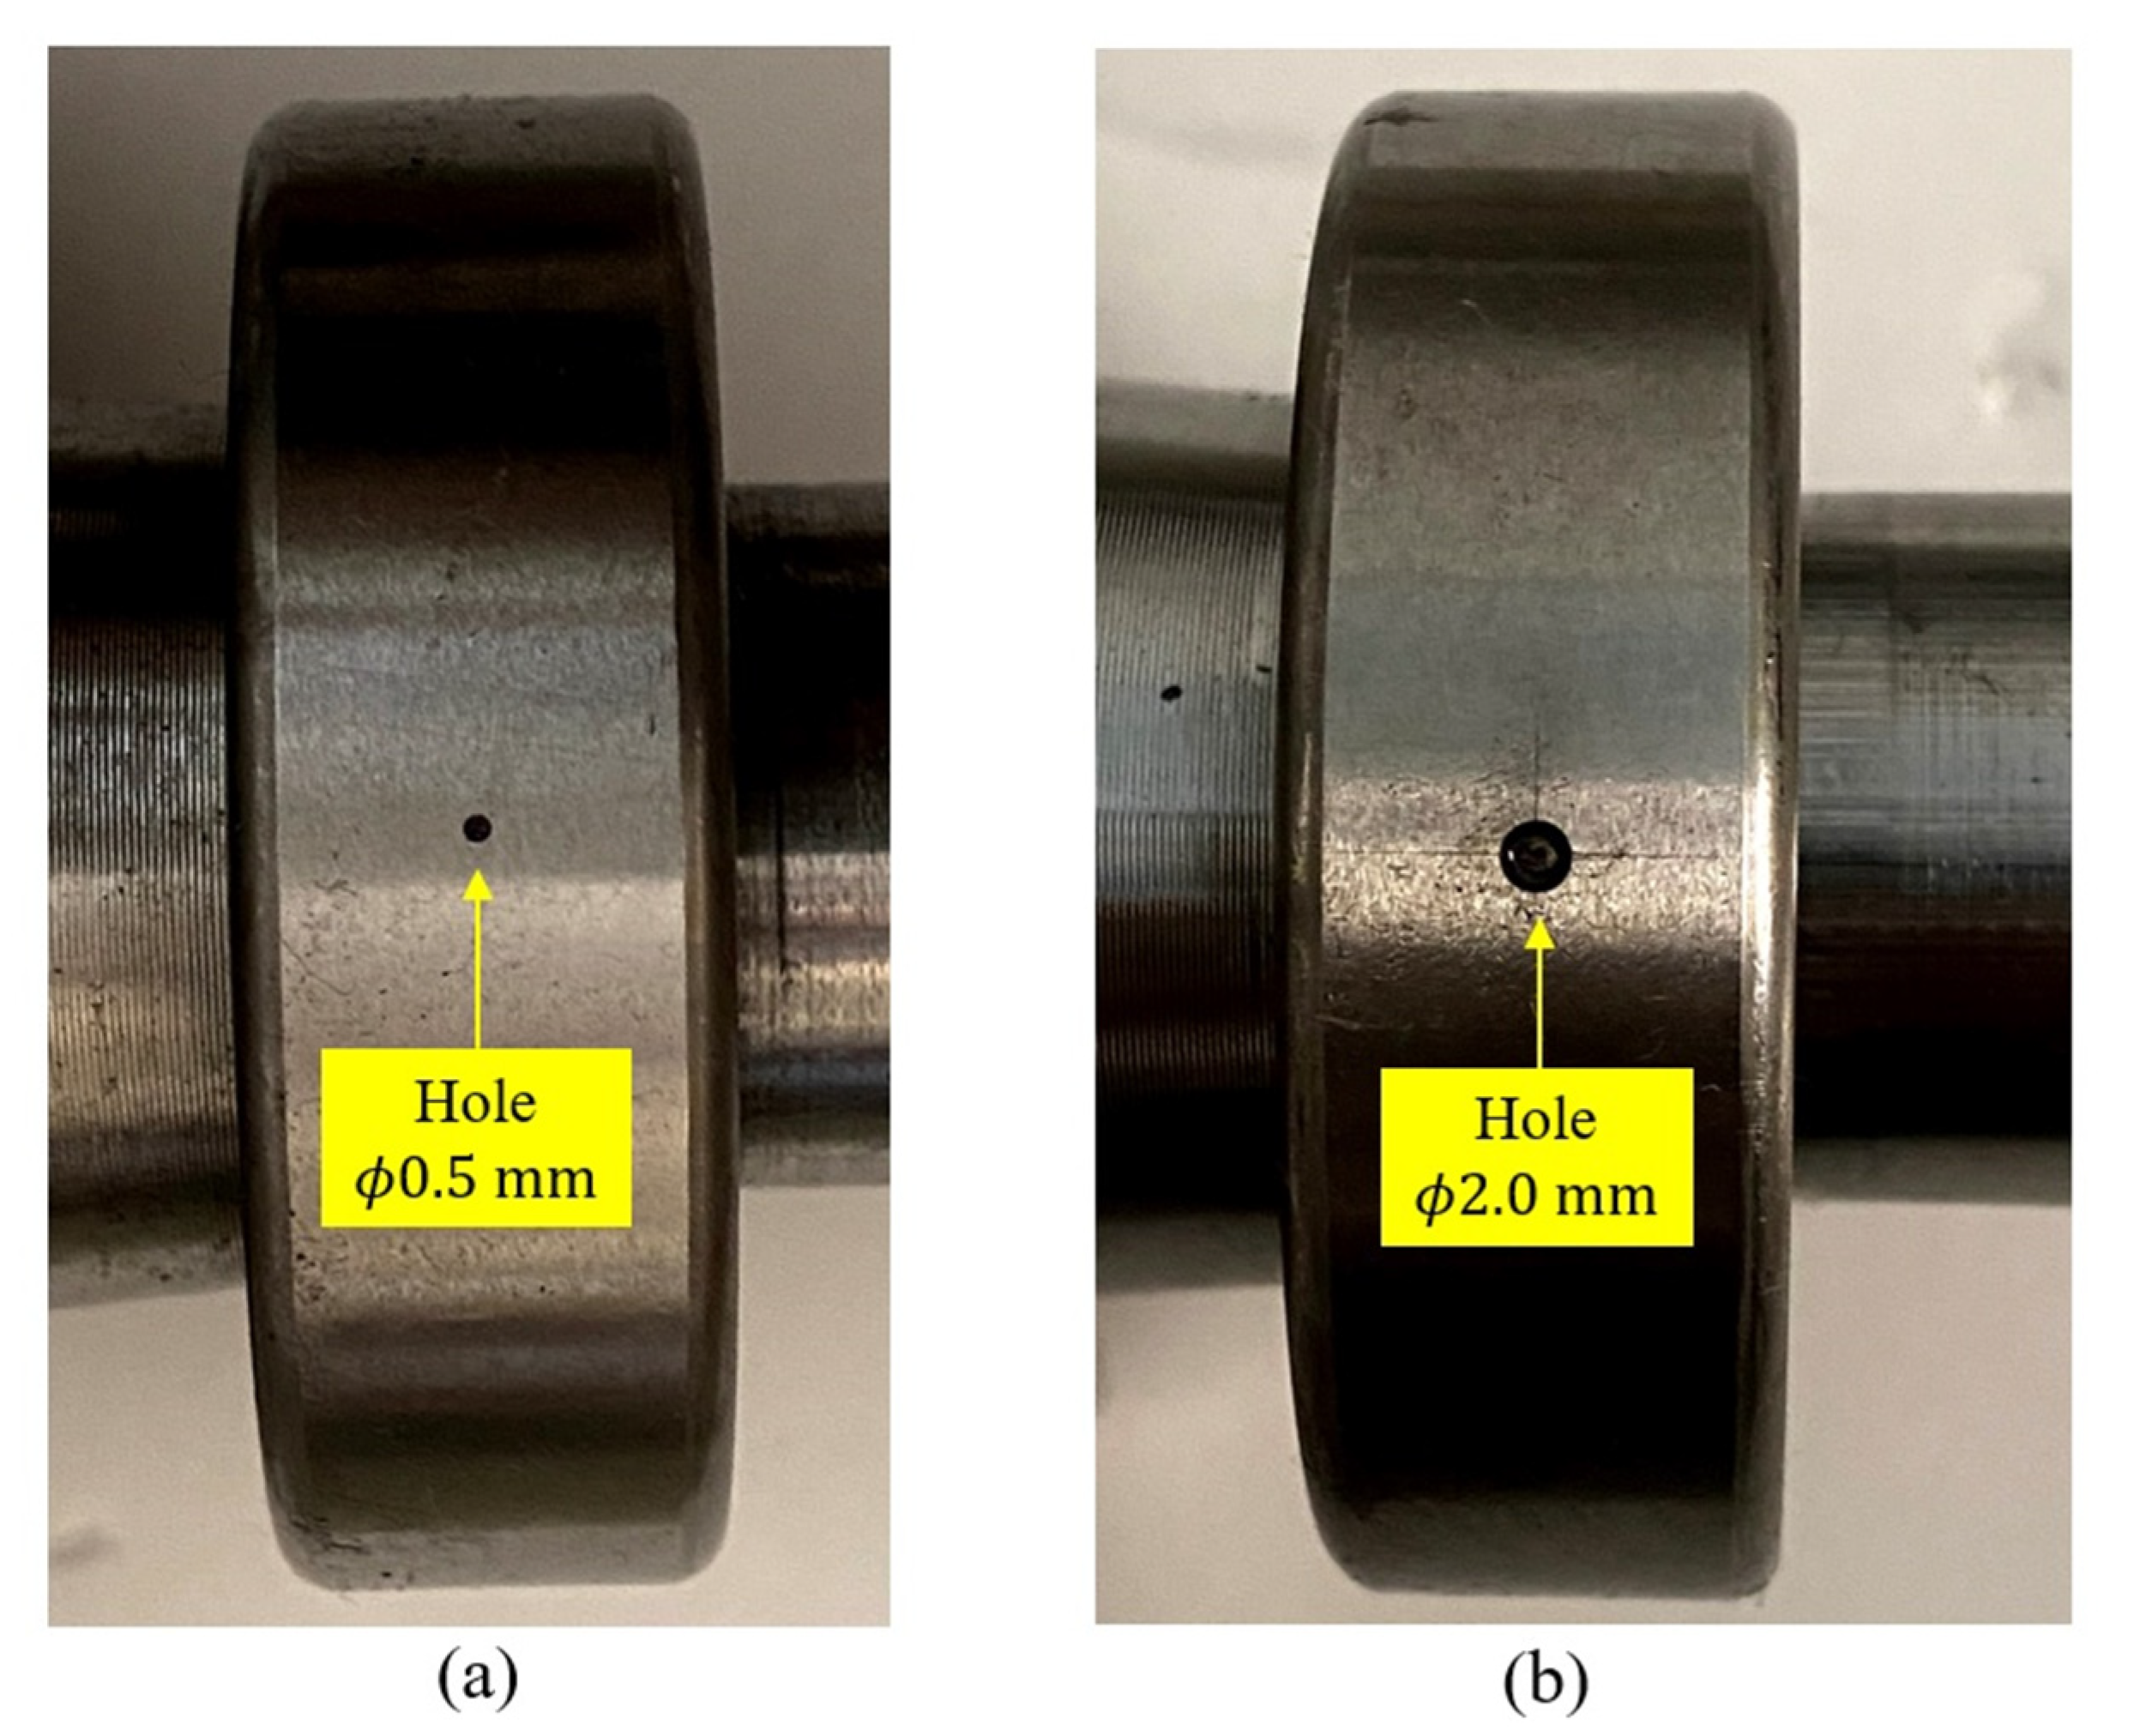
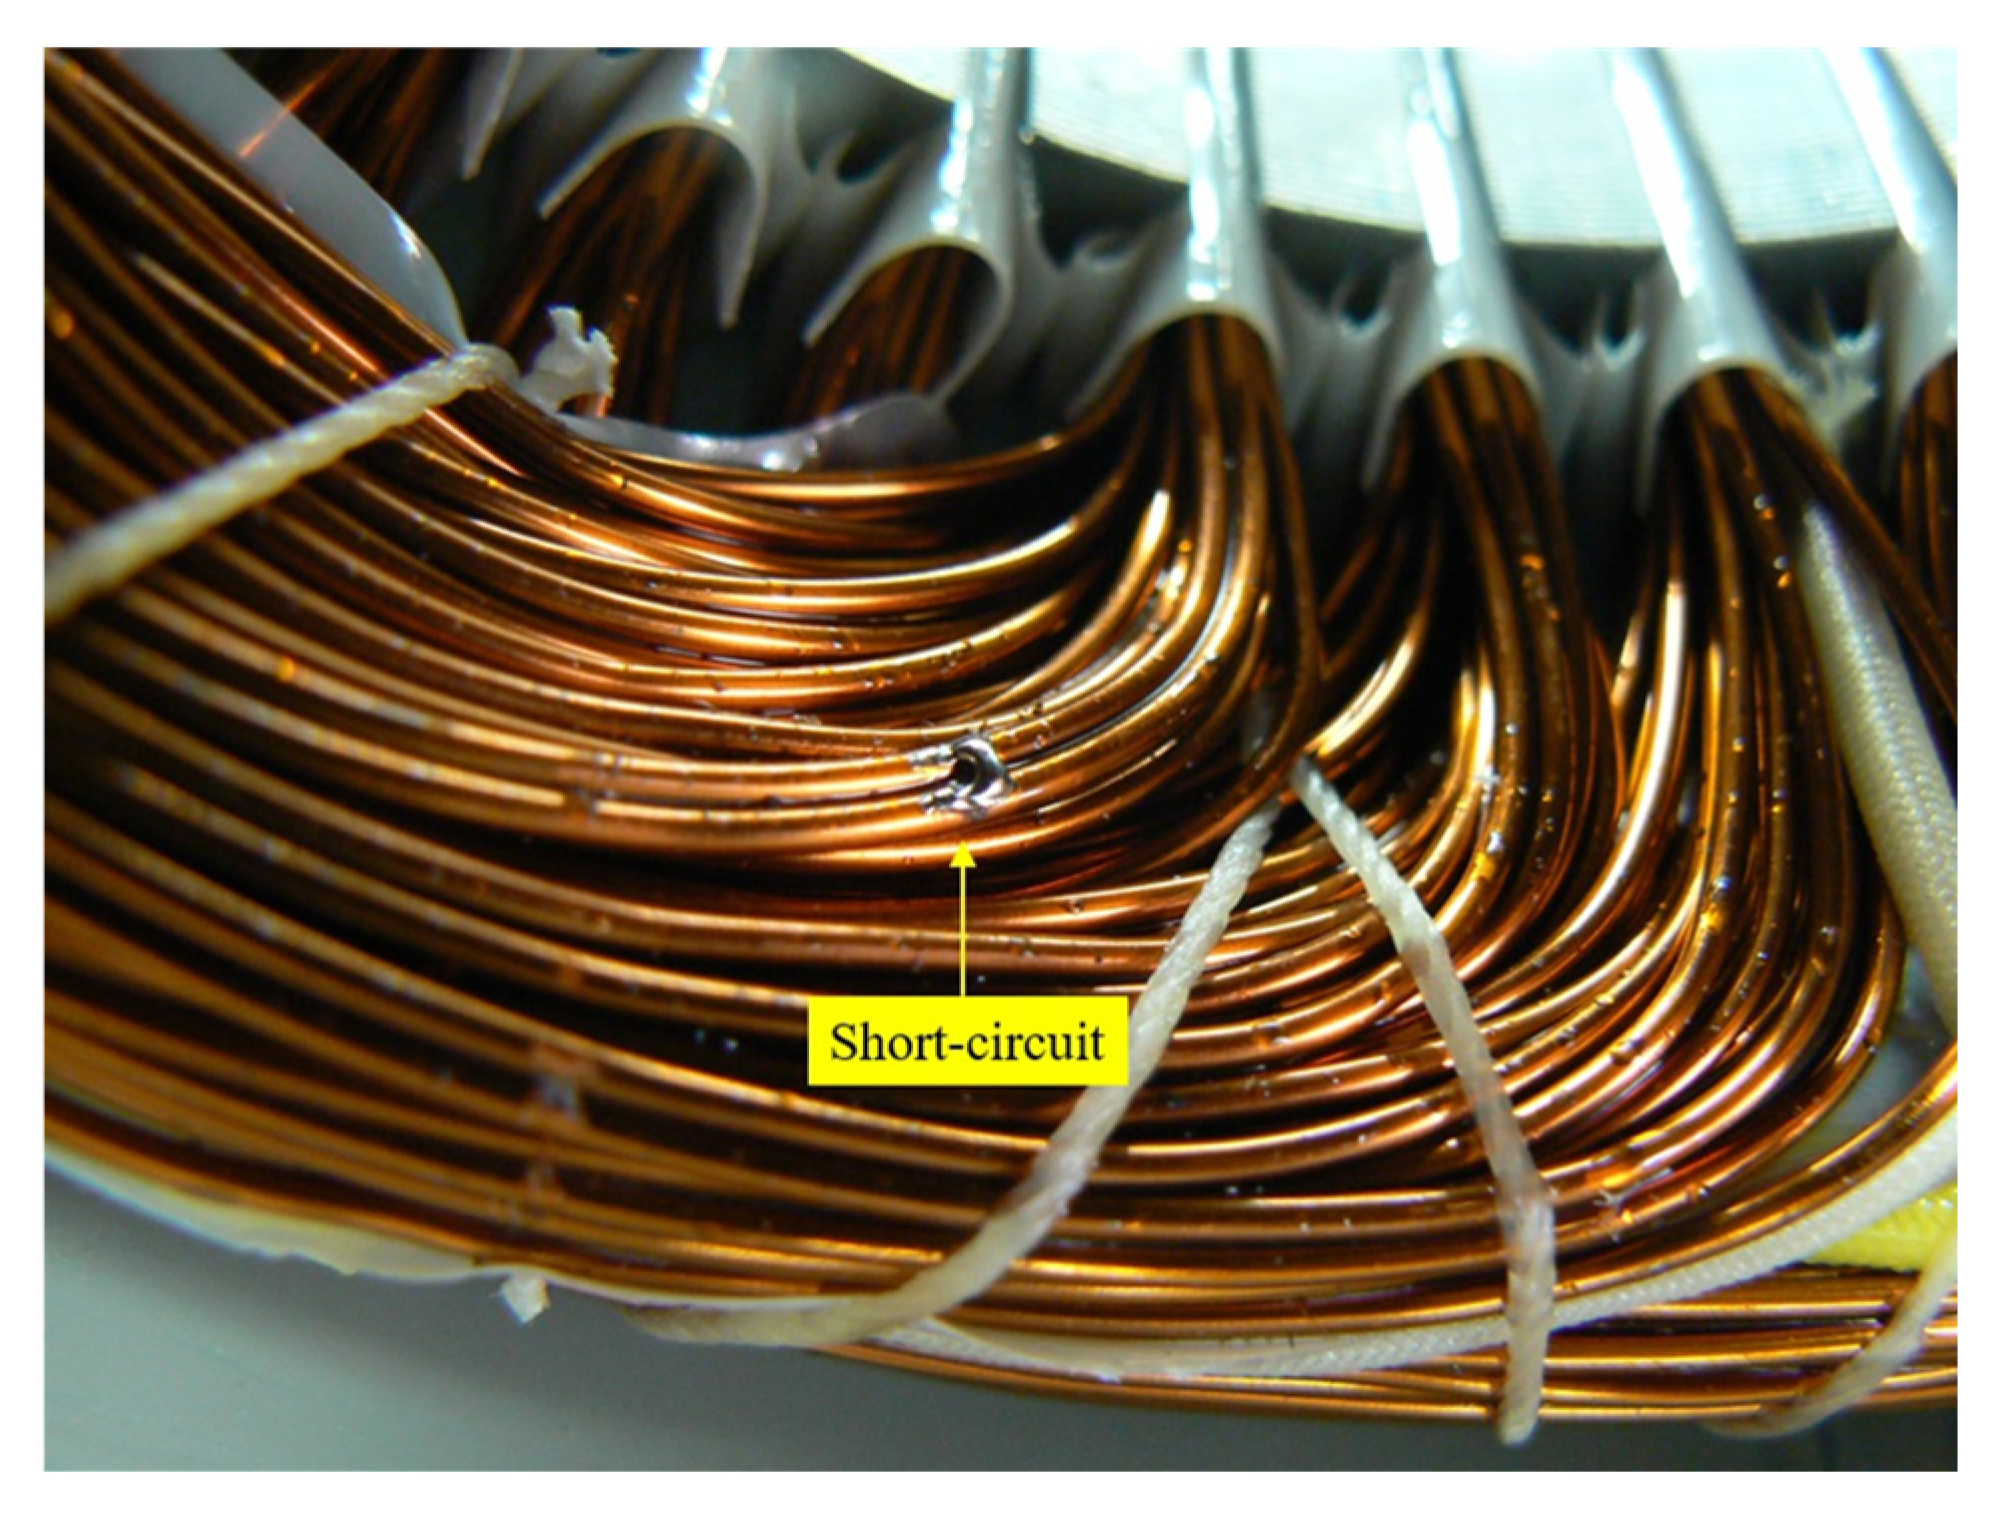
2.2. Reproduction of Faults
3. Characteristics of Rotating Sounds of Motors under Each Condition
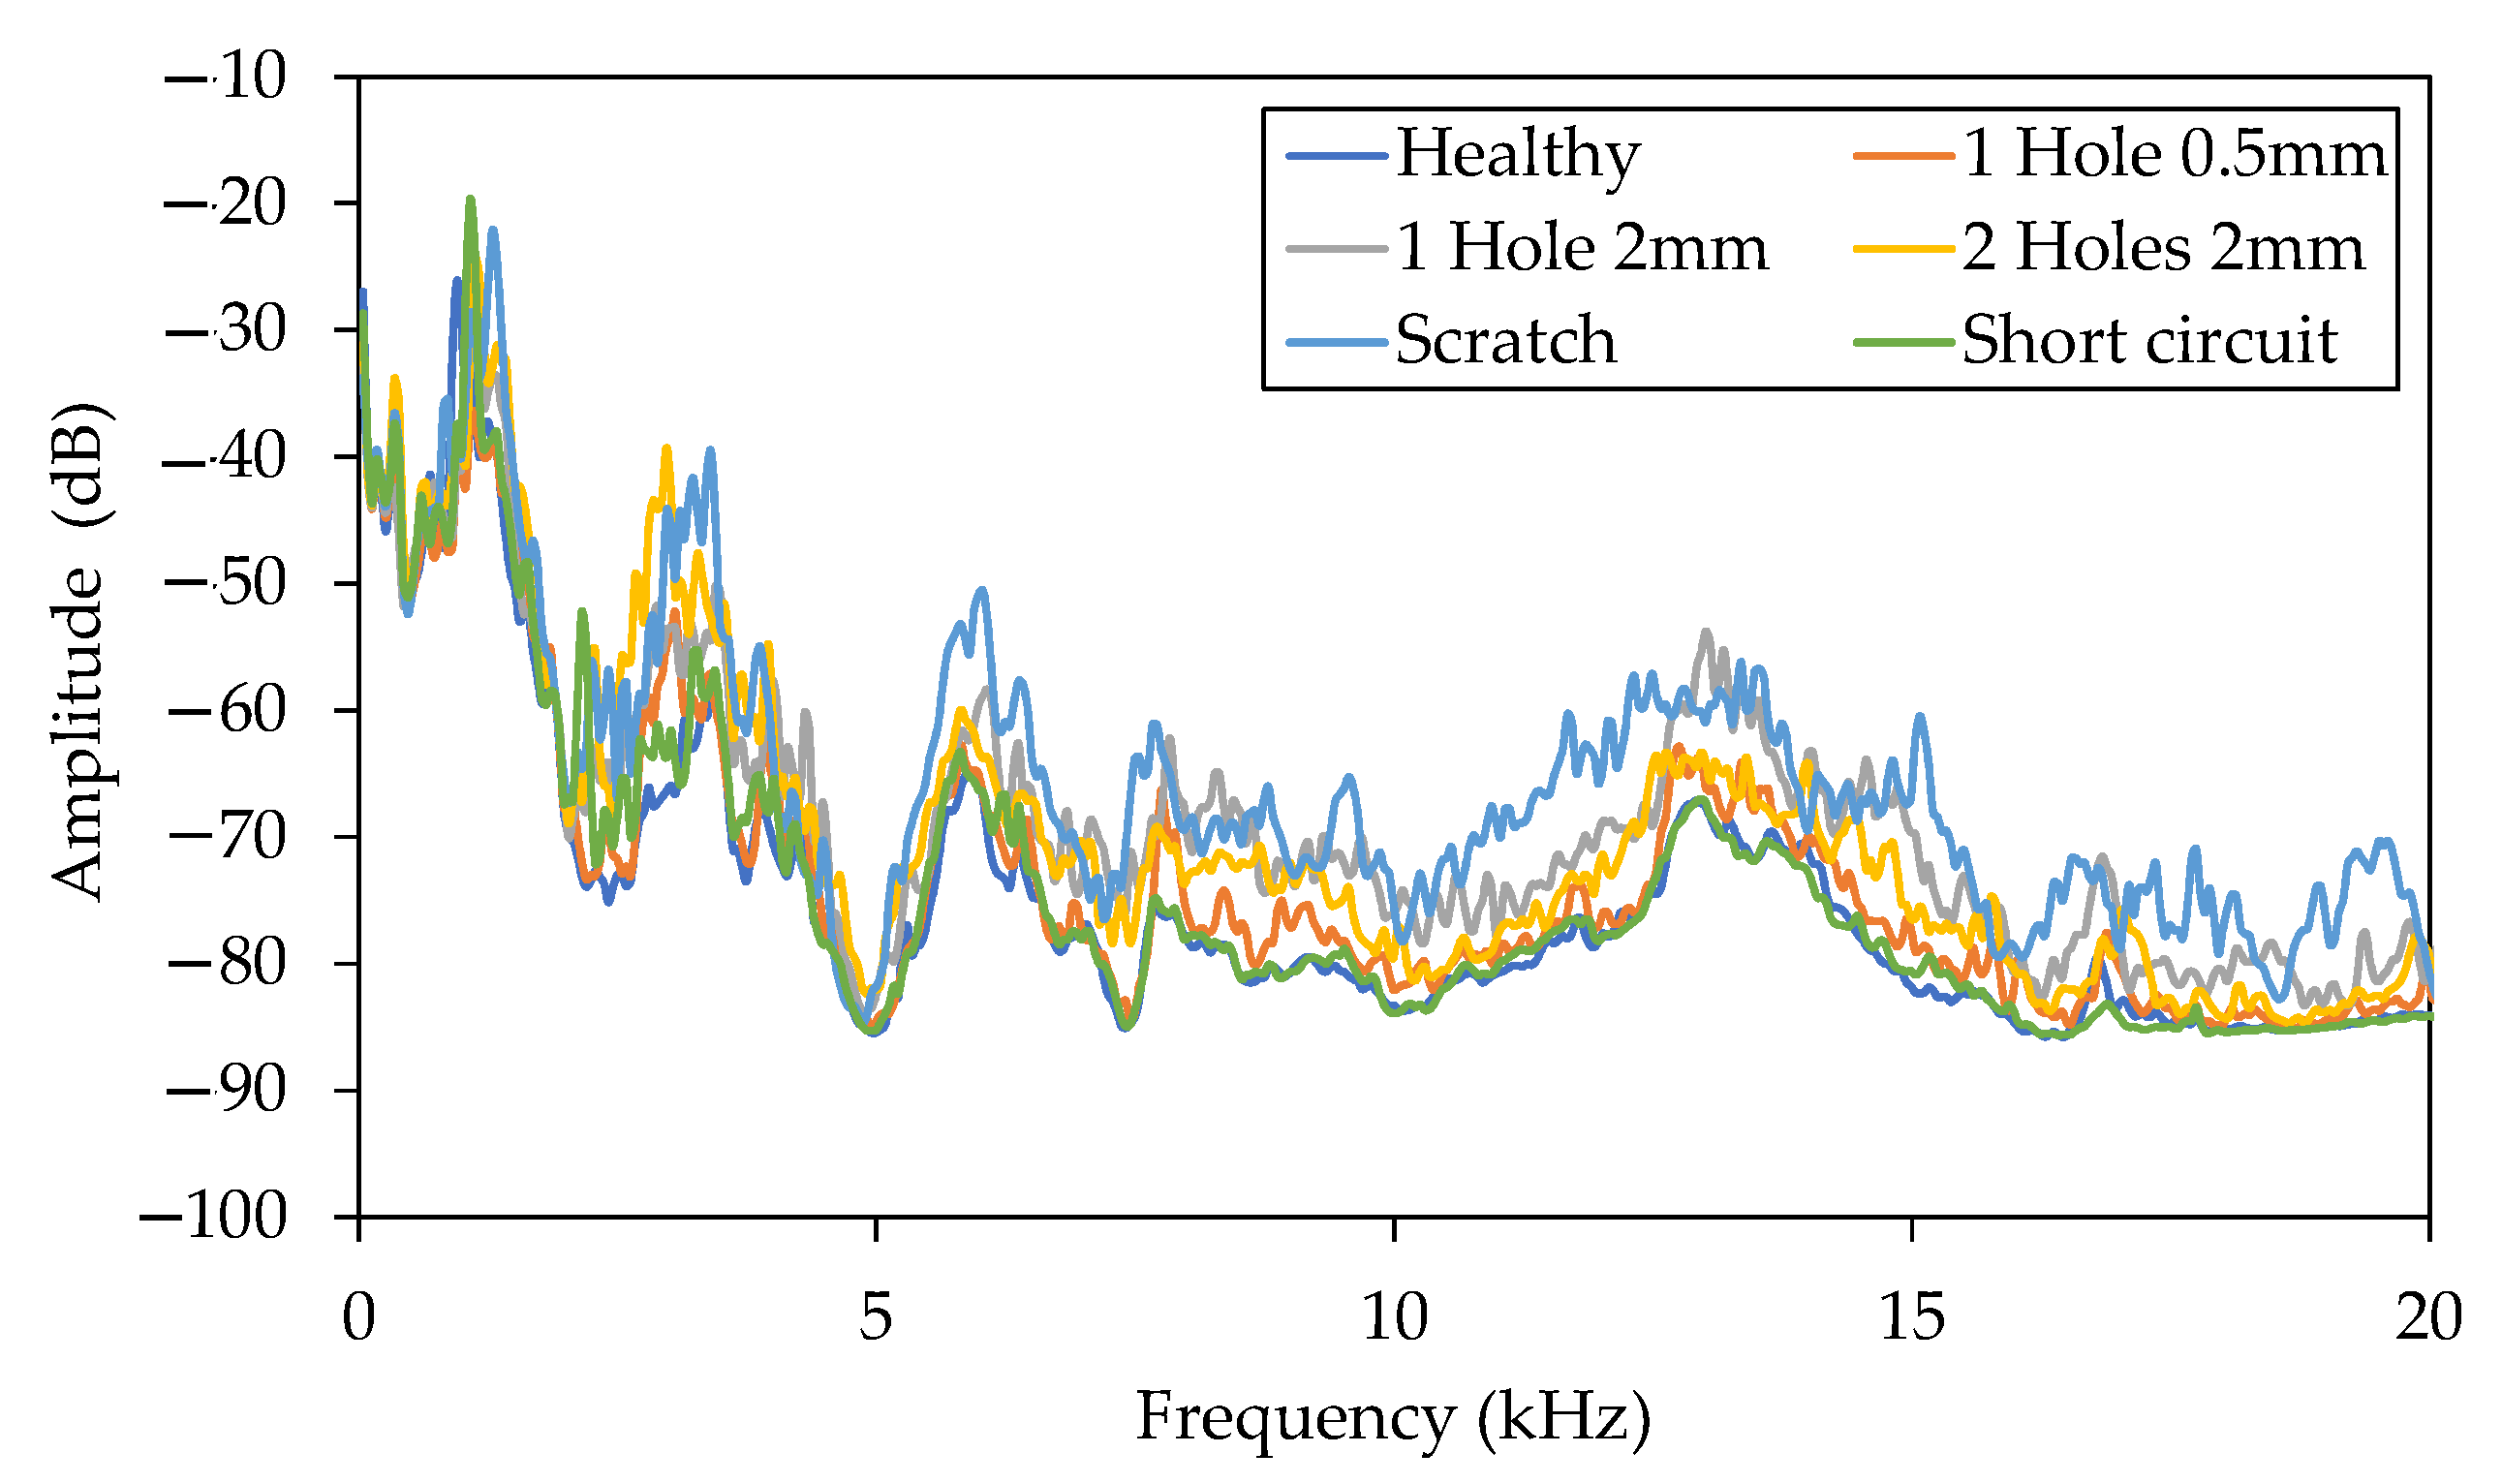
3.1. Experimental Results
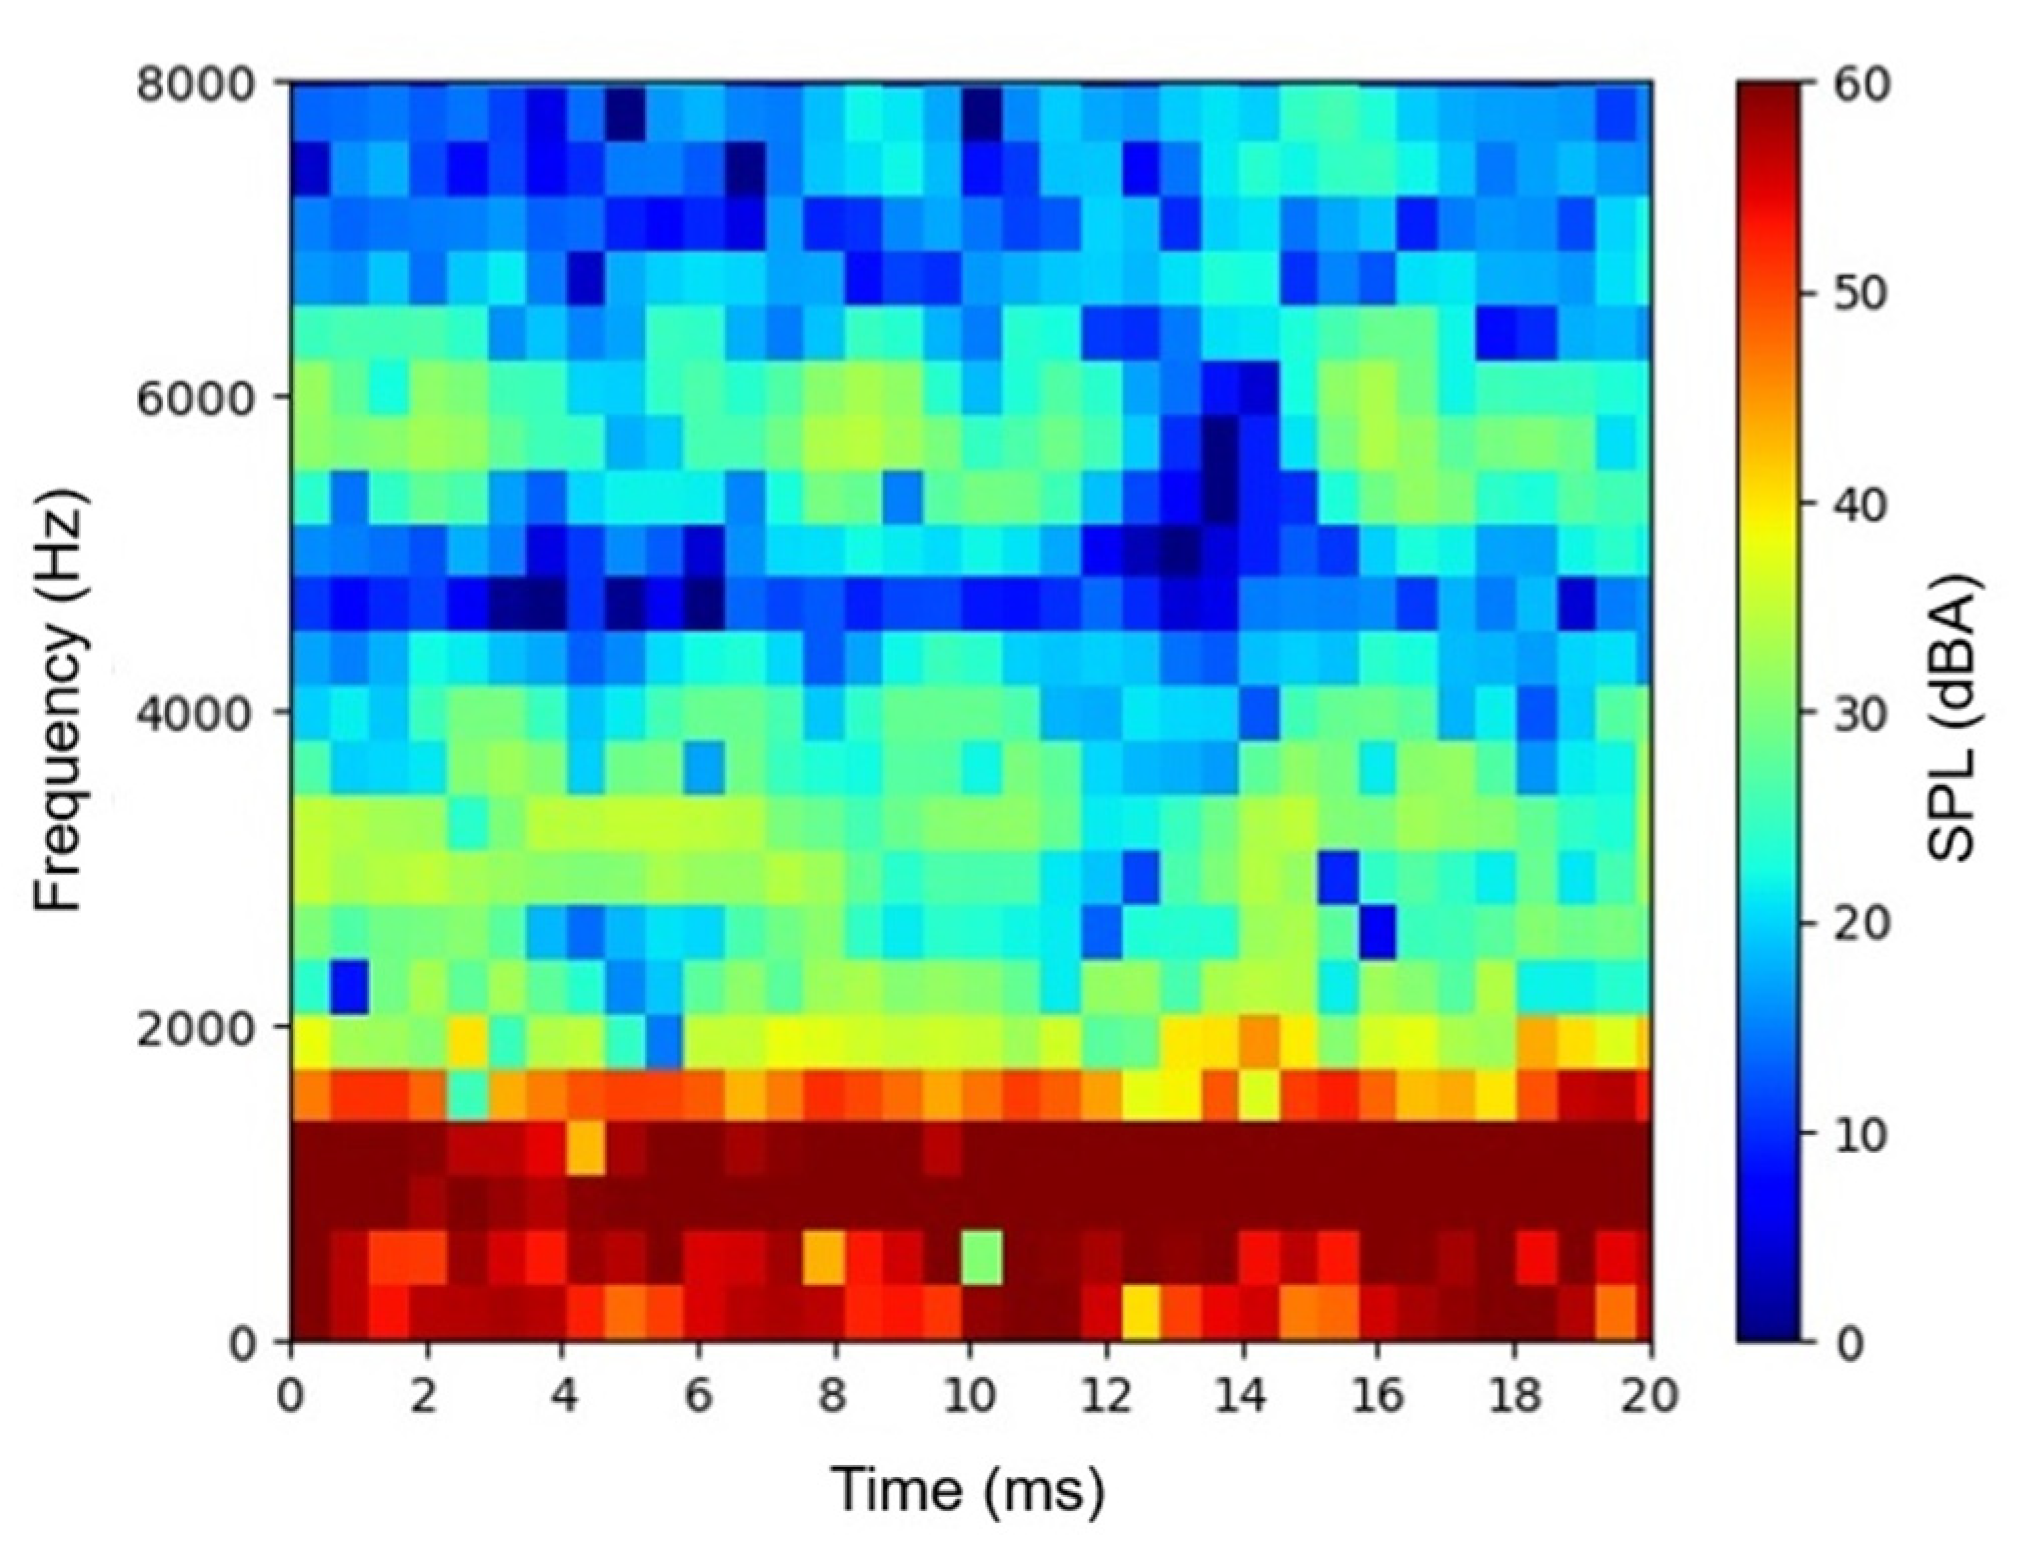
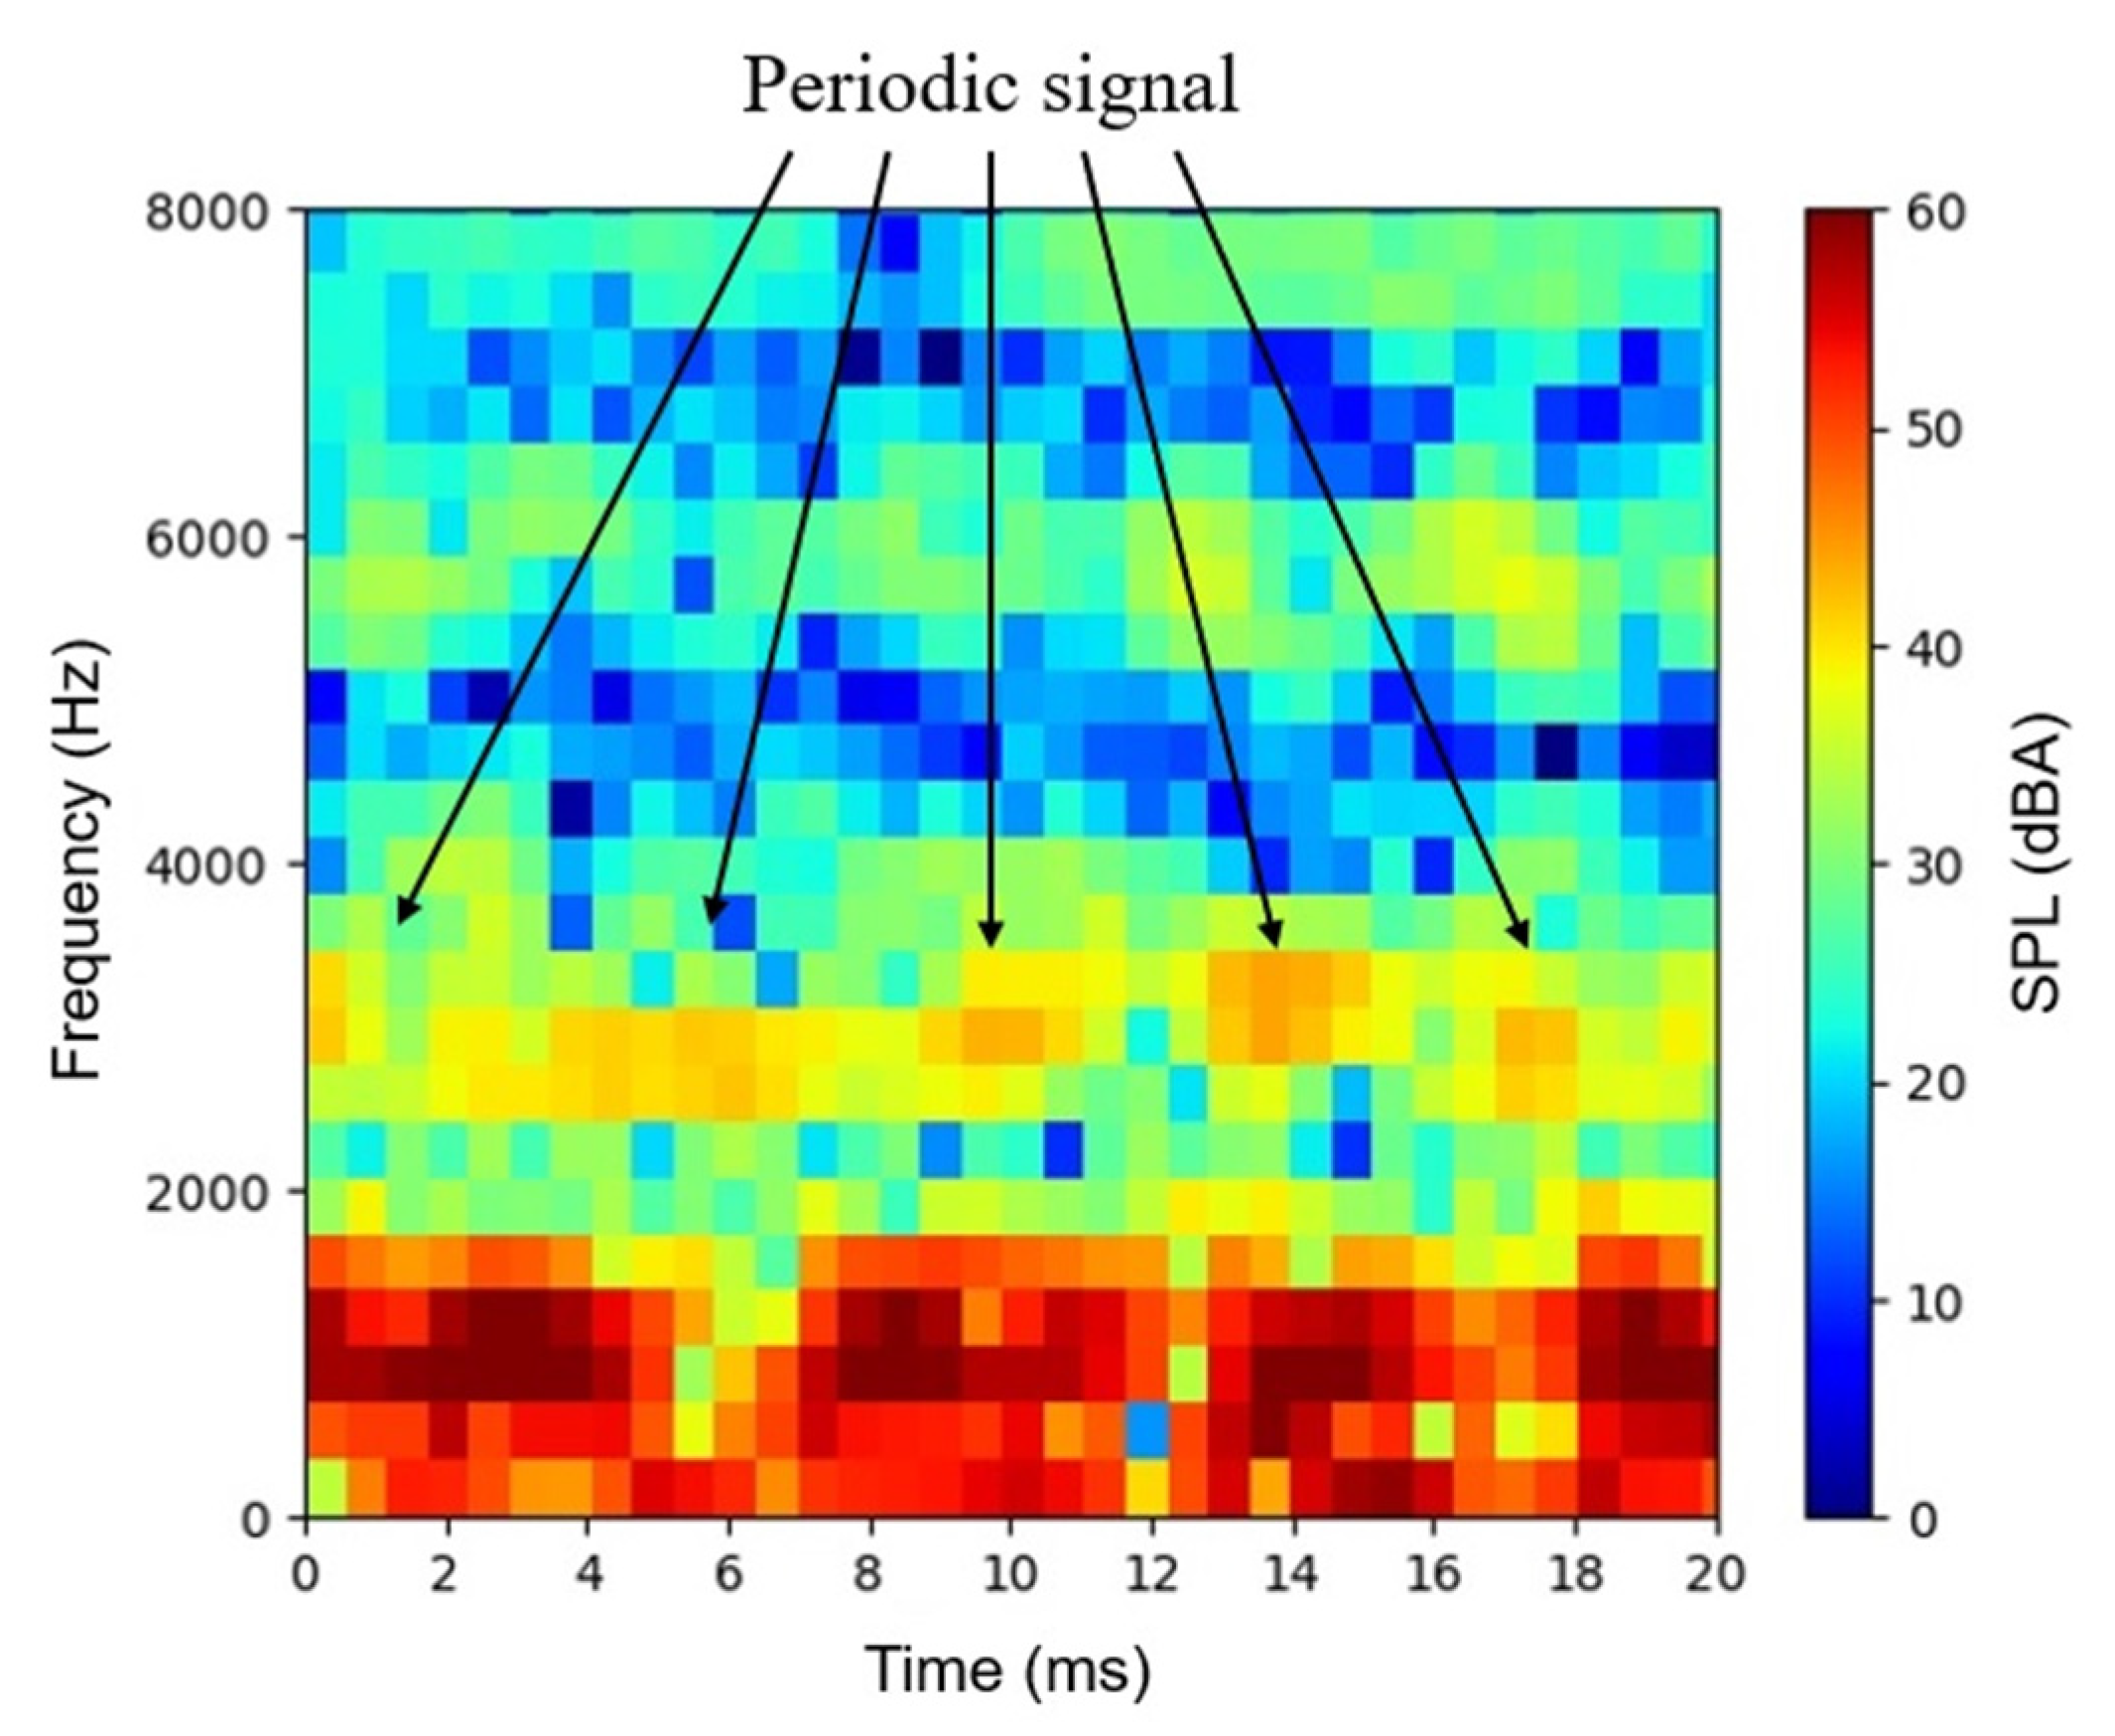
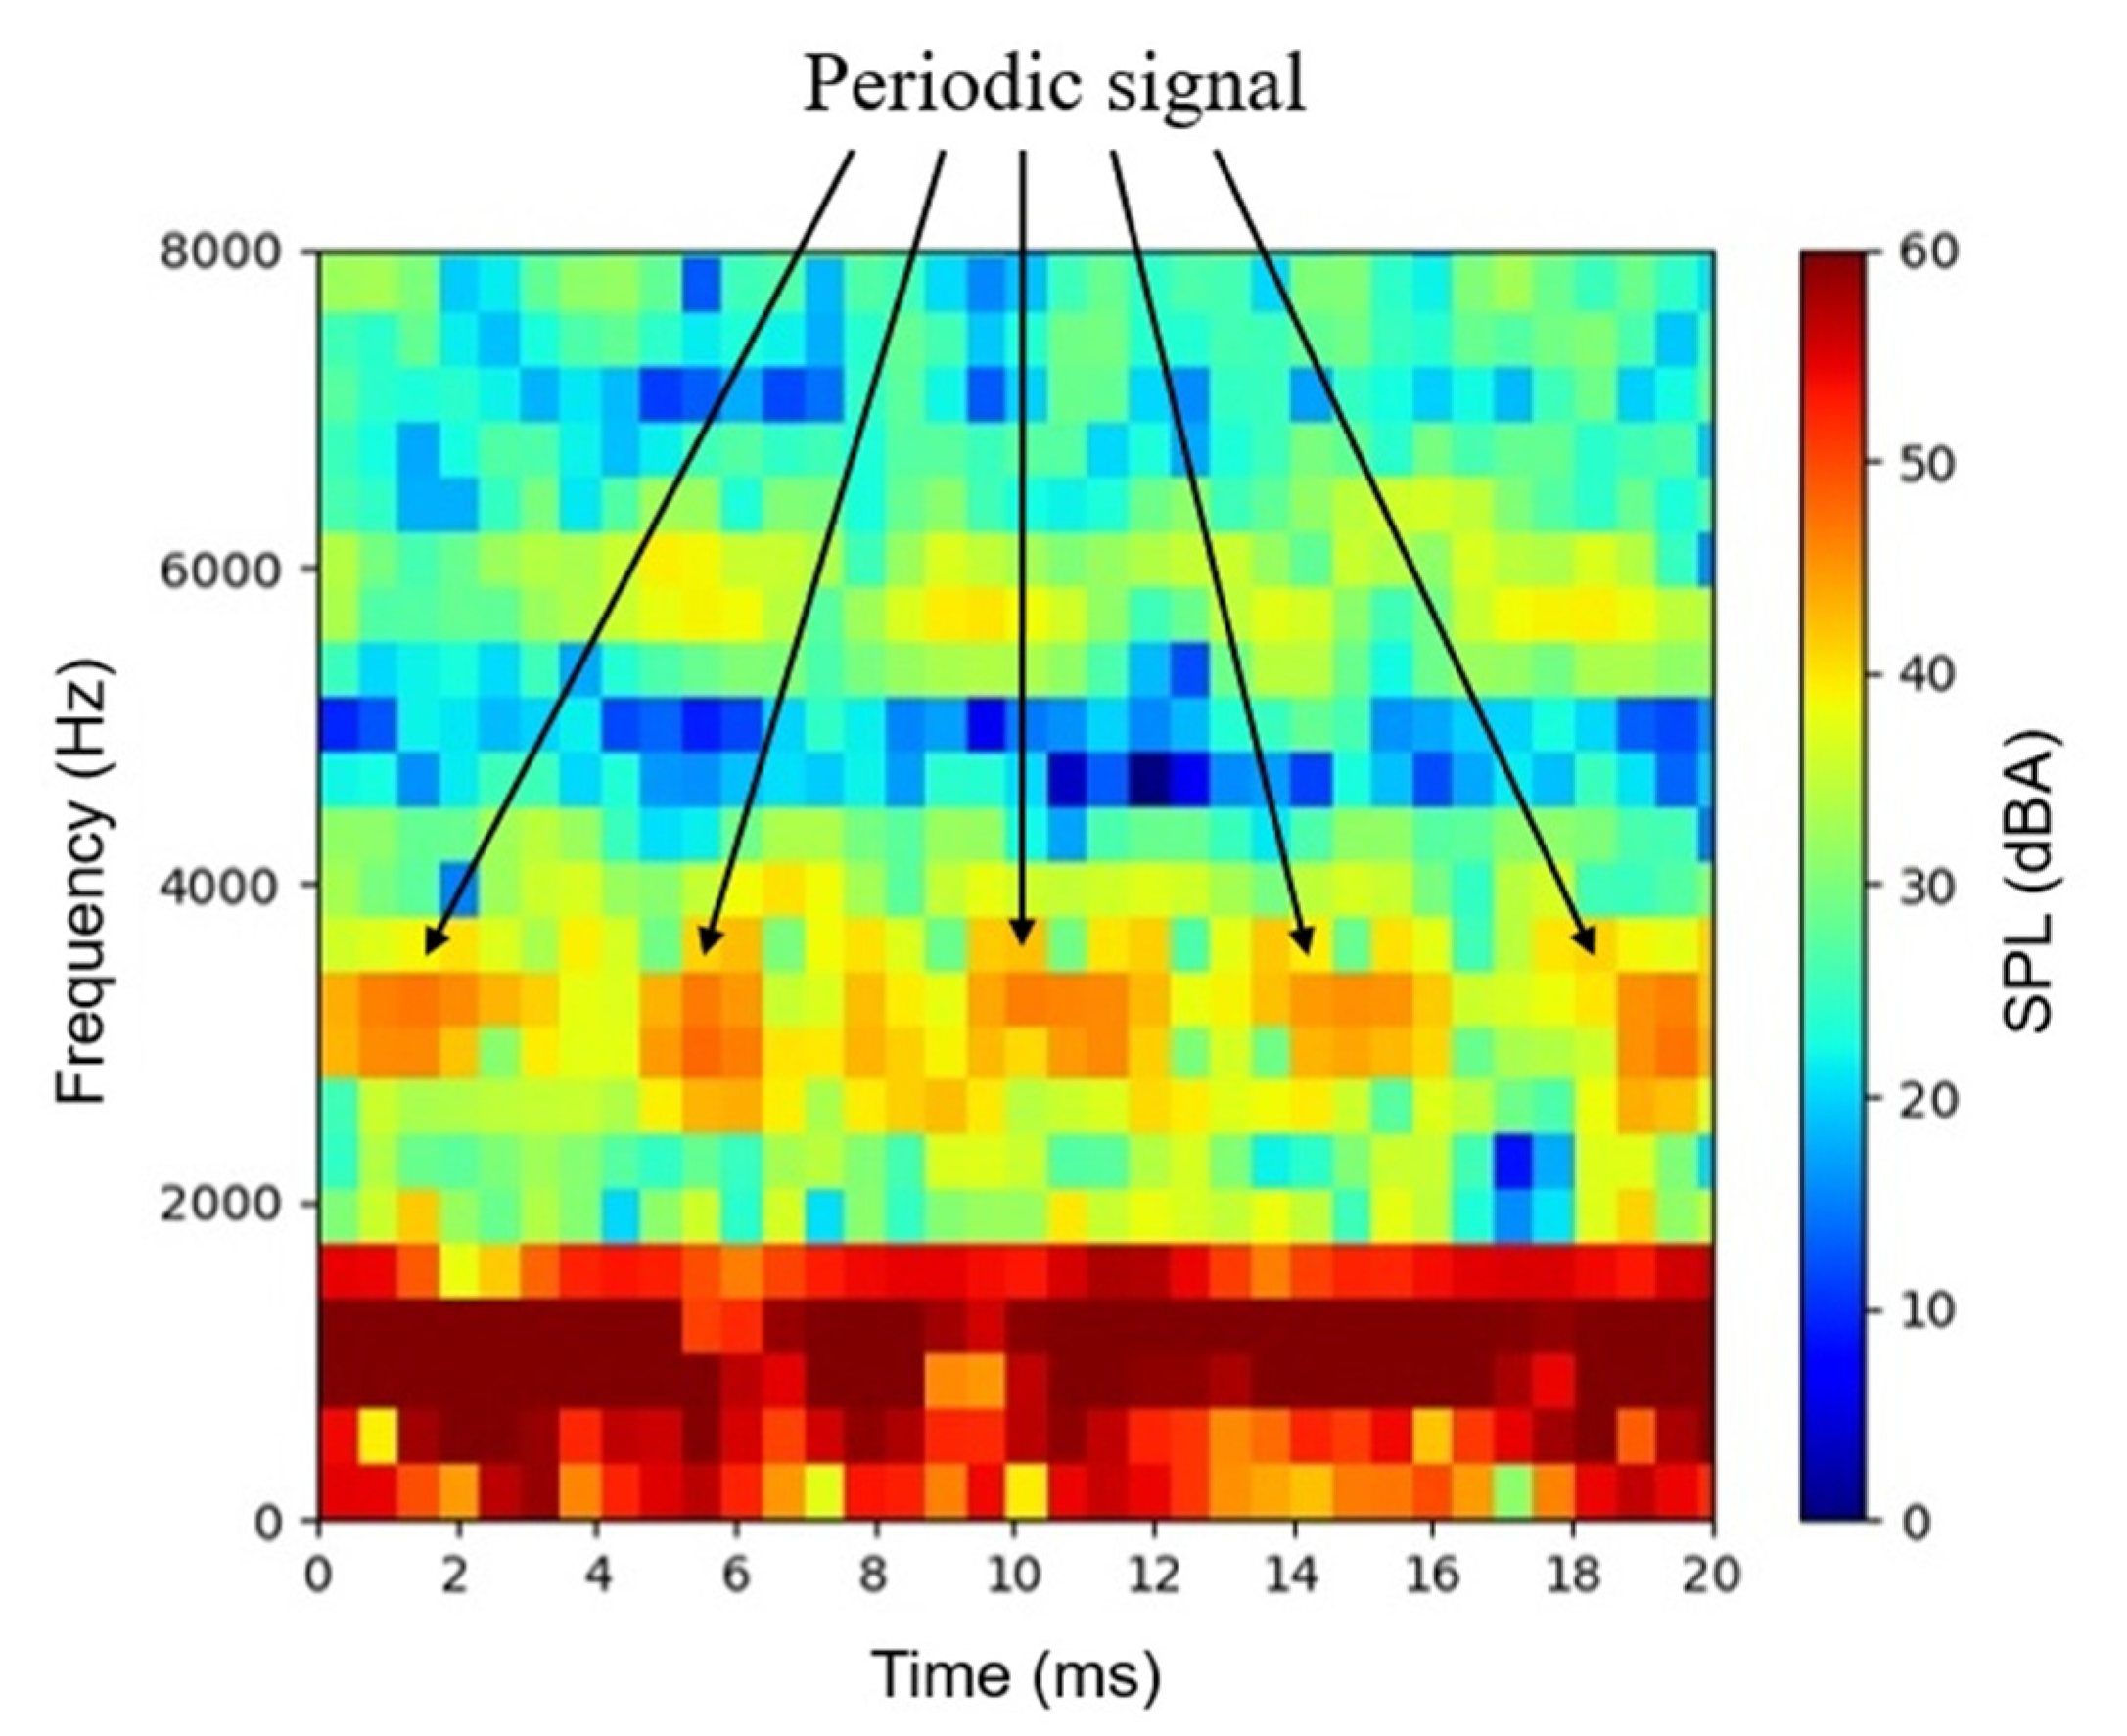
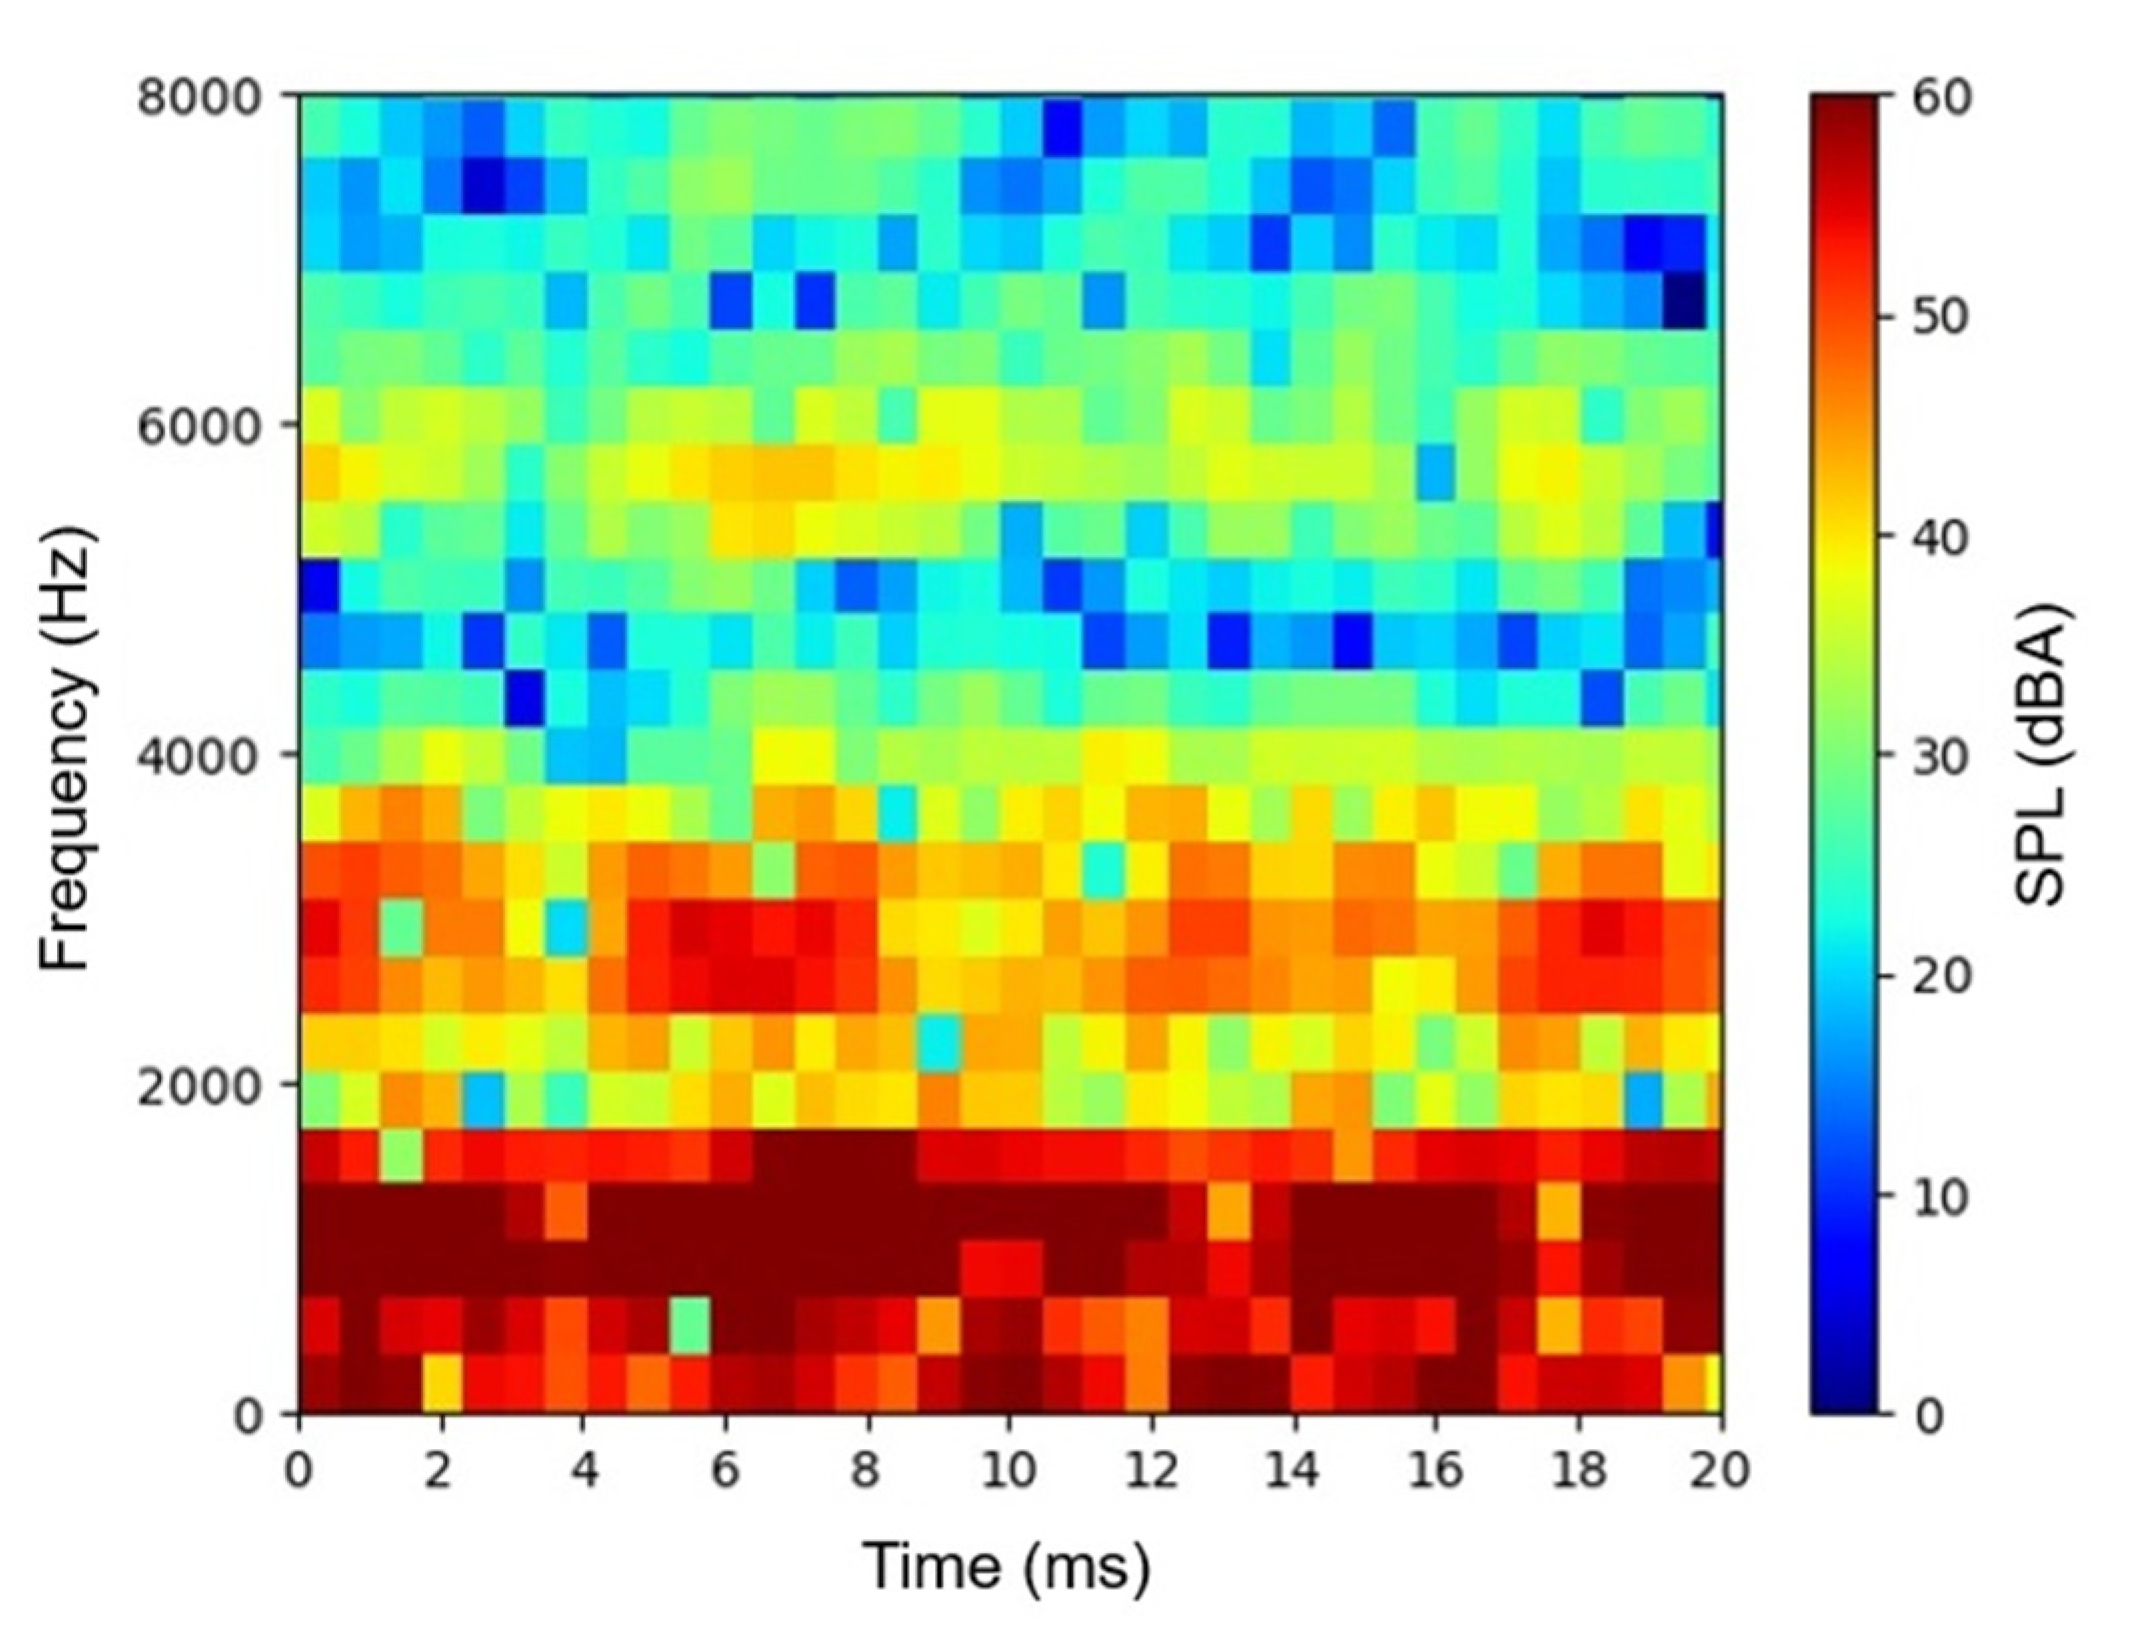
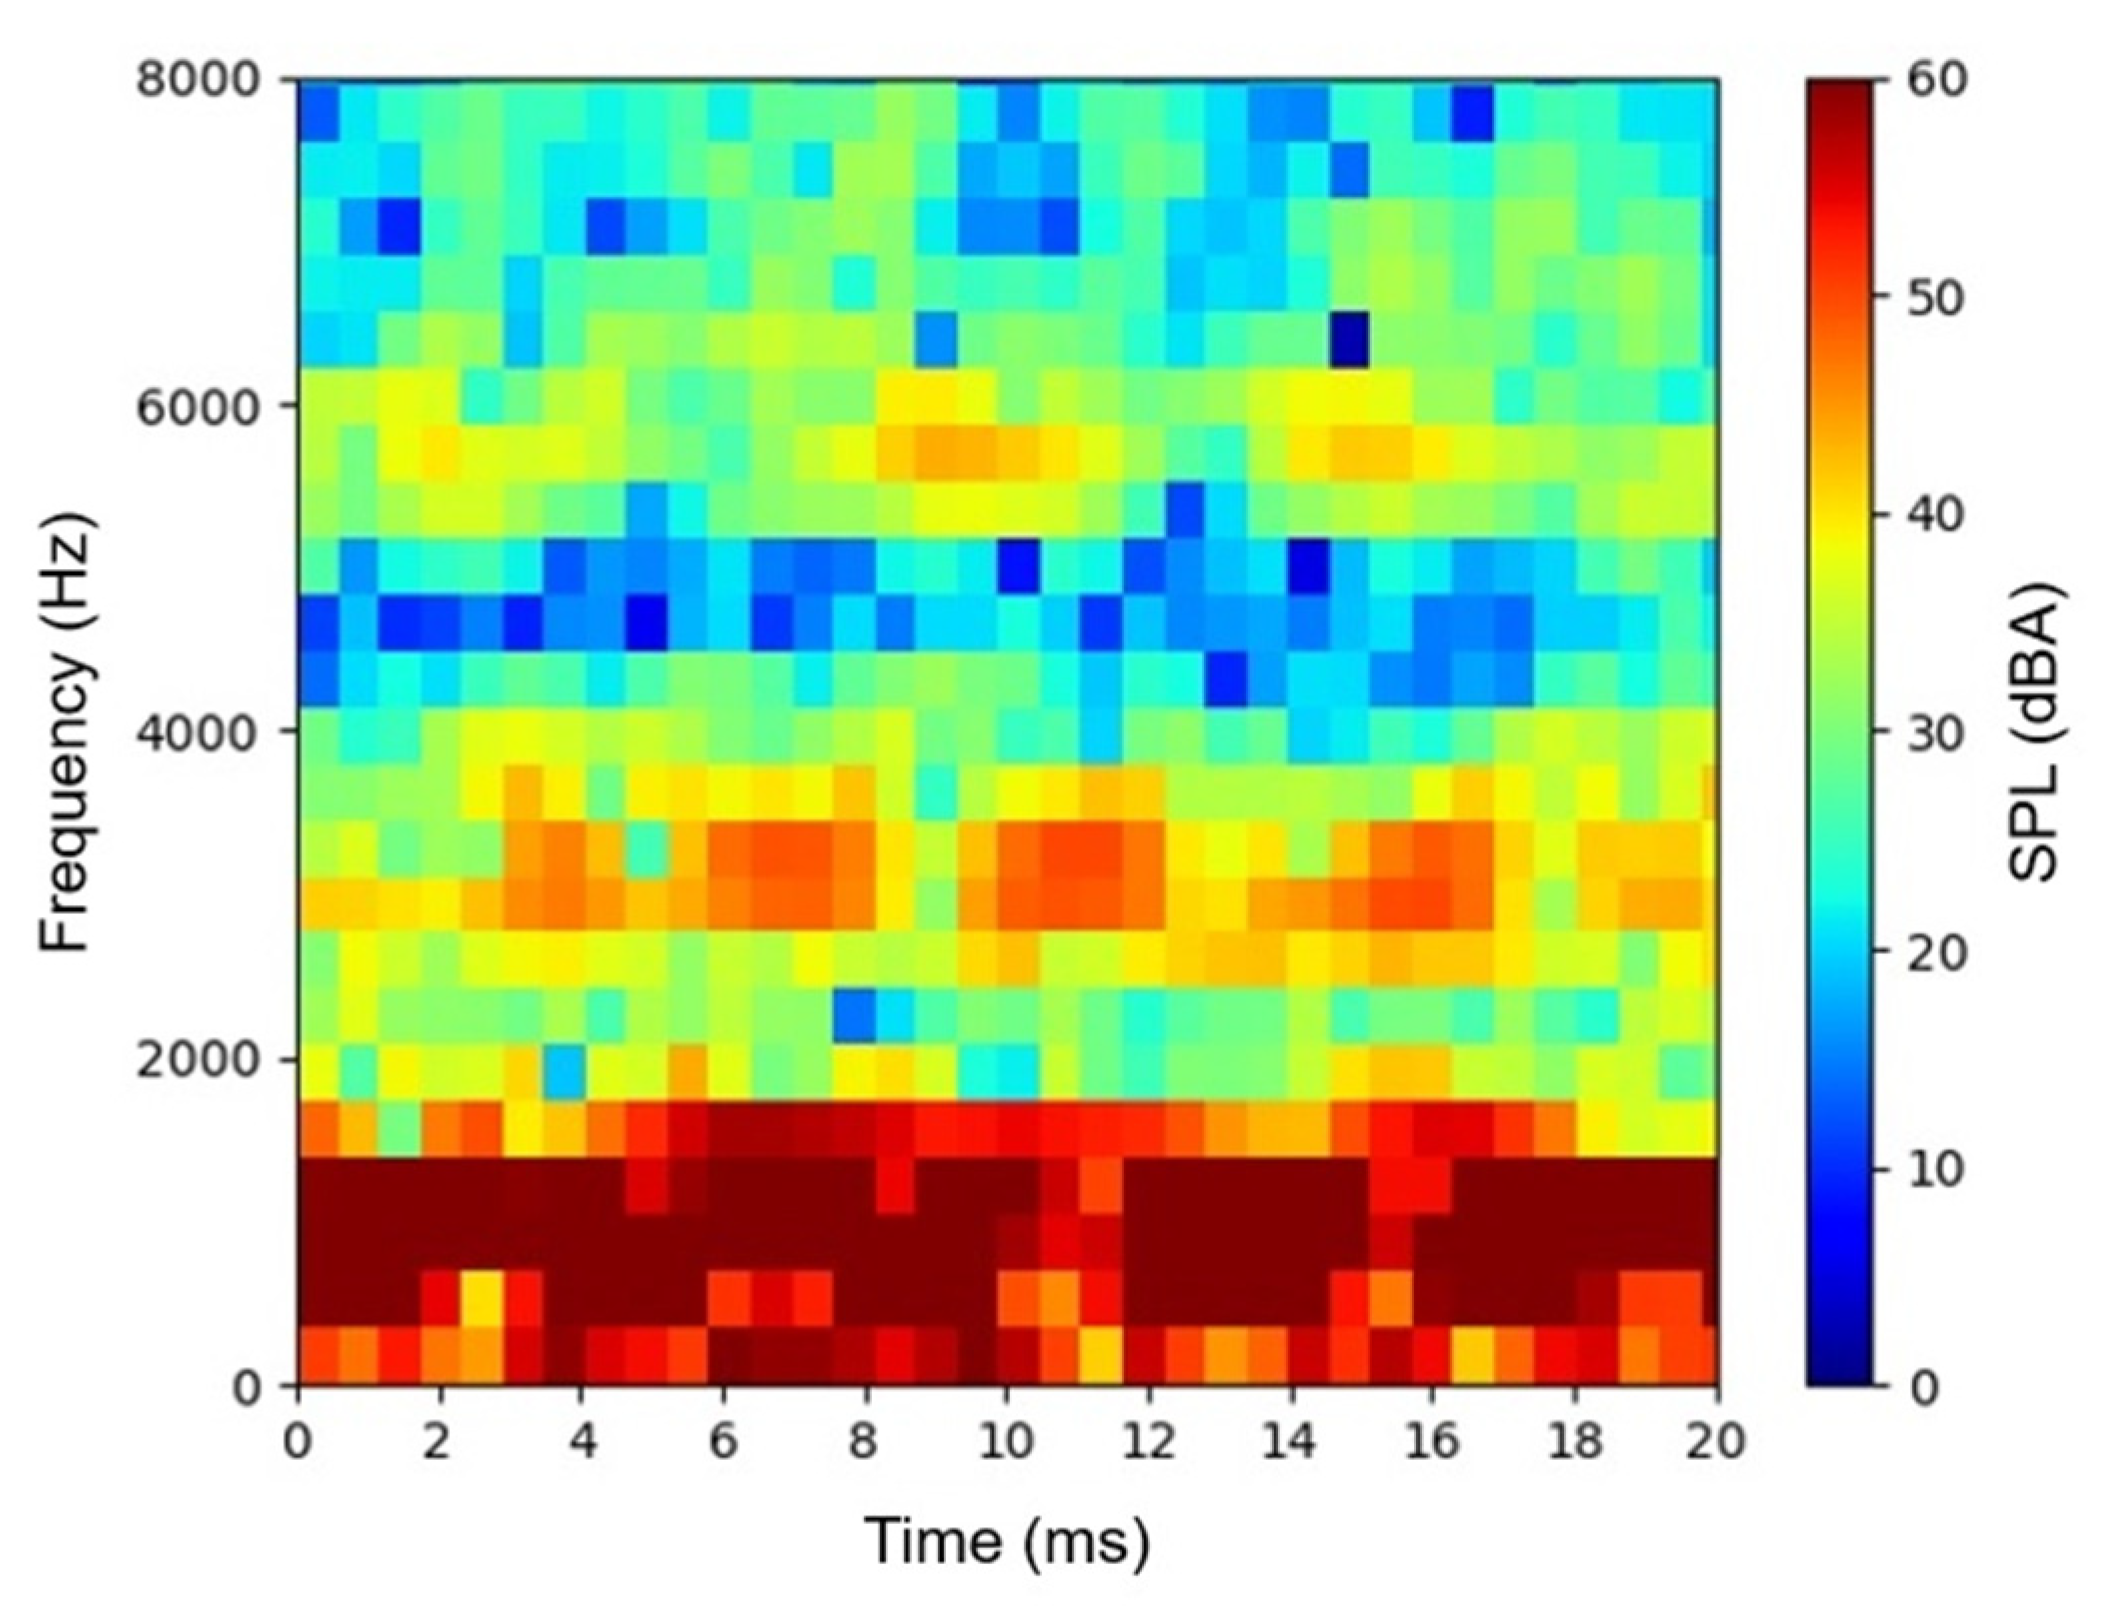
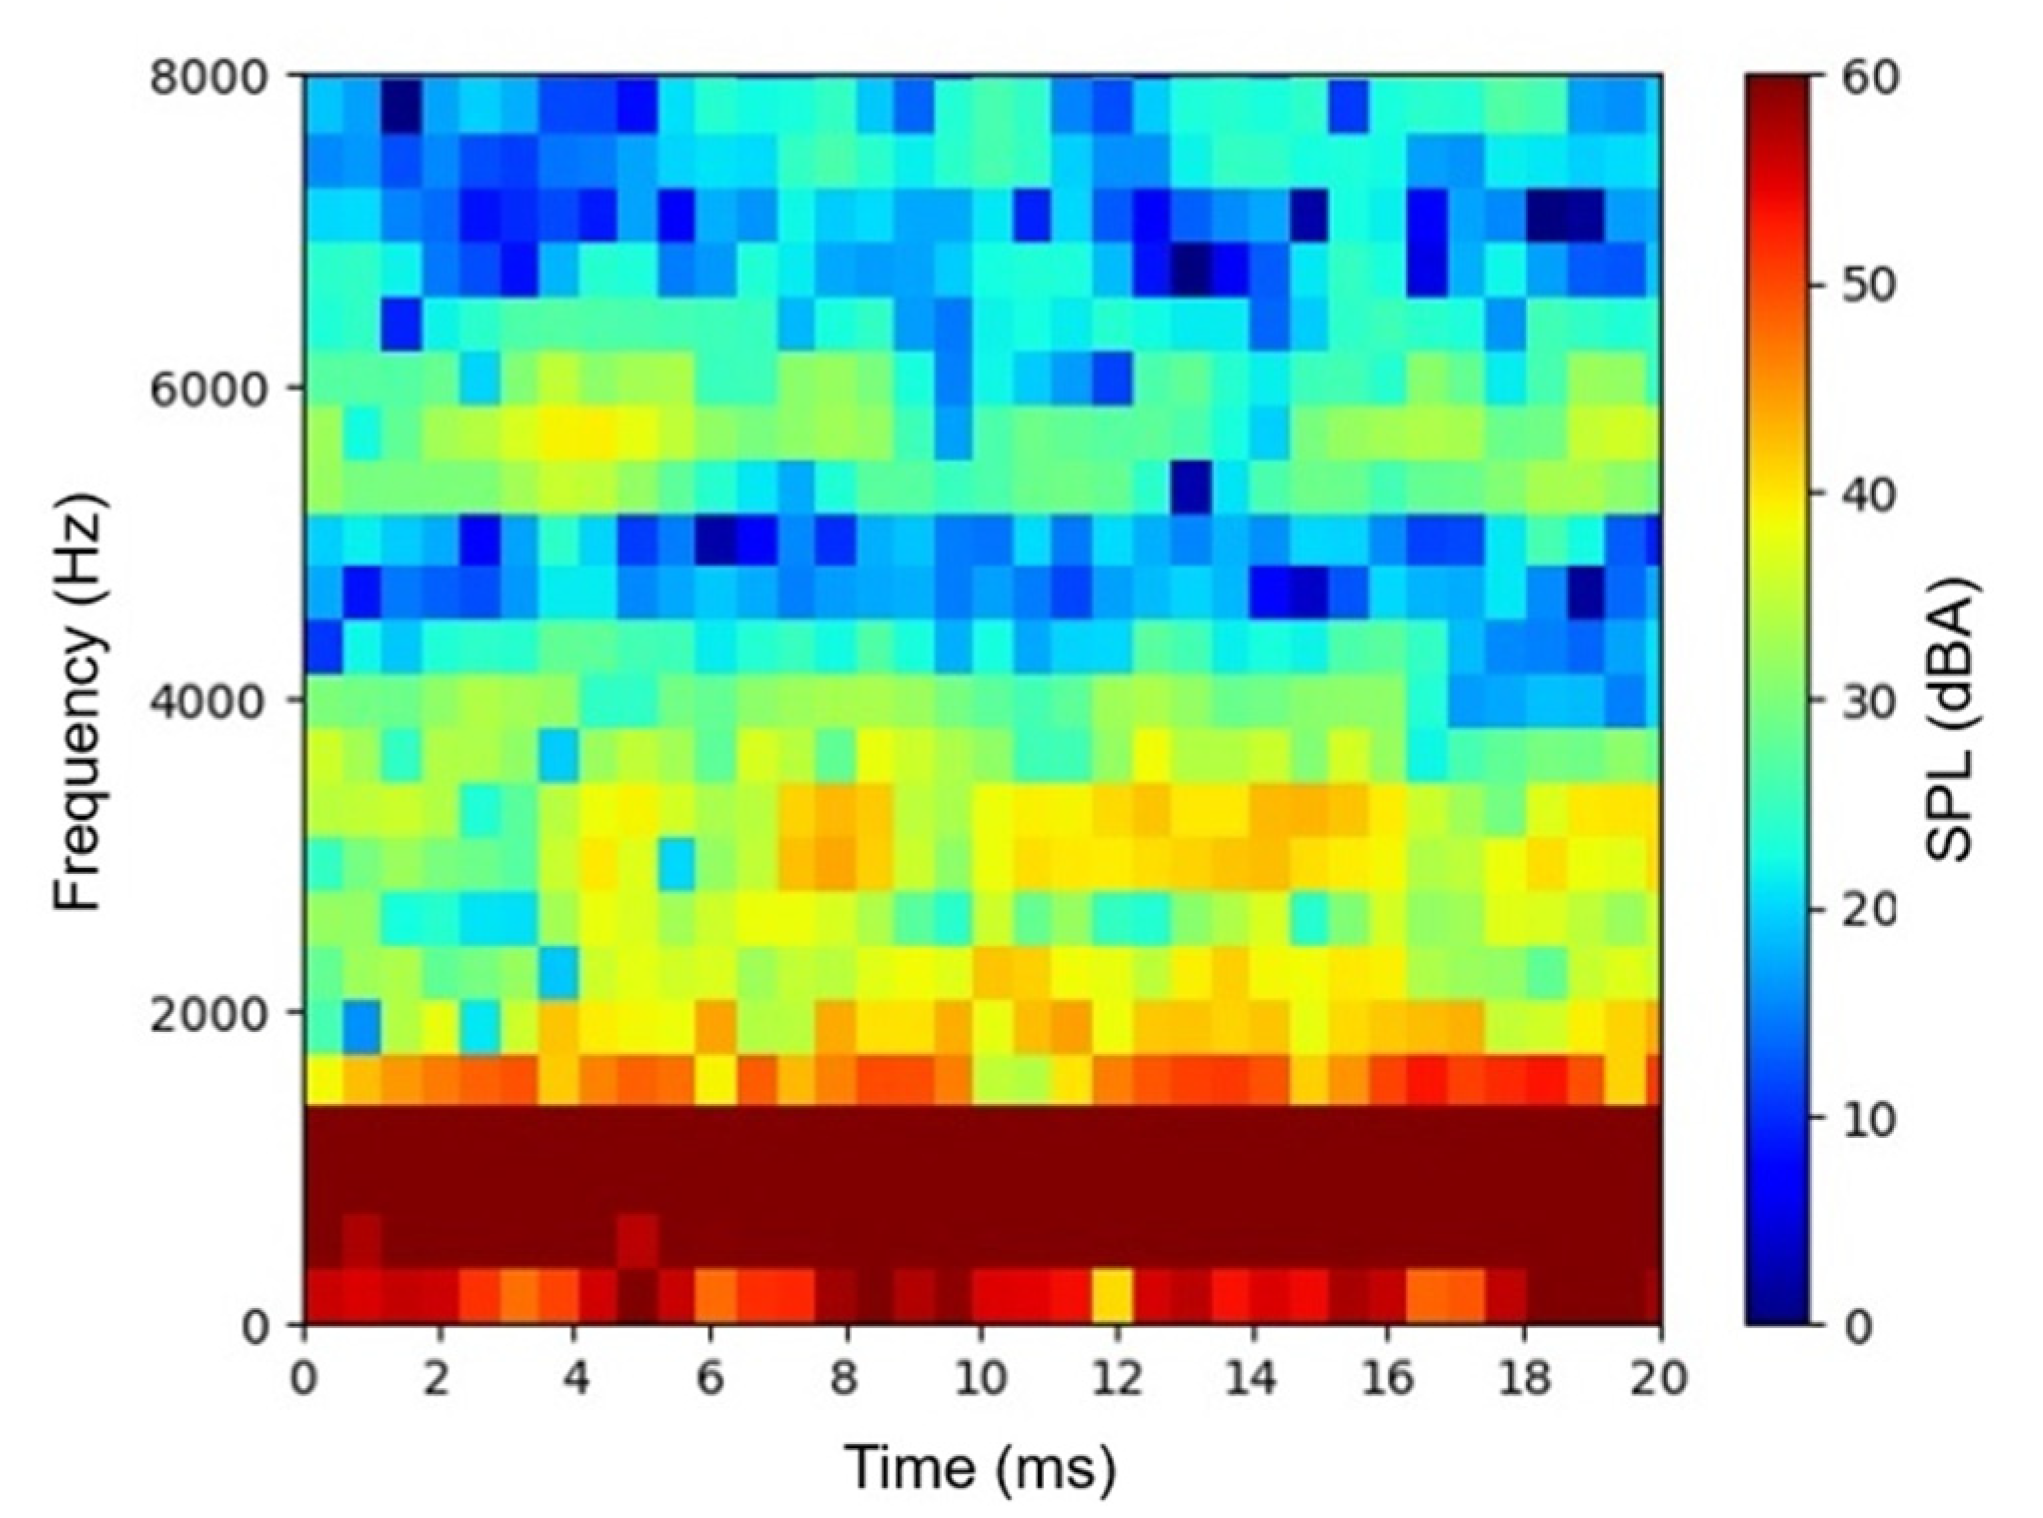
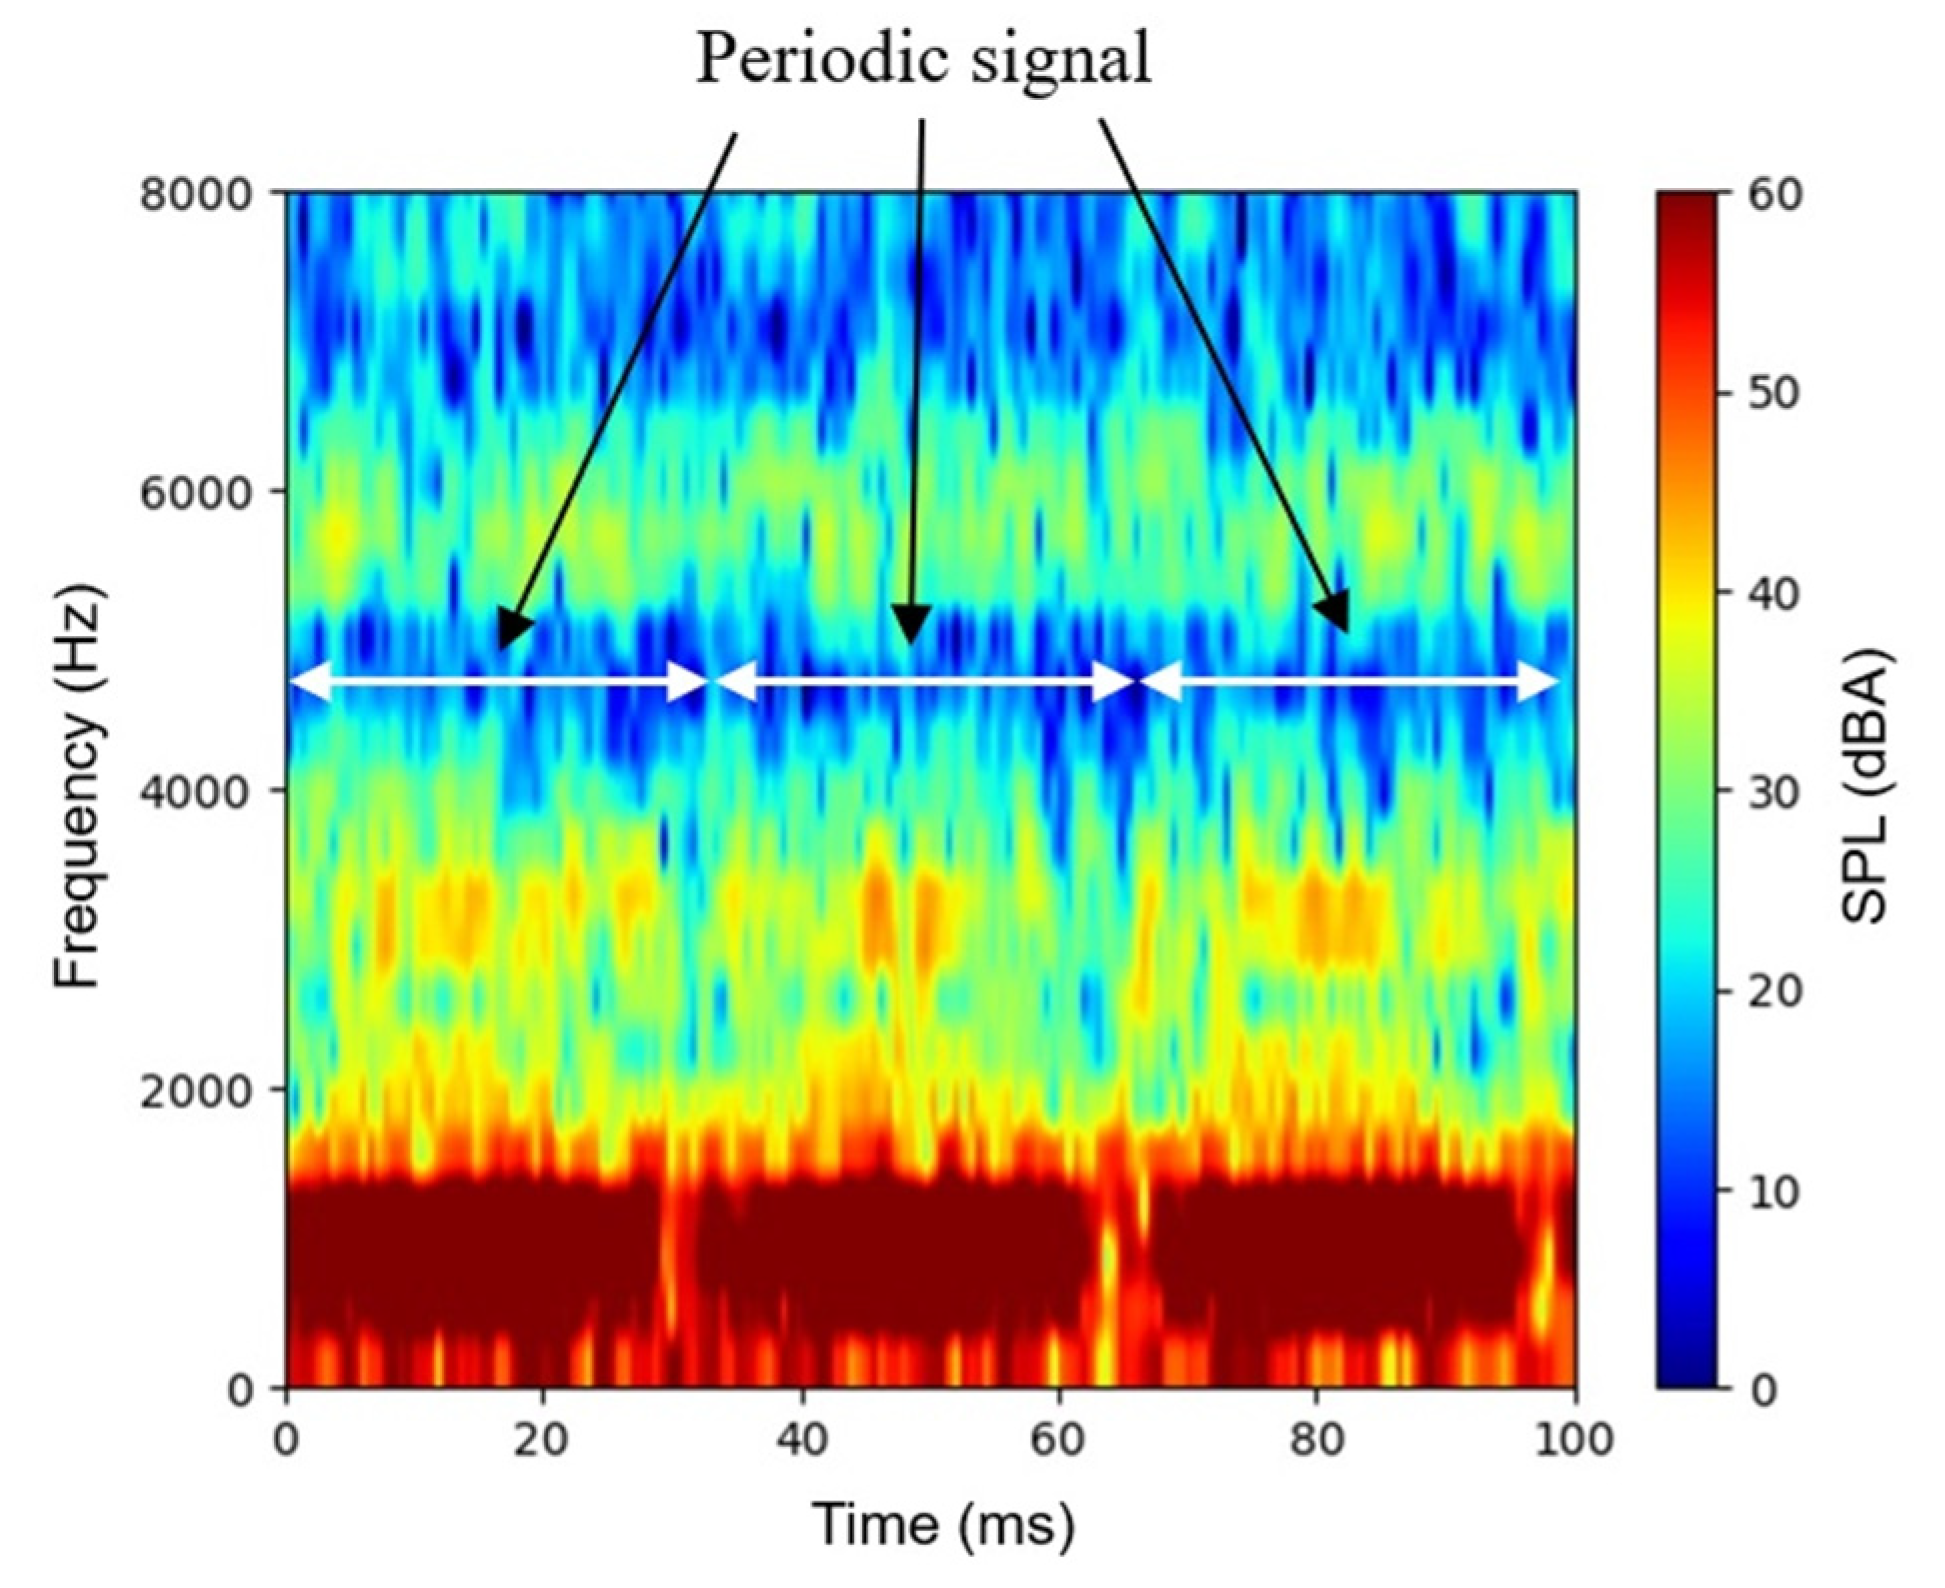
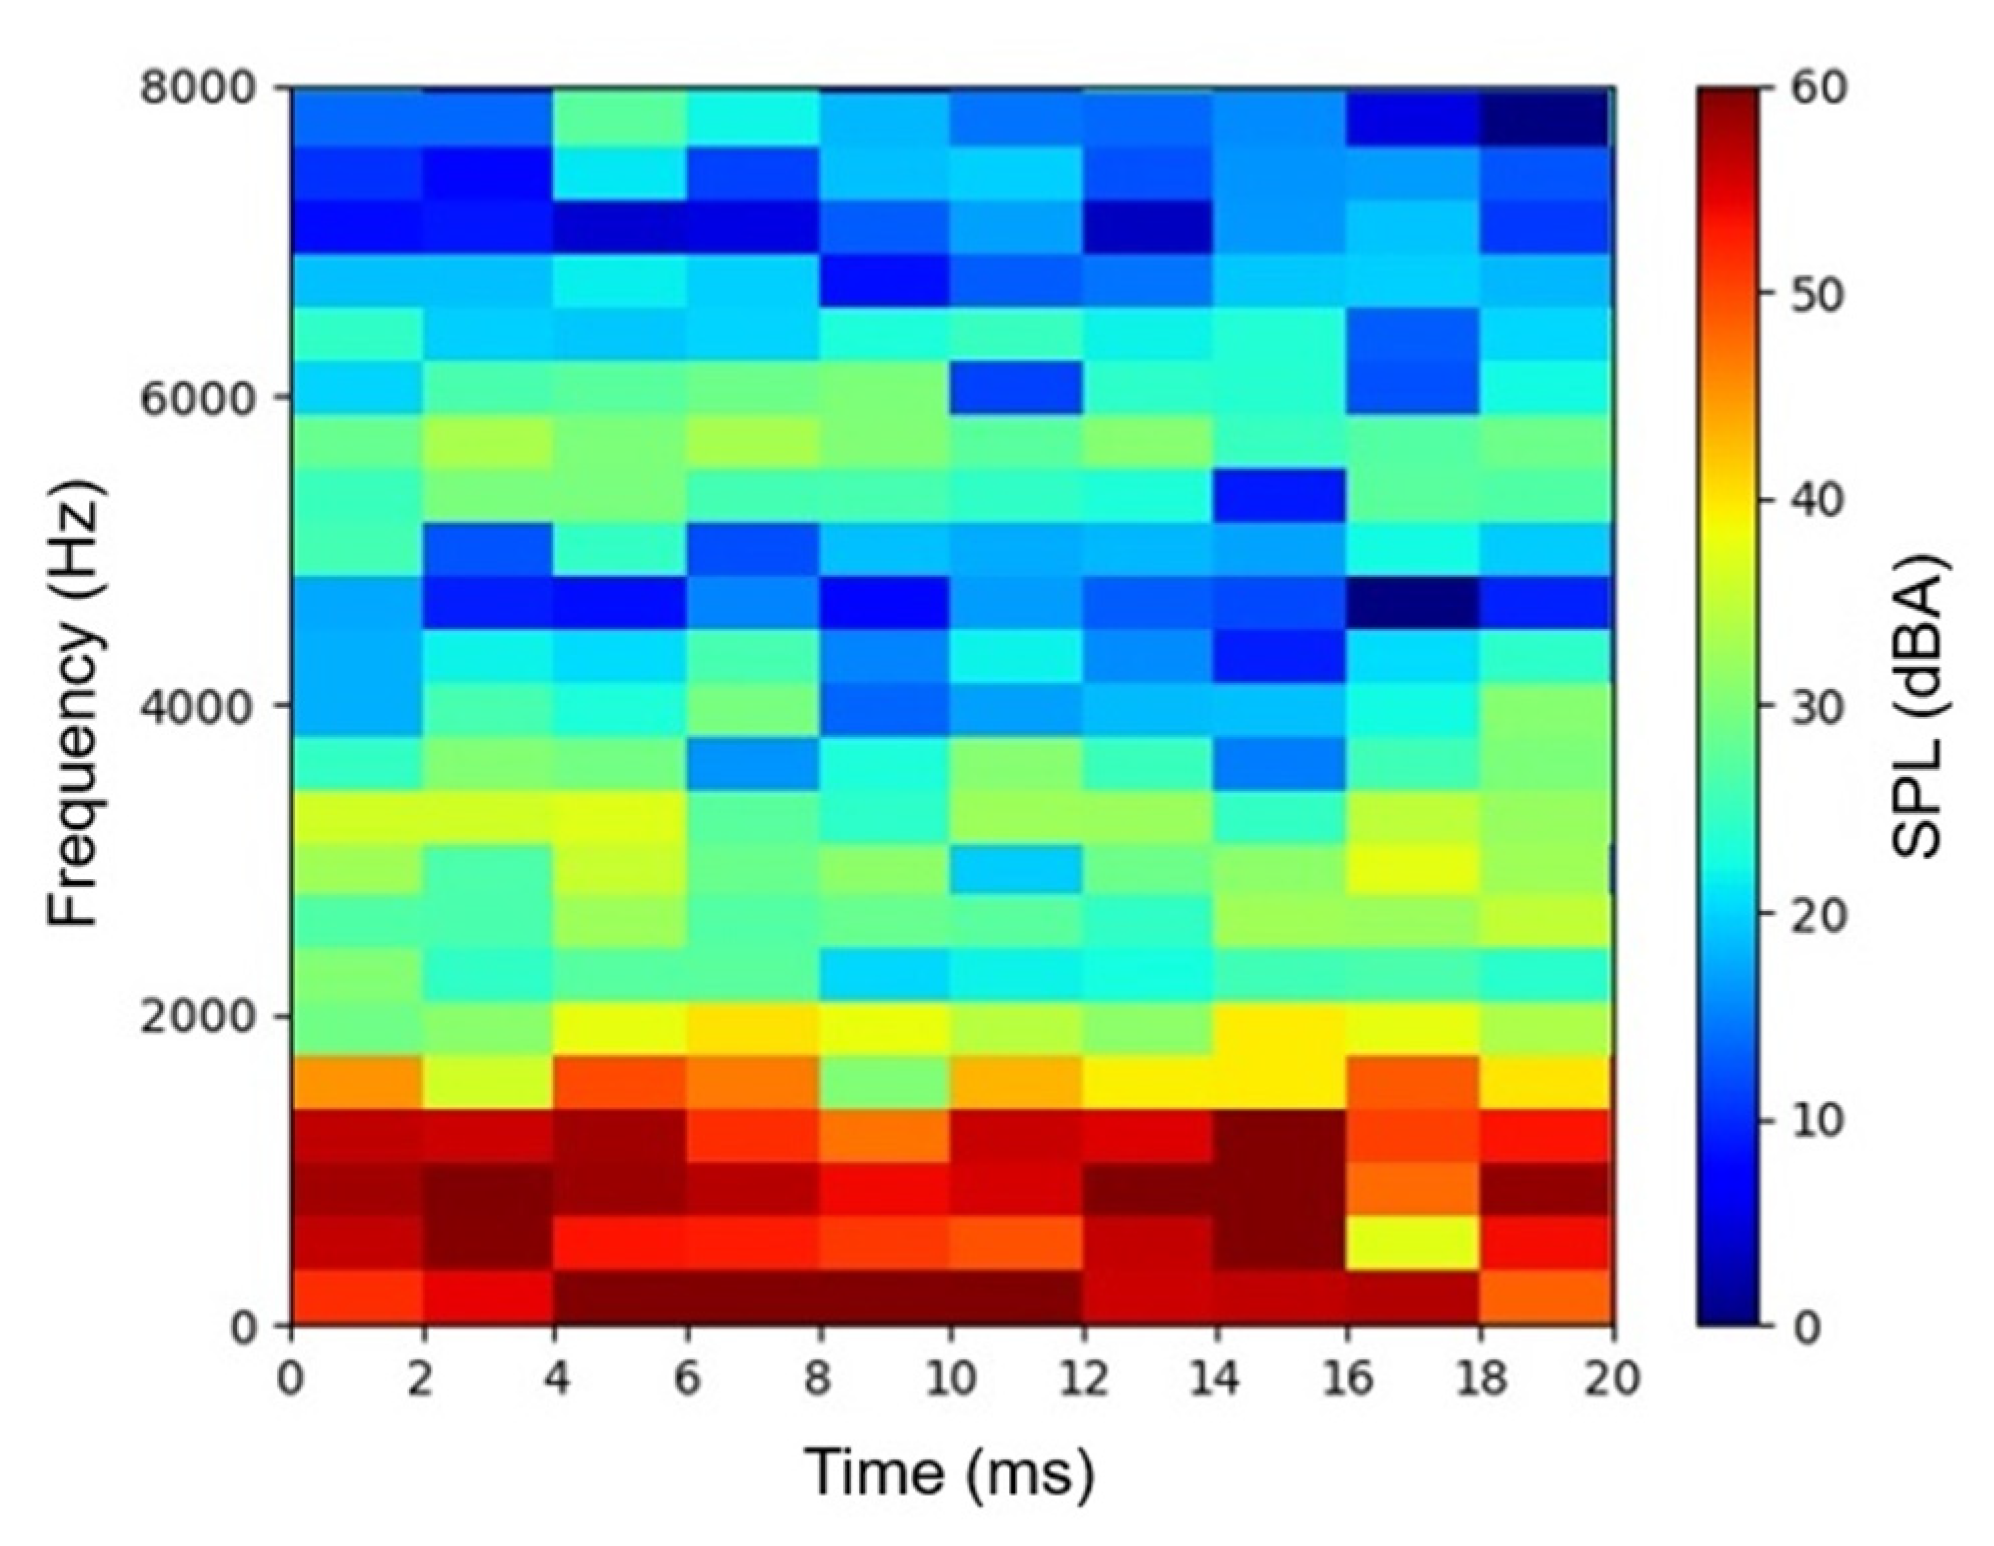
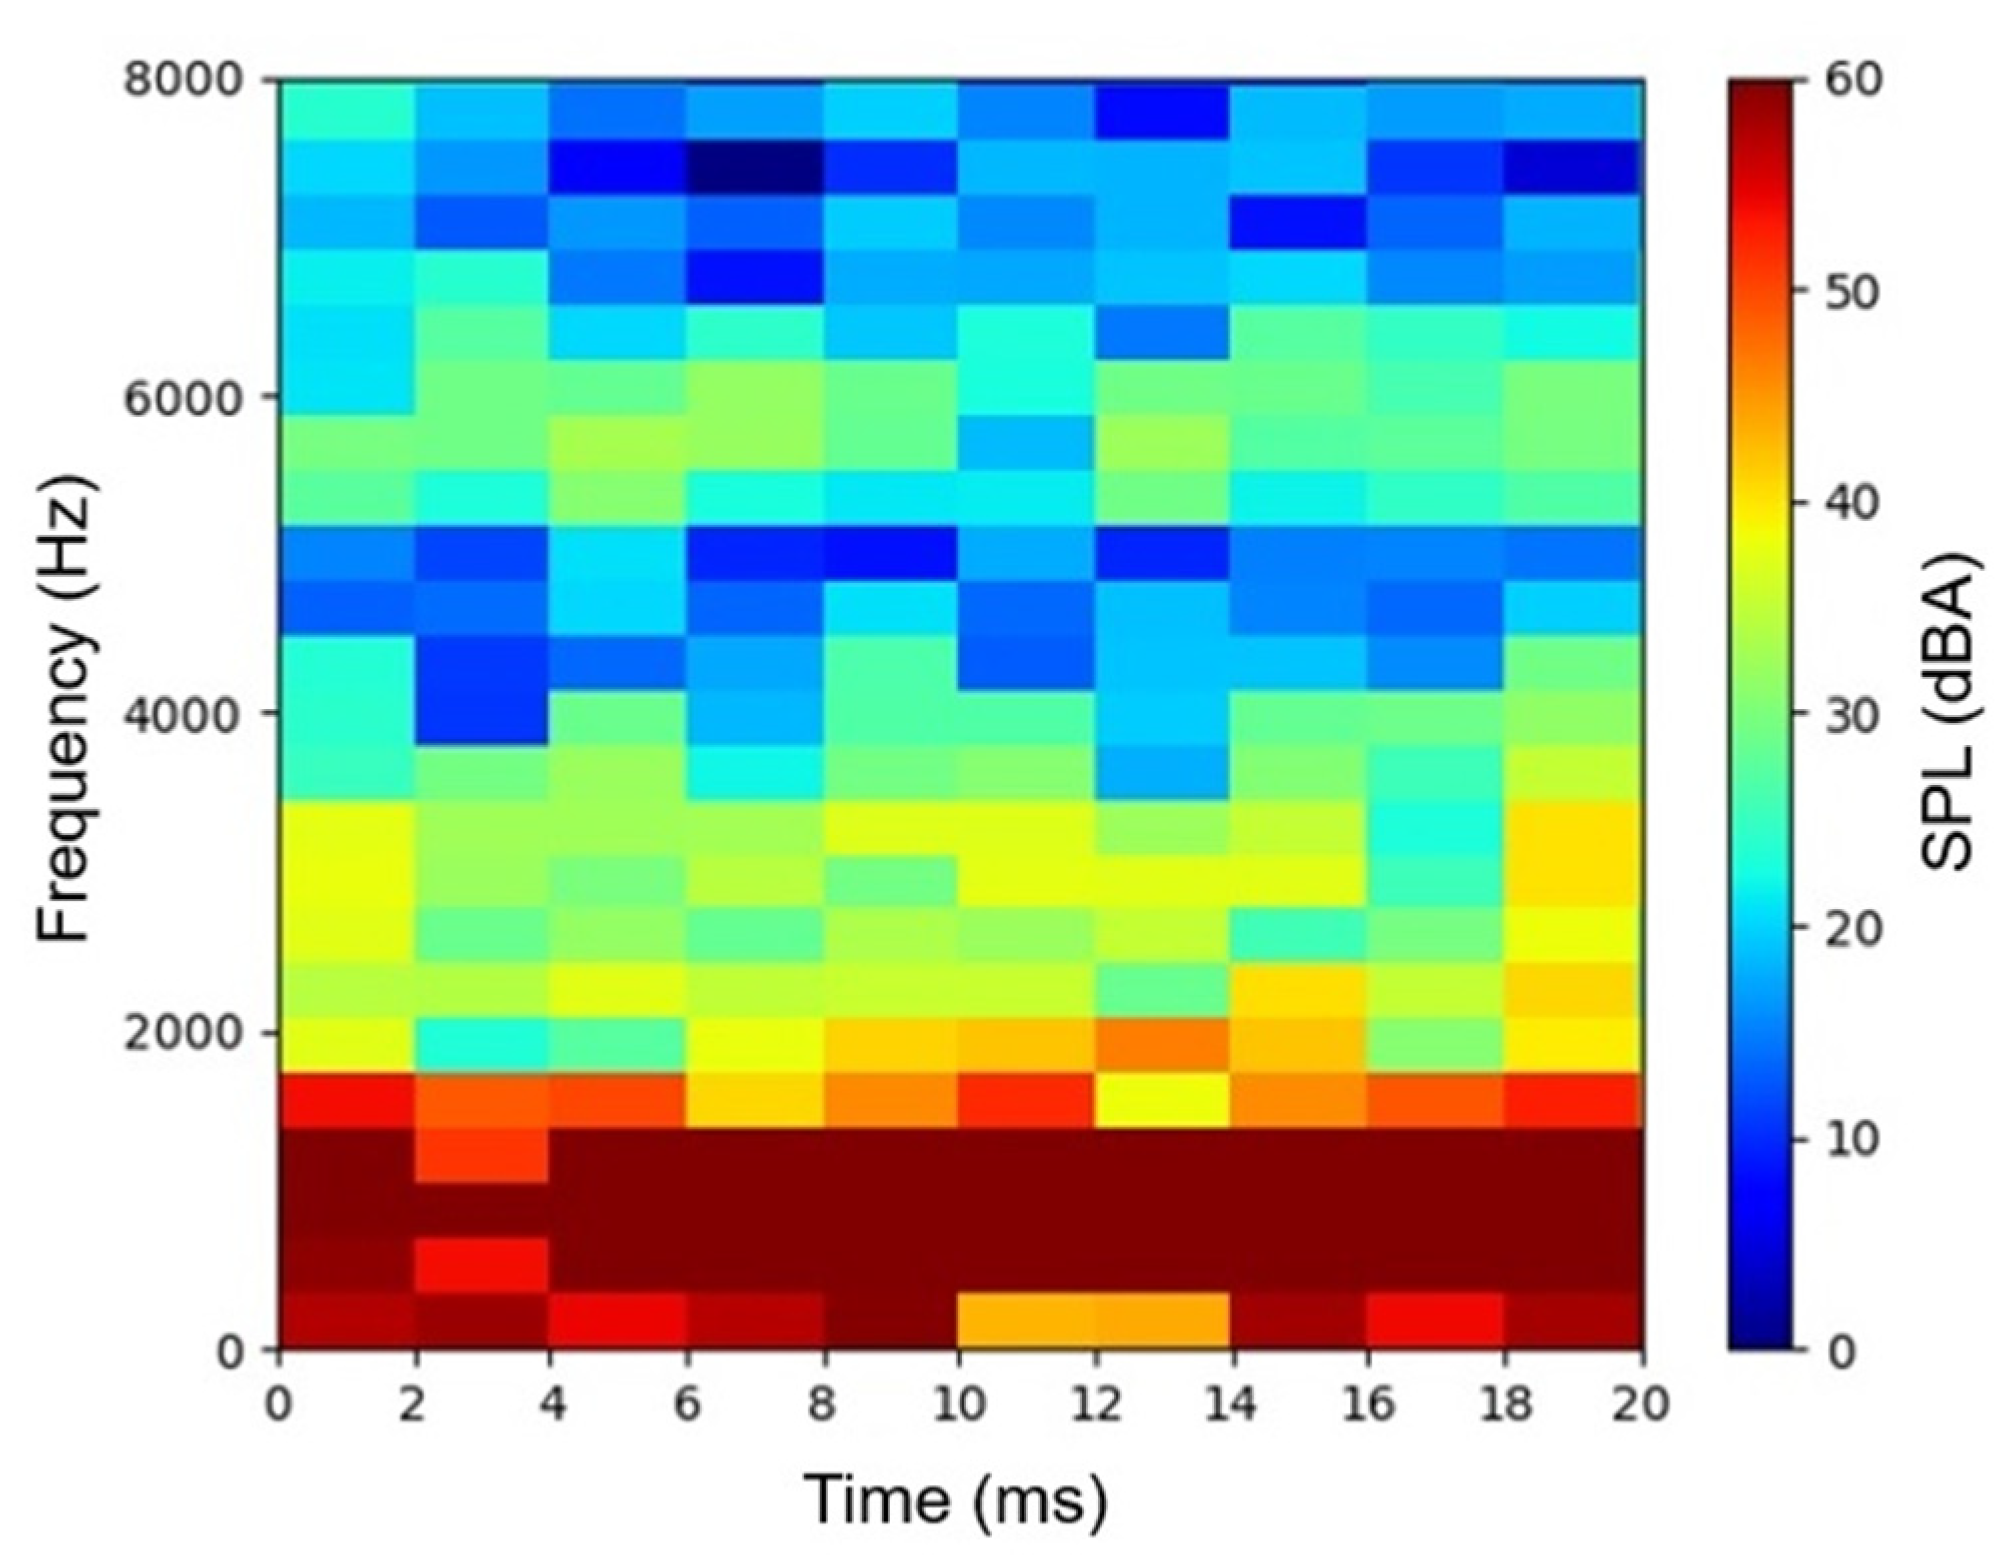
3.2. Analysis of Spectrum of Rotating Sound Based on Short-Time Fourier-Transform (STFT)
4. Methodology for Diagnosis
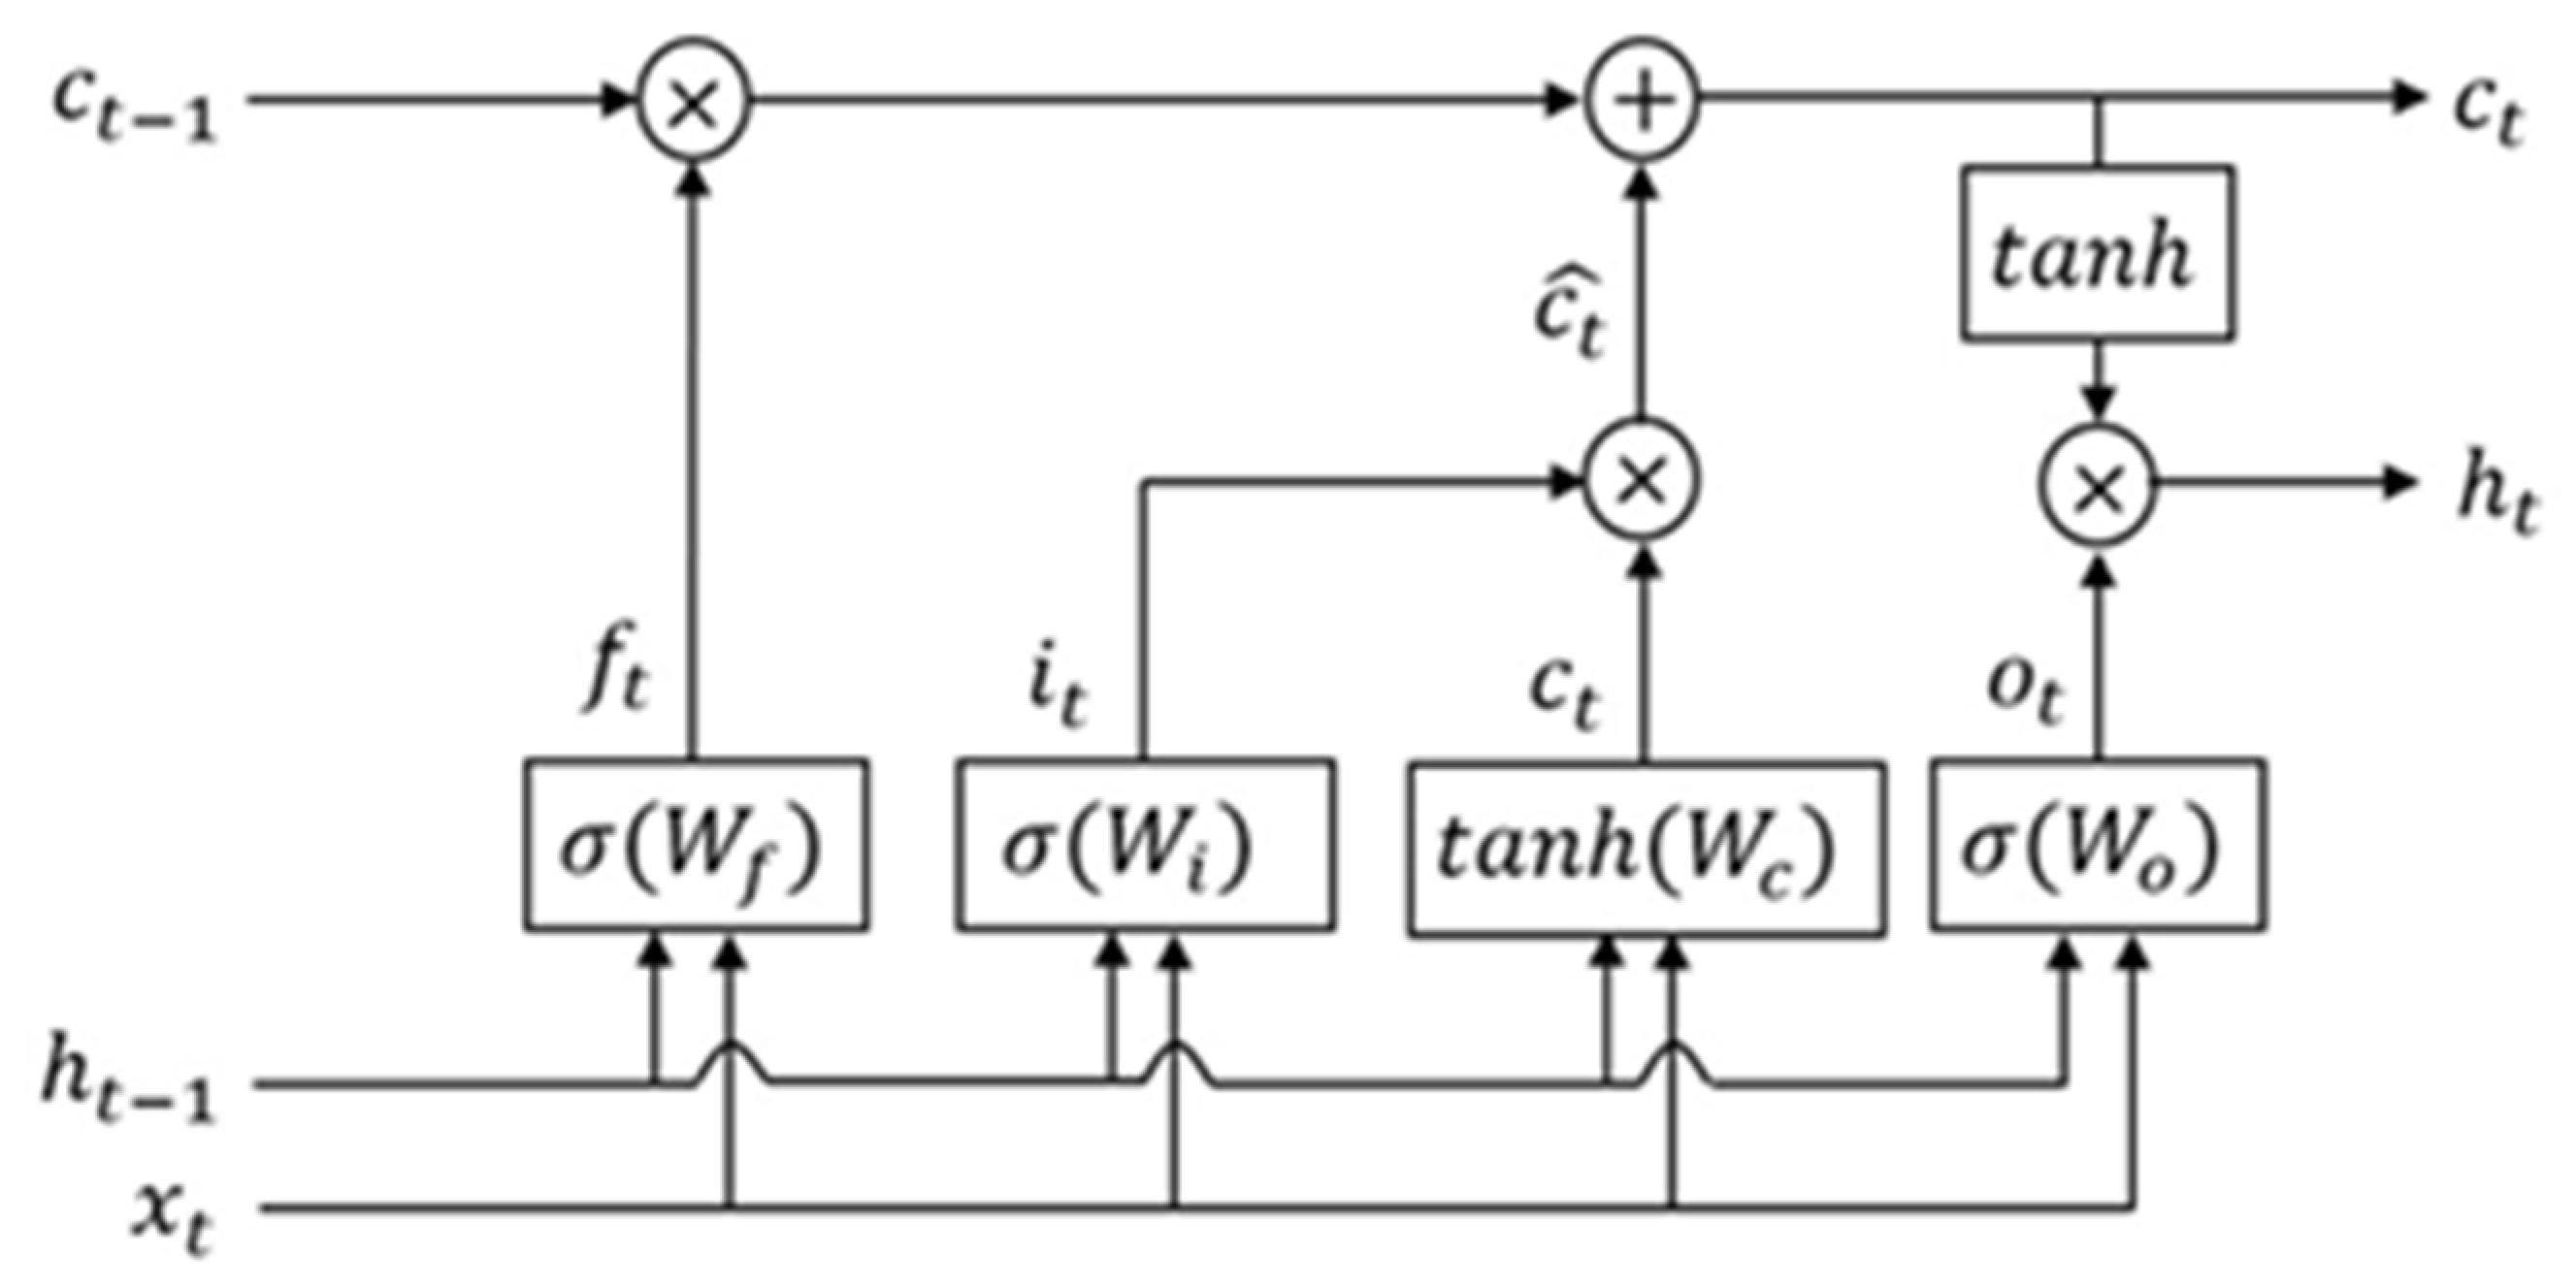
4.1. Long Short-Term Memory (LSTM) [27]
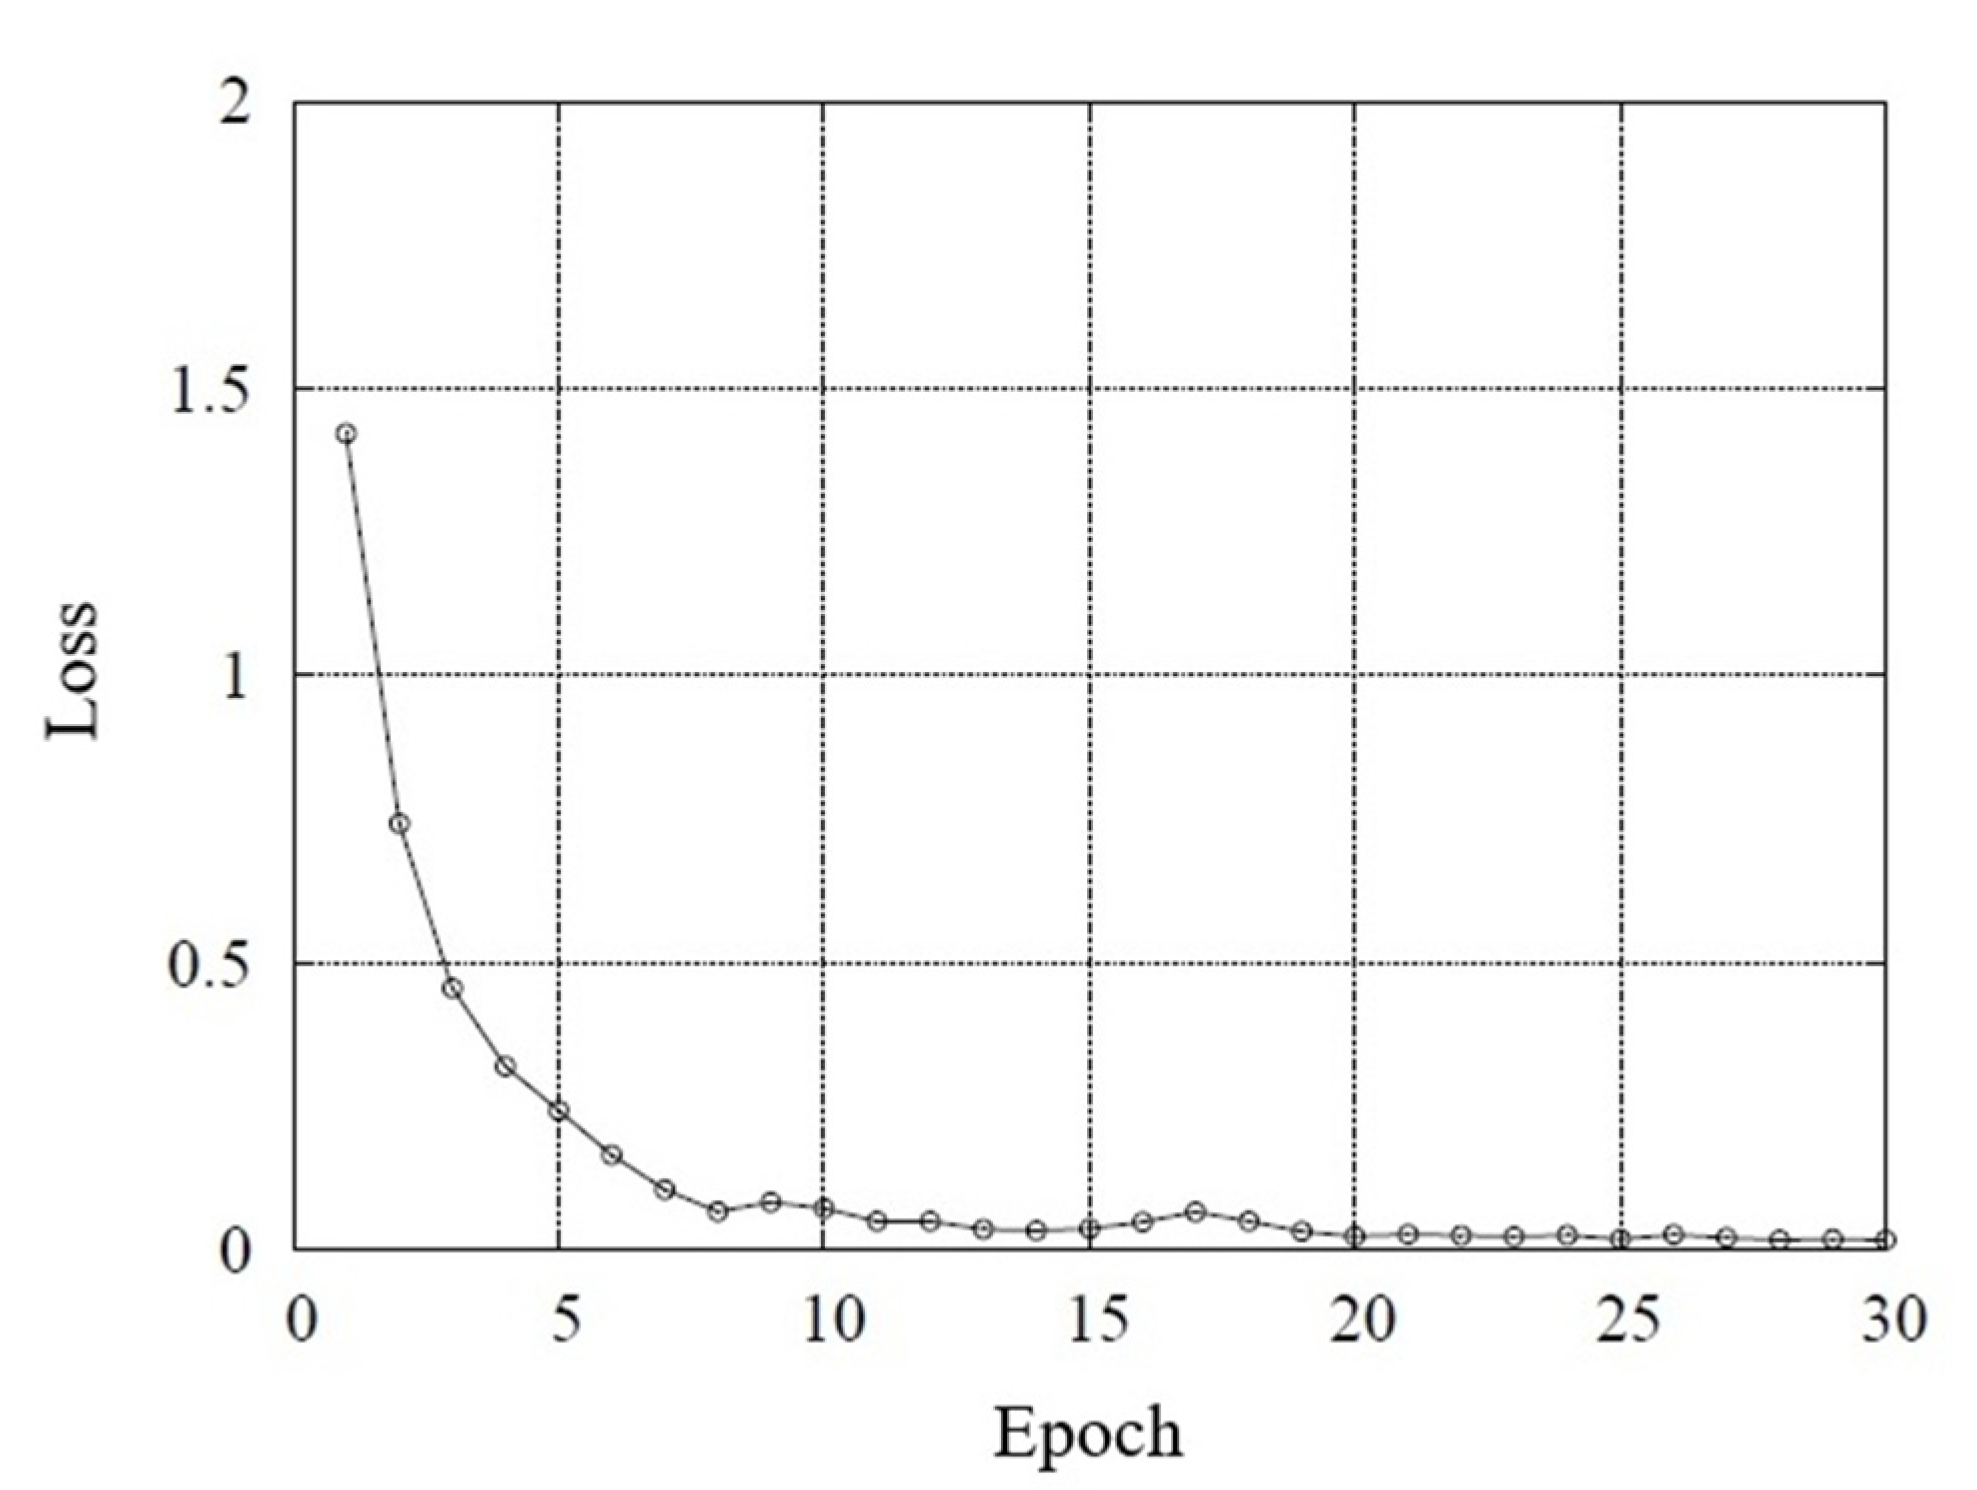
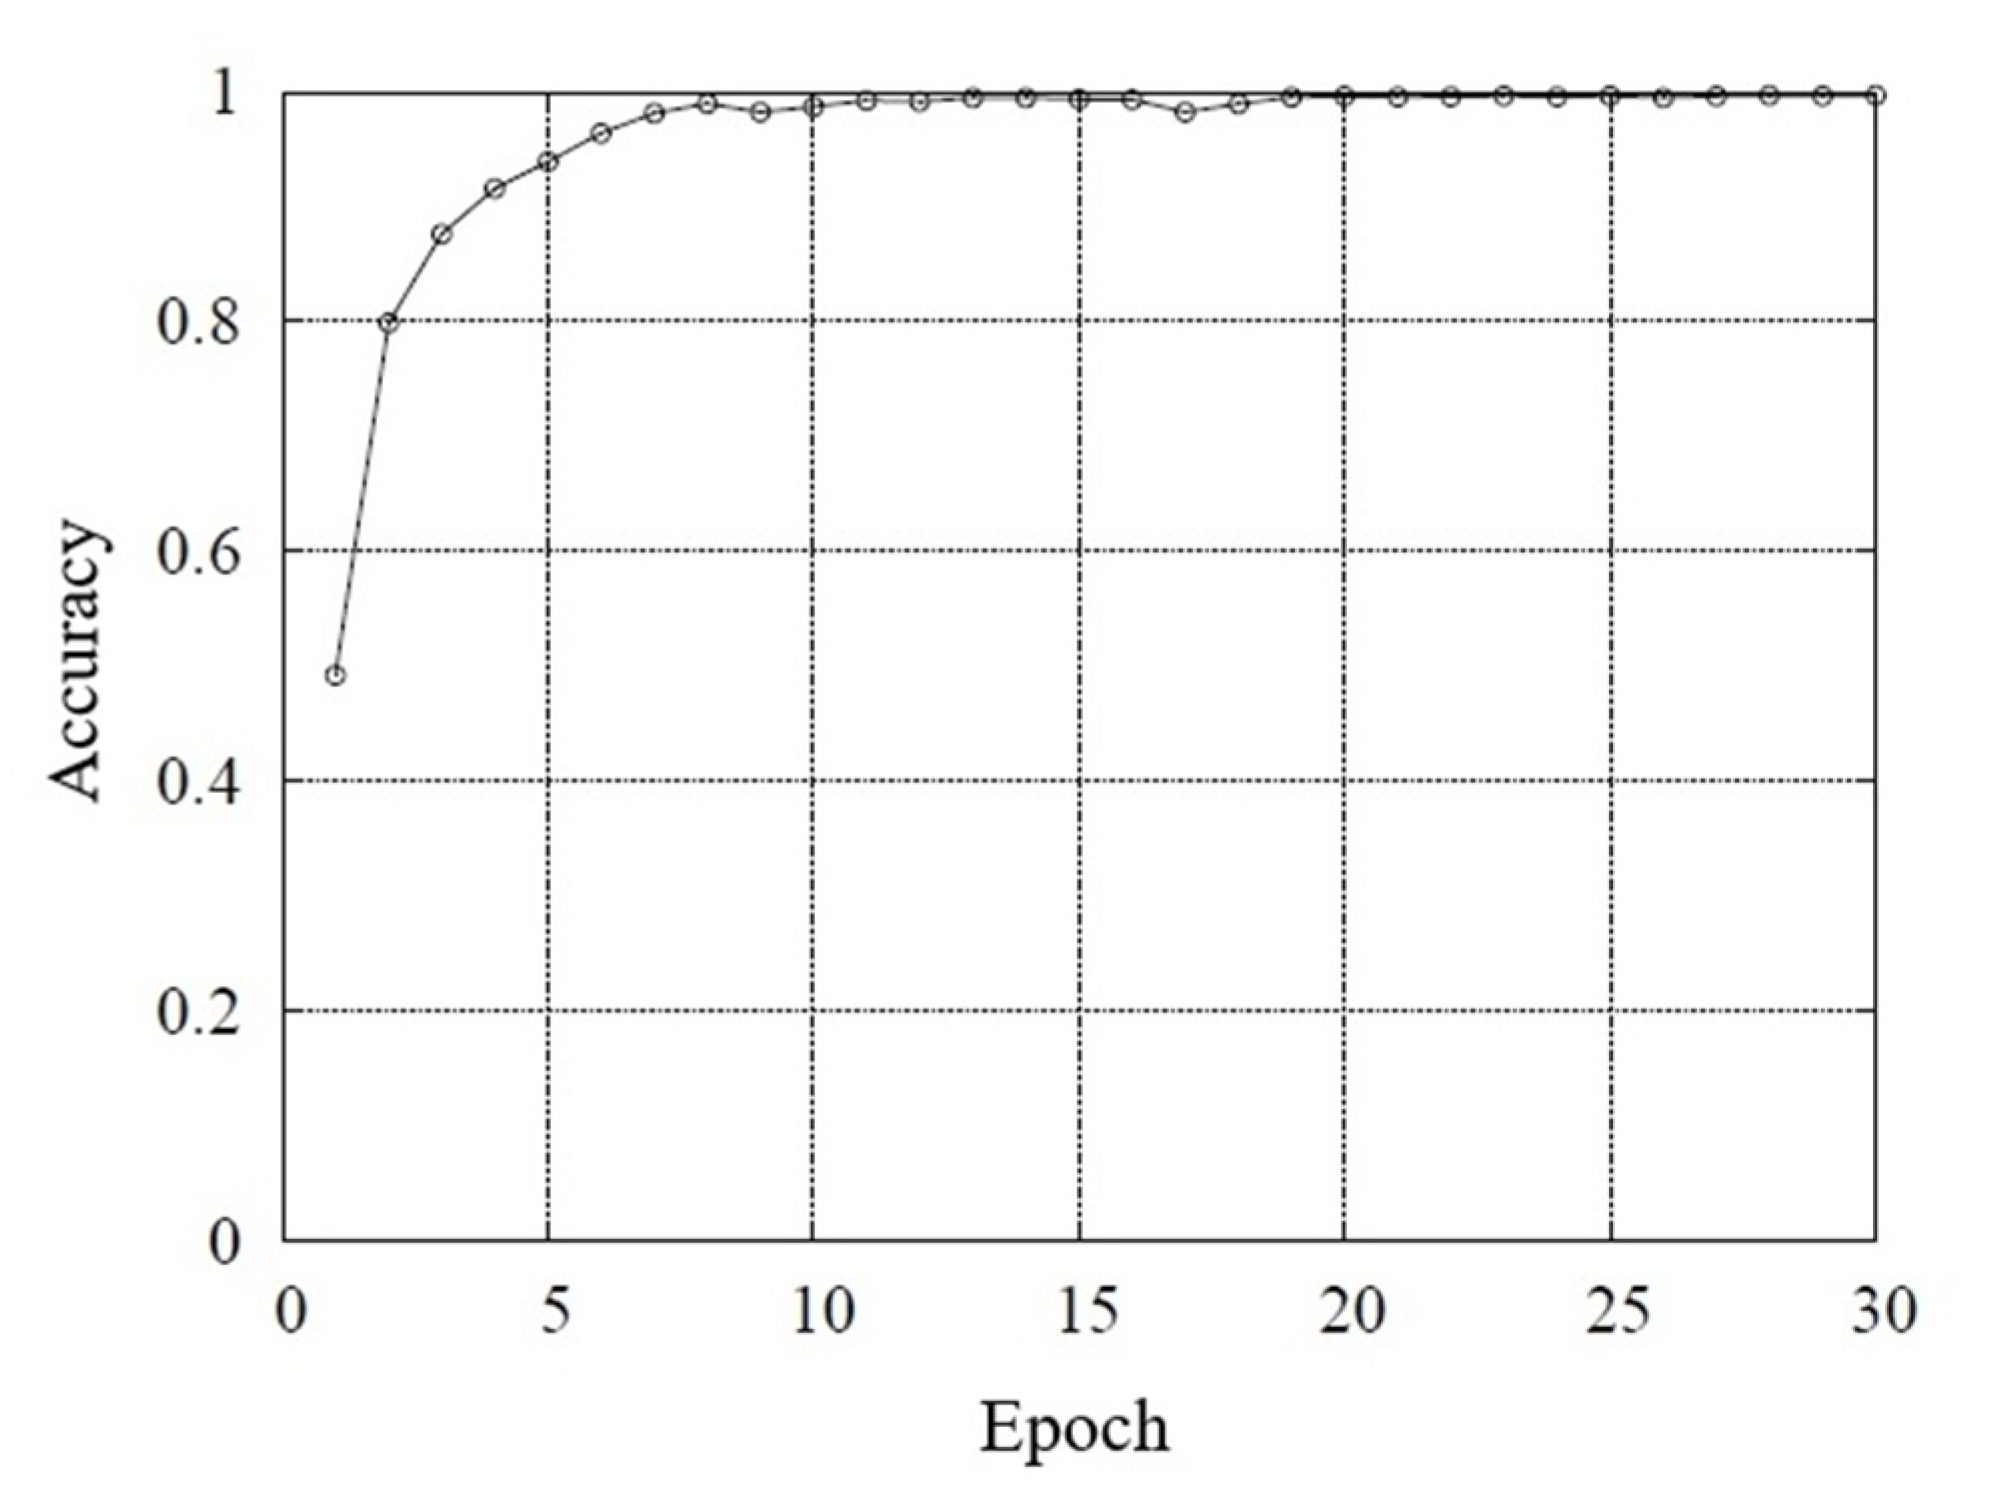
4.2. Training of LSTM
5. Evaluation
5.1. Evaluation of Accuracy
5.2. Discussion
6. Conclusions
- The diagnosis system is simple and can be realized at a low-cost. A microphone is cheap, and the free software Python is available for programming based on deep learning;
- Extremely high accuracy rate of diagnosis is achieved for at least conditions described in the present paper;
- A fault motor can be discriminated from a healthy motor. It can detect a slight fault in bearing or stator winding like a hole of 0.5 mm diameter on an outer raceway of a bearing, one turn-to-turn short circuit of the stator winding;
- Furthermore, a kind of fault can be identified;
- A possible application of the proposed method is a shipping test of motors at manufactures. Reduction in labor, cost, and time of the test can be expected.
Author Contributions
Funding
Conflicts of Interest
References
- Motor Reliability Working Group. Report of Large Motor Reliability Survey of Industrial and Commercial Installation, Part II. IEEE Trans. Ind. Appl. 1985, 21, 865–872. [Google Scholar]
- Zhou, W.; Lu, B.; Habetler, T.G.; Harley, R.G. Incipient Bearing Fault Detection via Motor Stator Current Noise Cancellation Using Wiener Filter. IEEE Trans. Ind. Appl. 2009, 45, 1309–1317. [Google Scholar] [CrossRef]
- Delgado, M.; Cirrincione, G.; Garcia, A.; Ortega, J.A.; Henao, H. A novel condition monitoring scheme for bearing faults based on curvilinear component analysis and hierarchical neural networks. In Proceedings of the 2012 XXth International Conference on Electrical Machines, Marseille, France, 2–5 September 2012; pp. 2472–2478. [Google Scholar]
- Prieto, M.D.; Cirrincione, G.; Espinosa, A.G.; Qrtega, J.A.; Henao, H. Bearing fault diagnosis by a novel condition-monitoring scheme based on statistical-time features and neural networks. IEEE Trans. Ind. Electron. 2013, 60, 3398–3407. [Google Scholar] [CrossRef]
- Jin, X.; Zhao, M.; Chow, T.W.S.; Pecht, M. Motor Bearing Fault Diagnosis Using Trace Ratio Linear Discriminant Analysis. IEEE Trans. Ind. Electron. 2014, 61, 2441–2451. [Google Scholar] [CrossRef]
- Seshadrinath, J.; Singh, B.; Panigrahi, B.K. Investigation of Vibration Signatures for Multiple Fault Diagnosis in Variable Frequency Drives Using Complex Wavelets. IEEE Trans. Power Electron. 2014, 29, 936–945. [Google Scholar] [CrossRef]
- Wang, J.; Peng, Y.; Qiao, W.; Hudgins, J.L. Bearing fault diagnosis of Direct-Drive Wind Turbines Using Multiscale Filtering Spectrum. IEEE Trans. Ind. Appl. 2017, 53, 3029–3038. [Google Scholar] [CrossRef]
- Saucedo-Dorantes, J.J.; Delgado-Prieto, M.; Osornio-Rios, R.A.; Romero-Troncoso, R.D.J. Multifault Diagnosis Method Applied to an Electric Machine Based on High-Dimensional Feature Reduction. IEEE Trans. Ind. Appl. 2016, 53, 3086–3097. [Google Scholar] [CrossRef]
- Ewert, P.; Orlowska-Kowalska, T.; Jankowska, K. Effectiveness Analysis of PMSM Motor Rolling Bearing Fault Detections Based on Vibration Analysis and Shallow Neural Networks. Energies 2021, 14, 712. [Google Scholar] [CrossRef]
- Lau, E.C.C.; Ngan, H.W. Detection of motor bearing outer raceway detect by wavelet packet transformed motor current signature analysis. IEEE Trans. Instrum. Meas. 2010, 59, 2683–2690. [Google Scholar] [CrossRef]
- Frosini, L.; Bassi, E. Stator Current and Motor Efficiency as Indicators for Different Types of Bearing Faults in Induction Motors. IEEE Trans. Ind. Electron. 2010, 57, 244–251. [Google Scholar] [CrossRef]
- Leite, V.C.M.N.; Silva, J.G.B.; Veloso, G.F.C.; Silva, L.E.D.; Lambert-Torres, G.; Bonaldi, E.L.; Oliveria, L.E.L. Detection of Localized Bearing Faults in Induction Machines by Spectral Kurtosis and Envelope Analysis of Stator Current. IEEE Trans. Indu. Electron. 2015, 62, 1855–1865. [Google Scholar] [CrossRef]
- Boudinar, A.H.; Benouzaa, N.; Bendiabdellah, A.; Khodja, M.E.A. Induction Motor Bearing Fault Analysis Using a Root-MUSIC Method. IEEE Trans. Ind. Appl. 2016, 52, 3851–3860. [Google Scholar] [CrossRef]
- Pandarakone, S.E.; Mizuno, Y.; Nakamura, H. Distinct Fault Analysis of Induction Motor Bearing Using Frequency Spectrum Determination and Support Vector Machine. IEEE Trans. Ind. Appl. 2016, 53, 3049–3056. [Google Scholar] [CrossRef]
- Pandarakone, S.E.; Mizuno, Y.; Nakamura, H. Evaluating the Progression and Orientation of Scratches on Outer-Raceway Bearing Using a Pattern Recognition Method. IEEE Trans. Ind. Electron. 2018, 66, 1307–1314. [Google Scholar] [CrossRef]
- Kang, M.; Kim, J.; Wills, L.; Kim, J.M. Time-Varying and Multiresolution Envelope Analysis and Discriminative Feature Analysis for Bearing Fault Diagnosis. IEEE Trans. Ind. Electron. 2015, 62, 7749–7761. [Google Scholar] [CrossRef]
- Hamadache, M.; Lee, D.; Veluvolu, K.C. Rotor Speed-Based Bearing Fault Diagnosis (RSB-BFD) Under Variable Speed and Constant Load. IEEE Trans. Ind. Electron. 2015, 62, 6486–6495. [Google Scholar] [CrossRef]
- Geiman, J. DC Step-Voltage and Surge Testing Motors. Available online: https://www.efficientplantmag.com/2007/03/dc-step-voltage-and-surge-testing-of-motors/ (accessed on 13 January 2021).
- Yang, S.C. Online Stator Turn Fault Detection for Inverter-Fed Electric Machines Using Neutral Point Voltages Difference. IEEE Trans. Ind. Appl. 2016, 52, 4039–4049. [Google Scholar] [CrossRef]
- Bouzid, M.B.K.; Champenois, G. An Efficient Simplified Physical Faulty Model of a Permanent Magnet Synchronous Generator Dedicated to Stator Fault Diagnosis Part II: Automatic Stator Fault Diagnosis. IEEE Trans. Ind. Appl. 2017, 53, 2762–2771. [Google Scholar] [CrossRef]
- Pandarakone, S.E.; Mizuno, Y.; Nakamura, H. Online Slight Inter-Turn Short-Circuit Fault Diagnosis Using the Distortion Ratio of Load Current in a Low-Voltage Induction Motor. IEEJ J. Ind. Appl. 2018, 7, 473–478. [Google Scholar] [CrossRef]
- Saleh, S.A.; Ozkop, E. Phaselet-Based Method for Detecting Electric Faults in 3ϕ Induction Motor Drives—Part I: Analysis and Development. IEEE Trans. Ind. Appl. 2017, 53, 2976–2987. [Google Scholar] [CrossRef]
- Irhoumah, M.; Pusca, R.; Lefevre, E.; Mercier, D.; Romary, R. Detection of the Stator Winding Inter-Turn Faults in Asynchronous and Synchronous Machines Through the Correlation Between Harmonics of the Voltage of Two Magnetic Flux Sensors. IEEE Trans. Ind. Appl. 2019, 55, 2682–2689. [Google Scholar] [CrossRef]
- Gyftakis, K.N.; Sumislawska, M.; Kavanagh, D.F.; Howey, D.A.; McCulloch, M.D. Dielectric Characteristics of Electric Vehicle Traction Motor Winding Insulation Under Thermal Aging. IEEE Trans. Ind. Appl. 2016, 52, 1398–1404. [Google Scholar]
- Sumislawska, M.; Gyftakis, K.N.; Kavanagh, D.F.; McCulloch, M.D.; Burnham, K.J.; Howey, D.A. The Impact of Thermal Degradation on Properties of Electrical Machine Winding Insulation Material. IEEE Trans. Ind. Appl. 2016, 52, 2951–2960. [Google Scholar] [CrossRef]
- Mizusawa, T.; Kondo, Y.; Takizawa, N.; Kawaharada, Y. Fundamental Study on Impact Sound Generated from Plates Colliding Spherical Bodies. Proc. Jpn. Soc. Civil Eng. 2004, 766, 47–57. (In Japanese) [Google Scholar]
- Hochreiter, S.; Schmidhuber, J. Long Short-Term Memory. Neural Comput. 1997, 9, 1735–1780. [Google Scholar] [CrossRef]


| Hidden Units | Loss | Accuracy (%) |
|---|---|---|
| 100 | 0.106 | 97.8 |
| 200 | 0.077 | 97.9 |
| 300 | 0.017 | 99.7 |
| 400 | 0.018 | 99.6 |
| 500 | 0.013 | 99.7 |
| Motor Condition | Target Motor | ||||||
|---|---|---|---|---|---|---|---|
| He | 1H05 | 1H20 | 2H20 | Sc | Sh | ||
| Results of diagnosis | He | 90 | 0 | 0 | 0 | 0 | 0 |
| 1H05 | 0 | 30 | 0 | 0 | 0 | 0 | |
| 1H20 | 0 | 0 | 30 | 0 | 0 | 0 | |
| 2H20 | 0 | 0 | 0 | 30 | 0 | 0 | |
| Sc | 0 | 0 | 0 | 0 | 30 | 0 | |
| Sh | 0 | 0 | 0 | 0 | 0 | 30 | |
| Accuracy average (%) | 100 | 100 | 100 | 100 | 100 | 100 | |
| Motor Condition | Target Motor | ||||||
|---|---|---|---|---|---|---|---|
| He | 1H05 | 1H20 | 2H20 | Sc | Sh | ||
| Results of diagnosis | He | 77 | 0 | 0 | 0 | 0 | 0 |
| 1H05 | 13 | 30 | 0 | 0 | 0 | 0 | |
| 1H20 | 0 | 0 | 30 | 0 | 0 | 0 | |
| 2H20 | 0 | 0 | 0 | 30 | 0 | 0 | |
| Sc | 0 | 0 | 0 | 0 | 30 | 0 | |
| Sh | 0 | 0 | 0 | 0 | 0 | 30 | |
| Accuracy average (%) | 85.6 | 100 | 100 | 100 | 100 | 100 | |
| Motor Condition | Target Motor | |||
|---|---|---|---|---|
| He-A1 | He-A2 | 1H05-A1 | ||
| Results of diagnosis | He | 30 | 27 | 0 |
| 1H05 | 0 | 3 | 30 | |
| 1H20 | 0 | 0 | 0 | |
| 2H20 | 0 | 0 | 0 | |
| Sc | 0 | 0 | 0 | |
| Sh | 0 | 0 | 0 | |
| Accuracy average (%) | 100 | 90.0 | 100 | |
Publisher’s Note: MDPI stays neutral with regard to jurisdictional claims in published maps and institutional affiliations. |
© 2021 by the authors. Licensee MDPI, Basel, Switzerland. This article is an open access article distributed under the terms and conditions of the Creative Commons Attribution (CC BY) license (http://creativecommons.org/licenses/by/4.0/).
Share and Cite
Nakamura, H.; Asano, K.; Usuda, S.; Mizuno, Y. A Diagnosis Method of Bearing and Stator Fault in Motor Using Rotating Sound Based on Deep Learning. Energies 2021, 14, 1319. https://doi.org/10.3390/en14051319
Nakamura H, Asano K, Usuda S, Mizuno Y. A Diagnosis Method of Bearing and Stator Fault in Motor Using Rotating Sound Based on Deep Learning. Energies. 2021; 14(5):1319. https://doi.org/10.3390/en14051319
Chicago/Turabian StyleNakamura, Hisahide, Keisuke Asano, Seiran Usuda, and Yukio Mizuno. 2021. "A Diagnosis Method of Bearing and Stator Fault in Motor Using Rotating Sound Based on Deep Learning" Energies 14, no. 5: 1319. https://doi.org/10.3390/en14051319
APA StyleNakamura, H., Asano, K., Usuda, S., & Mizuno, Y. (2021). A Diagnosis Method of Bearing and Stator Fault in Motor Using Rotating Sound Based on Deep Learning. Energies, 14(5), 1319. https://doi.org/10.3390/en14051319