
Influence of Water Saturation, Grain Size of Quartz Sand and Hydrate-Former on the Gas Hydrate Formation


 and
and
Abstract
1. Introduction
2. Materials and Methods
3. Results
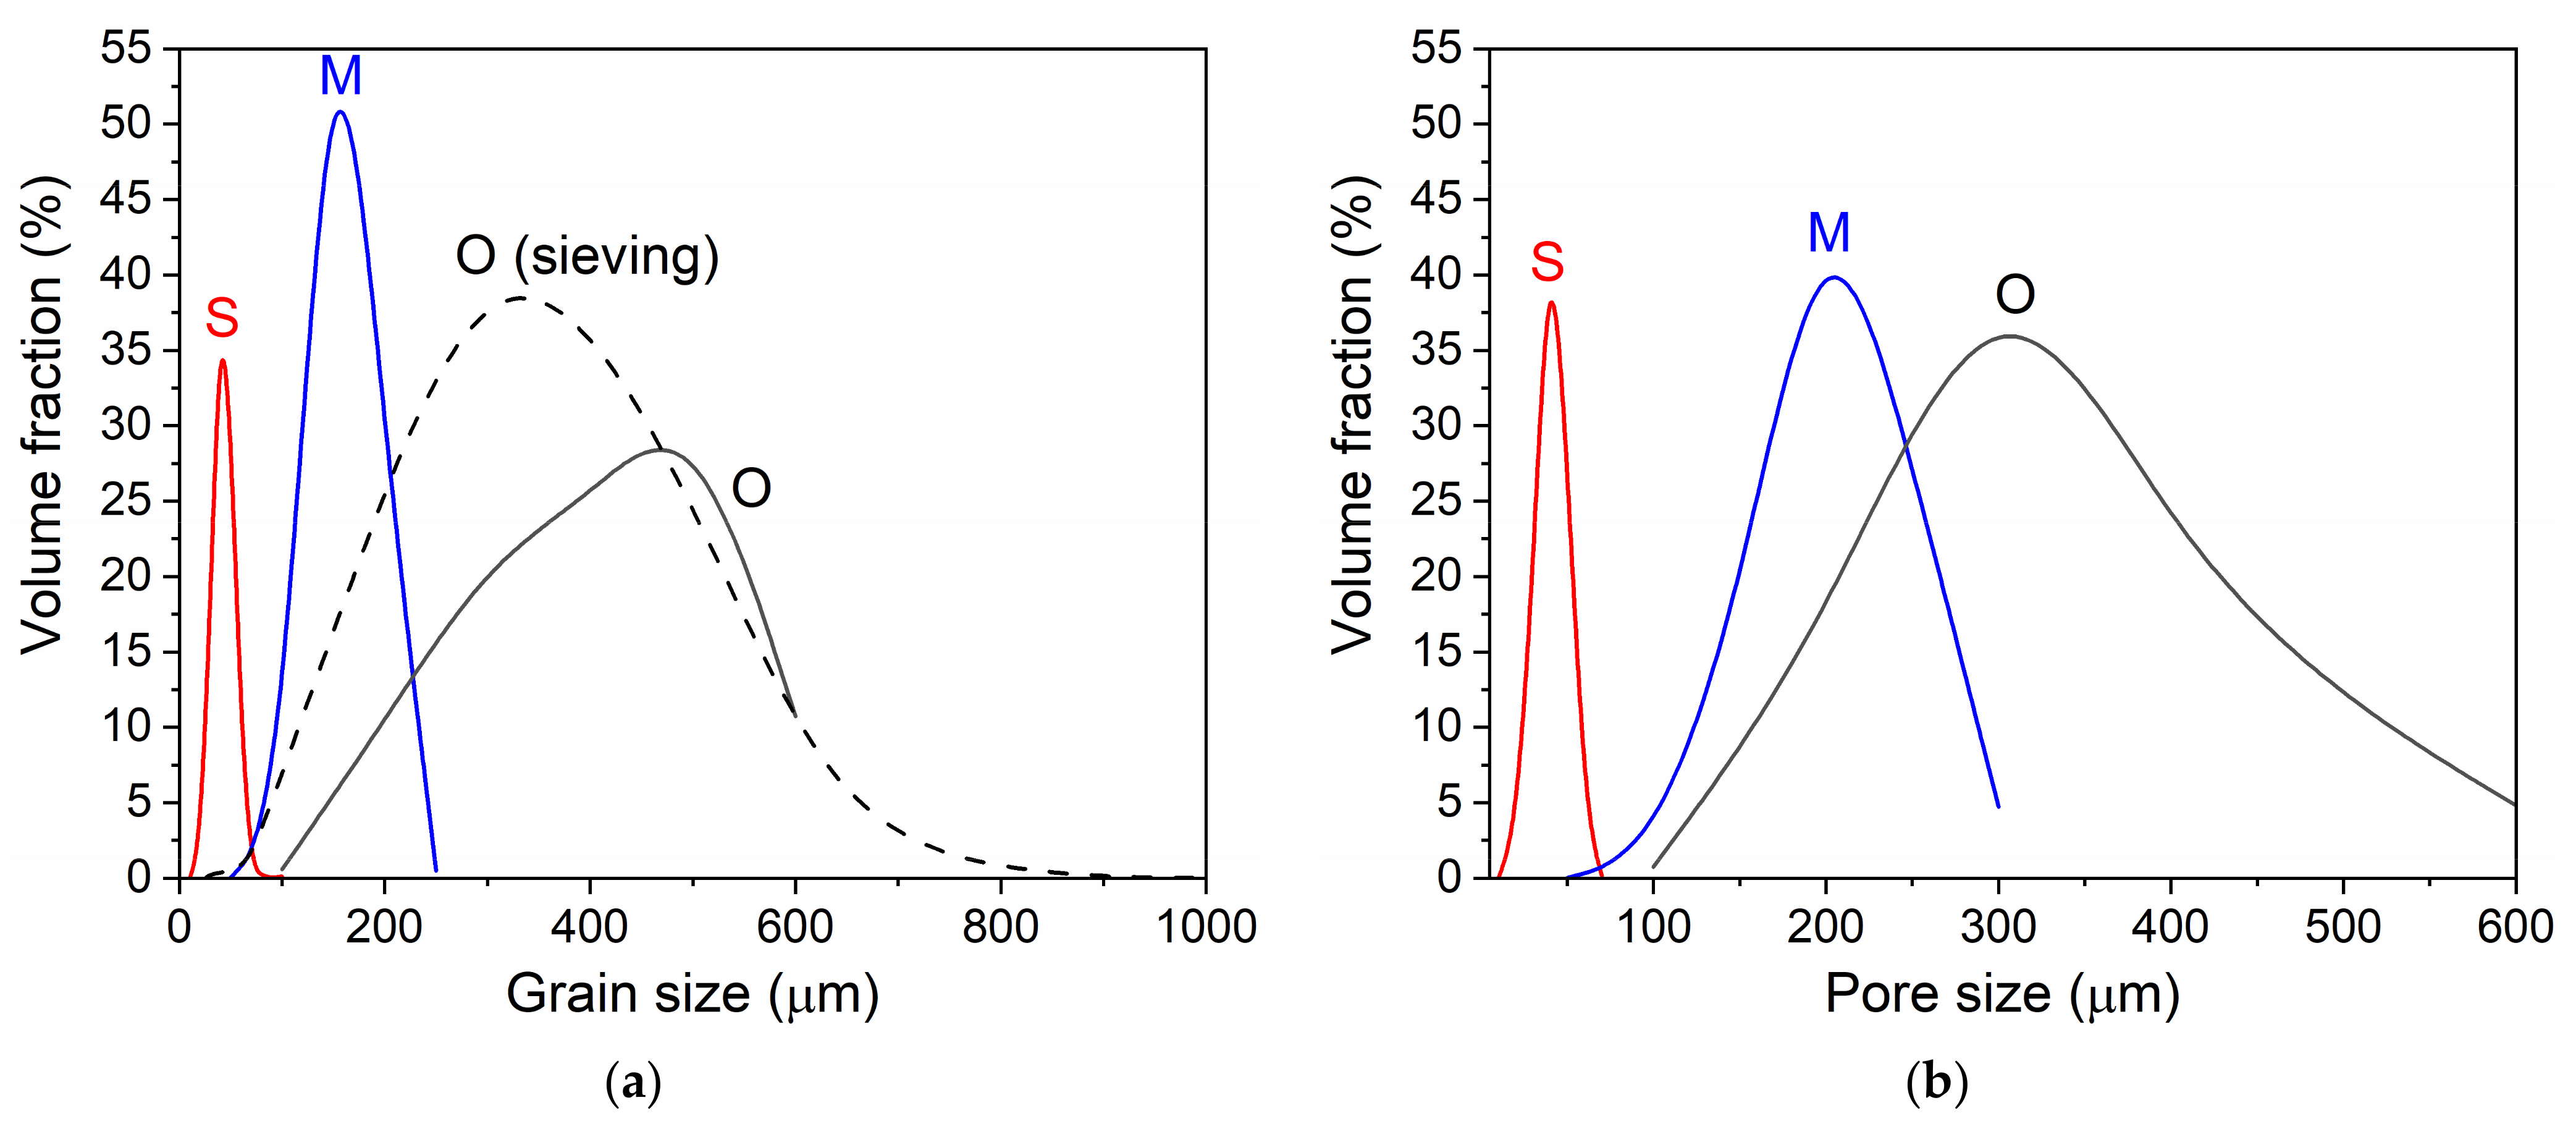
3.1. Granulometric Analysis
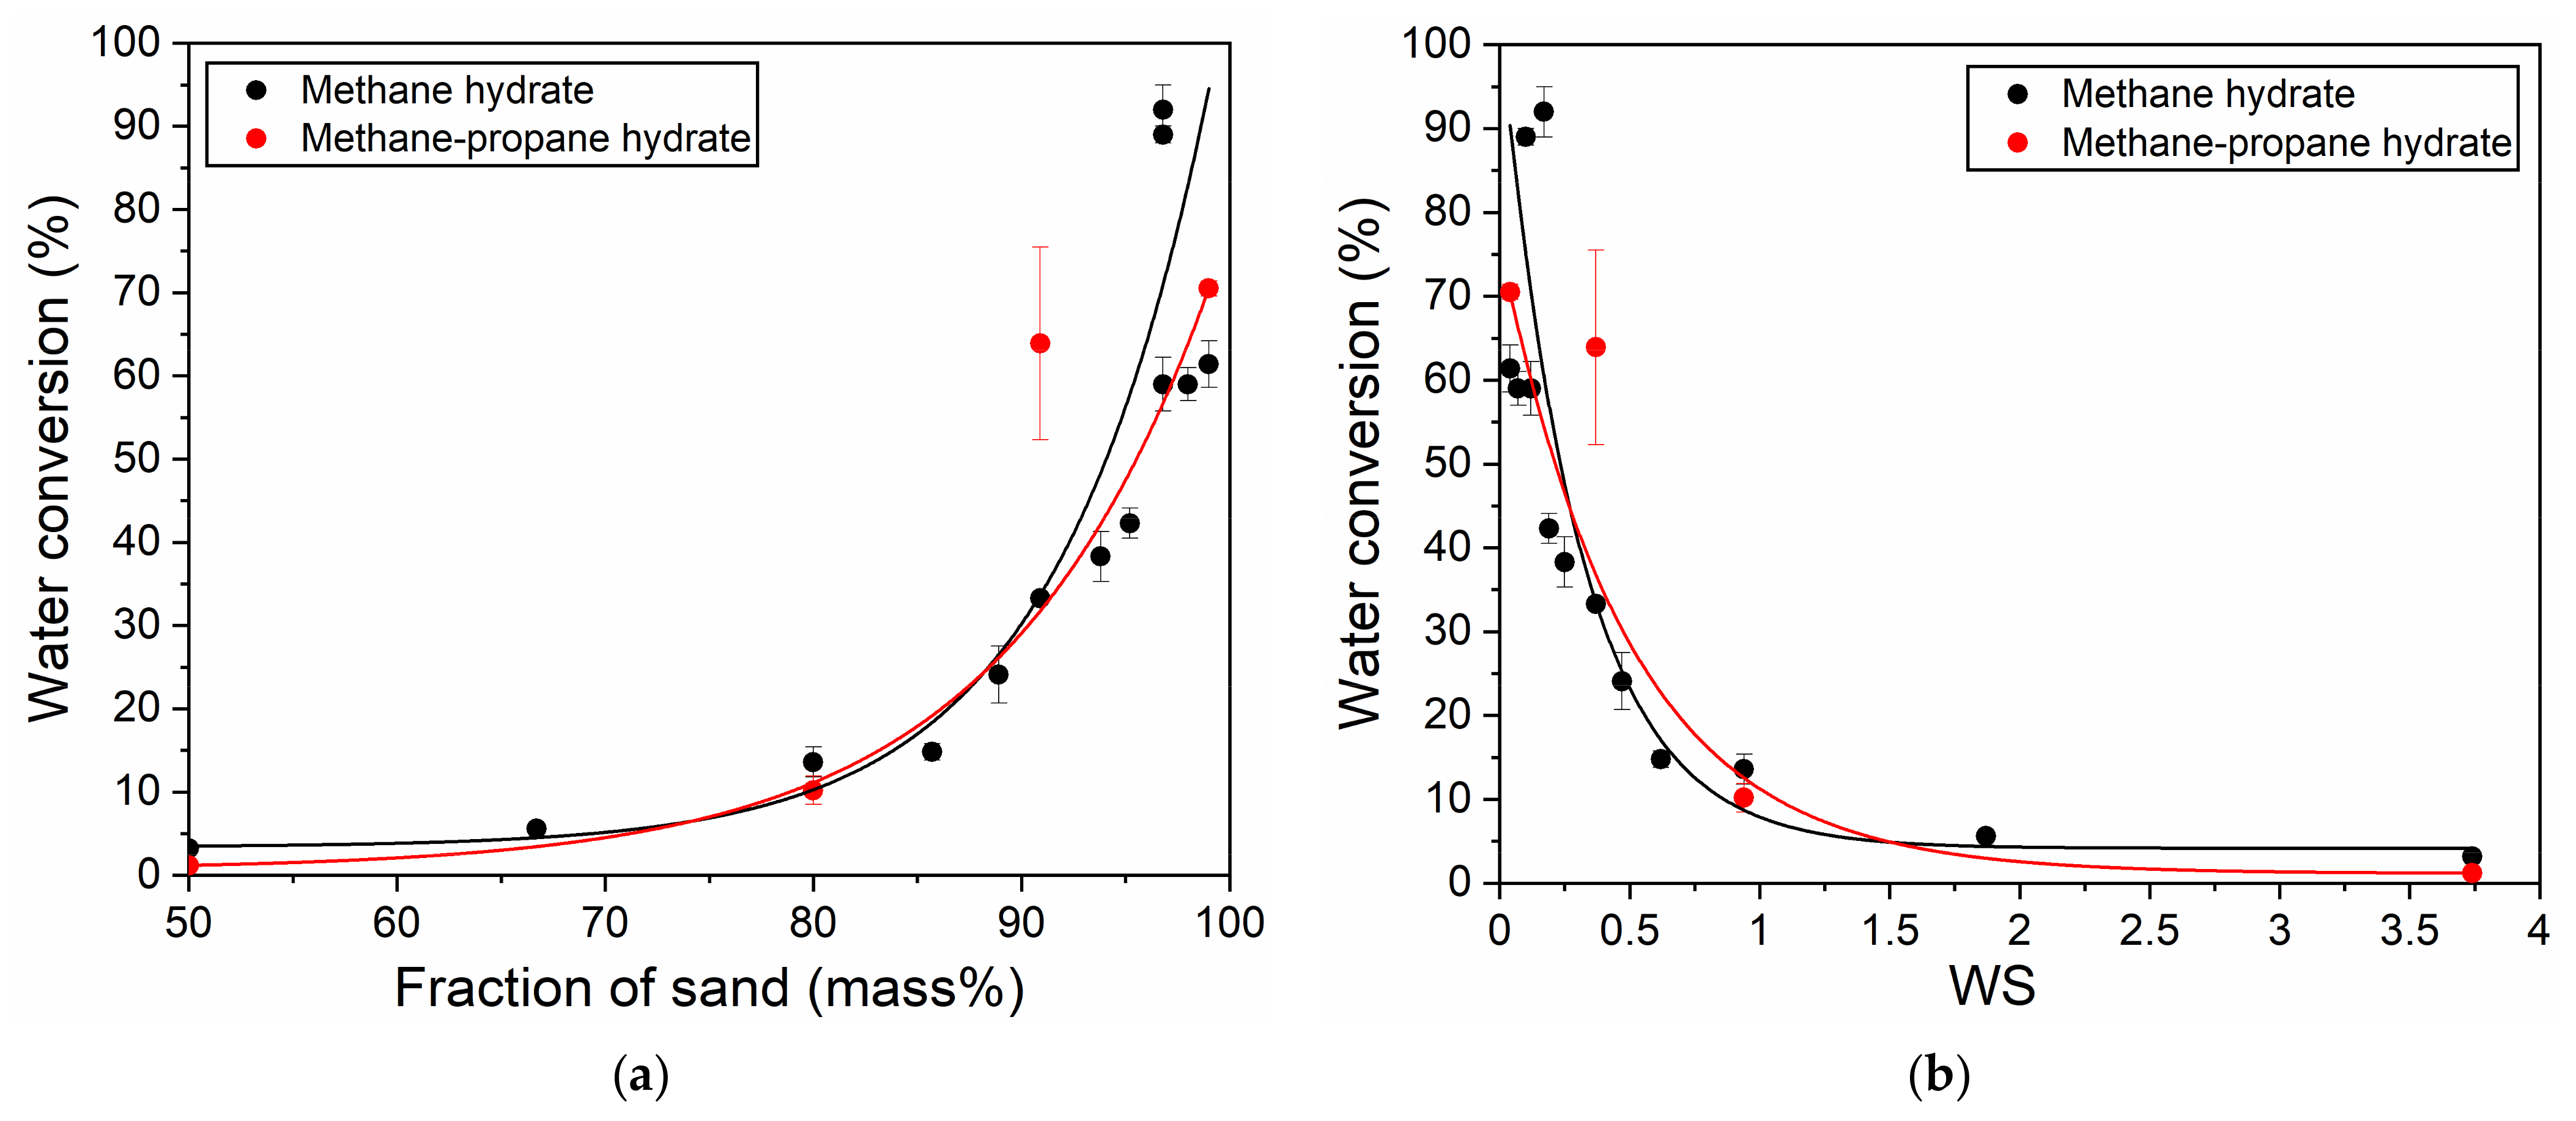
3.2. Influence of Water Saturation on the Methane Hydrate Formation
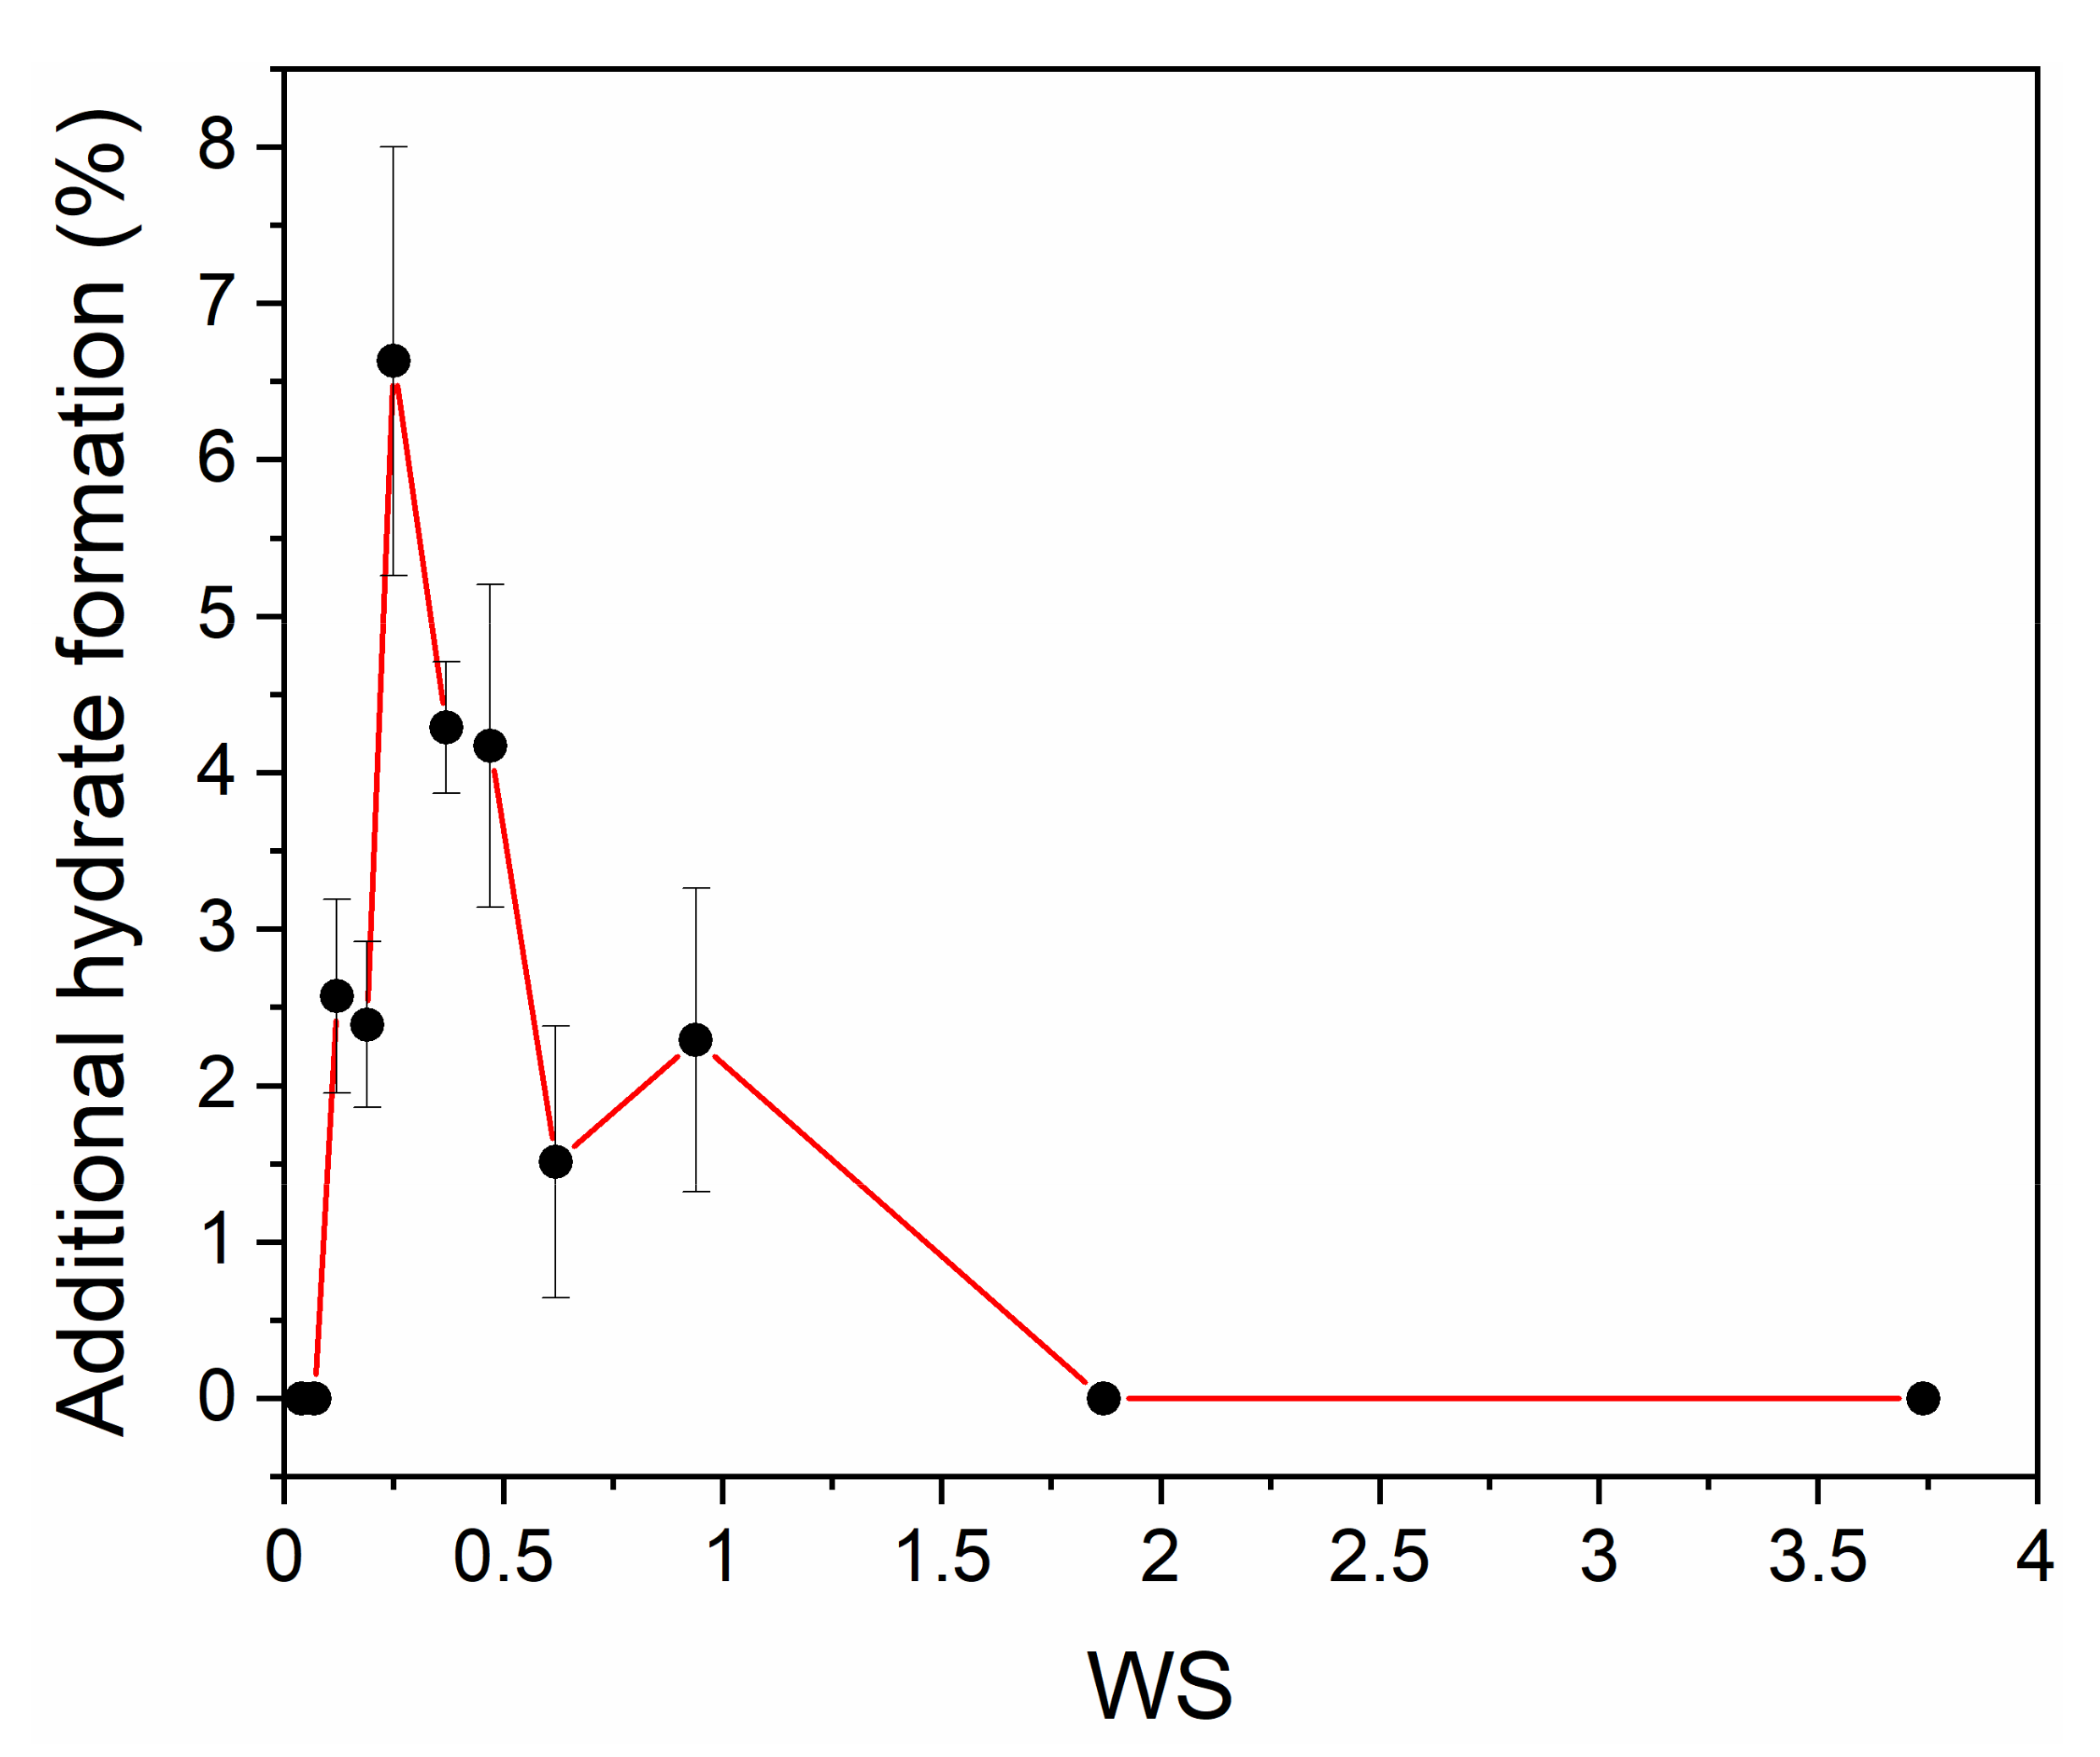
3.3. Influence of Water Saturation on the Formation of Methane-Propane Hydrate
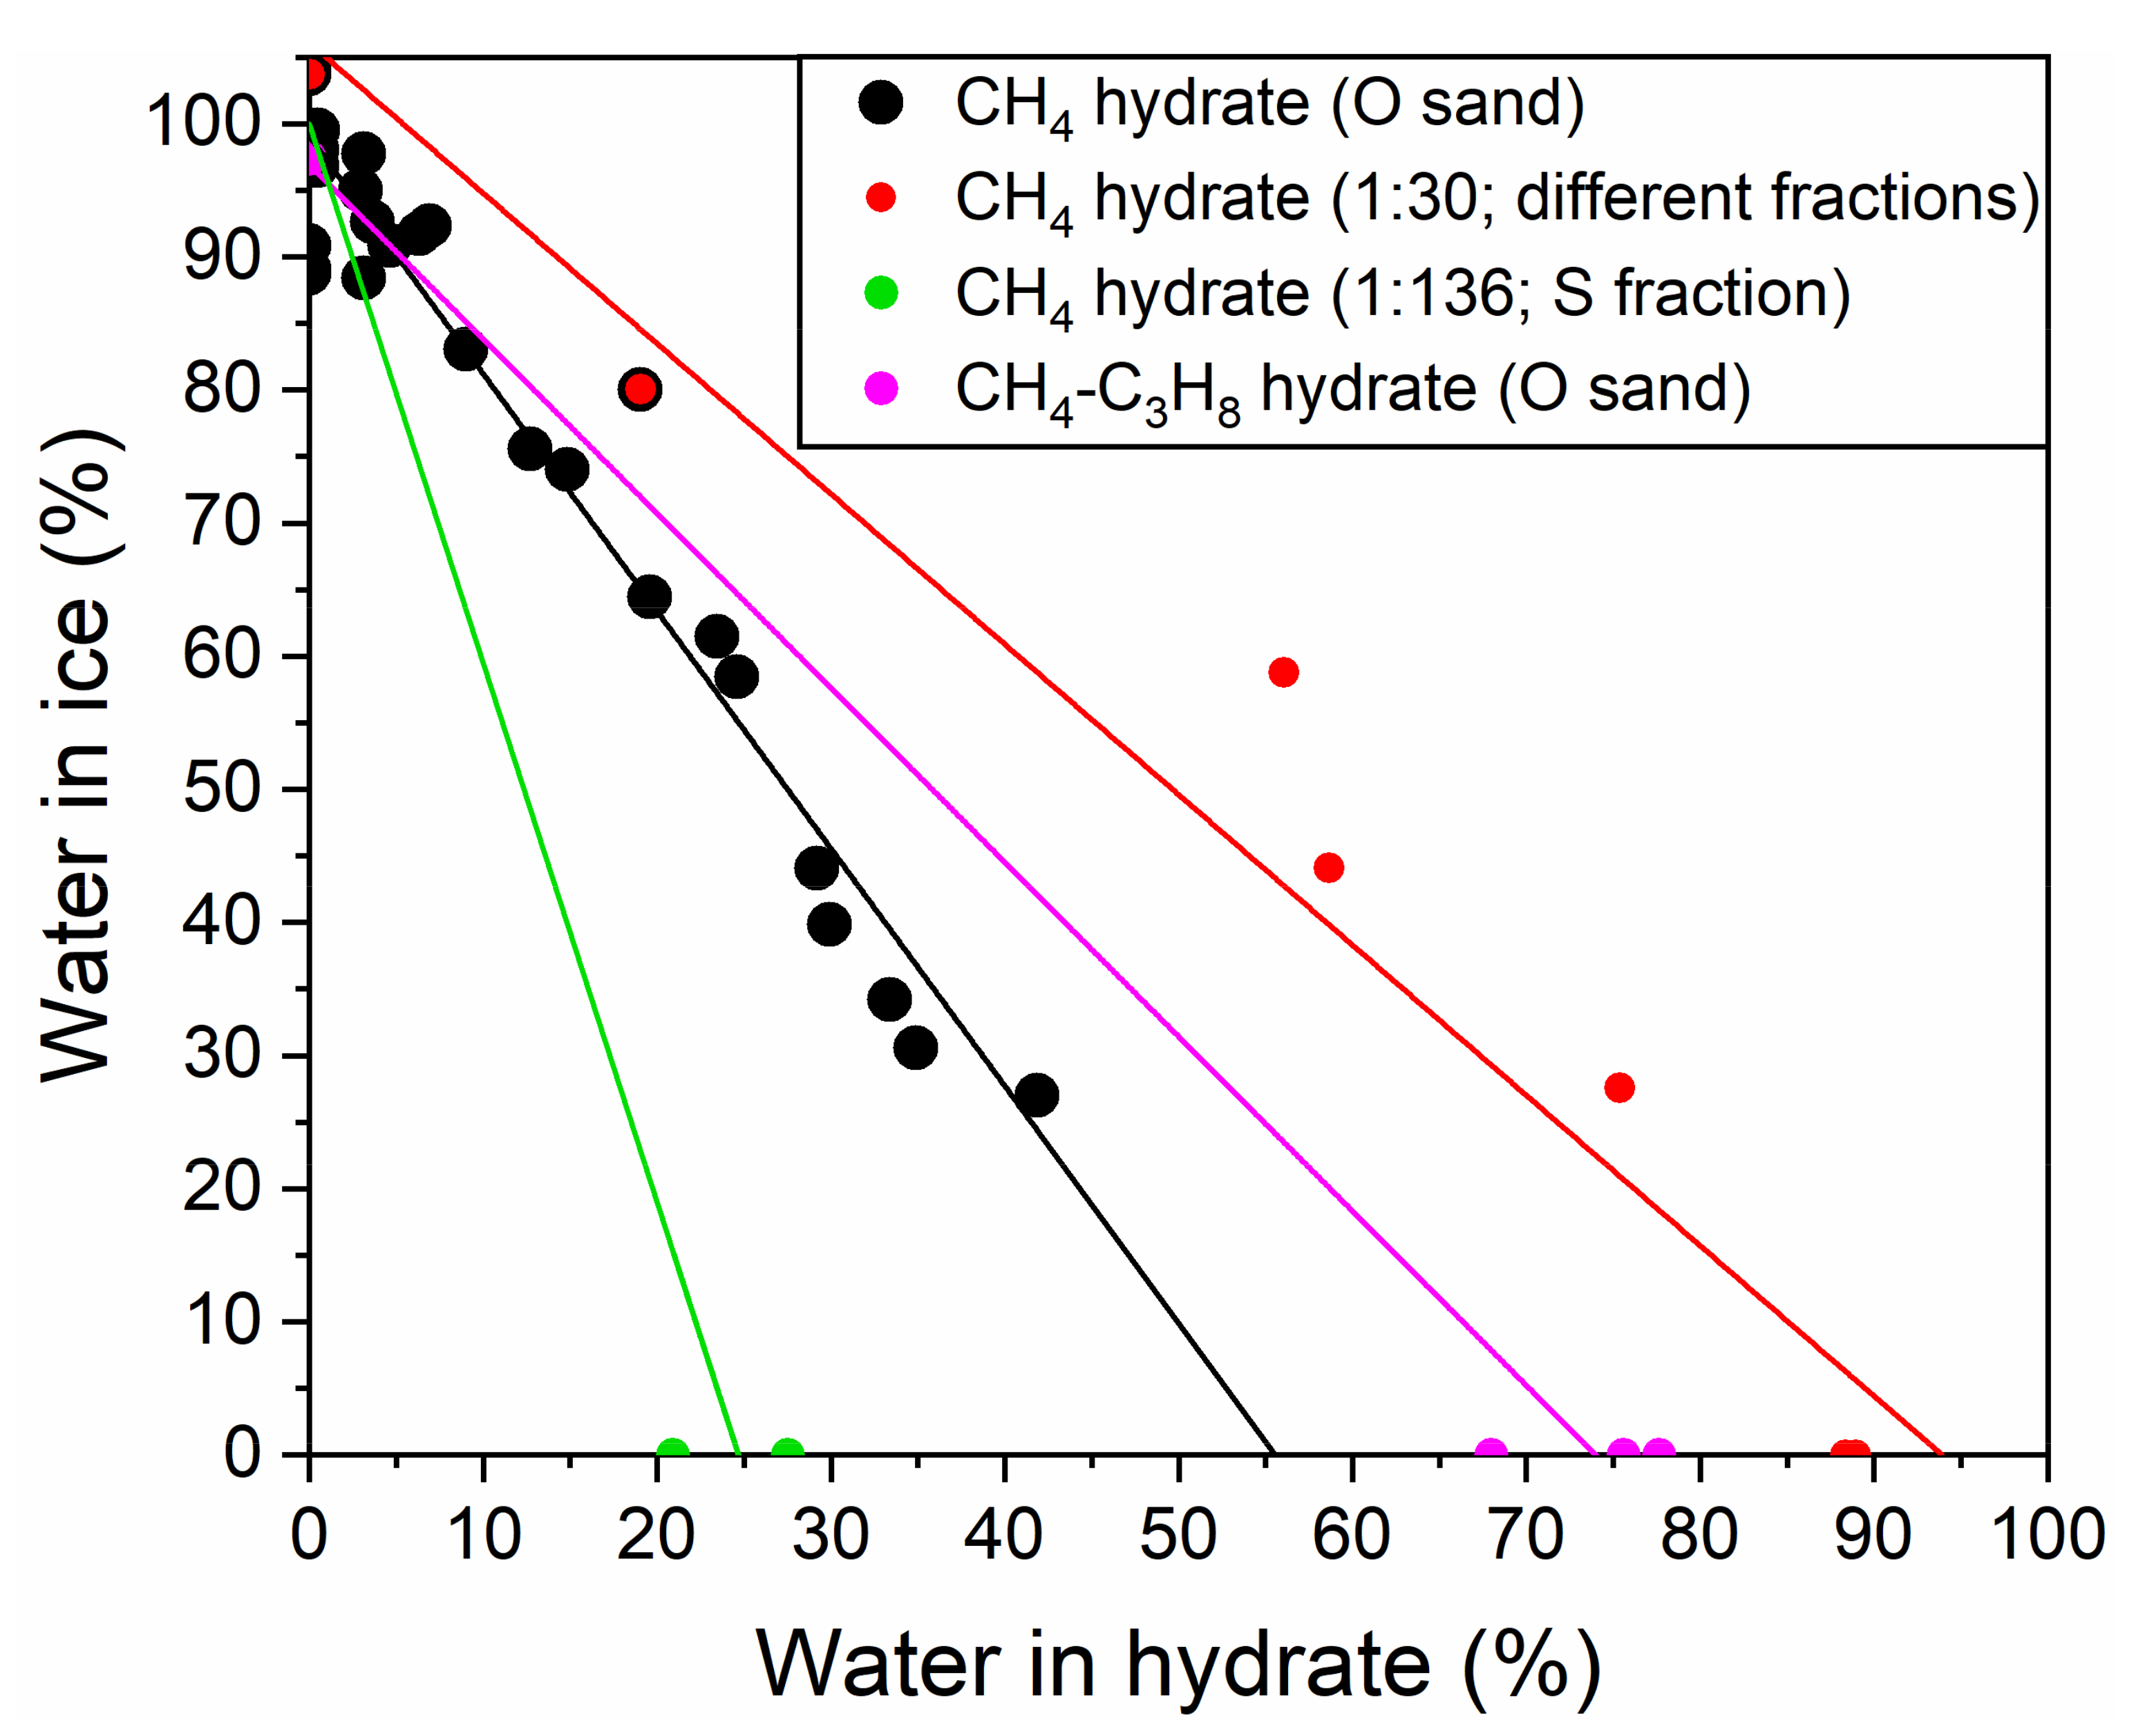
3.4. Influence of the Size of Quartz Sand Particles on the Formation of Methane Hydrates
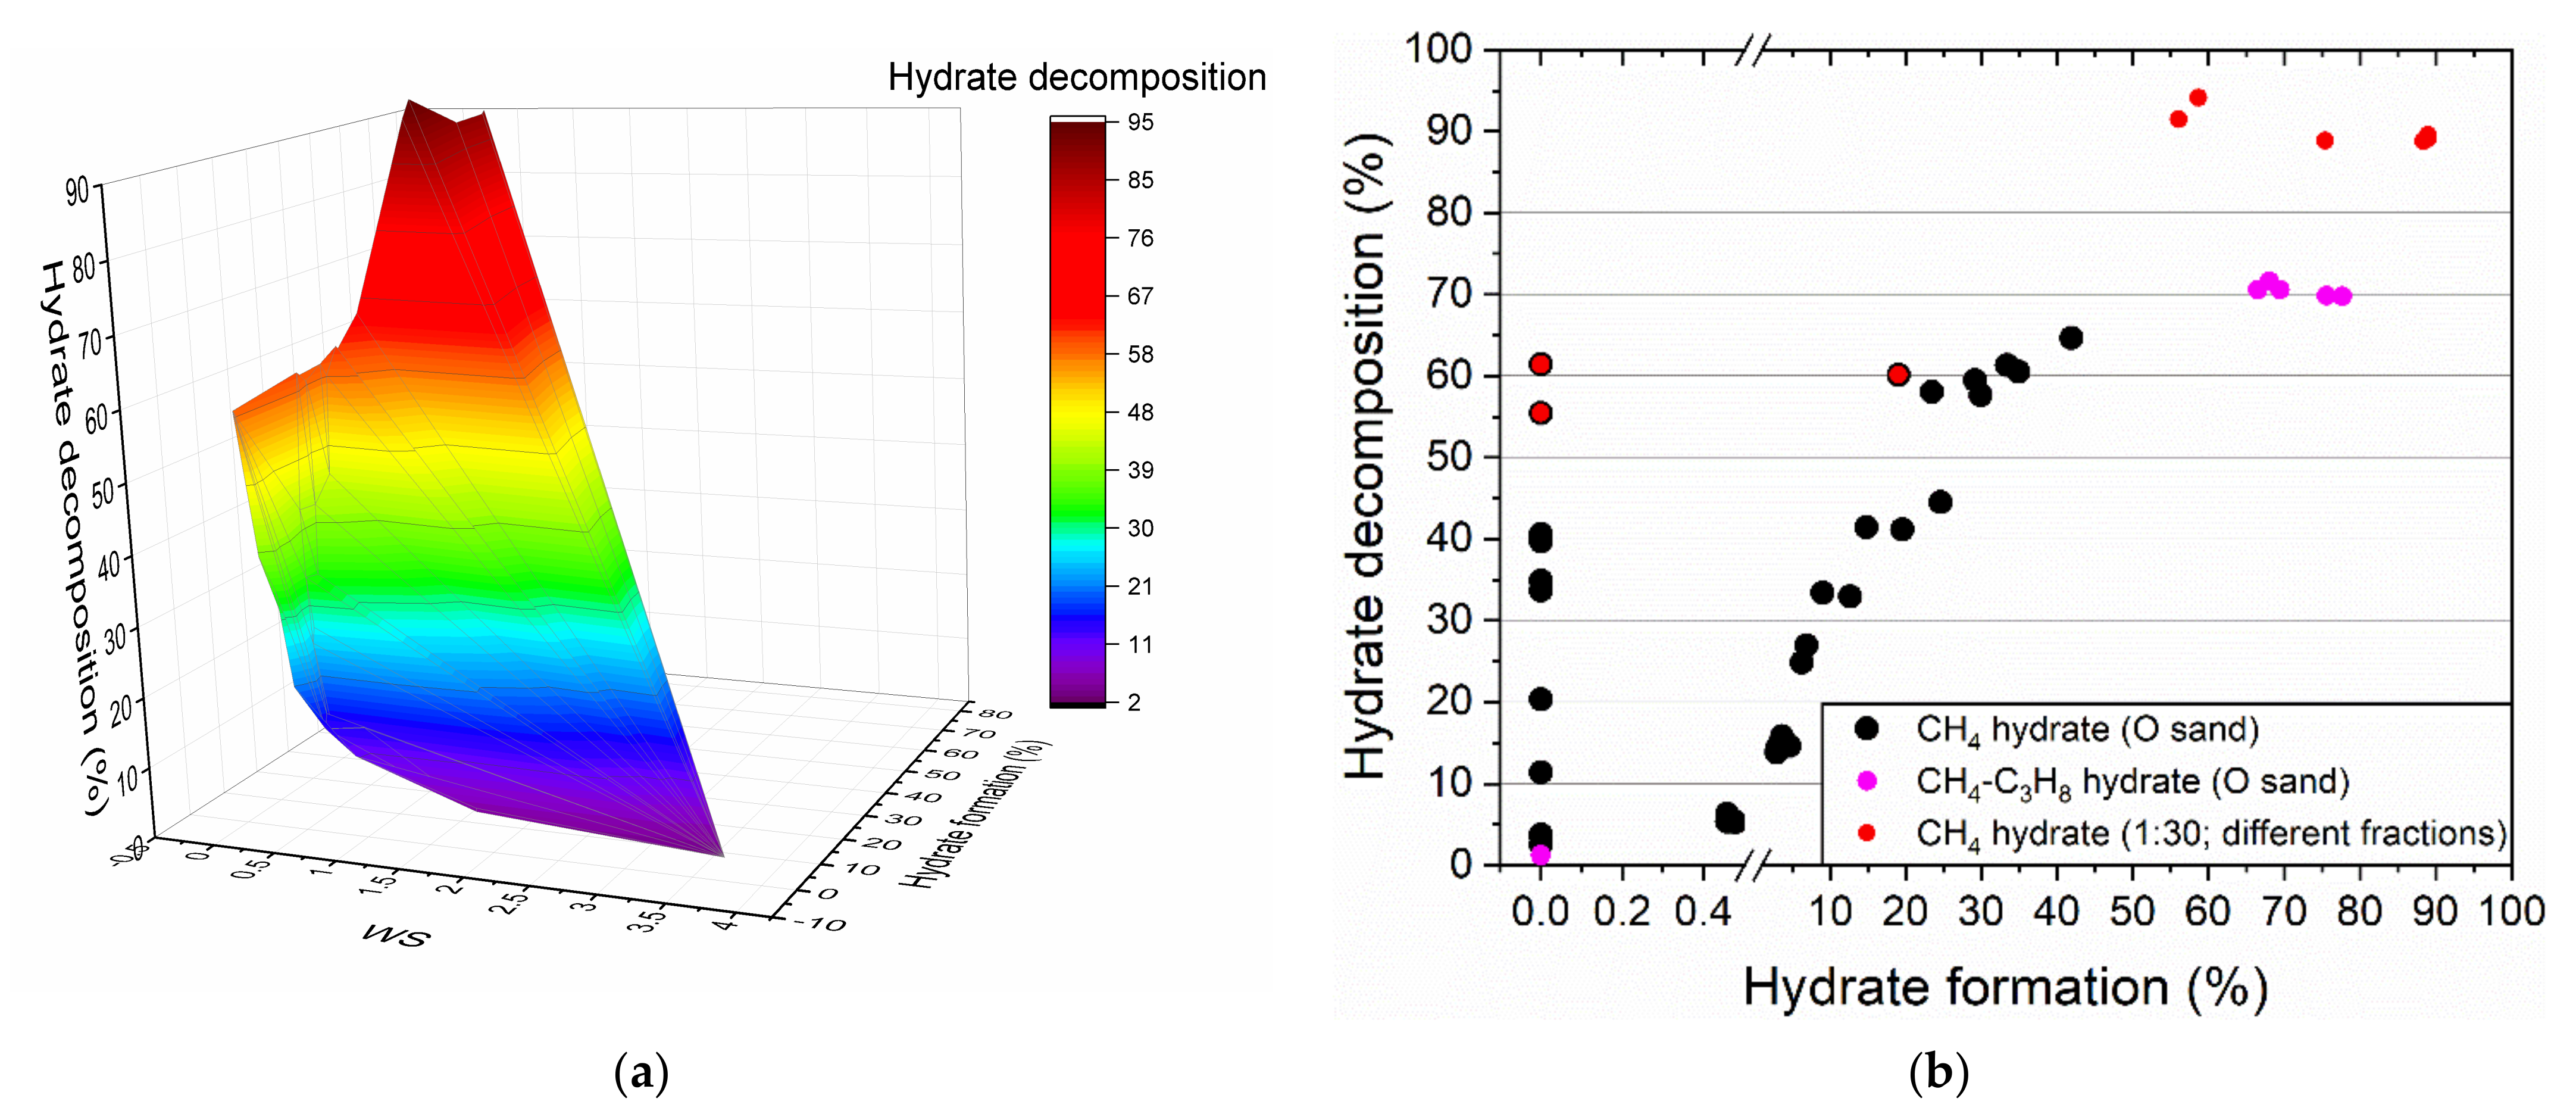
4. Discussion
Influence of Water Saturation, Grain Size of Quartz Sand and Hydrate-Former on Gas Hydrate Formation
5. Conclusions
Author Contributions
Funding
Institutional Review Board Statement
Informed Consent Statement
Data Availability Statement
Conflicts of Interest
References
- Sloan, E.D.; Koh, C.A. Clathrate Hydrates of Natural Gases, 3rd ed.; CRC Press: Boca Raton, FL, USA; London, UK; New York, NY, USA, 2008. [Google Scholar]
- Kirov, M. Atlas of optimal proton configurations of water clusters in the form of gas hydrate cavities. J. Struct. Chem. 2002, 43, 790–797. [Google Scholar] [CrossRef]
- Manakov, A.Y.; Kosyakov, V.I.; Solodovnikov, S.F. Structural Chemistry of Clathrate Hydrates and Related Compounds. In Comprehensive Supramolecular Chemistry II; JL, A., Ed.; Elsevier: Oxford, UK, 2017; pp. 161–206. [Google Scholar]
- Sloan, E.D. Natural Gas Hydrates in Flow Assurance; Gulf Professional Publishing: Houston, TX, USA, 2010. [Google Scholar]
- Boswell, R.; Collett, T.S. Current perspectives on gas hydrate resources. Energy Environ. Sci. 2011, 4, 1206–1215. [Google Scholar] [CrossRef]
- Mimachi, H.; Takeya, S.; Yoneyama, A.; Hyodo, K.; Takeda, T.; Gotoh, Y.; Murayama, T. Natural gas storage and transportation within gas hydrate of smaller particle: Size dependence of self-preservation phenomenon of natural gas hydrate. Chem. Eng. Sci. 2014, 118, 208–213. [Google Scholar] [CrossRef]
- Babu, P.; Nambiar, A.; He, T.; Karimi, I.A.; Lee, J.D.; Englezos, P.; Linga, P. A Review of Clathrate Hydrate Based Desalination To Strengthen Energy-Water Nexus. ACS Sustain. Chem. Eng. 2018, 6, 8093–8107. [Google Scholar] [CrossRef]
- Misyura, S. Dissociation of various gas hydrates (methane hydrate, double gas hydrates of methane-propane and methane-isopropanol) during combustion: Assessing the combustion efficiency. Energy 2020, 206, 118120. [Google Scholar] [CrossRef]
- Misyura, S. Developing the environmentally friendly technologies of combustion of gas hydrates. Reducing harmful emissions during combustion. Environ. Pollut. 2020, 265, 114871. [Google Scholar] [CrossRef]
- Delahaye, A.; Fournaison, L.; Dalmazzone, D. Use of Hydrates for Cold Storage and Distribution in Refrigeration and Air-Conditioning Applications. In Gas Hydrates 2: Geoscience Issues and Potential Industrial Applications; Wiley: Hoboken, NJ, USA, 2018; pp. 315–358. [Google Scholar] [CrossRef]
- Milkov, A.V. Global estimates of hydrate-bound gas in marine sediments: How much is really out there? Earth Sci. Rev. 2004, 66, 183–197. [Google Scholar] [CrossRef]
- Ruppel, C. Permafrost-Associated Gas Hydrate: Is It Really Approximately 1 % of the Global System? J. Chem. Eng. Data 2015, 60, 429–436. [Google Scholar] [CrossRef]
- Chong, Z.R.; Yang, S.H.B.; Babu, P.; Linga, P.; Li, X.-S. Review of natural gas hydrates as an energy resource: Prospects and challenges. Appl. Energy 2016, 162, 1633–1652. [Google Scholar] [CrossRef]
- Milkov, A.V.; Sassen, R. Economic geology of offshore gas hydrate accumulations and provinces. Mar. Pet. Geol. 2002, 19, 1–11. [Google Scholar] [CrossRef]
- Misyura, S.Y. Non-stationary combustion of natural and artificial methane hydrate at heterogeneous dissociation. Energy 2019, 181, 589–602. [Google Scholar] [CrossRef]
- Cui, Y.; Lu, C.; Wu, M.; Peng, Y.; Yao, Y.; Luo, W. Review of exploration and production technology of natural gas hydrate. Adv. Geo-Energy Res. 2018, 2, 53–62. [Google Scholar] [CrossRef]
- Yang, X.; Sun, C.-Y.; Su, K.-H.; Yuan, Q.; Li, Q.-P.; Chen, G.-J. A three-dimensional study on the formation and dissociation of methane hydrate in porous sediment by depressurization. Energy Convers. Manag. 2012, 56, 1–7. [Google Scholar] [CrossRef]
- Gao, Q.; Yin, Z.; Zhao, J.; Yang, D.; Linga, P. Tuning the fluid production behaviour of hydrate-bearing sediments by multi-stage depressurization. Chem. Eng. J. 2021, 406, 127174. [Google Scholar] [CrossRef]
- Feng, J.-C.; Wang, Y.; Li, X.-S.; Chen, Z.-Y.; Li, G.; Zhang, Y. Investigation into optimization condition of thermal stimulation for hydrate dissociation in the sandy reservoir. Appl. Energy 2015, 154, 995–1003. [Google Scholar] [CrossRef]
- Wu, P.; Li, Y.; Liu, W.; Liu, Y.; Wang, D.; Song, Y. Microstructure evolution of hydrate-bearing sands during thermal dissociation and ensued impacts on the mechanical and seepage characteristics. J. Geophys. Res. Solid Earth 2020, 125, e2019JB019103. [Google Scholar] [CrossRef]
- Sun, Y.-F.; Zhong, J.-R.; Li, W.-Z.; Ma, Y.-M.; Li, R.; Zhu, T.; Ren, L.-L.; Chen, G.-J.; Sun, C.-Y. Methane recovery from hydrate-bearing sediments by the combination of ethylene glycol injection and depressurization. Energy Fuels 2018, 32, 7585–7594. [Google Scholar] [CrossRef]
- Liang, M.; Gushchin, P.; Khlebnikov, V.; Antonov, S.; Mishin, A.; Khamidullina, I.; Likhacheva, N.; Semenov, A.; Vinokurov, V. Methane Recovery from Natural Gas Hydrate via CO 2/CH 4 Injection in the Presence of Methanol Aqueous Solution. Shiyou Huagong Gaodeng Xuexiao Xuebao 2018, 31, 61–66. [Google Scholar]
- Li, G.; Wu, D.; Li, X.; Zhang, Y.; Lv, Q.; Wang, Y. Experimental investigation into the production behavior of methane hydrate under methanol injection in quartz sand. Energy Fuels 2017, 31, 5411–5418. [Google Scholar] [CrossRef]
- Sun, Y.-F.; Wang, Y.-F.; Zhong, J.-R.; Li, W.-Z.; Li, R.; Cao, B.-J.; Kan, J.-Y.; Sun, C.-Y.; Chen, G.-J. Gas hydrate exploitation using CO2/H2 mixture gas by semi-continuous injection-production mode. Appl. Energy 2019, 240, 215–225. [Google Scholar] [CrossRef]
- Xie, Y.; Zhu, Y.-J.; Zheng, T.; Yuan, Q.; Sun, C.-Y.; Yang, L.-Y.; Chen, G.-J. Replacement in CH4-CO2 hydrate below freezing point based on abnormal self-preservation differences of CH4 hydrate. Chem. Eng. J. 2021, 403, 126283. [Google Scholar] [CrossRef]
- Veluswamy, H.P.; Kumar, A.; Seo, Y.; Lee, J.D.; Linga, P. A review of solidified natural gas (SNG) technology for gas storage via clathrate hydrates. Appl. Energy 2018, 216, 262–285. [Google Scholar] [CrossRef]
- Yan, L.; Chen, G.; Pang, W.; Liu, J. Experimental and modeling study on hydrate formation in wet activated carbon. J. Phys. Chem. B 2005, 109, 6025–6030. [Google Scholar] [CrossRef]
- Manakov, A.Y.; Stoporev, A. physical chemistry of gas hydrates and their technological application: State of the art. Russ. Chem. Rev. 2021, 90, 90. [Google Scholar] [CrossRef]
- Oignet, J.; Hoang, H.M.; Osswald, V.; Delahaye, A.; Fournaison, L.; Haberschill, P. Experimental study of convective heat transfer coefficients of CO2 hydrate slurries in a secondary refrigeration loop. Appl. Therm. Eng. 2017, 118, 630–637. [Google Scholar] [CrossRef]
- Misyura, S.Y.; Donskoy, I.G. Ways to improve the efficiency of carbon dioxide utilization and gas hydrate storage at low temperatures. J. CO2 Util. 2019, 34, 313–324. [Google Scholar] [CrossRef]
- Khlebnikov, V.; Antonov, S.; Mishin, A.; Liang, M.; Khamidullina, I.; Zobov, P. The main influence factors of gas hydrate formation in porous media. Nat. Gas Ind. 2017, 5, 38–45. [Google Scholar]
- Liu, H.; Zhan, S.; Guo, P.; Fan, S.; Zhang, S. Understanding the characteristic of methane hydrate equilibrium in materials and its potential application. Chem. Eng. J. 2018, 349, 775–781. [Google Scholar] [CrossRef]
- Li, X.-Y.; Wang, Y.; Li, X.-S.; Zhang, Y.; Chen, Z.-Y. Experimental study of methane hydrate dissociation in porous media with different thermal conductivities. Int. J. Heat Mass Transf. 2019, 144, 118528. [Google Scholar] [CrossRef]
- Bhattacharjee, G.; Kumar, A.; Sakpal, T.; Kumar, R. Carbon dioxide sequestration: Influence of porous media on hydrate formation kinetics. ACS Sustain. Chem. Eng. 2015, 3, 1205–1214. [Google Scholar] [CrossRef]
- Zhang, Y.; Li, X.; Wang, Y.; Chen, Z.; Li, G. Methane hydrate formation in marine sediment from South China Sea with different water saturations. Energies 2017, 10, 561. [Google Scholar] [CrossRef]
- Em, Y.; Stoporev, A.; Semenov, A.; Glotov, A.; Smirnova, E.; Villevald, G.; Vinokurov, V.; Manakov, A.; Lvov, Y. Methane Hydrate Formation in Halloysite Clay Nanotubes. ACS Sustain. Chem. Eng. 2020, 8, 7860–7868. [Google Scholar] [CrossRef]
- Sun, Y.; Jiang, S.; Li, S.; Wang, X.; Peng, S. Hydrate formation from clay bound water for CO2 storage. Chem. Eng. J. 2021, 406, 126872. [Google Scholar] [CrossRef]
- Linga, P.; Daraboina, N.; Ripmeester, J.A.; Englezos, P. Enhanced rate of gas hydrate formation in a fixed bed column filled with sand compared to a stirred vessel. Chem. Eng. Sci. 2012, 68, 617–623. [Google Scholar] [CrossRef]
- Dai, S.; Lee, J.Y.; Santamarina, J.C. Hydrate nucleation in quiescent and dynamic conditions. Fluid Phase Equilibria 2014, 378, 107–112. [Google Scholar] [CrossRef]
- Zhang, L.; Sun, M.; Sun, L.; Yu, T.; Song, Y.; Zhao, J.; Yang, L.; Dong, H. In-situ observation for natural gas hydrate in porous medium: Water performance and formation characteristic. Magn. Reson. Imaging 2020, 65, 166–174. [Google Scholar] [CrossRef]
- Benmesbah, F.D.; Ruffine, L.; Clain, P.; Osswald, V.; Fandino, O.; Fournaison, L.; Delahaye, A. Methane Hydrate Formation and Dissociation in Sand Media: Effect of Water Saturation, Gas Flowrate and Particle Size. Energies 2020, 13, 5200. [Google Scholar] [CrossRef]
- Sun, S.-C.; Liu, C.-L.; Ye, Y.-G.; Liu, Y.-F. Phase behavior of methane hydrate in silica sand. J. Chem. Thermodyn. 2014, 69, 118–124. [Google Scholar] [CrossRef]
- Bagherzadeh, S.A.; Moudrakovski, I.L.; Ripmeester, J.A.; Englezos, P. Magnetic Resonance Imaging of Gas Hydrate Formation in a Bed of Silica Sand Particles. Energy Fuels 2011, 25, 3083–3092. [Google Scholar] [CrossRef]
- Liu, C.; Lu, H.; Ye, Y.; Ripmeester, J.A.; Zhang, X. Raman spectroscopic observations on the structural characteristics and dissociation behavior of methane hydrate synthesized in silica sands with various sizes. Energy Fuels 2008, 22, 3986–3988. [Google Scholar] [CrossRef]
- Pan, Z.; Liu, Z.; Zhang, Z.; Shang, L.; Ma, S. Effect of silica sand size and saturation on methane hydrate formation in the presence of SDS. J. Nat. Gas Sci. Eng. 2018, 56, 266–280. [Google Scholar] [CrossRef]
- Chen, Q.; Liu, C.L.; Ye, Y.G. Differential Scanning Calorimetry Research of Hydrates Phase Equilibrium in Porous Media. Adv. Mater. Res. 2012, 512–515, 2122–2126. [Google Scholar] [CrossRef]
- Xie, Y.; Zheng, T.; Zhong, J.-R.; Zhu, Y.-J.; Wang, Y.-F.; Zhang, Y.; Li, R.; Yuan, Q.; Sun, C.-Y.; Chen, G.-J. Experimental research on self-preservation effect of methane hydrate in porous sediments. Appl. Energy 2020, 268, 115008. [Google Scholar] [CrossRef]
- Dalmazzone, C.; Dalmazzone, D.; Herzhaft, B. Differential scanning calorimetry: a new technique to characterize hydrate formation in drilling muds. In Proceedings of the SPE Annual Technical Conference and Exhibition, Dallas, TX, USA, 1–4 October 2000. [Google Scholar]
- Youssef, S.; Rosenberg, E.; Gland, N.F.; Kenter, J.A.; Skalinski, M.; Vizika, O. High resolution CT and pore-network models to assess petrophysical properties of homogeneous and heterogeneous carbonates. In Proceedings of the SPE/EAGE Reservoir Characterization and Simulation Conference, Abu Dhabi, UAE, 28–31 October 2007. [Google Scholar]
- Maeda, N. Interfacial Nanobubbles and the Memory Effect of Natural Gas Hydrates. J. Phys. Chem. C 2018, 122, 11399–11406. [Google Scholar] [CrossRef]
- Holzammer, C.; Schicks, J.M.; Will, S.; Braeuer, A.S. Influence of Sodium Chloride on the Formation and Dissociation Behavior of CO2 Gas Hydrates. J. Phys. Chem. B 2017, 121, 8330–8337. [Google Scholar] [CrossRef]
- Fukumoto, A.; Kamada, K.; Sato, T.; Oyama, H.; Torii, H.; Kiyono, F.; Nagao, J.; Temma, N.; Narita, H. Numerical simulation of pore-scale formation of methane hydrate in the sand sediment using the phase-field model. J. Nat. Gas Sci. Eng. 2018, 50, 269–281. [Google Scholar] [CrossRef]
- Stoporev, A.S.; Svarovskaya, L.I.; Strelets, L.A.; Altunina, L.K.; Villevald, G.V.; Karpova, T.D.; Rodionova, T.V.; Manakov, A.Y. Nucleation of methane hydrate and ice in emulsions of water in crude oils and decane under non-isothermal conditions. Chin. J. Chem. Eng. 2019, 27, 668–676. [Google Scholar] [CrossRef]
- Qin, J.; Kuhs, W.F. Quantitative analysis of gas hydrates using Raman spectroscopy. AIChE J. 2013, 59, 2155–2167. [Google Scholar] [CrossRef]


| Quartz Sand Fractions | Grain Size by Sieving (μm) | Grain Size by CT/Mean Size (μm) | Mean Pore Size by CT (μm) | Porosity (φ) |
|---|---|---|---|---|
| Small (S) | < 50 | 10–80/43.3 ± 0.5 | 41.5 ± 0.6 | 0.34 |
| Medium (M) | 125–160 | 50–250/162 ± 2 | 208 ± 2 | 0.46 |
| Original unsifted sand (O) | 30–800 | 100–600/460 ± 80 | 320 ± 10 | 0.41 |
| mw/ms | WS | Content of O Sand (Mass%) | ΔHice cryst (J/g) 1 | ΔHice melt (J/g) 1 | Thyd onset (°C) | ΔHhyd form (J/g) 1 | Teq (°C) | ΔHhyd dec (J/g) 1 |
|---|---|---|---|---|---|---|---|---|
| 1:1 | 3.74 | 50.0 | −299 ± 4 | 323 ± 3 | – | – | 11.0 | 16 ± 3 |
| 1:2 | 1.87 | 66.7 | −327 ± 4 | 333 ± 4 | −7.4 ± 0.1 | −2.3 ± 0.1 | 11.5 | 28 ± 3 |
| 1:4 | 0.94 | 80.0 | −317 ± 19 | 306 ± 7 | 0.5 ± 5 | −15.7 ± 0.1 | 12.0 | 68 ± 9 |
| 1:6 | 0.62 | 85.7 | −310 ± 7 | 312 ± 3 | −3 ± 2 | −19 ± 4 | 11.2 | 74 ± 5 |
| 1:8 | 0.47 | 88.9 | −320 ± 23 | 312 ± 3 | 2.3 ± 0.8 | −33 ± 2 | 11.8 | 121 ± 17 |
| 1:10 | 0.37 | 90.9 | −287 ± 41 | 255 ± 5 | −2 ± 2 | −54 ± 13 | 11.3 | 167 ± 2 |
| 1:15 | 0.25 | 93.8 | −329 ± 1 | 275 ± 4 | – | – | 11.8 | 192 ± 15 |
| 1:20 | 0.19 | 95.2 | −219 ± 26 | 206 ± 18 | 5 ± 6 | −99 ± 24 | 11.9 | 212 ± 9 |
| 1:50 | 0.07 | 98.0 | −151 ± 48 | 111 ± 10 | 4 ± 6 | −145 ± 25 | 11.9 | 296 ± 10 |
| 1:100 | 0.04 | 99.0 | −113 ± 30 | 66 ± 17 | 3 ± 5 | −177 ± 32 | 11.9 | 308 ± 14 |
| WS | Content of O Sand (Mass%) | ΔHice cryst (J/g) 1 | ΔHice melt (J/g) 1 | Thyd onset (°C) | ΔHhyd form (J/g) 1 | Teq (°C) | ΔHhyd dec (J/g) 1 |
|---|---|---|---|---|---|---|---|
| 3.74 | 50.0 | 325 ± 3 | 349 ± 3 | – | – | 12.3 | 7.8 ± 0.6 |
| 0.94 | 80.0 | 358 ± 3 2 | 310 ± 7 | −4.9 ± 0.2 | 358 ± 3 2 | 11.0 | 65 ± 11 |
| 0.37 | 90.9 | 408 ± 44 2 | 120 ± 43 | −4.6 ± 0.1 | 408 ± 44 2 | 11.4 | 407 ± 74 |
| 0.04 | 99.0 | – | 6 ± 6 | 0 ± 5 | 470 ± 32 | 10.8 | 449 ± 6 |
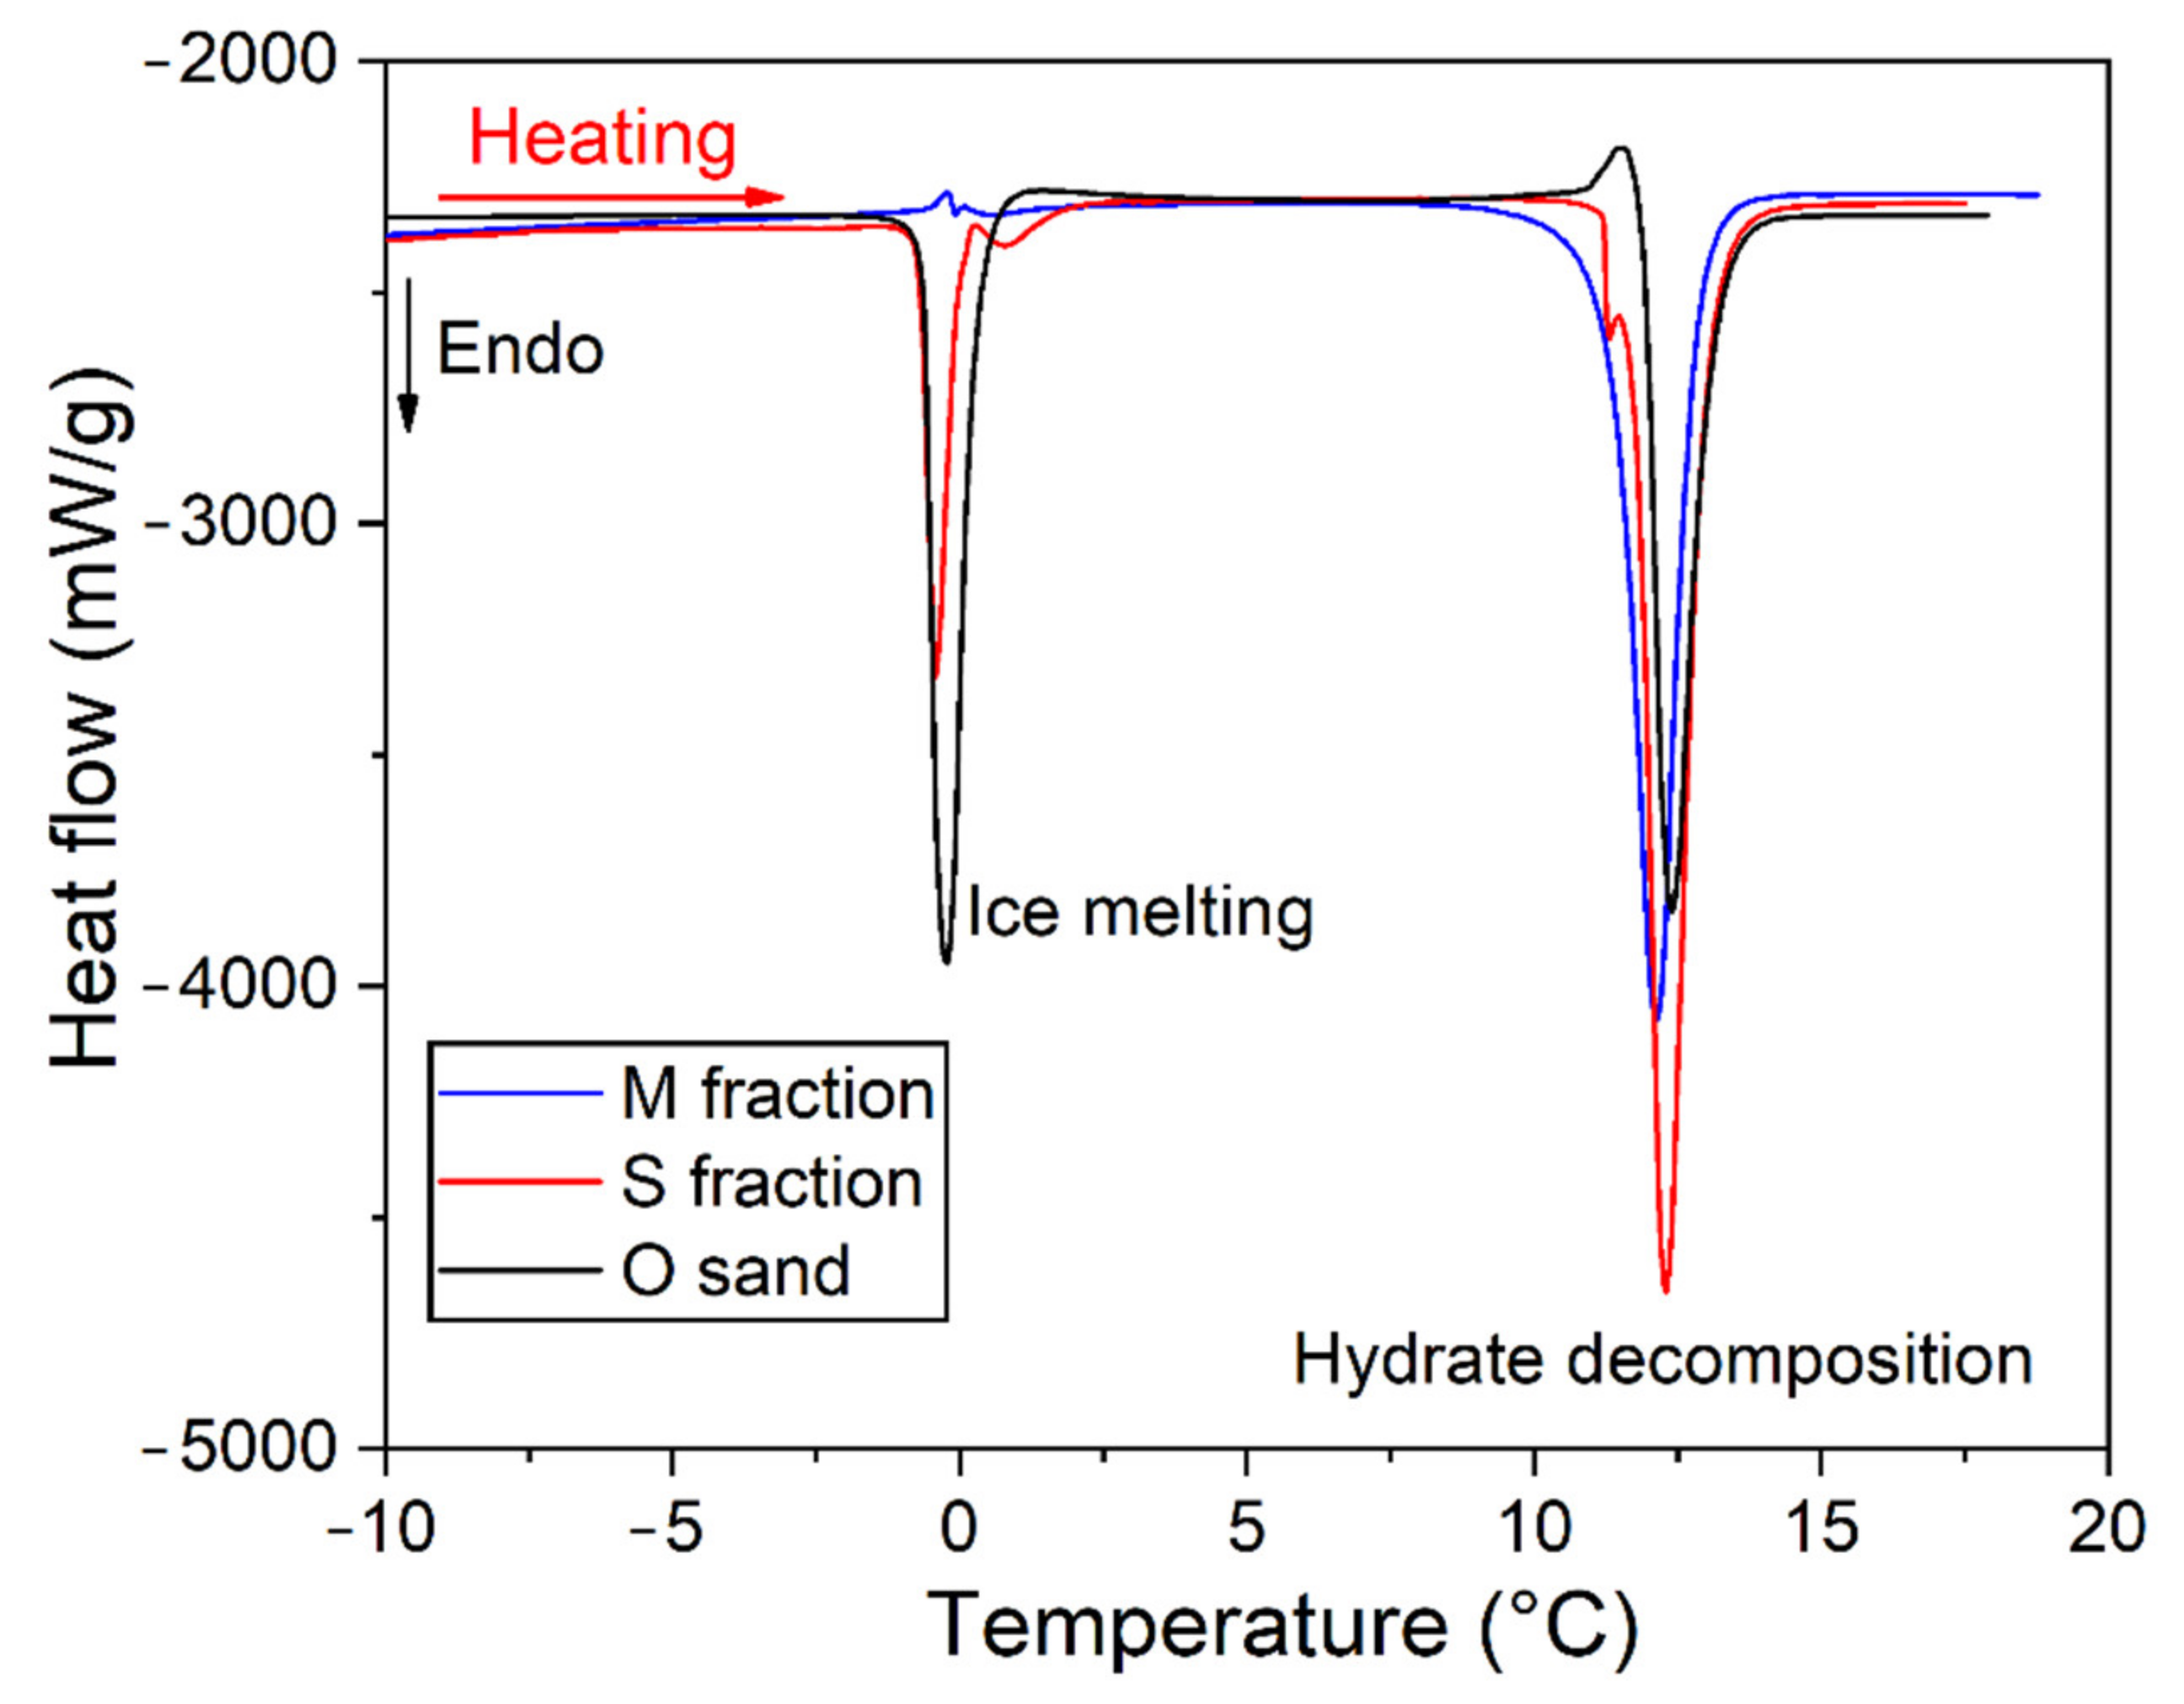
| Quartz Sand Fraction | WS | ΔHice cryst (J/g) 1 | ΔHice melt (J/g) 1 | Thyd onset (°C) | ΔHhyd form (J/g) 1 | Teq (°C) | ΔHhyd dec (J/g) 1 |
|---|---|---|---|---|---|---|---|
| S | 0.17 | −145 ± 52 | 148 ± 35 | 1 ± 5 | −318 ± 53 | 11.3 | 459 ± 13 |
| M | 0.10 | – | 5.0 ± 0.8 | 5 ± 7 | −445 ± 2 | 11.8 | 447 ± 4 |
| O | 0.12 | −320 ± 46 | 256 ± 11 | 0.3 2 | −95.5 2 | 11.9 | 296 ± 16 |
| S 3 | 0.04 | – | – | −6 ± 3 | −159 ± 23 | 10.6 | 138 ± 4 |
| S 4 | – | – | −7 ± 3 | −105 ± 4 | 11.0 | 105 ± 1 |
| Sand Type | mw/ms | WS | Water to Hydrate Conversion of (%) |
|---|---|---|---|
| Methane hydrate | |||
| O | 1:1 | 3.74 | 3 ± 1 |
| 1:2 | 1.87 | 6 ± 1 | |
| 1:4 | 0.94 | 14 ± 2 | |
| 1:6 | 0.62 | 15 ± 1 | |
| 1:8 | 0.47 | 24 ± 3 | |
| 1:10 | 0.37 | 33 ± 1 | |
| 1:15 | 0.25 | 38 ± 3 | |
| 1:20 | 0.19 | 42 ± 2 | |
| 1:50 | 0.07 | 59 ± 2 | |
| 1:100 | 0.04 | 61 ± 3 | |
| Methane hydrate; different sand fractions | |||
| O | 1:30 | 0.12 | 59 ± 3 |
| S | 0.17 | 92 ± 3 | |
| M | 0.10 | 89 ± 1 | |
| S | 1:136 | 0.04 | 28 ± 1 1 |
| 20.9 ± 0.2 2 | |||
| Methane-propane hydrate | |||
| O | 1:1 | 3.74 | 1.2 ± 0.1 |
| 1:4 | 0.94 | 10 ± 2 | |
| 1:10 | 0.37 | 64 ± 12 | |
| 1:100 | 0.04 | 70 ± 1 | |
Publisher’s Note: MDPI stays neutral with regard to jurisdictional claims in published maps and institutional affiliations. |
© 2021 by the authors. Licensee MDPI, Basel, Switzerland. This article is an open access article distributed under the terms and conditions of the Creative Commons Attribution (CC BY) license (http://creativecommons.org/licenses/by/4.0/).
Share and Cite
Zaripova, Y.; Yarkovoi, V.; Varfolomeev, M.; Kadyrov, R.; Stoporev, A. Influence of Water Saturation, Grain Size of Quartz Sand and Hydrate-Former on the Gas Hydrate Formation. Energies 2021, 14, 1272. https://doi.org/10.3390/en14051272
Zaripova Y, Yarkovoi V, Varfolomeev M, Kadyrov R, Stoporev A. Influence of Water Saturation, Grain Size of Quartz Sand and Hydrate-Former on the Gas Hydrate Formation. Energies. 2021; 14(5):1272. https://doi.org/10.3390/en14051272
Chicago/Turabian StyleZaripova, Yulia, Vladimir Yarkovoi, Mikhail Varfolomeev, Rail Kadyrov, and Andrey Stoporev. 2021. "Influence of Water Saturation, Grain Size of Quartz Sand and Hydrate-Former on the Gas Hydrate Formation" Energies 14, no. 5: 1272. https://doi.org/10.3390/en14051272
APA StyleZaripova, Y., Yarkovoi, V., Varfolomeev, M., Kadyrov, R., & Stoporev, A. (2021). Influence of Water Saturation, Grain Size of Quartz Sand and Hydrate-Former on the Gas Hydrate Formation. Energies, 14(5), 1272. https://doi.org/10.3390/en14051272