Abstract
Low-density polyethylene (LDPE) is an important thermoplastic material which can be made into films, containers, wires, cables, etc. It is highly valued in the fields of packaging, medicine, and health, as well as cables. The method of improving the dielectric property of materials by blending LDPE with inorganic particles as filler has been paid much attention by researchers. In this paper, low-density polyethylene is used as the matrix, and montmorillonite (MMT) particles and silica (SiO2) particles are selected as micro and nano fillers, respectively. In changing the order of adding two kinds of particles, a total of five composite materials were prepared. The crystallization behavior and crystallinity of five kinds of composites were observed, the εr and tanδ changes of each material were investigated with frequency and temperature, and the power frequency (50 Hz) AC breakdown performance of materials were measured. The differential scanning calorimetry (DSC) and X-ray diffraction (XRD) results show that the crystallinity of the composites is higher than that of LDPE. Experimental data of dielectric frequency spectra show that the dielectric constants of micro–nano composites and composites with added MMT particles are lower than LDPE, the dielectric loss of composites can be improved by adding MMT particles. The experimental data of dielectric temperature spectra show that the permittivity of SiO2-MMT/LDPE is still at a low level under the condition of 20~100 °C. In terms of breakdown field strength, the SiO2/LDPE composite material increased by about 17% compared with the matrix LDPE, and the breakdown field strength of the materials SiO2-MMT/LDPE and MMT-SiO2/LDPE increased by about 6.8% and 4.6%, respectively.
1. Introduction
Low-density polyethylene (LDPE) is diffusely employed in many fields, such as wire and cable industry and environmental engineering, because of its outstanding insulation, fine mechanical properties, process performance, and adsorption [1,2]. With the rapid economic development of all countries in the world, the cable industry is moving towards high voltage and ultra-high voltage. Therefore, it is very important to enhance the dielectric property of high-voltage insulation materials and d evelop higher-grade high-voltage insulation materials [3].
In the interest of meeting the increasing demand for science and technology progress and the development of society on the insulating electrical properties of polymers, researchers have tried to ameliorate the physicochemical properties of polymers by the method of adding inorganic nano-fillers. A great deal of research work shows that the mixing of nano-fillers and polymer materials could polish up the breakdown field strength [4,5,6], conductivity [7,8], electrical tree resistance, and partial discharge performances [9,10], as well as inhibit the accumulation of space charges [11,12]. Nevertheless, the result of the aggregation of nanoparticles in polymers has made achieving good dispersion difficult. Thereby, different researchers have different conclusions. Up to now, the improvement mechanism of added inorganic particles to matrix is still not very clear. For the sake of acquisition of maximized dispersion of nanoparticles in polymers, scholars make an attempt to blend micro- and nanoparticles with matrix materials. It is expected that the superior properties of composites will be obtained through the synergistic effect between micro- and nanoparticles. Research shows that the introduction of micron-particles and nanoparticles to matrix materials can not only avoid the agglomeration of nano-particles, but also improve the properties of the matrix materials [13,14,15]. At a certain proportion, the adding of the micron particle will highlight unique performances of the nanoparticle to a certain degree. This makes certain performances of micro–nano composites resemblant to nano-composites, and even superior to nano-composites. Ma et al. synthesized micro–nano Co3O4 ceramic materials by liquid phase and calcination method and studied its microstructure and dielectric properties, and found that micro–nano composite materials have more excellent dielectric properties [16]. Espinoza-Gonzalez et al. doped CaCu3Ti4O12 (CCTO) with ZrO and ZrO2 as micro–nano fillers, and found the micro–nano composite exhibited lower dielectric loss and a smaller dielectric constant [17]. Nazir et al. added micro and nano boron nitride (BN) particles to the matrix ethylene propylene diene monomer (EPDM) by melt blending method. It was found that the composite with 25 wt% micron particles and 5 wt% nanoparticles had good dielectric loss performance; the composite with 29 wt% micron particles and 1% nanoparticles showed low permittivity [18].
Adding nano-SiO2 particles into LDPE can increase the crystal nucleus density, reduce the spherulite size, and enhance the resistance to partial discharge [19]. Montmorillonite (MMT) is a layered silicate mineral with one-dimensional nano-structure. After being organically treated, MMT is introduced into LDPE by melt intercalation method. MMT can scatter and block electrons generated in the discharge process, thus improving the partial discharge resistance of LDPE [20]. In this paper, SiO2 was selected as inorganic nanoparticles, MMT as micron particles, LDPE as polymer matrix, with 1 wt% of added content, LDPE, MMT/LDPE, SiO2/LDPE, SiO2-MMT/LDPE, and MMT-SiO2/LDPE composite materials were prepared by melt blending method. The adding order of micro–nano particles in SiO2-MMT/LDPE and MMT-SiO2/LDPE was changed. SiO2-MMT/LDPE involved adding the SiO2 particle first and then the MMT particle, while MMT-SiO2/LDPE involved adding the MMT particle first and then the SiO2 particle. The effects of different composite systems and adding order of particles on the crystalline structure, dielectric properties, and AC breakdown properties of the composites were studied.
The research content of the article is a continuation of the research of reference [21]. The research results of the conduction current and space charge characteristics of SiO2/MMT/LDPE micro–nano composites are published in reference [21], which concluded that MMT-SiO2/LDPE composite materials can well hinder carrier migration and have a strong inhibitory effect on space charges, but many contents could not be perfected because the previous writing and publications are in the COVID-19 epidemic period. In this paper, the polarizing microscope (PLM) experiment and the differential scanning calorimetry (DSC) experiment were supplemented and analyzed, and X-ray diffraction (XRD) experimental results were combined to verify the crystallization behavior and crystallinity of each material. The characteristics of dielectric spectrum and dielectric temperature spectrum of each experimental material were analyzed, and the breakdown field strength characteristics of each composite material were studied. The research done in this paper is a great supplement to the previous research, which can make readers have a more comprehensive understanding of our research work, which has vital function in understanding the mechanism of improving properties of micro and nano composites.
2. Experimental Method
2.1. Surface Modification of SiO2
The nano silica (SiO2) and silane coupling agent (KH570) used to prepare the samples were both from Beijing Deke Daojin Science and Technology (Beijing, China), and the particle size of nano-SiO2 was 30 nm. SiO2 particles were treated with coupling agent KH570. Firstly, the SiO2 powder was dissolved with the mixed solution of anhydrous ethanol and deionized water, and stored in a three-neck boiling flask. Secondly, the ultrasonic wave was used to oscillate for 1 h, silane coupling agent KH570 was added, and heated in a constant temperature water bath. The temperature was set at 80 °C, stirring uniformly at high speed, and applying ultrasonic oscillation for 2 h again. Finally, after filtering, washing, drying, and grinding, the surface-modified SiO2 particles were obtained.
2.2. Organic Treatment of MMT
The montmorillonite (MMT) was purchased from Qinghe Chemical Plant in Zhangjiakou City of China. The particle size of the original MMT was about 40–70 µm, and the cation exchange capacity was 0.9–1.2 mol/kg. Firstly, MMT was mixed with weak acid solution in a certain proportion, and then heated in a water bath at 80 °C and stirred at high speed to obtain a uniform MMT suspension. Then, it was centrifuged and purified, and then intercalated with octadecyl trimethyl ammonium chloride solution. The mixture was placed in the water bath again. The temperature was set at 80 °C, and high-speed stirring and ultrasonic treatment were carried out to obtain the MMT with intercalation suspension. The suspension was allowed to stand, then washed with deionized water until no white precipitate appeared after being tested by AgNO3 solution. After a series of operations such as drying, grinding, and sieving, the intercalated solid MMT particles were obtained.
The MMT particles prepared above were used to prepare the MMT suspension with 95% ethanol solution as solvent in a ratio of 1 g:10 mL, and the solution was stirred at high speed and oscillated by ultrasonic for 3 h with the temperature of 70 °C. After that, the silane coupling agent KH570 was used to modify the surface. The specific operation steps are as follows: In acidic environment with pH value of 3~5, the coupling agent KH570 was pre-hydrolyzed with 95% ethanol aqueous solution. While stirring the MMT suspension, the hydrolyzed KH570 was slowly added into the suspension in three times. After the solution reaction is completed, it should be left to stand for a period of time through the separator funnel. Then, the MMT layer was taken out and dried in an oven under 80 °C for 24 h, and then ground and screened to obtain the organic MMT required in this paper.
2.3. Preparation of Composite Materials
Experimental fabrication of materials required for this article is reported in [21].
2.4. Crystallization Behavior
The five kinds of materials were soaked in the mixed solution of potassium permanganate and concentrated sulfuric acid with mass fraction of 5% for 5 h to etch the surface of the sample. After that, the samples were cleaned with ultrasonic cleaning apparatus. The microscopic morphology of each sample was detected by LeicaDM2500 polarizing microscope (PLM, Leica Microsystems, Wetzlar, Germany), and the magnification was 500 times.
A DSC-1 differential scanning calorimeter produced by Mettler Toledo company was utilized to measure the crystallization and fusion temperature of each material. The determination condition was nitrogen atmosphere, and the lifting and cooling rates were all 10 °C/min. The temperature selection range was 25~140 °C, and 10~15 mg was weighed for each sample.
The LDPE and composite materials were tested by X-ray diffraction (XRD) using EMPYREAN X-ray diffractometer (Panako, The Netherlands). Cu target was used in the experiment. The tube voltage was 40 kV, the tube current was 30 mA, the experimental scanning speed was 2°/min, the scanning range was 2θ = 5°~50°, and the X-ray wavelength was 0.154 nm.
2.5. Dielectric Frequency Spectra and Dielectric Temperature Spectra
At ambient temperature, the εr and tanδ of all samples were tested with frequency f by broadband dielectric/impedance spectrometer (Novocontrol Technologies, Montabaur, Germany), and the test frequency range was 10−1 Hz~106 Hz. For reducing the influence of moisture and residual charge on the test results, it is necessary to short-circuit each experimental material in advance.
The QS30I high-precision high-voltage capacitor bridge (Shanghai Peicheng Electronic Technology Development Co., Ltd., Shanghai, China) and high-low temperature alternating test box (Shanghai Guangpin Test Equipment Manufacturing Co., Ltd., Shanghai, China) were used to test the change of εr and tanδ with T by three electrode system. The temperature range was 20~100 °C, and the temperature gradient was 10 °C. The pretreatment method of the samples was consistent with the dielectric spectrum. During the time of test, electrodes and samples should be placed in a high and low temperature alternating test chamber and the temperature should be kept constant.
2.6. Breakdown Strength
According to the Chinese standard GB/T1408.1-2005, the power frequency AC breakdown performance of each sample was tested by plate–plate electrode, as shown in Figure 1. The diameter and height of the upper electrode were 20 mm and 25 mm, respectively. The diameter and height of the lower electrode were 60 mm and 10 mm, respectively. The edges of the electrodes were rounded and the radius was 2 mm. The sample thickness was 50 μm. In order to prevent residual charge from affecting the test results, it is necessary to short-circuit each sample to be tested before testing the breakdown field strength. In order to prevent the edge discharge of metal electrode, the sample with thickness of 50 μm and electrode should be immersed in cable oil. In the test, 50 Hz alternating current was used, and the voltage was slowly increased at a speed of 1 kV/s until composites were broken down, and the voltage was recorded. By the formula E = U/D, the corresponding power frequency AC breakdown field strength was calculated, where U is the voltage at the breakdown of the sample, D is the thickness of the sample, and E is the breakdown field strength of each sample.
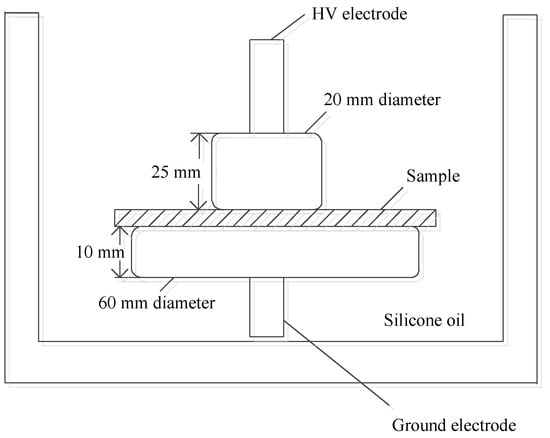
Figure 1.
Schematic diagram of breakdown experimental device.
3. Results and Discussion
3.1. Crystalline Morphology
Figure 2 shows the crystalline morphology of each material under PLM after being etched by concentrated sulfuric acid mixed with potassium permanganate. As both the previous writing and the ICHVE 2020 conference were held during the COVID-19 epidemic period, universities were closed, so the crystal cell size of each material was not marked in time [21,22]. Now, the epidemic situation in China is well controlled and universities have been opened. We went back to the laboratory and marked the crystal cell size of each composite material, and the statistical distribution of the crystal cell size of each material was calculated; the results are shown in Figure 3. From Figure 2, the crystal of all materials are spherical structures. It can be seen from Figure 3 the average and standard deviation of cell size of each sample. In Figure 2 and Figure 3, LDPE has the largest crystal cell size, and the crystal cell size varies, the diameter of crystal cell is about 9~19 μm, and the average size is 12.541 μm. After adding MMT into the matrix, the crystal cell size decreases, the average size is 6.849 m, and the crystal cell spacing decreases to some extent. The crystal cell size of composites with SiO2 particles is further reduced, with an average diameter of 6.345 μm, and the crystal cell size of SiO2/LDPE is uniform, but its crystal cell spacing is larger than that of micro–nano composites SiO2-MMT /LDPE and MMT-SiO2/LDPE. The crystal cell size and spacing of SiO2-MMT/LDPE material prepared by the method of adding SiO2 particle first and then MMT particle are further reduced. The diameter of the crystal cell is distributed around 4~8 μm, and the average diameter of the cell is 5.341 μm. The internal structure of the material is tight. The crystal size and spacing of MMT-SiO2/LDPE material prepared by the method of adding MMT particle first and then SiO2 particle becomes smaller than the former, and the crystal cell diameter is distributed around 3~7 μm with the average crystal cell diameter as 4.765 μm. The reason why the crystal cell size of MMT-SiO2/LDPE is smaller than that of SiO2-MMT/LDPE is that the small-sized particle is added first, which makes it easier for the small-sized particles to enter the machine body and play a heterogeneous nucleation role, thus reducing the unit cell size. However, a small-sized particle is added first, and then a large-sized particle is added, which will damage the structure formed by the small-sized particle added first, and weaken the heterogeneous nucleation effect, so the cell size is reduced.
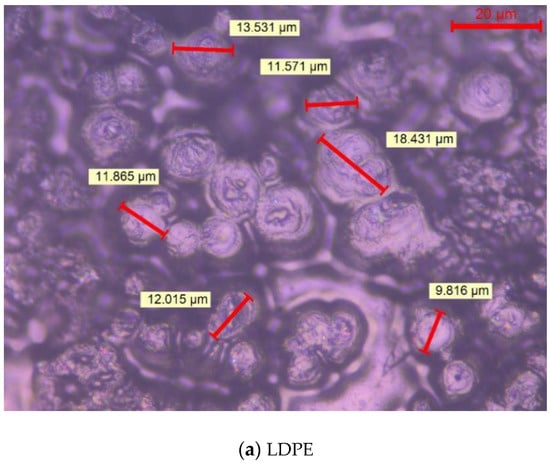
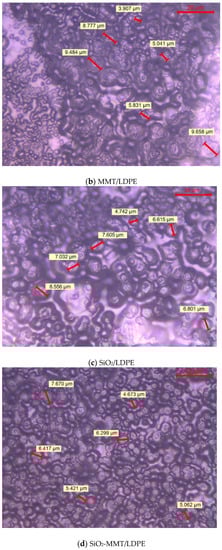
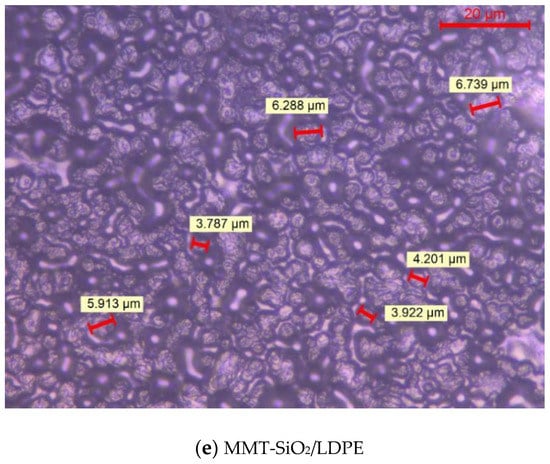
Figure 2.
The crystalline morphology of various samples.
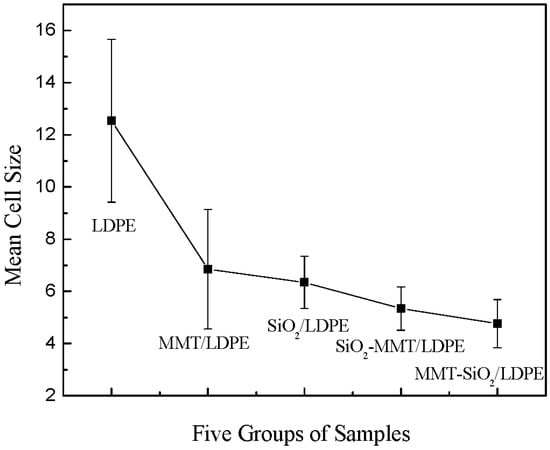
Figure 3.
Statistical distribution of crystal cell size of each sample.
3.2. Crystallinity of Composite Materials
This part of the experiment has been given some analysis in reference [22]. The experimental results and analysis of XRD, dielectric spectrum, dielectric temperature spectrum, and breakdown in this paper need to be combined with this part of the experiment. In order to make the analysis of this paper more comprehensive, further experimental analysis is given here again. Considering the particles do not contribute to the enthalpy of crystallization, we can obtain the crystallinity of five samples through the calculation of Equation (1) [23].
The fusion temperature and crystallinity results of all samples are listed in Table 1.
where and is the particles content in the composites.

Table 1.
Fusion peaks and crystallinity of samples.
According to Table 1, the order of fusion temperature is SiO2/LDPE > MMT/LDPE > SiO2-MMT/LDPE > MMT-SiO2/LDPE > LDPE. The order of crystallinity is SiO2/LDPE > MMT/LDPE > SiO2-MMT/LDPE > MMT-SiO2/LDPE > LDPE. The increase in the crystallinity of the sample is due to heterogeneous nucleation after doped particles. The heterogeneous nucleation of SiO2 with smaller particle size is obvious, and the crystallinity of SiO2/LDPE material has a larger increase. During the experiment, the addition order of micro- and nanoparticles was changed to research the crystallinity of micro–nano composite materials. According to the order of adding the SiO2 particle first and then the MMT particle, the crystallinity of SiO2-MMT/LDPE composites are weaker than that of the composites with only SiO2 particles. This is result of the large size of the MMT particles; the addition of MMT particles will squeeze the composite materials crystalline structure of samples, which will change the crystalline structure of the sample. Furthermore, the addition of MMT particles will cause expansion of the original crystal area, and the new structure may increase the hindrance to the movement of molecular chains. According to the order of adding the MMT particle first and then the SiO2 particle, the crystallinity of MMT-SiO2/LDPE composites are weaker than the SiO2-MMT/LDPE composites. This is because the size of the MMT particle is larger than the SiO2 particle. In the preparation of micro–nano composites, small particles added later are harder to squeeze into the matrix than large ones. Simultaneously, the composites filled with particles may add multiple heat conduction channels, which significantly improves the fusion temperature of the material. Experimental data shows that the smaller the particle size, the more significant the improvement of the fusion temperature. When SiO2-MMT/LDPE is compared with MMT-SiO2/LDPE composite materials, both of them are micro–nano composite materials with two kinds of particles, but the fusion temperature of the former is higher than that of the latter. The reason is that the large-sized MMT particle is added later in the former, and more heat conduction channels will be introduced in composite process than the latter, so that the fusion temperature of SiO2-MMT/LDPE composites is high. However, the particles added later will squeeze the original heat conduction channels, resulting in the fusion temperature of micro–nano composites not being as good as that of adding one particle alone.
3.3. XRD Analysis of Composite Materials
Figure 4 shows the X-ray diffraction curves of composite materials. From Figure 4, there are two obvious diffraction peaks in each composite, which are 21.35° and 23.65°. According to reference [24], these two diffraction peaks correspond to (110) and (200) crystal surfaces, respectively.
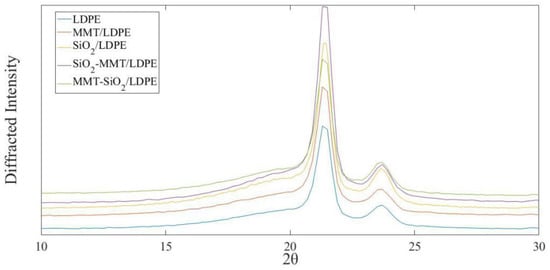
Figure 4.
XRD curves of each sample.
According to Equation (2), the average grain thickness of the composite with different crystal planes can be calculated [25].
where is the X-ray wavelength and the value is 0.154 nm; is half height and width of diffraction peak on diffraction crystal surface; is the broadening factor of the instrument; is the diffraction angle.
According to Equation (3), the crystallinity of each composite material after XRD test is calculated [26].
where , , and are diffraction peak integral area of (110) crystal plane, (200) crystal plane, and amorphous scattering diffraction peak integral area, respectively.
The XRD parameter calculation results of each sample are listed in Table 2.
Table 2.
XRD parameters of each sample.
In Table 2, the crystallinity order of composites is SiO2/LDPE > MMT/LDPE > SiO2-MMT/LDPE > MMT-SiO2/LDPE > LDPE, which is consistent with the DSC test results. From the average grain thickness of each composite, it can be seen that the average grain thickness both of SiO2/LDPE and SiO2-MMT/LDPE composites along the (110) and (200) crystal plane directions have little difference, which indicates that the crystal growth of the two composites is uniform. SiO2-MMT/LDPE composite is the thickest of the average grain thicknesses in terms of both the direction along the (100) crystal plane and the (200) crystal plane, indicating that the addition of large-size MMT particles broaden the crystallization area to a certain extent, and thus increases the average thickness of the grain, which confirms the analysis results of the DSC experiments above.
3.4. Dielectric Frequency Spectra of Composite Materials
Two major statements for the change of permittivity exist in composites with certain particles. First, the interaction between particles and composites matrix limits the moving of composite macromolecular chains and reduces the polarization of matrix [27,28]. Second, the interfacial polarization would occur in the interface between particles and composites matrix, which will make the value of permittivity rise [29]. Figure 5 and Figure 6 show the variation of εr and t tanδ with f of each sample. In Figure 5 and Figure 6, we can see that LDPE is a non-polar material, the polarization of electron displacement occurs primarily in its interior, and therefore εr is small. At the same time, it does not vary with the frequency. SiO2 particles were added into LDPE, and a number of interfaces will be formed. There will be interface polarization in materials, hence εr and tanδ of SiO2/LDPE are higher than LDPE. As the frequency increases, the electrical fields change gradually faster, and the relaxation polarization is too late to keep abreast of the electrical fields. In consequence, polarization establishment is incomplete, and εr has a downward trend. As stated in the PLM results, MMT/LDPE and MMT-SiO2/LDPE have compact structures. Simultaneously, on account of the especially stratified structure of MMT, segment activity and polarization establishment of composite materials are not easy. As a consequence, the value of their dielectric constant is small. The structure of SiO2-MMT/LDPE restricts severely the movement of macromolecular chains, and as a result, the εr and tanδ values of SiO2-MMT/LDPE are at low levels in five materials.
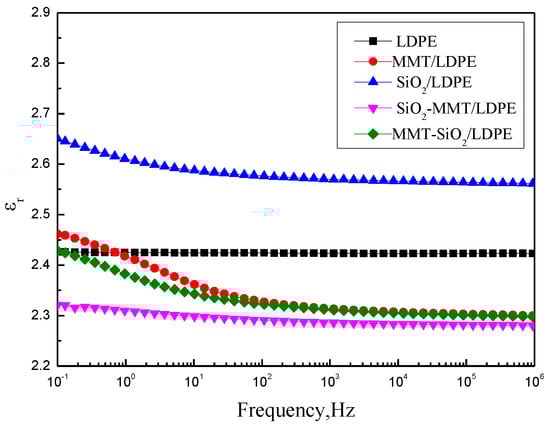
Figure 5.
Curves of εr with respect to f.
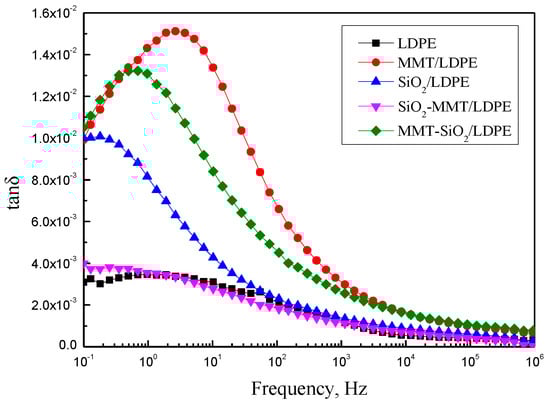
Figure 6.
Curves of tanδ with respect to f.
3.5. Dielectric Temperature Spectra of Composite Materials
Figure 7 and Figure 8 show the changes of εr and tanδ with T of the five samples, and the test frequency is 50 Hz. It is observed that the dielectric constant of composites reduces with the increment of temperature. This is because of the intensification of molecular thermal motion, which results in directional polarization difficulty. When a micro–nano particle is introduced into the matrix, interface areas will appear, hindering the thermal motion of molecular chains under high temperature, and therefore dielectric constant and loss of composites will raise. Nevertheless, SiO2-MMT/LDPE could ruin the original interface areas with adding of small-size fillers first, and then large-size fillers. As a result, interfacial regions have less obstruction to molecular chains’ thermal movement under high temperature, and dielectric constant of composites decline accordingly. As the increment of temperature, the loss is chiefly decided by the conductance loss, and tanδ increases along with temperature. Since the main components in MMT are SiO2, Al2O3, and H2O, after introducing MMT particles into composites, lots of interfaces formation. Relaxation polarization has a great influence under low temperature and relaxation loss is large. Therefore, the loss of composites with MMT increases first, and then decreases with the temperature rises.
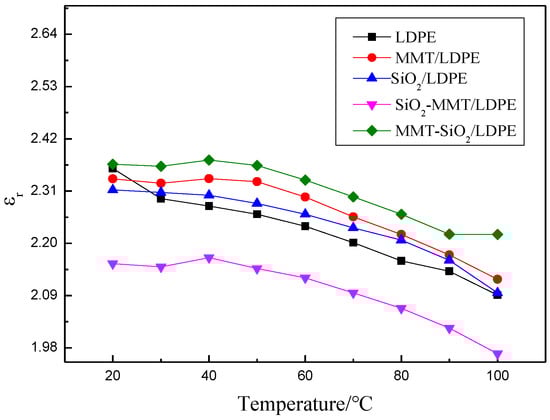
Figure 7.
Curves of εr with respect to T.
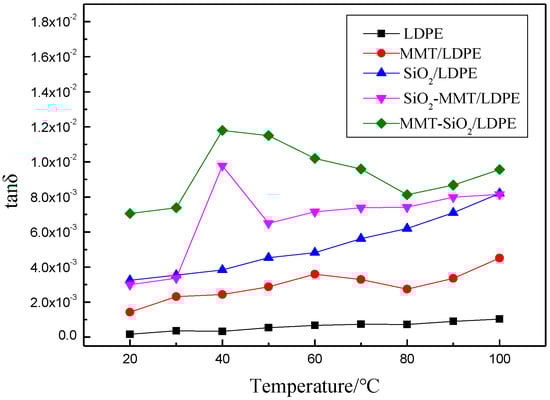
Figure 8.
Curves of tanδ with respect to T.
3.6. Breakdown Field Strength
The breakdown test data of each composite material are processed by two-parameter Weibull distribution [30,31]. The relationship between the cumulative breakdown probability and the breakdown electric field intensity is:
In Equation (4), is the standard breakdown field strength when the cumulative breakdown probability is 63.2%; is the shape parameter, which characterizes the dispersion of breakdown data.
The Weibull distribution analysis of breakdown field strength data of each sample measured by the experimental device in Figure 1 was analyzed by MINITAB software; 15 samples were measured for each material, and the results are shown in Figure 9.
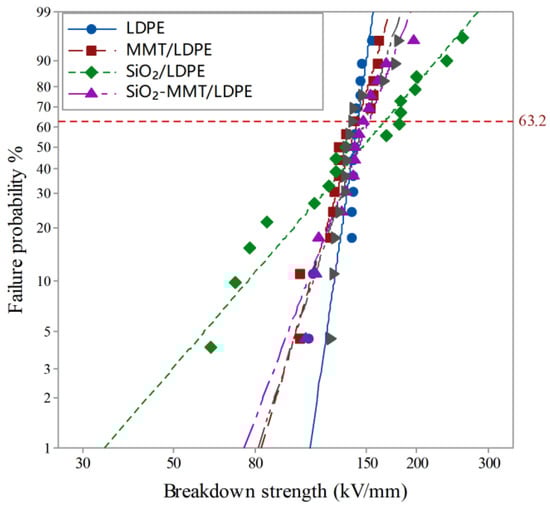
Figure 9.
Weibull curve of breakdown field strength of each sample.
The logarithm of both sides of Equation (4) are taken at the same time, and then simplified to get:
The breakdown field strength can be calculated by Equation (5). The characteristic breakdown field strength values of each sample are shown in Table 3.
Table 3.
Characteristic breakdown field strength of each sample.
represents the degree of data dispersion. The smaller the value, the more dispersed the data. From Table 3, it can be seen that the values of each material are greater than 1. At present, regarding the mechanism by which inorganic particles improve the breakdown strength of polymer insulating dielectrics, scholars at home and abroad have basically reached a certain consensus. Lewis et al. proposed that the interface is the main factor determining the electrical properties of nano-dielectrics, and an interface charged layer will form between particles and polyethylene matrix; the interface effect will improve the dielectric properties of the dielectric [32].
From the PLM experiment and dielectric spectrum analysis, it serves to show that the addition of micron MMT particle will impede the movement of molecular chains and inhibit the migration of carriers, which will weaken the collision of electrons on the macromolecular chains to a certain extent, and lead to the improvement of the breakdown performance of MMT/LDPE composite materials. However, due to the weak interface between micron particles and matrix, the breakdown performance is not significantly improved.
The addition of nano-SiO2 particles will form an independent interface domain in the polyethylene matrix, which will affect the space charge transport and improve the breakdown field strength. By mixing and ultrasonic treatment of the twin-screw extruder, nano-SiO2 particles can obtain better uniform dispersion [33,34], which are easy to form more interface domains. In the previous study [21], it was proved that the addition of SiO2 particles will introduce deep traps into the matrix LDPE. Under the action of the electric field, the charge cannot be trapped and is limited on the surface of dielectric materials. Moreover, the structure formed by SiO2/LDPE composite materials has a certain blocking effect on carrier migration, thereby reducing the energy accumulation of electrons and weakening its impact on macromolecular chains, thus improving the impact breakdown field strength by about 17% [35].
For SiO2-MMT/LDPE and MMT-SiO2/LDPE, due to the introduction of two kinds of particles, a great many interfaces are introduced into the matrix, so the breakdown field strength is increased by about 6.8% and 4.6%, respectively. However, due to the introduction of micron particles that will form part of the weak interface with the matrix, the breakdown field strength of them is lower than SiO2/LDPE. When MMT-SiO2/LDPE is compared with SiO2-MMT/LDPE, according to the PLM experimental results, the MMT-SiO2/LDPE composite materials formed by adding large-sized MMT particle first and then small-sized SiO2 particle have a compact crystal structure, and the crystallinity is small from the crystallinity results of DSC and XRD. This will increase the free volume of the materials, increase the chance of electron collisions, and decrease the breakdown field strength. At the same time, according to DSC experiment and analysis, the heat dissipation of MMT-SiO2/LDPE composite materials is worse than that of SiO2-MMT/LDPE, so MMT-SiO2/LDPE easily accumulates heat inside the materials, which improves the probability of thermal breakdown of the materials. Therefore, the breakdown field strength of MMT-SiO2/LDPE is about 2% lower than that of SiO2-MMT/LDPE.
4. Conclusions
From PLM experiment, DSC experiment, and XRD experiment results, it can be seen that the introduction of micro- and nanoparticles together will make the internal structure of the materials more compact than the matrix. The adding method of first small and then large can more effectively limit the molecular chains activity than the composite materials prepared by adding large first and then small. The addition of a variety of particles will destroy the original crystal structure, which makes the crystallinity of materials added with varieties of particles slightly lower than materials added with a single particle. The addition method of first small and then large will expand the crystallization region of the composites, and the crystallinity is higher than that of the composite materials prepared by first large and then small addition method.
From the experimental results of dielectric spectrum, it can be seen that the addition of micro- and nanoparticles will make the materials structure more compact, resulting in serious restriction of molecular chain motion, difficulty in establishing partial polarization, and a decrease in the dielectric constant and loss to a certain extent. Among them, the effect of adding small particles first and then large particles is better.
From the experimental results of dielectric temperature spectrum, it can be seen that with the change of temperature, the original interface area may be destroyed by the addition method of first small and then large, and the interface area is not bound enough to the thermal motion of molecules, so the dielectric constant will decrease.
From the experimental results of AC breakdown field strength, it can be seen that the interface effect is the main factor affecting the breakdown performance of composite materials. By adding nano-SiO2 particles alone in LDPE, the breakdown field strength is greatly increased by about 17%. Adding micro- and nanoparticles into LDPE at the same time will introduce a large number of interfaces into the matrix, which will also improve the breakdown field strength of micro–nano composite materials. The lifting amplitude of SiO2-MMT/LDPE composite materials is about 6.8%, and that of MMT-SiO2/LDPE composite materials is about 4.6%.
Author Contributions
H.J.: conceptualization, methodology, software, and writing—original draft. X.Z.: funding acquisition, reviewing, resources, validation, supervision, and editing. J.G.: data curation, visualization, and investigation. N.G.: reviewing, formal analysis, and editing. All authors have read and agreed to the published version of the manuscript.
Funding
This research was funded by the National Natural Science Foundation of China, grant number 51577045.
Acknowledgments
We acknowledge the financial support from the National Natural Science Foundation of China (51577045).
Conflicts of Interest
The authors declare no conflict of interest.
References
- Du, B.X.; Han, C.L.; Li, J. Research Status of Polyethylene Insulation for High Voltage Direct Current Cables. Trans. China Electrotech. Soc. 2019, 34, 180–191. [Google Scholar]
- Lei, P.; Zhu, J.J.; Pan, K.; Zhang, H. Sorption kinetics of parent and substituted PAHs for low-density polyethylene (LDPE): Determining their partition coefficients between LDPE and water (KLDPE) for passive sampling. J. Environ. Sci. 2020, 87, 351–362. [Google Scholar] [CrossRef]
- Zhen, Z.H.; Li, M.L.; Liu, Z.; Ma, C.X. Discussion on the way to improve the operation reliability of cables and cable accessories. China Sci. Technol. Expo. 2011, 30, 453. [Google Scholar]
- He, L.J.; Zeng, J.J.; Huang, Y.W.; Yang, X.; Li, D.W.; Chen, Y.; Yang, X.Y.; Wang, D.B.; Zhang, Y.X.; Fu, Z.D. Enhanced Thermal Conductivity and Dielectric Properties of h-BN/LDPE Composite. Materials 2020, 21, 4738. [Google Scholar] [CrossRef]
- Tian, F.; Lei, Q.; Wang, X.; Wang, Y. Investigation of electrical properties of LDPE/ZnO nanocomposite dielectrics. IEEE Trans. Dielectr. Electr. Insul. 2012, 19, 763–769. [Google Scholar] [CrossRef]
- Le, H.; Schadler, L.S.; Nelson, J.K. The influence of moisture on the electrical properties of crosslinked polyethylene/silica nanocomposites. IEEE Trans. Dielectr. Electr. Insul. 2013, 20, 50–53. [Google Scholar] [CrossRef]
- Cheng, Y.J.; Yu, G.; Yu, B.Y.; Zhang, X.H. The Research of Conductivity and Dielectric Properties of ZnO/LDPE Composites with Different Particles Size. Materials 2020, 18, 4136. [Google Scholar] [CrossRef]
- Mi, R.; Xing, Z.L.; Hao, J.H.; Hu, X.N.; Min, D.M.; Li, S.T.; Wu, Q.Z. Effect of morphology and traps on DC conductivity and breakdown of polyethylene nanocomposites. IEEE Trans. Dielectr. Electr. Insul. 2020, 27, 489–497. [Google Scholar] [CrossRef]
- Fleming, R.J.; Ammala, A.; Casey, P.S. Conduction and space charge in LDPE/TiO2 nanocomposites. IEEE Trans. Dielectr. Electr. Insul. 2010, 18, 15–23. [Google Scholar] [CrossRef]
- Ai, Y.; Li, C.Y.; Zhao, H.; Yang, J.M.; Zhang, C.C.; Han, B.Z. Effects of nano SiO2 on AC/DC breakdown strength and electrical treeing resistance of cross-linked polyethylene. J. Compos. 2019, 36, 2031–2041. [Google Scholar]
- Fan, Y.H.; Song, W.; Li, L.; Hua, Y.; Yang, J.M.; Sun, Z.; Han, B. Space charge characteristics of micron- and nano-BiFeO3/LDPE composites under a magnetic field. J. Mater. Sci. Mater. Electron. 2020, 32, 1–13. [Google Scholar]
- Castellon, J.; Banet, L.; Preda, I.; Agnel, S.; Toureille, A.; Fréchette, M.; David, E.; Sami, A. Space charge measurements on polymer nanocomposite HDPE/SiO2 materials. In Proceedings of the 2010 Annual Report Conference on Electrical Insulation and Dielectic Phenomena, West Lafayette, IN, USA, 17–20 October 2010; pp. 1–4. [Google Scholar]
- Fabiani, D.; Montanari, G.C.; Krivda, A. Epoxy based materials containing micro and nano sized fillers for improved electrical characteristics. In Proceedings of the 2010 10th IEEE International Conference on Solid Dielectrics, Potsdam, Germany, 4–9 July 2010; pp. 1–4. [Google Scholar]
- Li, Z.; Okamoto, K.; Ohki, Y.; Tanaka, T. Effects of nano-filler addition on partial dis-charge resistance and dielectric breakdown strength of micro-Al2O3/epoxy composite. IEEE Trans. Dielectr. Electr. Insul. 2010, 17, 653–661. [Google Scholar] [CrossRef]
- Li, Z.; Okamoto, K.; Ohki, Y. The role of nano and micro particles on partial discharge and breakdown strength in epoxy composites. IEEE Trans. Dielectr. Electr. Insul. 2011, 18, 675–681. [Google Scholar] [CrossRef]
- Ma, M.X.; Wei, L.; Zhang, S.L.; Lu, Y.H. Synthesis and Dielectric Properties of Micro-nanostructure Co3O4 Ceramics. J. Ceram. 2019, 40, 101–105. [Google Scholar]
- Rodrigo, E.G.; Mosquera, E. Influence of micro- and nanoparticles of zirconium oxides on the dielectric properties of CaCu3Ti4O12. Ceram. Int. 2017, 43, 14659–14665. [Google Scholar]
- Nazir, M.T.; Phung, B.T.; Zhang, Y.Y.; Li, S.T. Dielectric and thermal properties of micro/nano boron nitride co-filled EPDM composites for high-voltage insulation. Micro Nano Lett. 2019, 40, 150–153. [Google Scholar] [CrossRef]
- Sridhar, A.; Thomas, M.J. Electrical treeing in polyethylene: Effect of nano fillers on tree inception and growth. In Proceedings of the 2010 International Conference on High Voltage Engineering and Application, New Orleans, LA, USA,, 11–14 October 2010. [Google Scholar]
- Zhang, X.H.; GAO, J.G.; Zhang, J.M.; Liu, J.Y.; Ji, Q.Q. Characteristics of microstructure and electrical treeing in PE/MMT nanocomposites. Trans. China Electrotech. Soc. 2009, 24, 1–5. [Google Scholar]
- Jiang, H.T.; Zhang, X.H.; Gao, J.G.; Guo, N. Conductance Current and Space Charge Characteristics of SiO2/MMT/LDPE Micro-Nano Composites. Materials 2020, 13, 4119. [Google Scholar] [CrossRef]
- Jiang, H.T.; Zhang, X.H.; Gao, J.G.; Guo, N. Dielectric Properties of SiO2/MMT/LDPE Micro-nano Composites. In Proceedings of the 2020 IEEE International Conference on High Voltage Engineering, Beijing, China, 6–10 September 2020. [Google Scholar]
- Kuang, X.W.; Gao, Q.; Zhu, H. Effect of calcination temperature of TiO2 on the crystallinity and the permittivity of PVDF-TrFE/TiO2 composites. J. Appl. Polym. Sci. 2013, 129, 296–300. [Google Scholar] [CrossRef]
- Panaitescu, D.; Ciuprina, F.; Iorga, M.; Frone, A.; Radovici, C.; Ghiurea, M.; Sever, S.; Plesa, I. Effects of SiO2 and Al2O3 Nanofillers on Polyethylene Properties. J. Appl. Polym. Sci. 2011, 122, 1921–1935. [Google Scholar] [CrossRef]
- Guo, J.L.; Shen, Y.N. Several problems that should be paid attention to in calculating grain size by Scherrer formula. J. Inner Mong. Normal Univ. (Nat. Sci. Ed.) 2009, 38, 357–358. [Google Scholar]
- Mo, Z.S.; Zhang, H.F. measurement of crystallinity OF Polymers by X-ray diffraction method. Poltmeric Mater. Sci. Eng. 1993, 3, 9–20. [Google Scholar]
- Tanaka, T. Dielectric nanocomposites with insulating properties. IEEE Trans. Dielectr. Electr. Insul. 2005, 12, 914–928. [Google Scholar] [CrossRef]
- Singha, S.; Thomas, M.J. Influence of filler loading on dielectric properties of epoxy-ZnO nanocomposites. IEEE Trans. Dielectr. Electr. Insul. 2009, 16, 531–542. [Google Scholar] [CrossRef]
- Zhang, L.; Zhou, Y.X.; Huang, M.; Sha, Y.C.; Tian, J.H.; Ye, Q. Effect of nanoparticle surface modification on charge transport characteristics in XLPE/SiO2 nanocomposites. IEEE Trans. Dielectr. Electr. Insul. 2014, 21, 424–433. [Google Scholar] [CrossRef]
- Chauvet, C.; Laurent, C. Weibull statistics in short-term dielectric breakdown of thin polyethylene films. IEEE Trans. Electr. Insul. 1993, 28, 18–29. [Google Scholar] [CrossRef]
- Liao, R.J.; Liu, H.B.; Bai, G.; Hao, J.; Li, X.; Lin, Y.D. Space Charge Characteristics and Dielectric Properties of Nano-SiO2/Aramid Paper Composite. Trans. China Electrotech. Soc. 2016, 31, 40–48. [Google Scholar]
- Lewis, T.J. Interfaces are the dominant feature of dielectrics at the nanometric level. IEEE Trans. Dielectr. Electr. Insul. 2004, 11, 739–753. [Google Scholar] [CrossRef]
- Yang, J.M.; Zhao, H.; Zheng, C.J.; Wang, X.; Yang, C.C. Effects of nano-particles dispersion on the DC dielectric properties of SiO2/LDPE nanocomposite and its effect on direct current conduction properties. Proc. CSEE 2015, 35, 5087–5094. [Google Scholar]
- Chen, Z.Z.; Wang, J.c.; Ma, Q.Y.; Wang, Y.; Wang, M.Z. Influence of Nano-SiO2 Ultrasonic Dispersion Conditions on the Properties of Composite Films. Packag. Eng. 2020, 85–90. [Google Scholar]
- Tanaka, T.; Kozako, M.; Fuse, N.; Ohki, Y. Proposal of a multi-core model for polymer nanocomposite dielectrics. IEEE Trans. Dielectr. Electr. Insul. 2005, 12, 669–681. [Google Scholar] [CrossRef]
Publisher’s Note: MDPI stays neutral with regard to jurisdictional claims in published maps and institutional affiliations. |
© 2021 by the authors. Licensee MDPI, Basel, Switzerland. This article is an open access article distributed under the terms and conditions of the Creative Commons Attribution (CC BY) license (http://creativecommons.org/licenses/by/4.0/).