
The Role of National Energy Policies and Life Cycle Emissions of PV Systems in Reducing Global Net Emissions of Greenhouse Gases


Abstract
1. Introduction
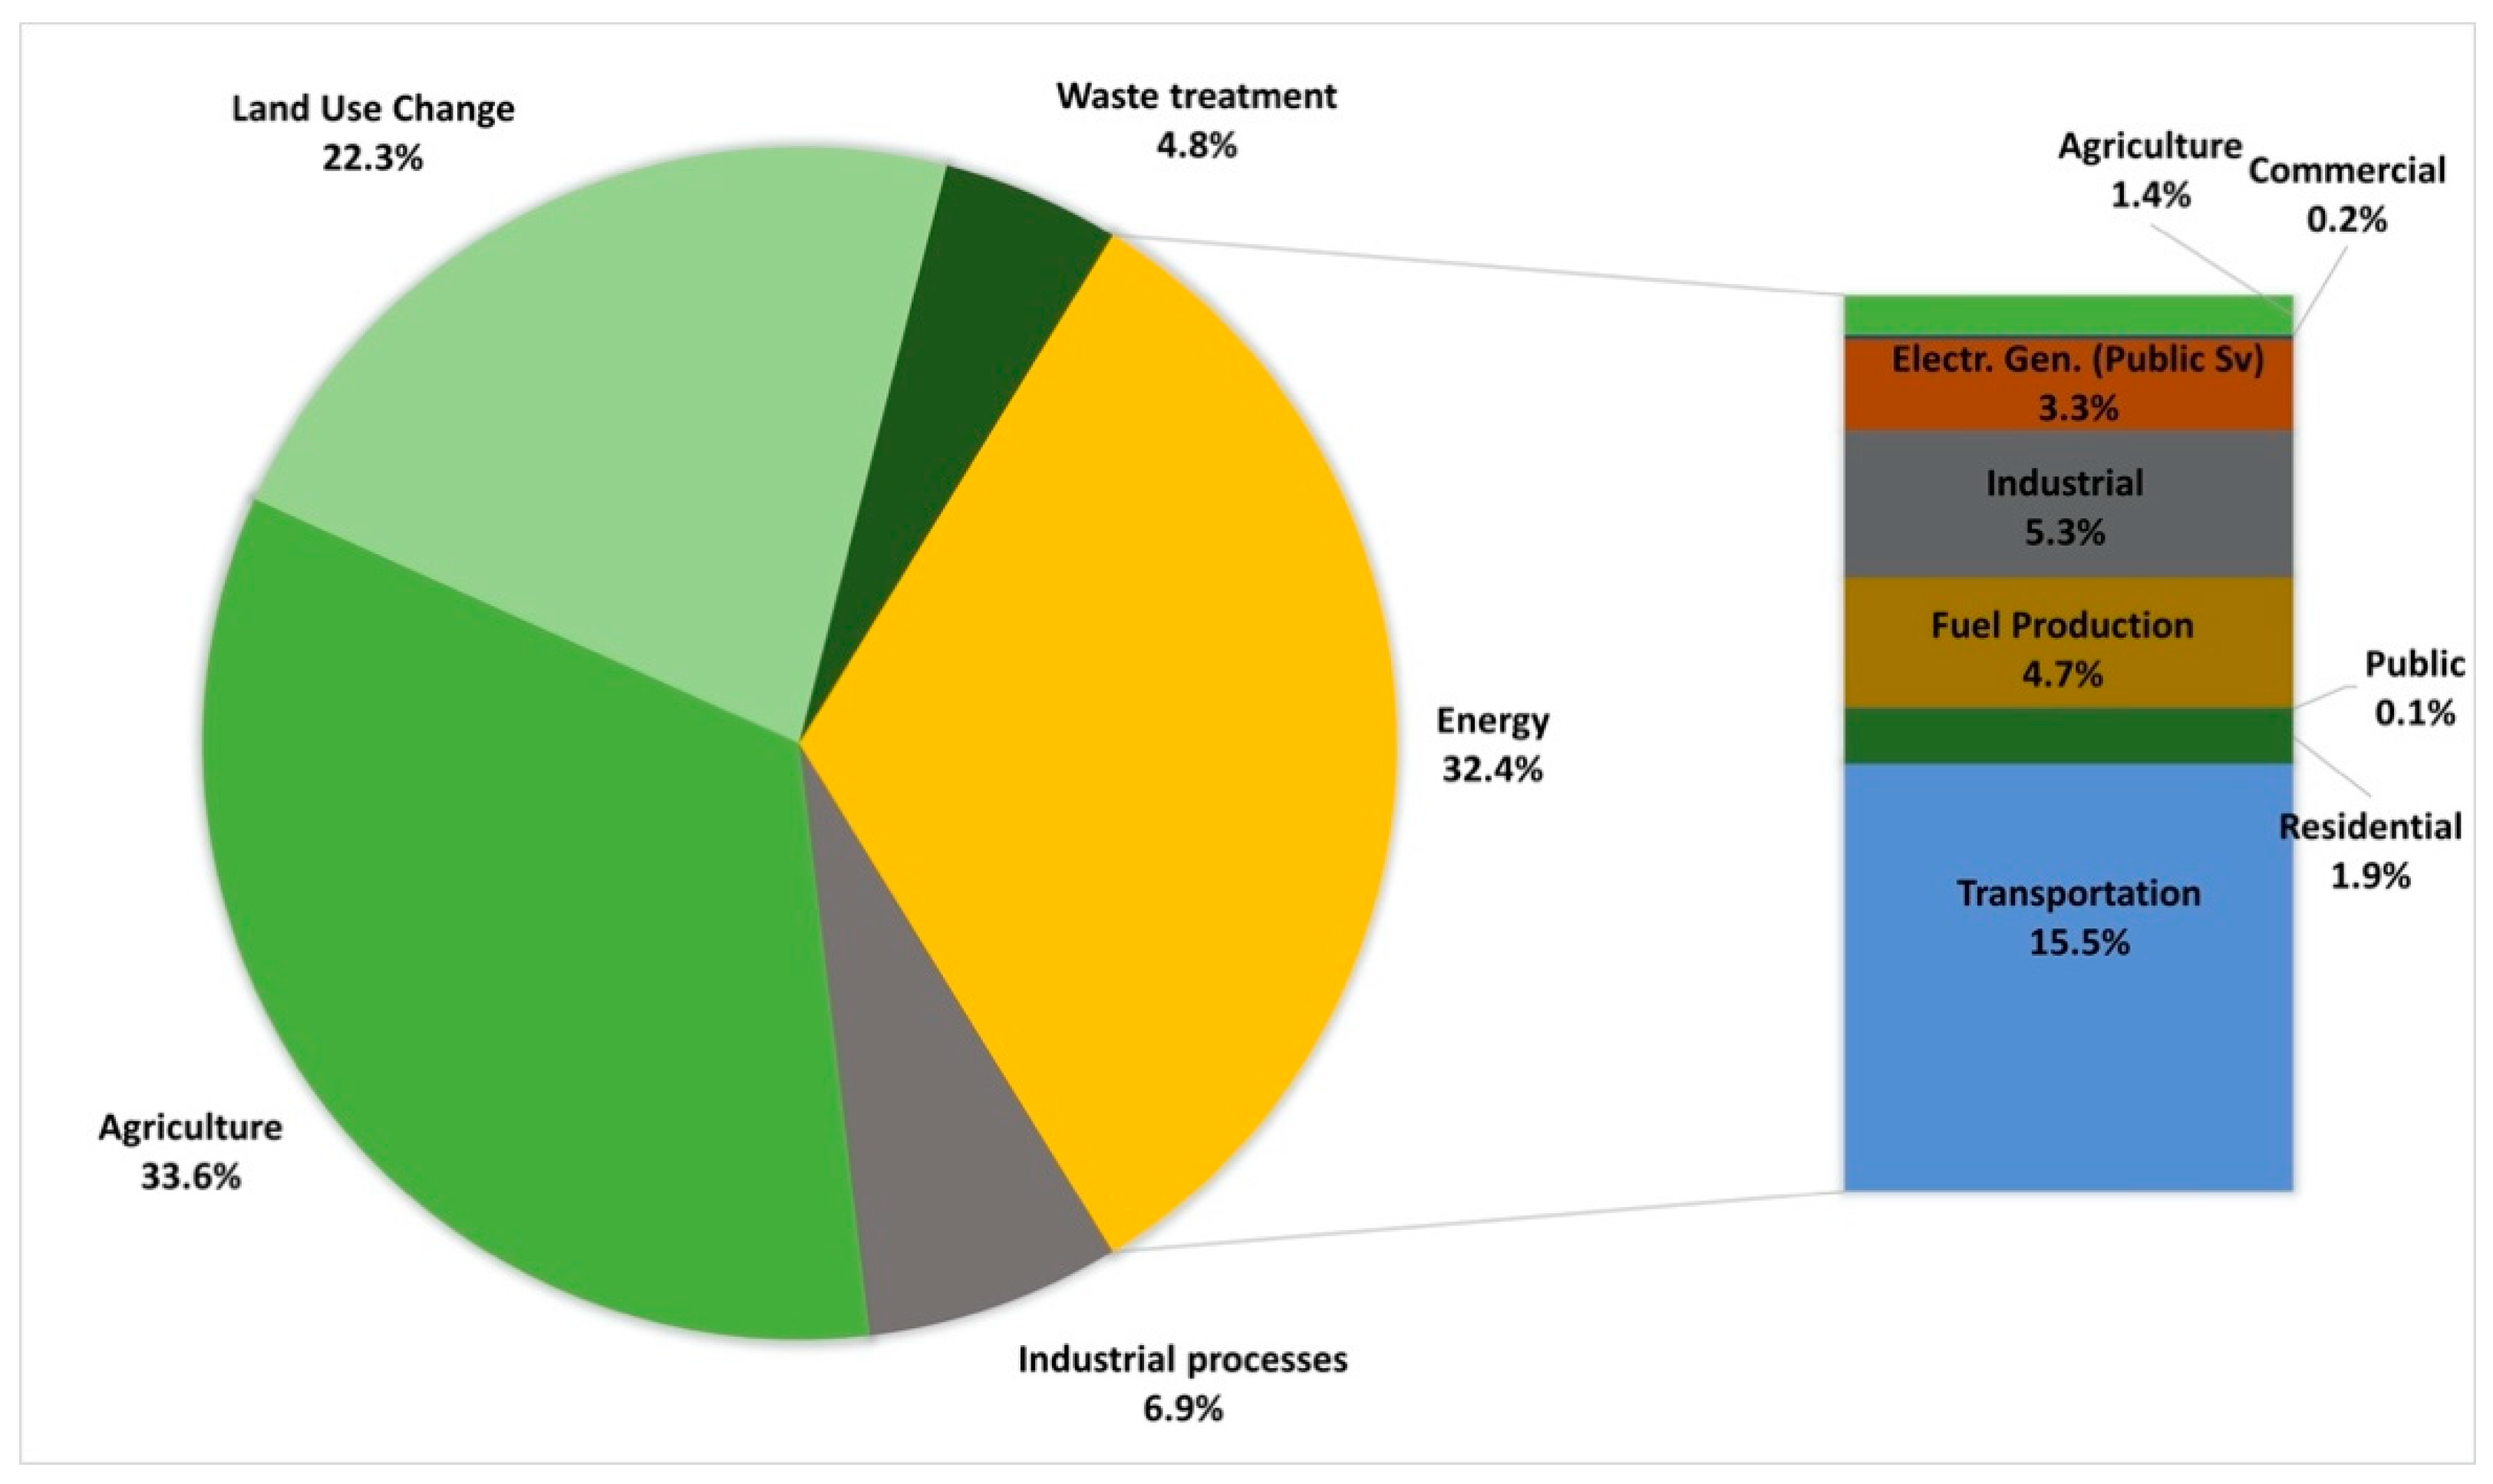
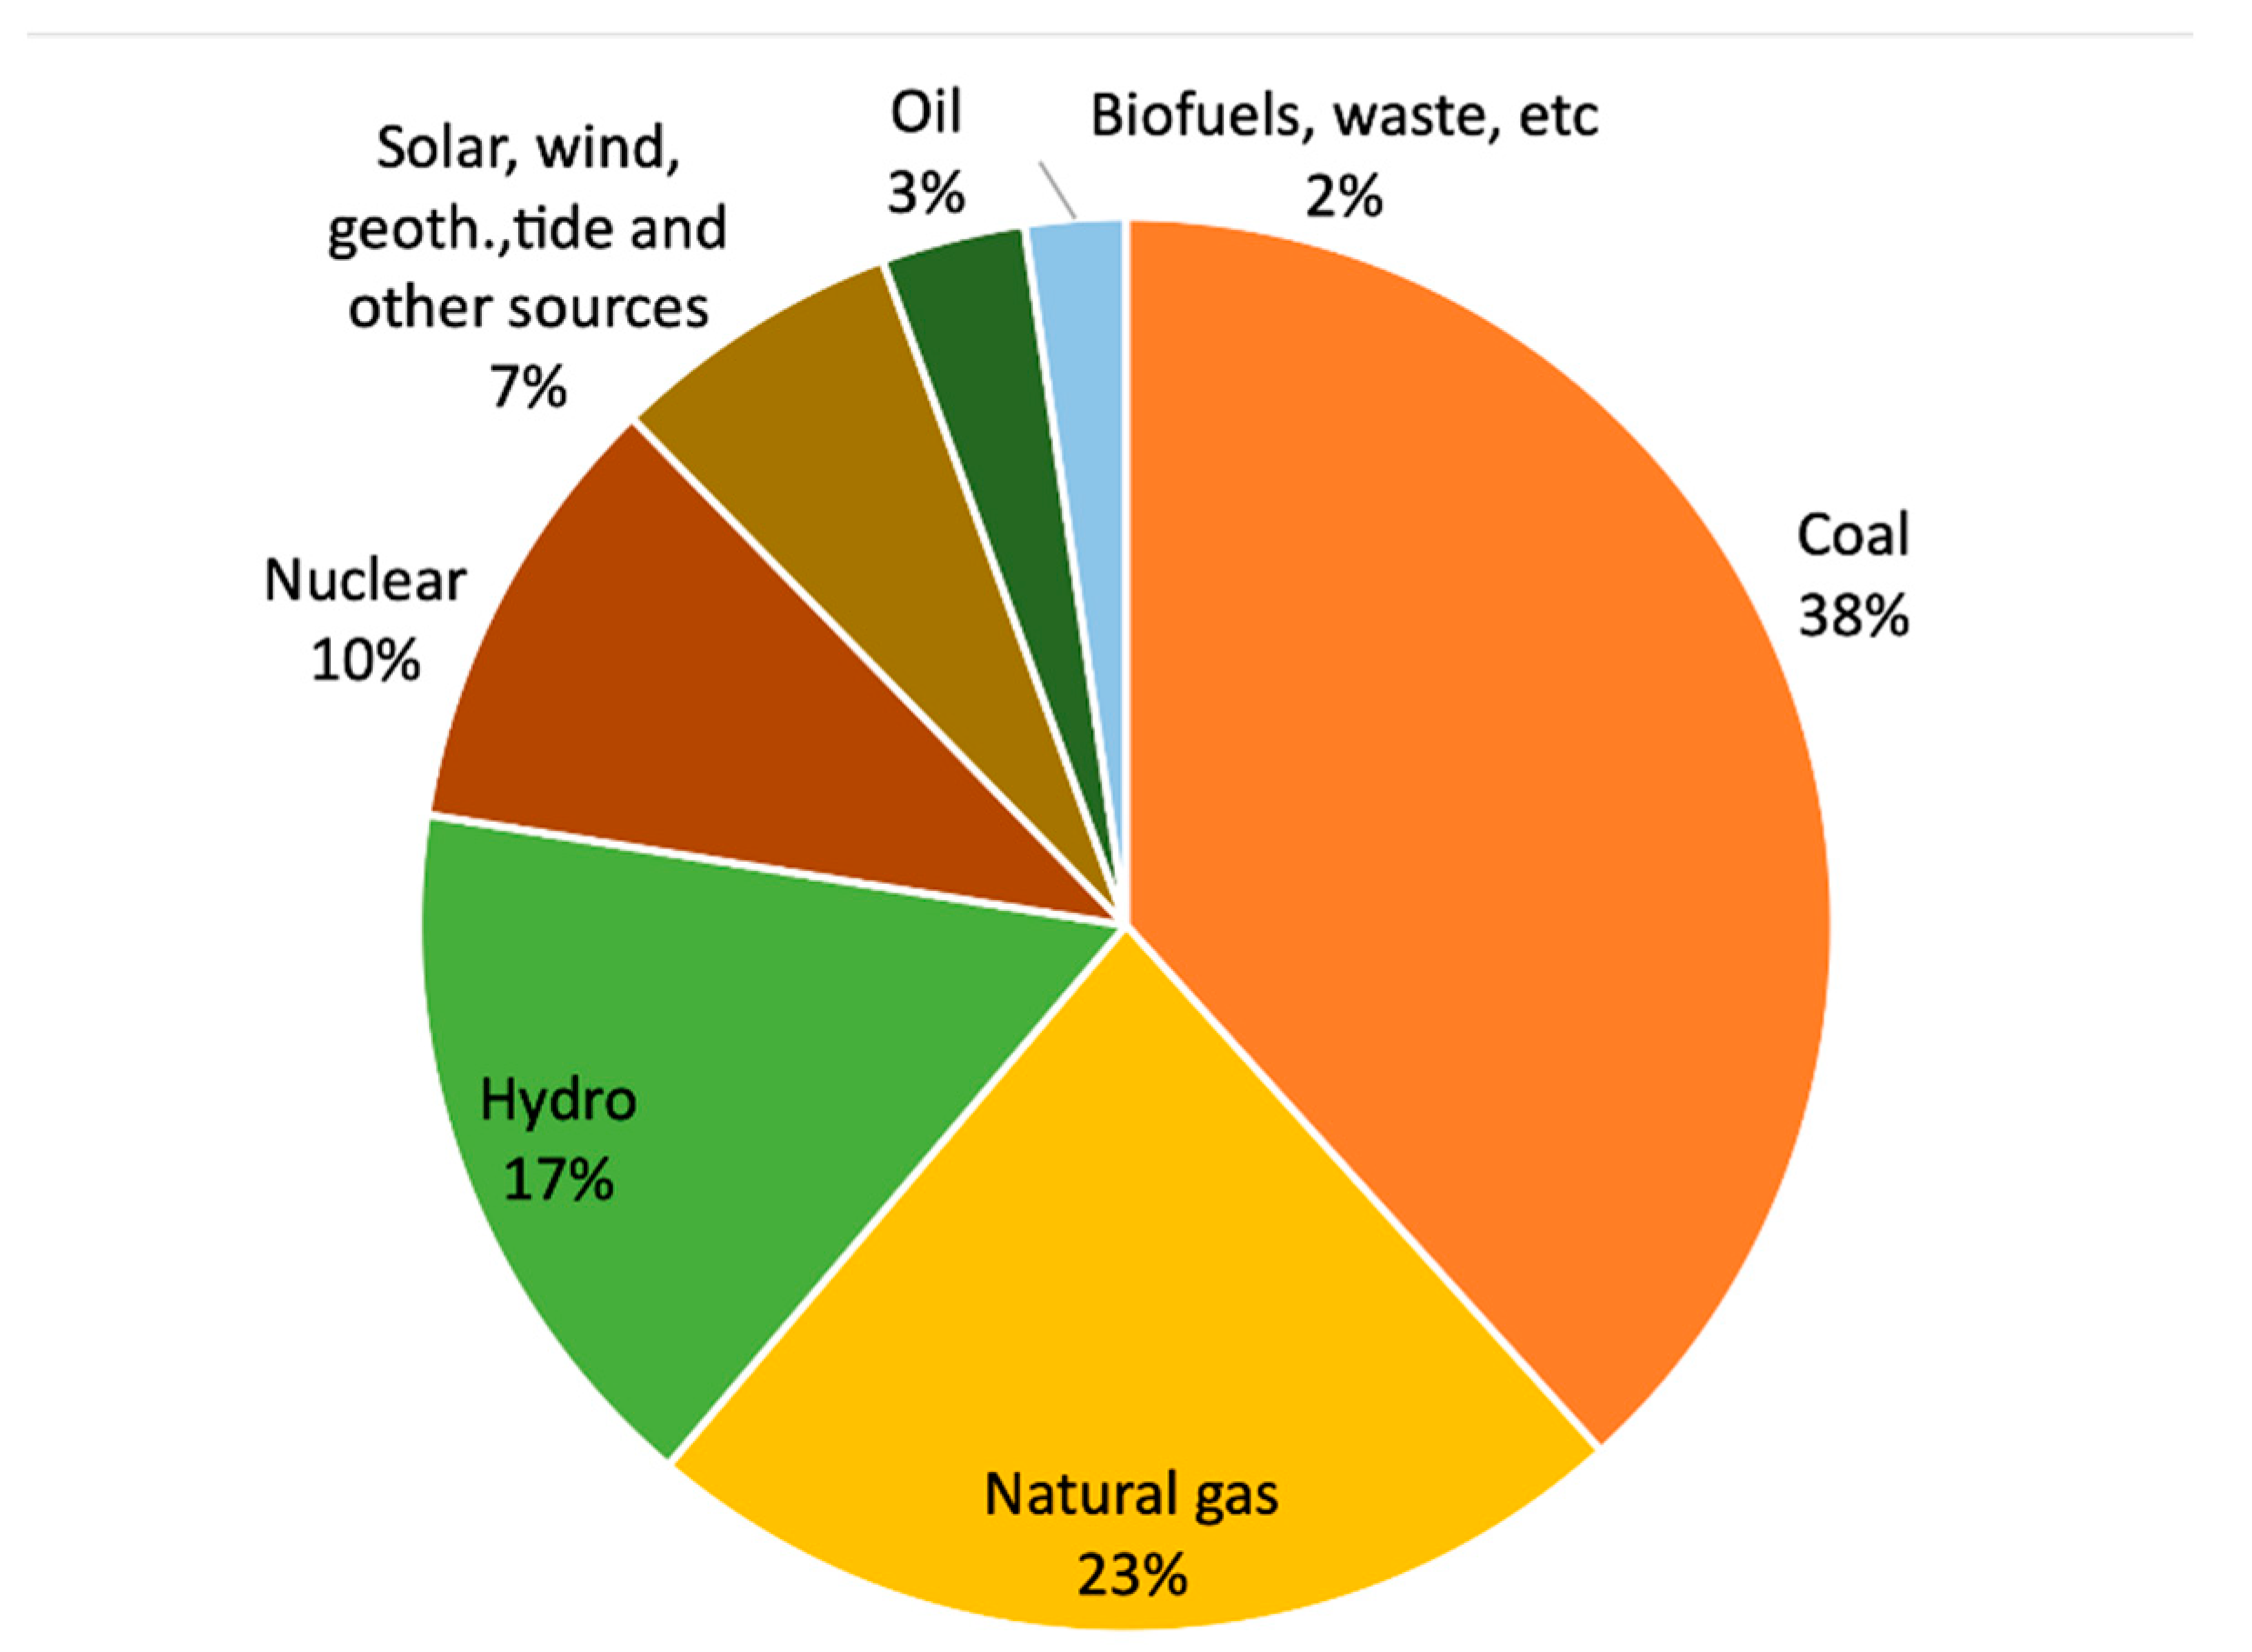
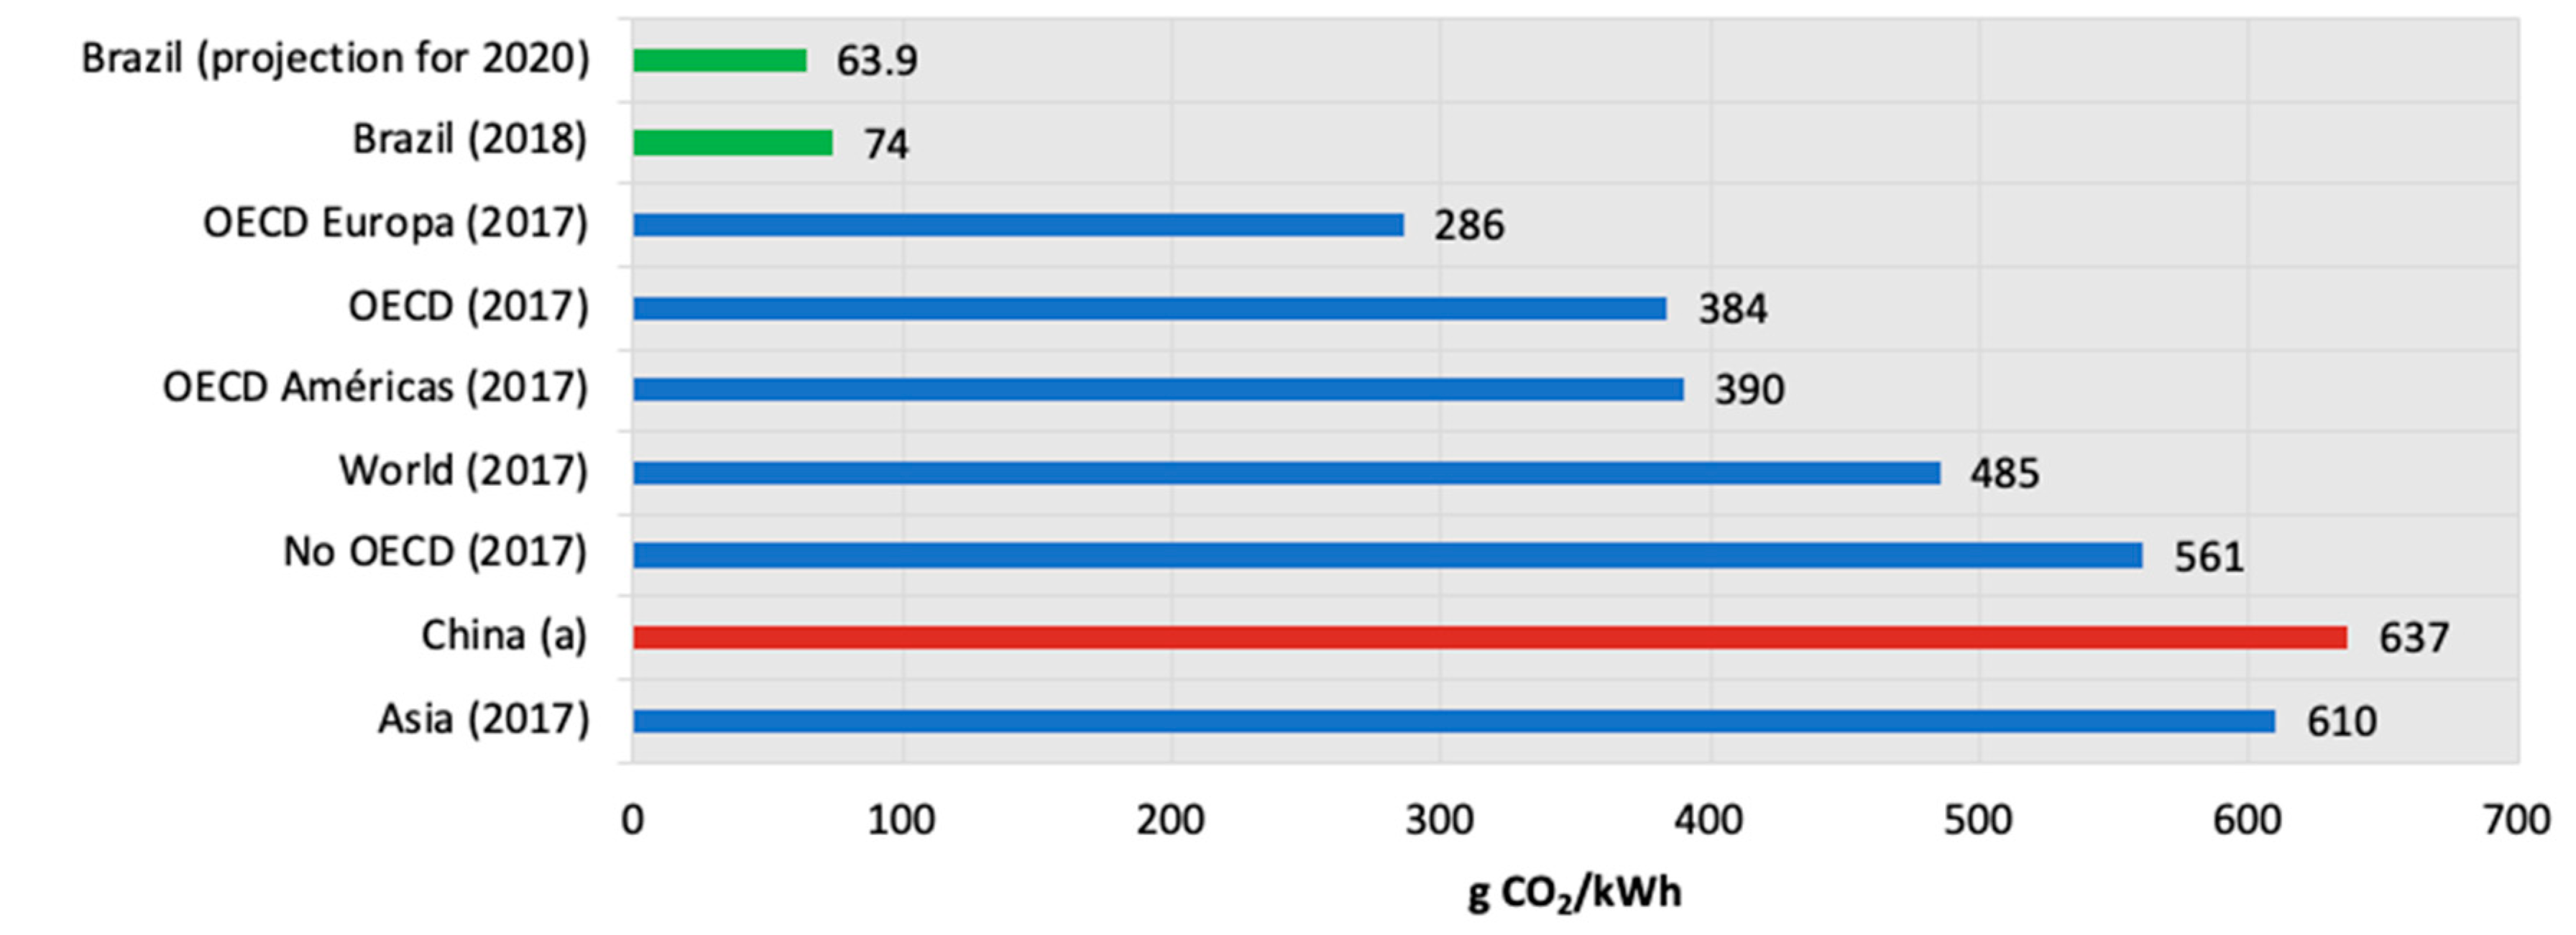
1.1. Energy Matrix and Greenhouse Gas Emission Factors
1.2. Public Policy to Incentivise Distributed Renewable Generation
2. Life Cycle Assessment of Solar Photovoltaic Systems
2.1. LCA Methodology
- Greenhouse gas emission rate (GHGe-rate), given by the following equation [26]:
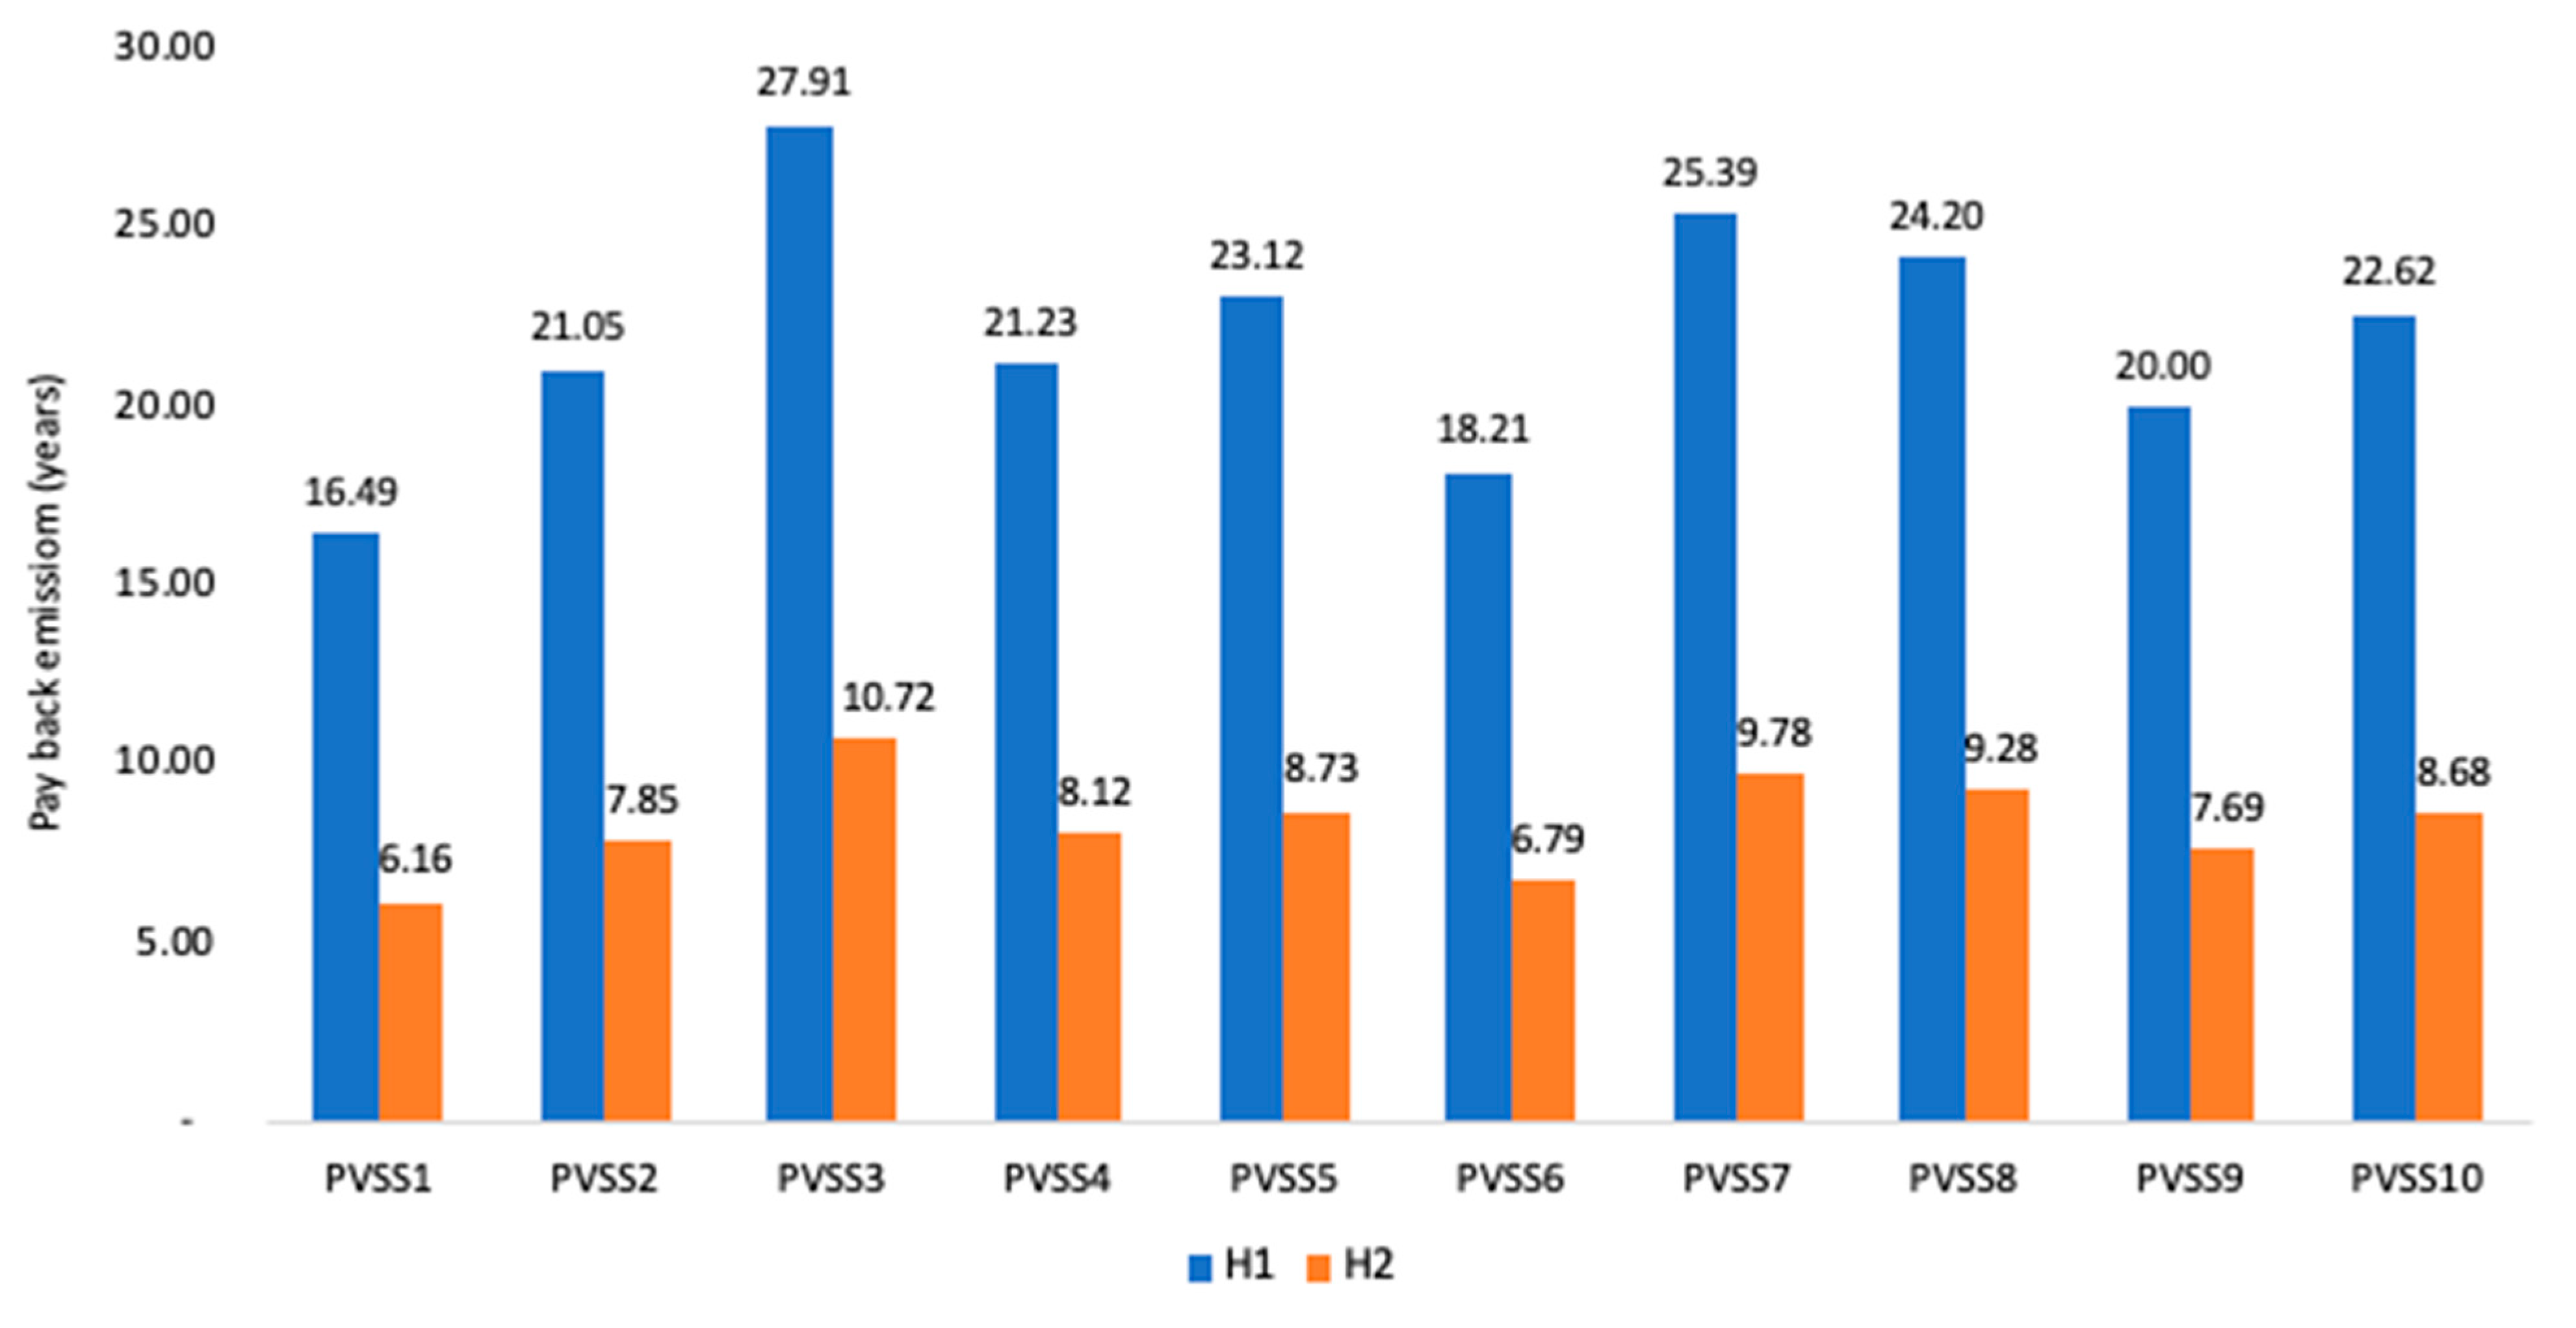
- Payback time emission, given by the following equation:
| CED = Einput + EBOS | CED (cumulative energy demand) is the sum of Einput: primary energy entering the life cycle (MJp) and the EBOS: energy required by the balance of system (BOS) (MJp). |
| Eagen | annual electricity generation by the PVSS (MJ). |
| ng | average conversion rate of primary energy into grid electricity in the country where the panel is installed. |
| Einput | includes the energy required for module manufacturing, transportation, installation, operation, and maintenance, and its final decommissioning or recycling. |
| EBOS | is the energy required for BOS components, including support structure, cabling, electronic and electrical components, inverters, and batteries for standard isolated systems. |
| GHGe-rate | is the GHG emission rate per unit of electricity generated by the PVSS (g CO2-eq/kWh).. |
| GHGe-total | comprises the total GHG emissions during the life cycle (g CO2-eq). |
| EELCA-output | is the total electricity generated by the PVSS during the life cycle (kWh). |
| Payback Time Emission | indicates how many PVSS years of operation will be required to offset the emissions generated during the manufacturing and installation process (Equation (3)). |
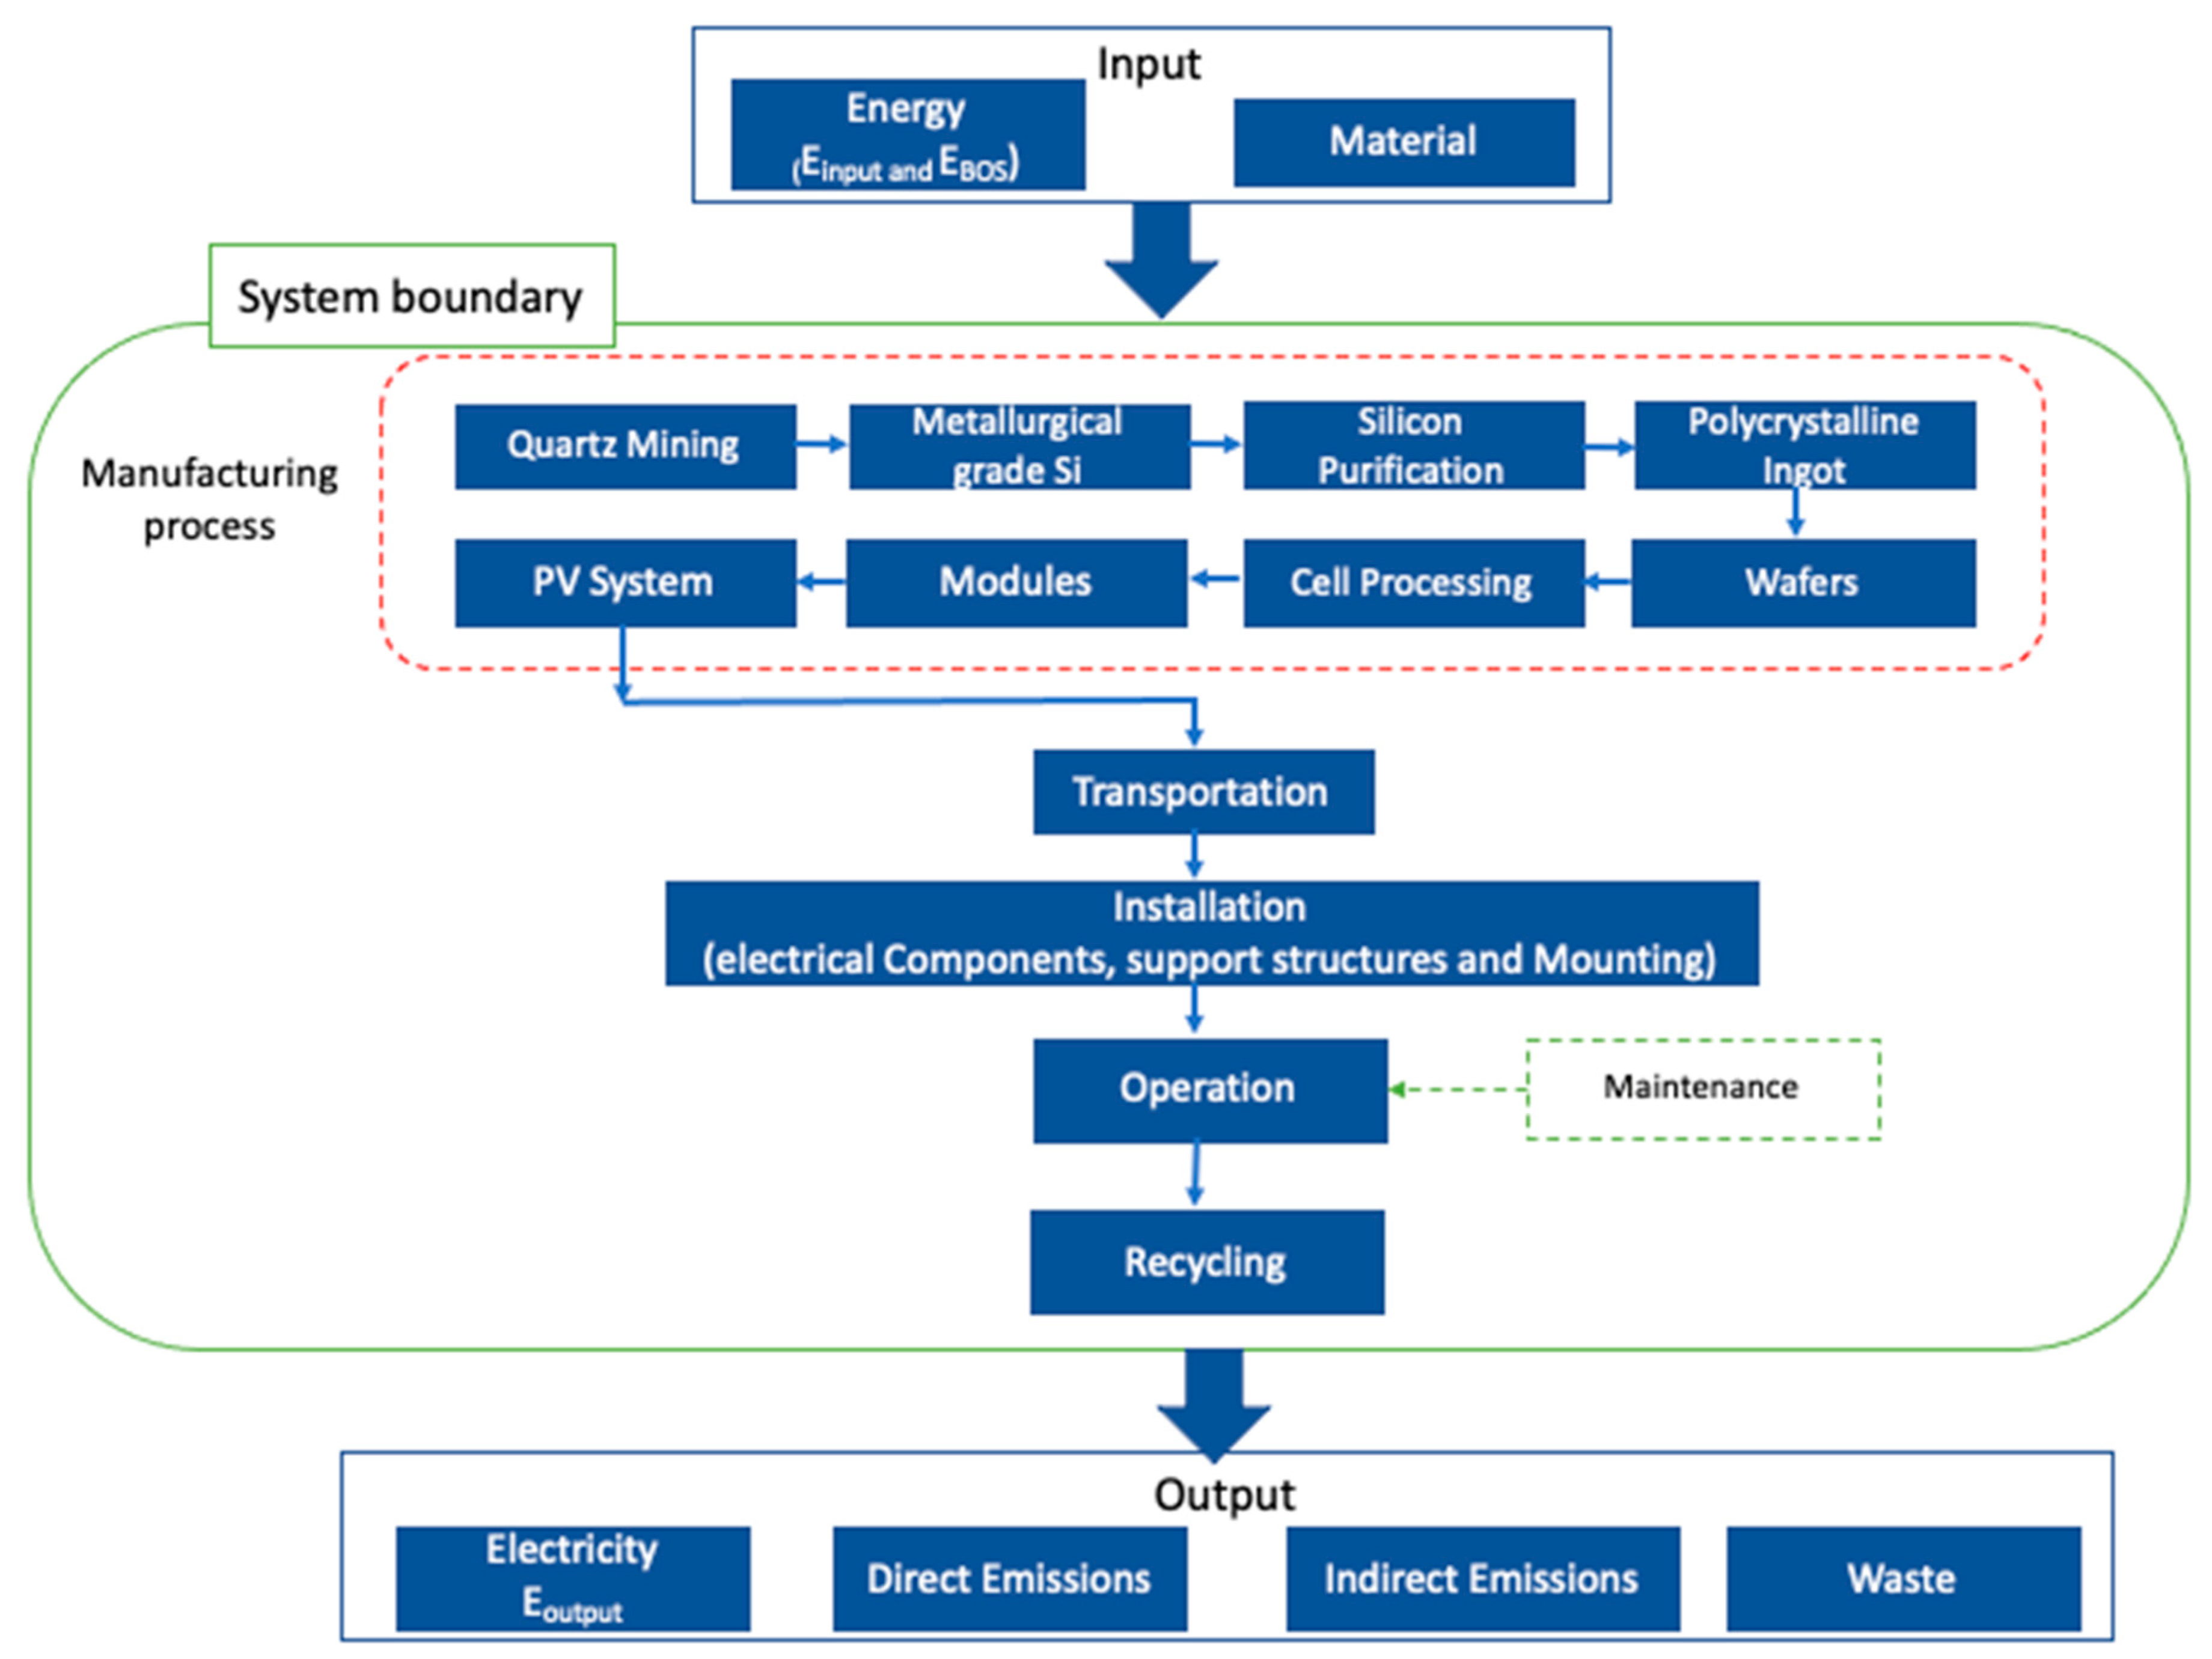
2.2. System Boundaries
- For the studied PVSS, energy consumption was considered in the phases of: manufacture of the modules, assembly and installation of the system and operation (25 years assumed).
- Direct emissions from the photovoltaic module manufacturing process and emissions associated with the energy use for the manufacture of PVSS were accounted for.
- Data of emissions from transportation and the recycling process were also considered.
- The average data available in the literature for the energy values incorporated in the production of PVSS and the balance of system were used.
- All stages of the PVSS production process were carried out in China.
- The PVSS real electricity generation data for 1 year was used. The data from 2018 were the only publicly available during the time this study took place. Future work will look into the integration of longer historical datasets. For the projection of electricity generated by PVSS, an increase of losses by 0.7% per year was considered [31] to represent normal wear.
2.3. PVSS Materials, Energy, and Carbon Inventory
2.4. System Balance (GHG Emission Rate and EPBT from PVSS)
- Literature was the source of the energy values required in photovoltaic systems and their installation structures, given in MJp/m2;
- The area of each PVSS and the electricity values generated by each evaluated photovoltaic plant were collected from the Sunny portal [48], who is a supplier of photovoltaic systems.
- Equation (1) was used to calculate the EPBT.
- The values were converted from primary energy to electrical energy by using the total primary energy required for each PVSS (MJp), expressed in MJ and then converted to kWh.
- To calculate the GHG value from the electricity needed to manufacture and install the photovoltaic system, the emission factor of the electrical matrix of the country in which the photovoltaic system was manufactured, expressed in g CO2-eq/kWh, was used.
- Literature was the source of the estimated values of GHG emitted directly in the acquisition and manufacture of PVSS components, expressed in g CO2-eq/m2.
- Direct and indirect GHG emissions from the systems were combined.
- The electricity generation data for each analyzed photovoltaic system was used.
- Equation (2) was used to calculate the GHG emission rate in g CO2-eq/kWh.
- For the projection of electricity generated by PVSS in the year following the actual data collected (2018), an increase of losses by 0.7% per year was considered [31] to represent normal wear.
- To calculate emissions avoided during each plant’s useful life, the total electricity generated per year (in MWh) was multiplied by the annual projected NIS emission factor (in tCO2/MWh).
- The return time of the emissions generated in the manufacture of the systems was calculated using Equation (3).
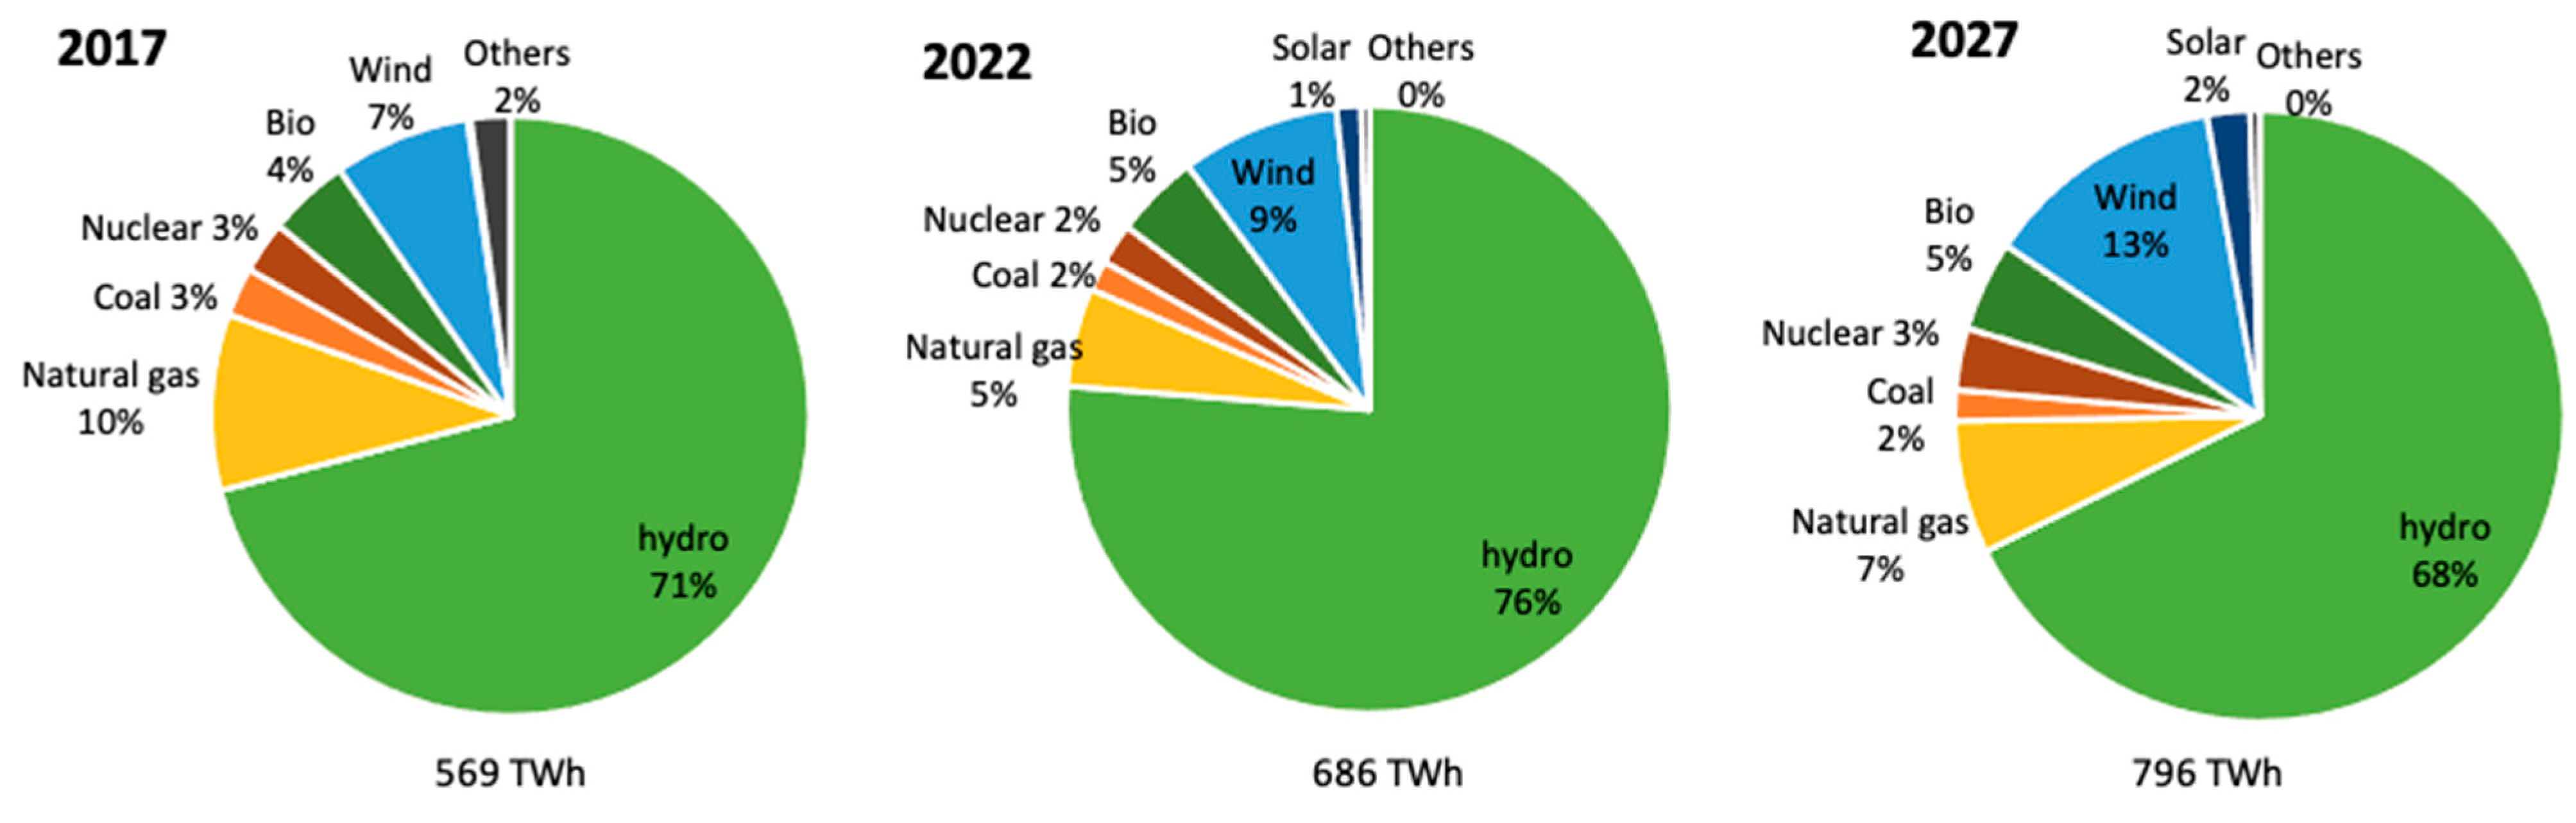
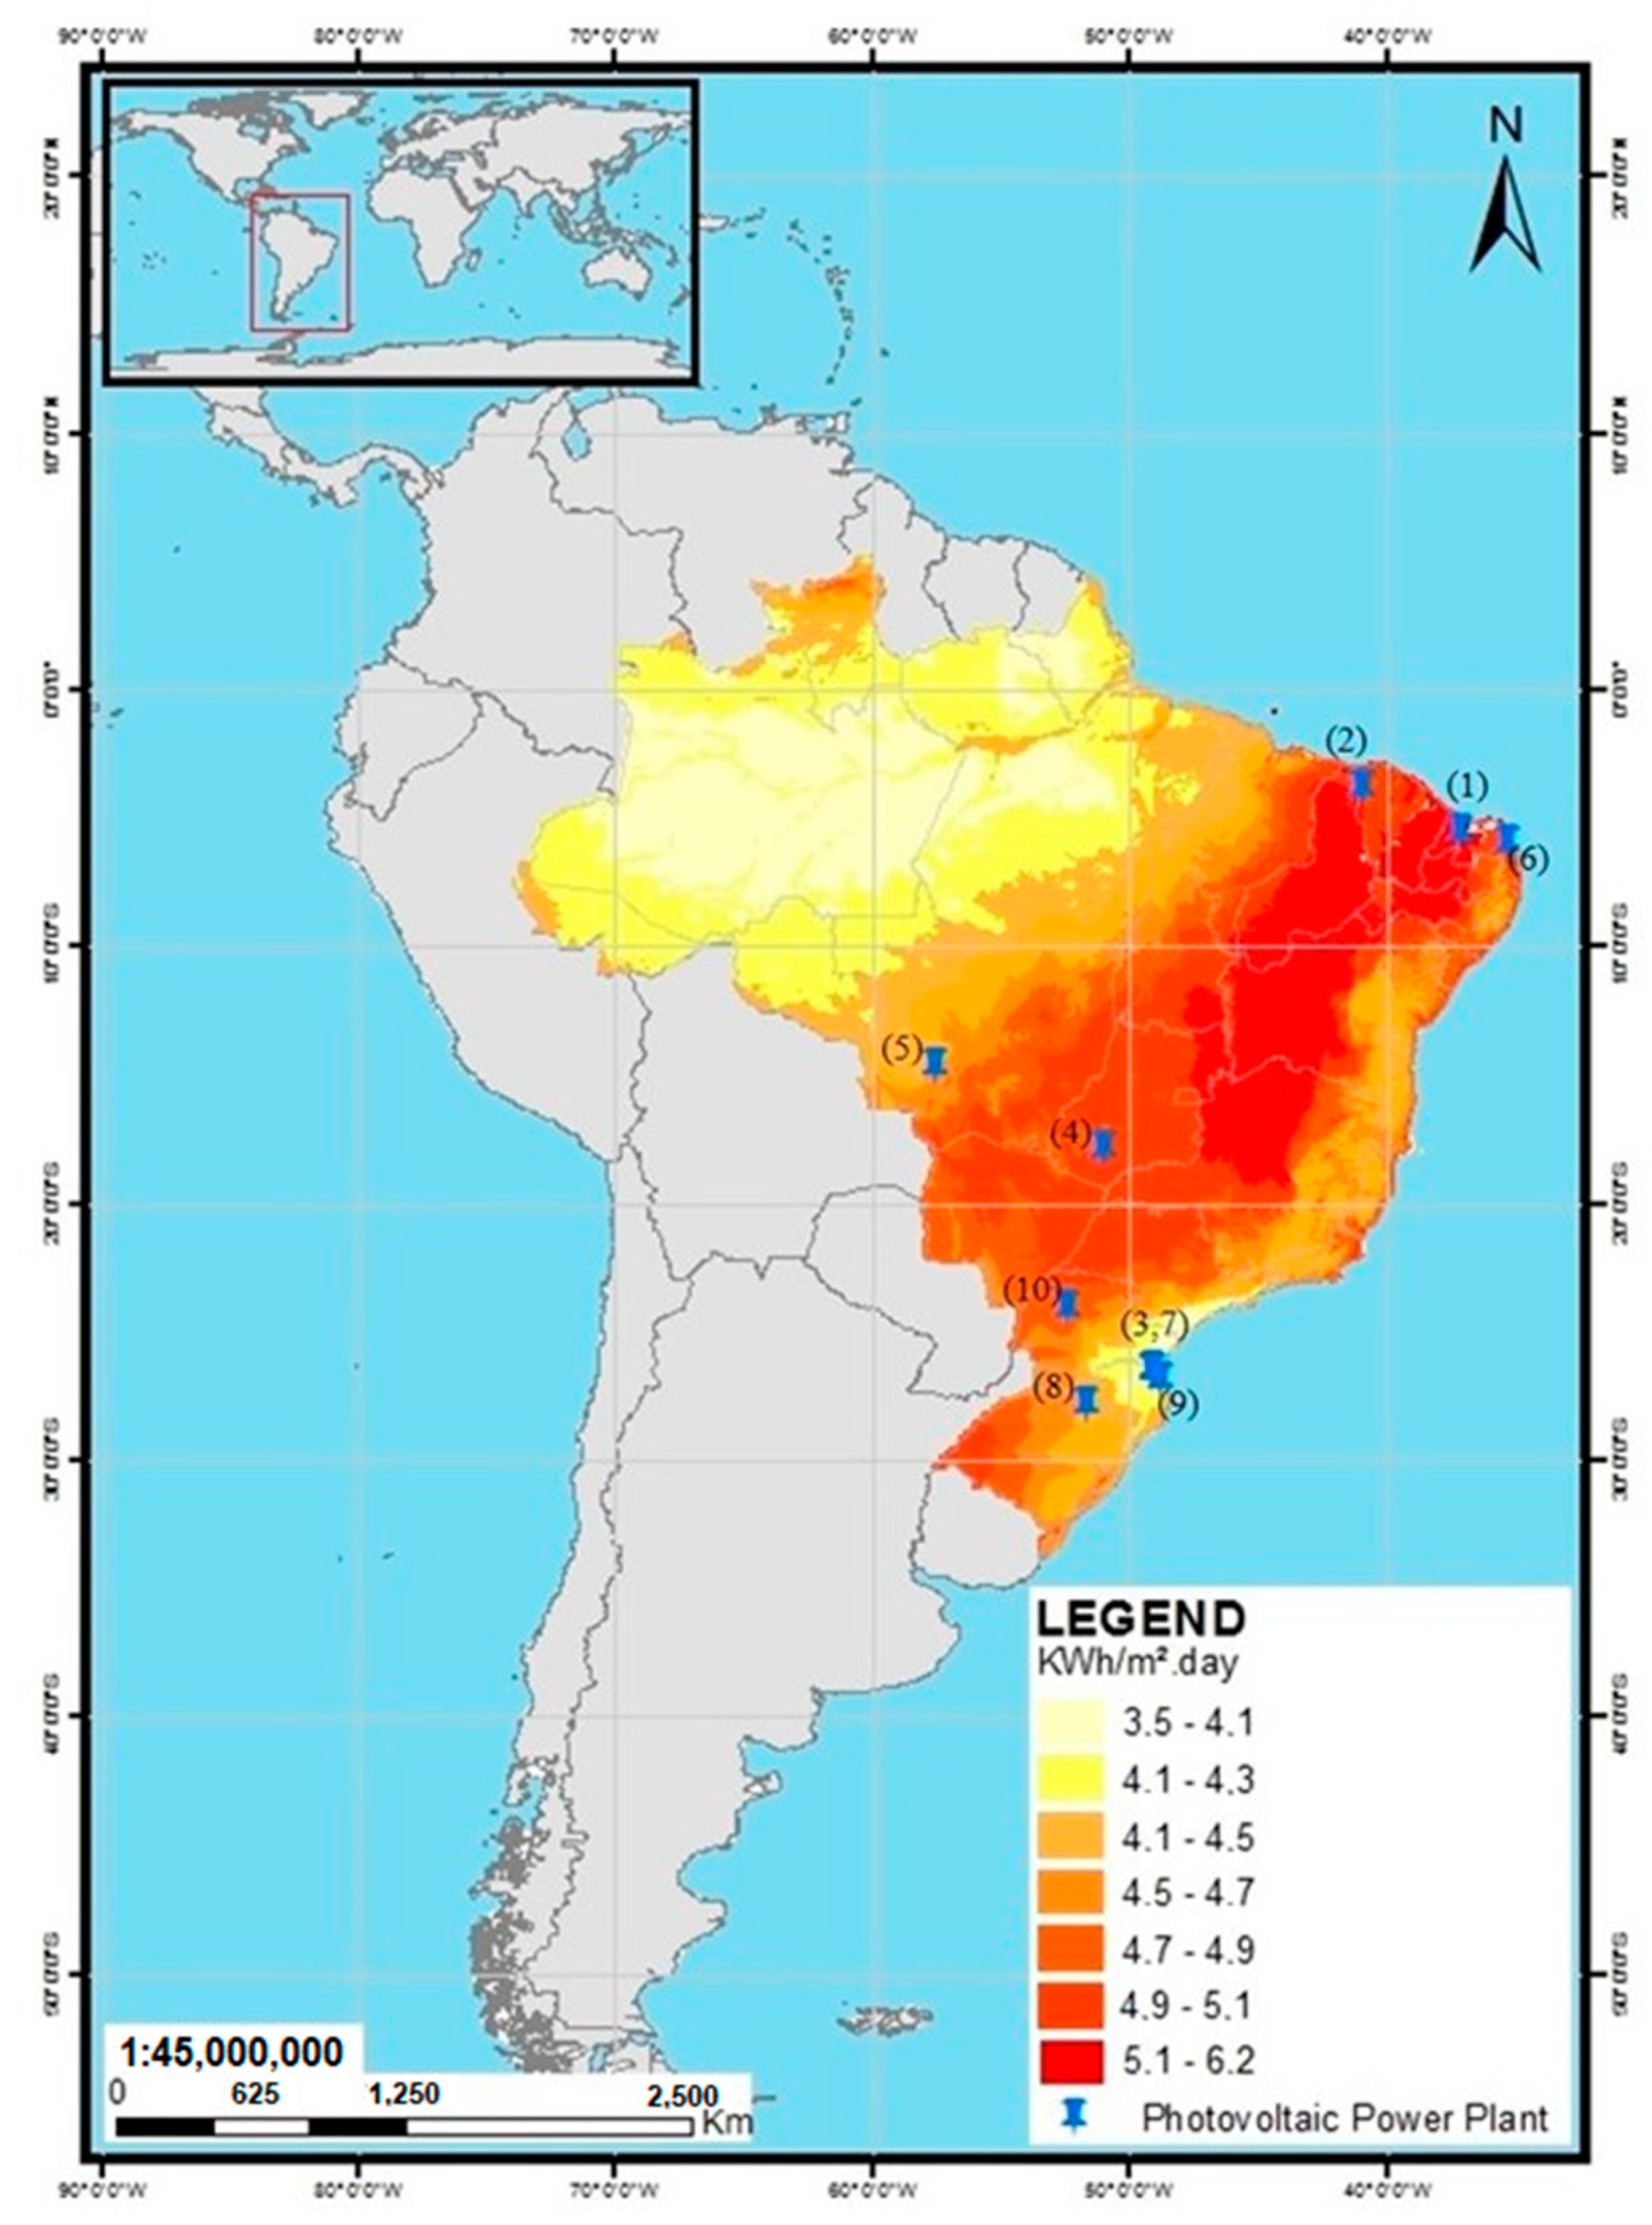
3. Case Study: PV Electricity Generation in Brazil
4. Results and Discussion
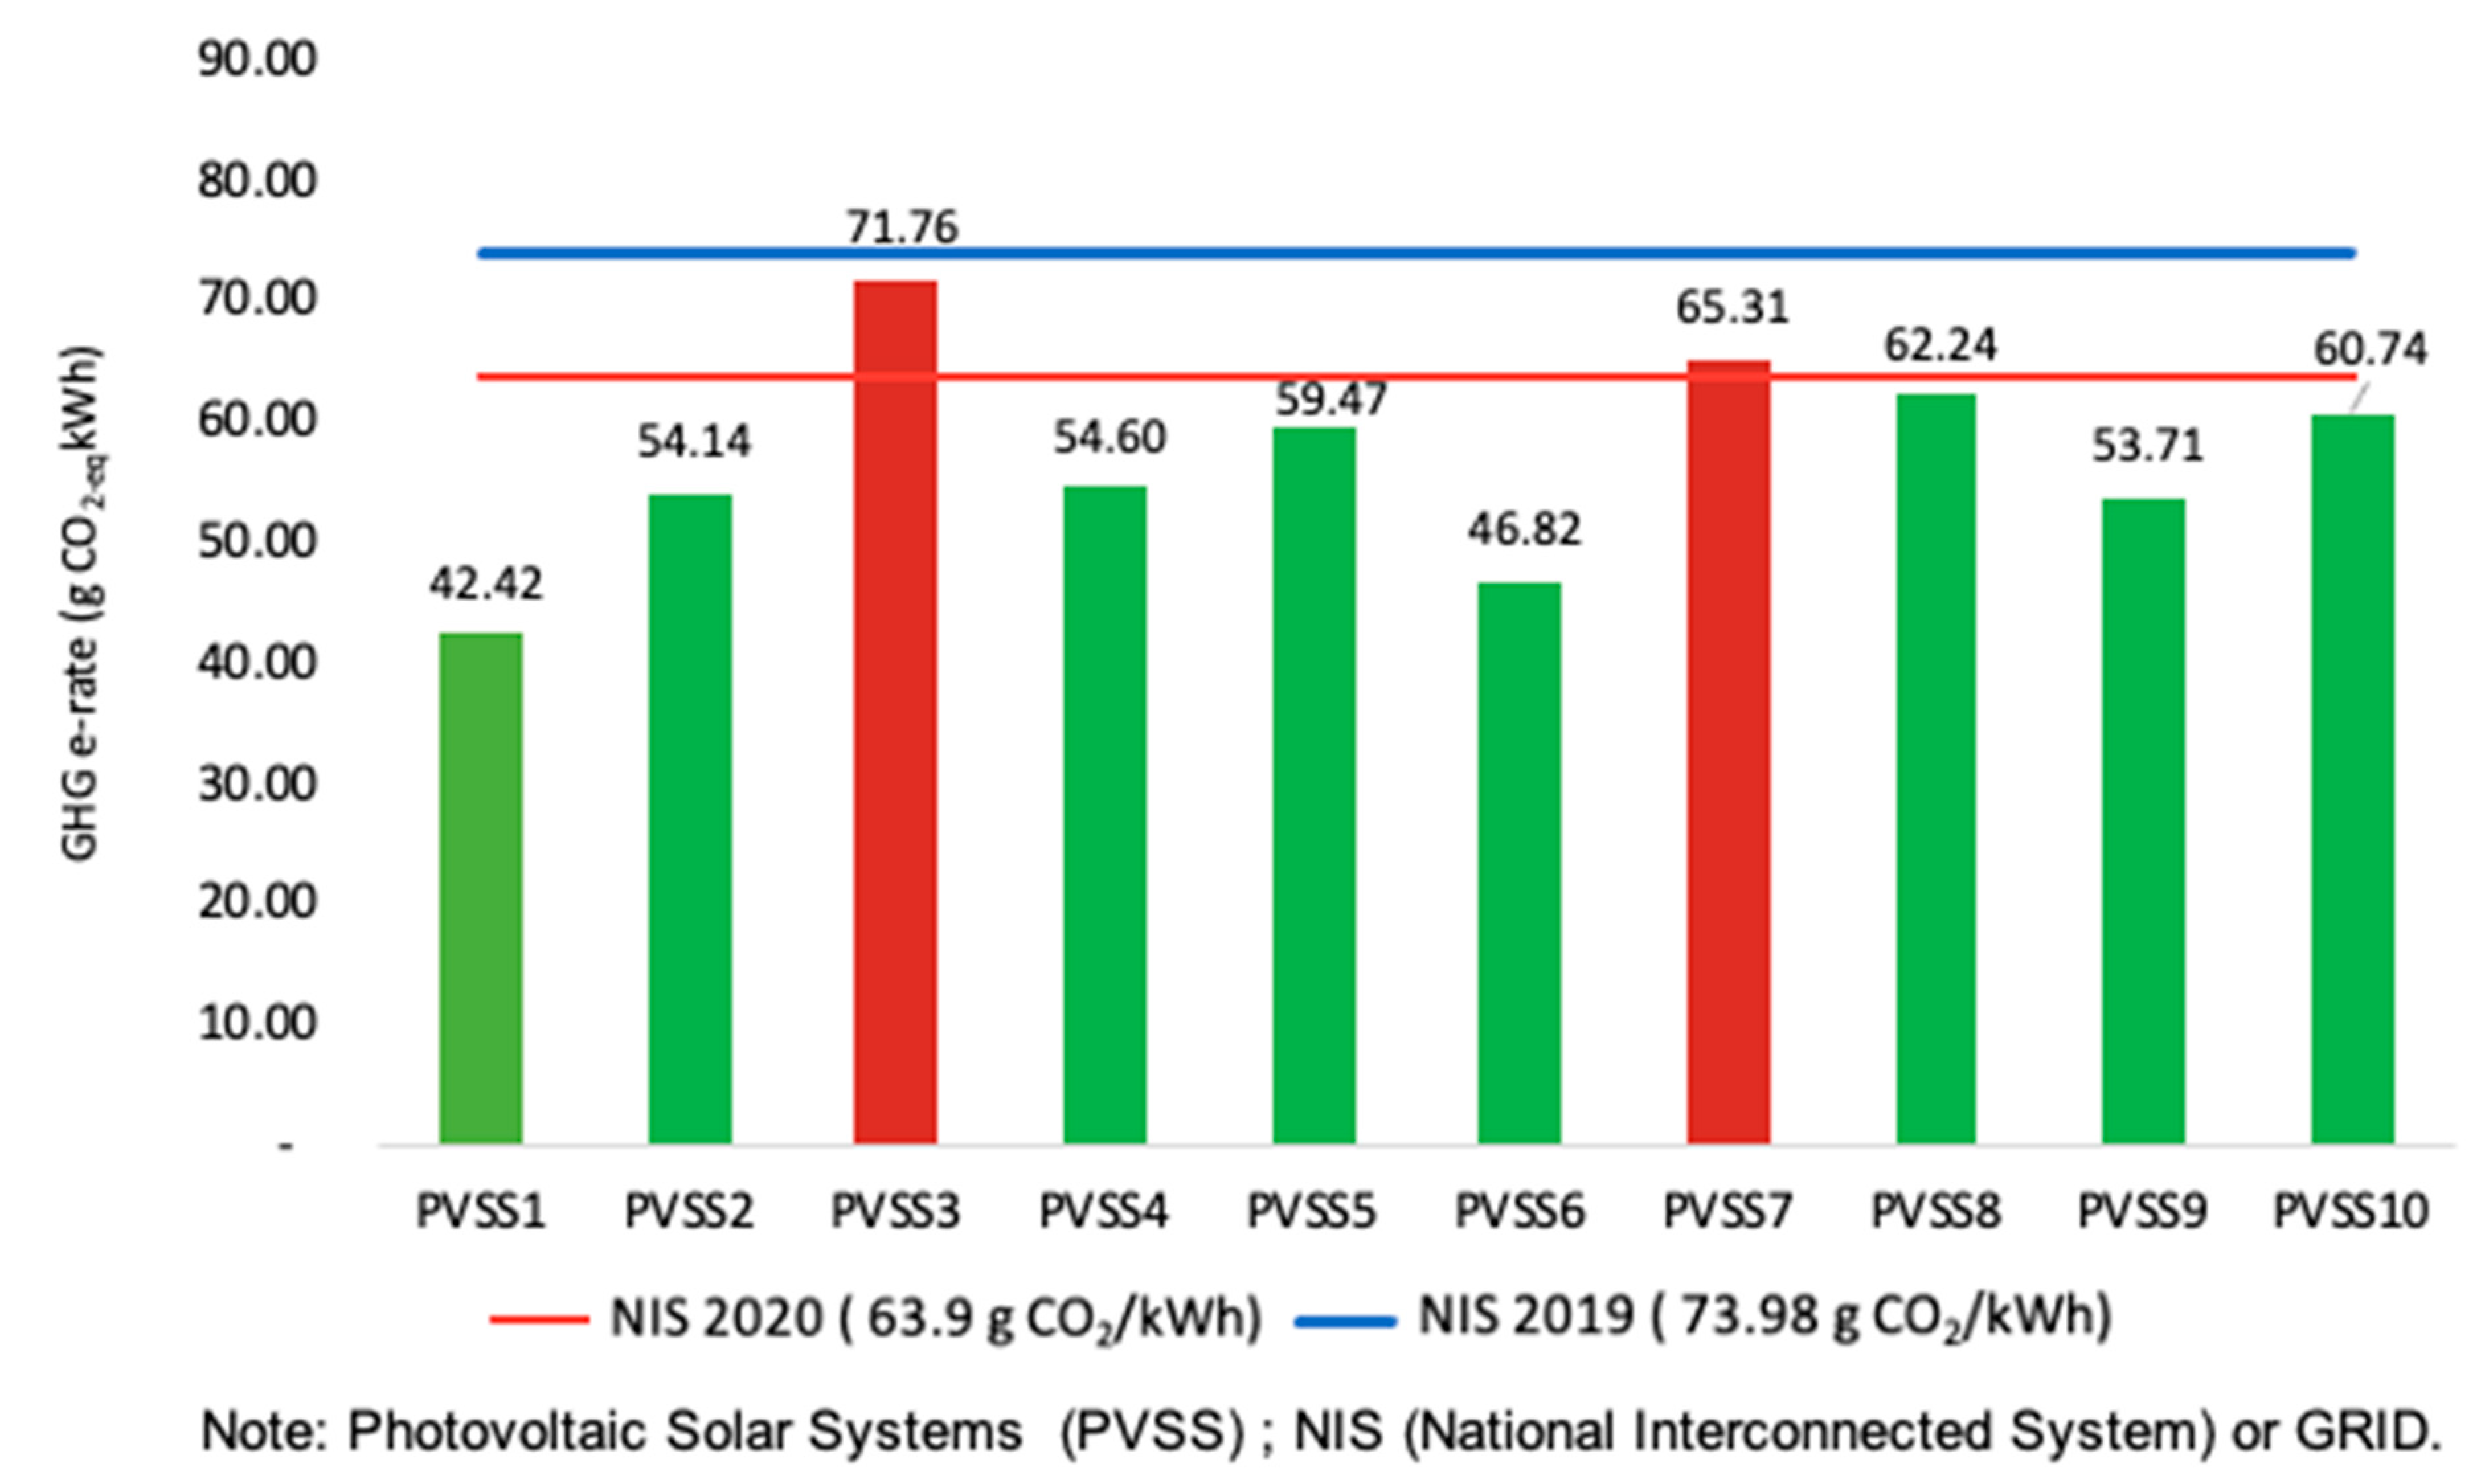
4.1. PV System EPBT and GHG Emission Rate
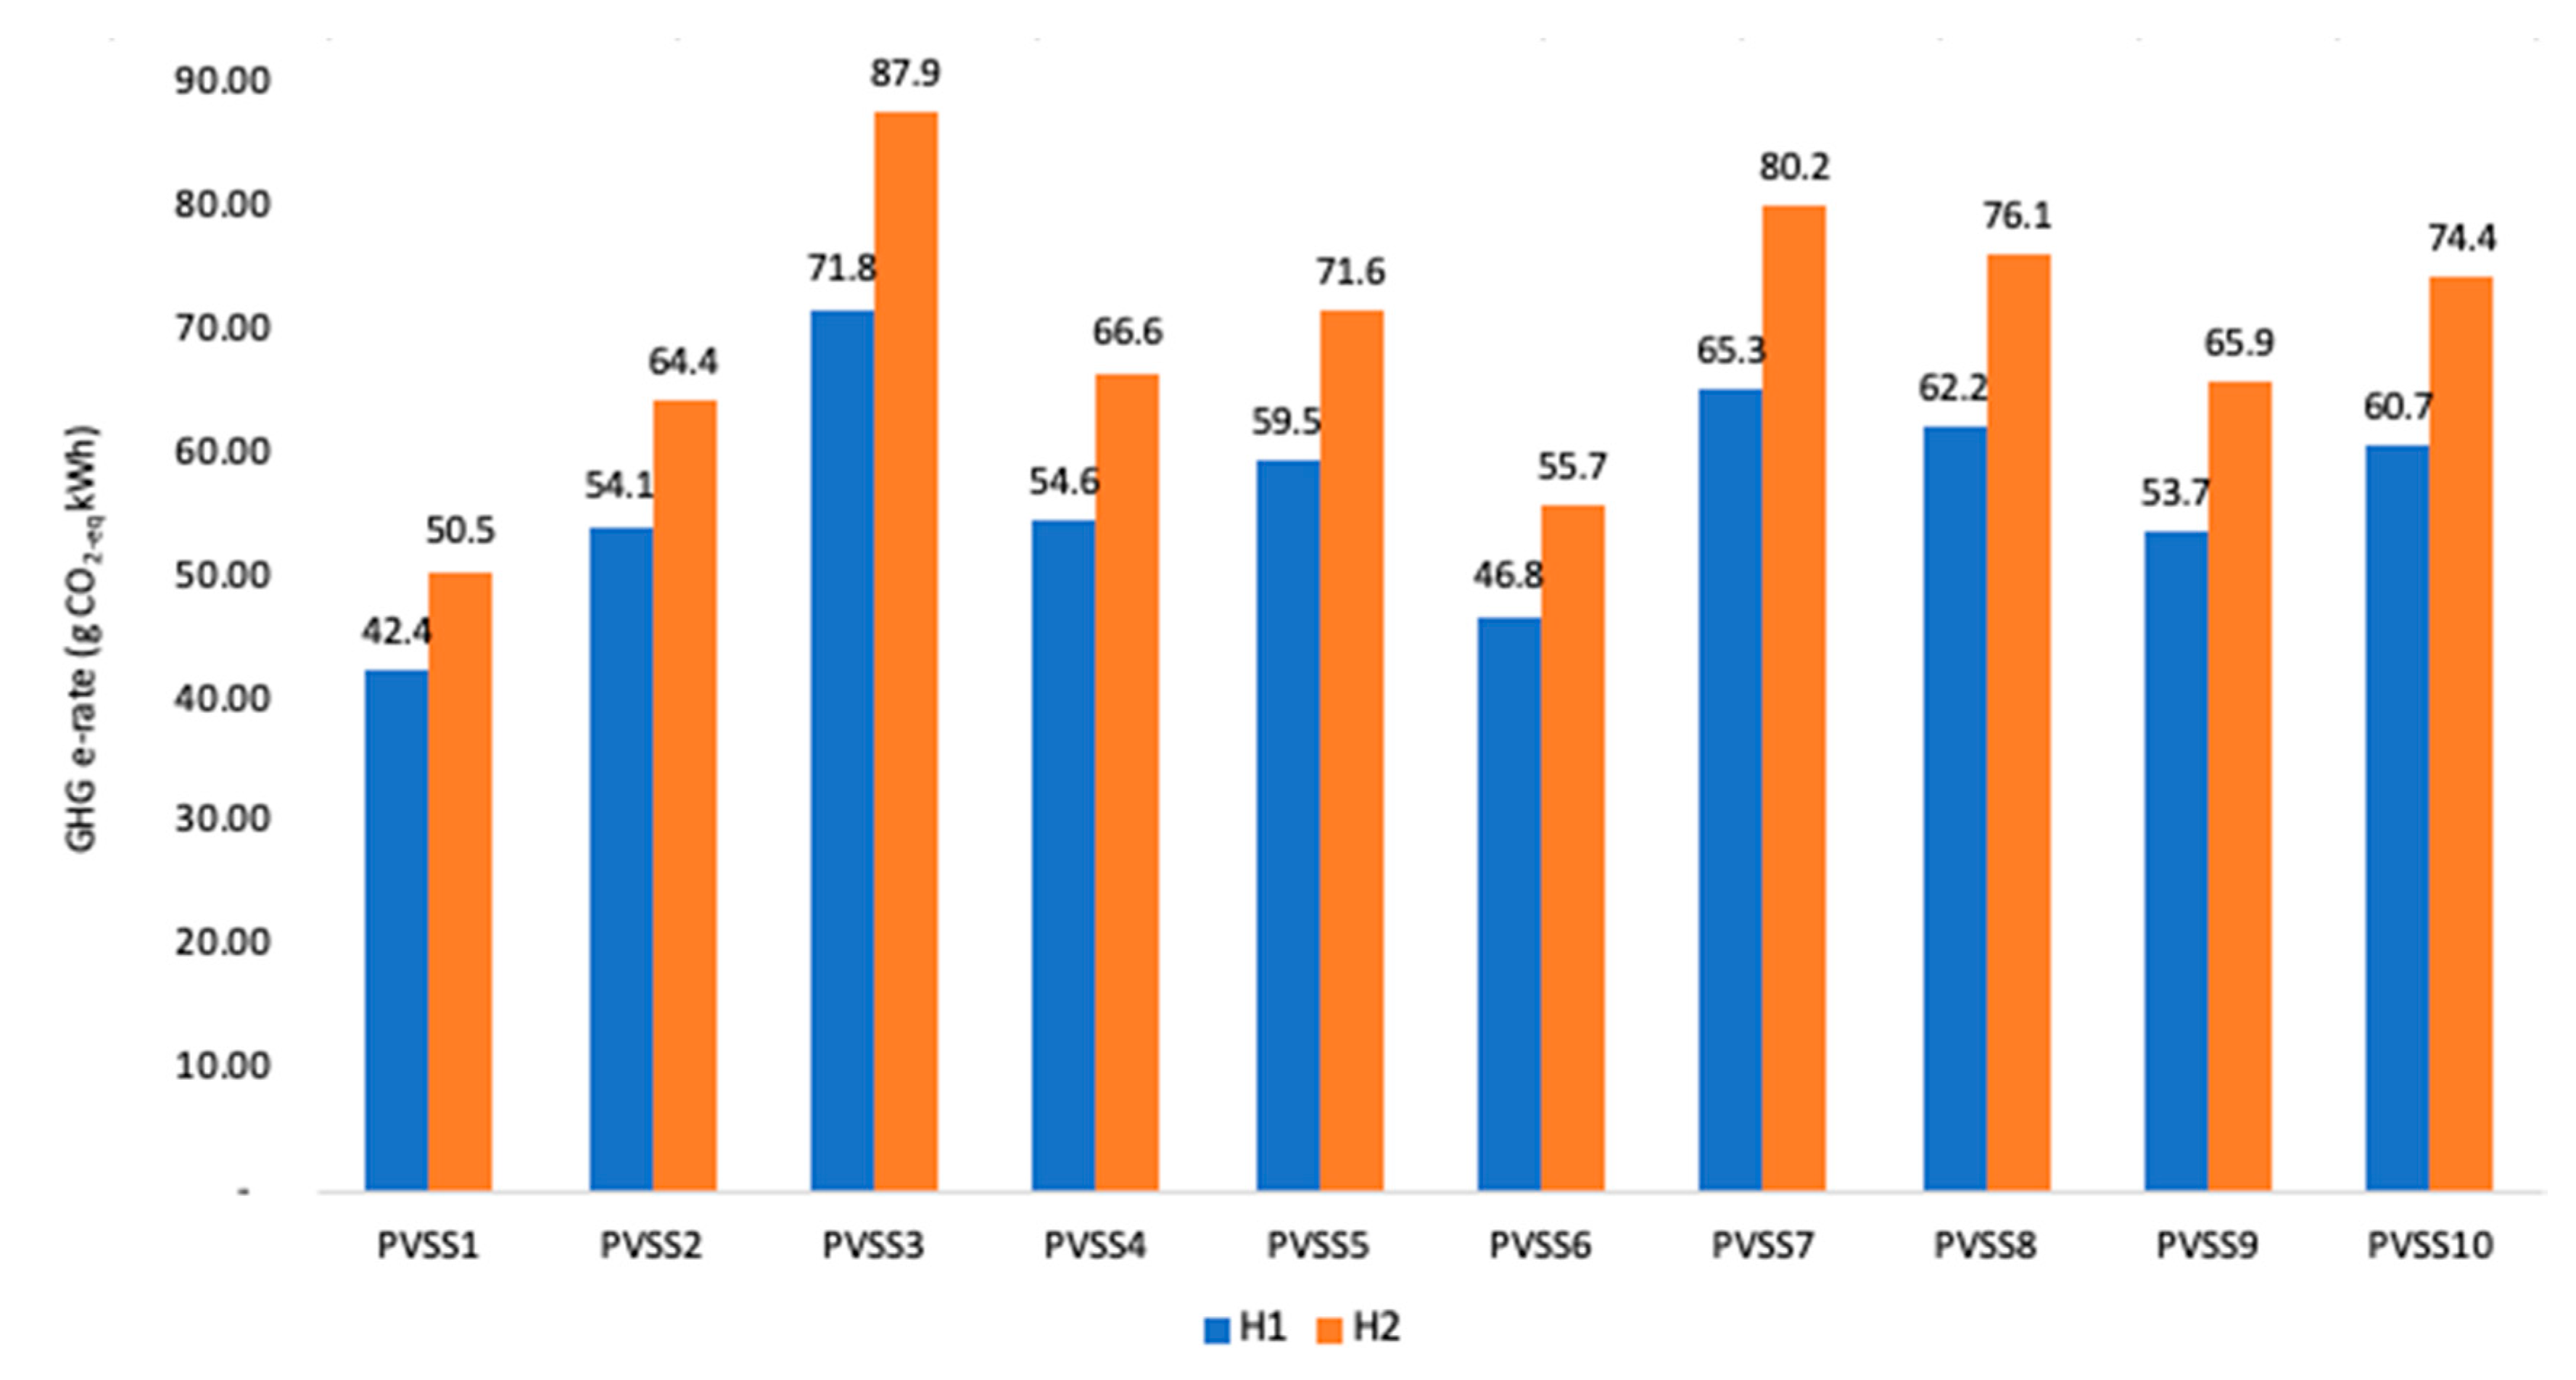
4.2. Additional Analysis
4.3. Discussion
- There is only data available for one year of electricity generation of the systems studied and the outputs were projected for the remaining 24 years of useful life despite any possible upgrades or downgrades during this period;
- For the calculation of the emissions avoided by the installation of the systems, it was considered that the emission factor of the matrix remains constant and equal to 2020 levels;
- Future work, if hourly PV generation data are available, could perform a comparative analysis with hourly data from NIS emission or marginal factors.
5. Conclusions
Author Contributions
Funding
Institutional Review Board Statement
Informed Consent Statement
Data Availability Statement
Acknowledgments
Conflicts of Interest
References
- IEA. IEA Sankey Diagram. Available online: https://www.iea.org/sankey/ (accessed on 27 October 2020).
- Evans, S.; Pearse, R. Mapped: The world’s Coal Power Plants in 2020. Available online: https://www.carbonbrief.org/mapped-worlds-coal-power-plants (accessed on 30 September 2020).
- Oak Ridge National Laboratory. Carbon dioxide Information Analysis; Oak Ridge National Laboratory: Oak Ridge, TN, USA, 2017. [Google Scholar]
- Carbon Footprint. Carbon Footprint Country Specific Electricity Grid Greenhouse Gas Emission Factors; Carbon Footprint: Hampshire, UK, 2019. [Google Scholar]
- IRENA. Renewable Capacity Statistics 2020 International Renewable Energy Agency (IRENA); IRENA: Abu Dhabi, United Arab Emirates, 2020. [Google Scholar]
- MCTIC. Estimativas Anuais de Emissões de Gases de Efeito Estufa no Brasil, 5th ed.; MCTIC: Brasília, Brazil, 2020; ISBN 9788588063914. [Google Scholar]
- SEEG Brasil Emissões Totais|SEEG-Sistema de Estimativa de Emissão de Gases. Available online: http://plataforma.seeg.eco.br/total_emission (accessed on 28 January 2021).
- IEA. Electricity Information: Overview; IEA: Paris, France, 2019. [Google Scholar]
- IEA. CO2 Emissions from Fuel Combustion 2019 Highlights; IEA: Paris; France, 2019. [Google Scholar]
- EPE. Cartilha EPE-Riomais20. In Proceedings of the Conferência para o Clima Rio+20; Rio de Janeiro, Brazil, 2012; p. 4. [Google Scholar]
- MCTIC. Fatores de Emissão de CO2 do Sistema Interligado Nacional do Brasil. Available online: https://antigo.mctic.gov.br/mctic/opencms/ciencia/SEPED/clima/textogeral/emissao_corporativos.html (accessed on 26 January 2021).
- EPE. PDE 2027-Plano Decenal de Energia; EPE: Rio de Janeiro, Brazil, 2019. [Google Scholar]
- Dale, A.; Pereira de Lucena, A.; Marriott, J.; Borba, B.; Schaeffer, R.; Bilec, M. Modeling Future Life-Cycle Greenhouse Gas Emissions and Environmental Impacts of Electricity Supplies in Brazil. Energies 2013, 6, 3182–3208. [Google Scholar] [CrossRef]
- Balcar, P. Emissões de Gases de Efeito Estufa em Reservatórios de Centrais Hidrelétricas; MME: Rio de Janeiro, Brazil, 2014. [Google Scholar]
- Barros, M.; Piekarski, C.; de Francisco, A. Carbon Footprint of Electricity Generation in Brazil: An Analysis of the 2016–2026 Period. Energies 2018, 11, 1412. [Google Scholar] [CrossRef]
- EPE. PDE2026-Plano Decenal de Energia; EPE: Brasília, Brazil, 2017. [Google Scholar]
- Ecoinvent Data Base. Available online: https://www.ecoinvent.org/database/database.html (accessed on 24 July 2020).
- Mma, M.; Do, M.A. Federative Republic of Brazil Intended Nationally Determinaded Contribution towards Achieving the Object of the United Nations Framework Convention on Climate Change; Brazil‘sInitial National Communication: Brasília, Brazil, 2015. [Google Scholar]
- ANEEL. Resolução Normativa no 482; ANEEL: Rio de Janeiro, Brazil, 2012.
- ANEEL. Resolução Normativa no 687; ANEEL: Rio de Janeiro, Brazil, 2015.
- ANEEL. Resolução Normativa n. 786/2017; ANEEL: Rio de Janeiro, Brazil, 2017.
- ANEEL. Nota Técnica no 0056/2017; ANEEL: Rio de Janeiro, Brazil, 2017.
- GREENER. Estudo Estratégico–Mercado Fotovoltaico de Geração Distribuída–2° Semestre de 2018; GREENER: São Paulo, Brasil, 2018. [Google Scholar]
- SOLARTAIC Net Metering e Feed In. Available online: https://www.solarvoltenergia.com.br/blog/net-metering-e-feed-in-saiba-o-que-sao-e-como-funcionam/ (accessed on 7 April 2020).
- Pinto, A.; Zilles, R. Reactive power excess charging in grid-connected PV systems in Brazil. Renew. Energy 2014, 62, 47–52. [Google Scholar] [CrossRef]
- Peng, J.; Lu, L.; Yang, H. Review on life cycle assessment of energy payback and greenhouse gas emission of solar photovoltaic systems. Renew. Sustain. Energy Rev. 2013, 19, 255–274. [Google Scholar] [CrossRef]
- Löfgren, B.; Tillman, A.M.; Rinde, B. Manufacturing actor’s LCA. J. Clean. Prod. 2011, 19, 2025–2033. [Google Scholar] [CrossRef]
- Fthenakis, V.M.; Kim, H.C. Photovoltaics: Life-cycle analyses. Sol. Energy 2011, 85, 1609–1628. [Google Scholar] [CrossRef]
- Mann, S.A.; de Wild-Scholten, M.J.; Fthenakis, V.M.; van Sark, W.G.; Sinke, W.C. The energy payback time of advanced crystalline silicon PV modules in 2020: A prospective study. Prog. Photovolt. Res. Appl. 2014, 22, 1180–1194. [Google Scholar] [CrossRef]
- Barros, M.V.; Salvador, R.; Piekarski, C.M.; de Francisco, A.C.; Freire, F.M.C.S. Life cycle assessment of electricity generation: A review of the characteristics of existing literature. Int. J. Life Cycle Assess. 2020, 25, 36–54. [Google Scholar] [CrossRef]
- Fthenakis, V.M.; Frischknecht, R.; Raugei, M.; Kim, H.C.; Alsema, E.; Held, M.; de Wild Scholten, M. Methodology Guidelines on Life Cycle Assessment of Photovoltaic Electricity; IEA: Paris, France, 2011; ISBN 978-3-906042-38-1. [Google Scholar]
- Yue, D.; You, F.; Darling, S.B. Domestic and overseas manufacturing scenarios of silicon-based photovoltaics: Life cycle energy and environmental comparative analysis. Sol. Energy 2014, 105, 669–678. [Google Scholar] [CrossRef]
- Nieuwlaar, E.; Alsema, E. Envorimental aspects of PV power systems. In Proceedings of the IEA PVPS Task 1 Workshop; IEA: Utrecht, The Netherlands, 1997; pp. 25–27. [Google Scholar]
- Pacca, S.; Sivaraman, D.; Keoleian, G.A. Parameters affecting the life cycle performance of PV technologies and systems. Energy Policy 2007, 35, 3316–3326. [Google Scholar] [CrossRef]
- Alsema, E.A.; De Wild-Scholten, M.J. Environmental Impacts of Crystalline Silicon Photovoltaic Module Production. In CIRP Intern. Conf. on Life Cycle Engineering; Materials Research Society: Leuven, Belgium, 2006. [Google Scholar]
- Wild-Scholten, M. Energy payback times of PV modules and systems; Workshop Photovoltaic: Köln, Germany, 2009; pp. 26–27. [Google Scholar]
- Alsema, E.A.; Wild-Scholten, M.J. Reduction of the Environmental Impacts in Crystalline Silicon Module Manufacturing; WIP-Renewable Energies: Munich, Germany, 2007. [Google Scholar]
- Alsema, E.A.; Frankl, P.; Kato, K. Energy Pay-Back Time of Photovoltaic Energy Systems: Present Status and Prospects. In 2nd World Conference on Photovoltaic Solar Energy Conversion; Utrecht University Repository: Viena, Austria.
- Frankl, P.; Masini, A.; Gamberalet, M.; Toccacelift, D.; Toccacelit, D. Simplified Life-Cycle Analysis of PV Systems in Buildings: Present situation and future trends. Prog. Photovolt. Res. Appl. 1998, 6, 137–146. [Google Scholar] [CrossRef]
- Alsema, E.; Nieuwlaar, E. Energy viability of photovoltaic systems. Energy Policy 2000, 28, 999–1010. [Google Scholar] [CrossRef]
- ODFJELL. Environmental Initiatives in ODFJELL; ODFJELL: Bergen, Norway, 2015. [Google Scholar]
- Alsema, E. Energy requirements of thin-film solar cell modules—A review. Renew. Sustain. Energy Rev. 1998, 2, 387–415. [Google Scholar] [CrossRef]
- Rupp, R.F.; Lamberts, R. Relatório: Fatores de conversão de energia elétrica e térmica em energia primária e em emissões de dióxido de carbono a serem usados na etiquetagem de nível de eficiência energética de edificações; UFSC: Florianópolis, Brazil, 2017. [Google Scholar]
- Fthenakis, V.; Kim, H.C. Energy Use and Greenhouse Gas Emissions in the Life Cycle of CdTe Photovoltaics. In Symposium G – Life-Cycle Analysis Tools for “Green” Materials and Process Selection; Cambridge University Press: Cambridge, UK, 2005; Volume 895, pp. 1–6. [Google Scholar]
- EIA. Annual Energy Review 2003; EIA-Energy Information Administration: Washington, DC, USA, 2003. [Google Scholar]
- Raugei, M.; Bargigli, S.; Ulgiati, S. Life cycle assessment and energy pay-back time of advanced photovoltaic modules: CdTe and CIS compared to poly-Si. Energy 2007, 32, 1310–1318. [Google Scholar] [CrossRef]
- Constantino, G.; Freitas, M.; Fidelis, N.; Pereira, M. Adoption of Photovoltaic Systems Along a Sure Path: A Life-Cycle Assessment (LCA) Study Applied to the Analysis of GHG Emission Impacts. Energies 2018, 11, 2806. [Google Scholar] [CrossRef]
- Sunny Portal Publicly Available PV System-Sunny Portal. Available online: https://www.sunnyportal.com/Templates/PublicPagesPlantList.aspx (accessed on 16 June 2020).
- Pereira, E.B.; Martins, F.R.; Gonçalves, A.R.; Costa, R.S.; Lima, F.L.; Rüther, R.; Abreu, S.L.; Tiepolo, G.M.; Pereira, S.V.; Souza, J.G. Atlas brasileiro de energia solar; INPE, Ed.; 2a; INPE: São José dos Campos, Brazil, 2017. [Google Scholar]
- Tiba, C. Banco de dados terrestres: Atlas Solarimétrico do Brasil; UFPE, Ed.; UFPE: Recife, Brazil, 2000. [Google Scholar]
- INPE (Instituto Nacional de Pesquisas Espaciais). Banco de Dados do Atlas Solar Brasileiro de Energia Solar. Available online: http://labren.ccst.inpe.br/ (accessed on 27 June 2018).
- Xin, L.; Konstantinos, J.; Chalvatzisa, D.P. China’s electricity emission intensity in 2020 - An analysis at provincial level. Energy Procedia 2017, 142, 2779–2785. [Google Scholar] [CrossRef]
- Alsema, E.A. Energy pay-back time and CO2 emissions of PV systems. Prog. Photovoltaics Res. Appl. 2000, 8, 17–25. [Google Scholar] [CrossRef]
- Breyer, C.; Koskinen, O.; Blechinger, P. Profitable climate change mitigation: The case of greenhouse gas emission reduction benefits enabled by solar photovoltaic systems. Renew. Sustain. Energy Rev. 2015, 49, 610–628. [Google Scholar] [CrossRef]
- Hondo, H. Life cycle GHG emission analysis of power generation systems: Japanese case. Energy 2005, 30, 2042–2056. [Google Scholar] [CrossRef]
- Fthenakis, V.; Alsema, E. Photovoltaics energy payback times, greenhouse gas emissions and external costs: 2004–early 2005 status. Prog. Photovoltaics Res. Appl. 2006, 14, 275–280. [Google Scholar] [CrossRef]
- Lenzen, M. Life-Cycle Energy Balance and Greenhouse Gas Emissions of Nuclear Energy in Australia. 2008. Energy Convers. Manag. 2008, 49, 2178–2199. [Google Scholar] [CrossRef]
- Stoppato, A. Life cycle assessment of photovoltaic electricity generation. Energy 2008, 33, 224–232. [Google Scholar] [CrossRef]
- Ito, M.; Komoto, K.; Kurokawa, K. Life-cycle analyses of very-large scale PV systems using six types of PV modules. Curr. Appl. Phys. 2010, 10, S271–S273. [Google Scholar] [CrossRef]
- Kommalapati, R.; Kadiyala, A.; Shahriar, M.; Huque, Z. Review of the Life Cycle Greenhouse Gas Emissions from Different Photovoltaic and Concentrating Solar Power Electricity Generation Systems. Energies 2017, 10, 350. [Google Scholar] [CrossRef]


| Country | Average | Minimum (kWh/m2. Day) | Maximum | Area (Thousand. km2) |
|---|---|---|---|---|
| Germany | 2.95 | 2.47 | 3.42 | 357.02 |
| France | 3.49 | 2.47 | 4.52 | 643.97 |
| England | 2.73 | 2.36 | 3.10 | 130.39 |
| Brazil | 5.50 | 4.25 | 6.75 | 8515.77 |
| (1) | (2) | (3) | (4) | (5) | (6) | (7) | (8) | (9) | (10) | |
|---|---|---|---|---|---|---|---|---|---|---|
| Location | ||||||||||
| City and state | Assú/RN | Ubajara/CE | Jaraguá do Sul/SC | Rio Verde/GO | Campo Novo do Parecis/MT | São José do Mipibu/RN | Jaraguá do Sul/SC | Cacique Doble/RS | Itajaí/SC | Campo Mourão/PR |
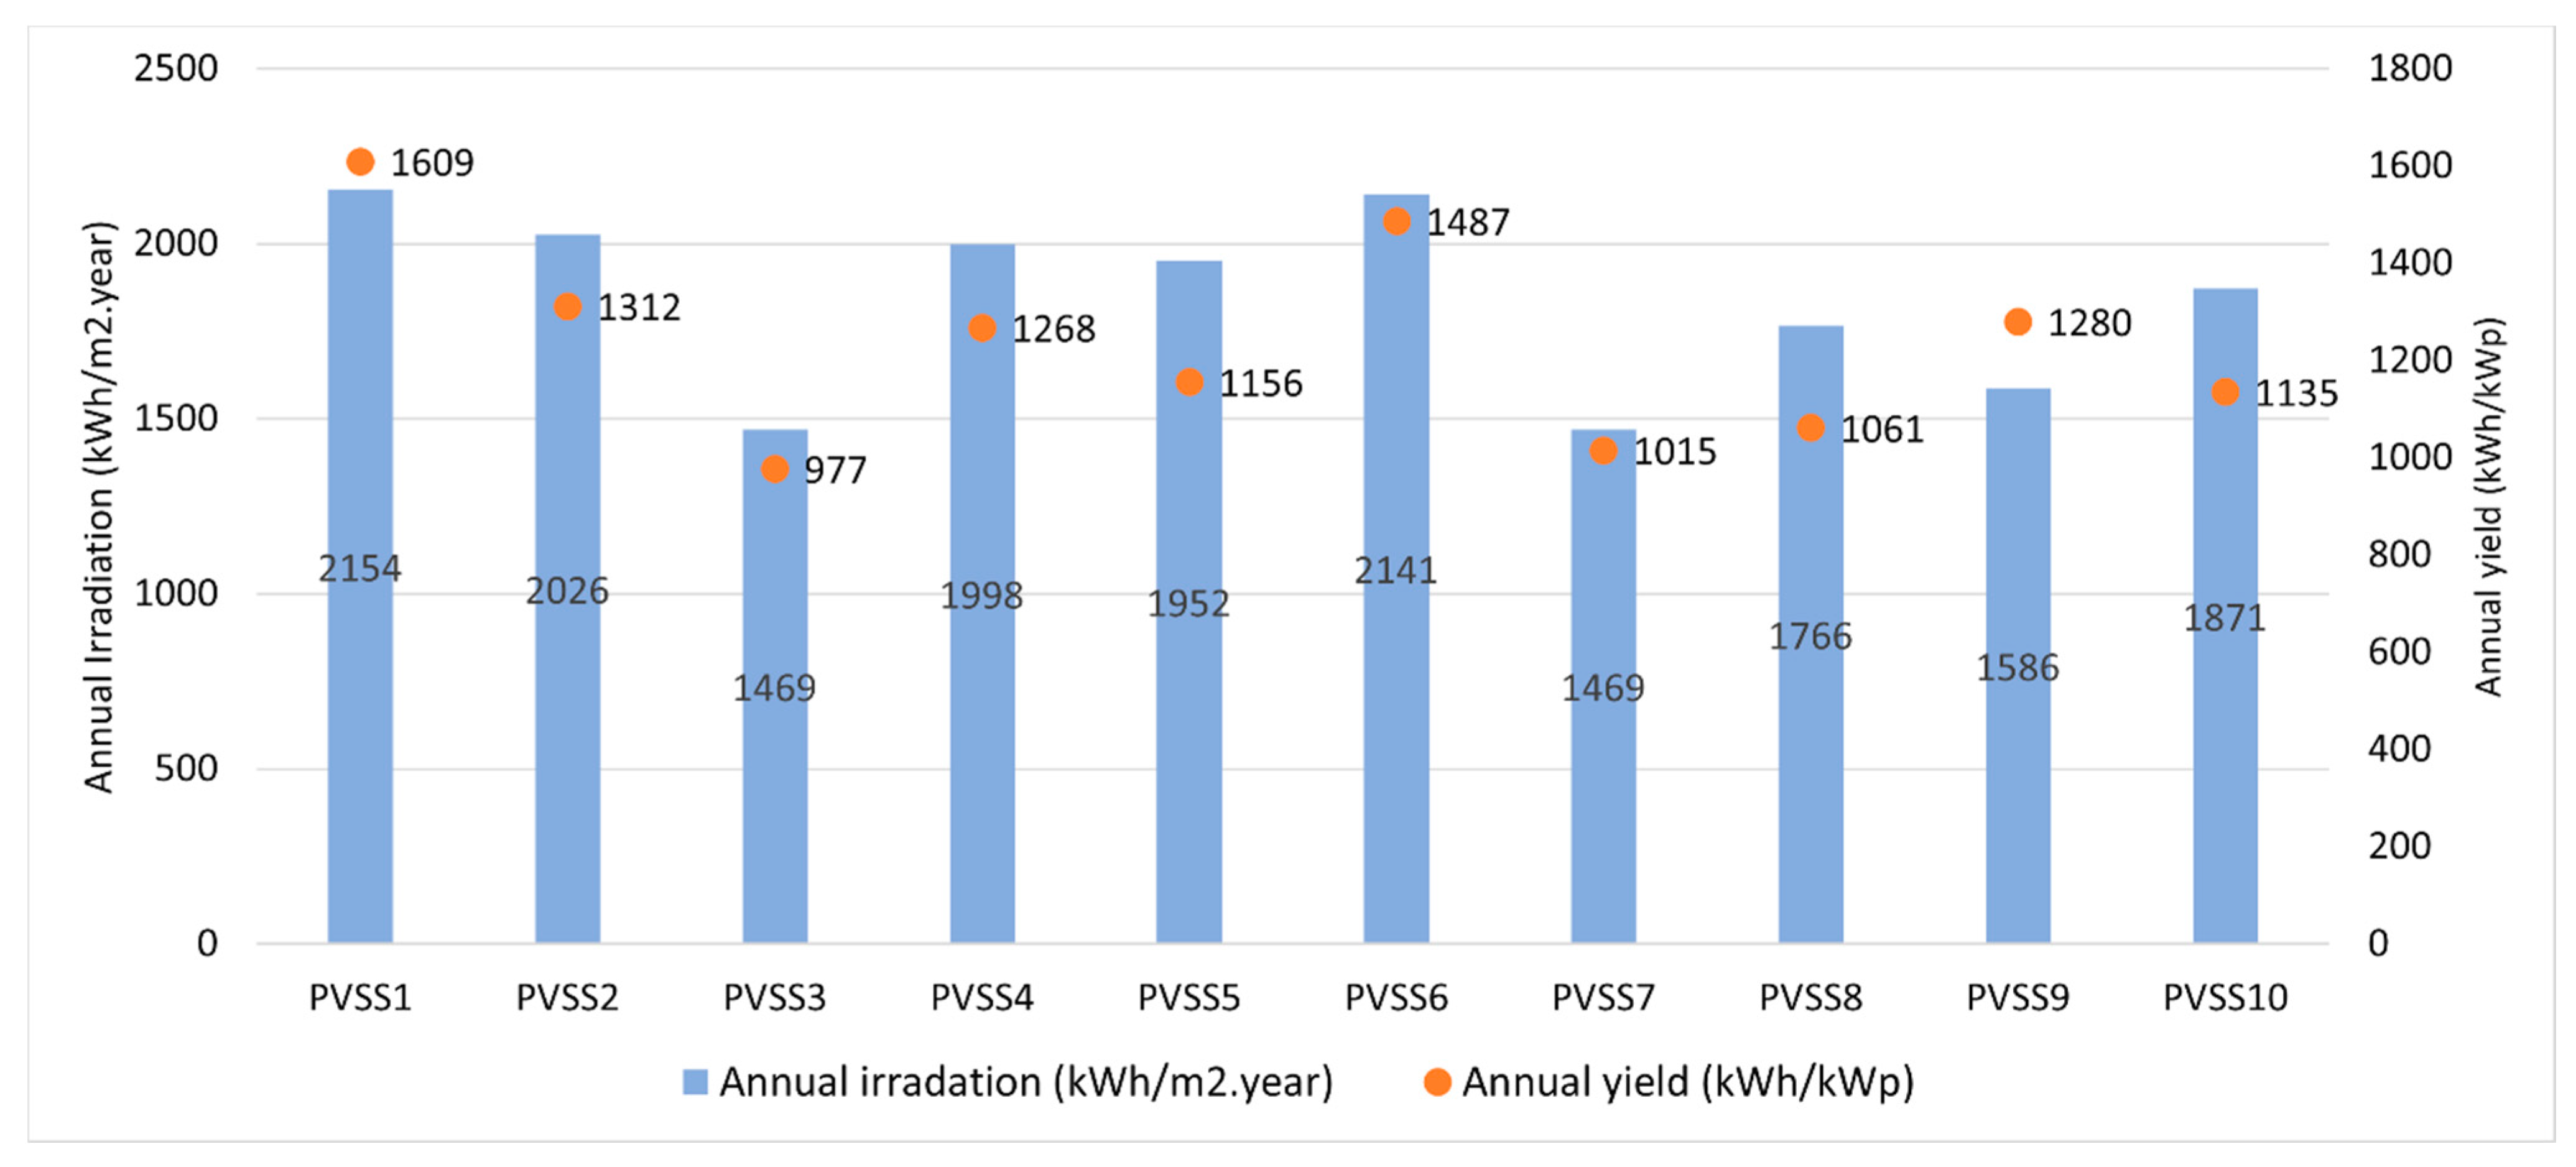
| Annual irradiation (kWh/m2.year) | 2154 | 2026 | 1469 | 1998 | 1952 | 2141 | 1469 | 1766 | 1586 | 1871 |
| Installed PVcapacity | ||||||||||
| (kWp) | 108 | 51.5 | 77 | 65 | 140 | 72 | 70 | 52 | 77 | 52 |
| Annual electricity generation | ||||||||||
| Annual Total (MWh) | 173.8 | 67.5 | 75.3 | 82.4 | 161.7 | 106.4 | 71.3 | 55.2 | 98.8 | 59.0 |
| Annual Yield (kWh/kWp) | 1609 | 1312 | 977 | 1268 | 1156 | 1487 | 1015 | 1061 | 1280 | 1135 |
| Energy | Emissions CO2-eq | GHGe-Rate | |||||||
|---|---|---|---|---|---|---|---|---|---|
| Required | Annual Converted | Payback | Avoided | Generated | Payback | NIS | |||
| PVSS | (GJp) | (GJp) | (Years) | (tCO2-eq) | (tCO2-eq) | (Years) | (gCO2-eq/kWh) | 2018 | 2020 |
| 1 | 2695.06 | 1001.06 | 2.69 | 279.34 | 184.29 | 16.49 | 42.42 | 73.98 | 63.9 |
| 2 | 1334.65 | 388.97 | 3.43 | 108.54 | 91.41 | 21.05 | 54.14 | ||
| 3 | 2030.93 | 433.48 | 4.69 | 120.96 | 135.02 | 27.91 | 71.76 | ||
| 4 | 1683.79 | 474.67 | 3.55 | 132.45 | 112.49 | 21.23 | 54.60 | ||
| 5 | 3551.78 | 931.38 | 3.81 | 259.89 | 240.39 | 23.12 | 59.47 | ||
| 6 | 1818.74 | 612.69 | 2.97 | 170.96 | 124.51 | 18.21 | 46.82 | ||
| 7 | 1754.37 | 410.57 | 4.27 | 114.57 | 116.37 | 25.39 | 65.31 | ||
| 8 | 1289.51 | 317.82 | 4.06 | 88.69 | 85.86 | 24.20 | 62.24 | ||
| 9 | 1998.75 | 569.27 | 3.51 | 165.89 | 132.71 | 20.00 | 53.71 | ||
| 10 | 1347.53 | 340.08 | 3.96 | 99.10 | 89.65 | 22.62 | 60.74 | ||
| Emissions CO2-eq | ||||
|---|---|---|---|---|
| Avoided | Generated | Payback | ||
| PVSS | (tCO2-eq) | (tCO2-eq) | (Years) | (g CO2-eq/kWh) |
| 1 | 890.7 | 219.49 | 6.16 | 50.5 |
| 2 | 346.1 | 108.69 | 7.85 | 64.4 |
| 3 | 385.7 | 165.43 | 10.72 | 87.9 |
| 4 | 422.3 | 137.1 | 8.12 | 66.6 |
| 5 | 828.7 | 289.3 | 8.73 | 71.6 |
| 6 | 545.1 | 148.1 | 6.79 | 55.7 |
| 7 | 365.3 | 142.9 | 9.78 | 80.2 |
| 8 | 282.8 | 105.0 | 9.28 | 76.1 |
| 9 | 529.0 | 162.8 | 7.69 | 65.9 |
| 10 | 316.0 | 109.8 | 8.68 | 74.4 |
Publisher’s Note: MDPI stays neutral with regard to jurisdictional claims in published maps and institutional affiliations. |
© 2021 by the authors. Licensee MDPI, Basel, Switzerland. This article is an open access article distributed under the terms and conditions of the Creative Commons Attribution (CC BY) license (http://creativecommons.org/licenses/by/4.0/).
Share and Cite
Lima, G.C.d.; Toledo, A.L.L.; Bourikas, L. The Role of National Energy Policies and Life Cycle Emissions of PV Systems in Reducing Global Net Emissions of Greenhouse Gases. Energies 2021, 14, 961. https://doi.org/10.3390/en14040961
Lima GCd, Toledo ALL, Bourikas L. The Role of National Energy Policies and Life Cycle Emissions of PV Systems in Reducing Global Net Emissions of Greenhouse Gases. Energies. 2021; 14(4):961. https://doi.org/10.3390/en14040961
Chicago/Turabian StyleLima, Gabriel Constantino de, Andre Luiz Lopes Toledo, and Leonidas Bourikas. 2021. "The Role of National Energy Policies and Life Cycle Emissions of PV Systems in Reducing Global Net Emissions of Greenhouse Gases" Energies 14, no. 4: 961. https://doi.org/10.3390/en14040961
APA StyleLima, G. C. d., Toledo, A. L. L., & Bourikas, L. (2021). The Role of National Energy Policies and Life Cycle Emissions of PV Systems in Reducing Global Net Emissions of Greenhouse Gases. Energies, 14(4), 961. https://doi.org/10.3390/en14040961