Innovative Methodology to Identify Errors in Electric Energy Measurement Systems in Power Utilities
Abstract
1. Introduction
- Theft of energy: Any type of illegal connection that is made before the energy meter so that the connected load consumptions are not recorded by the measurement equipment.
- Handling of the measuring equipment: Voluntary alterations to the measuring equipment resulting in the registration of less consumption than the real one.
- Measurement errors: Involuntary technical failures of measurement devices that produce the wrong recordings, such as:
- –
- Damage to the components of the measurement system in direct and indirect connection, the meter, current transformers, potential transformers, terminal blocks, and connection cables.
- –
- Human error in taking the reading or failure of the telemetry equipment.
- –
- Incorrect configuration of the energy meter.
- –
- Unintentional errors in the connection of the measurement system installation.
- Billing errors: They occur when the energy consumed is not recorded in the billing system of the distribution company due to damage to the components of the metering system.
- Development of a methodological study based on suitable indicators that integrate and take advantage of the different technologies for data analytics, machine learning, and neural networks. These results of the study were tested with real utility data related to customers’ consumption patterns. This study yields a list of potentially manipulated measurement equipment to be reviewed under the planning of the power utility.
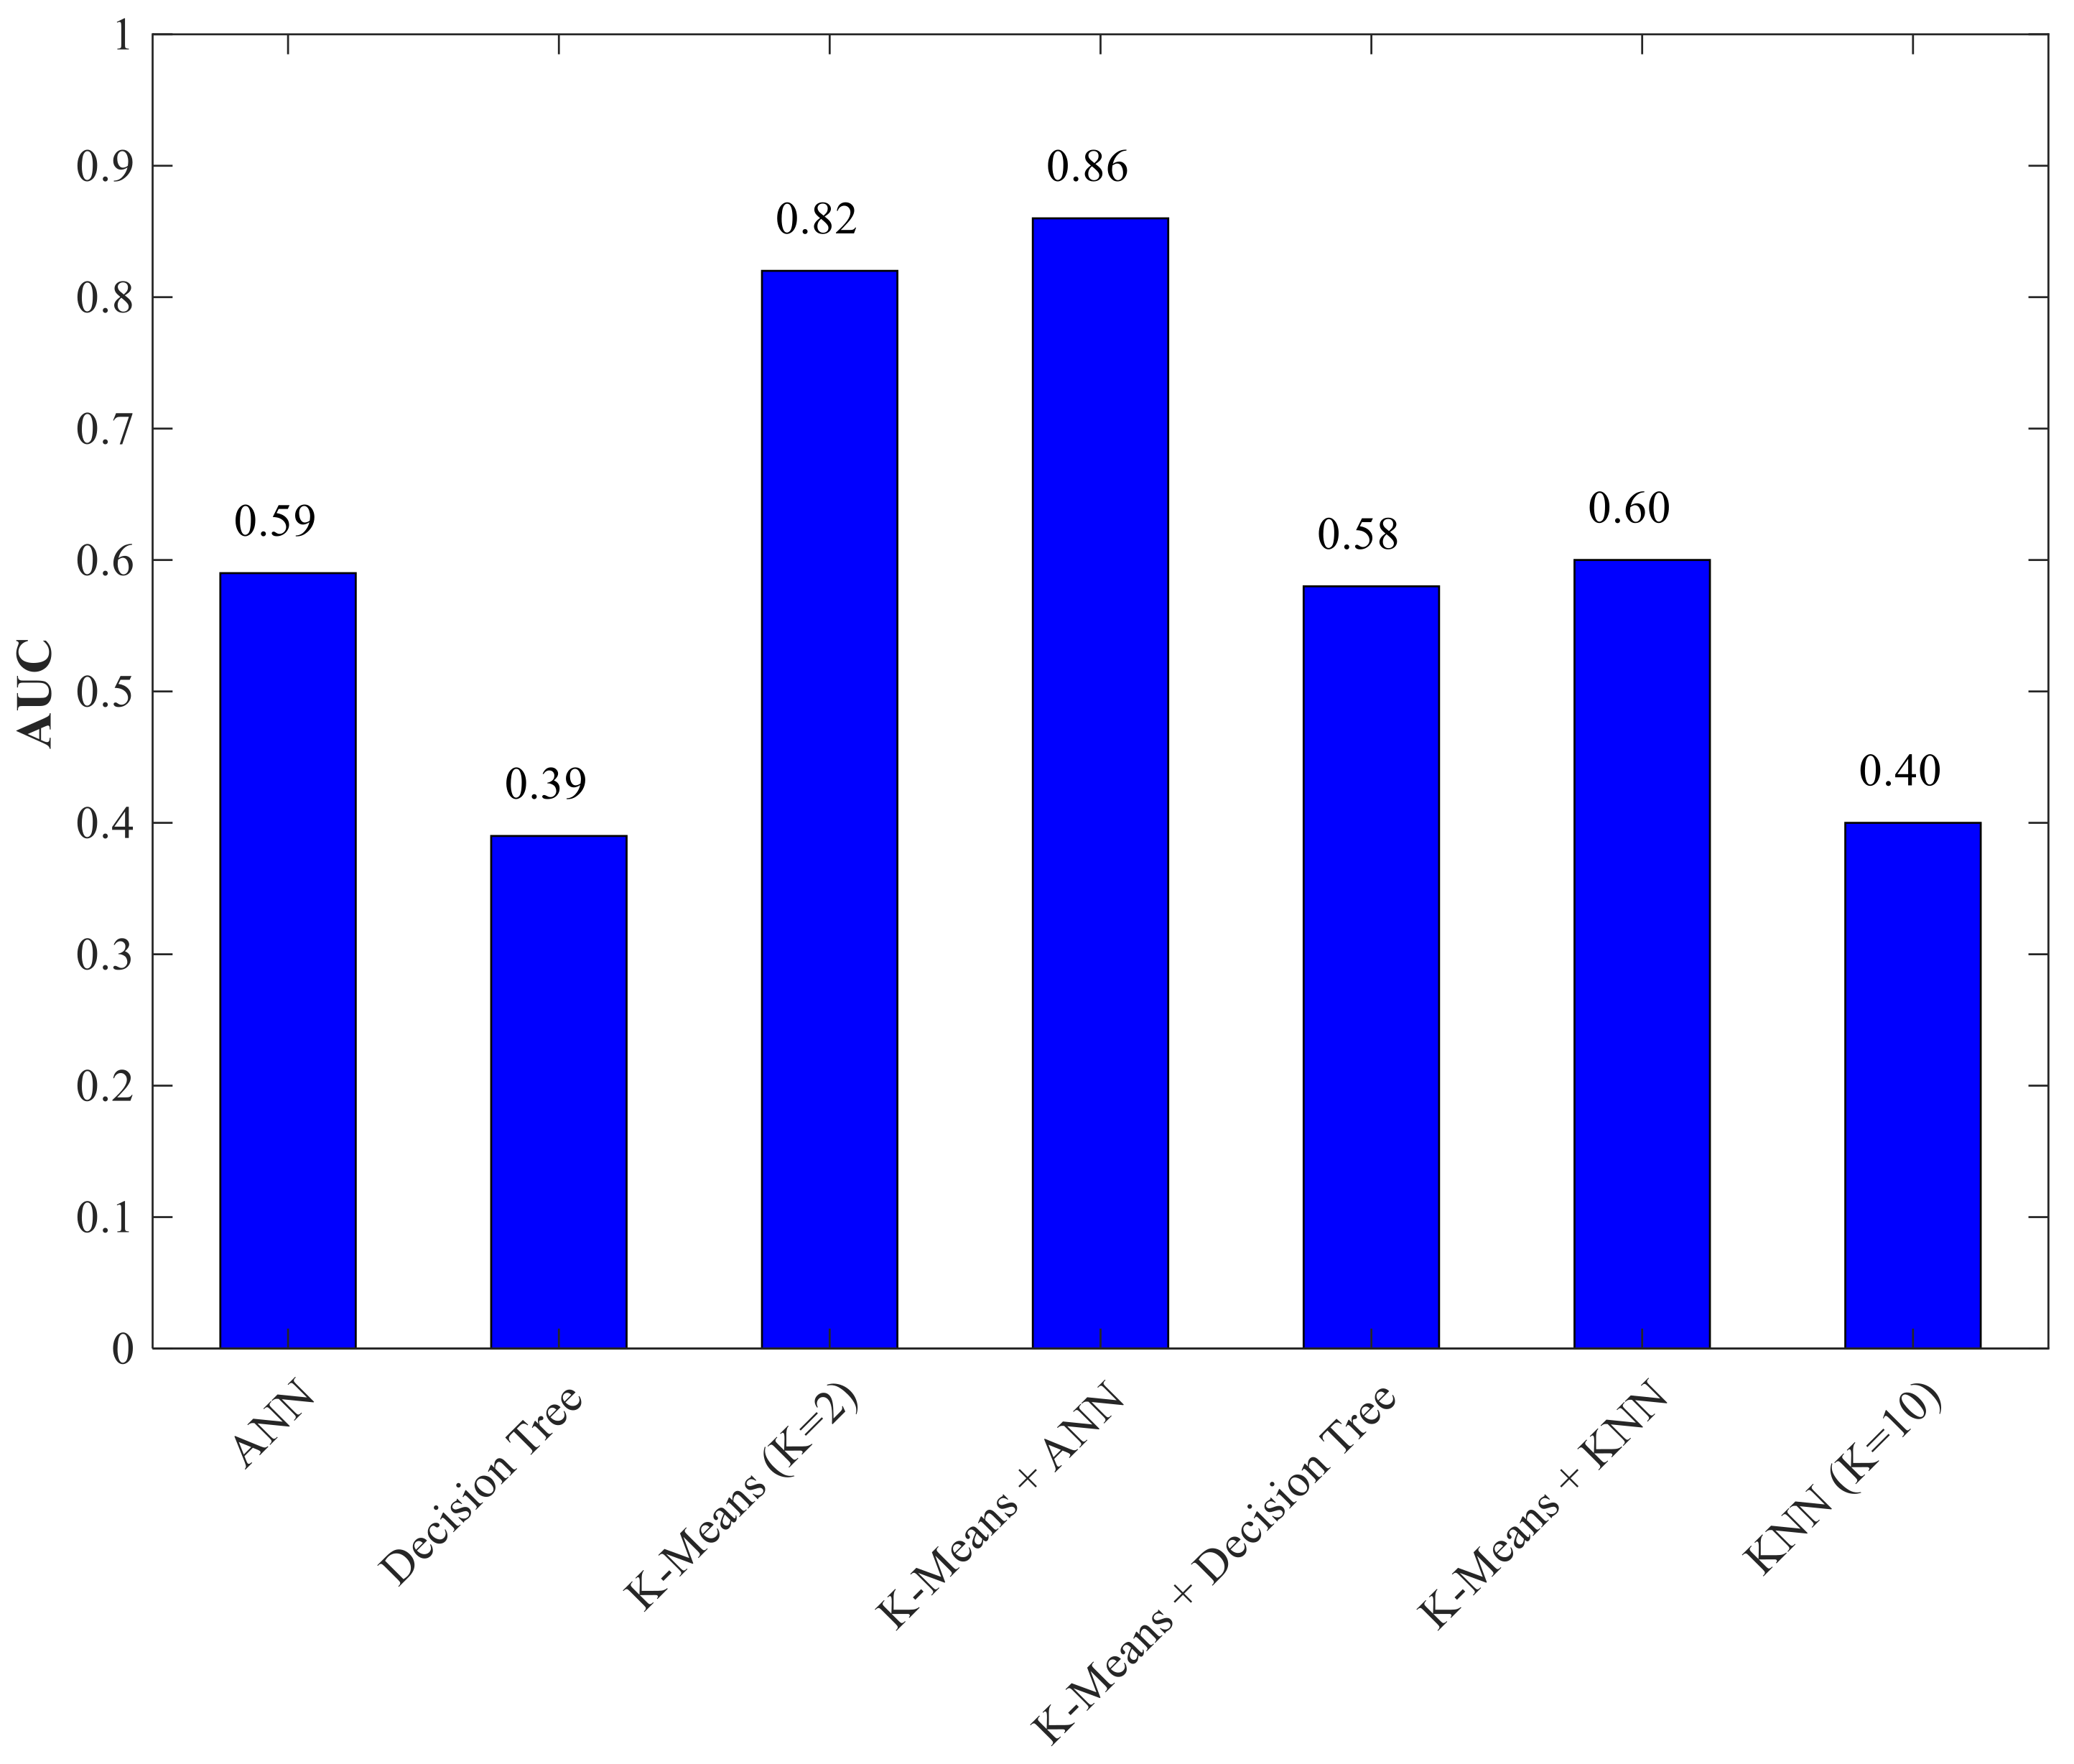
- The study allows identifying which technique gives the best result, denoting the precision of each of these, with the support of data science, processed through the use of the computational tool MATLAB® for the construction of algorithms, in such a way that contributes to the objective of reducing non-technical losses and maximizing economic utility incomes.This document is structured as follows: Section 2 considers the current state-of-the-art, providing a deep insight into the theoretical concept of the evaluated methods for the determination of NTLs. Section 3 shows the process of data analytics and the application of the algorithms. Section 4 presents the results of the methodology for the proposed analytic methods’ evaluation and comparison. Section 5 shows the results of the implementation of the methodology in a real system. Finally, in Section 6, the technical and economic effects are discussed and concluded.
2. Techniques Applied in Data Mining
- Theoretical study: This focuses on analyzing aspects related to energy theft through the use of statistical techniques with socio-demographic and socio-economic variables to build potential lists of suspected infractions for the reviewed measurement systems; The disadvantage of theoretical studies is that they do not present specific cases of theft or the failure of the measuring equipment [20].
- Data-oriented methods: These methods focus on data analytics, for example the pattern of energy consumption and demand. By applying data mining techniques, the consumers with high error probability are identified [20,22].Learning with data mining techniques is classified into:
- (a)
- Supervised learning: These are algorithms that learn by example, require input data, and provide output data with the variables that the data scientist needs; that is, he/she must give instances on properly labeled data (positive/fraud and negative/no fraud). This method requires a large amount of quality information to apply the model; the electricity distribution company must have data labeled with the variables of fraud and not fraud [20,22].
- (b)
- Network-oriented methods: These methods are based the acquisition of data through the management of proprietary software and hardware installed in the electrical network, in such a way as to facilitate the identification or estimation of non-technical losses after a data analytics process through an algorithm that minimizes error and loss of information.
| Methodology | Concept | Algorithm-Method | Reference |
|---|---|---|---|
| Theoretical study | [17,24,25,26] | ||
| Data-oriented methods | Supervised learning | Nearest neighbor (k-NN) | [27,28] |
| Decision trees | [4,5,6,27,28,29,30,31] | ||
| Artificial neural network (ANN) | [3,31,32,33,34,35,36] | ||
| Support vector machine (SVM) | [29,32,35] | ||
| Optimum path forest (OPF) | [10,27,37] | ||
| Bayesian classifiers | [5,6,27] | ||
| Rule induction | [4,5,11,12,33,38] | ||
| Unsupervised learning | Self organizing map (SOM) | [31,38] | |
| Cluster K-means | [21,38,39] | ||
| Cluster K-menoids | [21] | ||
| Regression models | [27,35] | ||
| Fuzzy c-means | [38,40,41] | ||
| Outlier detection | [38,42] | ||
| Network-oriented methods | [16,19,43,44,45] | ||
| Hybrid methods | Observer meter-SVM | [46,47] | |
| Smart meter-SVM | [48] | ||
| Smart meter-observer meter- maximum information coefficient (MIC) -clustering technique | [49] |
2.1. Unsupervised Techniques
2.2. Supervised Techniques
2.2.1. K-Nearest Neighbors
2.2.2. Decision Tree
2.2.3. Artificial Neural Network
- Training stage: This is the learning stage where the input attributes (network input) can be added and compared with the target set (label or target).
- Validation stage: This stage is executed in conjunction with the training stage and is carried out to avoid over-training the network.
- Testing stage: This stage is carried out after the training stage and consists of using a set of data other than those of the training and validation stage to investigate how well the network learned at the end of the process.
3. Methodological Construction of the Matrix and Data Analysis
3.1. Data Collection and Integration
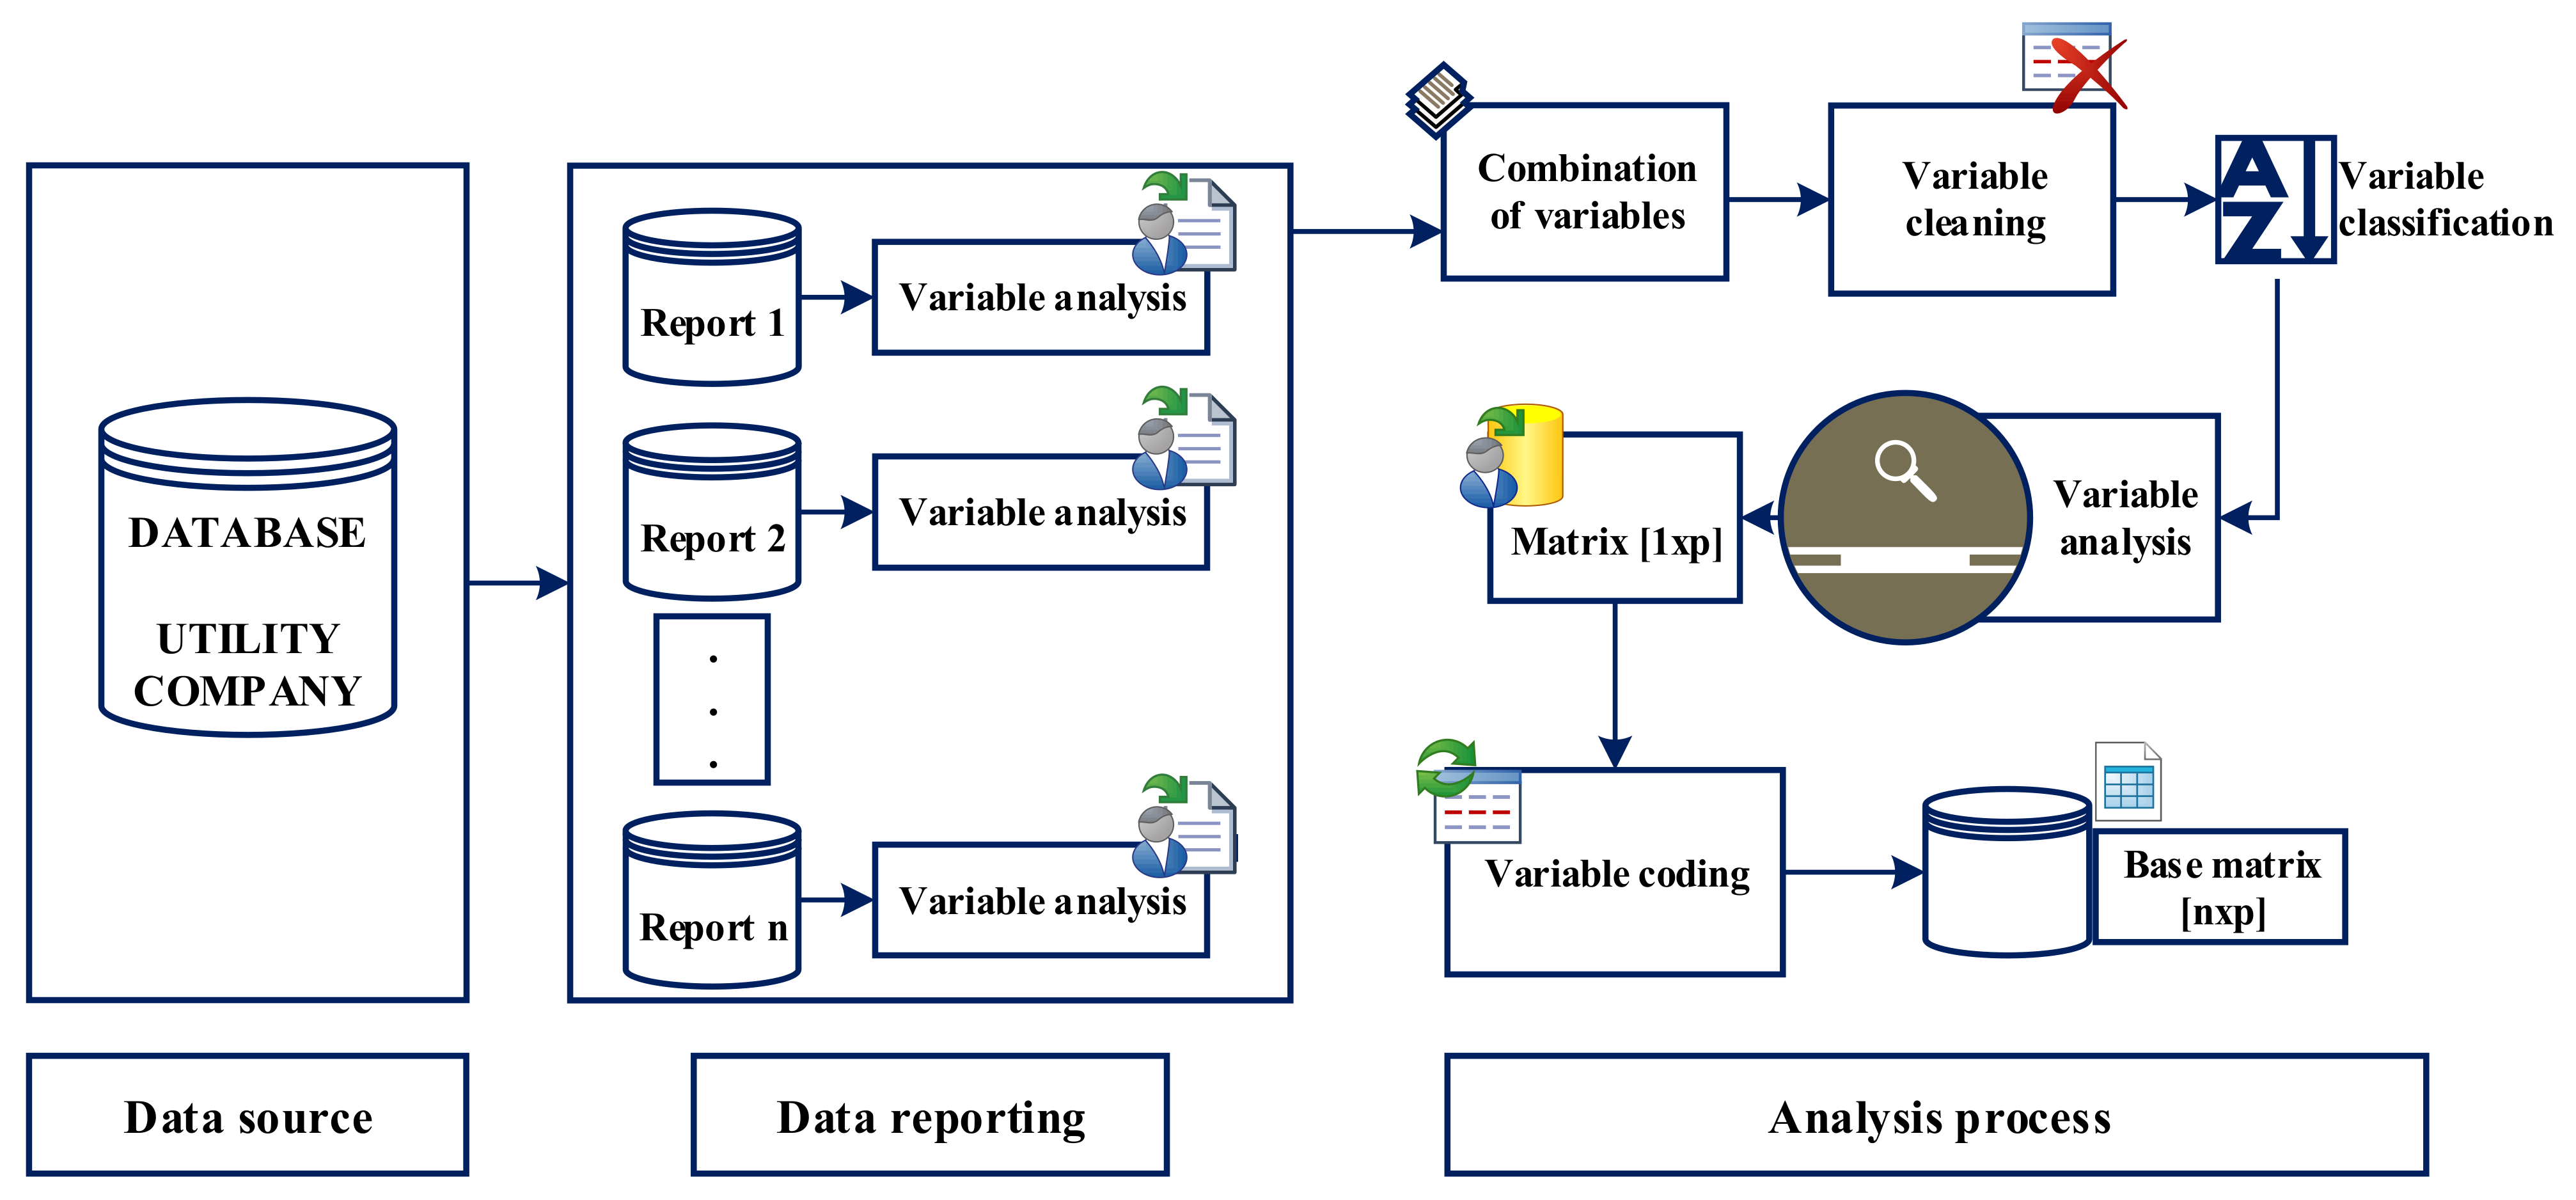
- Integration of the data set: In this step, this is the most important or relevant data in the search; allows determining the NTL according to the history of consumption, demands, consumer characteristics, and type of meter.
- Variable analysis: The variables of each report are analyzed, understanding that they describe the type of information each variable contains.
- Combination of variables: All the reports are joined, obtaining 424 variables in this investigation.
- Variable cleaning: Variables with the same name and with different names, but with the same information content are eliminated because they do not contribute to the model and increase the computation time of the algorithm and the error in the result. Once completed, these steps have 318 variables.
- Classification of the variables: The variables are classified as follows:
- Information: Those variables that provide consumer information, such as: “contracted account”, “account”, “name”, and “ID.”
- Geographic: Variables that indicate the geographic location of the customer’s meters, such as: “Codparr”, “province”, and “canton.”
- Economic: Variables that show the economic relationship between the customer and the distribution company, such as: “date last paid”, “months due”, and “debt.”
- Social: Variables that indicate a social aspect concerning the client, such as “population.”
- Techniques: Technical variables, such as: “type consumption”, “voltage”, “consumption kWh/month.”
With the classified variables, the next step corresponds to the careful review of each variable to determine those that provide relevant information in the NTL detection and control algorithm. Subsequently, with the correlation analysis of the variables and the “expert’s criteria”, each variable is meticulously analyzed to establish the number and magnitude of the variables that will provide information to this research methodology. After completing this step, we have 68 variables: a matrix [1 × 68] that eliminates approximately 84% of the variables that do not contribute, repeat, or have a high variation coefficient. Steps 2, 3, 4, and 5 are developed under the supervision of an expert. - Data coding: As the variables that make up the [1 × 68] matrix were obtained from different reports, they do not have the same format; therefore, in this step, some variables are coded for the analysis.
- Base matrix: With the previously performed analysis, the n subscribers can be added, and the base matrix of size [n × p] is obtained; where n represents the number of customers; in a first approximation, a universe of 5615 consumers is taken (only for analysis); concluding with a base data matrix of [5615 × 68].
3.2. Data Pre-Processing
3.2.1. Recognition of Data
- All variables presented blank or null data.
- There exist large differences between the maximum and minimum values; there are even high percentages of the variation coefficients, generally occurring when the base matrix analyzed contains measurement systems with information of residential, commercial, and industrial consumers; therefore, consumption varies considerably. The data must be linearized and normalized to reduce these differences in values and avoid possible errors in training and executing the algorithms; this procedure is given in Section 3.2.3.
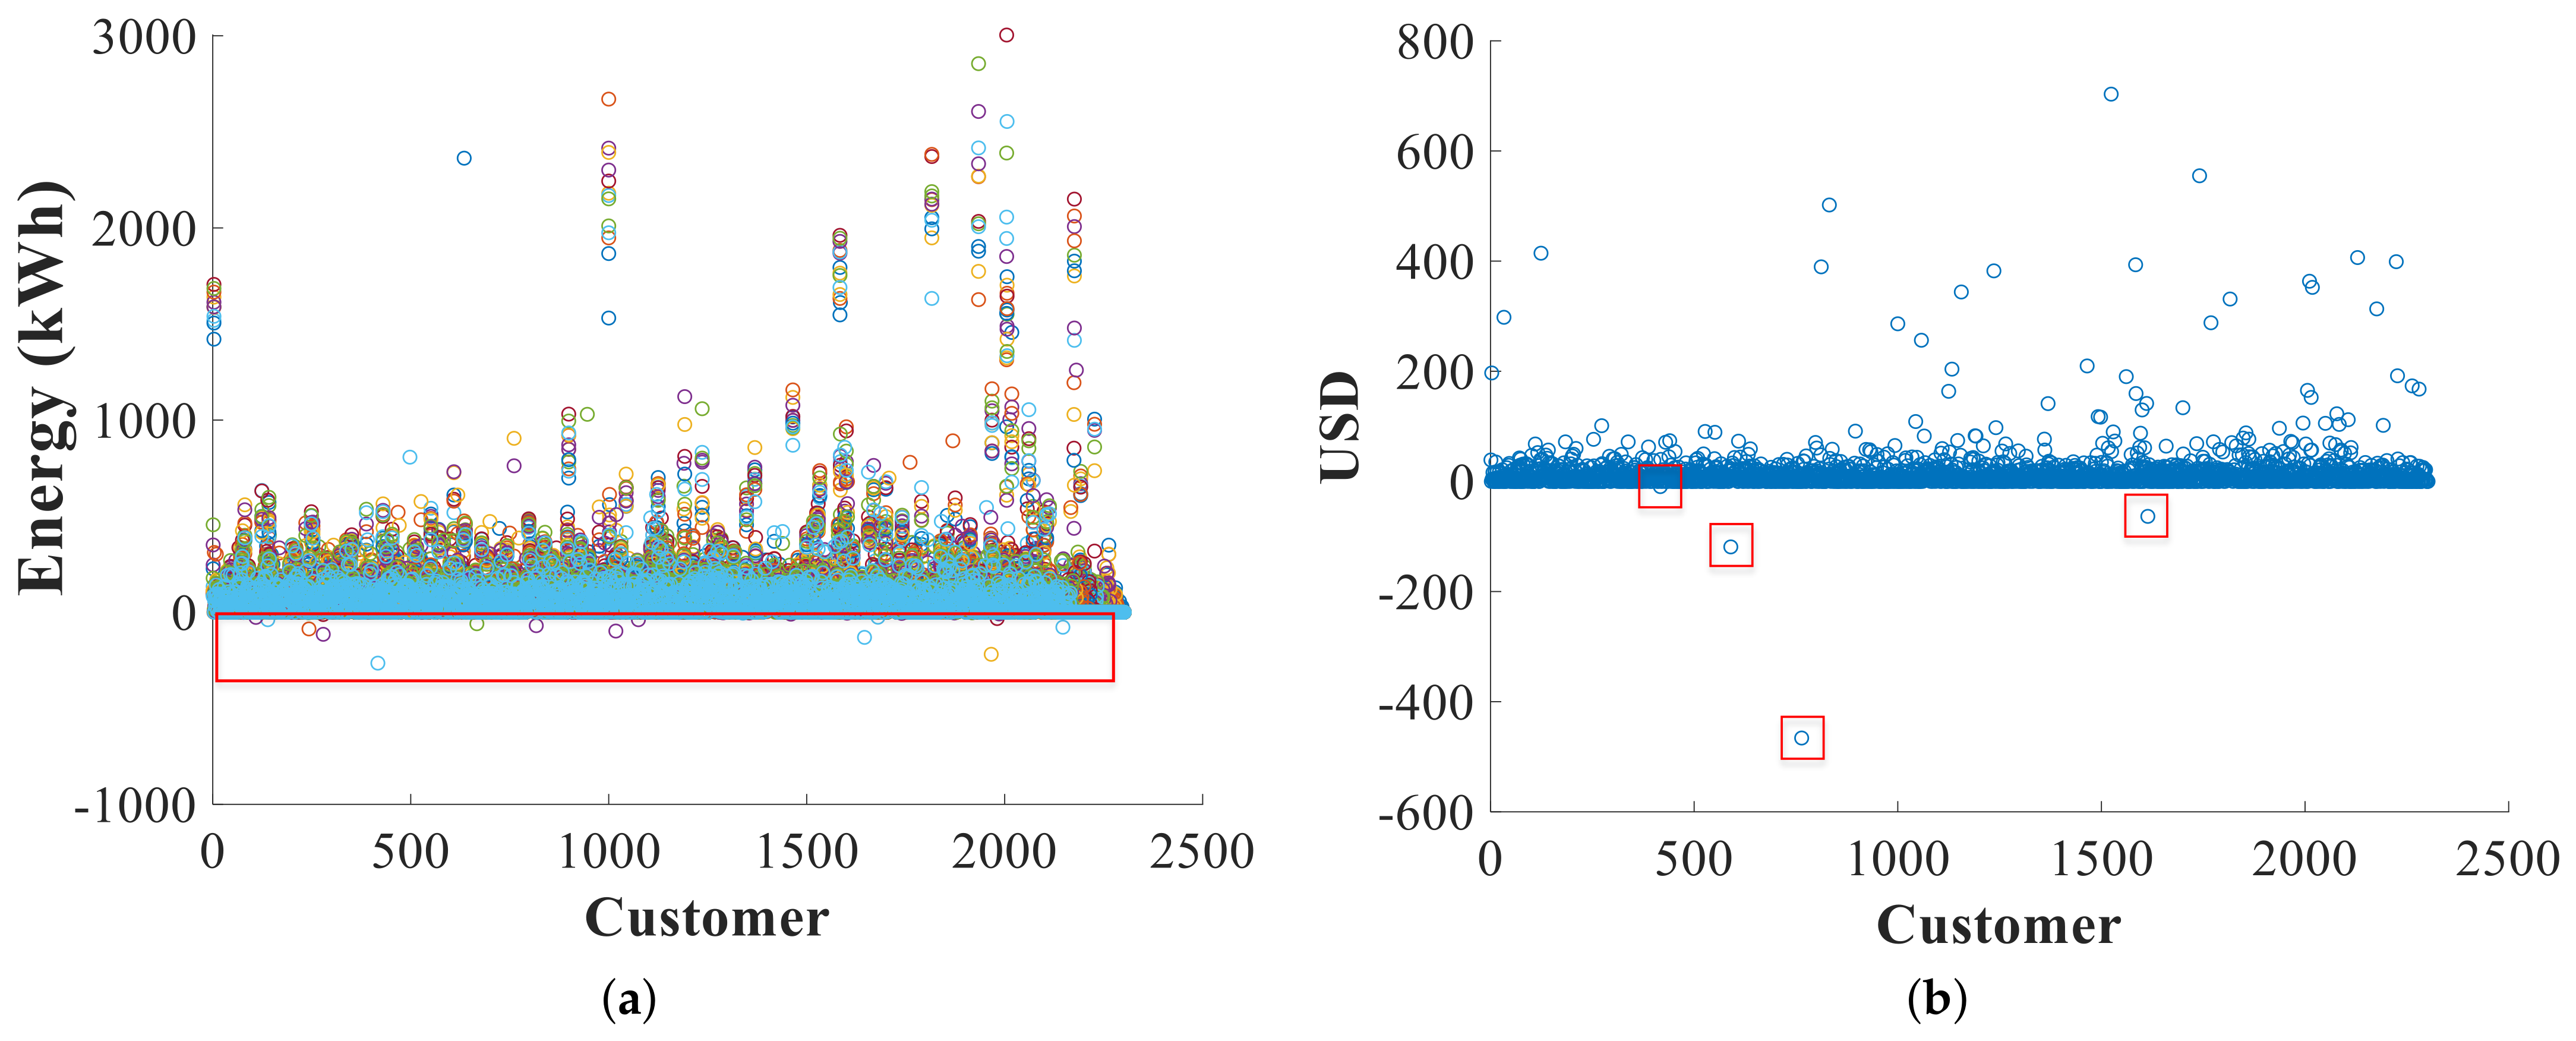
- Some variables have negative values; the distribution company states that they correspond to re-invoicing of the consumer due to reading errors or low application rates.
- The zero value for the mode in the consumption variables determines that there are measurement systems with zero consumption; it is essential to physically review this in field planning.
- There is a high difference between the maximum and minimum values; this must be considered when applying data mining techniques.
3.2.2. Data Cleaning
- Null or non-existent data are verified:
- –
- EXCEL recognizes the missing data as N/A.
- –
- MATLAB® recognizes non-existent data as NaN (not a number).
Those consumers that have null data in the technical variables are eliminated from the list. - Atypical data: Through exploratory data analysis, it is determined that the data that should have been considered inconsistent are the negative values in the technical variables; therefore, any consumer that has a negative value is eliminated from the list.
3.2.3. Data Normalization
- Maximum-minimum normalization: This is done by Equation (1).where:
- –
- is the new value
- –
- v is the value to normalize
- –
- is the maximum value of the data
- –
- is the minimum data value
- Z-score normalization: This is done by Equation (2)where:
- –
- is the new value
- –
- v is the value to normalize
- –
- is the data average
- –
- is the standard deviation of the data
3.3. Data Processing
3.3.1. Supervised Learning
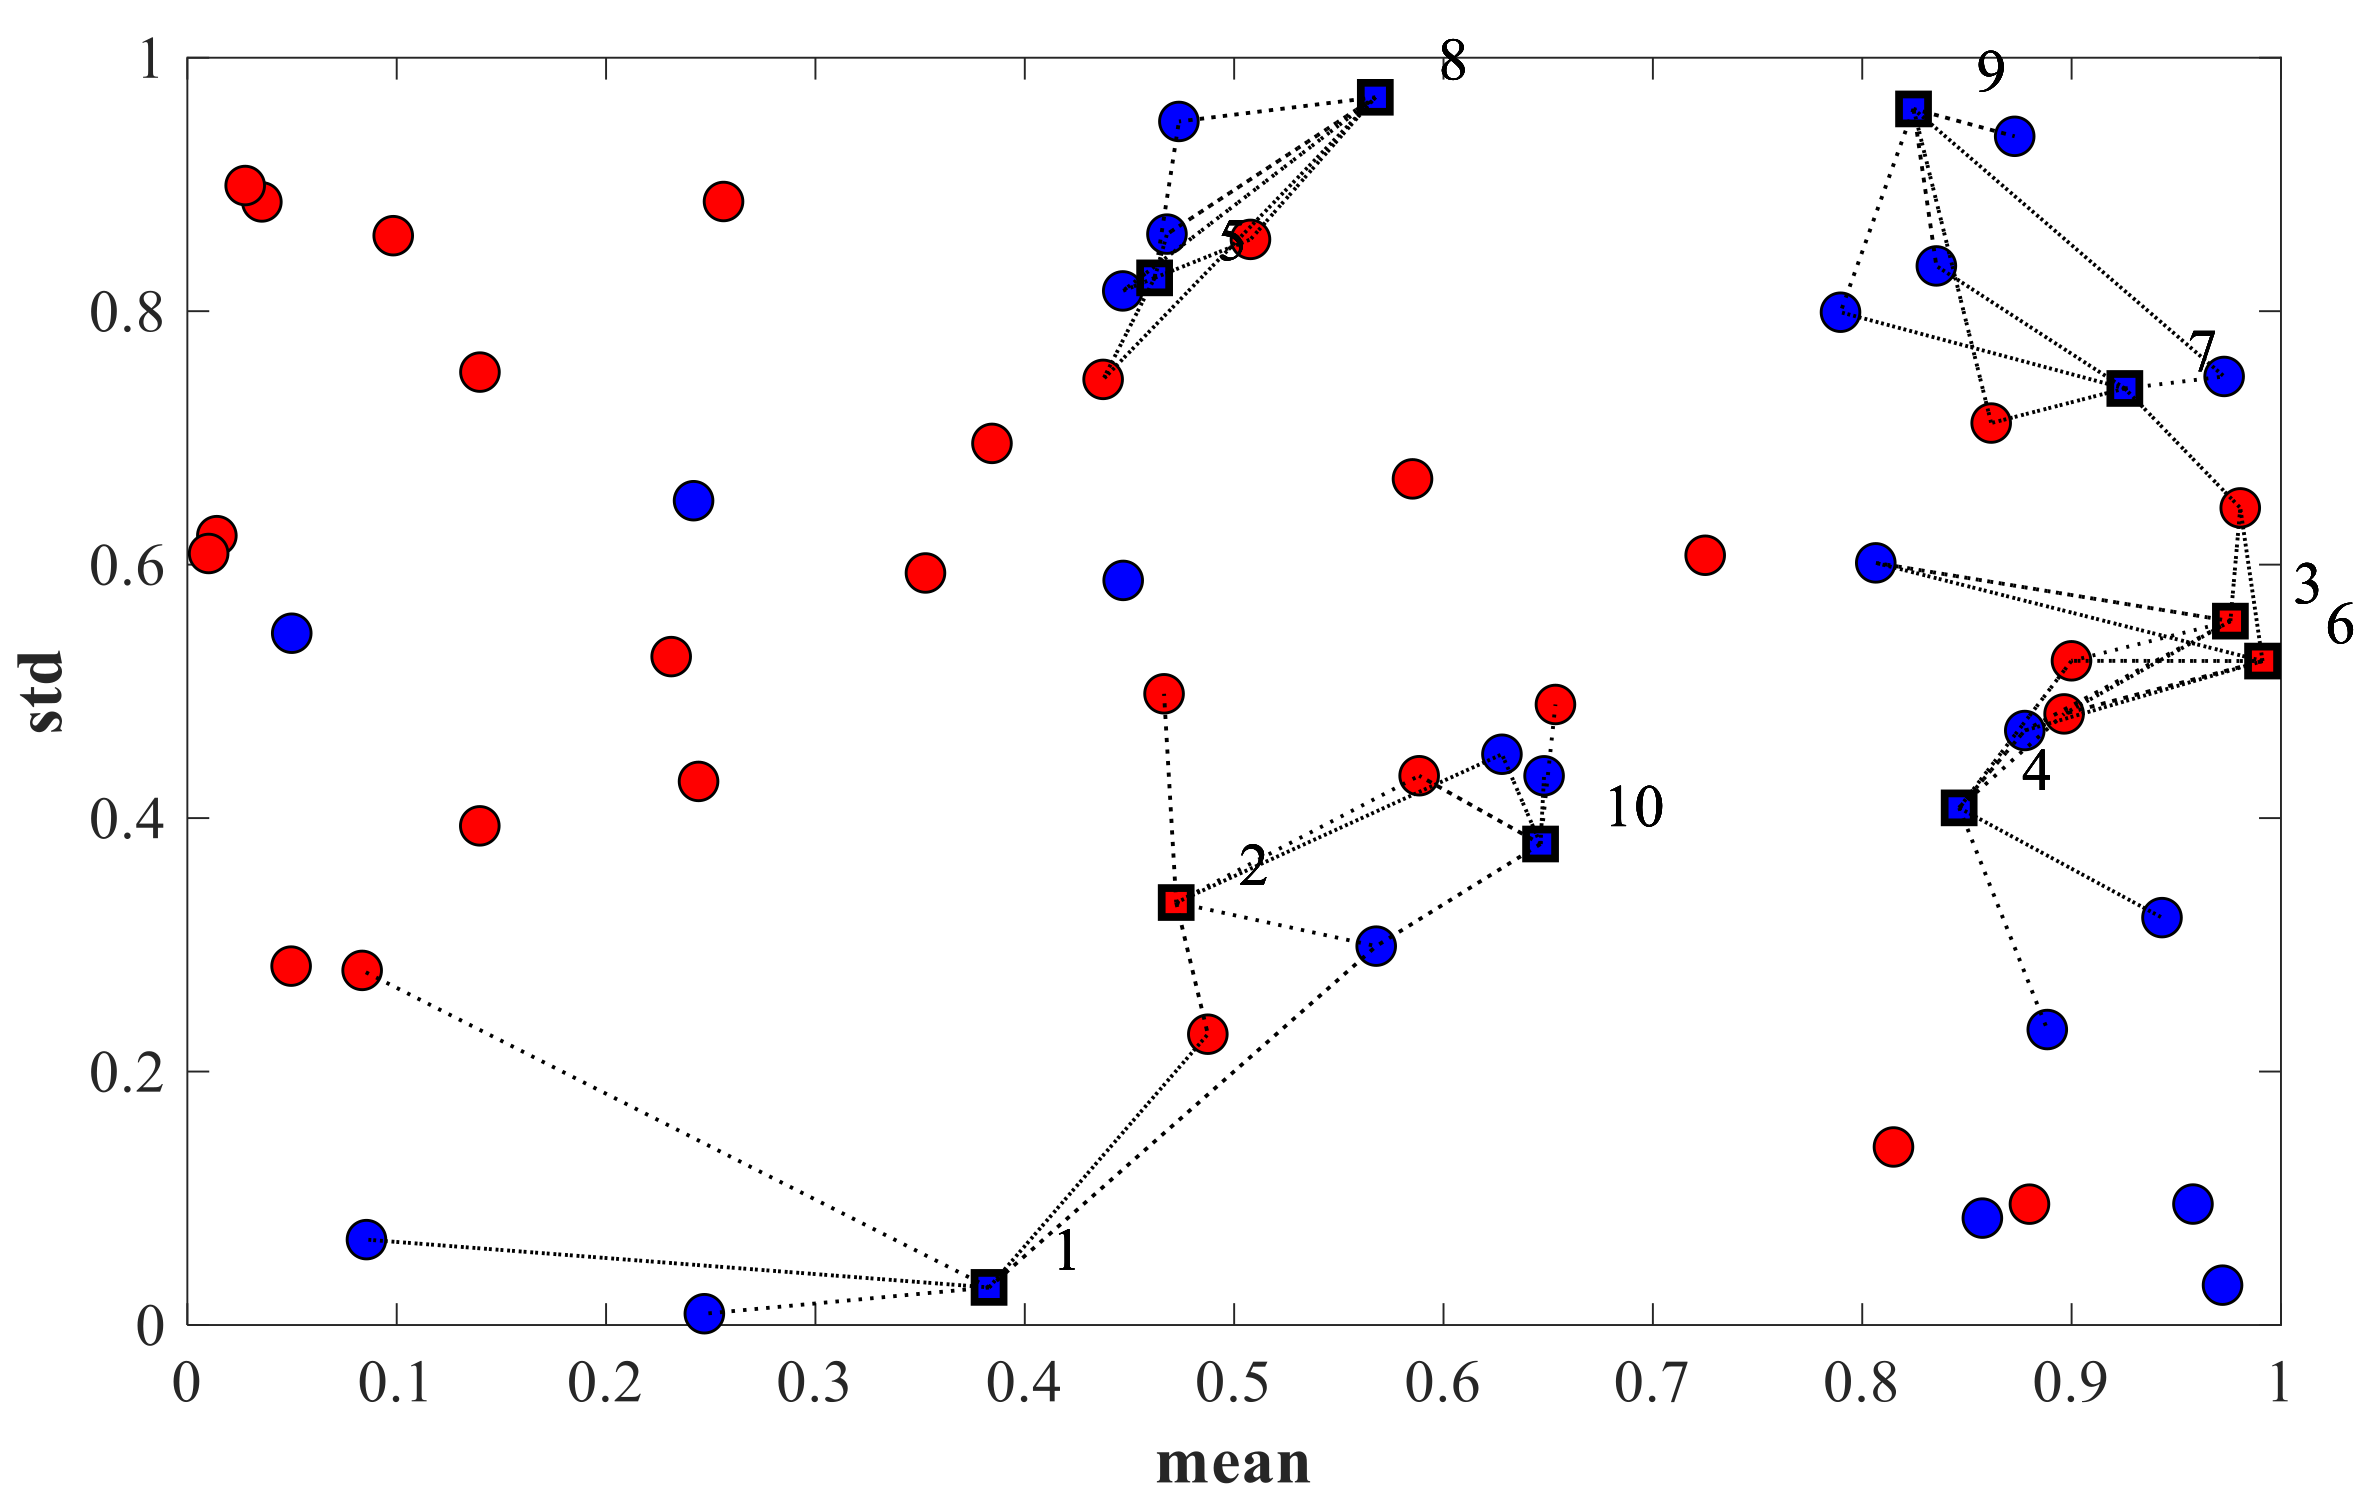
- Nearest neighbor (K-NN):The algorithm uses the MATLAB® tool; in Figure 4, the algorithm execution response is given. The training data represent a circular form, and the new data are in a grid form; in red color, data classified as “fraud” and in blue color “no fraud.” The K value is five, and the operation of this algorithm is simple; it calculates the distance of the most frequent nearest neighbors (in this case, five) and chooses the class.Before training this algorithm, the data are normalized with Equation (1).
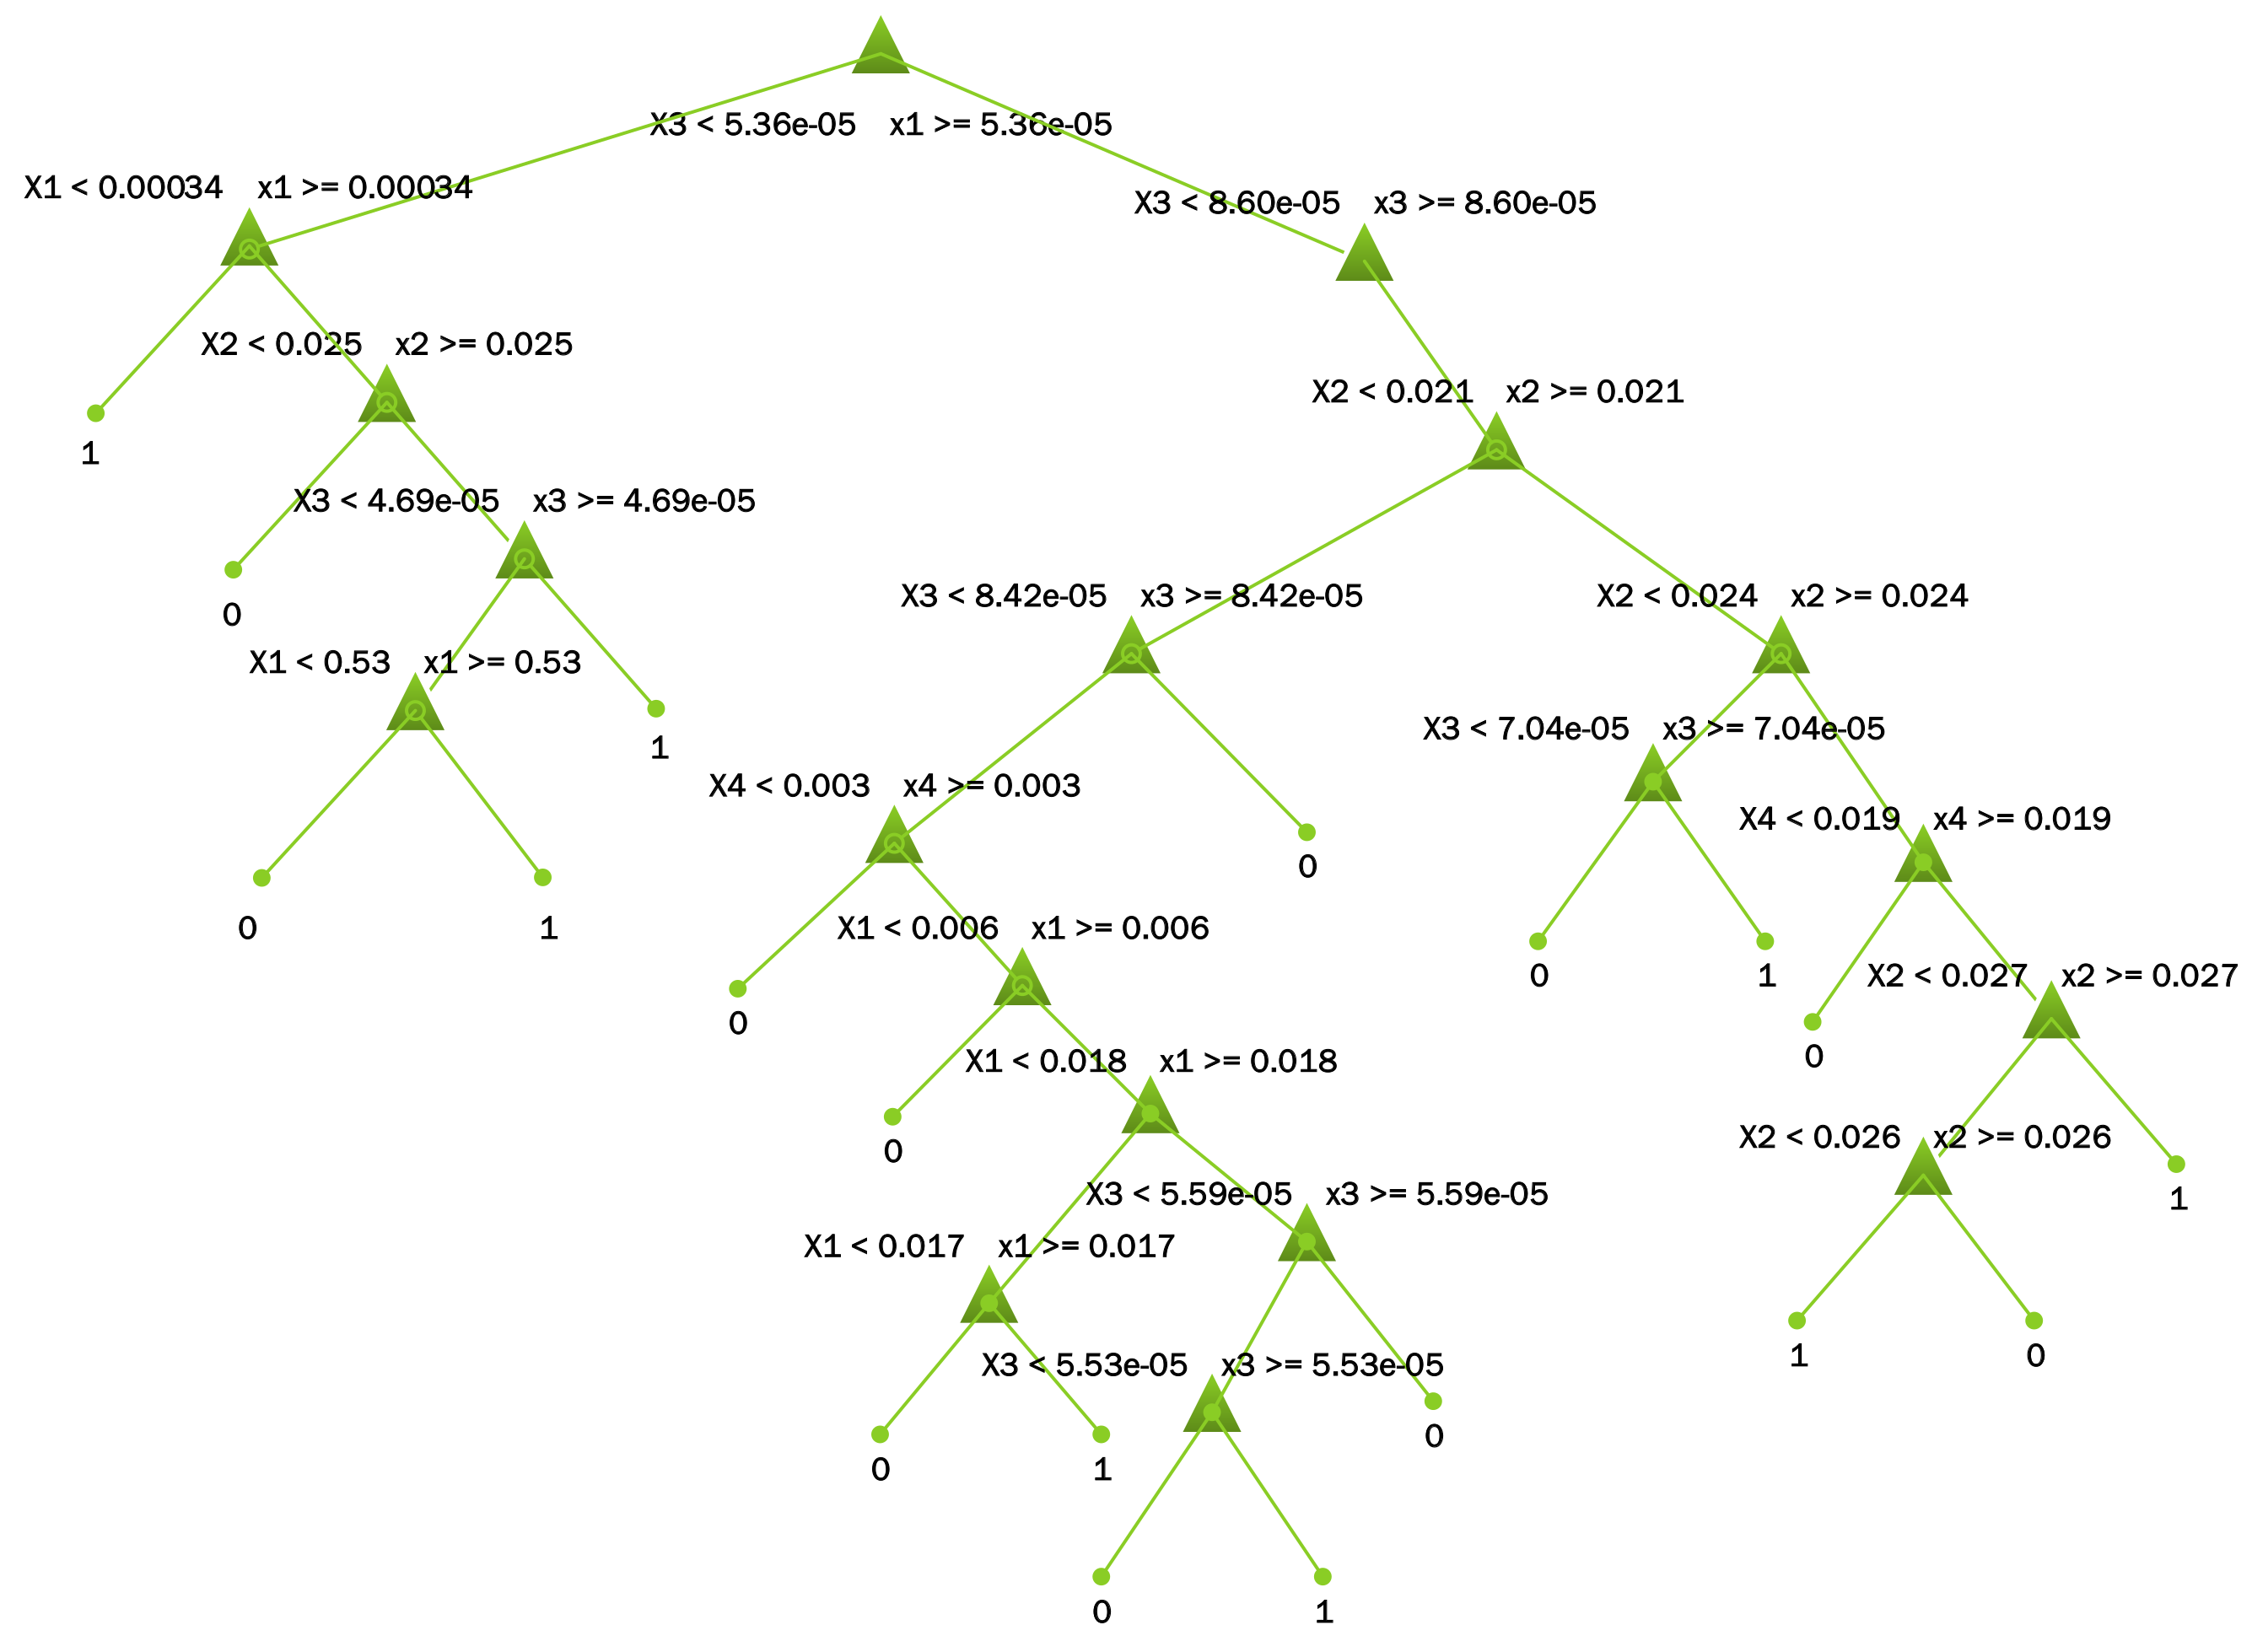
- Decision tree:
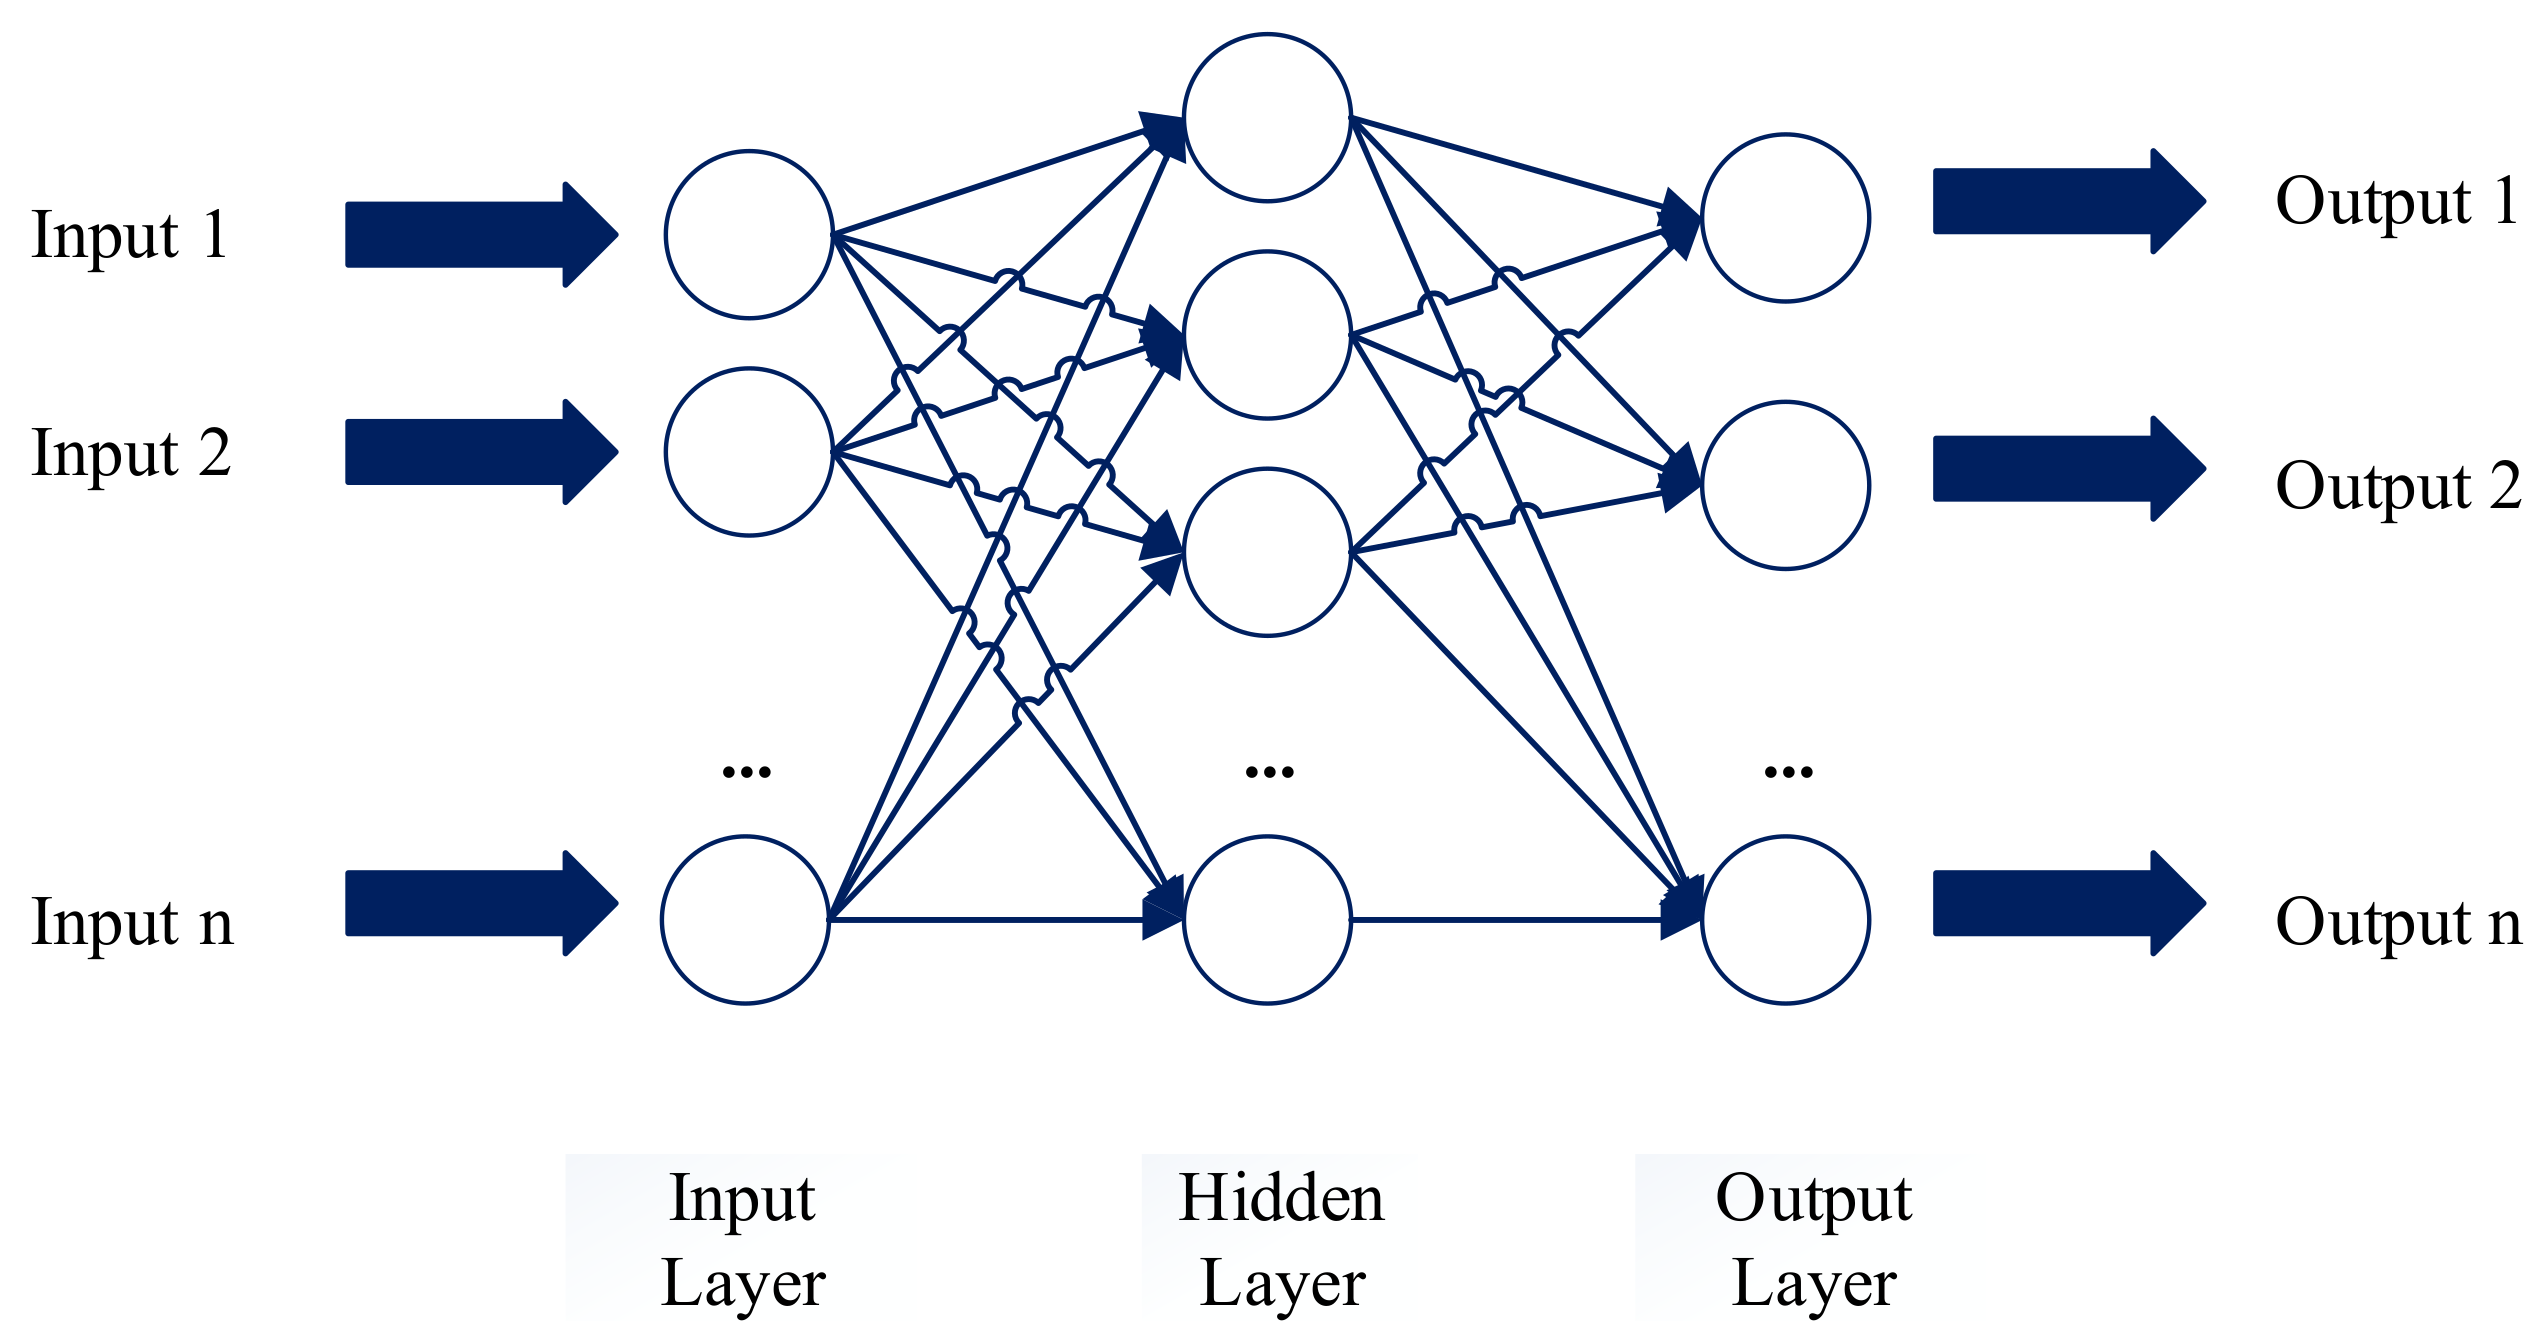
- Neural network (ANN):The creation and training of the artificial neural network occur using the Toolbox tool of MATLAB®, in which the perceptron multilayer neural network is used. The implemented neural network in Figure 6 shows an input layer with six variables; a hidden layer made up of 10 neurons and an output layer with one neuron for classification. The training algorithm is the Levenberg–Marquardt backpropagation, and the activation function is the sigmoidal one.The data are normalized with Equation (1) and randomly divided into three parts: 70% for training, 15% for validation, and 15% for testing.
3.3.2. Unsupervised Learning
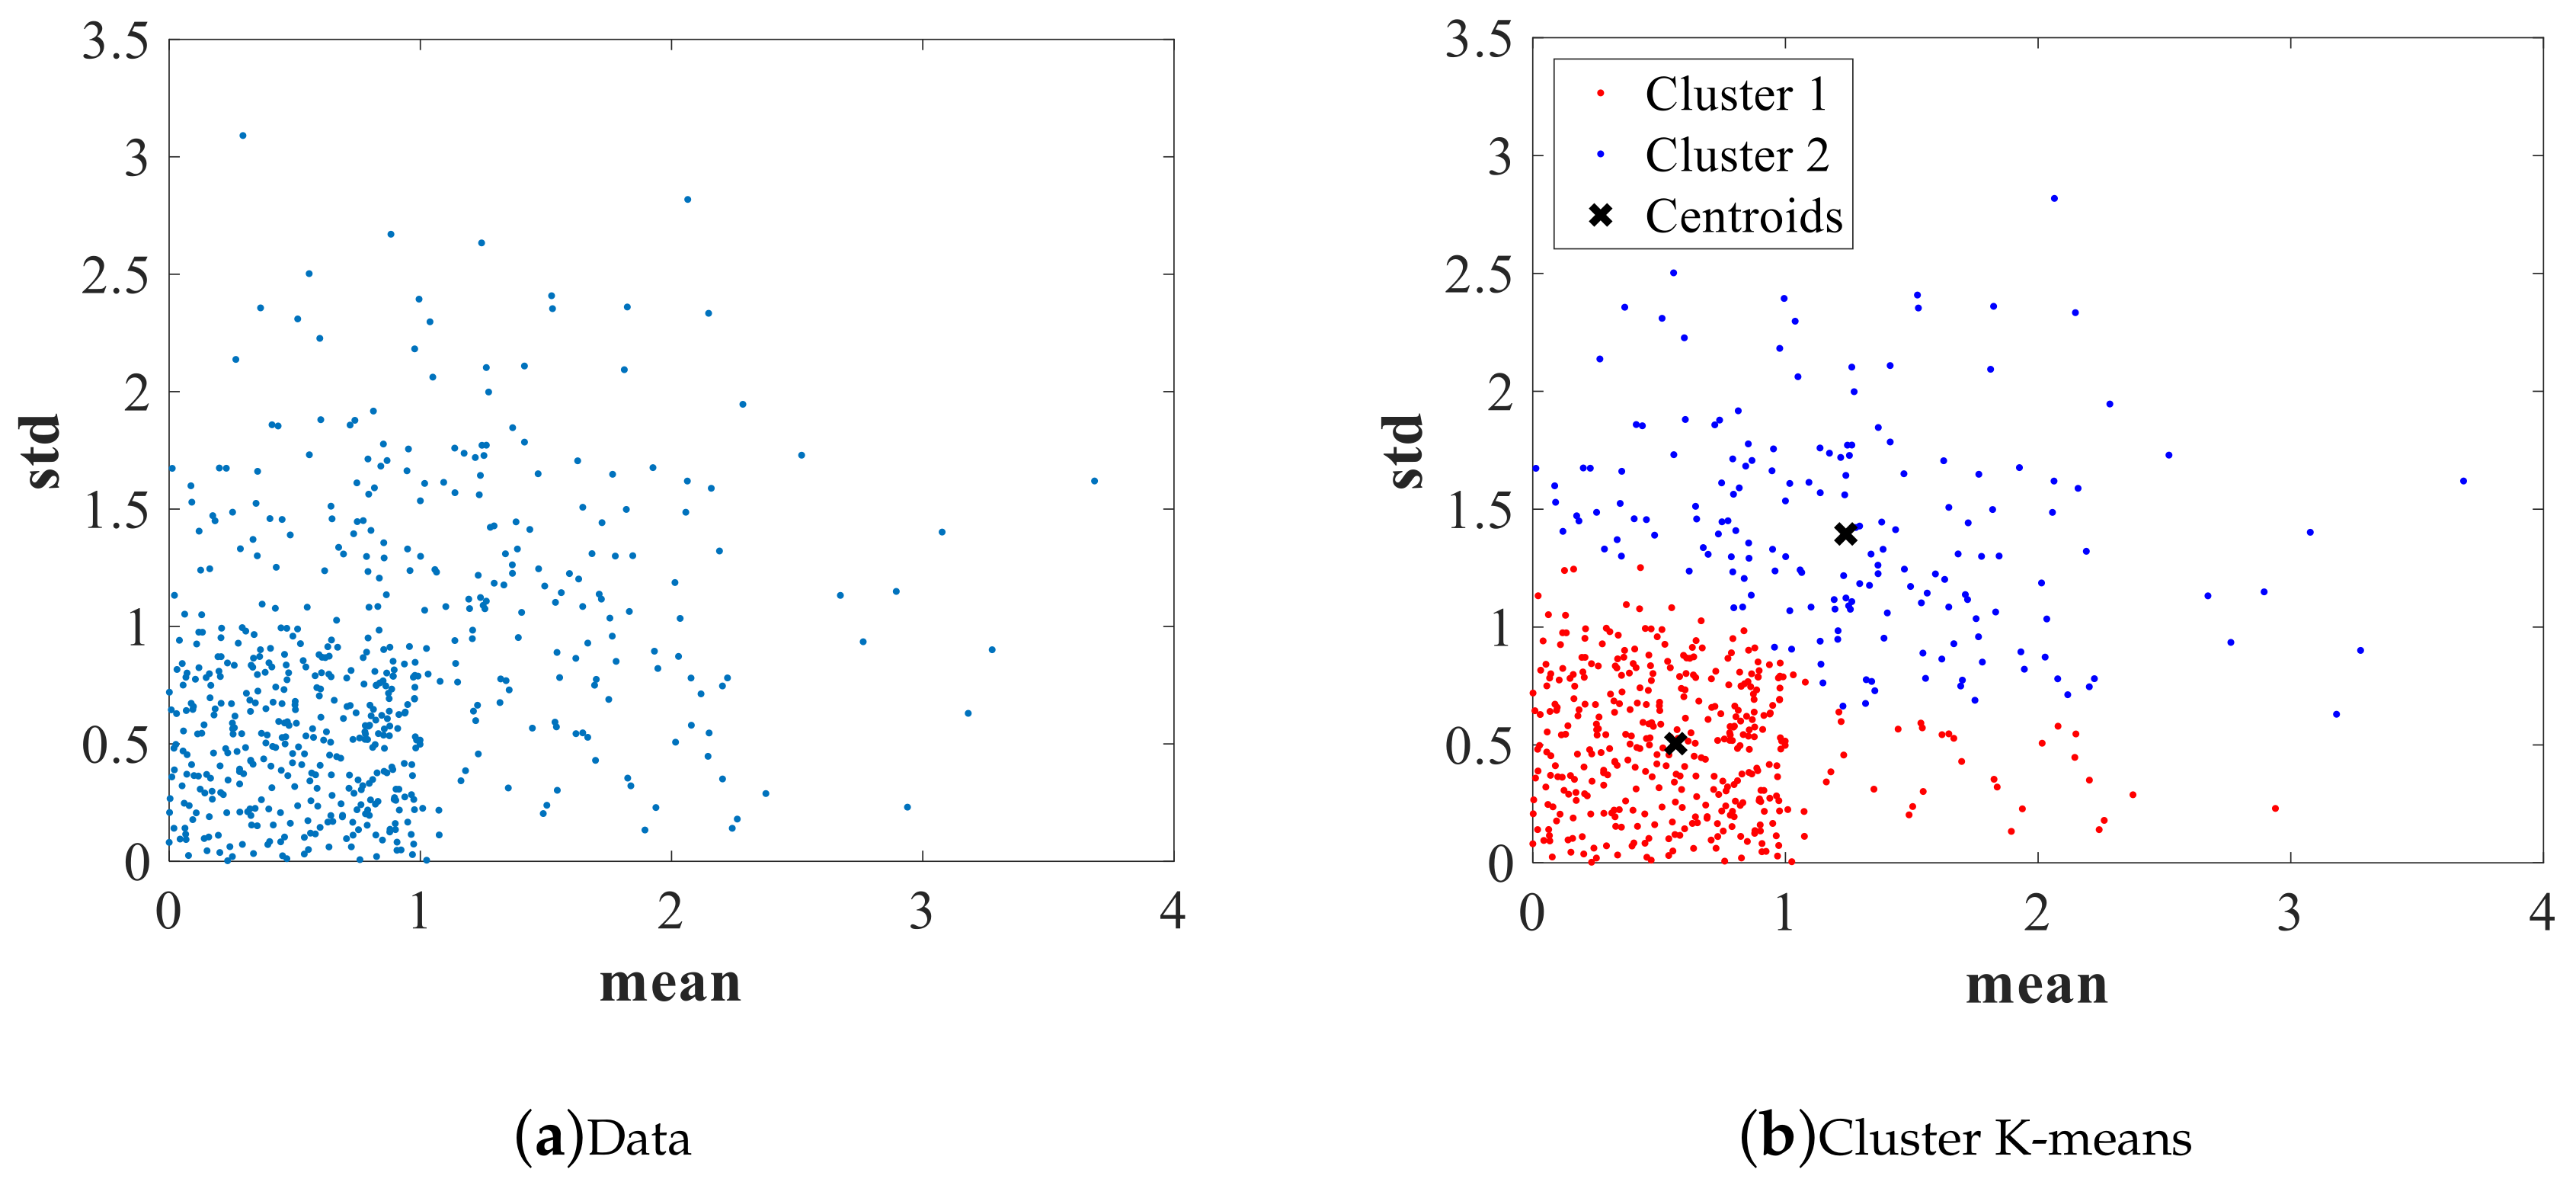
- K-means:The algorithm does not require following the traceability of previous occurrences; the variables of the base matrix is used; however, only the variables mentioned in Table 6 are used compared with other techniques. The K-means technique is based on grouping by similarities. The algorithm performs a pre-grouping before performing the K-means groupings to avoid bad group formation since the magnitudes of consumption between these rates vary significantly. The data are normalized with Equation (2).In Figure 7, an example of the algorithm execution is given; the value of K is two, representing the formation of two groups within the residential rate, the group of fraudulent consumption, and the group of consumers that reflect consumption patterns without alterations. In this sense, it is necessary to plan the on-site review of the measurement systems since something is happening with these measurement systems. An example is presented in Figure 7b. The group is selected as Fraudulent Number 2 (blue color).
4. Results of the Application of the Data Analytics Techniques
- True positive (TP): when a consumer commits fraud and the technique classifies it as such;
- True negatives (TN): cases correctly cited as non-fraud;
- False positive (FP): when a consumer does not commit fraud and the technique classifies it as fraud;
- False negatives (FN): when a consumer commits fraud and the technique classifies it as non-fraud.
- Specificity or true positive ratio (TPR): This indicates whether a classification technique performs correctly, stating the proportion of samples cataloged as non-technical energy losses corresponding to the total number of non-technical losses within a data group, shown in Equation (3).
- Reliability or a false positive ratio (FPR): This indicates the relationship between false alarms (consumers falsely classified as committing fraud) and the total number of true negatives, shown in Equation (4).
5. Case of Study—Application of the Methodology to Determine Energy Losses
5.1. Control of Measurement Systems in Utilities
5.2. Management in the Recovery of Energy Consumed and Not Invoiced
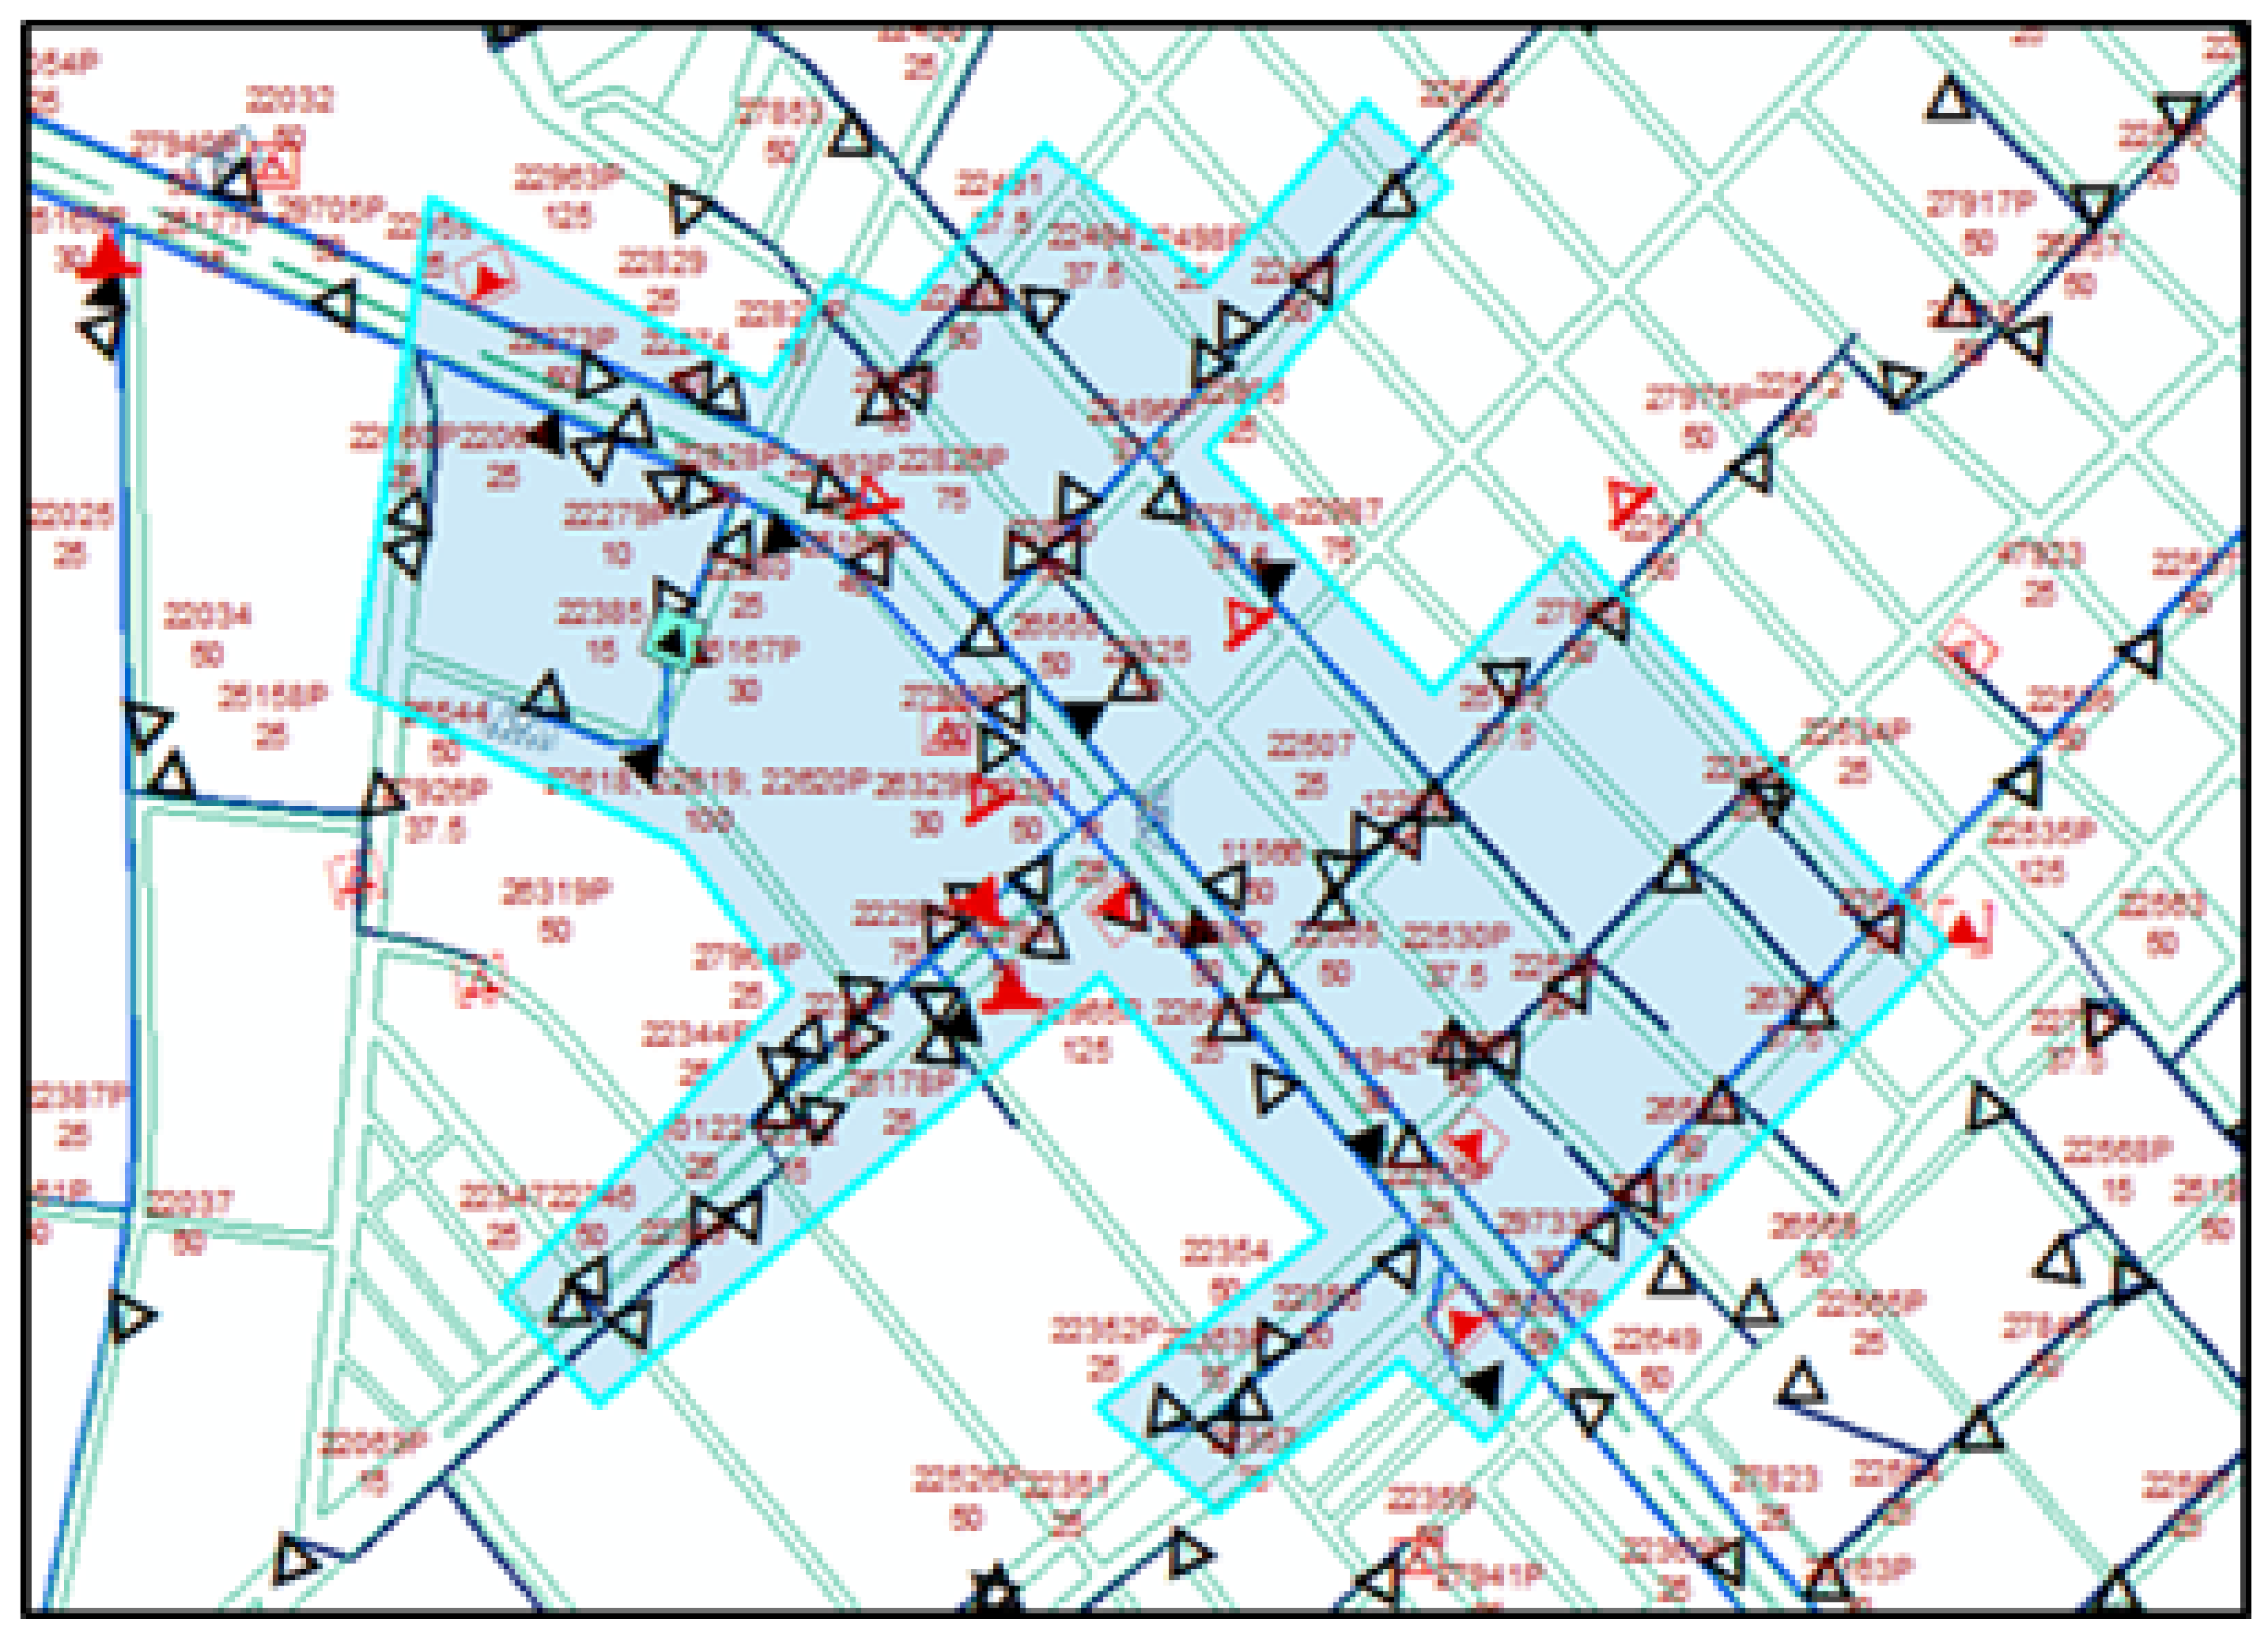
5.3. Examples of the Application of the Methodology for the Reduction of Non-Technical Losses
6. Conclusions
Author Contributions
Funding
Data Availability Statement
Acknowledgments
Conflicts of Interest
Abbreviations
| NTL | Non-technical losses |
| GIS | Geographic information system |
| CIS | Customer information systems |
| SAP | System application products |
| CENTROSUR | Empresa Eléctrica Regional Centro Sur C.A. |
| TPR | True positive rate |
| FPR | False positive rate |
| TP | True positives |
| TN | True negatives |
| FP | False positives |
| FN | False negatives |
| k-NN | k-nearest neighbor |
| ANN | Artificial neural network |
| SVM | Support vector machine |
| OPF | Optimum path forest |
| AUC | Area under the curve |
References
- Organización Latinoamericana de Energía—OLADE. Panorama Energético de Latinoamérica y el Caribe; OLADE: Quito, Ecuador, 2019; Volume I. [Google Scholar]
- Alvarez, C.M.; Rodriguez, J.; Alcazar, M.; Carbonell, J. Análisis para la Implementación de Redes Inteligentes en Ecuador; Editorial Institucional UPV: Valencia, Spain, 2016; Volume I, pp. 1–287. ISBN 978-84-608-5432-6. [Google Scholar]
- Costa, B.; Alberto, B.; Portela, A.; Maduro, M.; Eler, E. Fraud Detection in Electric Power Distribution Networks using an Ann-Based Knowledge-Discovery Process. Int. J. Artif. Intell. Appl. 2013, 4, 17–23. [Google Scholar] [CrossRef]
- Leon, C.; Biscarri, F.; Monedero, I.; Guerrero, J.I.; Biscarri, J.; Millan, R. Variability and Trend-Based Generalized Rule Induction Model to NTL Detection in Power Companies. IEEE Trans. Power Syst. 2011, 26, 1798–1807. [Google Scholar] [CrossRef]
- Monedero, I.; Biscarri, F.; León, C.; Guerrero, J.; Biscarri, J.; Millán, R. Detection of frauds and other non-technical losses in a power utility using Pearson coefficient, Bayesian networks and decision trees. Int. J. Electr. Power Energy Syst. 2011, 34, 90–98. [Google Scholar] [CrossRef]
- Nizar, A.H.; Dong, Z.Y.; Zhao, J.H.; Zhang, P. A data mining based NTL analysis method. In Proceedings of the 2007 IEEE Power Engineering Society General Meeting, Tampa, FL, USA, 24–28 June 2007; pp. 1–8. [Google Scholar] [CrossRef]
- Leite, D.; Pessanha, J.; Simões, P.; Calili, R.; Souza, R. A Stochastic Frontier Model for Definition of Non-Technical Loss Targets. Energies 2020, 13, 3227. [Google Scholar] [CrossRef]
- Arthur, D.; Vassilvitskii, S. K-means++: The advantages of careful seeding. In Proceedings of the Eighteenth Annual ACM-SIAM Symposium on Discrete Algorithms, New Orleans, LA, USA, 7–9 January 2007; pp. 1027–1035. [Google Scholar]
- Sun, S.; Huang, R. An adaptive k-nearest neighbor algorithm. In Proceedings of the 2010 Seventh International Conference on Fuzzy Systems and Knowledge Discovery, Yantai, China, 10–12 August 2010; Volume 1, pp. 91–94. [Google Scholar] [CrossRef]
- Ramos, C.C.O.; de Sousa, A.N.; Papa, J.P.; Falcão, A.X. A New Approach for Nontechnical Losses Detection Based on Optimum-Path Forest. IEEE Trans. Power Syst. 2011, 26, 181–189. [Google Scholar] [CrossRef]
- Nagi, J.; Yap, K.S.; Tiong, S.K.; Ahmed, S.K.; Nagi, F. Improving SVM-Based Nontechnical Loss Detection in Power Utility Using the Fuzzy Inference System. IEEE Trans. Power Deliv. 2011, 26, 1284–1285. [Google Scholar] [CrossRef]
- León, C.; Biscarri, F.; Monedero, I.; Guerrero, J.; Biscarri, J.; Millán, R. Integrated Expert System Applied to the Analysis of Non Technical Losses In Power Utilities. Expert Syst. Appl. 2011, 38, 10274–10285. [Google Scholar] [CrossRef]
- Toledo, M.; Morales, D.; Vintimilla, J.; Medina, R. Smart multivariate techniques applied in the budget assignment for loss reduction in ecuador. In Proceedings of the 2016 IEEE PES Innovative Smart Grid Technologies Conference Europe (ISGT-Europe), Ljubljana, Slovenia, 9–12 October 2016; Volume I, pp. 1–6. [Google Scholar] [CrossRef]
- Ministerio de Energía y Recursos Naturales no Renovables. Plan Maestro de Electricidad of—Ecuador; Ministry of Electricity and Renewable Energy: Quito, Ecuador, 2018; Volume I, pp. 1–390.
- Zhang, T.; Gao, R.; Sun, S. Theories, applications and trends of non-technical losses in power utilities using machine learning. In Proceedings of the 2018 2nd IEEE Advanced Information Management, Communicates, Electronic and Automation Control Conference (IMCEC), Xi’an, China, 25–27 May 2018; pp. 2324–2329. [Google Scholar] [CrossRef]
- Pózna, A.; Fodor, A.; Hangos, K. Model-based fault detection and isolation of non-technical losses in electrical networks. Math. Comput. Model. Dyn. Syst. 2019, 25, 397–428. [Google Scholar] [CrossRef]
- Jamil, F.; Ahmad, E. Policy considerations for limiting electricity theft in the developing countries. Energy Policy 2019, 129, 452–458. [Google Scholar] [CrossRef]
- CIRED. Reduction of technical and non-technical losses in distribution networks. In Proceedings of the International Conference on Electricity Distribution, Lyon, France, 15–18 June 2015. [Google Scholar]
- Agüero, J.R. Improving the efficiency of power distribution systems through technical and non-technical losses reduction. In Proceedings of the PES T & D 2012, Orlando, FL, USA, 7–10 May 2012; pp. 1–8. [Google Scholar] [CrossRef]
- Viegas, J.L.; Esteves, P.R.; Melício, R.; Mendes, V.M.F.; Vieira, S.M. Solutions for detection of non-technical losses in the electricity grid: A review. Renew. Sustain. Energy Rev. 2017, 80, 1256–1268. [Google Scholar] [CrossRef]
- Monteiro, M.D.; Maciel, R.S. Detection of commercial losses in electric power distribution systems using data mining techniques. In Proceedings of the 2018 Simposio Brasileiro de Sistemas Eletricos (SBSE), Niteroi, Brazil, 12–16 May 2018; pp. 1–6. [Google Scholar] [CrossRef]
- Messinis, G.; Hatziargyriou, N. Review of non-technical loss detection methods. Electr. Power Syst. Res. 2018, 158, 250–266. [Google Scholar] [CrossRef]
- Ahmad, T.; Chen, H.; Wang, J.; Guo, Y. Review of various modeling techniques for the detection of electricity theft in smart grid environment. Renew. Sustain. Energy Rev. 2018, 82. [Google Scholar] [CrossRef]
- Gonzalez-Urdaneta, G. A venezuelan experience in the reduction of non-technical power losses. In Proceedings of the CICED 2010 Proceedings, Nanjing, China, 13–16 September 2010; pp. 1–6. [Google Scholar]
- Yakubu, O.; Babu, C.N.; Adjei, O. Electricity theft: Analysis of the underlying contributory factors in Ghana. Energy Policy 2018, 123, 611–618. [Google Scholar] [CrossRef]
- Glauner, P.; Glaeser, C.; Dahringer, N.; Valtchev, P.; State, R.; Duarte, D. Non-Technical Losses in the 21st Century: Causes, Economic Effects, Detection and Perspectives; Interdisciplinary Centre for Security, Reliability and Trust, University of Luxembourg: Luxembourg, 2018. [Google Scholar]
- Aydin, Z.; Gungor, V.C. A novel feature design and stacking approach for non-technical electricity loss detection. In Proceedings of the 2018 IEEE Innovative Smart Grid Technologies (ISGT), Singapore, 22–25 May 2018; pp. 867–872. [Google Scholar] [CrossRef]
- Ghori, K.M.; Rabeeh Ayaz, A.; Awais, M.; Imran, M.; Ullah, A.; Szathmary, L. Impact of feature selection on non-technical loss detection. In Proceedings of the 2020 6th Conference on Data Science and Machine Learning Applications (CDMA), Riyadh, Saudi Arabia, 21–22 March 2020; pp. 19–24. [Google Scholar] [CrossRef]
- Kosut, J.P.; Santomauro, F.; Jorysz, A.; Fernández, A.; Lecumberry, F.; Rodríguez, F. Abnormal consumption analysis for fraud detection: UTE-UDELAR joint efforts. In Proceedings of the 2015 IEEE PES Innovative Smart Grid Technologies Latin America (ISGT LATAM), Montevideo, Uruguay, 5–7 October 2015; pp. 887–892. [Google Scholar] [CrossRef]
- Wang, D.-G.; Dong, J.-C.; Huang, L.; Gong, Y. Anomaly behavior detection based on ensemble decision tree in power distribution network. In Proceedings of the 2018 4th Annual International Conference on Network and Information Systems for Computers (ICNISC), Wuhan, China, 19–21 April 2018; pp. 312–316. [Google Scholar] [CrossRef]
- Guerrero, J.I.; Monedero, I.; Biscarri, F.; Biscarri, J.; Millán, R.; León, C. Non-Technical Losses Reduction by Improving the Inspections Accuracy in a Power Utility. IEEE Trans. Power Syst. 2018, 33, 1209–1218. [Google Scholar] [CrossRef]
- Yap, K.S.; Tiong, S.K.; Nagi, J.; Koh, J.S.; Nagi, F. Comparison of supervised learning techniques for non-technical loss detection in power utility. Int. Rev. Comput. Softw. 2012, 7, 626–636. [Google Scholar]
- Guerrero, J.; León, C.; Monedero, I.; Biscarri, F.; Biscarri, J. Improving Knowledge-Based Systems with statistical techniques, text mining, and neural networks for non-technical loss detection. Knowl. Based Syst. 2014, 71, 376–388. [Google Scholar] [CrossRef]
- Ford, V.; Siraj, A.; Eberle, W. Smart grid energy fraud detection using artificial neural networks. In Proceedings of the 2014 IEEE Symposium on Computational Intelligence Applications in Smart Grid (CIASG), Orlando, FL, USA, 9–12 December 2014; pp. 1–6. [Google Scholar] [CrossRef]
- Micheli, G.; Soda, E.; Vespucci, M.; Gobbi, M.; Bertani, A. Big data analytics: An aid to detection of non-technical losses in power utilities. Comput. Manag. Sci. 2018, 16, 1–15. [Google Scholar] [CrossRef]
- Barros, R.; Costa, E.; Araujo, J. Use of ANN for identification of consumers with irregular electrical installations. In Proceedings of the 2018 Simposio Brasileiro de Sistemas Eletricos (SBSE), Niteroi, Brazil, 12–16 May 2018; pp. 1–6. [Google Scholar] [CrossRef]
- Ramos, C.; Rodrigues, D.; Souza, A.; Papa, J. On the Study of Commercial Losses in Brazil: A Binary Black Hole Algorithm for Theft Characterization. IEEE Trans. Smart Grid 2016, 9, 1. [Google Scholar] [CrossRef]
- Messinis, G.M.; Hatziargyriou, N.D. Unsupervised classification for non-technical loss detection. In Proceedings of the 2018 Power Systems Computation Conference (PSCC), Dublin, Ireland, 11–15 June 2018; pp. 1–7. [Google Scholar] [CrossRef]
- Umar, H.A.; Prasad, R.; Fonkam, M. Assessing severity of non-technical losses in power using clustering algorithms. In Proceedings of the 2019 15th International Conference on Electronics, Computer and Computation (ICECCO), Abuja, Nigeria, 10–12 December 2019; pp. 1–6. [Google Scholar] [CrossRef]
- Terciyanli, E.; Eryigit, E.; Emre, T.; Caliskan, S. Score based non-technical loss detection algorithm for electricity distribution networks. In Proceedings of the 2017 5th International Istanbul Smart Grid and Cities Congress and Fair (ICSG), Istanbul, Turkey, 19–21 April 2017; pp. 180–184. [Google Scholar] [CrossRef]
- Babu, T.V.; Murthy, T.S.; Sivaiah, B. Detecting unusual customer consumption profiles in power distribution systems — APSPDCL. In Proceedings of the 2013 IEEE International Conference on Computational Intelligence and Computing Research, Enathi, India, 26–28 December 2013; pp. 1–5. [Google Scholar] [CrossRef]
- Yeckle, J.; Tang, B. Detection of electricity theft in customer consumption using outlier detection algorithms. In Proceedings of the 2018 1st International Conference on Data Intelligence and Security (ICDIS), South Padre Island, TX, USA, 8–10 April 2018; pp. 135–140. [Google Scholar] [CrossRef]
- Moghaddass, R.; Wang, J. A Hierarchical Framework for Smart Grid Anomaly Detection Using Large-Scale Smart Meter Data. IEEE Trans. Smart Grid 2018, 9, 5820–5830. [Google Scholar] [CrossRef]
- Zanetti, M.; Jamhour, E.; Pellenz, M.; Penna, M.; Zambenedetti, V.; Chueiri, I. A Tunable Fraud Detection System for Advanced Metering Infrastructure Using Short-Lived Patterns. IEEE Trans. Smart Grid 2019, 10, 830–840. [Google Scholar] [CrossRef]
- Kazymov, I.; Kompaneets, B. Definition of fact and place of losses in low voltage electric networks. In Proceedings of the 2019 International Conference on Industrial Engineering, Applications and Manufacturing (ICIEAM), Sochi, Russia, 25–29 March 2019; pp. 1–5. [Google Scholar] [CrossRef]
- Jindal, A.; Dua, A.; Kaur, K.; Singh, M.; Kumar, N.; Mishra, S. Decision Tree and SVM-Based Data Analytics for Theft Detection in Smart Grid. IEEE Trans. Ind. Inform. 2016, 12, 1005–1016. [Google Scholar] [CrossRef]
- Pulz, J.; Muller, R.B.; Romero, F.; Meffe, A.; Neto, A.F.G.; Jesus, A.S. Fraud detection in low-voltage electricity consumers using socio-economic indicators and billing profile in smart grids. CIRED Open Access Proc. J. 2017, 2017, 2300–2303. [Google Scholar] [CrossRef]
- Messinis, G.M.; Rigas, A.E.; Hatziargyriou, N.D. A Hybrid Method for Non-Technical Loss Detection in Smart Distribution Grids. IEEE Trans. Smart Grid 2019, 10, 6080–6091. [Google Scholar] [CrossRef]
- Zheng, K.; Chen, Q.; Wang, Y.; Kang, C.; Xia, Q. A Novel Combined Data-Driven Approach for Electricity Theft Detection. IEEE Trans. Ind. Inform. 2019, 15, 1809–1819. [Google Scholar] [CrossRef]
- Bholowalia, P.; Kumar, A. EBK-Means: A Clustering Technique based on Elbow Method and K-Means in WSN. Int. J. Comput. Appl. 2014, 105, 17–24. [Google Scholar]
- Júnior, L.P.; Ramos, C.; Rodrigues, D.; Pereira, D.; Souza, A.; Costa, K.; Papa, J. Unsupervised non-technical losses identification through optimum-path forest. Electr. Power Syst. Res. 2016, 140. [Google Scholar] [CrossRef]
- Al-Radaideh, Q.A.; Al-Zoubi, M.M. A data mining based model for detection of fraudulent behaviour in water consumption. In Proceedings of the 2018 9th International Conference on Information and Communication Systems (ICICS), Irbid, Jordan, 3–5 April 2018; pp. 48–54. [Google Scholar] [CrossRef]
- Glauner, P.; Meira, J.A.; Dolberg, L.; State, R.; Bettinger, F.; Rangoni, Y. Neighborhood features help detecting non-technical losses in big data sets. In Proceedings of the 2016 IEEE/ACM 3rd International Conference on Big Data Computing Applications and Technologies (BDCAT), Shanghai, China, 6–9 December 2016; pp. 253–261. [Google Scholar]
- Rokach, L.; Maimon, O. Data Mining with Decision Trees: Theory and Applications; Series in Machine Perception and Artificial Intelligence; World Scientific: Singapore, 2015. [Google Scholar]
- Glauner, P.; Meira, J.; Valtchev, P.; State, R.; Bettinger, F. The Challenge of Non-Technical Loss Detection Using Artificial Intelligence: A Survey. Int. J. Comput. Intell. Syst. 2017, 10, 760–775. [Google Scholar] [CrossRef]

| Country | 2008 | 2009 | 2010 | 2011 | 2012 | 2013 | 2014 | 2015 | 2016 | 2017 | 2018 | Average |
|---|---|---|---|---|---|---|---|---|---|---|---|---|
| Argentina | 14.3 | 14.8 | 14.8 | 13.6 | 14.4 | 15.1 | 12.0 | 13.2 | 13.0 | 14.7 | 15.1 | 14.1 |
| Bolivia | 10.1 | 10.1 | 11.2 | 11.0 | 9.9 | 9.0 | 9.4 | 8.9 | 9.9 | 10.7 | 11.0 | 10.1 |
| Brazil | 15.3 | 15.8 | 15.6 | 15.4 | 15.9 | 15.4 | 14.9 | 15.1 | 15.9 | 15.6 | 15.9 | 15.5 |
| Chile | 8.3 | 8.2 | 5.8 | 6.1 | 2.3 | 6.7 | 6.7 | 5.0 | 3.6 | 5.2 | 5.2 | 5.7 |
| Colombia | 13.4 | 12.3 | 12.0 | 11.3 | 11.7 | 10.1 | 10.6 | 12.4 | 9.4 | 7.4 | 10.4 | 11.0 |
| Costa Rica | 10.3 | 10.6 | 10.1 | 10.8 | 10.6 | 10.5 | 10.6 | 12.1 | 10.2 | 9.9 | 9.8 | 10.5 |
| Cuba | 15.9 | 14.3 | 15.9 | 15.8 | 15.7 | 15.3 | 15.3 | 15.5 | 15.2 | 15.5 | 15.8 | 15.5 |
| Ecuador | 25.0 | 21.3 | 18.6 | 17.8 | 15.3 | 14.2 | 12.6 | 12.7 | 13.0 | 12.6 | 13.0 | 16.0 |
| El Salvador | 9.6 | 10.9 | 11.7 | 12.1 | 9.8 | 7.0 | 9.8 | 9.4 | 11.6 | 11.4 | 11.6 | 10.4 |
| Guatemala | 14.1 | 14.4 | 9.8 | 13.2 | 12.5 | 11.8 | 12.4 | 12.0 | 12.1 | 12.6 | 11.7 | 11.5 |
| Honduras | 20.6 | 21.5 | 27.5 | 26.1 | 28.6 | 28.2 | 16.2 | 14.2 | 14.7 | 31.9 | 30.2 | 23.6 |
| Jamaica | 23.3 | 23.2 | 22.5 | 24.5 | 27.2 | 28.0 | 28.5 | 28.5 | 26.6 | 26.3 | 26.0 | 25.9 |
| Mexico | 15.8 | 16.3 | 16.4 | 15.9 | 15.1 | 14.6 | 13.9 | 13.4 | 12.8 | 15.8 | 17.5 | 15.2 |
| Panama | 14.0 | 13.1 | 14.5 | 13.6 | 13.7 | 13.5 | 14.0 | 13.6 | 14.4 | 13.5 | 13.0 | 13.7 |
| Paraguay | 31.8 | 31.6 | 31.5 | 29.8 | 30.6 | 25.9 | 24.5 | 24.6 | 24.9 | 24.9 | 23.6 | 27.6 |
| Peru | 8.2 | 8.1 | 10.2 | 9.6 | 8.2 | 10.5 | 11.0 | 11.0 | 10.6 | 10.5 | 10.9 | 9.9 |
| Dominican Republic | 11.9 | 12.7 | 13.2 | 12.8 | 12.8 | 12.7 | 12.7 | 12.8 | 12.9 | 13.0 | 13.0 | 12.8 |
| Suriname | 9.0 | 9.0 | 8.5 | 9.0 | 9.0 | 10.2 | 8.7 | 10.5 | 17.0 | 17.9 | 18.6 | 11.6 |
| Uruguay | 11.1 | 11.5 | 11.6 | 11.9 | 11.6 | 11.2 | 10.7 | 12.0 | 12.2 | 13.1 | 11.5 | 11.7 |
| Venezuela | 26.7 | 27.8 | 27.9 | 29.6 | 31.0 | 32.0 | 32.8 | 32.2 | 29.2 | 29.2 | 29.2 | 29.8 |
| 1. | Randomly enter a value of K, these being the centroids of each group. |
| 2. | Form K clusters, setting each of data to the closest centroid. |
| 3. | Readjust the K centroids, which will be the average of the group established in Step 2. |
| 4. | Repeat Steps 2 and 3 until there is no readjustment of centroids. |
| 1. | Enter class data . |
| 2. | Enter data to classify . |
| 3. | Enter the value of K neighbors to consider. |
| 4. | For every classified object, calculate the distance with the data to be classified. |
| 5. | Keep the K training data closest to the data to be classified. |
| 6. | Assign X the most frequent class. |
| # | Variable | Null | Media | Median | Mode | Maximum | Minimum | Stand. Dev. | Coeff Variant. |
|---|---|---|---|---|---|---|---|---|---|
| V27 | Third Age | 255 | 0.05 | 0 | 0 | 1 | 0 | 0.22 | 430% |
| V28 | HDB | 255 | 0.02 | 0 | 0 | 1 | 0 | 0.33 | 500% |
| . . . | . . . | . . . | . . . | . . . | . . . | . . . | . . . | . . . | . . . |
| V67 | GeographStrat | 255 | 3.94 | 5 | 5 | 10 | 0 | 3.03 | 41% |
| V68 | Year Product | 19 | 1998.09 | 2013 | 2015 | 2017 | 0 | 165.2 | 6% |
| # | Variable | Description |
|---|---|---|
| Average | 13 month average energy consumption | |
| Standard deviation | Standard deviation corresponding to monthly energy data | |
| Coefficient of variation | Expresses the standard deviation as a percentage of the average | |
| Minimum | Minimum consumption value of the 13 values | |
| Maximum | Maximum consumption value of the 13 values | |
| Range | Difference between the maximum and minimum value |
| Actual Values | |||
|---|---|---|---|
| Fraud (1) | No Fraud (0) | ||
| Predicted Values | Fraud (1) | TP | FP |
| No Fraud (0) | FN | TN | |
| N of Groups | TPR (%) | FPR (%) |
|---|---|---|
| 2 | 80 | 17 |
| 3 | 80 | 24 |
| 5 | 79 | 24 |
| 7 | 79 | 24 |
| 9 | 49 | 24 |
| K | TPR (%) | FPR (%) |
|---|---|---|
| 2 | 13 | 62 |
| 3 | 16 | 62 |
| 5 | 24 | 56 |
| 10 | 33 | 53 |
| 20 | 25 | 82 |
| Methods | TPR (%) | FPR (%) |
|---|---|---|
| K-nearest neighbors (K = 10) | 40 | 39 |
| Decision tree | 40 | 63 |
| Neural network | 60 | 43 |
| Methods | TPR (%) | FPR (%) |
|---|---|---|
| K-means + K-neighbors (K = 10) | 53 | 34 |
| K-means + decision tree | 55 | 39 |
| K-means + neural network | 87 | 16 |
Publisher’s Note: MDPI stays neutral with regard to jurisdictional claims in published maps and institutional affiliations. |
© 2021 by the authors. Licensee MDPI, Basel, Switzerland. This article is an open access article distributed under the terms and conditions of the Creative Commons Attribution (CC BY) license (http://creativecommons.org/licenses/by/4.0/).
Share and Cite
Toledo-Orozco, M.; Arias-Marin, C.; Álvarez-Bel, C.; Morales-Jadan, D.; Rodríguez-García, J.; Bravo-Padilla, E. Innovative Methodology to Identify Errors in Electric Energy Measurement Systems in Power Utilities. Energies 2021, 14, 958. https://doi.org/10.3390/en14040958
Toledo-Orozco M, Arias-Marin C, Álvarez-Bel C, Morales-Jadan D, Rodríguez-García J, Bravo-Padilla E. Innovative Methodology to Identify Errors in Electric Energy Measurement Systems in Power Utilities. Energies. 2021; 14(4):958. https://doi.org/10.3390/en14040958
Chicago/Turabian StyleToledo-Orozco, Marco, Carlos Arias-Marin, Carlos Álvarez-Bel, Diego Morales-Jadan, Javier Rodríguez-García, and Eddy Bravo-Padilla. 2021. "Innovative Methodology to Identify Errors in Electric Energy Measurement Systems in Power Utilities" Energies 14, no. 4: 958. https://doi.org/10.3390/en14040958
APA StyleToledo-Orozco, M., Arias-Marin, C., Álvarez-Bel, C., Morales-Jadan, D., Rodríguez-García, J., & Bravo-Padilla, E. (2021). Innovative Methodology to Identify Errors in Electric Energy Measurement Systems in Power Utilities. Energies, 14(4), 958. https://doi.org/10.3390/en14040958


