Article

A Modified Niching Crow Search Approach to Well Placement Optimization

1
Fundamental and Applied Sciences Department, Universiti Teknologi PETRONAS, Seri Iskandar 32610, Perak Darul Ridzuan, Malaysia
2
Shale Gas Research Group, Institute of Hydrocarbon Recovery, Universiti Teknologi PETRONAS, Seri Iskandar 32610, Perak Darul Ridzuan, Malaysia
3
Petroleum Engineering Department, Universiti Teknologi PETRONAS, Seri Iskandar 32610, Perak Darul Ridzuan, Malaysia
4
Electrical & Electronic Engineering Department, Chittagong University of Engineering and Technology, Chittagong 4349, Bangladesh
5
College of Business and Economics, Qatar University, Doha 00974, Qatar
6
Department of Computer & Information Sciences, Universiti Teknologi Petronas, Seri Iskandar 32610, Perak, Malaysia
*
Author to whom correspondence should be addressed.
Energies 2021, 14(4), 857; https://doi.org/10.3390/en14040857
Submission received: 25 November 2020 / Revised: 23 December 2020 / Accepted: 28 December 2020 / Published: 6 February 2021

Abstract

:
Well placement optimization is considered a non-convex and highly multimodal optimization problem. In this article, a modified crow search algorithm is proposed to tackle the well placement optimization problem. This article proposes modifications based on local search and niching techniques in the crow search algorithm (CSA). At first, the suggested approach is verified by experimenting with the benchmark functions. For test functions, the results of the proposed approach demonstrated a higher convergence rate and a better solution. Again, the performance of the proposed technique is evaluated with well placement optimization problem and compared with particle swarm optimization (PSO), the Gravitational Search Algorithm (GSA), and the Crow search algorithm (CSA). The outcomes of the study revealed that the niching crow search algorithm is the most efficient and effective compared to the other techniques.

1. Introduction

Optimization performs a vital function in scientific, manufacturing, and environmental processes in the modern world [1]. To solve problems of this kind, researchers use several different methods to determine the right approach for a specific problem [2,3]. Scientists are also constantly searching for more sophisticated modeling strategies [1,4,5]. The conventional exact approach should be used for smaller problems where the problems are constant and distinct [4,5]. The conventional exact solution approach cannot escape local optimum in real-world problems, as real-world problems are not always differentiable [6]. On the other side, the metaheuristic algorithm’s performance is problem specific [7]. Metaheuristic techniques are used in a vast range of studies [8,9].
The multimodal optimization problem of well placement is one of the most difficult factors in the development process in the oil and gas industry. However, there is a growing body of literature that addresses the well placement optimization problem as an extremely non-smooth, non-convex cost function that includes several local optimums [10,11]. Based on contemporary research work, the optimization methods can be indexed into three major categories in this field. These three categories are (a) classical methods, (b) non-classical methods, and (c) hybrid methods [10]. In the early novel research endeavors to tackle the well placement optimization problem, the focus was mainly on classical methods, and, among them, the finite difference method [12], mixed-integer programming (MIP) [13], multivariate interpolation algorithms [14], the steepest ascent method [15] and the simultaneous perturbation stochastic approximation method [16,17] are significant. However, the biggest bottlenecks of the gradient-based techniques are that they might get trapped in local optima. Hence, gradient-based techniques hardly solve the well placement optimization problem due to its nature. However, non-classical methods do not require gradient calculation. Again, they are less likely to get trapped in local optima compared to classical methods [18,19,20]. Therefore, non-conventional methods with gradient-free approaches are considered for this problem.
Nonconventional gradient-free techniques such as ant colony optimization (ACO) [21] improved harmony search (IHS) [22], differential evolution (DE) [23,24], cuckoo search (CS) [25], the imperialist competitive algorithm (ICA) [26,27,28], the Firefly Algorithm [29], the Smart flower optimization algorithm ([30,31]), particle swarm optimization (PSO) ([32,33]), the covariance matrix adaptation evolution strategy (CMA-ES) [34,35], artificial bee colony (ABC) [36], the bat algorithm (BA) [37,38], and the genetic algorithm ([39,40,41,42,43]) etc. have been applied in the optimization problem of well placement. However, such types of algorithms tend to be trapped in the optimum local and are still heavily affected by parameter tuning, although they can provide better solutions than traditional techniques. Again, researchers tend to combine non-conventional methods with classical methods [44] to create a hybrid algorithm [45]. Many researchers combined the best features of different algorithms by following this approach and developed many hybrid strategies ([46,47]) that demonstrated superior performance in the well placement optimization problem. This form of methodology, however, lacks theoretical studies to support the combination they proposed. The gravitational search algorithm (GSA) is superior to the genetic algorithm (GA) [48]. Furthermore, in another analysis, PSO provided more net present value than GA [11]. Besides, BA provided better net present value than GA and PSO in another study [37]. Again, the contract-theoretic based framework is used in optimization techniques. Convex optimization methods and optimal contracts can be followed to solve the corresponding optimization problem in [49]. In addition, proxy techniques can provide faster convergence. However, they are susceptible to incorrect approximation, which may lead to error [50]. Hence, based on the above discussion, it can be inferred that a single algorithm cannot be depicted as a superior algorithm in this field. Nevertheless, these global optimization algorithms are still susceptible to the local optimum, and due to having a stochastic nature, the results are often unstable [51].
Again, the cost functions are discontinuous and non-convex due to the reservoir heterogeneities ([52,53]), and contain several local optima. Besides, parameter tuning requires a considerable number of reservoir simulations due to computational expenses [54]. The trial and error technique for finding the right configuration is, therefore, impractical. Again, the selection of suitable strategies is difficult due to the lack of studies in exploration and exploitation techniques [55]. Besides, only one reservoir is used in most instances to test the algorithms’ performance. The supremacy of the algorithm in this area is not defined by such an approach, as reservoir heterogeneity alters the surface of the search field. Besides, metaheuristic algorithms are stochastic. Thus, to develop a methodology in this area, statistical analysis and certain criteria should be considered. It is, therefore, necessary to perceive an effective algorithm with an intrinsic ability to solve this complex optimization problem.
Oliva et al. stated that the crow search algorithm can maximize the magnetic resonant of the brain image threshold value and prevents premature convergence [56]. The scale and location of the capacitor in the power distribution network are specifically configured by using the crow search algorithm [57]. Aleem et al. implemented the crow search algorithm and genetic algorithm [58] to design the third-order high pass filter. The CSA had demonstrated a higher degree of convergence. While the CSA has been applied in several fields, scientists have suggested numerous strategies to boost the crow search algorithm’s deficits [59]. To overcome feature selection problems, Sayed et al. suggested a sine chaotic algorithm of crow search [60]. With the new approach, the classification efficiency increased considerably. To avoid local optima, Jain et al. implemented the levy flight with the CSA [59]. The awareness probability of the CSA was updated by Díaz et al. [61]. Mohammadi and Abdi improved the CSA to solve the economic load dispatch problem [62]. They have modified the flight length in their proposed algorithm. The CSA was integrated with chaos theory and applied to Parkinson’s disease prediction problems and multi-objective optimization problems [63,64]. The above research improves the optimization efficiency of the crow search algorithm in specific problems. However, the primary CSA provides low-quality solutions for complex, multimodal optimization problems. Hence, the existing drawbacks of this search algorithm include its inability to avoid local optimal and poor convergence of the multimodal search region.
There have been no studies on the niching crow search algorithm (NCSA) to solve the well placement optimization problem. Therefore, this study proposes an improved crow search technique for solving multimodal benchmark functions and real-world multimodal optimization problems such as the well placement optimization problem in the oil and gas industry, and compares the results with a wide range of established algorithms. In addition, collecting the end result in terms of cost function value does not help to fully understand the internal behavior of the algorithms. Hence, this study attempts to explain the internal behavior of the algorithms on well placement optimization with graphical illustrations. In this study, two case studies are conducted to find the maximum net present value and statistical analysis is provided to find a better algorithm.

2. Problem Formulation

The prime motivation behind well placement optimization is to make sure that the expenditure remains at a minimum while maximizing the net profit. The well placement optimization, in general, can be formulated as:
M a x   R ( u n )
R ( u n ) = N P V ( u n )
Subjected to:
L B u n U B     n ϵ   ( 0 , 1 , 2 , 3 N 1 ) ,
where u n represents well coordinates, N P V presents net profit value, L B and U B are the lower bound and upper bound of the reservoir, respectively.
NPV changes randomly with the change of coordinates of the well location. Eclipse simulation was used to calculate the cumulative oil production, cumulative gas production, and cumulative water production value based on the coordinates of the well location. The variables used in (3) are depicted from [10]. Hence, N P V for a reservoir model can be formulated as:
N P V ( u n ) = i = 1 T Q O P O ( u n ) + Q g P g ( u n ) Q w C w ( u n ) O P E X ( 1 + D ) i C A P E X ,
where P g denotes gas price, Q w presents cumulative water production, D is the discount rate, Q g is the cumulative gas production, T is the number of years passed since the production has started, CAPEX is the capital expenditure, P O presents oil price, C w denotes cost per unit volume of produced water, OPEX is the operational expenditure, and Q O is the cumulative oil production.
The dynamic behavior of an oil reservoir can be defined by spatiotemporal differential equations. These are, in the case of a two-phase oil reservoir:
  t [ ε S f B f ] + q f [ k r f μ f B f K ( P f ρ f g g c Z ) ]   = 0 ,
where μ f is the phase f (f = w for water and f = 0 for oil) of viscosity, ρ f is the density, ε is the porosity, K is the tensor of absolute permeability, B f is the factor of formation volume, S f is the saturation, P f is the pressure, k r f is the relative permeability, and q f is the reservoir flow.
The relative permeability of each step is usually defined in mathematical analysis and modeling using:
k r o = k r o 0 S o S o r 1 S w r S o r a ,
k r w = k r w 0 S w S w r 1 S w r S o r b ,
where S w r and S o r are the residual water and oil saturations, a and b present the exponents in Corey’s correlation, respectively, k r w 0 and k r o 0 are the end-point relative permeabilities for water and oil, respectively.
The oil and water phases’ pressure and saturation are interrelated by the equation:
P c = P o P w = f ( S o S w ) ,
S 0 + S w = 1 ;
where P c is capillary pressure, P o and P w are oil and water pressure, and S 0   and   S w present oil and water saturation.
Then, using the following output equation (IPR or Inflow Performance Relation), the flow rate at the wellbore can be defined:
q = Ψ ( k r / μ B ( P B H P ) ,
where Ψ is the relation transmissibility factor for wells and the Vertical Flow Performance (VFP) curve defines the Bottom Hole Pressure (BHP):
B H P = T H P + ρ g L + Δ P + Δ p .
Among them, ∆P indicates the drop in frictional pressure by well tubing, ∆p is the drop in pressure due to the acceleration, L reflects the well width, ρ is the well output density, and THP is the head pressure of the tubing. The overall flow, the water/oil ratio (gas/oil ratio), and the inlet/outlet pressure define the pressure drop in the equation for a given well placement in Equation (5).
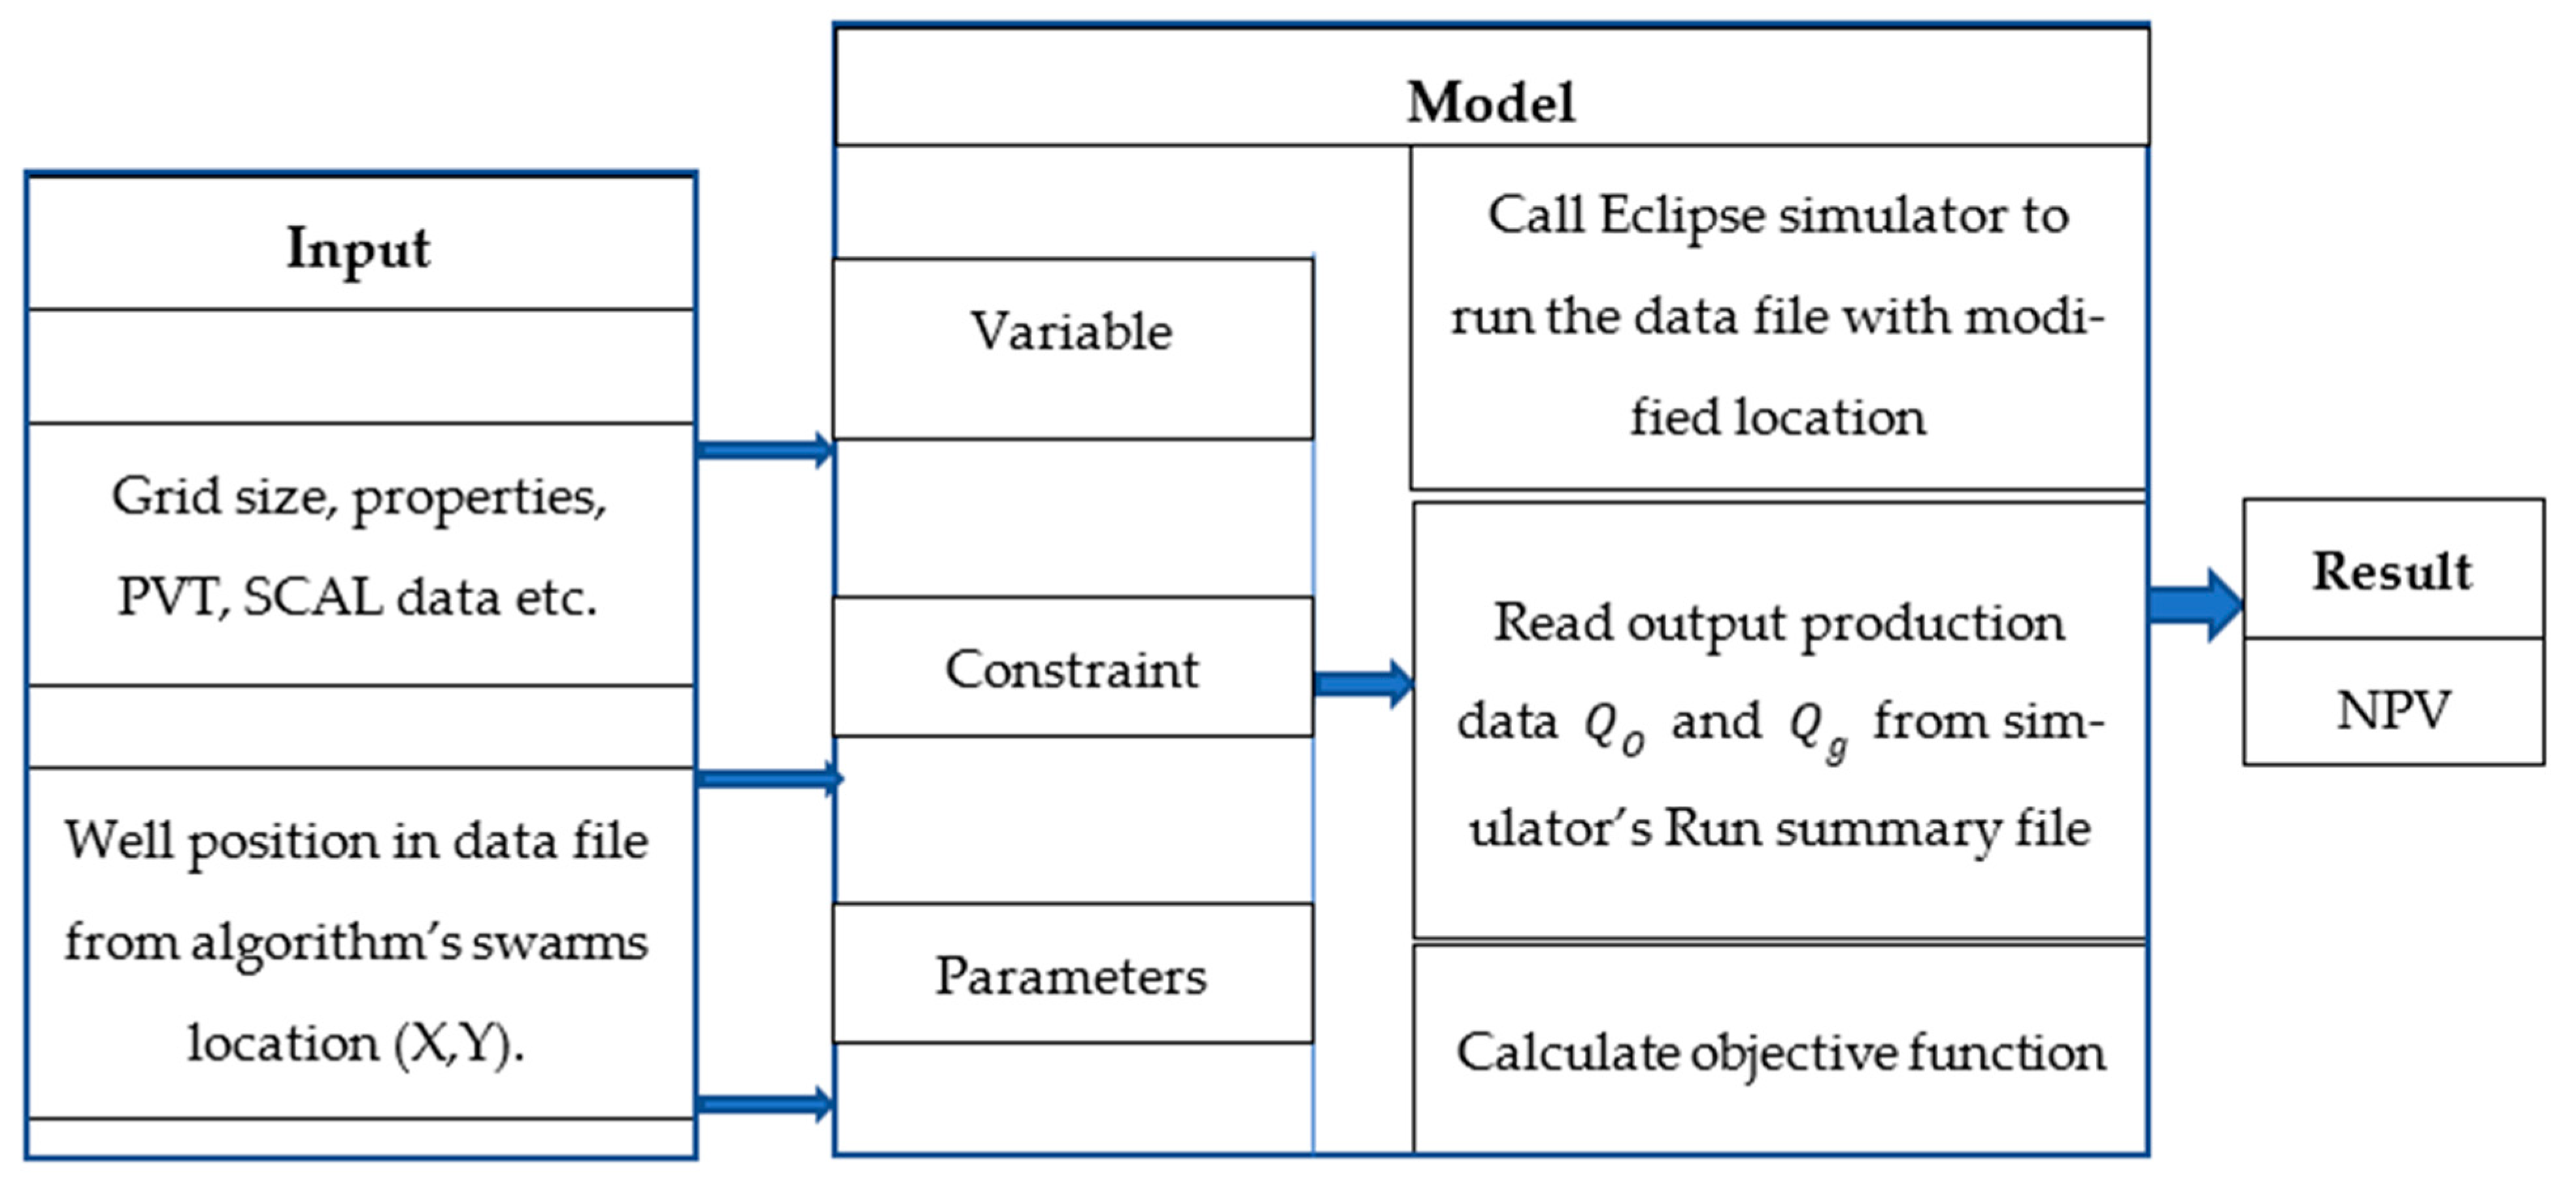
Figure 1 depicts the general flowchart of well placement optimization. To address this problem, the researchers used several different methods to determine the right approach for the problem. In previous research, conventional and non-conventional optimization techniques have been applied to resolve this problem. However, both gradient-based and gradient-free optimization techniques suffer from local optima [65].

3. Methodology

Metaheuristic algorithms are stochastic and non-deterministic in nature. It was first developed in 1995 by Kennedy and Eberhart [66]. There are various types of metaheuristic methods like local search, simulated annealing, tabu search, variable neighbourhood search, population-based or trajectory-based search, etc. Among all the metaheuristic search algorithms, some of the most popular algorithms are the crow search algorithm, particle swarm optimization, the gravitational search algorithm, etc. Since the well placement optimization problem is considered as a multimodal optimization problem, the proposed NCSA algorithm can be applied to harmonic elimination and the economic emission dispatch problem. In Figure 2, an overview of the optimization model is depicted. In the following section, optimization techniques are discussed.

3.1. Crow Search Algorithm (CSA)

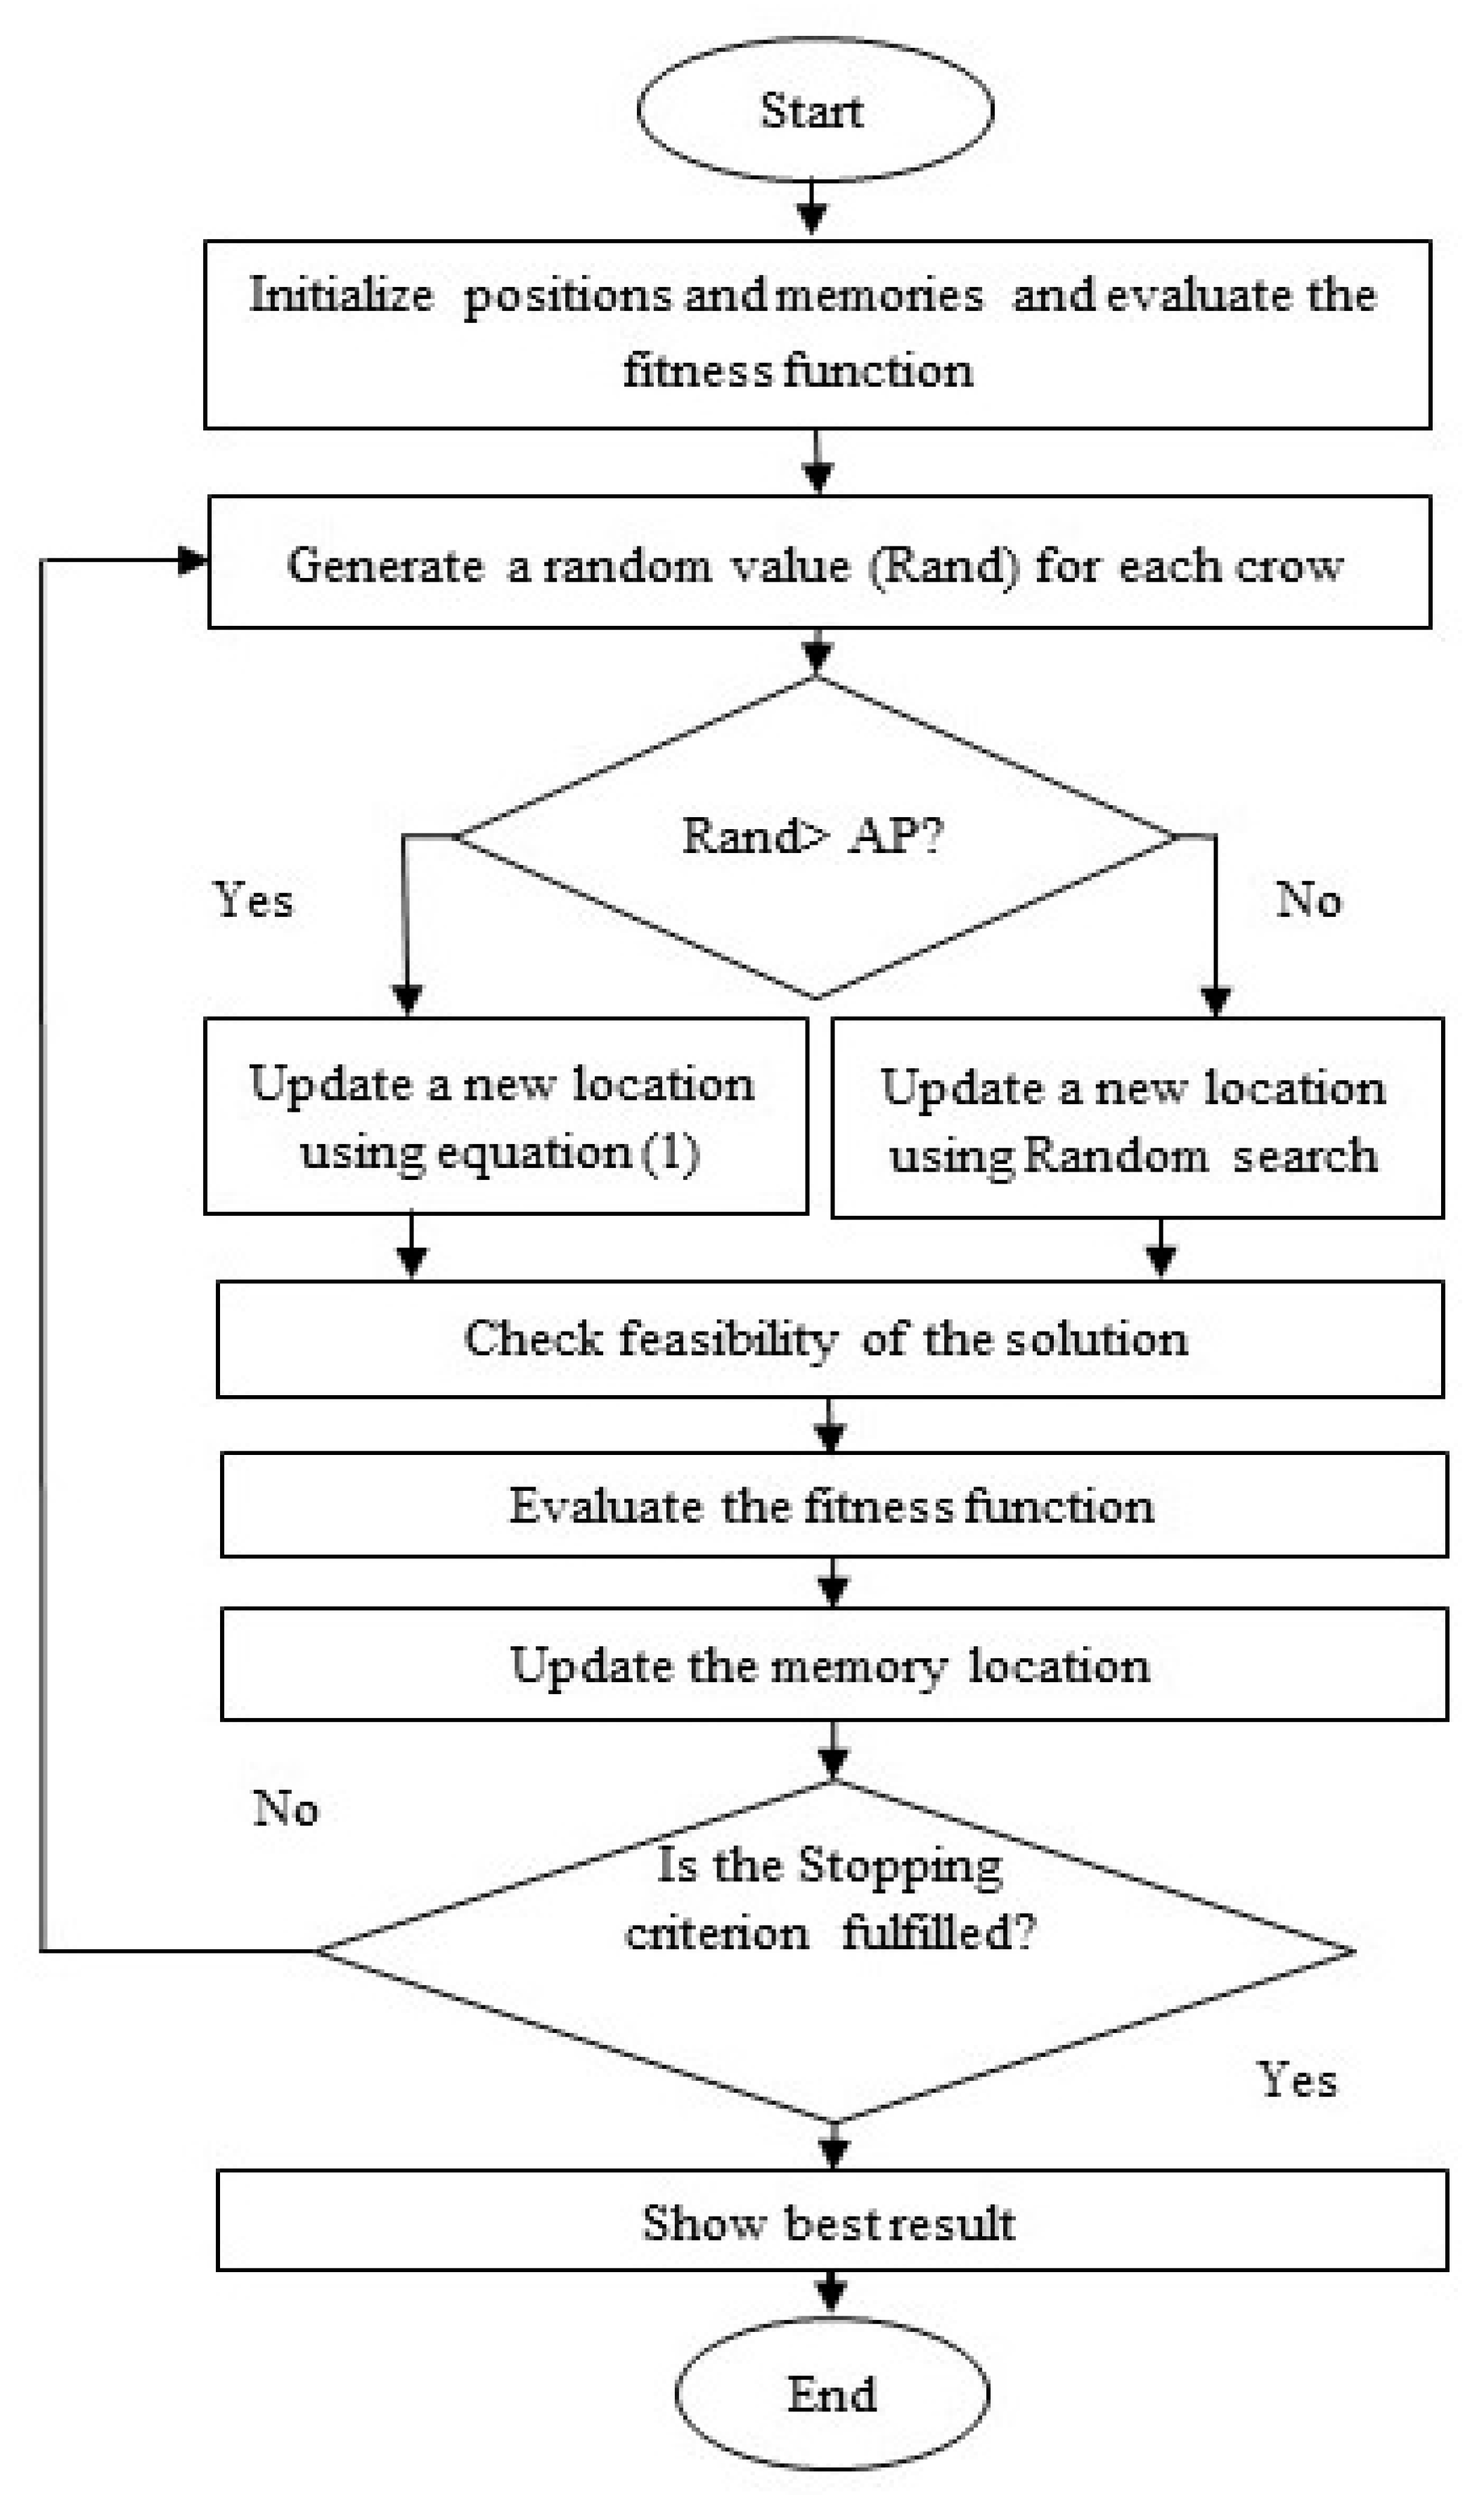
The crow search algorithm is inspired by natural events. In Figure 3, the flow chart diagram of the primary crow search algorithm is shown. Crows have astounding capacities to take care of complex problems. They closely observe other birds and watch very carefully where others try to hide their food. They attempt to take the food when the proprietor vacates their spot. The crow search algorithm is designed based on the following facts.
  • Crows live in a herd;
  • Crows remember the location of concealed places of food;
  • Crows can commit burglary by following the other crows;
  • Crows conceal their collectives that have been robbed.
In standard CSA, the position of each crow changes according to the perception of other crows. For example, suppose crow i chases crow j to steal hidden food from crow j. Thus, the crow i updates its location to steal hidden food from crow j using the following formula:
X i , i t r + 1 = { X i , i t r + r i f l i , i t r ( M j , i t r X i , i t r )   ;   r i A P i i t r   X i , i t r + 1 = a   r a n d o m   p o s i t i o n   i n   s e a r c h   s p a c e ,
where A P i t   and   f l i , i t r are the awareness probability and flight capability of the ith crow in the itrth iteration, respectively. r i denotes a random number for the ith crow and M j , i t r denotes the memory location of the jth crow for the itrth iteration. Again, M i , i t r + 1 is updated based on the following equation:
M i , i t r + 1 = { X i , i t r   ;   f ( X i , i t r + 1 )     f ( M i , i t r ) M i , i t r .

3.2. Niching Crow Search Algorithm (NCSA)

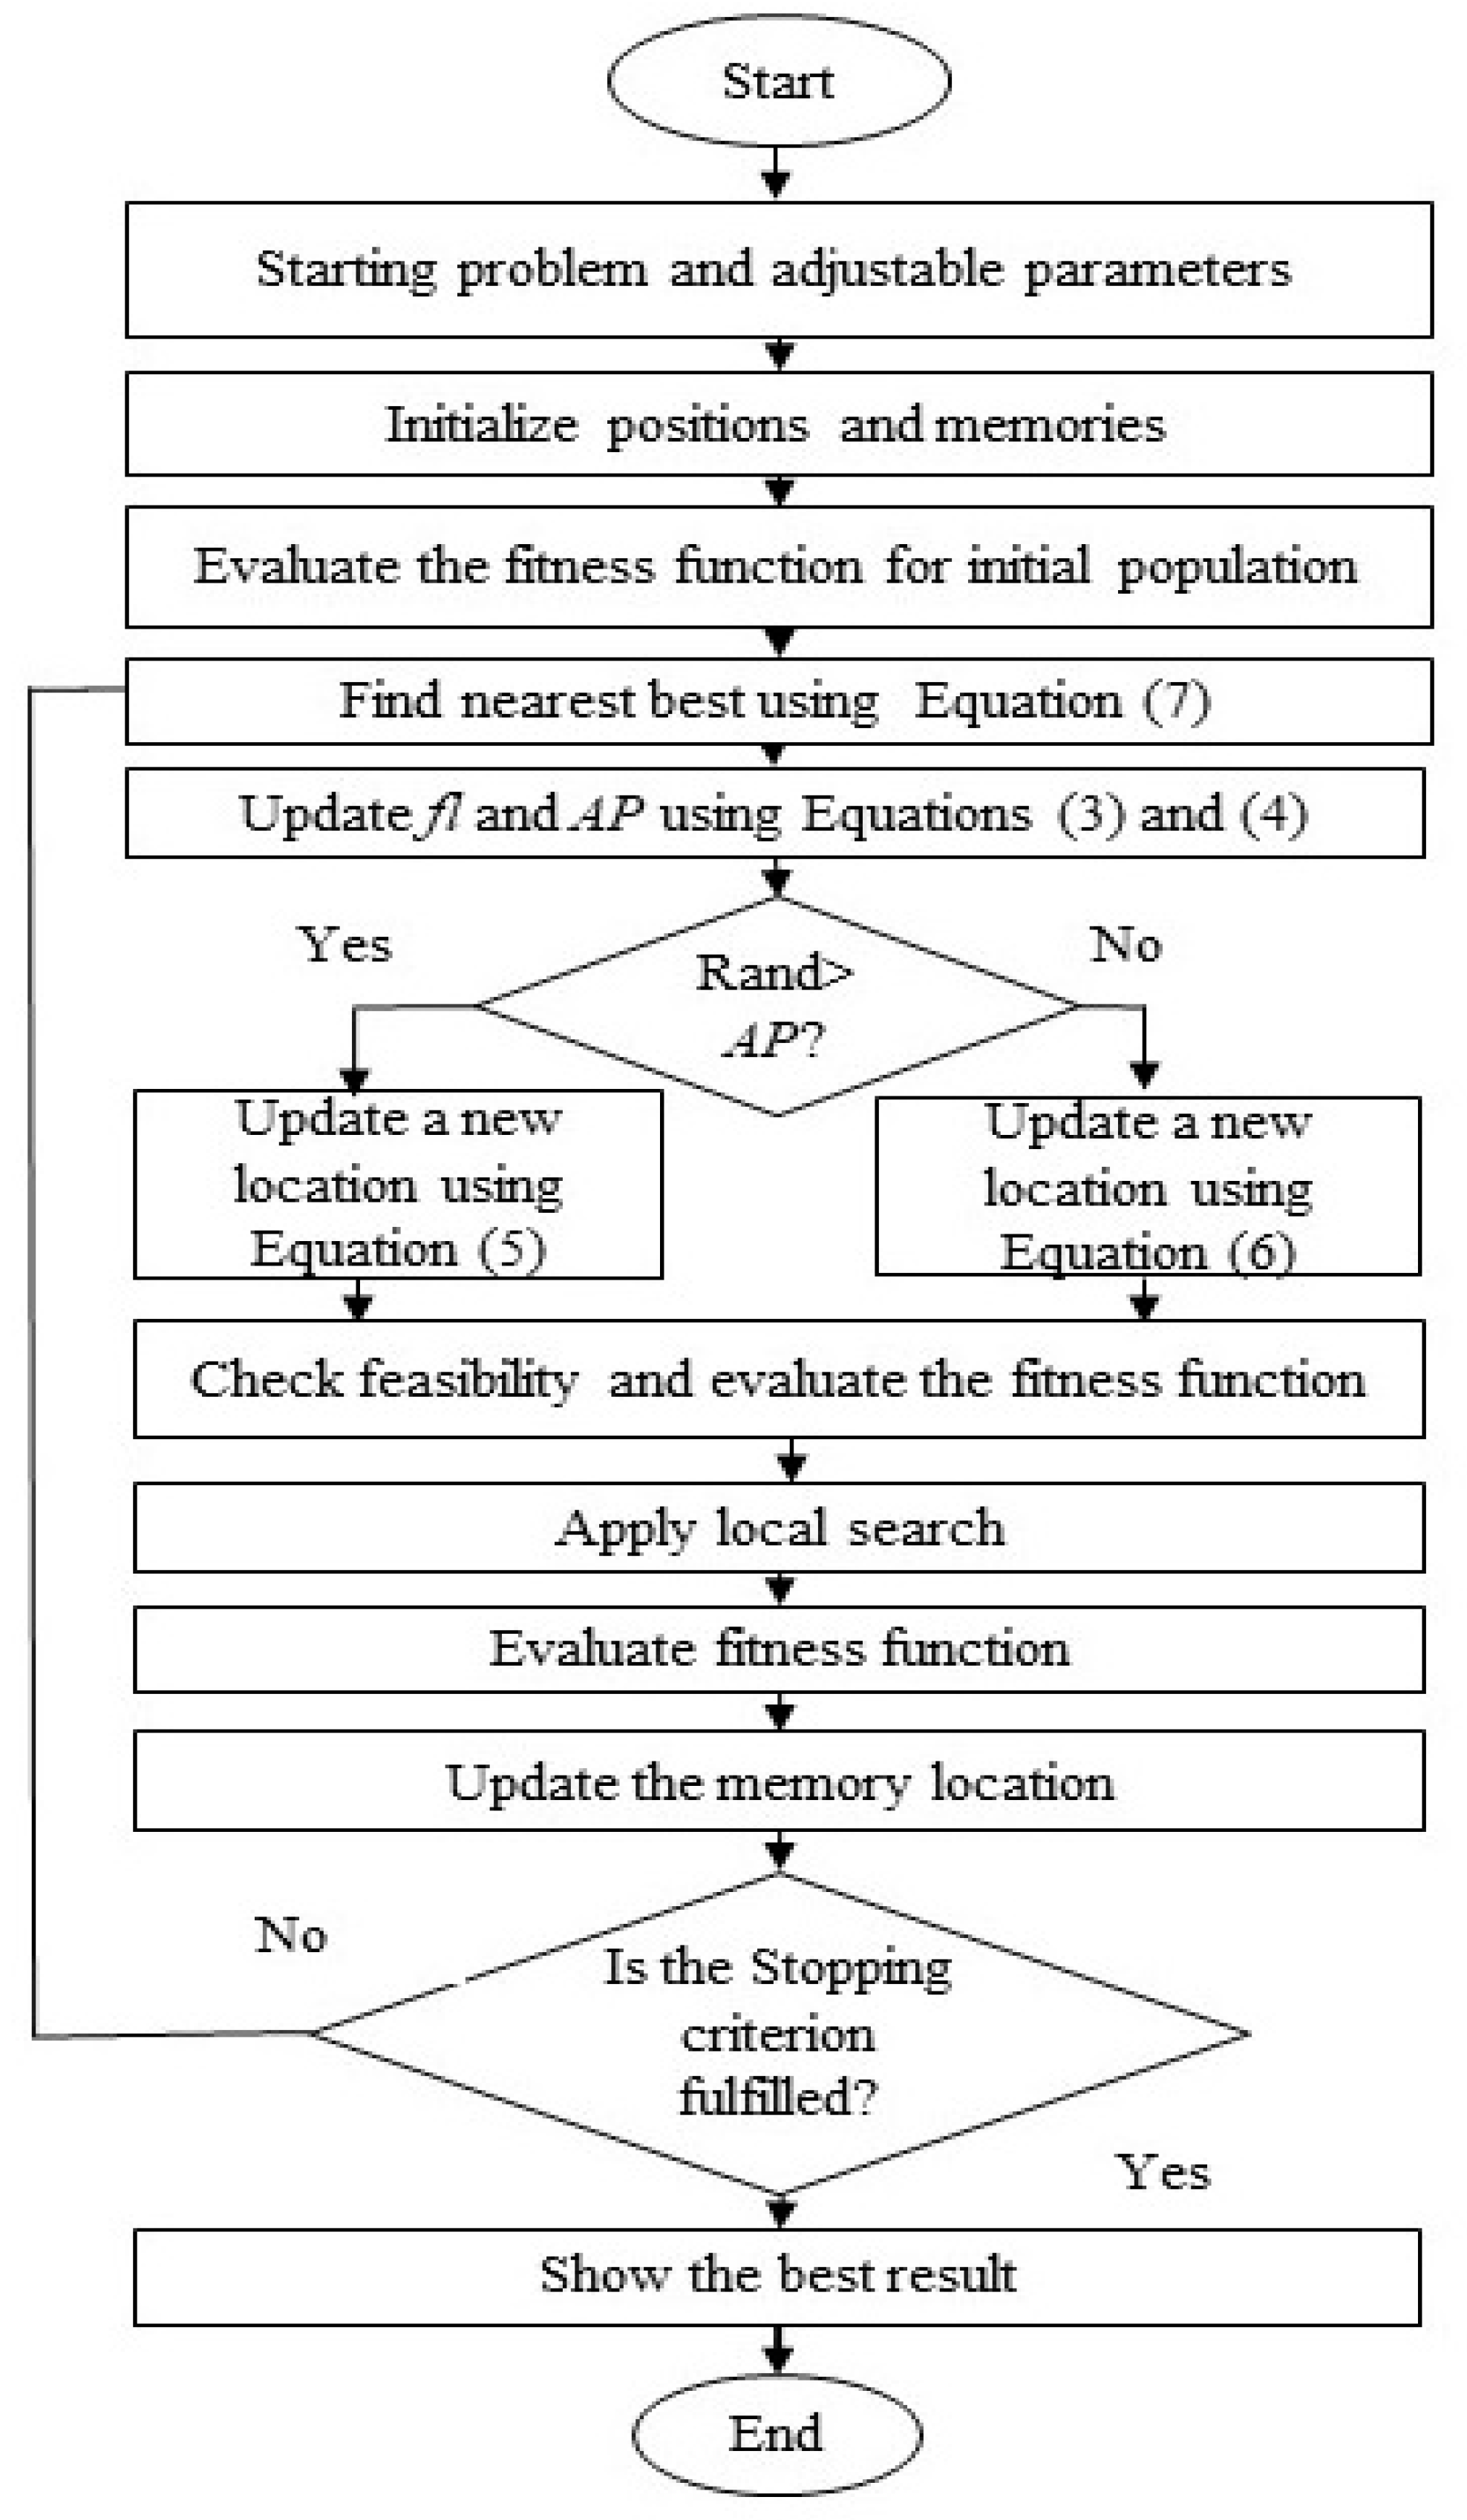
The existing shortcomings of this search algorithm involve its inability to avoid the local optimum and slow convergence speed for multimodal search areas, which is addressed in ref. [67]. Since the search relies entirely on a random search on (12), a faster convergence is not guaranteed. The proposed method presented here brings two changes to tackle the multimodal optimization problem, making it more practical for a range of applications without losing the attractive features of the original technique. Our proposed algorithm modifies the Crow’s position update equation with the gaussian distribution φ and niching technique. With these incorporations, the new method improves the convergence for multimodal optimization problems and provides a better solution compared to the original crow search algorithm. The flow chart of the NCSA algorithm is shown in Figure 4 and pseudo code is shown in Algorithm 1.
Flying capacity ( f l i , i t r ) and awareness probability (AP) remain consistent for the entire search process in the primary crow search algorithm. This is not appropriate for balancing exploration with exploitation. Therefore, the following equations are suggested:
f l i t r = 2 . i t r m a x i t r i t r m a x + 0.5 ,
A P = 1 i t r i t r m a x ,
where the current iteration number and maximum iteration are indicated, respectively, by i t r and i t r m a x .
Again, a global best operator is included and directed to adjust the position of the primary crow search algorithm in (16). The position of the global best operator is set by m i n ( M j , i t r ) . To introduce randomness in the equation, the gaussian distribution φ is incorporated. If r i A P i t is true, then the new location is updated using (16) to provide higher exploration capacity.
X i , i t r + 1 = φ M i , i t r + ( 1 φ ) r i f l i t r m i n ( M i t r ) ;   r i A P i t ,
where φ = r a n d n ( 1 , D ) , and D represents random numbers that are subject to the gaussian standard distribution.   r i is a random number, m i n ( M i t r ) denotes the best memory location in itrth iteration,   M i , i t r denotes the memory location of ith crow for itrth iteration, f l i t r is the flying capacity for itrth iteration. Again, if r i A P i t is false, then (10) is executed to increase exploitation capacity.
X i , i t r + 1 = X i , i t r + r i f l i , i t r ( n e a r e s t b e s t X i , i t r )   ,
where n e a r e s t b e s t is the location of the crow with the best fitness memory from crow i in the nearest location. This inclusion directs towards the crow with the nearest fitness memory, which offers a better multimodal optimization solution.
To locate the nearest best, the fitness Euclidean distance ratio (FER) [68] is used in (17). The crow’s personal best is used in the primary crow search as a memory to preserve the best solution. In this updated crow search technique, a random crow’s memory location is used rather than using a single global best. In this approach, by measuring their FER value, each crow is drawn to a neighborhood point. This technique is incorporated to accurately locate all global optima with sufficient population size. One notable benefit of this approach is it does not require niching parameter specifications.
In each iteration, the nearest best in (17) is determined using (18). To calculate the FER between two crows, crow i and crow j in the population is calculated by using the equation below:
F E R ( j , i ) = ( α ) . f ( p j ) f ( p i ) | | p j p i | | ,
where ||s|| represents the dimensions of the search space that can be determined using its diagonal distance. p g denotes best fitness location and p w denotes the worst fitness location of crows. α is a scaling factor and α = | | s | | f ( p g ) f ( p w ) , where f ( p w ) worst fitness value and f ( p g ) is the best fitness value of crows.
Algorithm 1 Pseudo Code: Proposed NCSA
Begin
Initialize positions, memory positions randomly and
set crows size (D), swarm size of all crows (k), and maximum number of iterations (itermax);
set iter = 0;
whileiter < itermax do
set itr = itr+1;
forj = 1 swarm size do
find euclidian distance among crow’s best position;
calculate fitness euclidean distance ratio using (14)
find nearest best for j th crow
end for
fori = 1 to swarm size
calculate f l i , i t r and AP using (10) and (11)
ifrand > AP
calculate X i , i t r + 1 using (12)
else
calculate X i , i t r + 1 using (13)
end if
evaluate the cost function;
update memory position;
do a local search;
end for
end while
In the niching technique, swarms may fluctuate around the global best, but they can not reach it because of their poor local search capabilities. Hence, a local search technique is implemented and the pseudo code is shown in Algorithm 2. This technique uses local searches similar to [69], where a solution is generated near the crow’s memory position with a small step. Therefore, a better solution is given by the local search process. Besides, it speeds up the convergence.
Algorithm 2 Pseudo Code: Local Search
fori = 1 to swarm size
find nearest memory location to memory location(i)
iffitness value of nearest memory position > = fitness value of memory location(i)
Local = memory location(i) +0.5 rand(1,D). (nearest memory location—memory location(i))
else
Local = memory location(i) + rand (1,D). (memory location(i)—memory location nearest)
end if
evaluate the fitness value for Local
iffitness value of Local > fitness value of memory location(i)
memory location(i) = Local
end if
end for

3.3. Computational Complexity

Due to the incorporation of the niching technique and local search, computational complexity is increased. The local search intensely searches around the global best to fine-tune the obtained result. Again, in the niching search, measurement of euclidian distances between crows is required, which adds more computation expense. However, this study is related to billion-dollar projects. Hence, such complexity can be considered if better results are obtained.

4. Result and Discussion

4.1. Benchmark Functions

The classic Benchmark functions used to evaluate the performance of the proposed algorithm are shown in Appendix A [70]. The benchmark functions in Appendix A can be divided into three categories: unimodal, multimodal, and fixed-dimensional multimodal. For evaluation, 30 particles and 1000 iterations are considered for each algorithm. All the algorithms run 30 times, and the statistics (such as mean and standard deviation) are recorded in Table 1, Table 2 and Table 3. To demonstrate the superiority of the algorithm, we compared the results of the algorithm with Particle swarm optimization (PSO) [71], gravitational search algorithm (GSA) [71], and primary crow searches. Statistically, of the 23 test functions, the niche crow search (NCSA) algorithm is superior in 15 functions, the PSO is superior for 7 functions, the CSA is superior for 8 functions, and the GSA is superior for 6 functions.

4.1.1. Exploitation Analysis

To test the exploitation analysis of the proposed algorithm, the unimodal benchmark functions f1 to f7 from Appendix A are used. In Table 1, the results imply that NCSA is a better algorithm than PSO, GSA, and the crow search algorithm. Therefore, NCSA improves the exploitation capacity of crow search and outperforms all other algorithms listed in f1 to f7 in Appendix A, except in f6.

4.1.2. Exploration Analysis

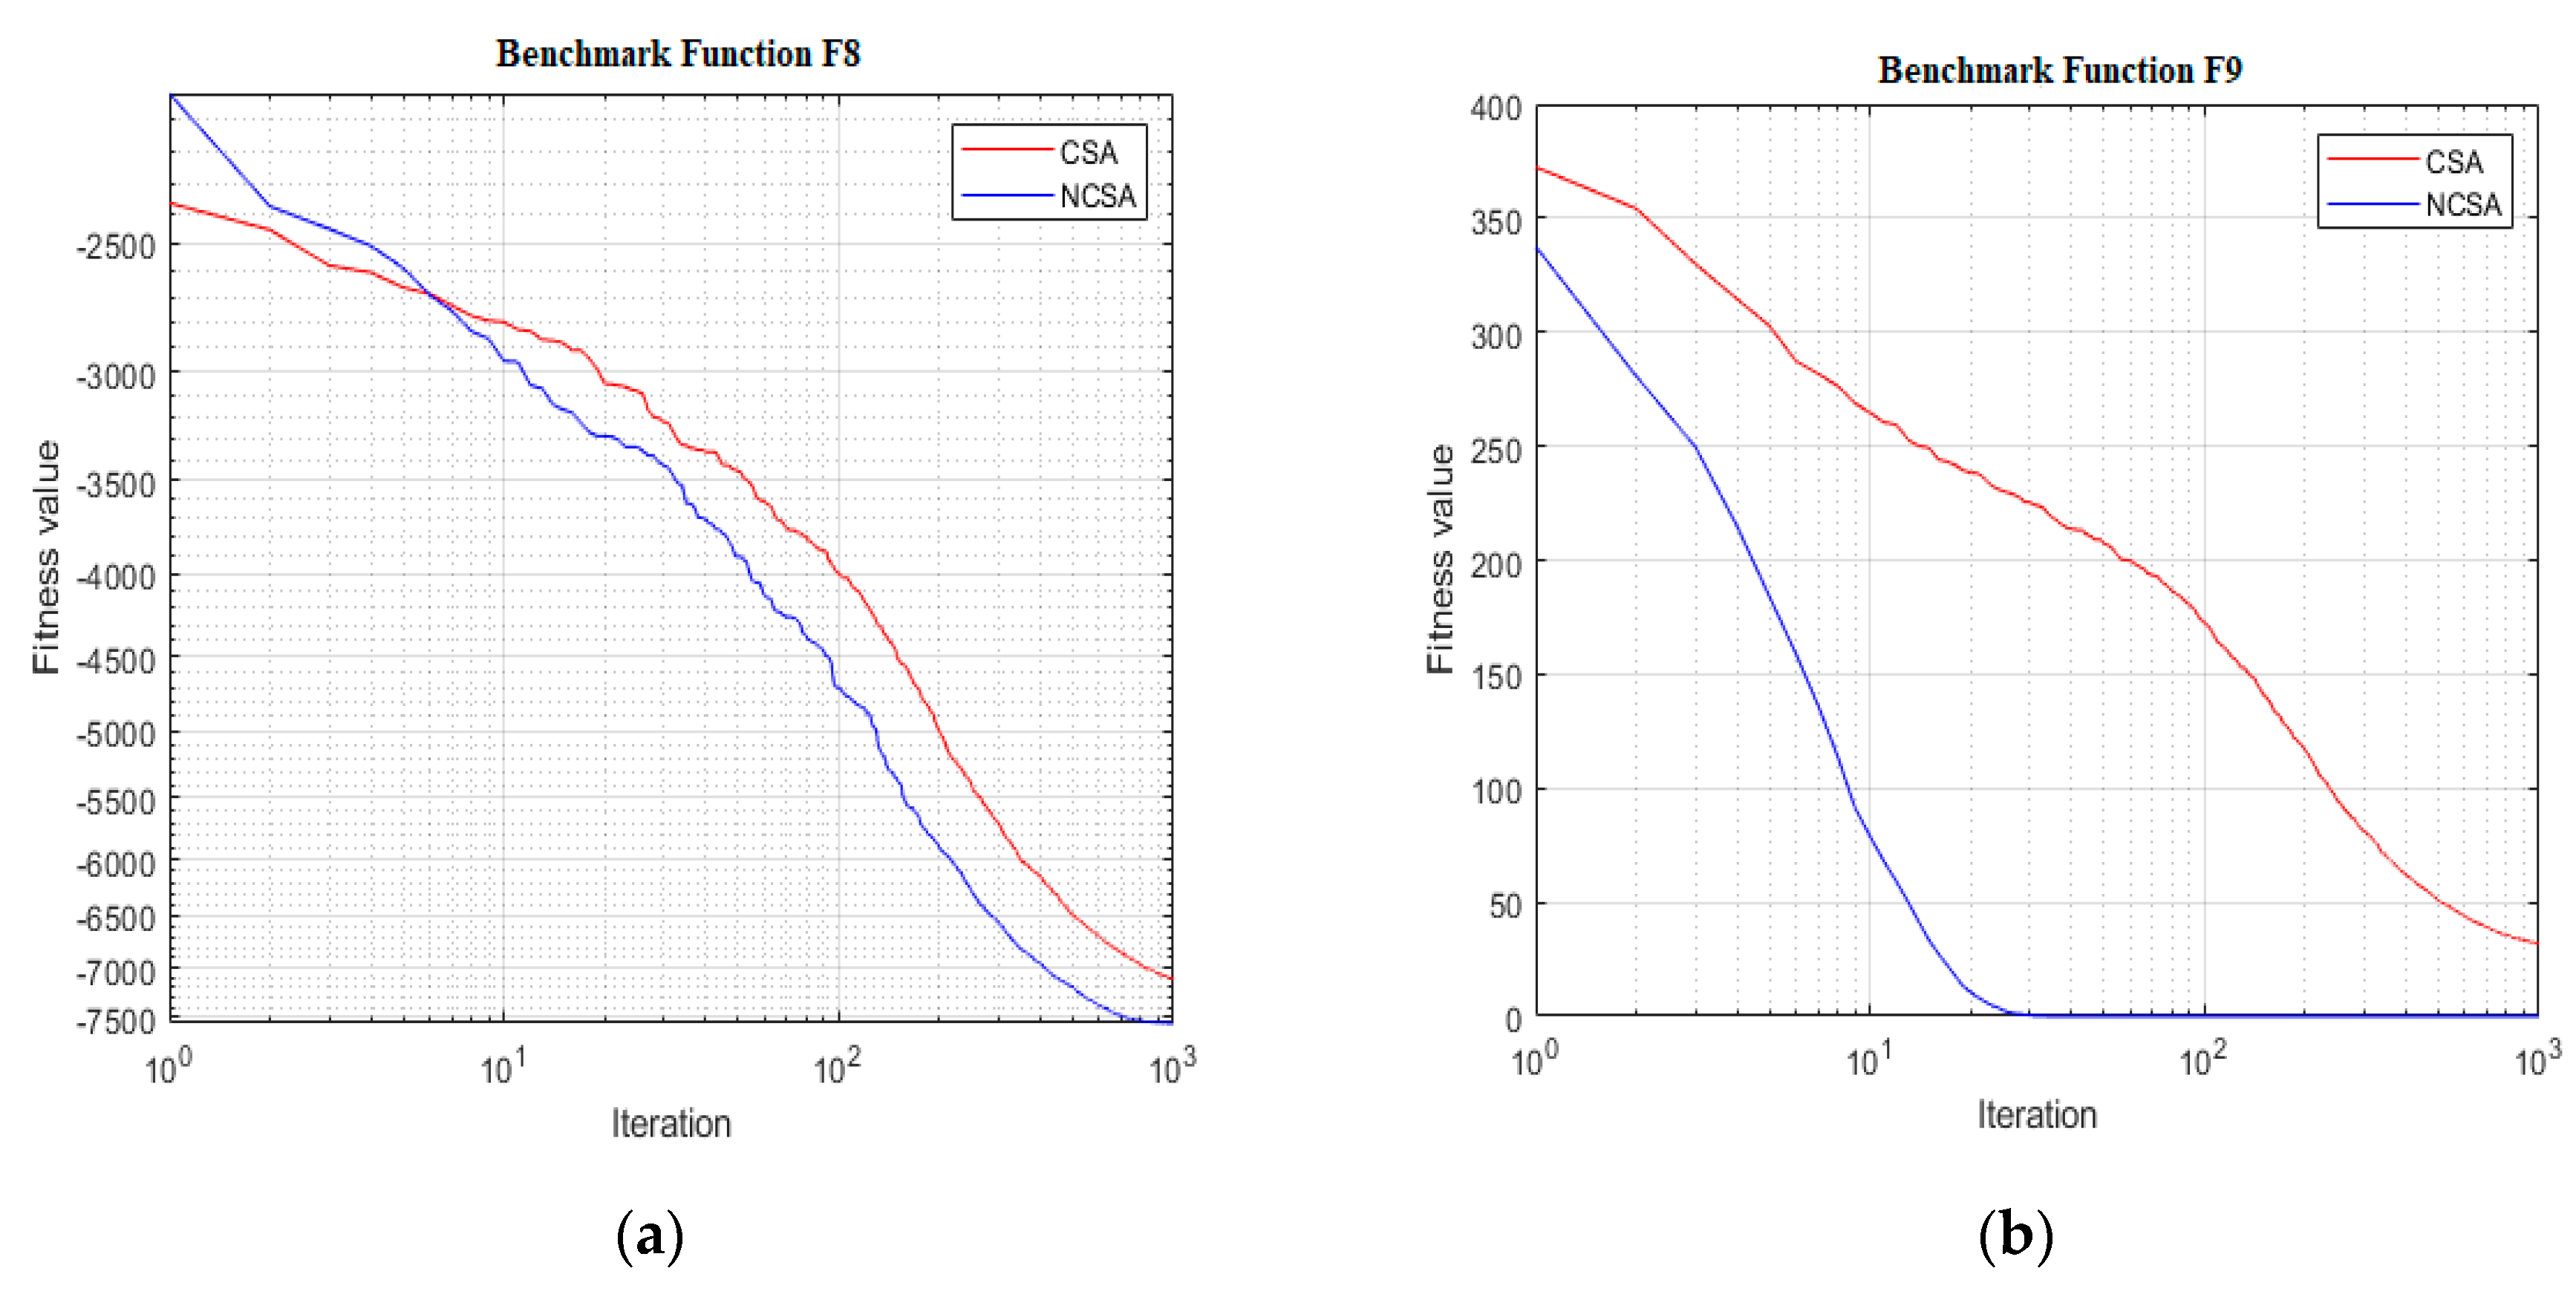
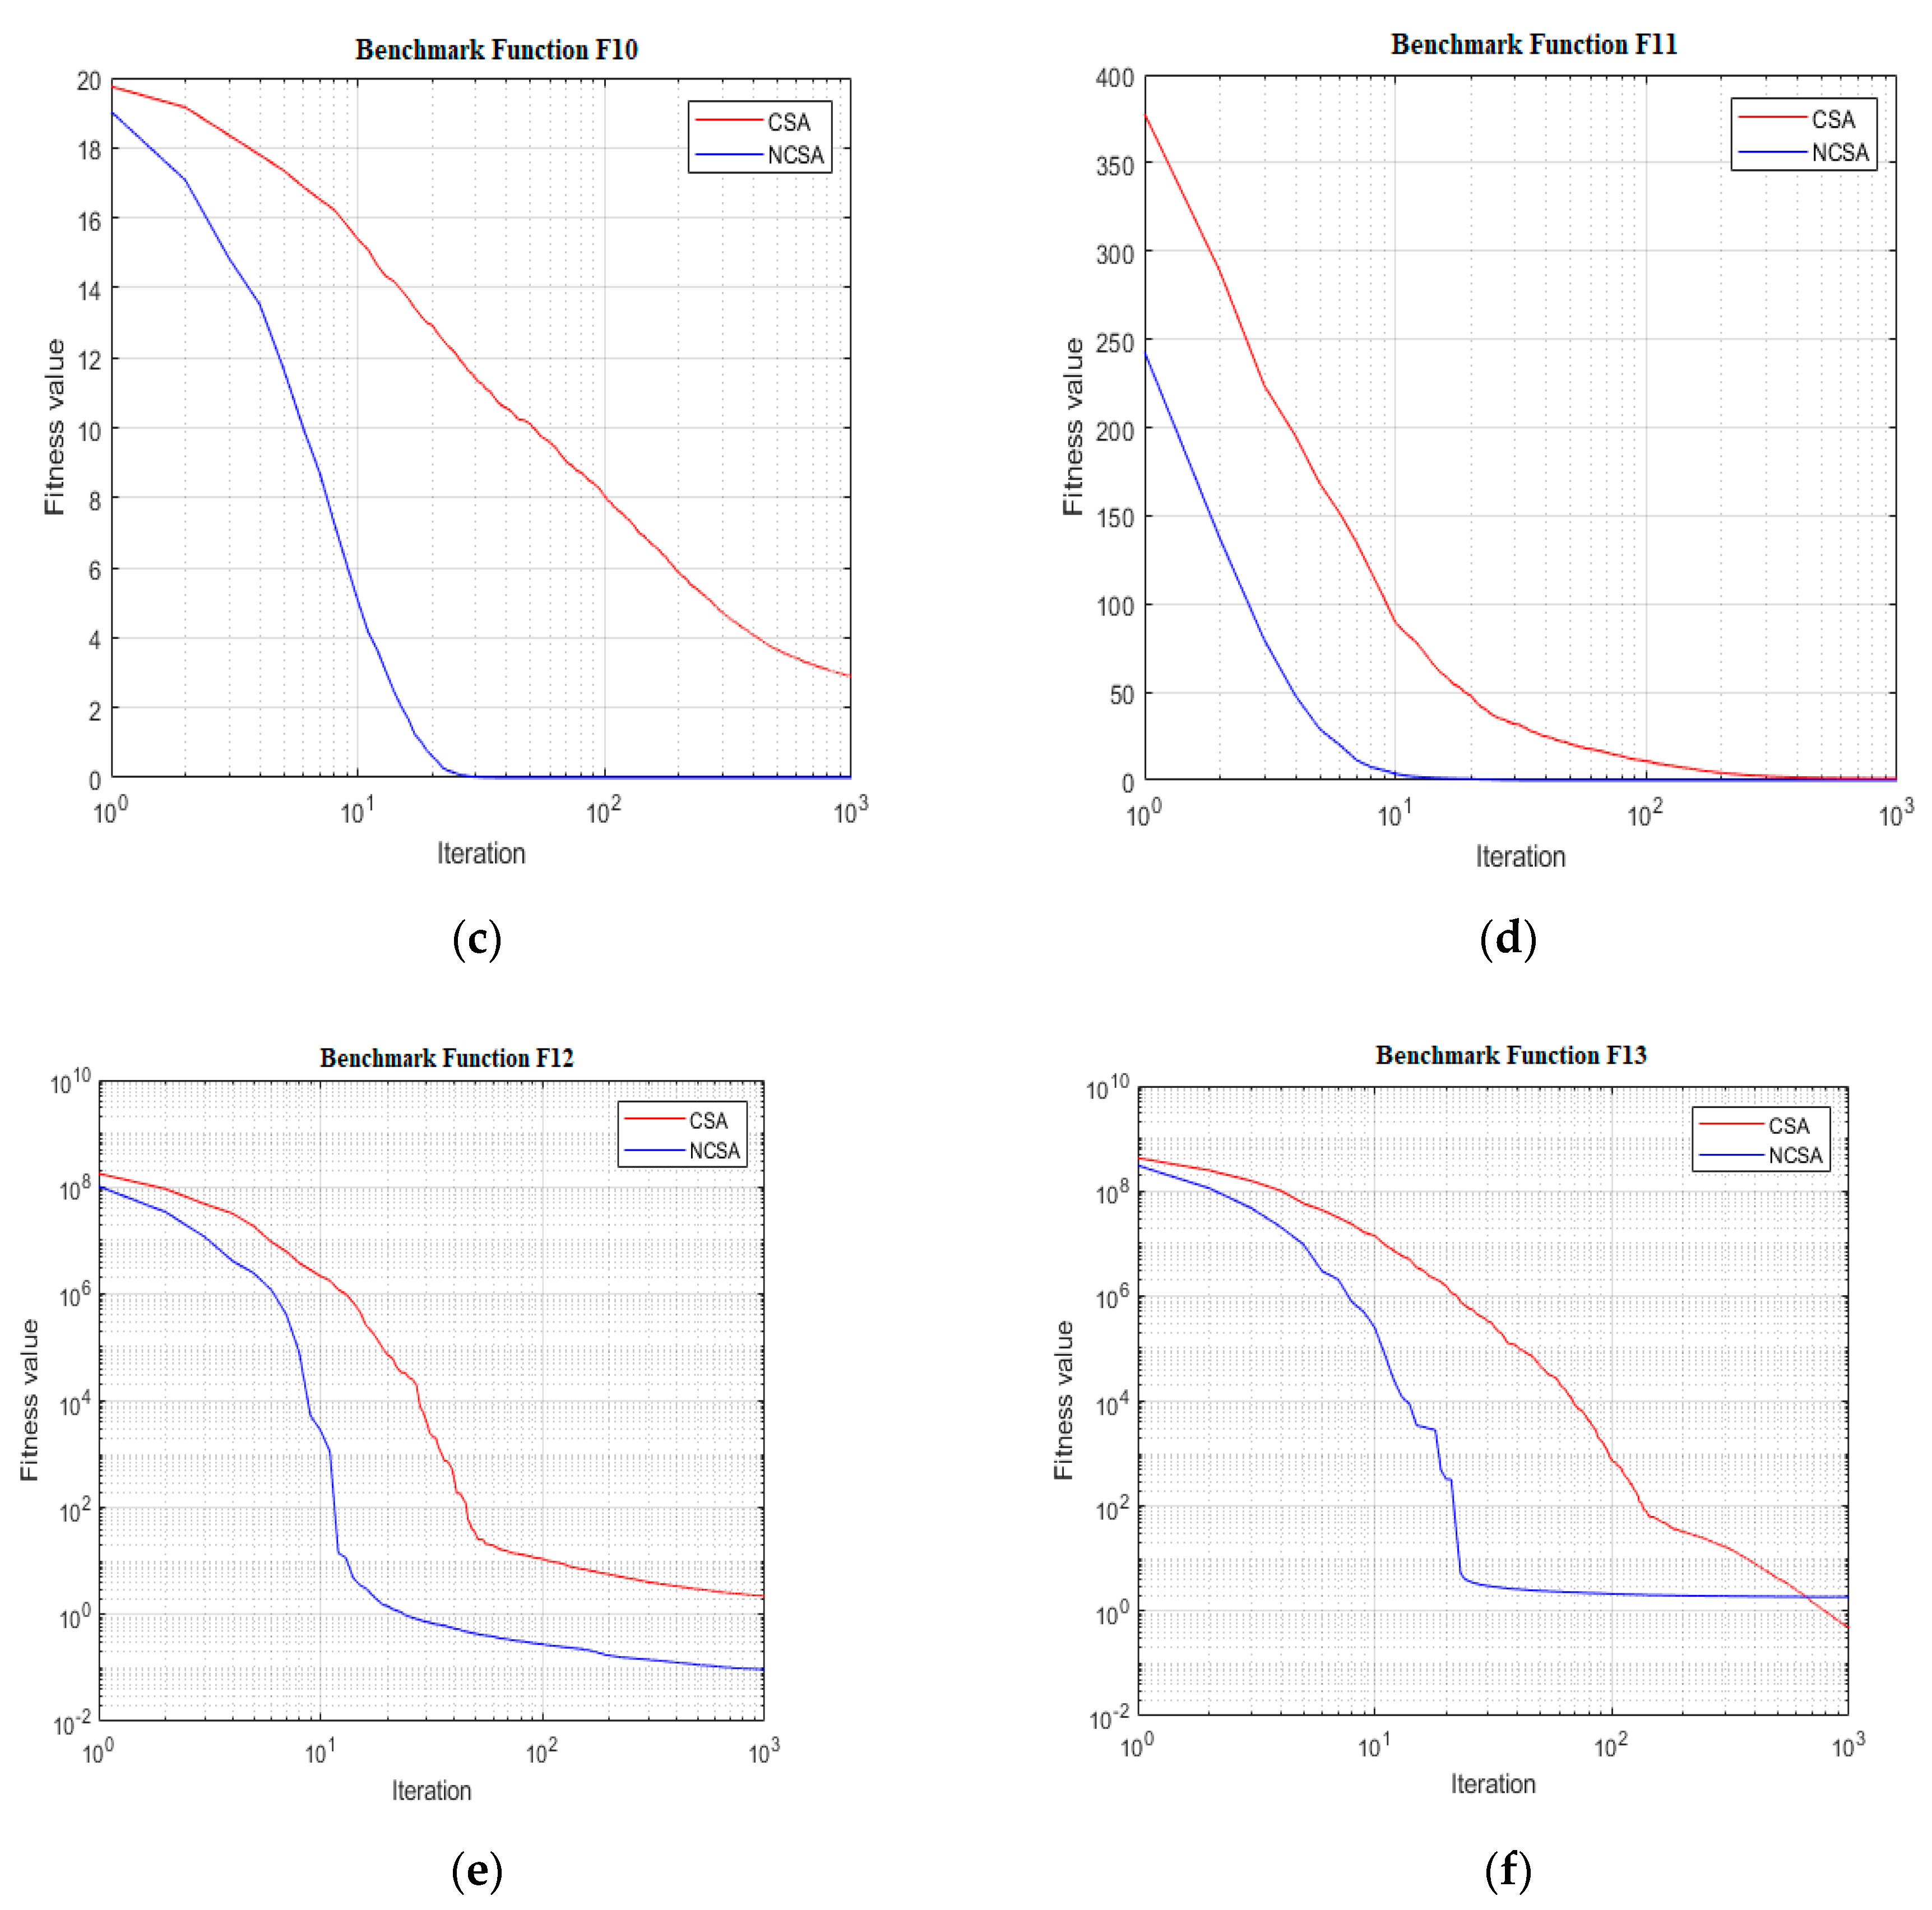
The benchmark functions from f8 to f13 (Appendix A) are suitable for the exploration ability test. These multimodal functions have many local optimums, and finding the global best is very difficult. Since the focus of the study is to tackle multimodal optimization problems, the proposed algorithm should work better in these benchmark functions. According to Table 2, the proposed NCSA was better than CSA. Table 2 and Table 3 demonstrates that the proposed NCSA algorithm outperforms other algorithms in f8, f9, f10, f11, f15, f16, f17, f18, and f19 benchmark functions. In other cases, it offers competitive results. Therefore, the results show that NCSA is superior in terms of exploration capacity.

4.1.3. Convergence Analysis

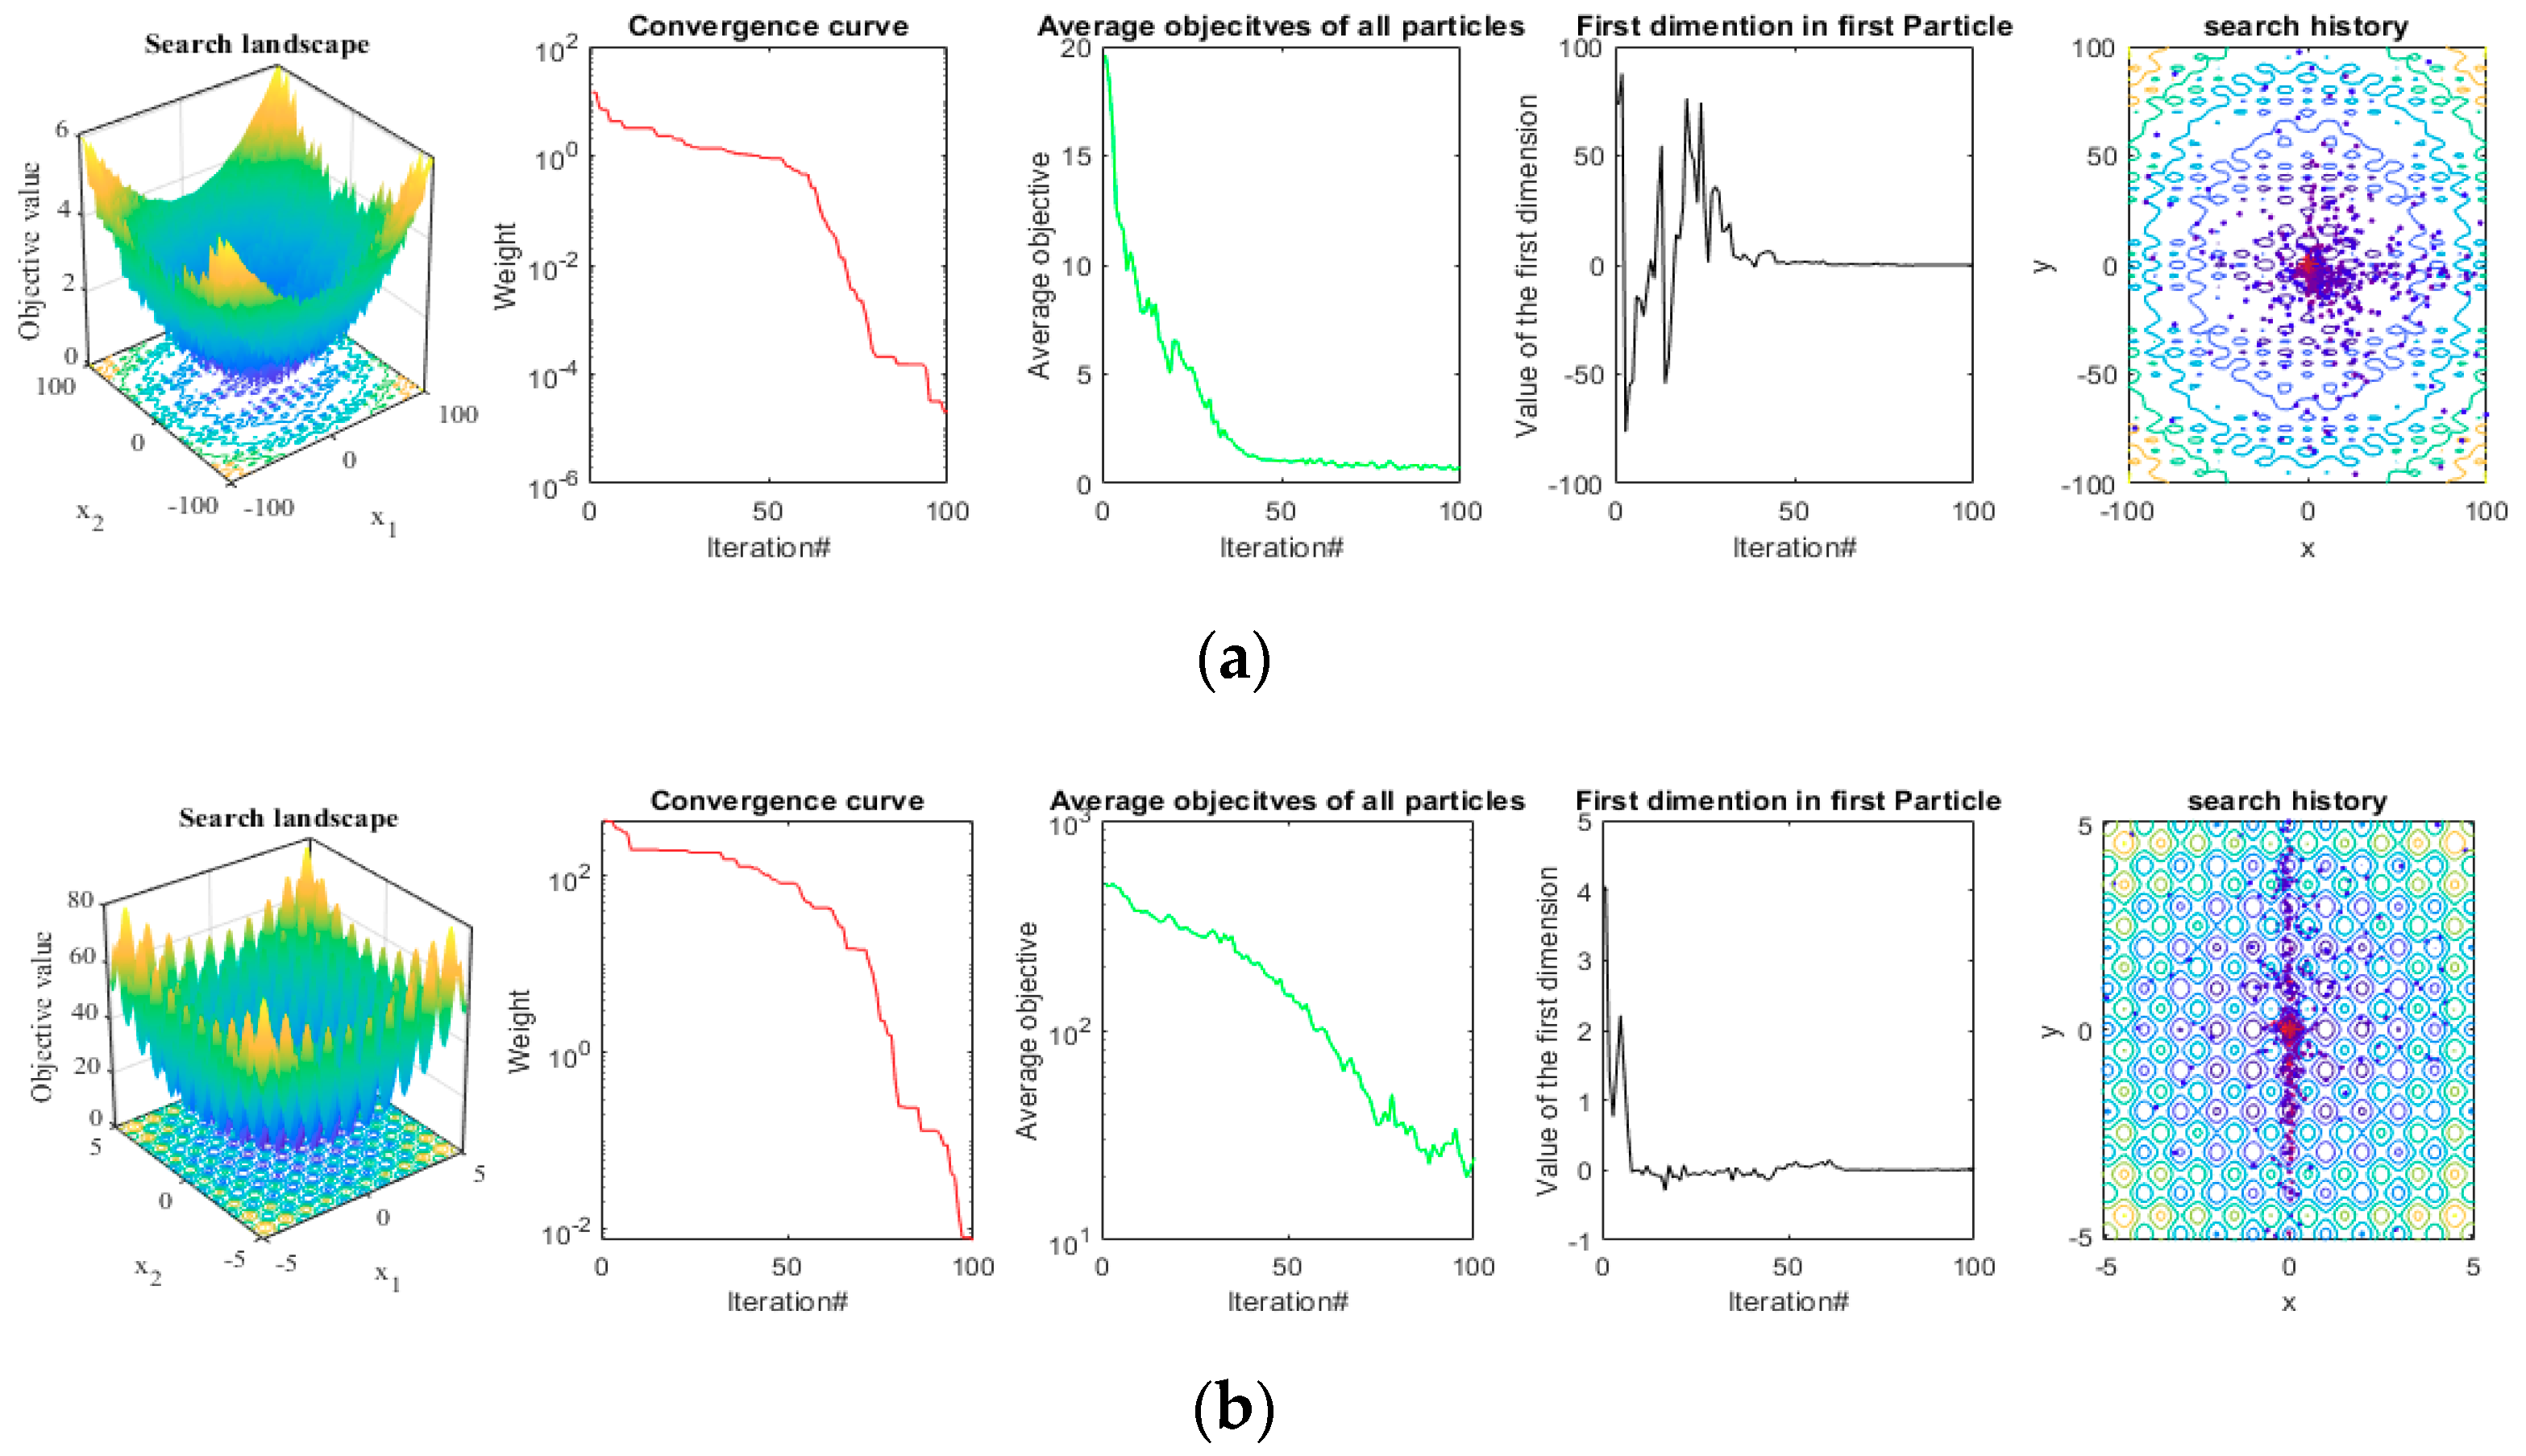
Since the focus of the study is to tackle the multimodal optimization problem, in Figure 5 the convergence curves of the benchmark functions from f8 to f13 are shown. In these Figures, the X-axis shows the number of iterations, and the Y-axis shows the fitness value of the reference function. From Figure 5, it can be concluded that NCSA provides better convergence and better solutions for multimodal problems than CSA. In addition, Figure 6 shows the search history for the NCSA technique.

4.2. Well Placement Optimization

To optimize the well placement problem in these reservoirs PSO, CSA, GSA, and NCSA are used. The Eclipse simulator will provide production data for specific well placement. The optimization algorithm will provide the specific location of the well. Each algorithm was run 16 times. In each trial, the number of iterations and particles for all algorithms were 100 and 20, respectively. The parameters used in these algorithms and the economic parameters used to evaluate (4) are shown in Table 4 and Table 5.

4.2.1. Description of Case Studies

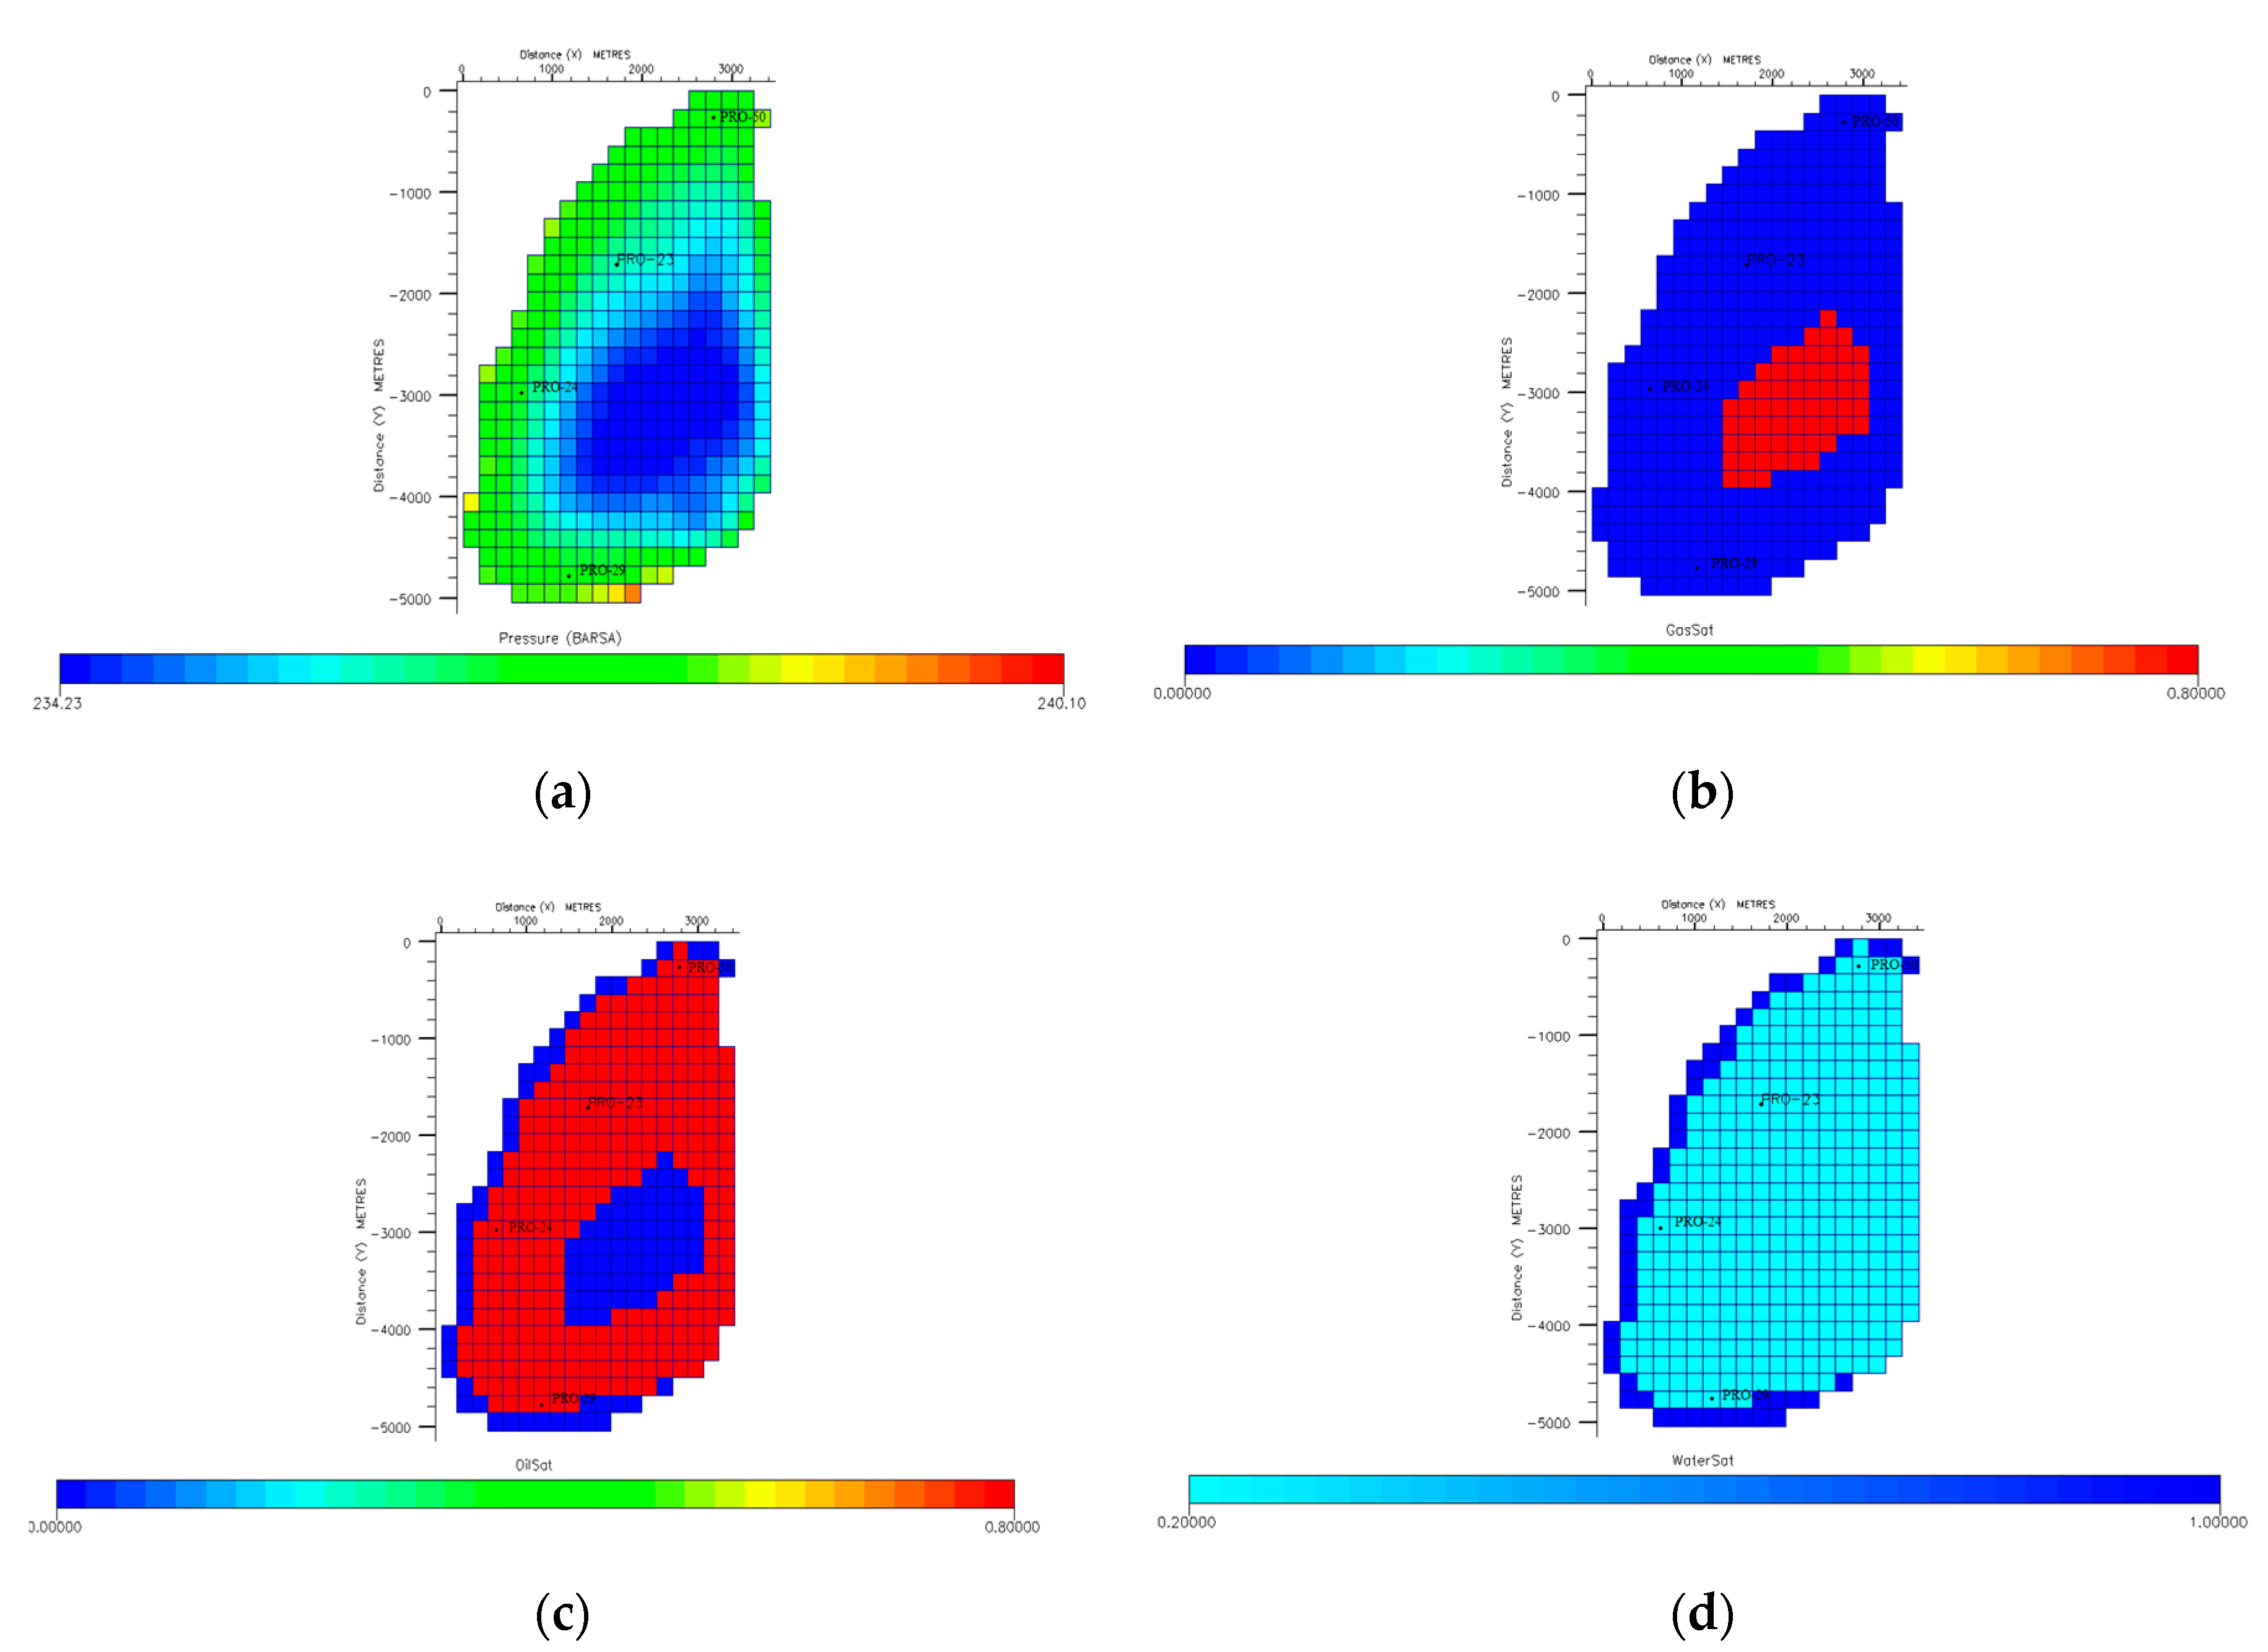
To perform the experimental tests, for case study 1, the PUNQ-S3 reservoir model is considered. PUNQ-S3 is a real field-based synthetic reservoir model used in Elf Exploration production. Details of the reservoir model can be found in [73]. The PUNQ-S3 has a 19 × 28 × 5 grid block. In this study, the authors have considered four vertical wells for optimization purposes. Each well has coordinates (x, y). Therefore, the total number of variables optimized in this experiment is 2 × 4 . Figure 7 shows the initial condition for the PUNQ-S3 reservoir in case study 1.
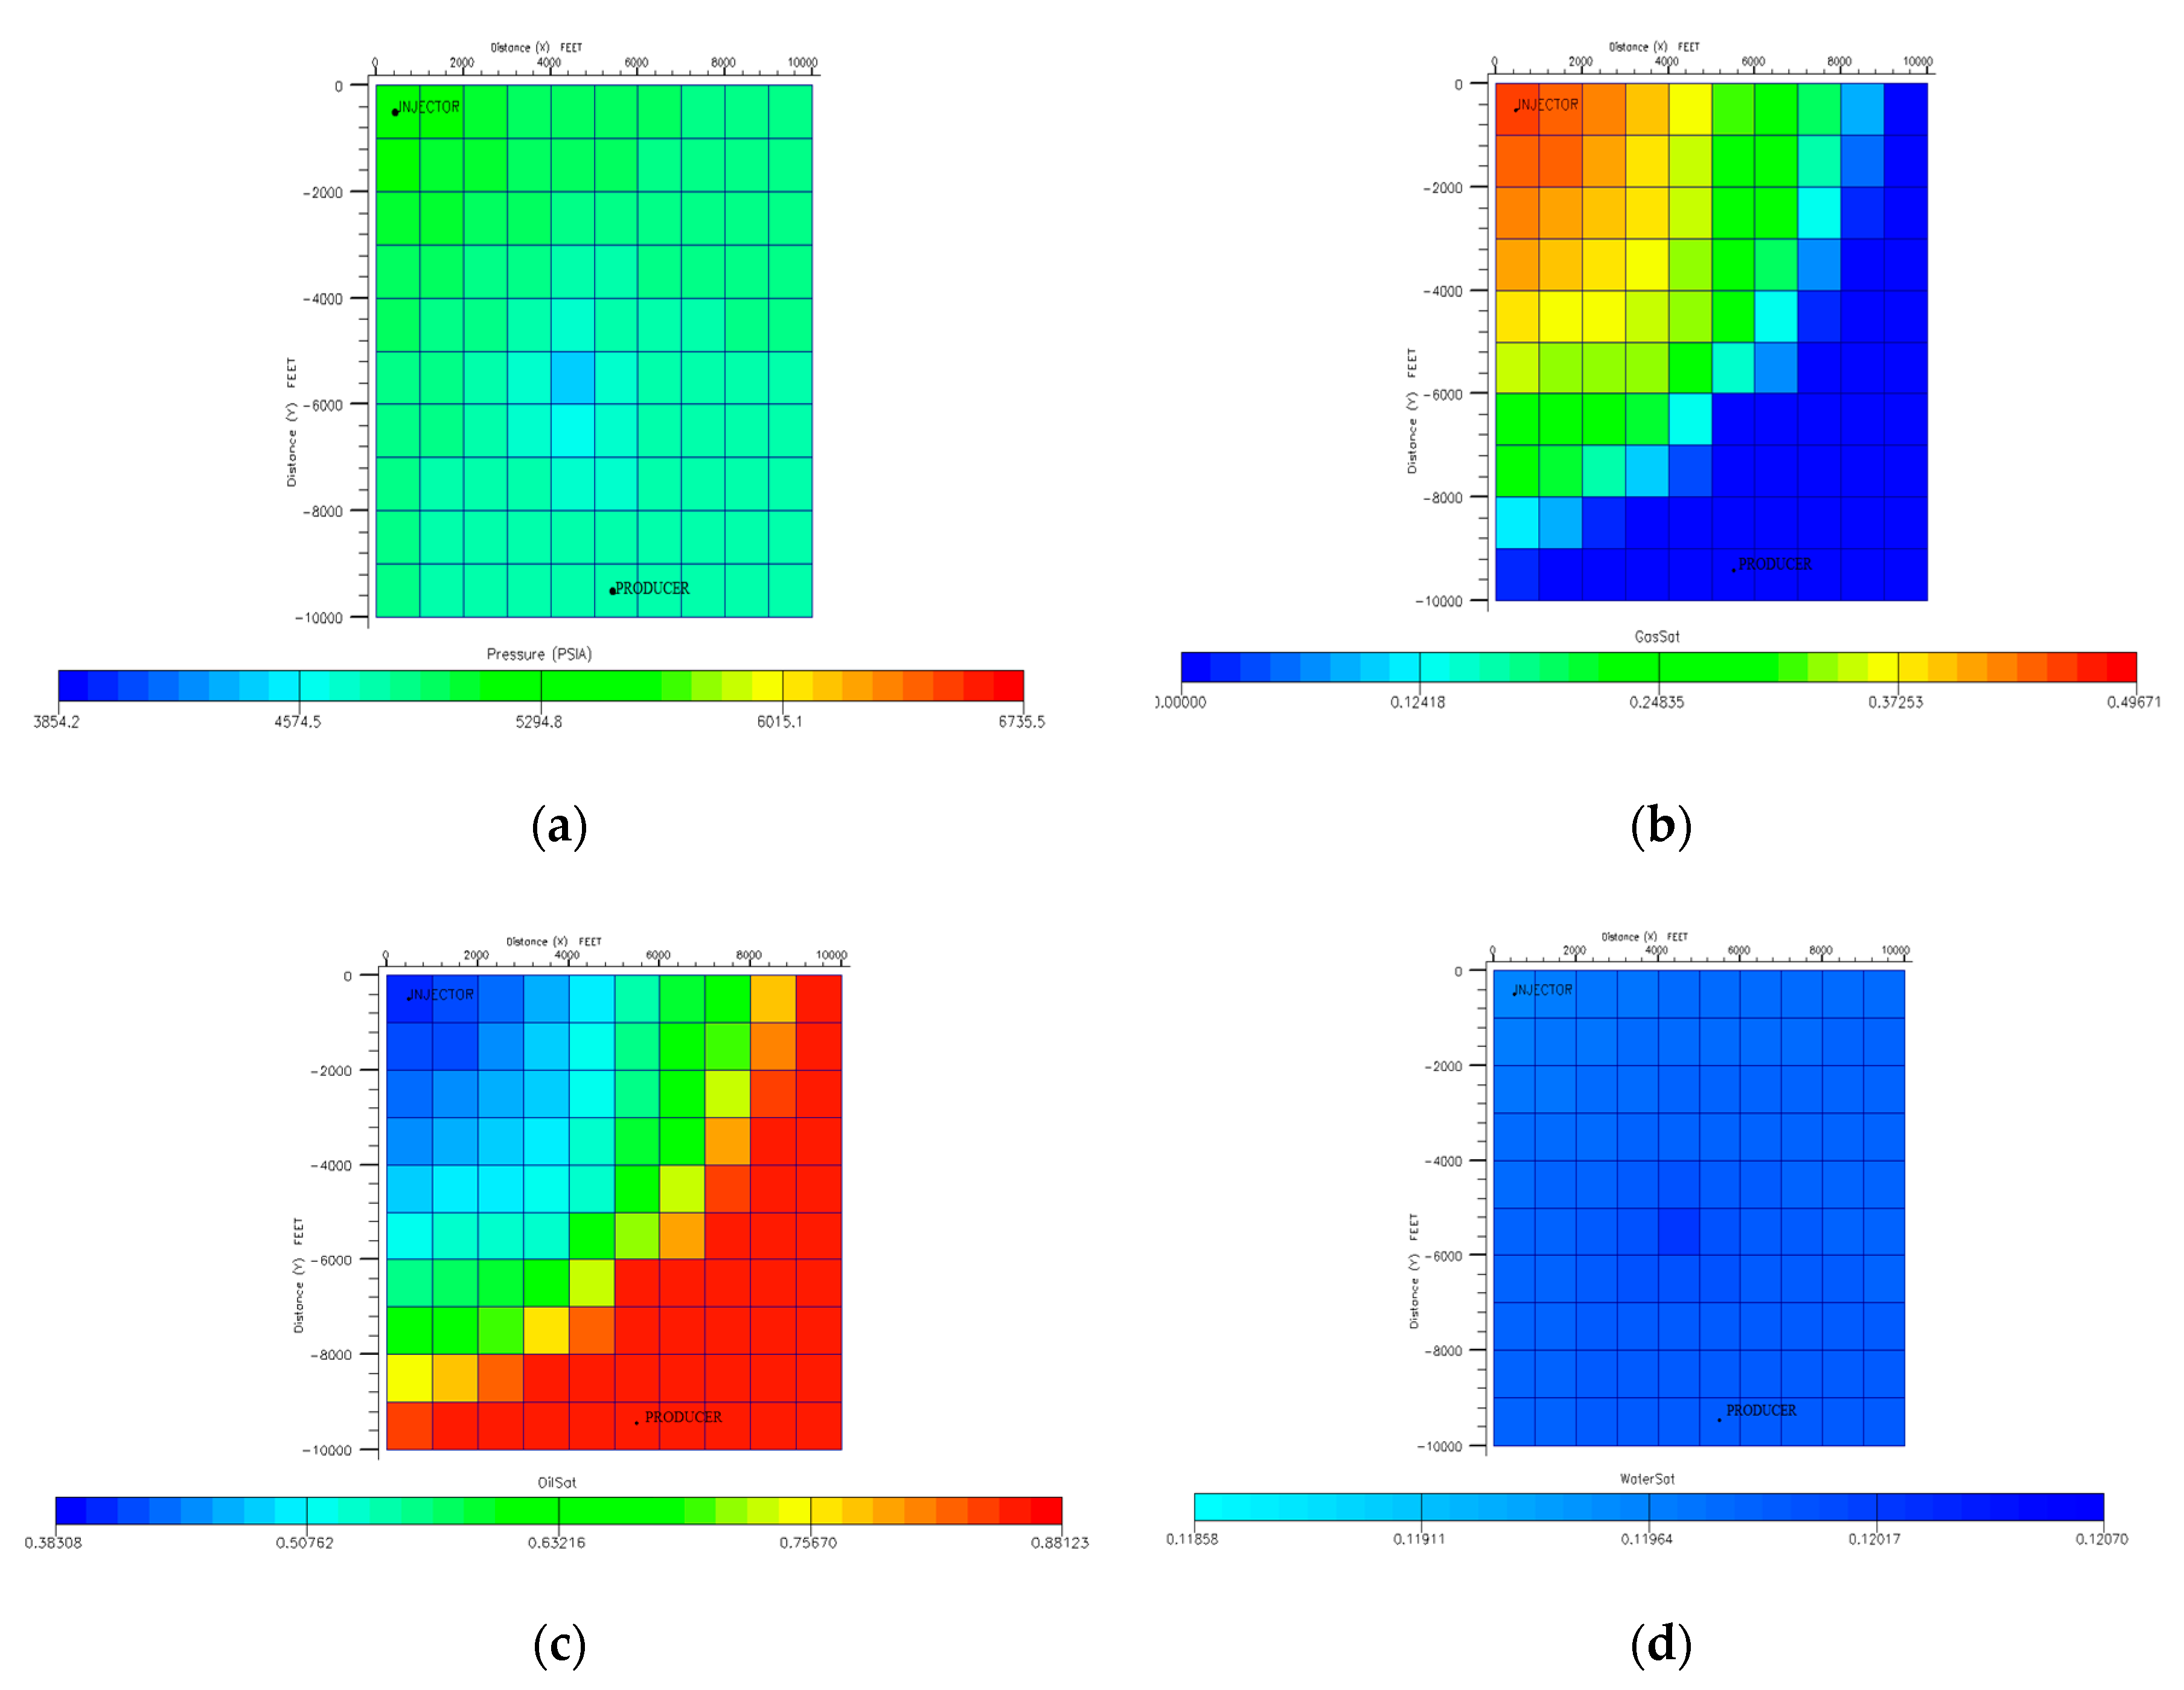
Again, to run the second case study, the authors have considered the first SPE model. The first SPE model is a synthetic reservoir model based on a three-dimensional black oil reservoir simulation problem. Details of the reservoir model can be found in [74]. The first SPE model has a 10 × 10 × 3 grid block. In this study, two vertical well locations were optimized. Therefore, the total number of variables to be optimized in this experiment is 2 × 2 . Figure 8 shows the initial condition for the SPE-1 reservoir in case study 2.

4.2.2. Input Data

Each well has coordinates (x, y). The total number of variables optimized in this experiment is 2 × 4 . and 2 × 2 . The PUNQ-S3 has a 19 × 28 × 5 grid block and the first SPE model has a 10 × 10 × 3 grid block. Hence, in case study 1, x i = ( x i1, x i2, …, x iD); 1 x i 19   ,
y i   =   ( y i 1 , y i 2 , ,   y i D ) ;   1 y i 28 .
Again, in case study 2, x i   =   ( x i 1 , x i 2 , ,   x i D ) ;   1 x i 10 ,
y i   =   ( y i 1 , y i 2 , ,   y i D ) ;   1 y i 10 .
The u vector represents the well locations matrix, hence the ith particle’s location can be denoted by
u i = [ x i 1 x i 2 x i D y i 1 y i 2 y i D ] ,
where u can be expressed as the input matrix in Equation (4).
This study aims at maximizing the net present value by changing well locations. Initially, u is generated randomly within the upper limit and lower limit. Then, u is used in Equation (4) to calculate the net present value. After that, the algorithm searches for well locations which will give the maximum net present value.

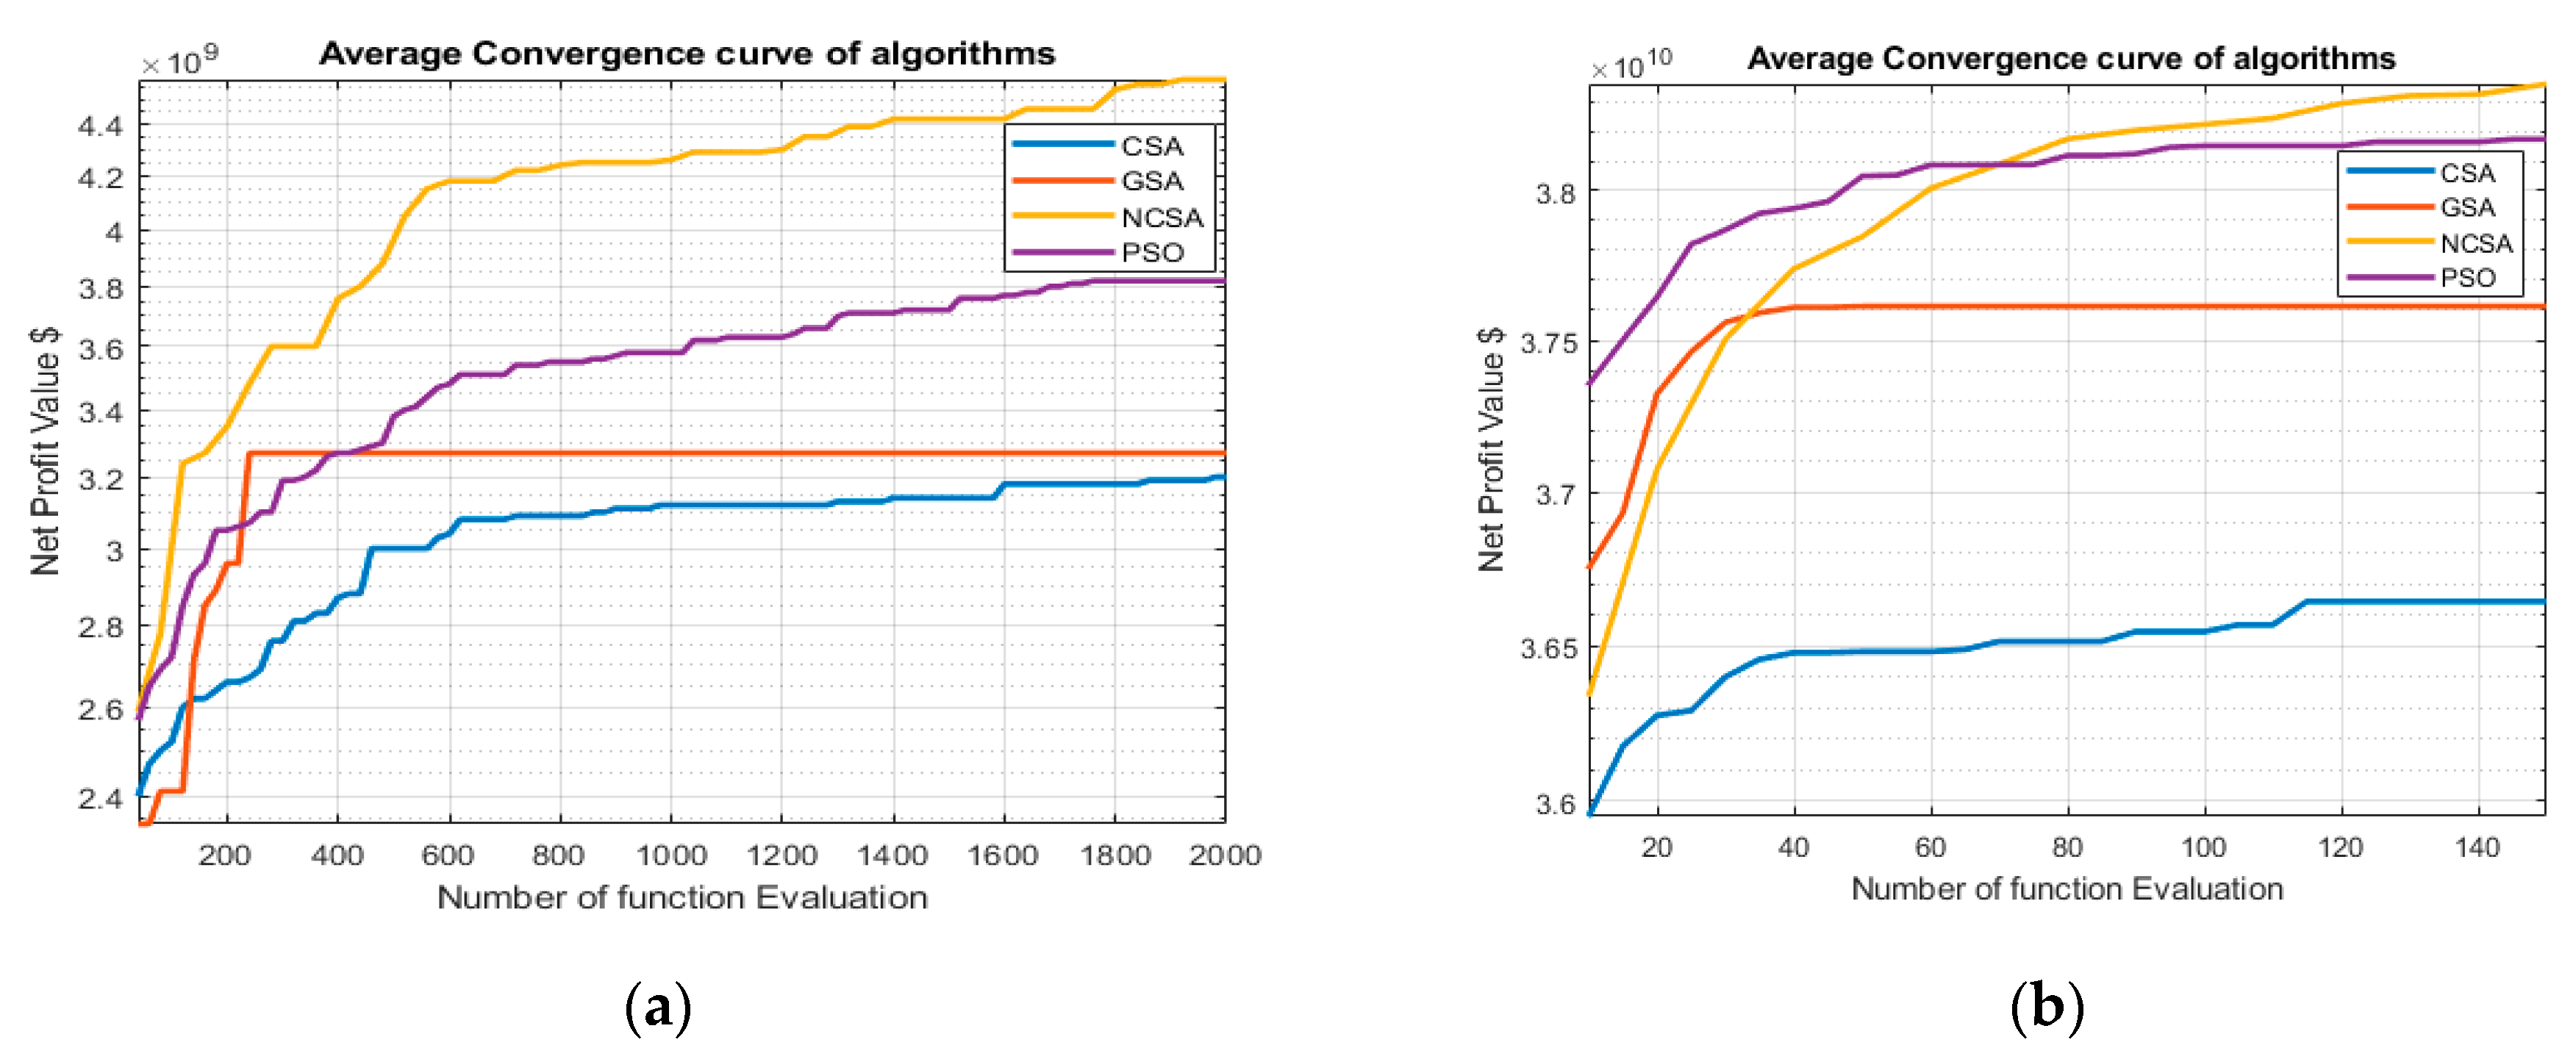
4.2.3. Convergence Analysis

Convergence curves are an important tool for analyzing the convergence speed of an algorithm and comparing its performance with other algorithms. Figure 9 shows a graph of the average NPV and number of iterations for the GSA, PSO, CSA, and NCSA algorithms. Case study 1 used 100 iterations and case study 2 used 30 iterations [54]. In case study 1, the search space is a 19 × 28 × 5 grid blocks. Case study 2 has 10 × 10 × 3 grid blocks. Therefore, for case study 1, the search space is larger than case study 2. Hence, for case study 1, the calculation requires more effort to find an optimized location. Since we are using the PUNQS3 reservoir, the previous study used 100 iterations [75]. Figure 9b shows that the best results, after a particular time, have not changed in case study 2. Basically, the convergence curve showed a horizontal line after a certain point. The horizontal line in Figure 9b shows that the search technique has reached the optimum value and there is no further improvement possible. Therefore, for case study 2, 30 iterations are sufficient.
In Figure 9a,b, it is clear that NCSA is superior to other algorithms for finding a better NPV value. The next best algorithm is PSO. PSO achieved the second-best NPV. GSA and CSA were stuck in a local optimum. In general, in both case studies, NCSA converged faster and had the highest NPV value. However, the CSA algorithm failed to provide a satisfactory NPV.
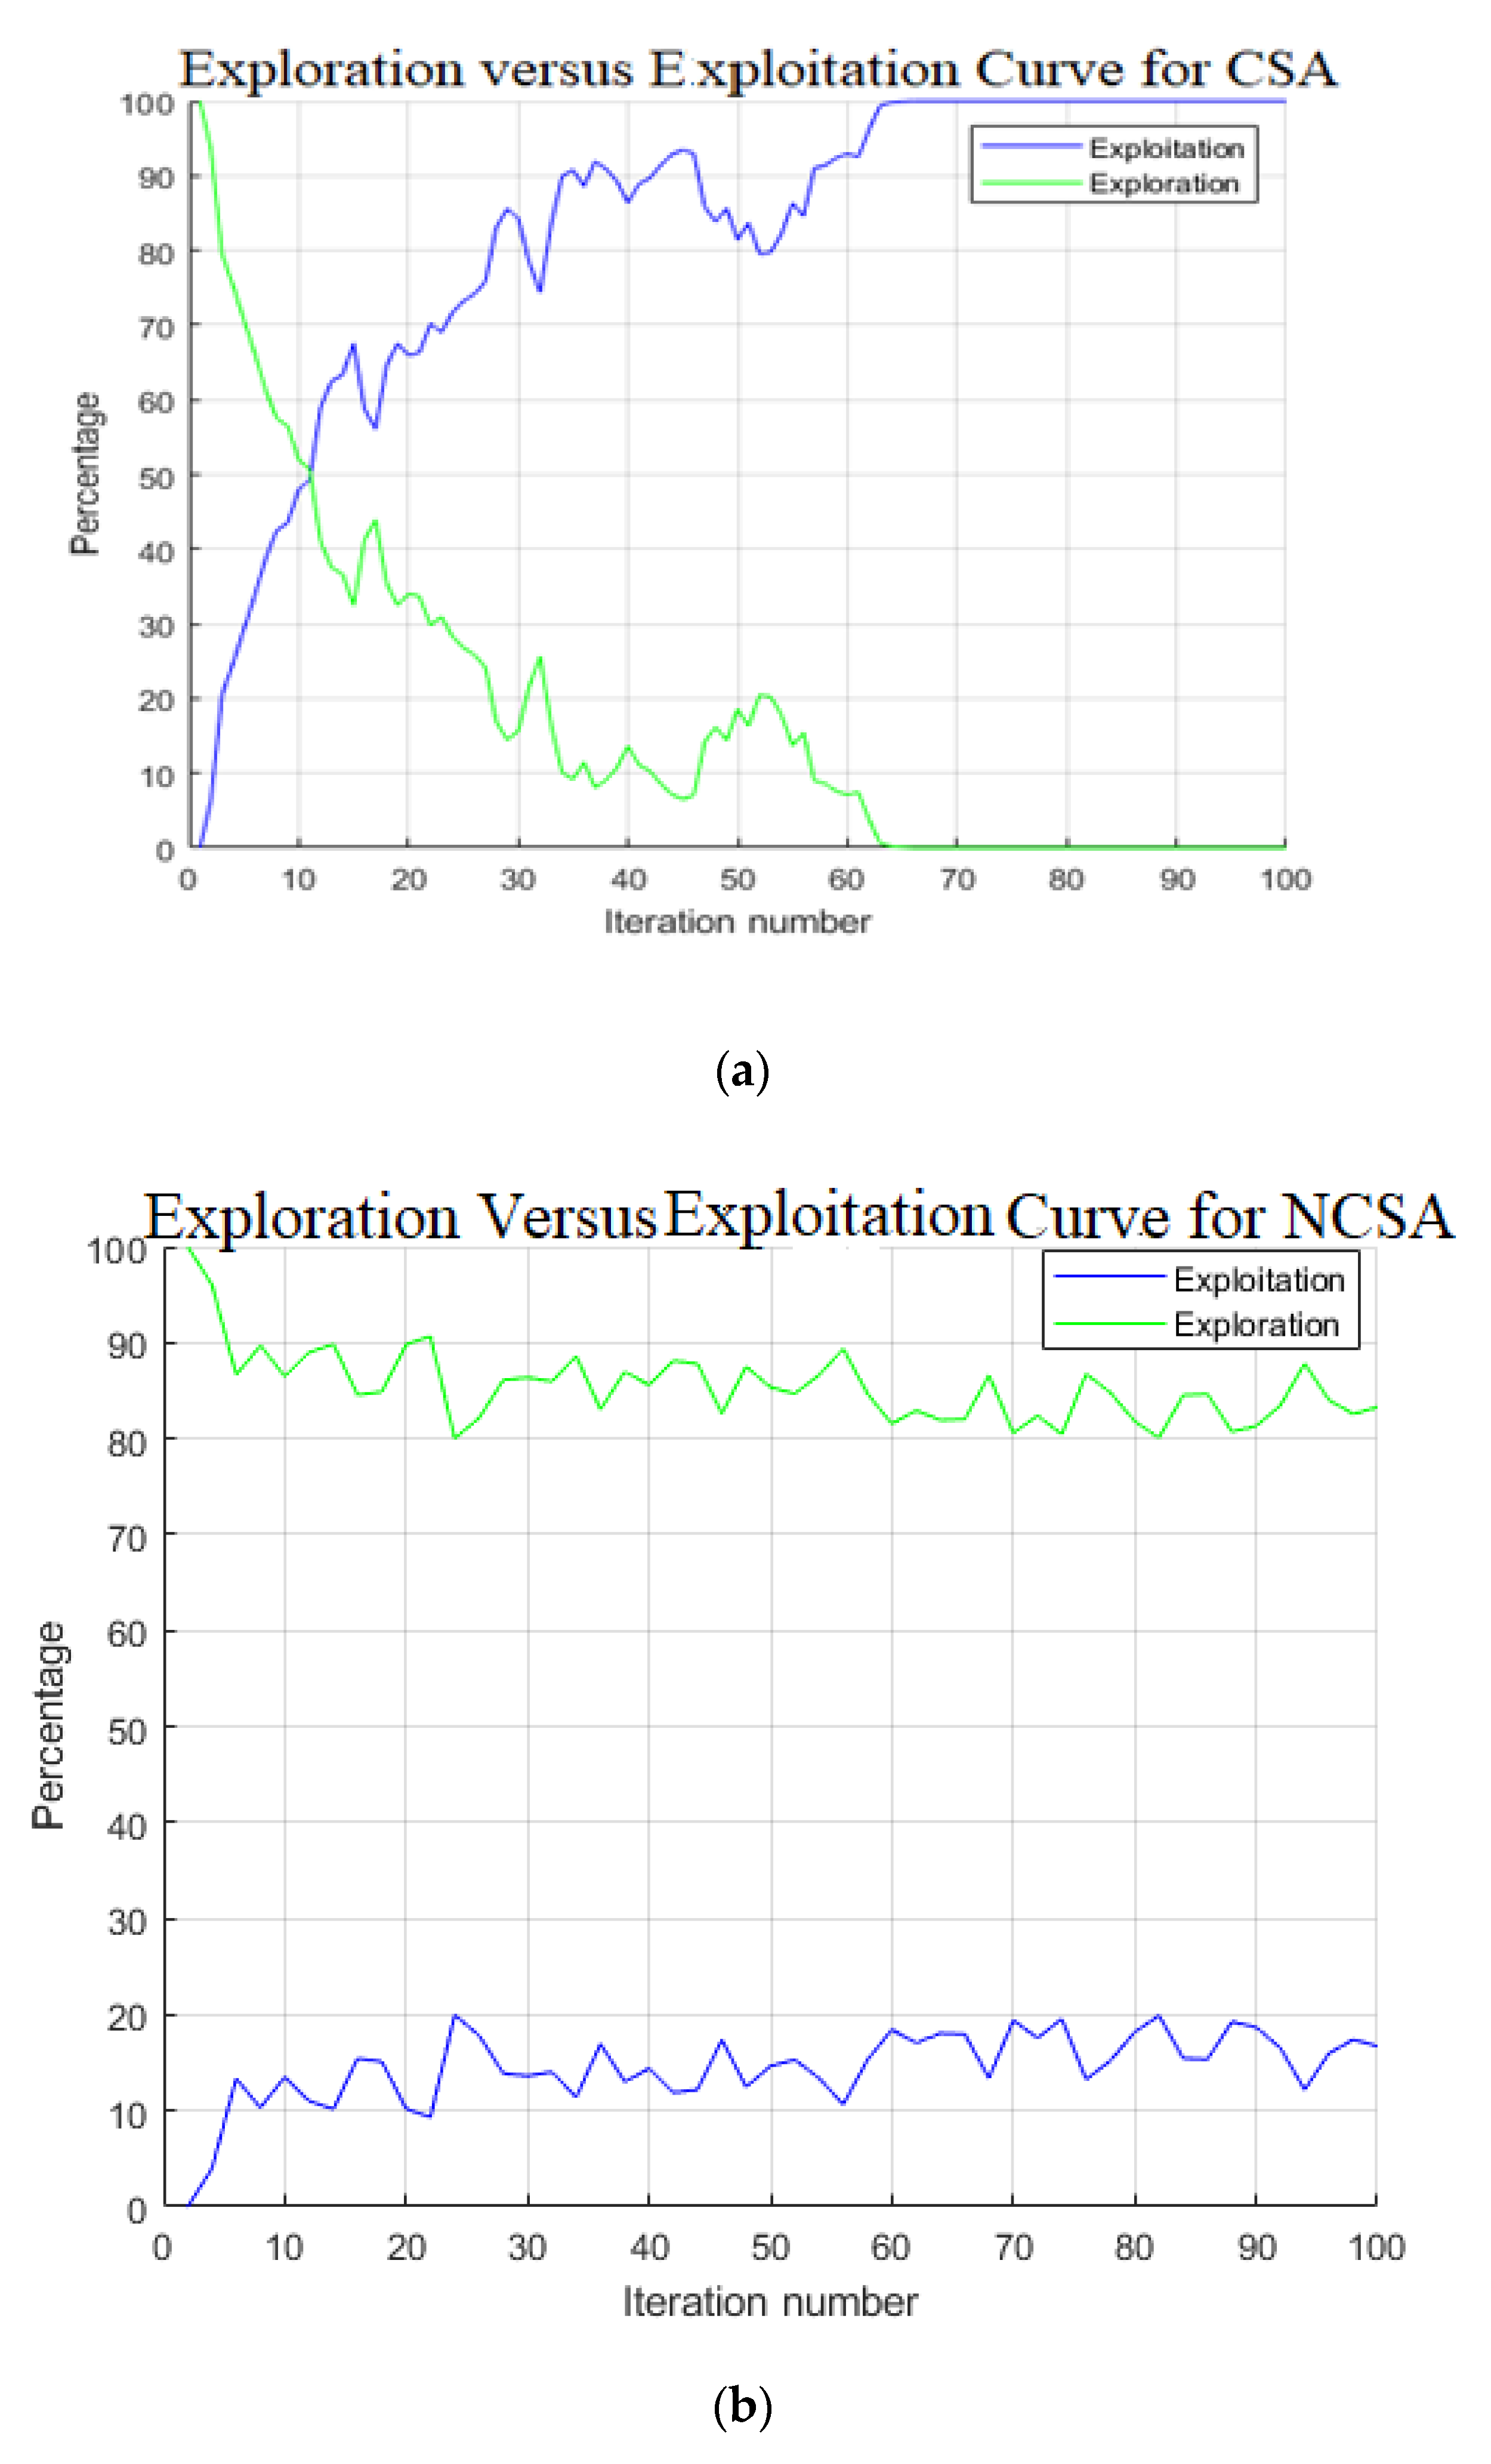
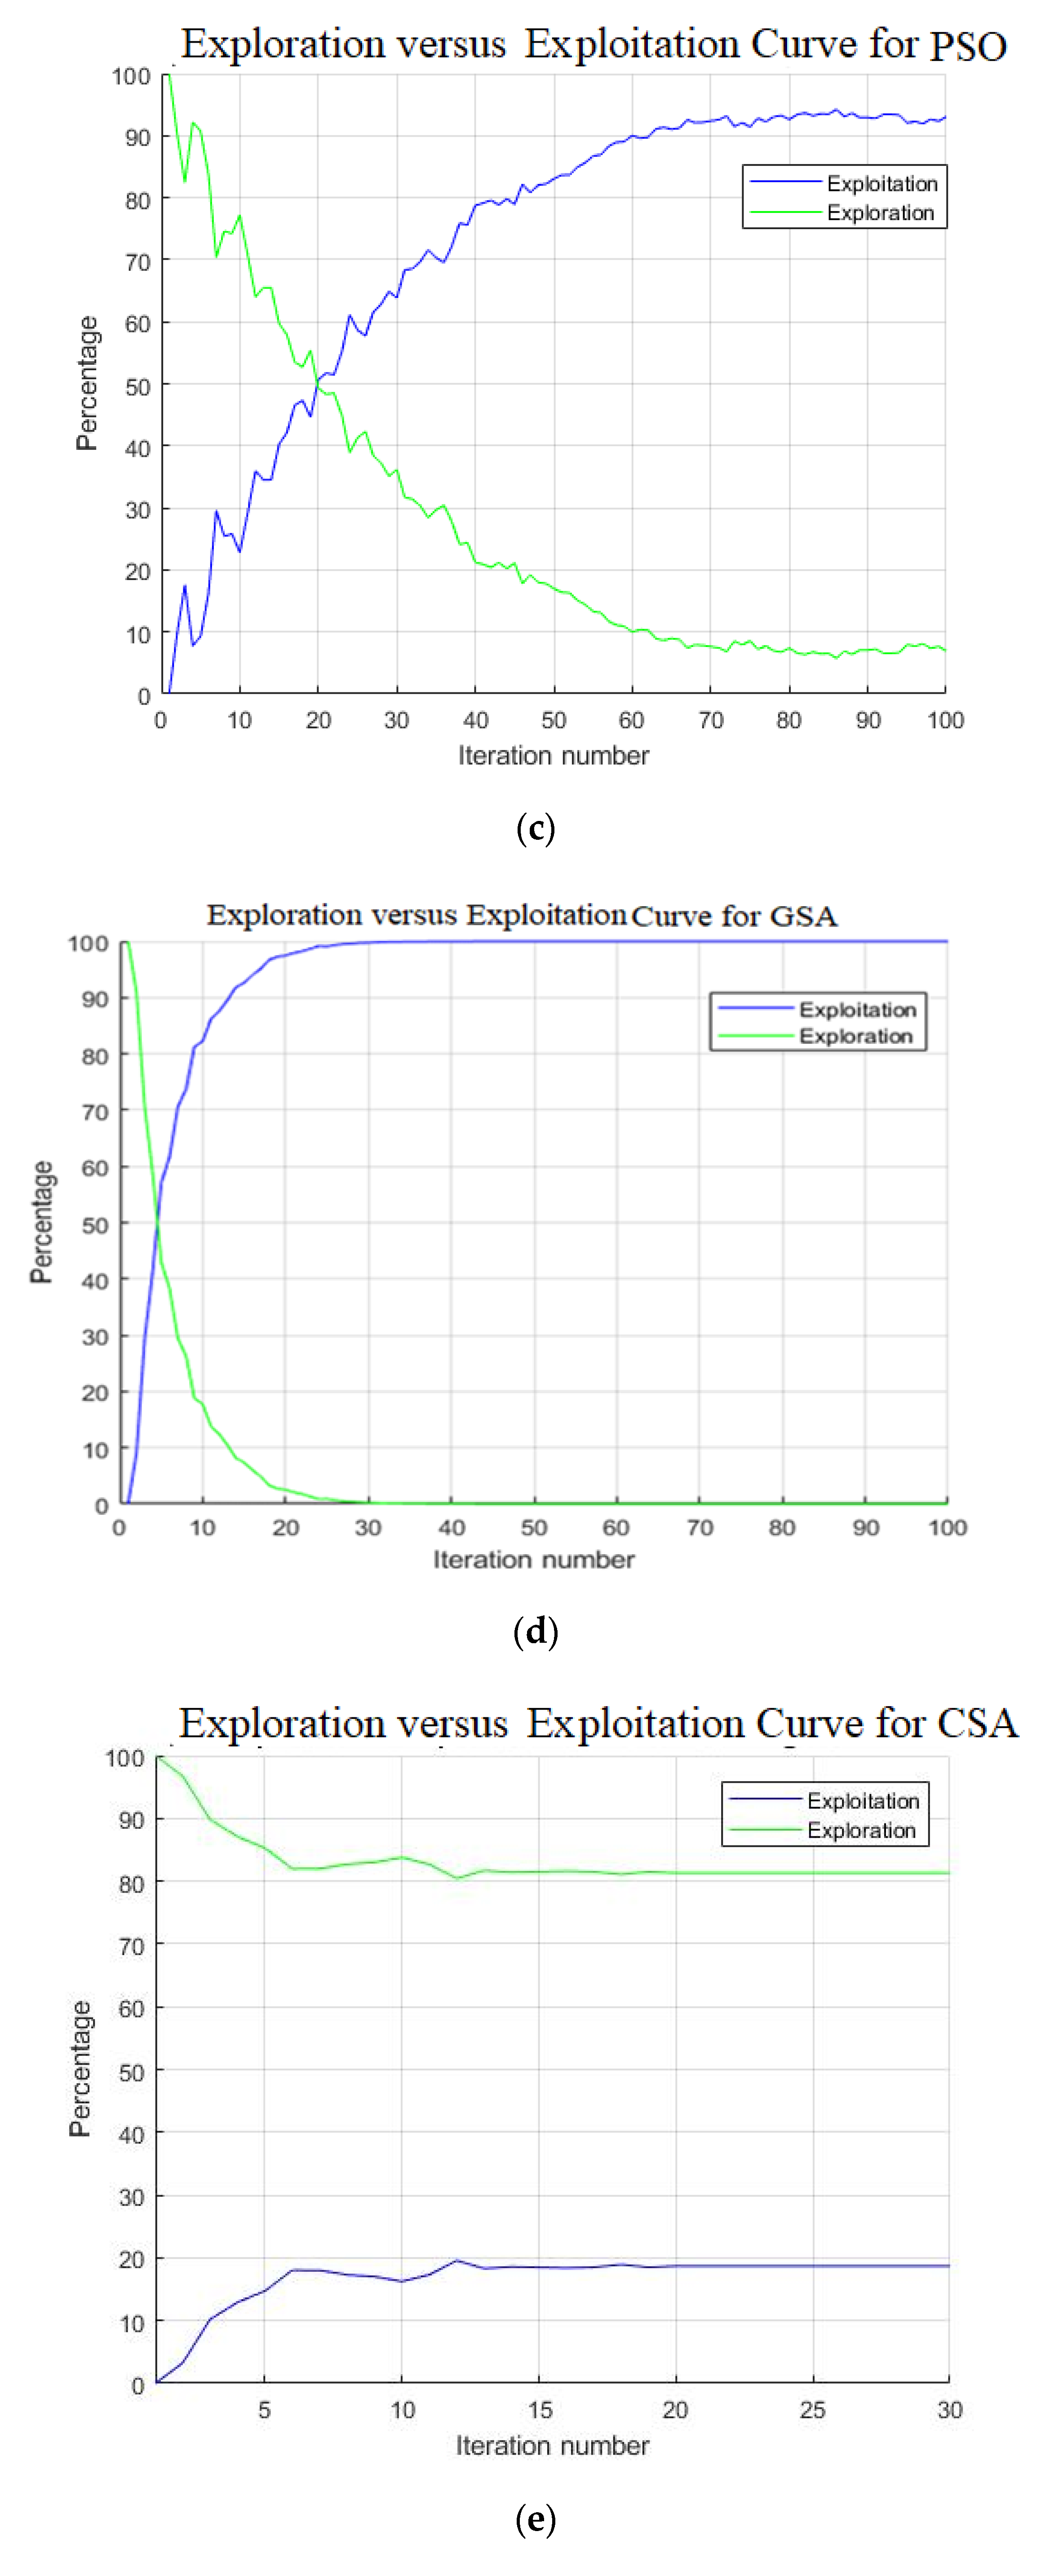
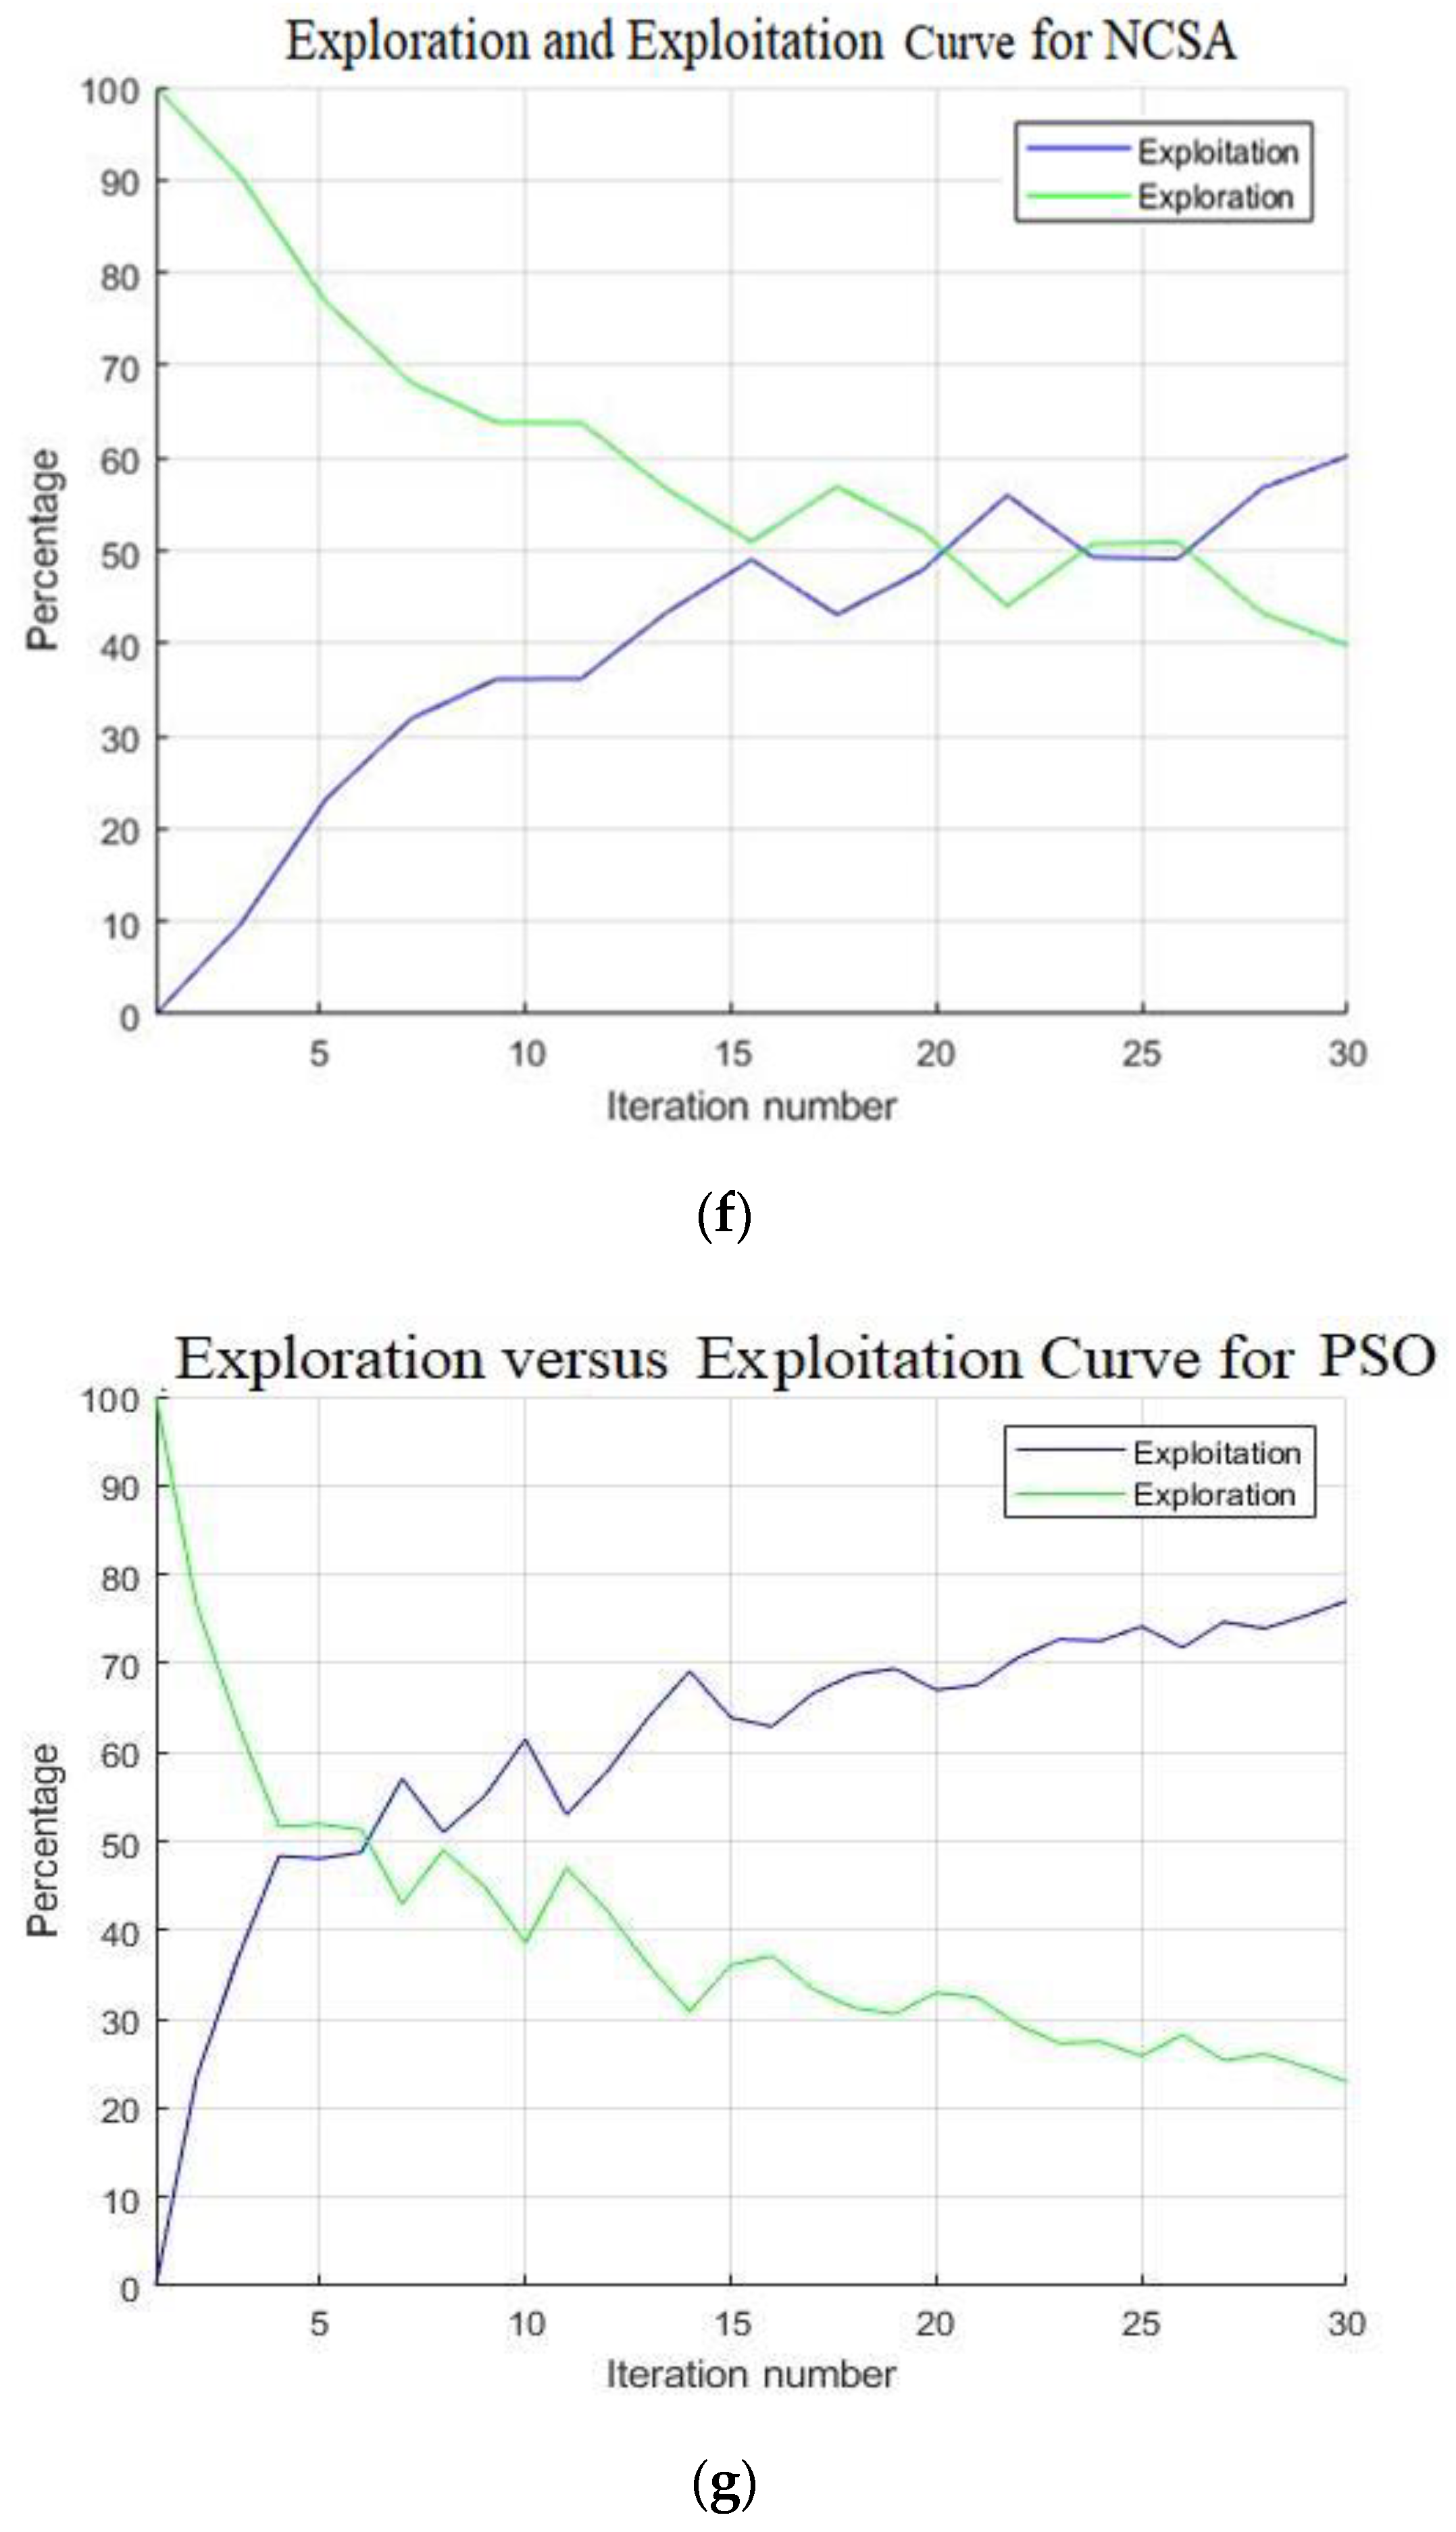
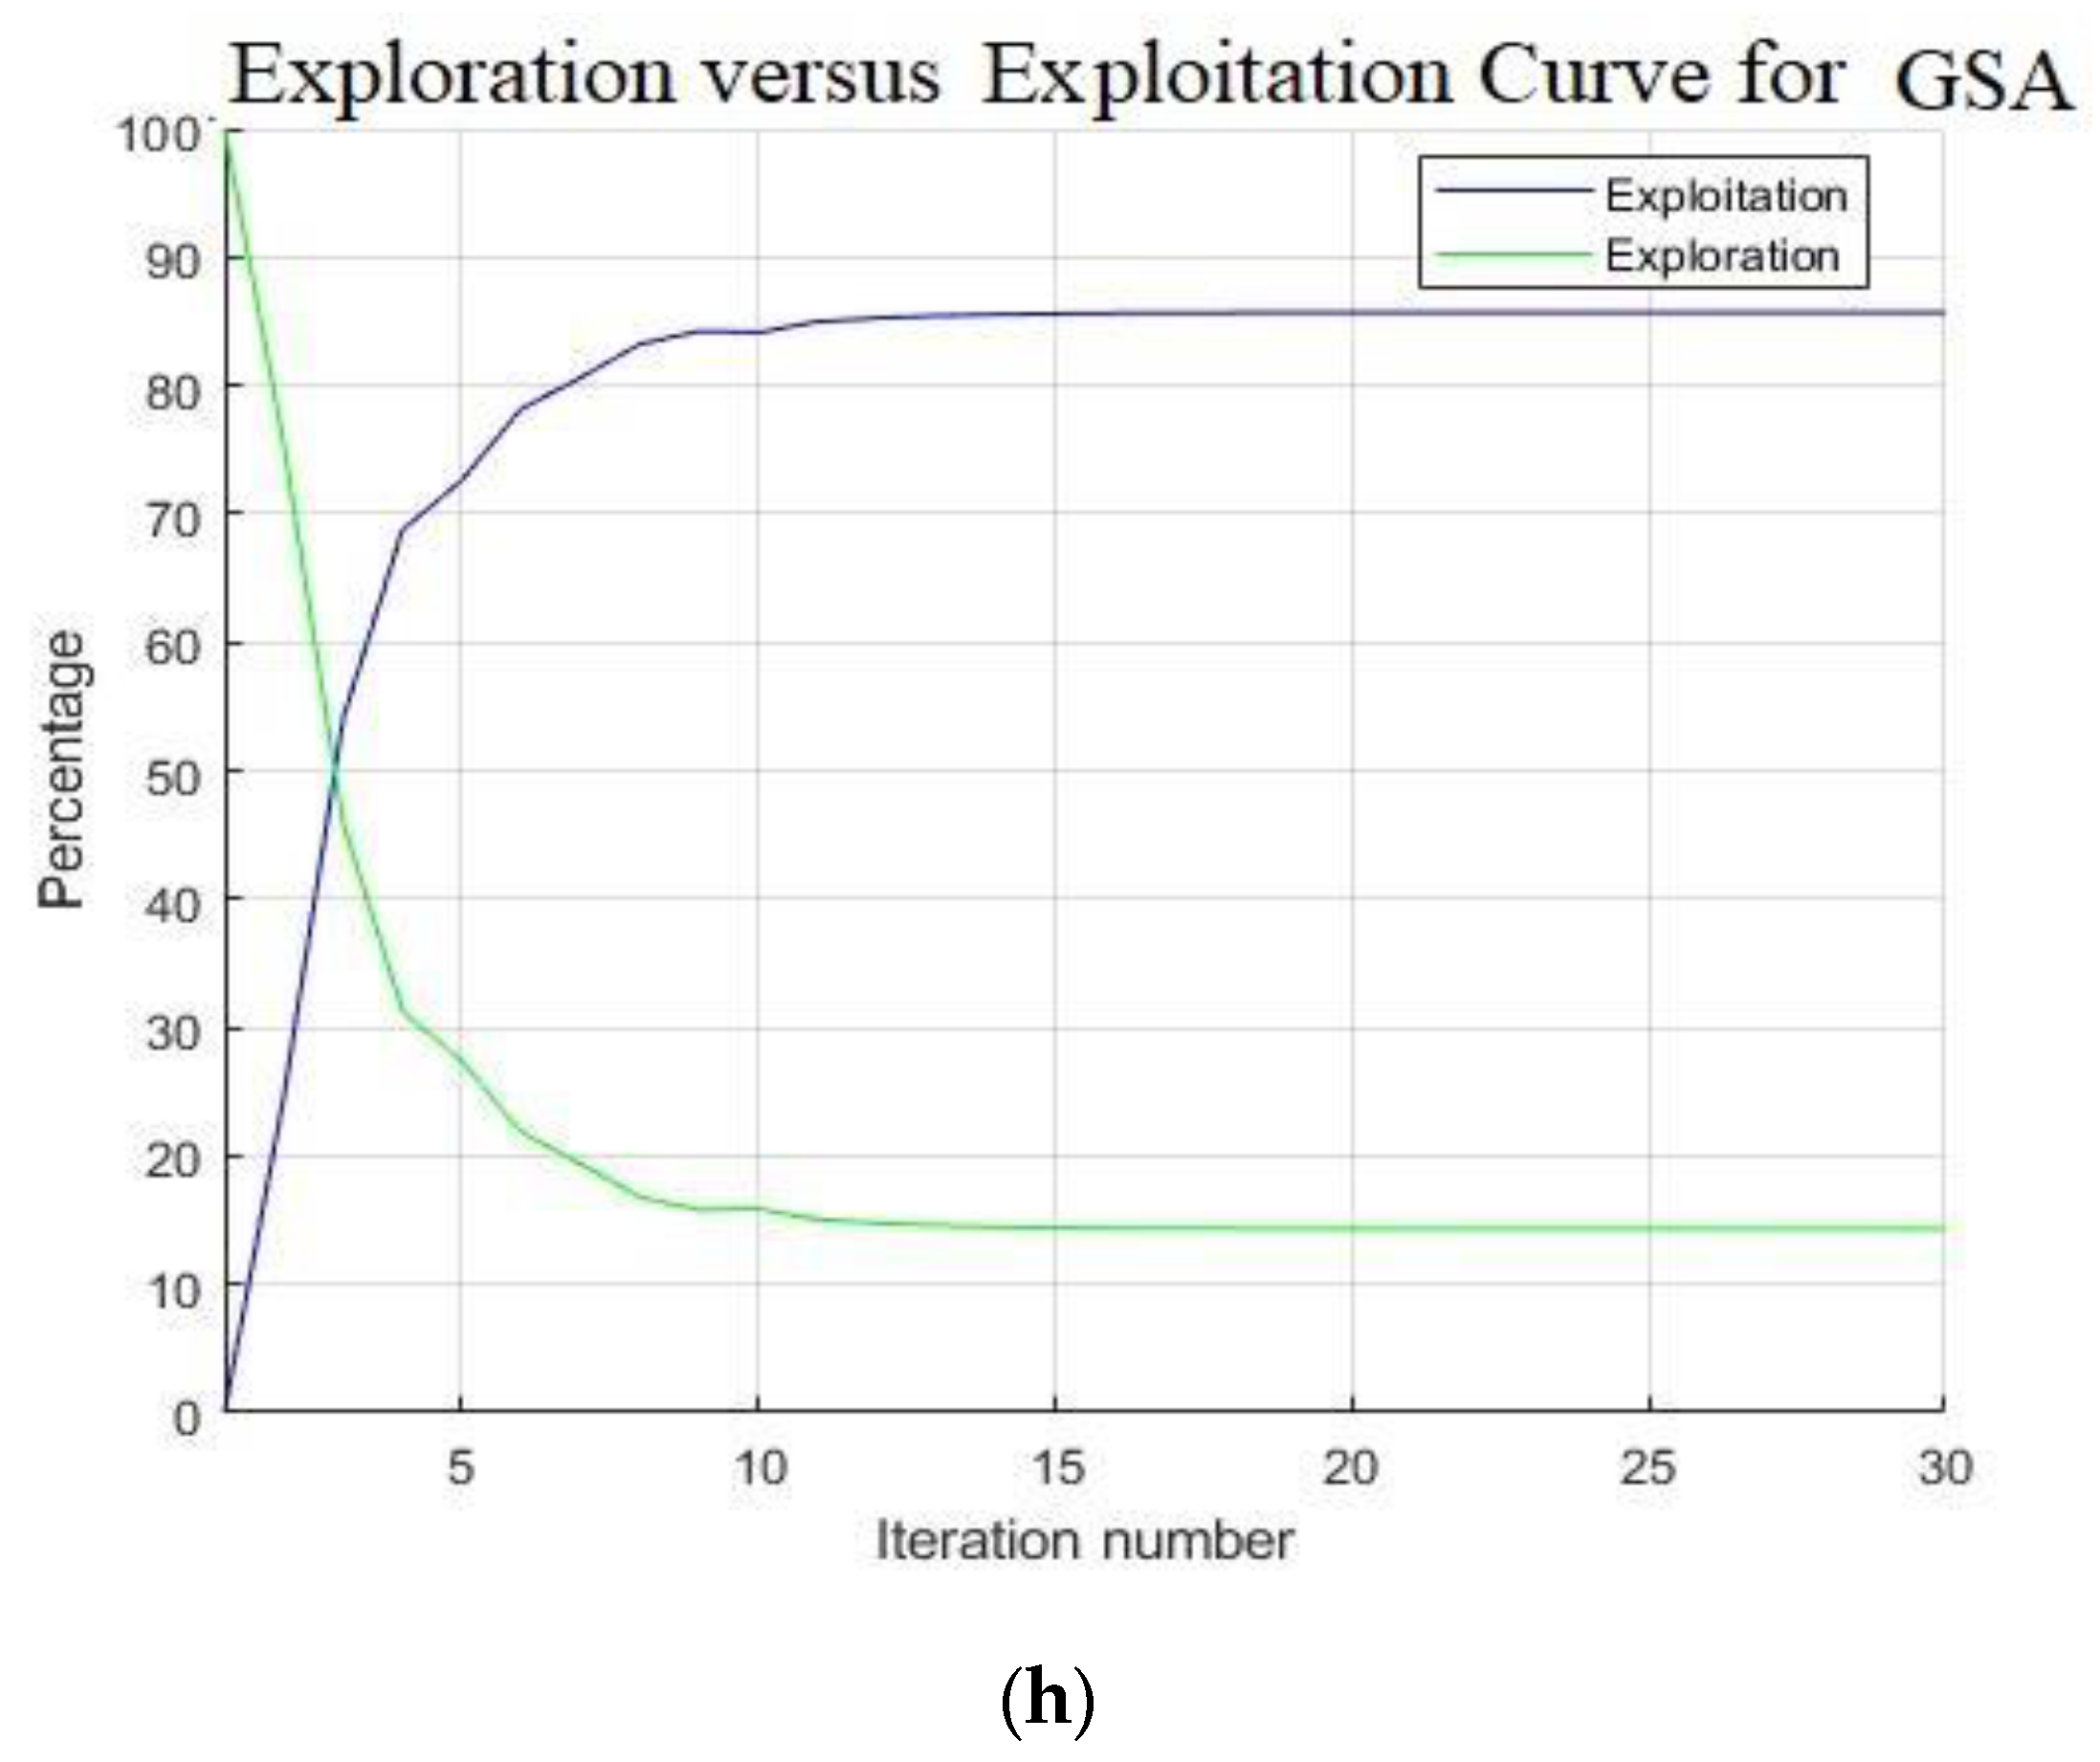
Figure 9 suggests that, unlike CSA, modification in the search expression in NCSA helps to avoid the local optimum in convergence. Besides, the proposed changes in the NCSA will make it more vibrant across most of the test functions and both case studies. For example, in a multimodal optimization problem, NCSA is more dynamic than CSA and is further validated by the exploration and exploitation graphs shown in Figure 10. According to the convergence graph, NCSA effectively converges to the best position compared to CSA, GSA, and PSO.

4.2.4. Exploration and Exploitation Analysis

Dimension-wise analysis sheds light on the internal behavior of the algorithms [76]. In this context, it is important to have a strong diversification to better exploit the search space. A small degree of diversification implies local convergence. To measure the diversity in each dimension, the authors have considered the equation proposed in [77].
D i v j = 1 n i = 1 n | m e d i a n ( x j ) x i j | ,
where x i j is the dimension j of the and i   t h swarm, m e d i a n ( x j ) refers to the median of dimension j in the whole population, and n is the total number of the population. So, the average diversity can be calculated using (13):
D i v = 1 D i = 1 n D i v j ,
where D i v is the diversity measurement of the whole population in an iteration.
Hence, exploration and exploitation can be measured using the following equation:
E x p l o r a t i o n = D i v D i v m a x × 100 ,  
E x p l o i t a t i o n = ( 1 D i v D i v m a x ) × 100 ,
where D i v m a x presents the maximum diversity of whole populations in one run.
Unless the behavior of the swarm in the iterative process is revealed, understanding the final result of the diversity or the value of the objective function is difficult. Therefore, to realize the true significance of these strategies, this study used a graphical representation of diversity measurement to exemplify the behavior of swarms in standard CSA, PSO, GSA, and NCSA. Figure 9 shows the exploration and exploitation curve with 100 iterations. It can be inferred from the illustration that the appropriate ratio of exploration and exploitation achieved a higher NPV. On the other hand, these graphs clearly show a gradual shifting in intensity between the exploration and exploitation rate during the iterative process of PSO. However, during the NCSA’s search process, the exploration and exploitation rate remained constant. From Figure 6, it can be seen that NCSA has better convergence capability than other algorithms in well location optimization problems. The graphical evidence provided by Figure 10 illustrates that NCSA had a higher average exploration rate and GSA had a relatively higher exploitation rate. In case study 1, the NCSA achieved an average diversity of 84%. However, the average diversity of PSO, GSA, and CSA is 27.5%, 6.3%, 17.4%, respectively. This indicates that the average diversity achieved by other algorithms is much lower than the NCSA. In addition, compared to other algorithms, the modified NCSA provided a better global optimal solution.
Again, in case study 2, the average diversity of NCSA, PSO, GSA, and CSA is 60.5%, 22%, 40% and 83%, respectively. In this case, CSA had the highest exploration rate. However, CSA failed to achieve a better global optimum. Hence, this result reveals that for well placement optimization, a higher exploration rate is necessary. However, the appropriate ratio of the exploration and exploitation should be carefully set according to the search field.

4.2.5. Performance Measurement and Statistical Analysis

To evaluate the performance of the algorithms, several criteria were considered for this problem [17,78]:
Effectiveness is a straightforward indicator of performance and is the total value of the best answer found in the trials as a percentage of the global optimum, or
f ¯ = 1 N i = 1 N f ( p i ^ )   f ( p * ) ,
where p i ^ is the best solution found in trial i, p * is the global optimum solution, f(p) is the value of solution p, and N is the number of trials for each algorithm.
Efficiency indicates the pace with which the algorithm achieves at least 98 percent of the best solution found using a specific number of evaluations, on average between tests, or
L ¯ = 1 N i = 1 N L i 98   M ,  
where L i 98 is the number of unique function evaluations required to find solution q such that f(q) equals 98 percent of the best solution found for trial i (for minimization) and M is the total number of function evaluations per trial.
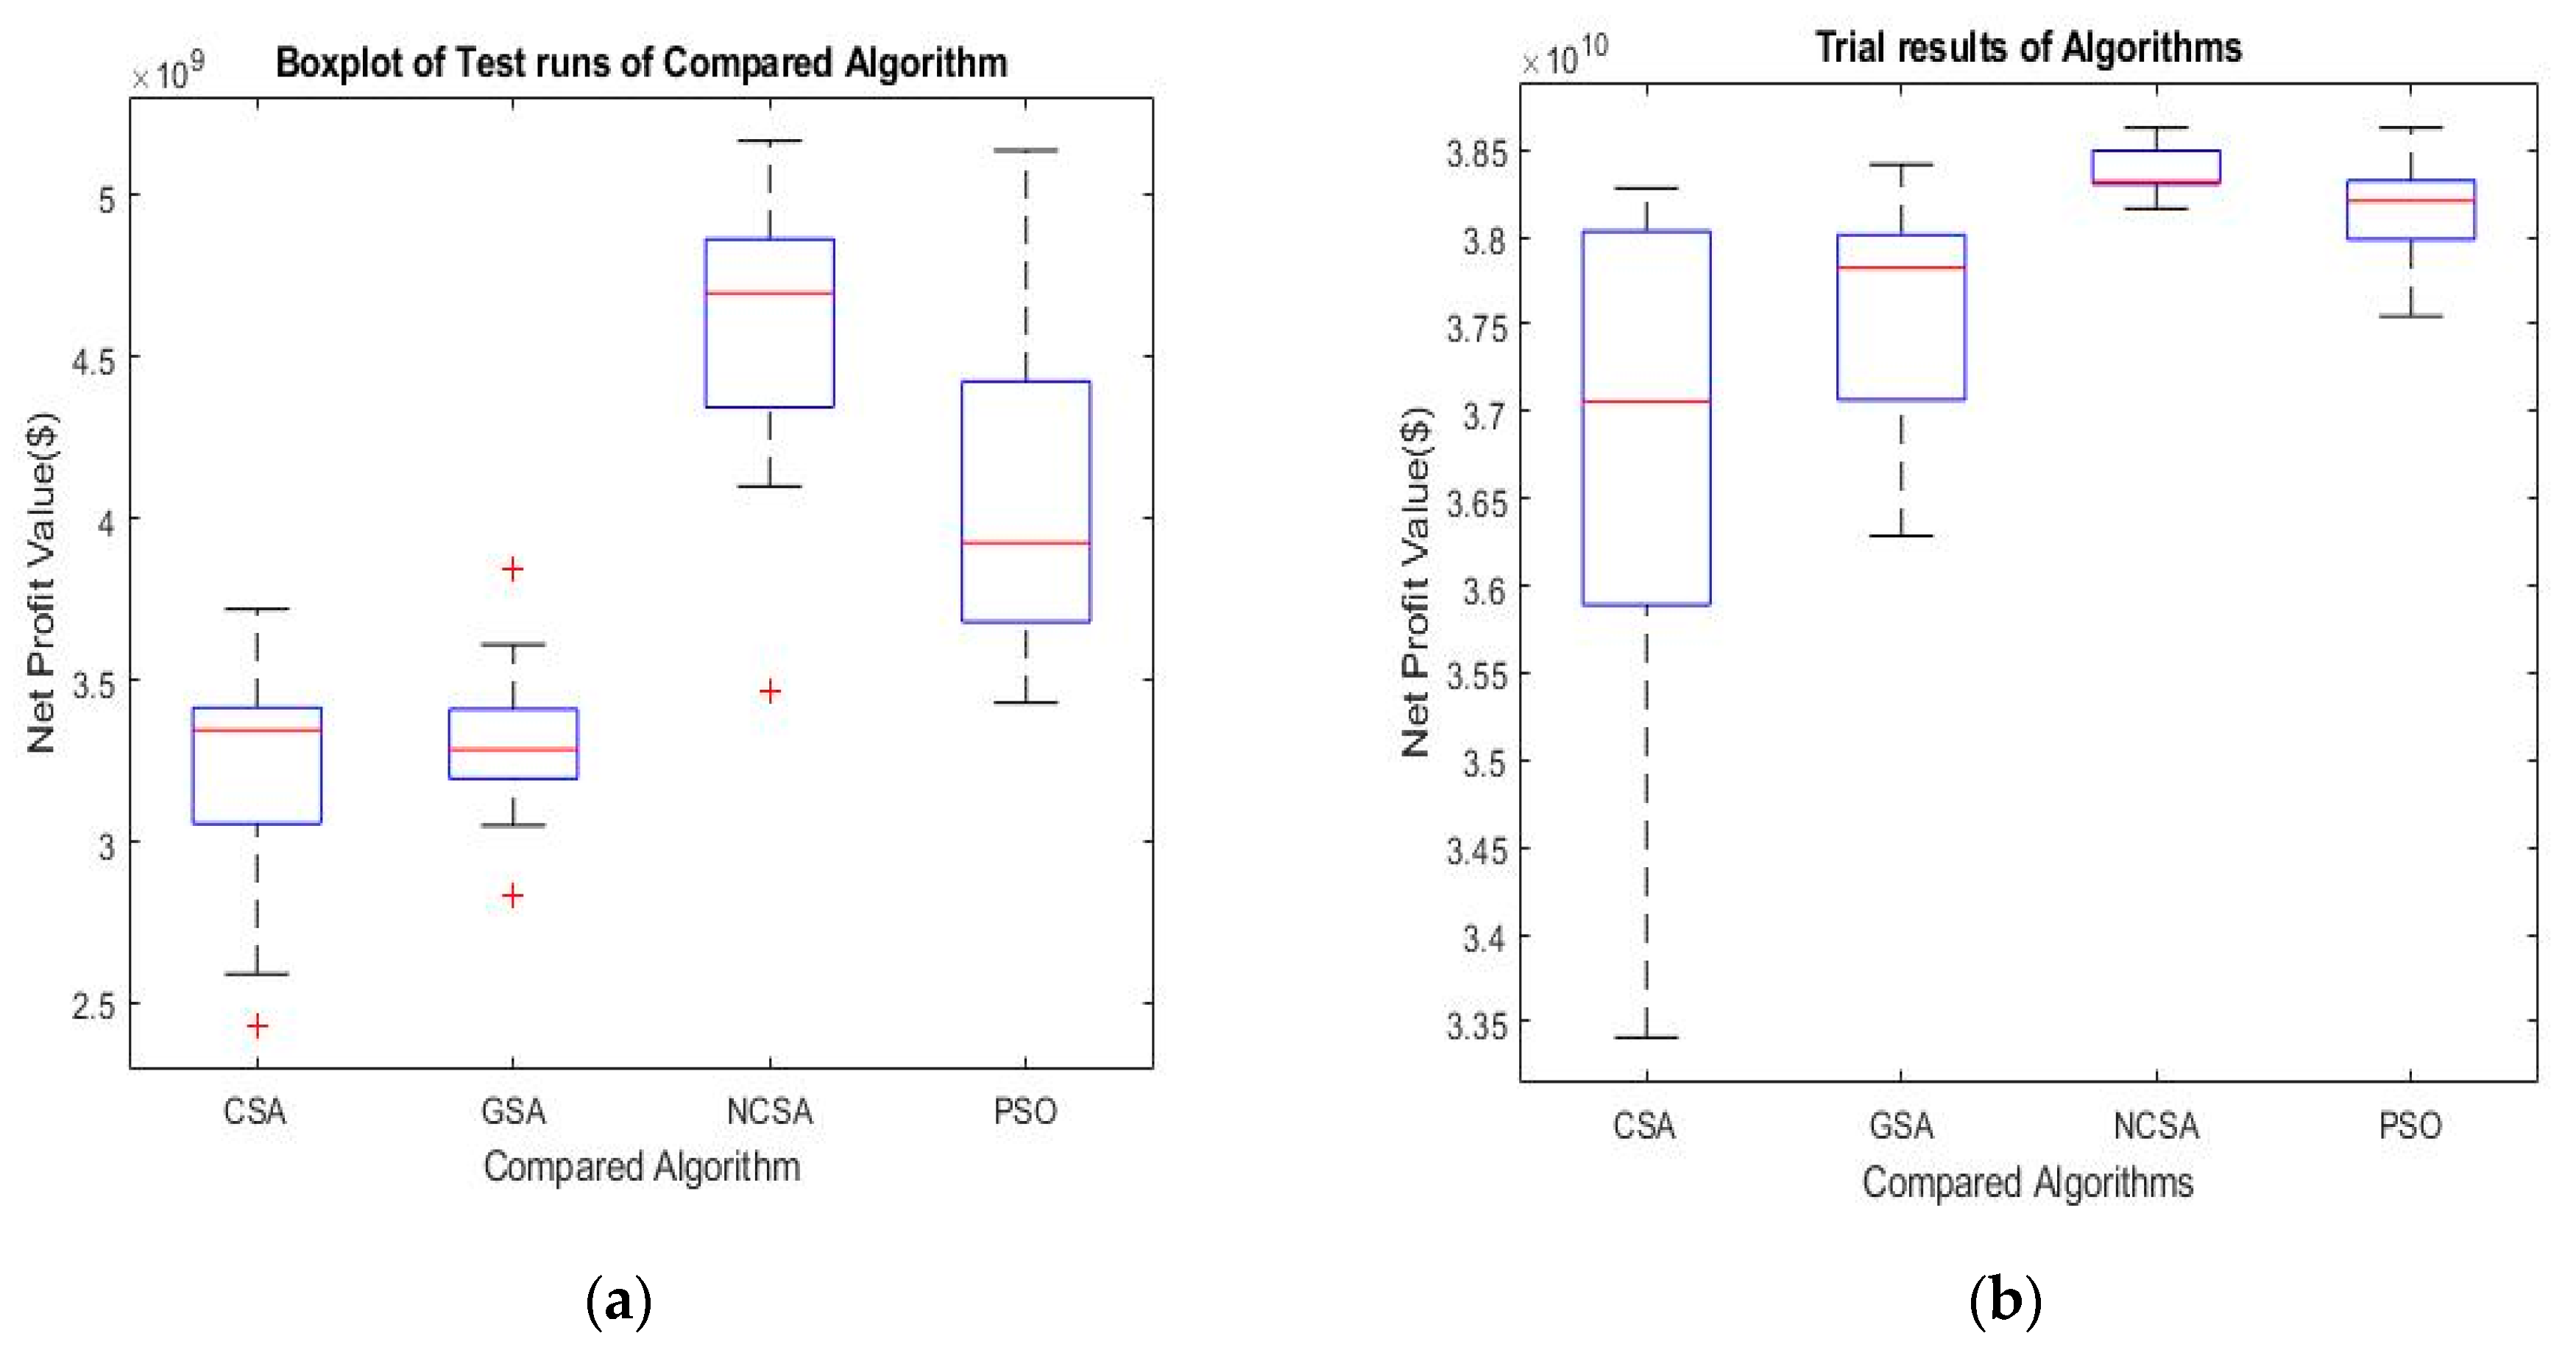
Additionally, maximum, minimum, mean, standard deviation, effectiveness, and efficiency are calculated for each algorithm in trails and listed in Table 6 and Table 7. The mean value and standard deviation indicate the robustness of the algorithm. The results of case study 1 show that the NCSA algorithm is superior on four criteria. However, PSO was more efficient. The reason for this phenomenon is that efficiency indicates the speed of that algorithm to achieve a certain performance. Thus, despite achieving a lower average NPV than NCSA, PSO achieved higher efficiency. The box plot results are shown in Figure 11. Figure 11a reveals that NCSA has reached a higher NPV value compared to other algorithms. The result of case study 2 in Table 7 shows that the NCSA algorithm is superior in six criteria. However, PSO also achieved the same best value. Figure 11b shows that NCSA has the lowest standard deviation compared to other algorithms, and PSO has the second-lowest standard deviation.

4.2.6. Wilcoxon’s Test

To validate whether the NCSA results are statistically different from the other three algorithms, a non-parametric statistical test, the Wilcoxon test [79,80], with a significance level of 0.05 is used. Table 8 shows the one tail p-value, two tail p-value, and Z values for the Wilcoxon test. A p-value less than 0.05 and a Z value higher than 1.96 is required to reject the null hypothesis. Table 8 shows that there is a statistical difference between the performance of NCSA and other algorithms except in one case. In case study 1, the performance of the NCSA and PSO are not statistically different. However, small differences in results may bring higher economic profit. Therefore, it can be inferred that NCSA can bring improved results from the other three algorithms.

4.3. Sensitivity Analysis

Design of Experiments (DOE) is a valuable tool for studying the effects of one or more variables on physical experiments [81]. Scientific experiments can only be performed on a small scale and are expensive and time-consuming. Therefore, limiting the number of parameter configurations to test is important for sensitivity studies. For this purpose, the design of experiments (DOE) was proposed by Fisher [82].
The goal of this design is to gain the greatest possible knowledge of the impact of relevant parameters on the results of the model at the lowest cost. Typically, in computer models, this cost is to keep computer time low by limiting the number of parameter combinations to investigate. It then simulates using a combination of these parameters, and finally evaluates the effect and makes a hypothesis. [83,84]. In this study iteration, population, awareness probability, and flight length parameter are used. In addition, the first-order Sobol sensitivity index (SI) is used [85] in many studies. Hence, in this study, the Sobol sensitivity index [86] technique is considered.

4.3.1. Case Study 1

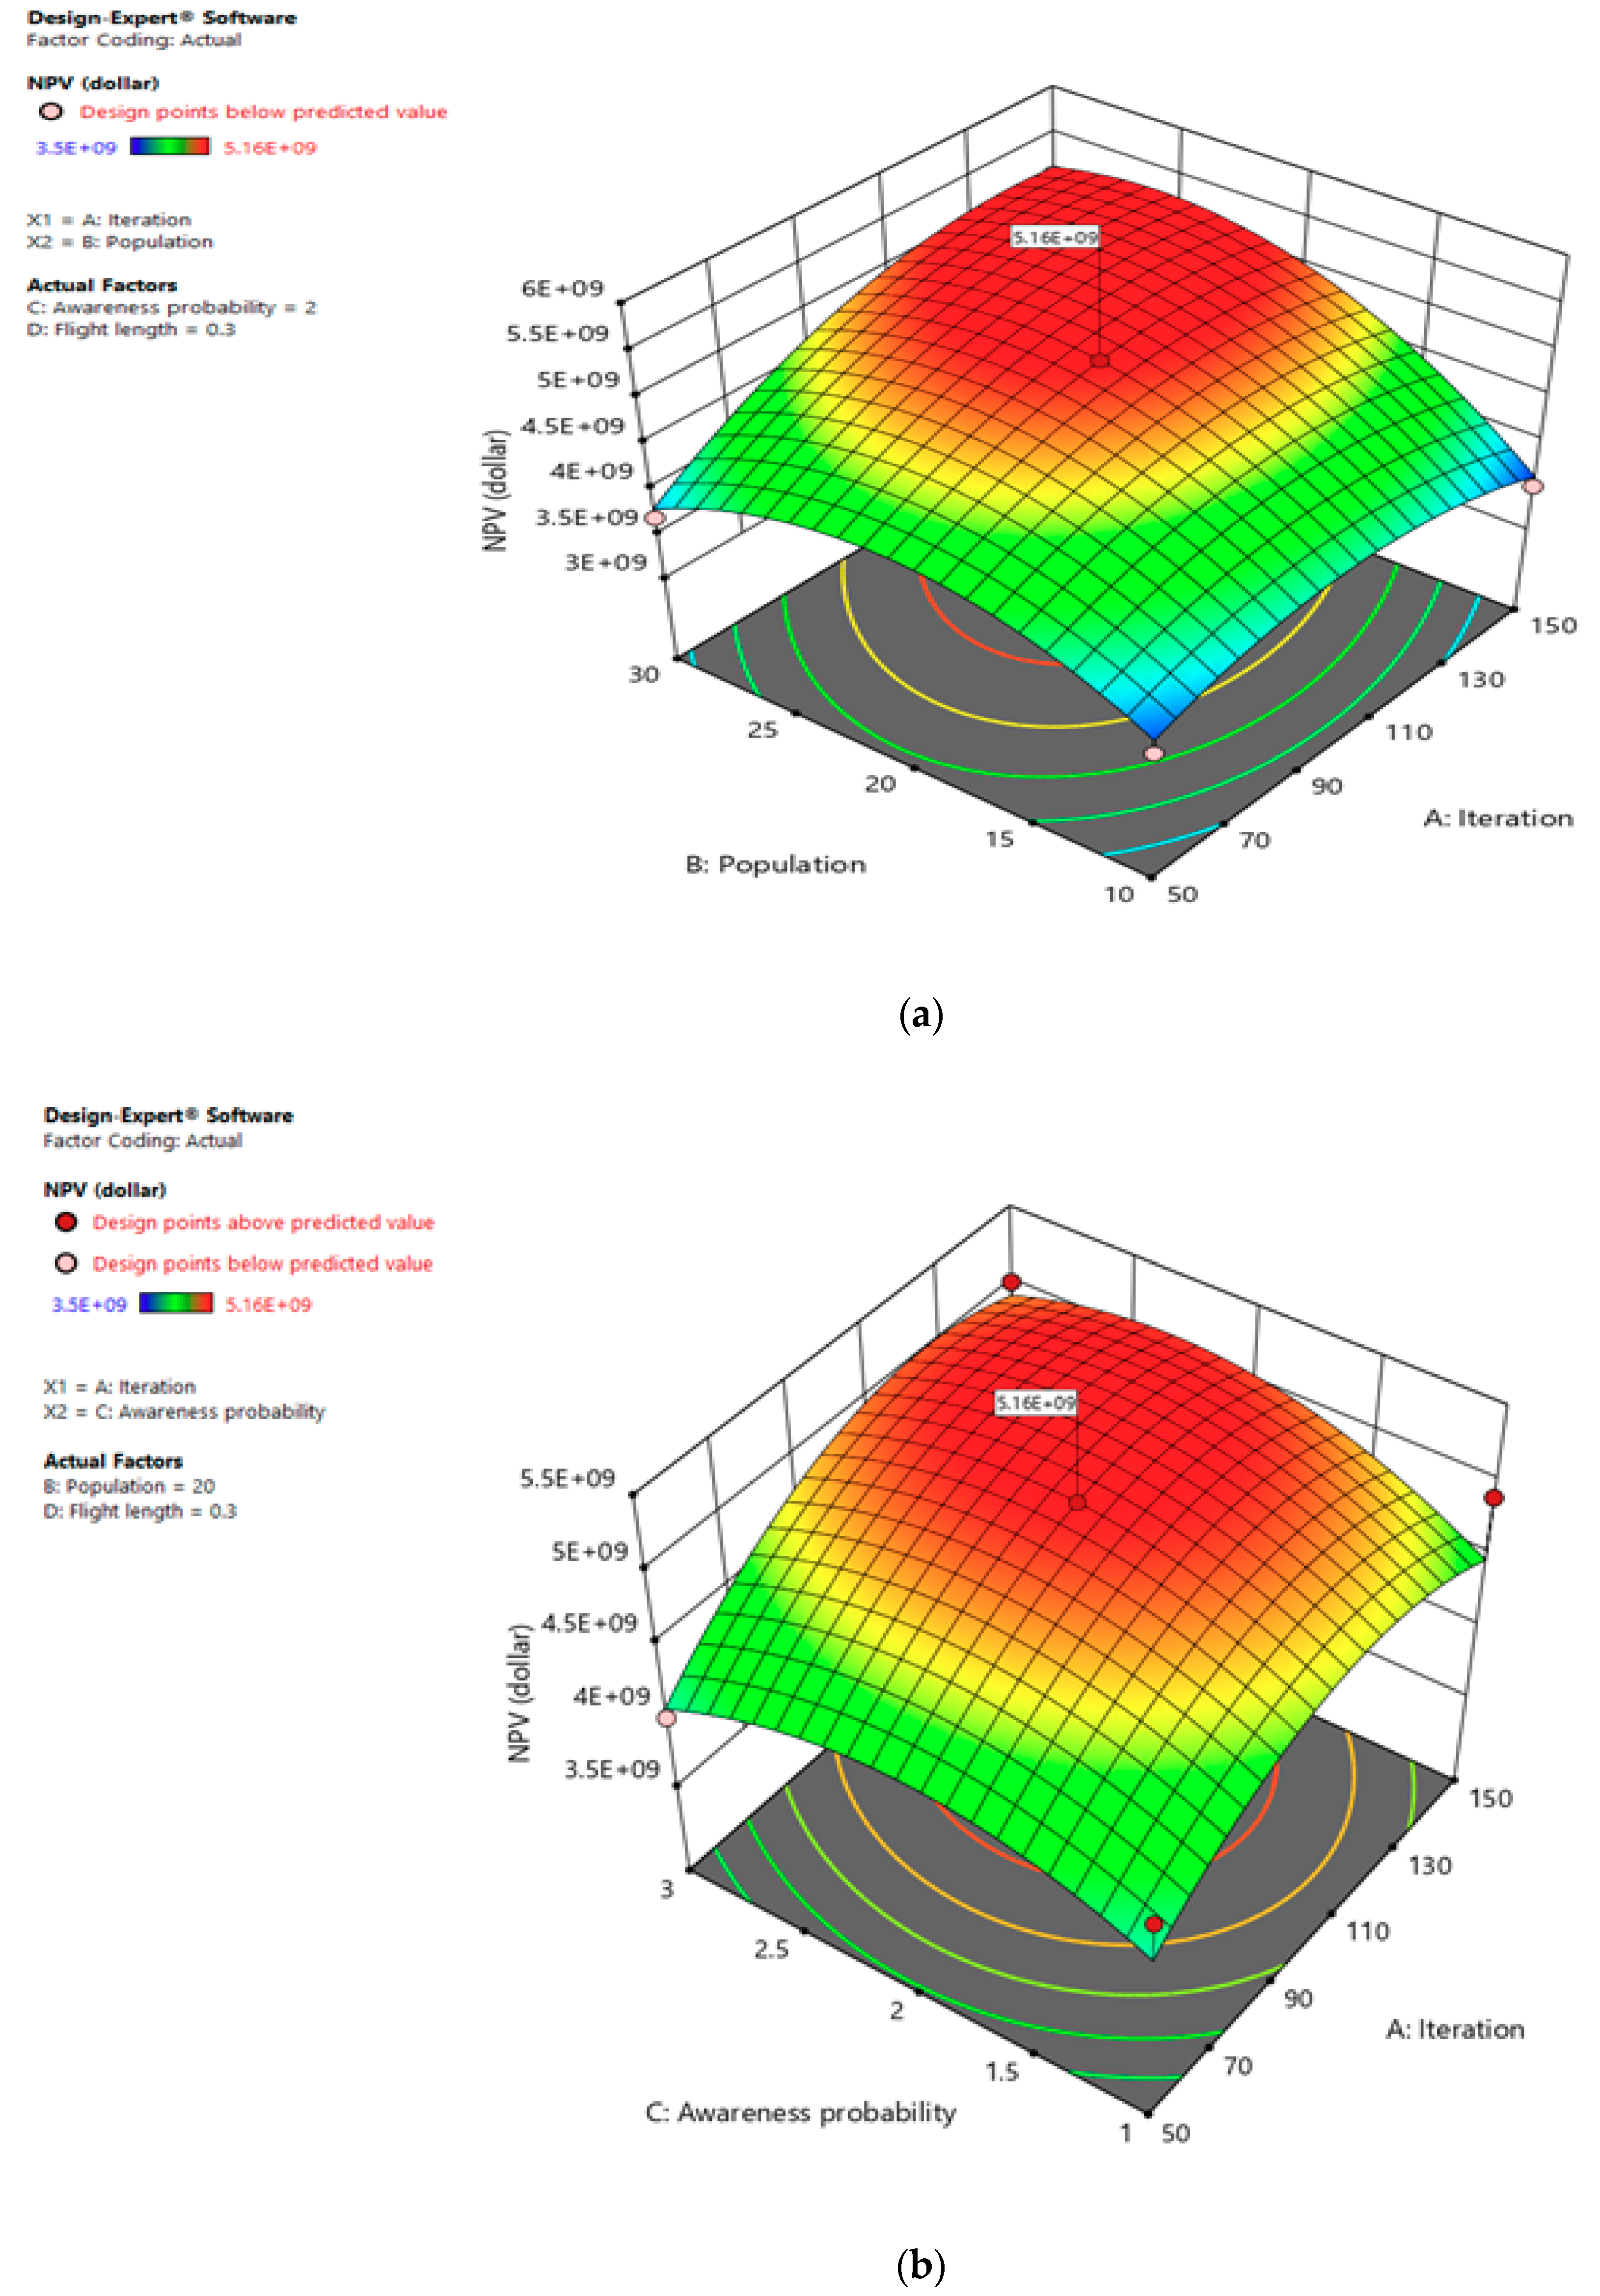
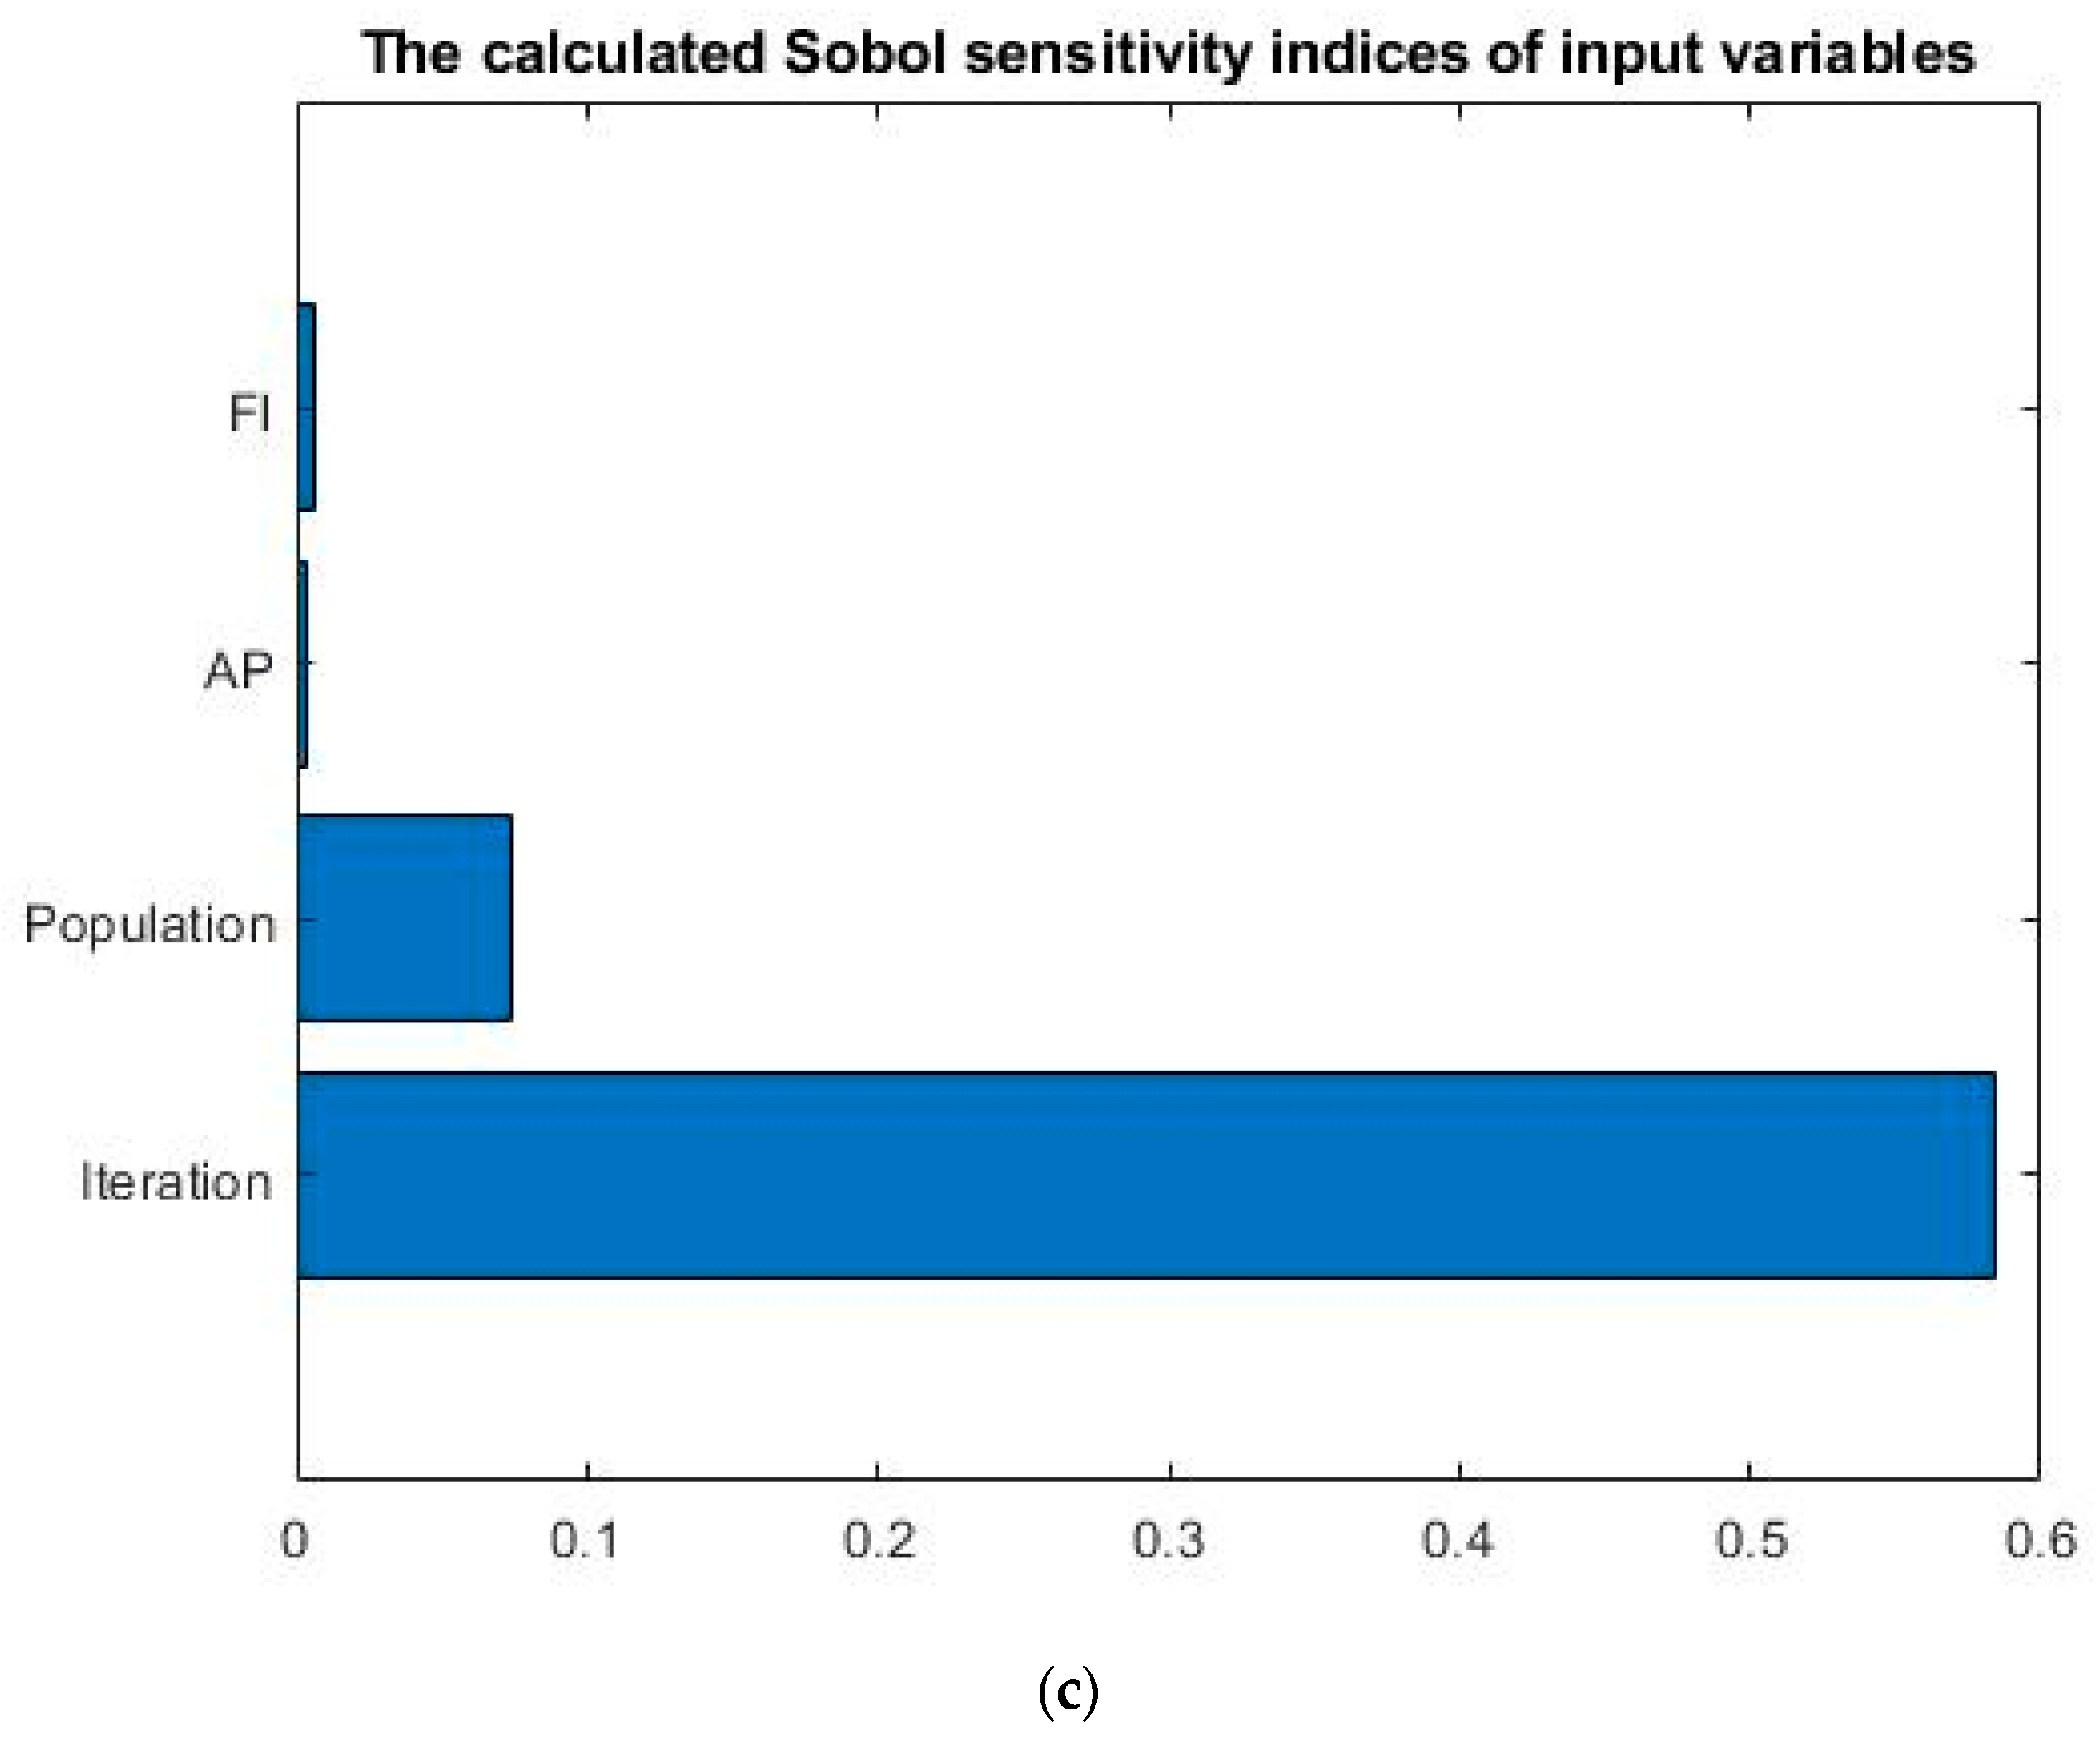
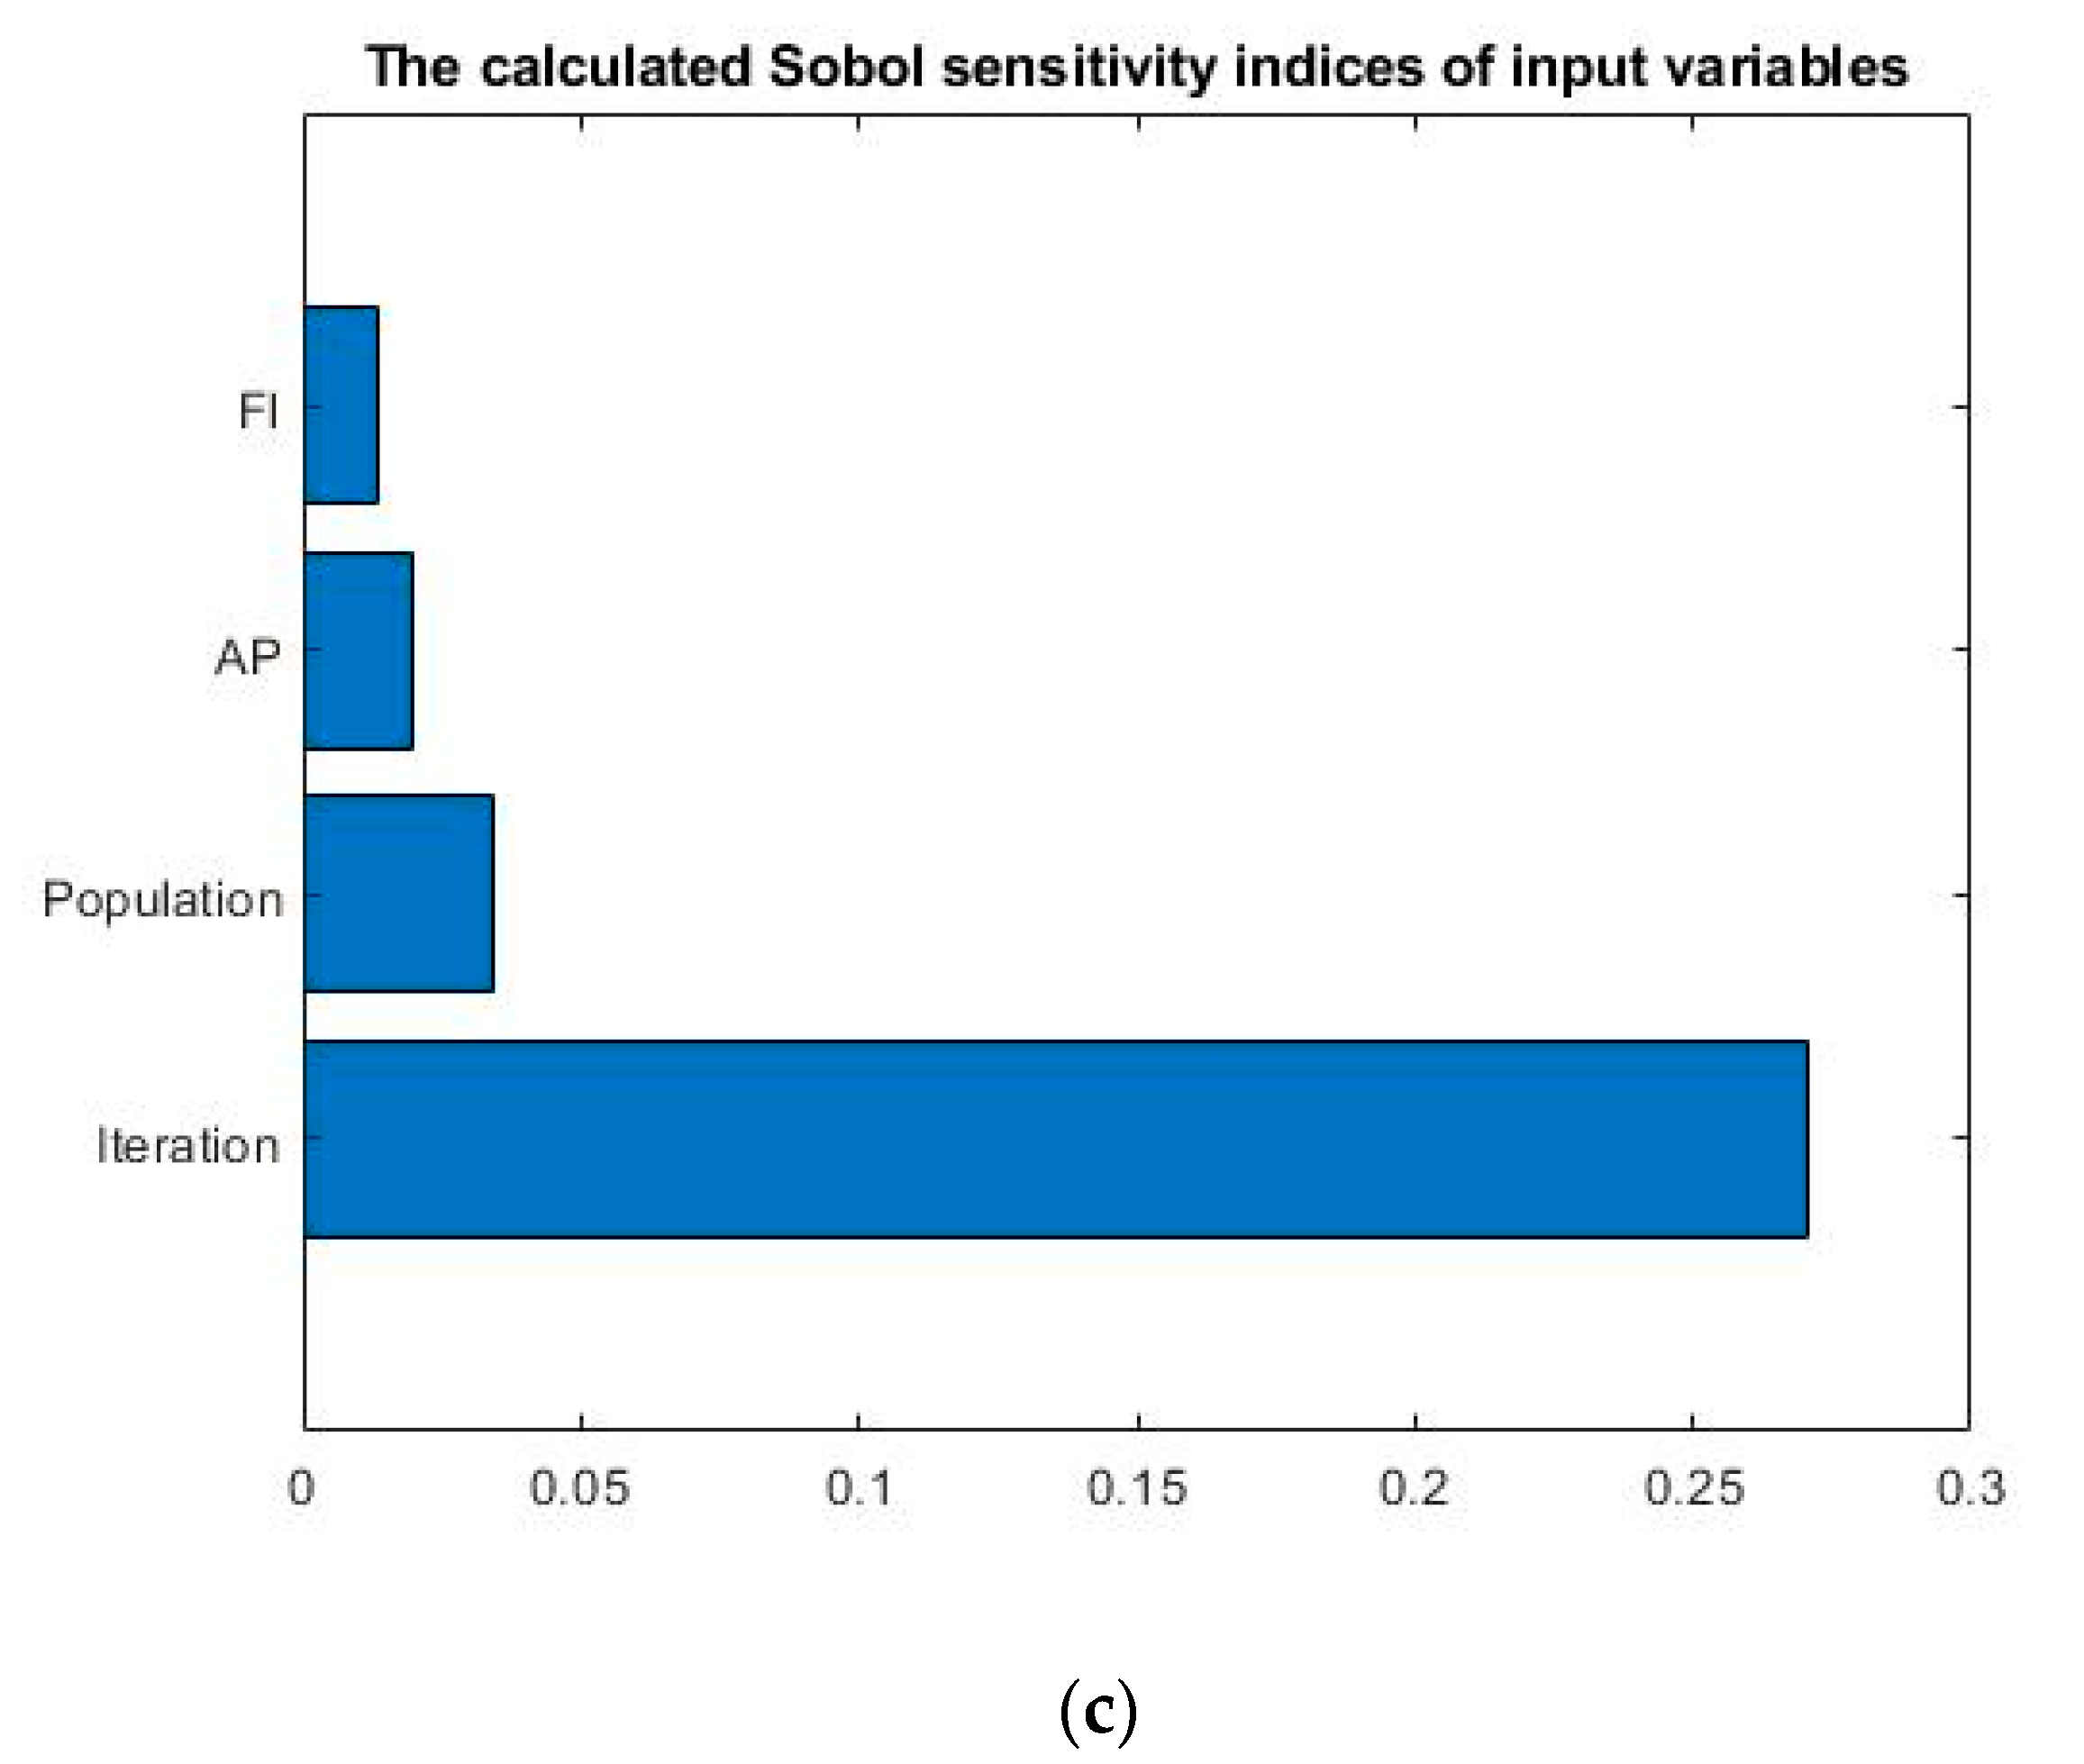
In case study 1, the following lower bound and upper bound are used and listed in Table 9. Figure 12 shows the effects of different parameters. Figure 12a shows the NPV value with population and iteration for Case study 1. Figure 12a shows that after increasing from 100 iterations and 20 populations to 150 iterations and 30 populations, the NPV value has not changed. Hence, after a certain population number and iteration number, the NPV has not changed. Figure 12b depicts the NPV value with the awareness probability and iteration. Figure 12b shows that after increasing from 100 iterations and an awareness probability of 2, to 150 iterations and an awareness probability of 3, the NPV value has not changed. Figure 12c shows that iteration and population have a significant effect on the NPV value. However, flight length (fl) and awareness probability have less effect on the NPV value.

4.3.2. Case Study 2

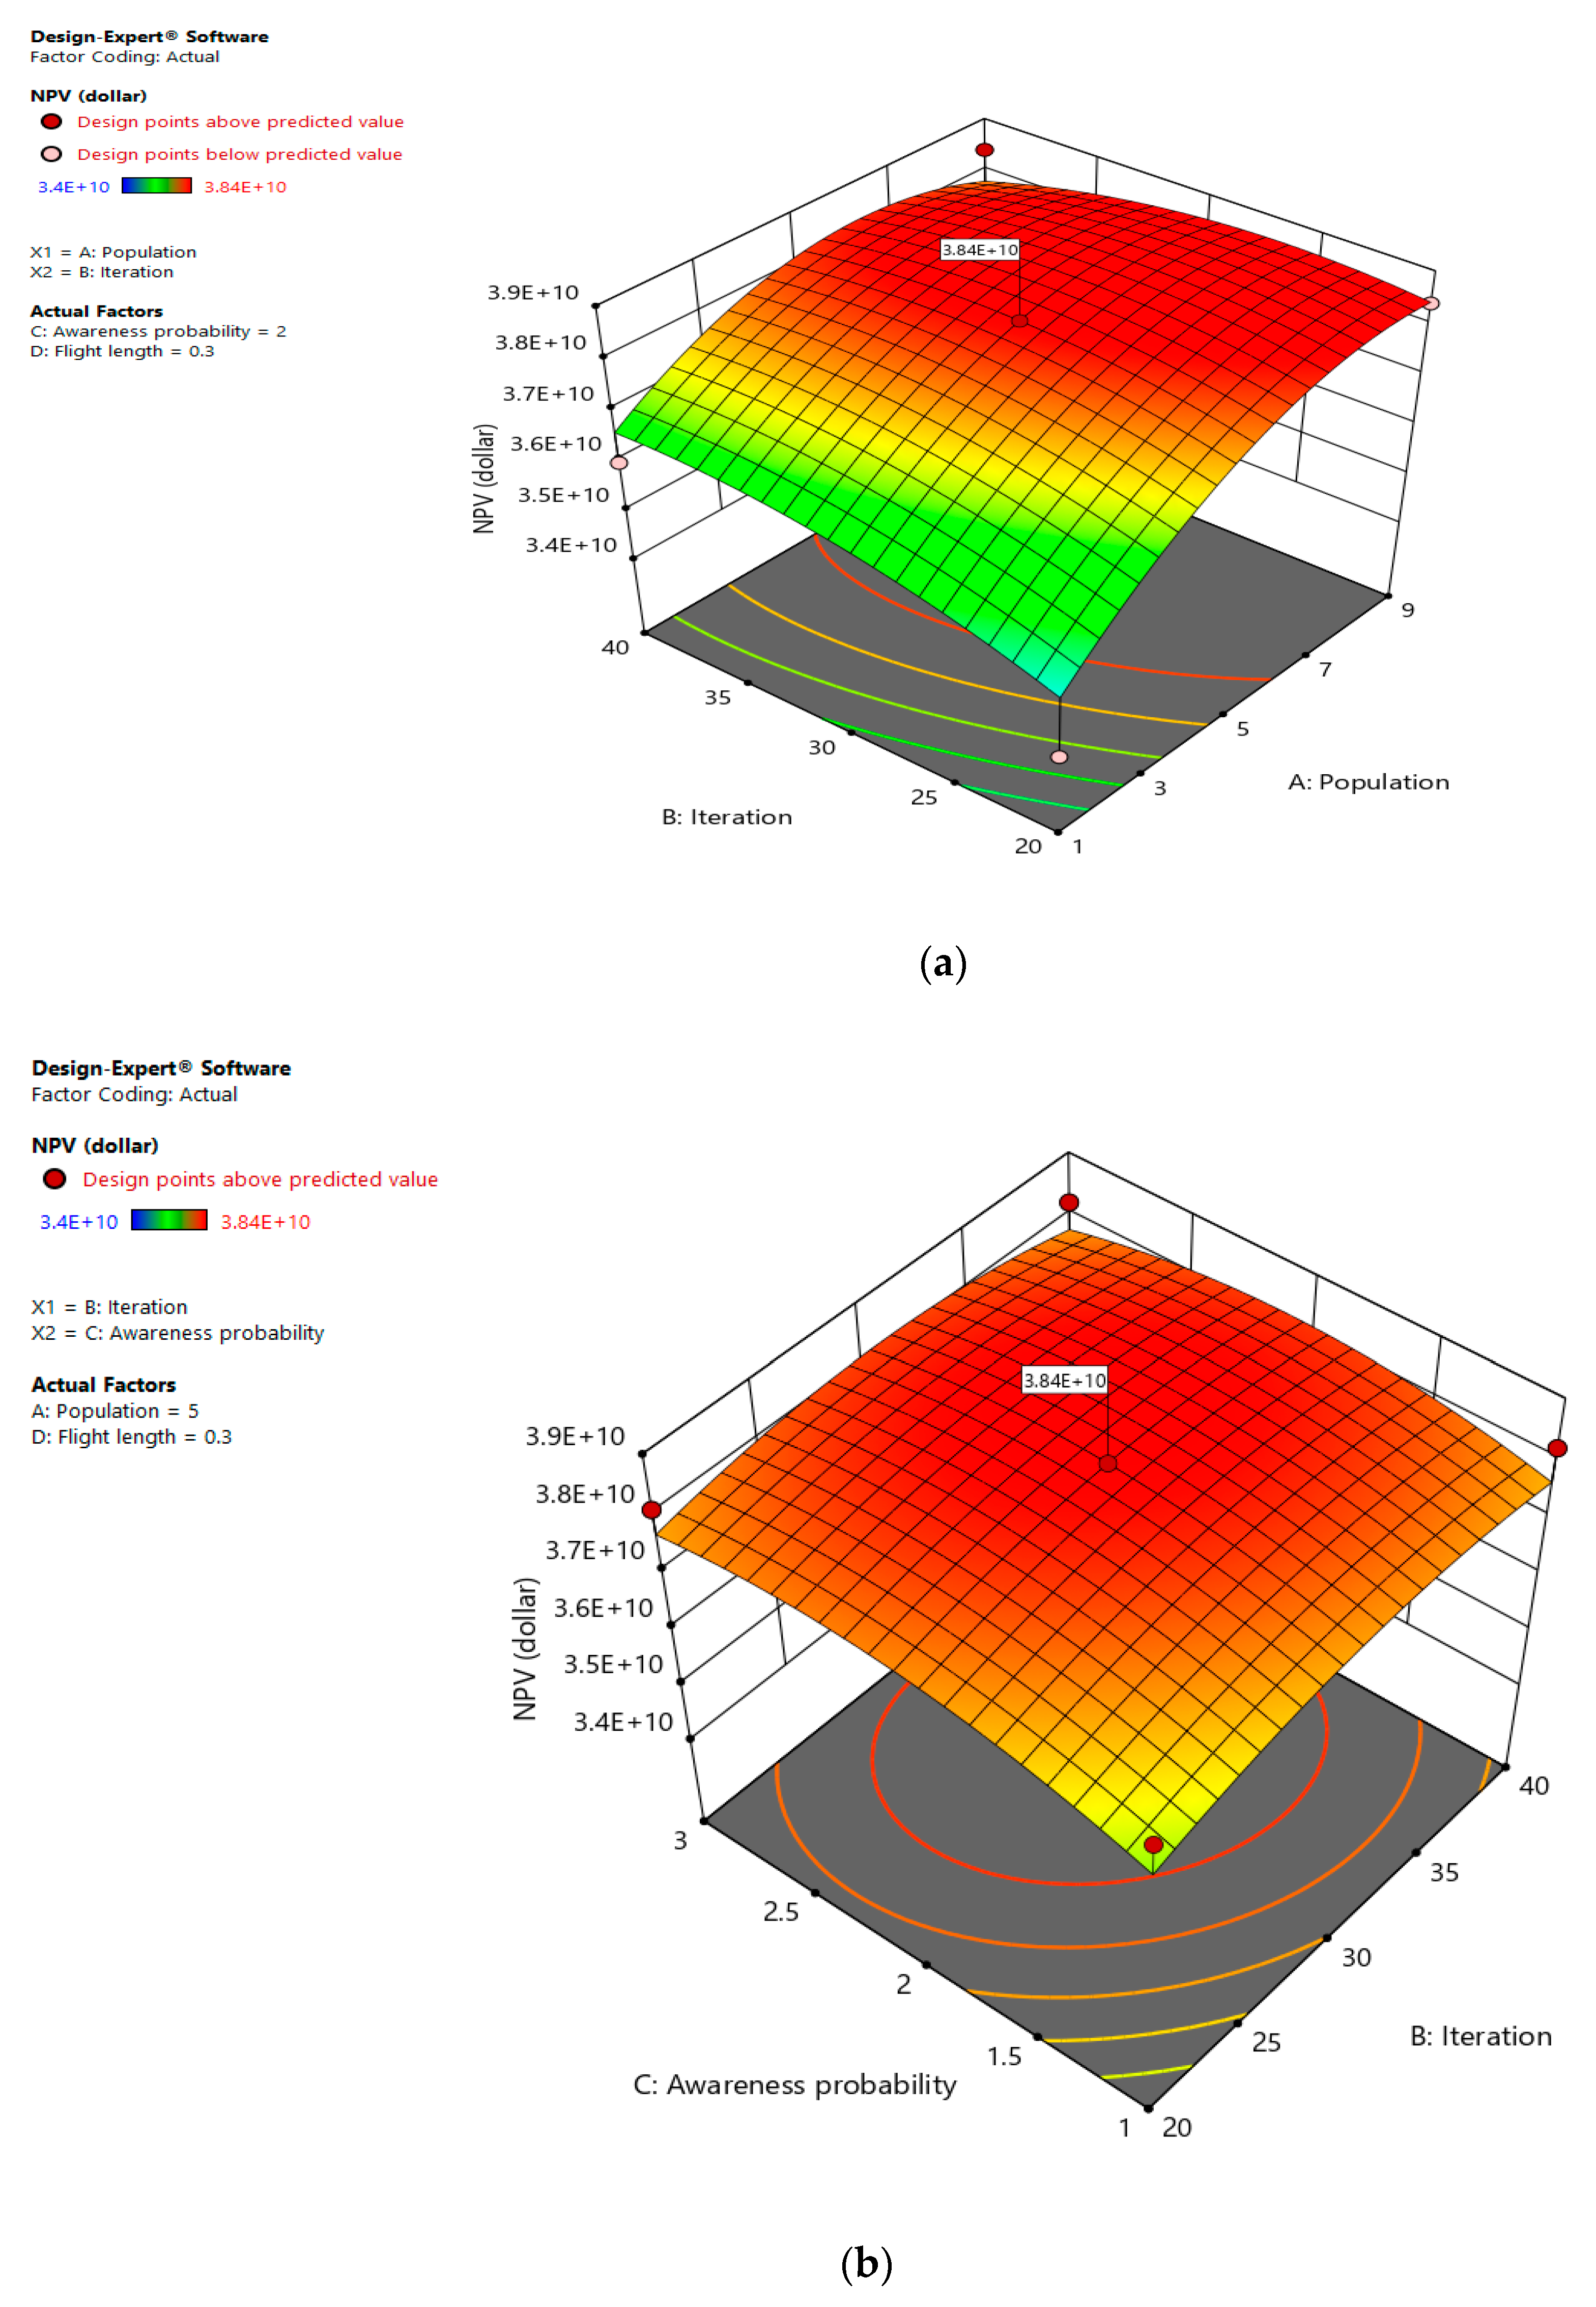
In case study 2, the lower and upper bounds are used, which are listed in Table 10. Figure 13 shows the effect of various parameters. Figure 13a shows the NPV value of case study 1 along with the size of the population and the number of iterations. Figure 13a shows that after increasing from 30 iterations and 5 populations to 40 iterations and 9 populations, the NPV value has not changed. Hence, after a certain population number and iteration number, the NPV has not changed. Figure 13b shows the NPV value including the awareness probability and the number of iterations. Figure 13b shows that after increasing from 30 iterations and an awareness probability of 2, to 40 iterations and an awareness probability of 3, the NPV value has not changed. Figure 13c shows that iteration and population have a significant effect on the NPV value. However, the effects of awareness probability and flight length on the NPV value are small.

4.4. Advantage and Disadvantage

The no free lunch theorem (NFL) states that no single algorithm can be best for all problems [7]. In this problem, PSO, GA, CSA, and NCSA have several benefits and drawbacks. CSA failed to tackle this multimodal problem since it was unable to avoid premature convergence. Equation 1 is more susceptible to premature convergence as it lacks exploration capacity. However, NCSA has been able to tackle the problem with efficiency and effectiveness. In Table 11, the advantages and disadvantages of these algorithms are presented.

4.5. Discussion

Apart from individual advantages and disadvantage, the success of NCSA can be highlighted by the following points:
  • NCSA can perform better than PSO, GSA, and CSA to tackle highly nonlinear, multimodal optimization problems as NCSA can automatically subdivide its population into subgroups since the niching technique is implemented.
  • To avoid premature convergence, such as those in PSO and GSA, the awareness probability parameter keeps NCSA switching between the equations based on the personal best information, or explicit global best.
This study has limitations, as it is primarily focused on developing optimization methods to tackle multimodal optimization. The optimization techniques can be compared with other metaheuristic algorithms in the future. In addition, history matching and uncertainty are not considered in this study for well placement optimization.

4.6. Limitations of the Study

This study only addressed well placement optimization. However, in the oil and gas industry, history matching and well control parameters are required to be optimized. Well controls are fixed in this study. However, optimized well control is necessary [87]. Furthermore, deciding the area of oil wells and operational settings (controls, for example, infusion/recuperation rates for heterogeneous supplies) presents extremely troublesome improvement issues and significantly affects underground energy recuperation execution and monetary worth. Well location optimization is an integer based problem. In addition, optimization of the well location is normally conducted first and well control settings are optimized as a fixed well location [88]. Contract theory can be used to jointly optimize the well placement optimization problem and well control optimization problem [49]. Again, a comprehensive sensitivity analysis is important. Besides, only two case studies are used. The space complexity is an important issue, which may require a different set of populations and iteration. However, in the well placement optimization problem, there is no study that has addressed this issue. In the future, a large search space should be considered to find an optimal solution. Sensitivity analysis shows that population and iteration mostly affects the performance. Since search space in the real world can be larger than in case studies, the number of iterations requires tuning. A convergence can be helpful to find the maximum number of iterations. If a sufficient number of iterations is not chosen, the convergence curve will only show an upward trend. The upward trends in the convergence curve show that the algorithm is still searching for global optima. However, if after a certain number iterations or fitness evaluations, the global optima have not changed, it can be assumed that the algorithm has converged and the convergence curve will provide a horizontal line.

5. Conclusions

In this study, the niching crow search algorithm is implemented for well placement optimization. The proposed technology is also applied to 23 classical benchmark functions. Experimental results suggested that the niching crow search algorithm can find a better solution than popular algorithms. The analysis indicates that the current approach can tackle the multimodal well placement optimization problem. Diversity analysis showed that a higher exploration could be helpful to tackle multimodal optimization problems. The crow search algorithm was unable to acquire good results for the well placement optimization problem. While tackling the multimodal optimization problem is the focus of this study, several statistical criteria are also considered to evaluate the stability and performance of the algorithms. The outcome of the study indicates that the proposed algorithm, in most cases, surpassed the main crow search algorithm. Future optimization studies should focus on combining the location of the well, well control parameters, and history matching. For better approaches, researchers have recently merged quantum computing with current metaheuristic optimization algorithms. Quantum-based optimization techniques were applied in several complex engineering applications using the quantum parallelism mechanism. Hence, to further develop the process, quantum behavior can be introduced in the future. Additionally, we suggest using the global search algorithm with a local search approach because it may have the advantage of solving the well placement optimization problem successfully. For example, the local search technique can be replaced by the firefly algorithm. Recently, lots of research works have used proxy models in recent years to replace actual reservoir simulators, and these models have been found to minimize runtime. The accuracy of this alternative model, therefore, depends on its range of sampling. Future research in this area may focus on improving the reliability of this technique.

Author Contributions

Conceptualization, J.I.; methodology, J.I.; software, J.I.; validation, J.W., P.M.V. and B.M.N.; formal analysis, J.I.; investigation, J.I.; resources, J.I.; data curation, J.I.; writing—original draft preparation, J.I.; writing—review and editing, J.I. and M.S.A.R.; visualization, J.I., A.H.; supervision, J.I., P.M.V. and B.M.N.; project administration, J.I., P.M.V. and H.K.A.; funding acquisition, M.S.A.R. All authors have read and agreed to the published version of the manuscript.

Funding

This research was funded and the Petroleum Research Fund, grant number PRF-0153AB-A33.

Institutional Review Board Statement

Not Applicable.

Informed Consent Statement

Not Applicable.

Data Availability Statement

Publicly available datasets were analyzed in this study. This data can be found here: https://doi.org/10.2118/89942-PA.

Acknowledgments

The authors would like to thank the Center of Graduate Studies of the Universiti Teknologi PETRONAS, and the petroleum research fund (PRF—0153AB-A33) for the funding of this research. The authors would like to thank and express their appreciation to the project leader Eswaran Padmanabhan for supporting the research. The authors also recognize the contribution of the Fundamental and Applied Science Department of Universiti Teknologi PETRONAS for their invaluable support.

Conflicts of Interest

The authors declare no conflict of interest.

Nomenclature

ABCArtificial Bee colony
CwCost per unit volume of produced water ($/STB)
CSACrow Search Algorithm
CAPEXCapital expenditure ($)
DDiscount rate (fraction)
StdStandard deviation
AvgAverage
GAGenetic Algorithm
ICAImperialist Competitive Algorithm
MAMetaheuristic algorithms
NFLNo Free Lunch theorem
NPVNet present value ($)
NCSANiching Crow Search Algorithm
OPEXOperational expenditure ($)
O-CSMADSMeta-optimized hybrid cat swarm MADS
PUNQ-S3A synthetic Reservoir
PSOParticle Swarm Optimization
PoOil price ($/STB)
QoCumulative oil production (STB)
QwCumulative water production (STB)
QPSOQuantum Particle Swarm optimization
PSOParticle Swarm Optimization
SPE-1A Synthetic Reservoir
TNumber of years
WPOWell Placement Optimization

Appendix A

The details of benchmark functions for numerical optimization are provided in Table A1.
Table A1. Benchmark functions considered in the numerical experiments.
FunctionRangeDimfmin
1 . f 1 ( x ) = i = 1 n x i 2 [−100, 100]300
2. f 2 ( x ) = i = 1 n | x |   + i = 1 n | x i | [−10, 10]300
3. f 3   ( x ) = i = 1 n ( j 1 i x j ) 2 [−100, 100]300
4. f 4   (x) = maxi { | x i | ,   1 i n } [−100, 100]300
5. f 5 (x) = i = 5 n 1 [ 100 ( x i = 1 x i 2 ) 2 + ( x i 1 ) 2 ] [−30, 30]300
6. f 6   ( x ) = i = 1 n ( [ x i + 0.5 ] ) 2 [−100, 100]300
7. f 7   ( x ) = i = 1 n i x i 4 + r a n d o m ( 1 , 0 ) [−1.28, 1.28]300
8. f 8   ( x ) = i = 1 n x sin | x i | [−500, 500]30−418.9829 × 5
9. f 9   ( x ) = i = 1 n [ x i 2 10 cos ( 2 π x i ) ] + 10 [−5.12, 5.12]300
10.   f 10 ( x ) = 20 e x p ( 0.2 1 n i = 1 n x i 2 ) e x p ( 1 n i = 1 n cos 2 π x i ) + 20 + e [−32, 32]300
11.   f 11 ( x ) = 1 4000 i = 1 n x i 2 i = 1 n cos ( x i i ) + 1 [−600, 600]300
12.   f 12 ( x ) = π n { 10 sin ( π y 1 ) + i = 1 n 1 ( y i 1 ) 2 [ 1 + 10 sin 2 ( π y i + 1 ) ] + ( y n 1 ) 2 } + i = 1 n u ( x i , 10 , 100 , 4 ) [−50, 50]300
13.   f 13 ( x ) = 0.1 { sin 2 ( 3 π x 1 ) + i = 1 n ( x i 1 ) 2 [ 1 + sin 2 ( 3 π x i ) + 1 ] + ( x n 1 ) 2 [ 1 + sin 2 ( 2 π x n ) ] } + i = 1 n ( x i , 5 , 100 , 4 ) [−50, 50]30−4.687
14.   f 14 ( x ) = ( 1 500 + j = 1 25 1 j + j = 1 2 ( x i a i j ) 6 ) 1 [−65.536, 65.536]21
15. f 15 ( x ) = i = 1 11 [ a i x 1 ( b i 2 + b i x 2 ) b i 2 + b i x 3 + x 4 ] 2 [−5, 5]40.00030
16.   f 16 ( x ) = 4 x 1 2 2.1 x 1 4 + 1 3 x 1 6 + x 2 x 2 4 x 2 2 + 4 x 2 4 [−5, 5]2−1.0316
17. f 17 ( x ) = ( x 2 5.1 4 π 2 x 1 2 + 5 π x 1 6 ) 2 + 10 ( 1 1 8 π ) cos x 1 + 10 [−5, 5]20.398
18. f 18 ( x ) = [ 1 + ( x 1 + x 2 + 1 ) 2 + ( 19 14 x 2 + 6 x 1 x 2 + 3 x 2 2 ) ] × [ 30 + ( 2 x 1 3 x 2 ) 2 × ( 18 32 x 1 + 12 x 1 2 + 48 x 2 36 x 1 x 2 + 27 x 2 2 ) ] [−2, 2]23
19. f 19 ( x ) = i = 1 4 c i e x p ( j = 1 3 a i j ( x i p i j ) 2 ) [1, 3]3−3.86
20. f 20 ( x ) = i = 1 4 c i e x p ( j = 1 6 a i j ( x j p i j ) 2 ) [0, 1]6−3.32
21. f 21 ( x ) = i = 1 5 [ ( X a i ) ( X a i ) T + c i ] 1 [0, 10]4−10.1532
22. f 22 ( x ) = i = 1 7 [ ( X a i ) ( X a i ) T + c i ] 1 [0, 10]4−10.4028
23. f 23 ( x ) = i = 1 10 [ ( X a i ) ( X a i ) T + c i ] 1 [0, 10]4−10.5363

References

  1. Shahri, A.A.; Moud, F.M. Landslide susceptibility mapping using hybridized block modular intelligence model. Bull. Eng. Geol. Environ. 2020, 1–18. [Google Scholar] [CrossRef]
  2. Bindiya, T.; Elias, E. Modified metaheuristic algorithms for the optimal design of multiplier-less non-uniform channel filters. Circuits Syst. Signal. Proc. 2014, 33, 815–837. [Google Scholar] [CrossRef]
  3. Lee, H.M.; Jung, D.; Sadollah, A.; Kim, J.H. Performance comparison of metaheuristic algorithms using a modified Gaussian fitness landscape generator. Soft Comput. 2019, 24, 1–11. [Google Scholar] [CrossRef]
  4. Naik, A.; Satapathy, S.C.; Abraham, A. Modified Social Group Optimization—A meta-heuristic algorithm to solve short-term hydrothermal scheduling. Appl. Soft Comput. 2020, 95, 106524. [Google Scholar] [CrossRef]
  5. Shahri, A.A.; Moud, F.M. Liquefaction potential analysis using hybrid multi-objective intelligence model. Environ. Earth Sci. 2020, 79, 1–17. [Google Scholar]
  6. Mao, K.; Pan, Q.-K.; Pang, X.; Chai, T. A novel Lagrangian relaxation approach for a hybrid flowshop scheduling problem in the steelmaking-continuous casting process. Eur. J. Oper. Res. 2014, 236, 51–60. [Google Scholar] [CrossRef]
  7. Fattahi, P.; Hosseini, S.M.H.; Jolai, F.; Tavakkoli-Moghaddam, R. A branch and bound algorithm for hybrid flow shop scheduling problem with setup time and assembly operations. Appl. Math. Model. 2014, 38, 119–134. [Google Scholar] [CrossRef]
  8. Floudas, C.A.; Gounaris, C.E. A review of recent advances in global optimization. J. Glob. Opt. 2009, 45, 3–38. [Google Scholar] [CrossRef]
  9. Wolpert, D.H.; Macready, W.G. No free lunch theorems for optimization. IEEE Trans. Evol. Comput. 1997, 1, 67–82. [Google Scholar] [CrossRef] [Green Version]
  10. Gao, Z.; Li, Y.; Yang, Y.; Wang, X.; Dong, N.; Chiang, H.-D. A GPSO-optimized convolutional neural networks for EEG-based emotion recognition. Neurocomputing 2020, 380, 225–235. [Google Scholar] [CrossRef]
  11. Bacanin, N.; Bezdan, T.; Tuba, E.; Strumberger, I.; Tuba, M. Monarch Butterfly Optimization Based Convolutional Neural Network Design. Mathematics 2020, 8, 936. [Google Scholar] [CrossRef]
  12. Islam, J.; Vasant, P.M.; Negash, B.M.; Laruccia, M.B.; Myint, M.; Watada, J. A holistic review on artificial intelligence techniques for well placement optimization problem. Adv. Eng. Softw. 2020, 141, 102767. [Google Scholar] [CrossRef]
  13. Onwunalu, J.E.; Durlofsky, L.J. Application of a particle swarm optimization algorithm for determining optimum well location and type. Comput. Geosci. 2010, 14, 183–198. [Google Scholar] [CrossRef]
  14. Ma, X.; Plaksina, T.; Gildin, E. Integrated horizontal well placement and hydraulic fracture stages design optimization in unconventional gas reservoirs. In Proceedings of the SPE Unconventional Resources Conference, Society of Petroleum Engineers, Calgary, AB, Canada, 5–7 November 2013. [Google Scholar]
  15. Rosenwald, G.W.; Green, D.W. A method for determining the optimum location of wells in a reservoir using mixed-integer programming. Soc. Petrol. Eng. J. 1974, 14, 44–54. [Google Scholar] [CrossRef]
  16. Pan, Y.; Horne, R.N. Improved methods for multivariate optimization of field development scheduling and well placement design. In Proceedings of the SPE Annual Technical Conference and Exhibition, Society of Petroleum Engineers, New Orleans, LA, USA, 27–30 September 1998. [Google Scholar]
  17. Zhang, L.M. Smart Well Pattern Optimization Using Gradient Algorithm. J. Energy Resour. Technol. Trans. Asme 2016, 138, 012901. [Google Scholar] [CrossRef]
  18. Li, L.L.; Jafarpour, B. A variable-control well placement optimization for improved reservoir development. Comput. Geosci. 2012, 16, 871–889. [Google Scholar] [CrossRef]
  19. Bangerth, W.; Klie, H.; Wheeler, M.F.; Stoffa, P.L.; Sen, M.K. On optimization algorithms for the reservoir oil well placement problem. Comput. Geosci. 2006, 10, 303–319. [Google Scholar] [CrossRef]
  20. Isebor, O.J.; Durlofsky, L.J.; Ciaurri, D.E. A derivative-free methodology with local and global search for the constrained joint optimization of well locations and controls. Comput. Geosci. 2014, 18, 463–482. [Google Scholar] [CrossRef]
  21. Giuliani, C.M.; Camponogara, E. Derivative-free methods applied to daily production optimization of gas-lifted oil fields. Comput. Chem. Eng. 2015, 75, 60–64. [Google Scholar] [CrossRef]
  22. Forouzanfar, F.; Reynolds, A.C. Well-placement optimization using a derivative-free method. J. Petrol. Sci. Eng. 2013, 109, 96–116. [Google Scholar] [CrossRef]
  23. Ma, J. An Intelligent Method for Deep-Water Injection-Production Well Pattern Design. In Proceedings of the 28th International Ocean and Polar Engineering Conference, Sapporo, Japan, 10–15 June 2018. [Google Scholar]
  24. Afshari, S.; Aminshahidy, B.; Pishvaie, M.R. Application of an improved harmony search algorithm in well placement optimization using streamline simulation. J. Petrol. Sci. Eng. 2011, 78, 664–678. [Google Scholar] [CrossRef]
  25. Awotunde, A.A. Inclusion of Well Schedule and Project Life in Well Placement Optimization. In Proceedings of the SPE Nigeria Annual International Conference and Exhibition, Society of Petroleum Engineers, Lagos, Nigeia, 5–7 August 2014. [Google Scholar]
  26. Das, K.N.; Parouha, R.P. Optimization of Engineering Design Problems via an Efficient Hybrid Meta-heuristic Algorithm. IFAC Proc. Vol. 2014, 47, 692–699. [Google Scholar] [CrossRef]
  27. Alghareeb, Z.M.; Walton, S.P.; Williams, J.R. Well placement optimization under constraints using modified cuckoo search. In Proceedings of the SPE Saudi Arabia Section Technical Symposium and Exhibition, Society of Petroleum Engineers, Al-Khobar, Saudi Arabia, 21–24 April 2014. [Google Scholar]
  28. Al Dossary, M.A.; Nasrabadi, H. Well placement optimization using imperialist competitive algorithm. J. Petrol. Sci. Eng. 2016, 147, 237–248. [Google Scholar] [CrossRef] [Green Version]
  29. Shahri, A.A.; Asheghi, R.; Zak, M.K. A hybridized intelligence model to improve the predictability level of strength index parameters of rocks. Neural Comput. Appl. 2020, 1–14. [Google Scholar] [CrossRef]
  30. Asheghi, R.; Shahri, A.A.; Zak, M.K. Prediction of uniaxial compressive strength of different quarried rocks using metaheuristic algorithm. Arab. J. Sci. Eng. 2019, 44, 8645–8659. [Google Scholar] [CrossRef]
  31. Shahri, A.A.; Moud, F.M.; Lialestani, S.P.M. A hybrid computing model to predict rock strength index properties using support vector regression. Eng. Comput. 2020, 1–16. [Google Scholar] [CrossRef]
  32. Sattar, D.; Salim, R. A smart metaheuristic algorithm for solving engineering problems. Eng. Comput. 2020, 1–29. [Google Scholar] [CrossRef]
  33. Bozorg-Haddad, O.; Solgi, M.; Loï, H.A. Meta-Heuristic and Evolutionary Algorithms for Engineering Optimization; John Wiley & Sons: New York, NY, USA, 2017. [Google Scholar]
  34. Onwunalu, J. Optimization of Field Development Using Particle Swarm Optimization and New Well Pattern Descriptions; Stanford University: Stanford, CA, USA, 2010. [Google Scholar]
  35. Siavashi, M.; Tehrani, M.R.; Nakhaee, A. Efficient Particle Swarm Optimization of Well Placement to Enhance Oil Recovery Using a Novel Streamline-Based Objective Function. J. Energy Resour. Technol. Trans. Asme 2016, 138, 052903. [Google Scholar] [CrossRef]
  36. Feng, Q.H. Well control optimization considering formation damage caused by suspended particles in injected water. J. Natl. Gas. Sci. Eng. 2016, 35, 21–32. [Google Scholar] [CrossRef]
  37. Greiner, D.; Periaux, J.; Quagliarella, D.; Magalhaes-Mendes, J.; Galván, B. Evolutionary Algorithms and Metaheuristics: Applications in Engineering Design and Optimization; Hindawi: London, UK, 2018. [Google Scholar]
  38. Khoshneshin, R.; Sadeghnejad, S. Integrated Well Placement and Completion Optimization using Heuristic Algorithms: A Case Study of an Iranian Carbonate Formation. J. Chem. Petrol. Eng. 2018, 52, 35–47. [Google Scholar]
  39. Naderi, M.; Khamehchi, E. Application of DOE and metaheuristic bat algorithm for well placement and individual well controls optimization. J. Natl. Gas. Sci. Eng. 2017, 46, 47–58. [Google Scholar] [CrossRef]
  40. Islam, J.; Vasant, P.M.; Hoqe, A.; Akand, T.; Negash, B.M. Well Location Optimization Using Novel Bat Optimization Algorithm for PUNQ-S3 Reservoir. Solid State Technol. 2020, 63, 4040–4045. [Google Scholar]
  41. Túpac, Y.J.; Vellasco, M.M.R.; Pacheco, M.A.C. Planejamento e Otimização do Desenvolvimento de um Campo de Petróleo por Algoritmos Genéticos. In Proceedings of the VIII International Conference on Industrial Engineering and Operations Management, Bandung, Indonesia, 6–8 March 2002. [Google Scholar]
  42. Montes, G.; Bartolome, P.; Udias, A.L. The use of genetic algorithms in well placement optimization. In Proceedings of the SPE Latin American and Caribbean petroleum engineering conference, Society of Petroleum Engineers, Buenos Aires, Argentina, 25–28 March 2001. [Google Scholar]
  43. Yeten, B.; Durlofsky, L.J.; Aziz, K.J.S.J. Optimization of nonconventional well type, location, and trajectory. SPE J. 2003, 8, 200–210. [Google Scholar] [CrossRef]
  44. Guyaguler, B.; Horne, R.N. Uncertainty assessment of well placement optimization. In SPE Annual Technical Conference and Exhibition; Society of Petroleum Engineers: New Orleans, LA, USA, 2001; Volume 30. [Google Scholar] [CrossRef]
  45. Lyons, J.; Nasrabadi, H. Well placement optimization under time-dependent uncertainty using an ensemble Kalman filter and a genetic algorithm. J. Petrol. Sci. Eng. 2013, 109, 70–79. [Google Scholar] [CrossRef]
  46. Humphries, T.D.; Haynes, R.D.; James, L.A. Simultaneous and sequential approaches to joint optimization of well placement and control. Comput. Geosci. 2014, 18, 433–448. [Google Scholar] [CrossRef]
  47. Aliyev, E. Use of Hybrid Approaches and Metaoptimization for Well Placement Problems. Ph.D. Thesis, Stanford University, Stanford, CA, USA, 2011. [Google Scholar]
  48. Emerick, A.A. Well placement optimization using a genetic algorithm with nonlinear constraints. In Proceedings of the SPE reservoir simulation symposium, Society of Petroleum Engineers, Woodlands, TX, USA, 2–4 February 2009. [Google Scholar]
  49. Negash, B.M.; Yaw, A.D. Artificial neural network based production forecasting for a hydrocarbon reservoir under water injection. Petrol. Explor. Dev. 2020, 47, 383–392. [Google Scholar] [CrossRef]
  50. Hamida, Z.; Azizi, F.; Saad, G. An efficient geometry-based optimization approach for well placement in oil fields. J. Petrol. Sci. Eng. 2017, 149, 383–392. [Google Scholar] [CrossRef]
  51. Irtija, N.; Sangoleye, F.; Tsiropoulou, E.E. Contract-Theoretic Demand Response Management in Smart Grid Systems. IEEE Access 2020, 8, 184976–184987. [Google Scholar] [CrossRef]
  52. Huang, X.-L.; Ma, X.; Hu, F. Machine learning and intelligent communications. Mob. Netw. Appl. 2018, 23, 68–70. [Google Scholar] [CrossRef] [Green Version]
  53. Nwankwor, E.; Nagar, A.K.; Reid, D.C. Hybrid differential evolution and particle swarm optimization for optimal well placement. Comput. Geosci. 2013, 17, 249–268. [Google Scholar] [CrossRef]
  54. Negash, B.; Ayoub, M.A.; Jufar, S.R.; Robert, A.J. History matching using proxy modeling and multiobjective optimizations. In ICIPEG 2016; Springer: Cham, Switzerland, 2017; pp. 3–16. [Google Scholar]
  55. Negash, B.M.; Him, P.C. Reconstruction of Missing Gas, Oil, and Water Flow-Rate Data: A Unified Physics and Data-Based Approach. SPE Res. Eval. Eng. 2020, 23. [Google Scholar] [CrossRef]
  56. Islam, J.; Negash, B.M.; Vasant, P.M.; Hossain, N.I.; Watada, J. Quantum-Based Analytical Techniques on the Tackling of Well Placement Optimization. Appl. Sci. 2020, 10, 7000. [Google Scholar] [CrossRef]
  57. Islam, J.; Vasant, P.; Negash, B.M.; Gupta, A.; Watada, J.; Banik, A. Well Placement Optimization Using Firefly Algorithm and Crow Search Algorithm. J. Adv. Eng. Comput. 2020, 4, 181–195. [Google Scholar] [CrossRef]
  58. Oliva, D.; Hinojosa, S.; Cuevas, E.; Pajares, G.; Avalos, O.; Gálvez, J. Cross entropy based thresholding for magnetic resonance brain images using Crow Search Algorithm. Exp. Syst. Appl. 2017, 79, 164–180. [Google Scholar] [CrossRef]
  59. Askarzadeh, A. Capacitor placement in distribution systems for power loss reduction and voltage improvement: A new methodology. IET Gene. Transm. Distrib. 2016, 10, 3631–3638. [Google Scholar] [CrossRef]
  60. Aleem, S.H.A.; Zobaa, A.F.; Balci, M.E. Optimal resonance-free third-order high-pass filters based on minimization of the total cost of the filters using Crow Search Algorithm. Electr. Power Syst. Res. 2017, 151, 381–394. [Google Scholar] [CrossRef] [Green Version]
  61. Jain, M.; Rani, A.; Singh, V. An improved Crow Search Algorithm for high-dimensional problems. J. Intell. Fuzzy Syst. 2017, 33, 3597–3614. [Google Scholar] [CrossRef]
  62. Sayed, G.I.; Hassanien, A.E.; Azar, A.T. Feature selection via a novel chaotic crow search algorithm. Neural Comput. Appl. 2019, 31, 171–188. [Google Scholar] [CrossRef]
  63. Díaz, P.; Pérez-Cisneros, M.; Cuevas, E.; Avalos, O.; Gálvez, J.; Hinojosa, S.; Zaldivar, D. An improved crow search algorithm applied to energy problems. Energies 2018, 11, 571. [Google Scholar] [CrossRef] [Green Version]
  64. Abdi, F.M.H. A modified crow search algorithm (MCSA) for solving economic load dispatch problem. Appl. Soft Comput. 2018, 71, 51–65. [Google Scholar]
  65. Rizk-Allah, R.M.; Hassanien, A.E.; Bhattacharyya, S. Chaotic crow search algorithm for fractional optimization problems. Appl. Soft Comput. 2018, 71, 1161–1175. [Google Scholar] [CrossRef]
  66. Gupta, D.; Sundaram, S.; Khanna, A.; Hassanien, A.E.; de Albuquerque, V.H.C. Improved diagnosis of Parkinson’s disease using optimized crow search algorithm. Comput. Electr. Eng. 2018, 68, 412–424. [Google Scholar] [CrossRef]
  67. Islam, J.; Vasant, P.M.; Negash, B.M.; Laruccia, M.B.; Myint, M. A Survey of Nature-Inspired Algorithms With Application to Well Placement Optimization. In Deep Learning Techniques and Optimization Strategies in Big Data Analytics; IGI Global: Hershey, PA, USA, 2020; pp. 32–45. [Google Scholar]
  68. Kennedy, J.; Eberhart, R. Particle swarm optimization (PSO). In Proceedings of the IEEE International Conference on Neural Networks, Perth, Australia, 27 November–1 December 1995; pp. 1942–1948. [Google Scholar]
  69. Islam, J.; Vasant, P.M.; Negash, B.M.; Watada, J. A modified crow search algorithm with niching technique for numerical optimization. In Proceedings of the 2019 IEEE Student Conference on Research and Development (SCOReD), Perak, Malaysia, 15–17 October 2019; pp. 170–175. [Google Scholar]
  70. Veeramachaneni, K.; Peram, T.; Mohan, C.; Osadciw, L.A. Optimization using particle swarms with near neighbor interactions. In Genetic and Evolutionary Computation Conference; Springer: Cham, Switzerland, 2003; pp. 110–121. [Google Scholar]
  71. Qu, B.-Y.; Liang, J.J.; Suganthan, P.N. Niching particle swarm optimization with local search for multi-modal optimization. Inform. Sci. 2012, 197, 131–143. [Google Scholar] [CrossRef]
  72. Yao, X.; Liu, Y.; Lin, G. Evolutionary programming made faster. IEEE Trans. Evol. Comput. 1999, 3, 82–102. [Google Scholar]
  73. Mirjalili, S.; Mirjalili, S.M.; Lewis, A. Grey wolf optimizer. Adv. Eng. Softw. 2014, 69, 46–61. [Google Scholar] [CrossRef] [Green Version]
  74. Khan, R.A.; Awotunde, A.A. Determination of vertical/horizontal well type from generalized field development optimization. J. Petrol. Sci. Eng. 2018, 162, 652–665. [Google Scholar] [CrossRef]
  75. Floris, F.; Bush, M.; Cuypers, M.; Roggero, F.; Syversveen, A.R. Methods for quantifying the uncertainty of production forecasts: A comparative study. Petrol. Geosci. 2001, 7, S87–S96. [Google Scholar] [CrossRef]
  76. Minton, J.J. A comparison of common methods for optimal well placement. Univ. Auckl. Res. Rep. 2012, 7. [Google Scholar] [CrossRef]
  77. Boah, E.A.; Kondo, O.K.S.; Borsah, A.A.; Brantson, E.T. Critical evaluation of infill well placement and optimization of well spacing using the particle swarm algorithm. J. Petrol. Exp. Prod. Technol. 2019, 9, 3113–3133. [Google Scholar] [CrossRef] [Green Version]
  78. Morales-Castañeda, B.; Zaldívar, D.; Cuevas, E.; Fausto, F.; Rodríguez, A. A better balance in metaheuristic algorithms: Does it exist? Swarm Evol. Comput. 2020, 54, 100671. [Google Scholar] [CrossRef]
  79. Hussain, K.; Salleh, M.N.M.; Cheng, S.; Shi, Y.; Naseem, R. Artificial bee colony algorithm: A component-wise analysis using diversity measurement. J. King Saud. Univ. Comput. Inform. Sci. 2018, 32, 794–808. [Google Scholar] [CrossRef]
  80. Clerc, M. From theory to practice in particle swarm optimization. In Handbook of Swarm Intelligence, (Adaptation, Learning, and Optimization); Panigrahi, B.K., Lim, M.H., Eds.; Springer: Cham, Switzerland, 2011; pp. 3–36. [Google Scholar]
  81. Wilcoxon, F. Individual comparisons by ranking methods. In Breakthroughs in Statistics; Springer: Cham, Switzerland, 1992; pp. 196–202. [Google Scholar]
  82. García, S.; Molina, D.; Lozano, M.; Herrera, F. A study on the use of non-parametric tests for analyzing the evolutionary algorithms’ behaviour: A case study on the CEC’2005 special session on real parameter optimization. J. Heurist. 2009, 15, 617. [Google Scholar] [CrossRef]
  83. Lundstedt, T. Experimental design and optimization. Chem. Intell. Lab. Syst. 1998, 42, 3–40. [Google Scholar] [CrossRef]
  84. Fisher, R.A. The design of experiments. Br. Med. J. 1936, 1, 554. [Google Scholar] [CrossRef]
  85. Montgomery, D.C. Montgomery Design and Analysis of Experiments; John Wiley & Sons: Hoboken, NJ, USA, 1997. [Google Scholar]
  86. Myers, R.H.; Montgomery, D.C.; Vining, G.G.; Borror, C.M.; Kowalski, S.M. Response surface methodology: A retrospective and literature survey. J. Q. Technol. 2004, 36, 53–77. [Google Scholar] [CrossRef]
  87. Asheghi, R.; Hosseini, S.A.; Saneie, M.; Shahri, A.A. Updating the neural network sediment load models using different sensitivity analysis methods: A regional application. J. Hydroinform. 2020, 22, 562–577. [Google Scholar] [CrossRef] [Green Version]
  88. Cannavó, F. Sensitivity analysis for volcanic source modeling quality assessment and model selection. Comput. Geosci. 2012, 44, 52–59. [Google Scholar] [CrossRef]
Figure 1. A general flow chart for searching the maximum net profit value.
Energies 14 00857 g001
Figure 2. An overview of the optimization model.
Energies 14 00857 g002
Figure 3. Crow Search Algorithm (CSA) algorithm flow chart.
Energies 14 00857 g003
Figure 4. Niching Crow Search Algorithm’s flow chart.
Energies 14 00857 g004
Figure 5. Convergence curve for CSA and NCSA for Multimodal Benchmark function f8f13 (af), (a) f8 benchmark function, (b) f9 benchmark function, (c) f10 benchmark function, (d) f11 benchmark function, (e) f12 benchmark function and (f) f13 benchmark function.
Energies 14 00857 g005aEnergies 14 00857 g005b
Figure 6. Landscape, Convergence curve, average Convergence curve, first dimension in first particle and search history for and NCSA for Multimodal Benchmark function f8f13 (af), (a) f8 benchmark function, (b) f9 benchmark function, (c) f10 benchmark function, (d) f11 benchmark function, (e) f12 benchmark function and (f) f13 benchmark function.
Energies 14 00857 g006aEnergies 14 00857 g006b
Figure 7. Description for case study 1 (ad), (a) Initial pressure, (b) Initial gas saturation, (c) Initial oil saturation and (d) Initial water saturation.
Energies 14 00857 g007
Figure 8. Description for case study 2 (ad), (a) Initial pressure, (b) Initial gas saturation, (c) Initial oil saturation and (d) Initial water saturation.
Energies 14 00857 g008
Figure 9. Convergence curve for PSO, CSA, GSA, and NCSA (a,b), (a) Case study 1 and (b) Case study 1.
Energies 14 00857 g009
Figure 10. Exploration and exploitation curve for PSO, GSA, CSA, and NCSA (ah), (a) CSA for case study 1, (b) NCSA for case study 1, (c) PSO for case study 1, (d) GSA for case study 1, (e) CSA for case study 2, (f) NCSA for case study 2, (g) PSO for case study 2 and (h) GSA for case study 2.
Energies 14 00857 g010aEnergies 14 00857 g010bEnergies 14 00857 g010cEnergies 14 00857 g010d
Figure 11. Box plot for PSO, GSA, CSA, and NCSA for (a) case study 1 and (b) case study 2.
Energies 14 00857 g011
Figure 12. Sensitivity analysis on case study 1(ac), (a) Population vs. iteration for case study 1, (b) Awareness probability vs. iteration for case study 1 and (c) Sobol sensitivity index for case study 1.
Energies 14 00857 g012aEnergies 14 00857 g012b
Figure 13. Sensitivity analysis on case study 2 (ac), (a) Population vs. iteration for case study 2, (b) Awareness probability vs. iteration for case study 2 and (c) Sobol sensitivity index for case study 2.
Energies 14 00857 g013aEnergies 14 00857 g013b
Table 1. Results for unimodal benchmark functions.
FNCSAGSA [71]PSO [71]CSA
AveStdAveStdAveAveAveStd
f13.48   ×   10 91 1.052.53   ×   10 16 9.67   ×   10 17 1.36   ×   10 4 2.02   ×   10 4 4.19   ×   10 0 1.16   ×   10 0
f26.64   ×   10 61 1.71   ×   10 60 5.57   ×   10 02 1.94   ×   10 1 4.21   ×   10 2 4.54   ×   10 2 2.72   ×   10 0 9.03   ×   10 1
f31.60   ×   10 27 5.97   ×   10 27 8.97   ×   10 2 3.19   ×   10 2 7.01   ×   10 1 2.21   ×   10 1 2.35   ×   10 2 7.16   ×   10 0
f41.67   ×   10 25 7.64   ×   10 25 7.351.74   ×   10 0 1.09   ×   10 0 3.17   ×   10 1 5.11   ×   10 0 1.22   ×   10 0
f52.68   ×   10 1 4.18   ×   10 01 6.75   ×   10 1 6.22   ×   10 1 9.67   ×   10 1 6.01   ×   10 1 2.24   ×   10 2 1.15   ×   10 2
f63.16   ×   10 1 2.39   ×   10 01 2.50   ×   10 16 1.74   ×   10 16 1.02   ×   10 4 8.28   ×   10 5 3.88   ×   10 0 1.45   ×   10 0
f78.06   ×   10 4 4.80   ×   10 04 8.94   ×   10 2 4.34   ×   10 2 1.23   ×   10 1 4.50   ×   10 2 3.30   ×   10 2 1.17   ×   10 2
Table 2. Results for multimodal benchmark functions.
FNCSAGSA [71]PSO [71]CSA
AveStdAveStdAveStdAveStd
f8−7.25   ×   10 3 9.86   ×   10 2 −2.82   ×   10 3 4.93   ×   10 2 −4.84   ×   10 3 1.15   ×   10 3 −7.01   ×   10 3 7.89   ×   10 2
f90.00   ×   10 0 0.00   ×   10 0 2.60   ×   10 1 7.47   ×   10 0 4.67   ×   10 1 1.16   ×   10 1 2.99   ×   10 1 1.13   ×   10 1
f104.44   ×   10 15 0.00   ×   10 0 6.21   ×   10 2 2.36   ×   10 1 2.76   ×   10 1 5   ×   10 1 2.80   ×   10 0 6.27   ×   10 1
f110.00   ×   10 0 0.00   ×   10 0 2.77   ×   10 0 5.04   ×   10 0 9.22   ×   10 3 7.72   ×   10 3 1.02   ×   10 0 4.07   ×   10 2
f121.66   ×   10 2 8.75   ×   10 3 1.80   ×   10 0 9.51   ×   10 1 6.92   ×   10 3 2.63   ×   10 2 2.56   ×   10 0 1.38   ×   10 0
f134.08   ×   10 1 2.27   ×   10 1 8.90   ×   10 0 7.13   ×   10 0 6.68   ×   10 3 8.91   ×   10 3 5.54   ×   10 1 2.19   ×   10 1
f141.13   ×   10 0 5.03   ×   10 1 5.86   ×   10 0 3.83   ×   10 0 3.63   ×   10 0 2.56   ×   10 0 9.98   ×   10 1 9.44   ×   10 15
f153.75   ×   10 4 7.73   ×   10 5 3.67   ×   10 3 1.65   ×   10 3 5.77   ×   10 4 2.22   ×   10 4 4.05   ×   10 4 7.73   ×   10 5
f16−1.03   ×   10 0 2.39   ×   10 6 −1.03   ×   10 0 4.88   ×   10 15 −1.03   ×   10 0 6.25   ×   10 16 −1.03   ×   10 0 2.39   ×   10 6
Table 3. Results for fixed-dimensional multimodal benchmark functions.
FNCSAGSA [71]PSO [71]CSA
AveStdAveStdAveAveAveStd
f173.98   ×   10 1 1.09   ×   10 5 3.98   ×   10 1 0.00   ×   10 0 3.98   ×   10 1 0.00   ×   10 0 3.98   ×   10 1 8.48   ×   10 10
f183.00   ×   10 0 9.98   ×   10 6 3.00   ×   10 0 4.17   ×   10 15 3.00   ×   10 0 1.33   ×   10 15 3.00   ×   10 0 1.32   ×   10 10
f19−3.86   ×   10 0 2.67   ×   10 4 −3.86   ×   10 0 2.29   ×   10 15 −3.86   ×   10 0 2.58   ×   10 15 −3.86   ×   10 0 2.19   ×   10 10
f20−3.29   ×   10 0 4.45   ×   10 2 −3.32   ×   10 0 2.31   ×   10 2 −3.27   ×   10 0 6.05   ×   10 2 −3.31   ×   10 0 3.11   ×   10 2
f21−7.73   ×   10 0 2.19   ×   10 0 −5.96   ×   10 0 3.74   ×   10 0 −6.87   ×   10 0 3.02   ×   10 0 −1.02   ×   10 1 4.65   ×   10 6
f22−8.82   ×   10 0 1.90   ×   10 0 −9.68   ×   10 0 2.01   ×   10 0 −8.46   ×   10 0 3.09   ×   10 0 −1.04   ×   10 1 4.54   ×   10 7
f23−9.16   ×   10 0 1.86   ×   10 0 −1.05   ×   10 1 2.60   ×   10 15 9.95   ×   10 0 1.78   ×   10 0 −1.05   ×   10 1 2.19   ×   10 7
Table 4. Parameters used for metaheuristic algorithms on well placement optimization.
Ref.YearsTechniqueParameter Configuration
1.[43]2018GACrossover = 60%
Mutation = 5%
2.[72]2018PSOInertial factor = 0.729
c 1 & c 2 = 1.494
(where c 1 & c 2 represents acceleration)
3.Proposed-NCSAFlight length, fl = 2
Awareness probability, Ap = 0.3
4.Proposed2010CSAFlight length, fl = 2
Awareness probability, Ap = 0.3
Table 5. Economic parameters used in well placement optimization.
Economic ParameterValueUnit
Gas price, P g 0.126$/MScf
Oil price, P O 290.572$/STB
Discount rate10%-
Capital expenditure (CAPEX)6.4 × 10⁷$
Water production cost31.447$/STB
Oil production cost72.327$/STB
Table 6. Statistical data of applied metaheuristic algorithms on well placement optimization for case study 1.
CriteriaGSAPSOCSANCSA
Max3.84   ×   10 9 5.14   ×   10 9 3.72   ×   10 9 5.17   ×   10 9
Min2.83   ×   10 9 3.43   ×   10 9 2.43   ×   10 9 4.06   ×   10 9
Average3.33   ×   10 9 4.07   ×   10 9 3.24   ×   10 9 4.37   ×   10 9
Standard deviation2.62   ×   10 8 5.72   ×   10 8 3.73   ×   10 8 1.10   ×   10 9
Effectiveness6.44   ×   10 1 7.87   ×   10 1 6.27   ×   10 1 8.46   ×   10 1
Efficiency1.39   ×   10 1 5.53   ×   10 1 5.09   ×   10 1 5.04   ×   10 1
Table 7. Statistical data of applied metaheuristic algorithms on well placement optimization for case study 2.
GSAPSOCSANCSA
Maximum3.84   ×   10 10 3.86   ×   10 10 3.83   ×   10 10 3.86   ×   10 10
Minimum3.63   ×   10 10 3.75   ×   10 10 3.34   ×   10 10 3.82   ×   10 10
Average3.76   ×   10 10 3.82   ×   10 10 3.66   ×   10 10 3.84   ×   10 10
Standard deviation6.21   ×   10 8 3.09   ×   10 8 1.63   ×   10 9 1.50   ×   10 8
Effectiveness9.74   ×   10 1 9.88   ×   10 1 9.49   ×   10 1 9.94   ×   10 1
Efficiency9.79   ×   10 2 1.52   ×   10 1 1.54   ×   10 1 3.05   ×   10 1
Table 8. Statistical data of applied metaheuristic algorithms on well placement optimization for the case study 1 reservoir.
Case Study 1Case Study 2
Z Valuep Value One Tailp Value Two TailsZ Valuep Value One Tailp Value Two Tails
NCSA Versus GSA2.68   ×   10 0 3.73   ×   10 3 7.45   ×   10 3 3.40   ×   10 0 3.37   ×   10 4 6.74   ×   10 4
NCSA Versus PSO1.90   ×   10 0 2.87   ×   10 2 5.74   ×   10 2 3.45   ×   10 0 2.79   ×   10 4 5.57   ×   10 4
NCSA Versus CSA2.68   ×   10 0 3.73   ×   10 3 7.45   ×   10 3 3.50   ×   10 0 2.30   ×   10 4 4.60   ×   10 4
Table 9. Statistical data of applied metaheuristic algorithms on well placement optimization for the case study 1 reservoir.
ParameterUpper BoundLower Bound
Iteration15050
Population3010
Awareness probability31
Flight length0.30.1
Table 10. Statistical data of applied metaheuristic algorithms on well placement optimization for the case study 1 reservoir.
ParameterUpper BoundLower Bound
Iteration4020
Population91
Awareness probability31
Flight length0.30.1
Table 11. Advantages and disadvantages of discussed techniques.
TechniquesAdvantagesDisadvantages
NCSAHigher effectiveness
High exploration rate
Superior net profit value.
A high standard deviation and low efficiency are observed.
PSO Less parameter to tune.
Simple structure and less dependent on initial points.
Trapped in local optima due to weak local search.
A high standard deviation and low efficiency are observed.
GSA Low standard deviationHigh exploitation provides less net profit value.
CSALess parameter to tune.
Faster convergence.
Easy Implementation.
Less effective in nonlinear optimization.
Trapped in local Optima.
Publisher’s Note: MDPI stays neutral with regard to jurisdictional claims in published maps and institutional affiliations.