Article

Polyethylene Pyrolysis Products: Their Detonability in Air and Applicability to Solid-Fuel Detonation Ramjets

by
Sergey M. Frolov
1,*,
Igor O. Shamshin
1,
Maxim V. Kazachenko
1,
Viktor S. Aksenov
1,
Igor V. Bilera
2,
Vladislav S. Ivanov
1 and
Valerii I. Zvegintsev
3
1
Department of Combustion and Explosion, Semenov Federal Research Center for Chemical Physics of the Russian Academy of Sciences, 119991 Moscow, Russia
2
Department of Oil Refining and Petrochemicals, Topchiev Institute of Petrochemical Synthesis of the Russian Academy of Sciences, 119991 Moscow, Russia
3
Laboratory of Hypersonic Technologies, Khristianovich Institute of Theoretical and Applied Mechanics of the Siberian Branch of the Russian Academy of Sciences, 630090 Novosibirsk, Russia
*
Author to whom correspondence should be addressed.
Energies 2021, 14(4), 820; https://doi.org/10.3390/en14040820
Submission received: 10 January 2021 / Revised: 31 January 2021 / Accepted: 1 February 2021 / Published: 4 February 2021
(This article belongs to the Section K: State-of-the-Art Energy Related Technologies)

Abstract

:
The detonability of polyethylene pyrolysis products (pyrogas) in mixtures with air is determined for the first time in a standard pulsed detonation tube based on the measured values of deflagration-to-detonation transition run-up time. The pyrogas is continuously produced in a gas generator at decomposition temperatures ranging from 650 to 850 °C. Chromatographic analysis shows that at a high decomposition temperature (850 °C) pyrogas consists mainly of hydrogen, methane, ethylene, and ethane, and has a molecular mass of about 10 g/mol, whereas at a low decomposition temperature (650 °C), it mainly consists of ethylene, ethane, methane, hydrogen, propane, and higher hydrocarbons, and has a molecular mass of 24–27 g/mol. In a pulsed detonation mode, the air mixtures of pyrogas with the fuel-to-air equivalence ratio ranging from 0.6 to 1.6 at normal pressure are shown to exhibit the detonability close to that of the homogeneous air mixtures of ethylene and propylene. On the one hand, this indicates a high explosion hazard of pyrogas, which can be formed, e.g., in industrial and household fires. On the other hand, pyrogas can be considered as a promising fuel for advanced propulsion powerplants utilizing the thermodynamic Zel’dovich cycle with detonative combustion, e.g., solid-fuel detonation ramjets. In view of it, the novel conceptual design of the dual-duct detonation ramjet demonstrator intended for operation on pyrogas at the cruising flight speed of Mach 2 at sea level has been developed. The ramjet demonstrator has been manufactured and preliminarily tested in a pulsed wind tunnel at Mach 1.5 and 2 conditions. In the test fires, a short-term onset of continuous detonation of ethylene was registered at both Mach numbers.

1. Introduction

Pyrolysis of organic solid combustible materials (SCMs) is a promising direction in aerospace propulsion, power engineering, waste incineration, chemical technology, etc. Pyrolysis implies the process of thermal degradation of long chains of hydrocarbons induced by the heat flux to the SCM. SCMs are generally converted into gas, solids, and liquids [1]. The factors driving the pyrolysis process are the SCM type, its decomposition temperature, and residence time in a reactor [2]. The issues related to the pyrolysis products of various SCMs (polymers, plastics, resins, paraffins, etc.) are of growing interest in the literature, in particular their fire and explosion safety [3] and application to advanced propulsion. Thus, multicomponent gaseous pyrolysis products containing hydrogen, hydrocarbons, and other compounds may exhibit the flammability/detonability, which cannot be estimated based on the flammabilities/detonabilities of the prevailing components due to the multiplicity of chemical kinetic channels for the development of chain reactions of combustion and self-ignition. The use of air as an oxidizing agent allows organizing a combustion process above an SCM sample and thereby significantly increase the efficiency of SCM gasification [4] as compared to the gasification in the inert gas environment [5]. The yield of gasification products increases with the temperature of the carrier gas and the heat absorbed by the material. The minimum ratio between the flow rates of the carrier gas and gasification products in the experiments [4,5] is estimated as 5 and 1.75 for nitrogen and air, respectively. This advantage is beneficial for solid-fuel ramjets [6,7,8] operating on SCMs with a low melting point, like polyethylene (PE), polypropylene (PP), polystyrene, polybutadiene, etc.
The possibility of using the gasification/pyrolysis products of low-melting SCMs in advanced solid-fuel ramjets operating on both deflagration and detonation was addressed only recently [9,10]. Since the thrust performances of ramjets operating on deflagration are close to reach their limits, the possibility of using a thermodynamic cycle with continuous-detonation (spinning or longitudinally pulsating) rather than continuous-deflagration of fuel is currently considered with the perspective of obtaining a significant increase in the ramjet efficiency [11]. Such a cycle is often referred to as the Zel’dovich cycle [12,13] and is named after Zel’dovich who was the first to propose the replacement of deflagration by controlled detonation in ramjets [12]. There are several excellent literature reviews on the rocket-type and air-breathing engines utilizing continuous detonation [14,15,16,17,18]. Most of publications relevant to detonation ramjets (DRs) deal with hydrogen as a fuel readily detonable in air. Other fuels used in such studies are syngas (H2 + CO), (H2 + CH4) blends, gaseous ethylene, acetylene, propane, etc. As for liquid fuels, there are several studies with liquid propane–gaseous hydrogen blends [19], blends of liquid kerosene with gaseous hydrogen or syngas [20], blends of liquid kerosene, hexane, and ethanol with gaseous hydrogen [21], and pure liquid kerosene [22]. The gasification/pyrolysis products of SCMs with a low melting point have never been considered as a fuel for DRs presumably because of a lack of data on their detonability in mixtures with air.
In [23,24], a new approach for evaluating the detonability of fuel–air mixtures (FAMs) based on the measured values of the deflagration-to-detonation transition (DDT) run-up distance and time in substantially identical thermodynamic and gasdynamic conditions is proposed. It is confirmed that this method is applicable to both gaseous mixtures and air suspensions of liquid or solid fuels. Experiments are performed to evaluate the detonability of FAMs of gaseous products of PP pyrolysis. Such FAMs enriched with fuel (with the fuel-to-air equivalence ratio Φ in the range 1.11 ≤ Φ ≤ 1.37) are shown to exhibit detonability close to that of the liquefied petroleum gas of the PBA grade (Propane-Butane Automotive) in a stoichiometric mixture with air under normal conditions. Systematic experimental studies on the ranking of gaseous FAMs based on hydrogen, acetylene, ethylene, propylene, propane-butane, n-pentane and natural gas of different compositions (from extremely fuel lean to extremely fuel rich) in terms of their detonability at normal temperature and pressure conditions are reported in [25]. When comparing the results of [23,24] and [25], it turns out that the detonability of gaseous products of PP pyrolysis in air is comparable to that of homogeneous propylene–air mixtures with the same equivalence ratio Φ.
The purpose of this work is to continue the studies started by Frolov et al. in [23,24,25] and to study the detonability of FAMs based on gaseous products of PE pyrolysis (hereinafter referred to as pyrogas) implying their application in advanced solid-fuel DRs operating on SCMs with a low melting point. The scientific novelty of the research outlined in this paper lies in the fact that the objects of this study are multicomponent pyrolysis gases of realistic composition. The manuscript is divided into two main parts. In the first, major part we describe the experimental study of the relative detonability of pyrogas in mixtures with air as compared to homogeneous ethylene–air and propylene–air mixtures. In the second, minor part we present the conceptual design of a dual-duct DR intended for operation on pyrogas and the results of preliminary test fires of the ethylene-fueled DR in a pulsed wind tunnel (WT).

2. Detonability of Polyethylene Pyrolysis Products in Air

2.1. Test Bench and Experimental Procedure

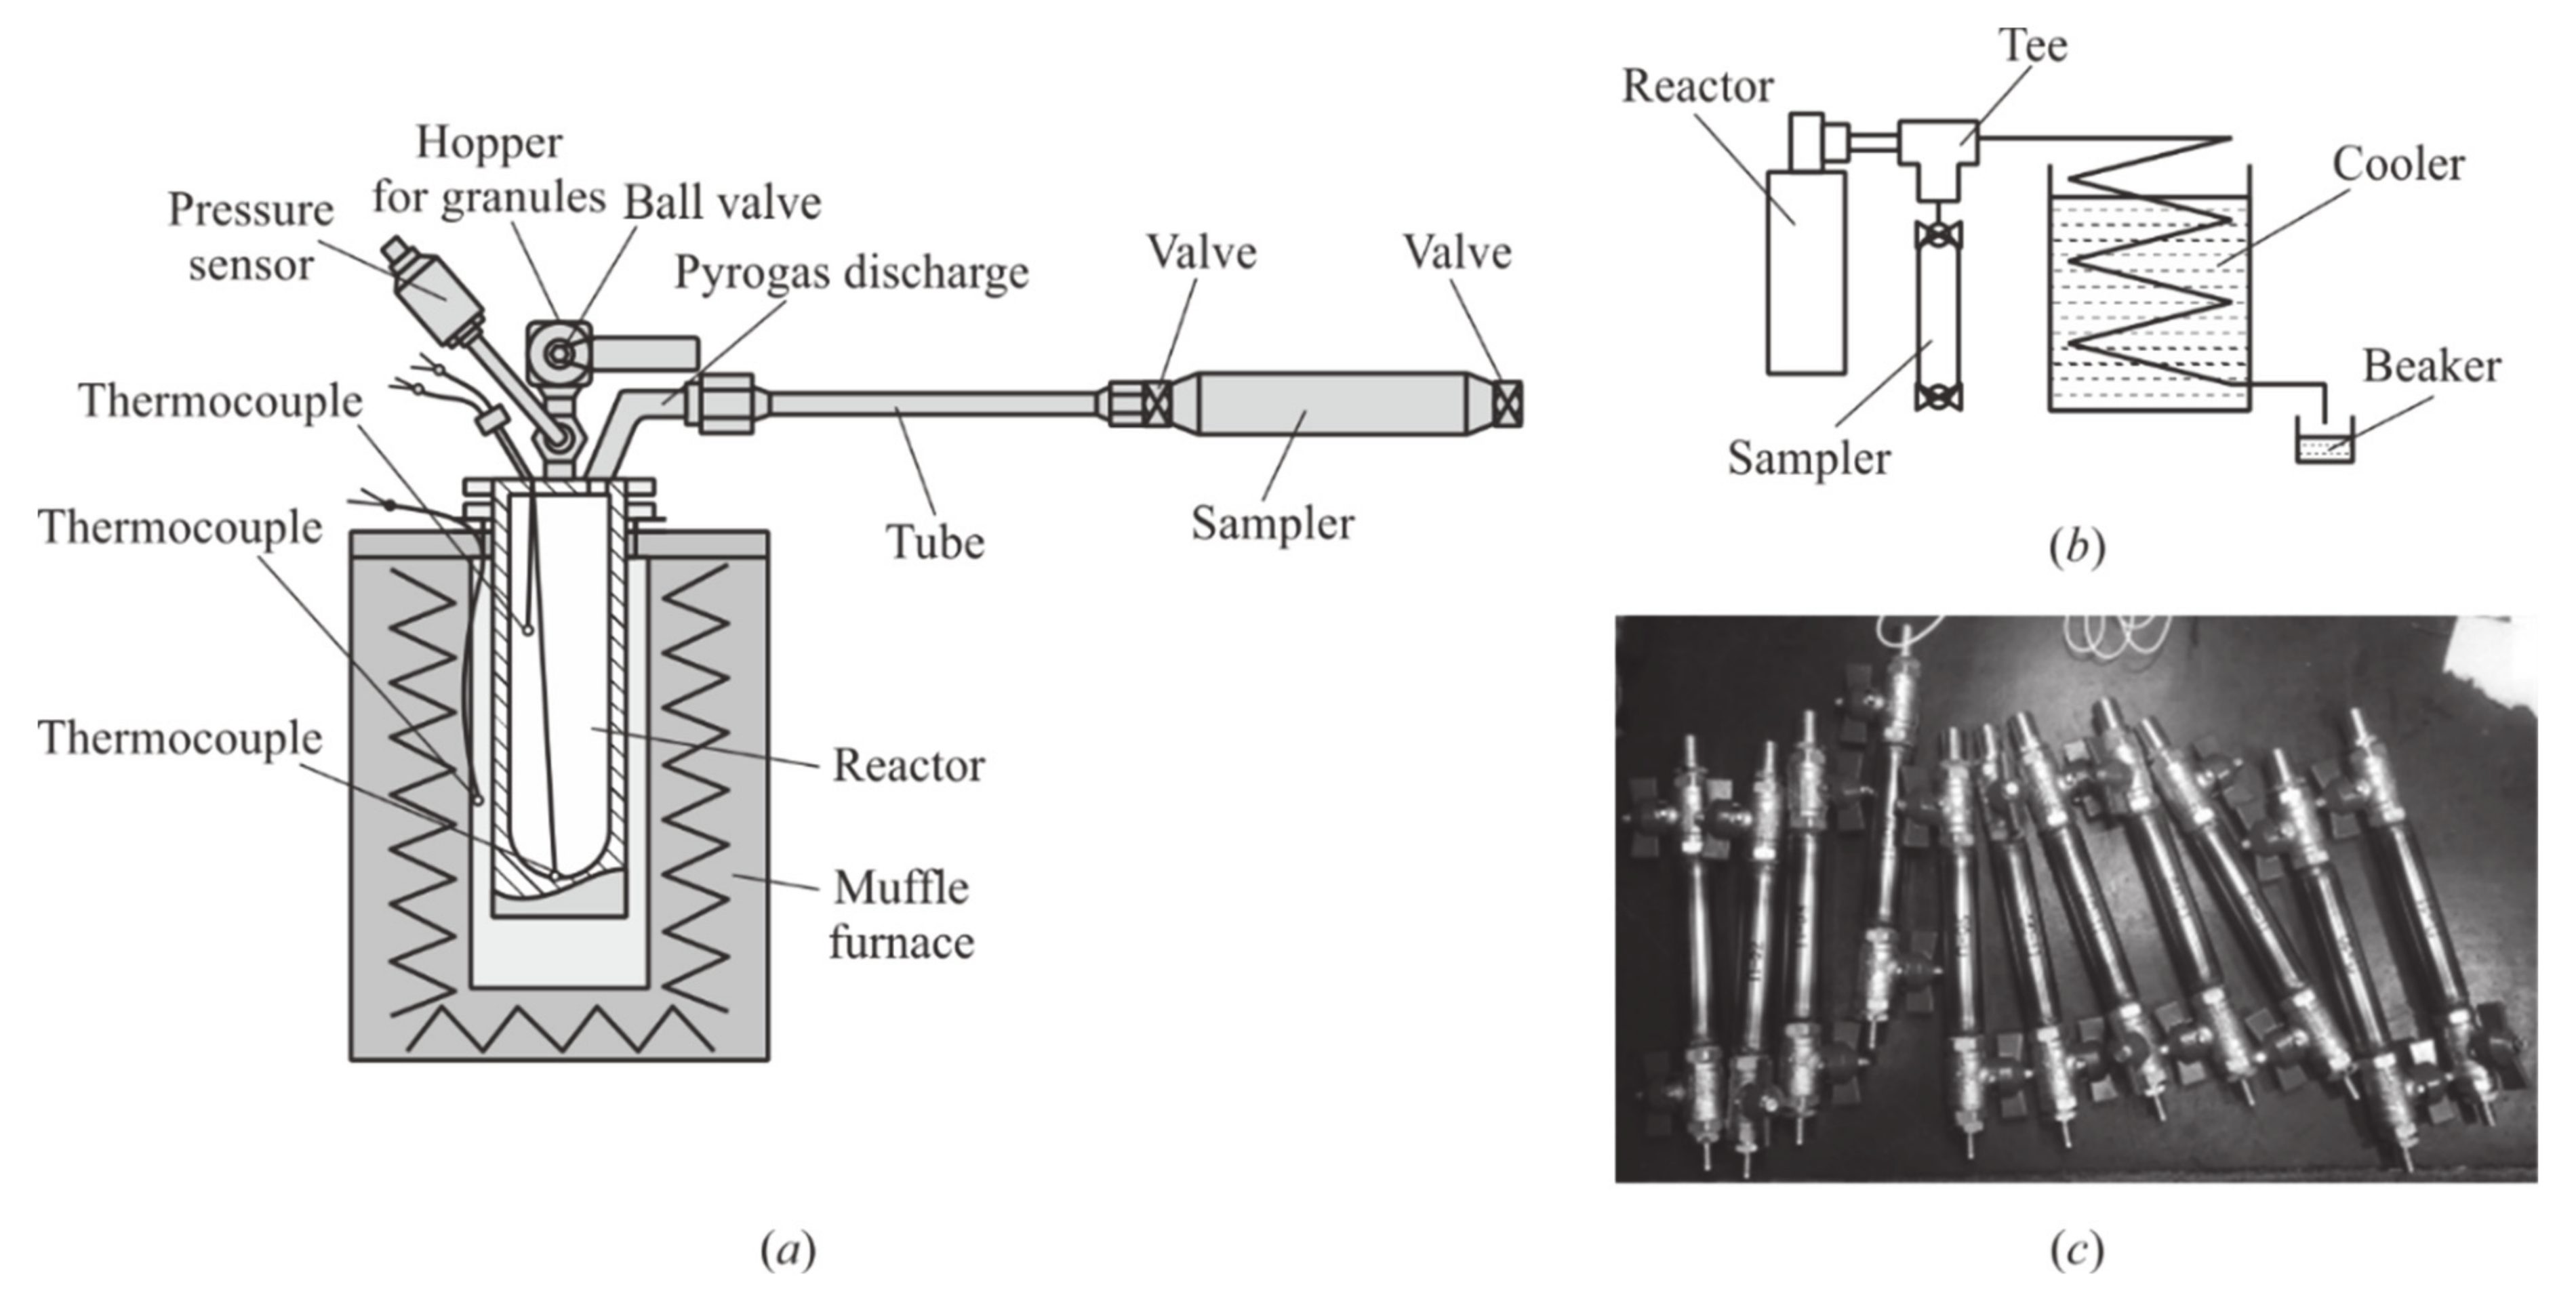
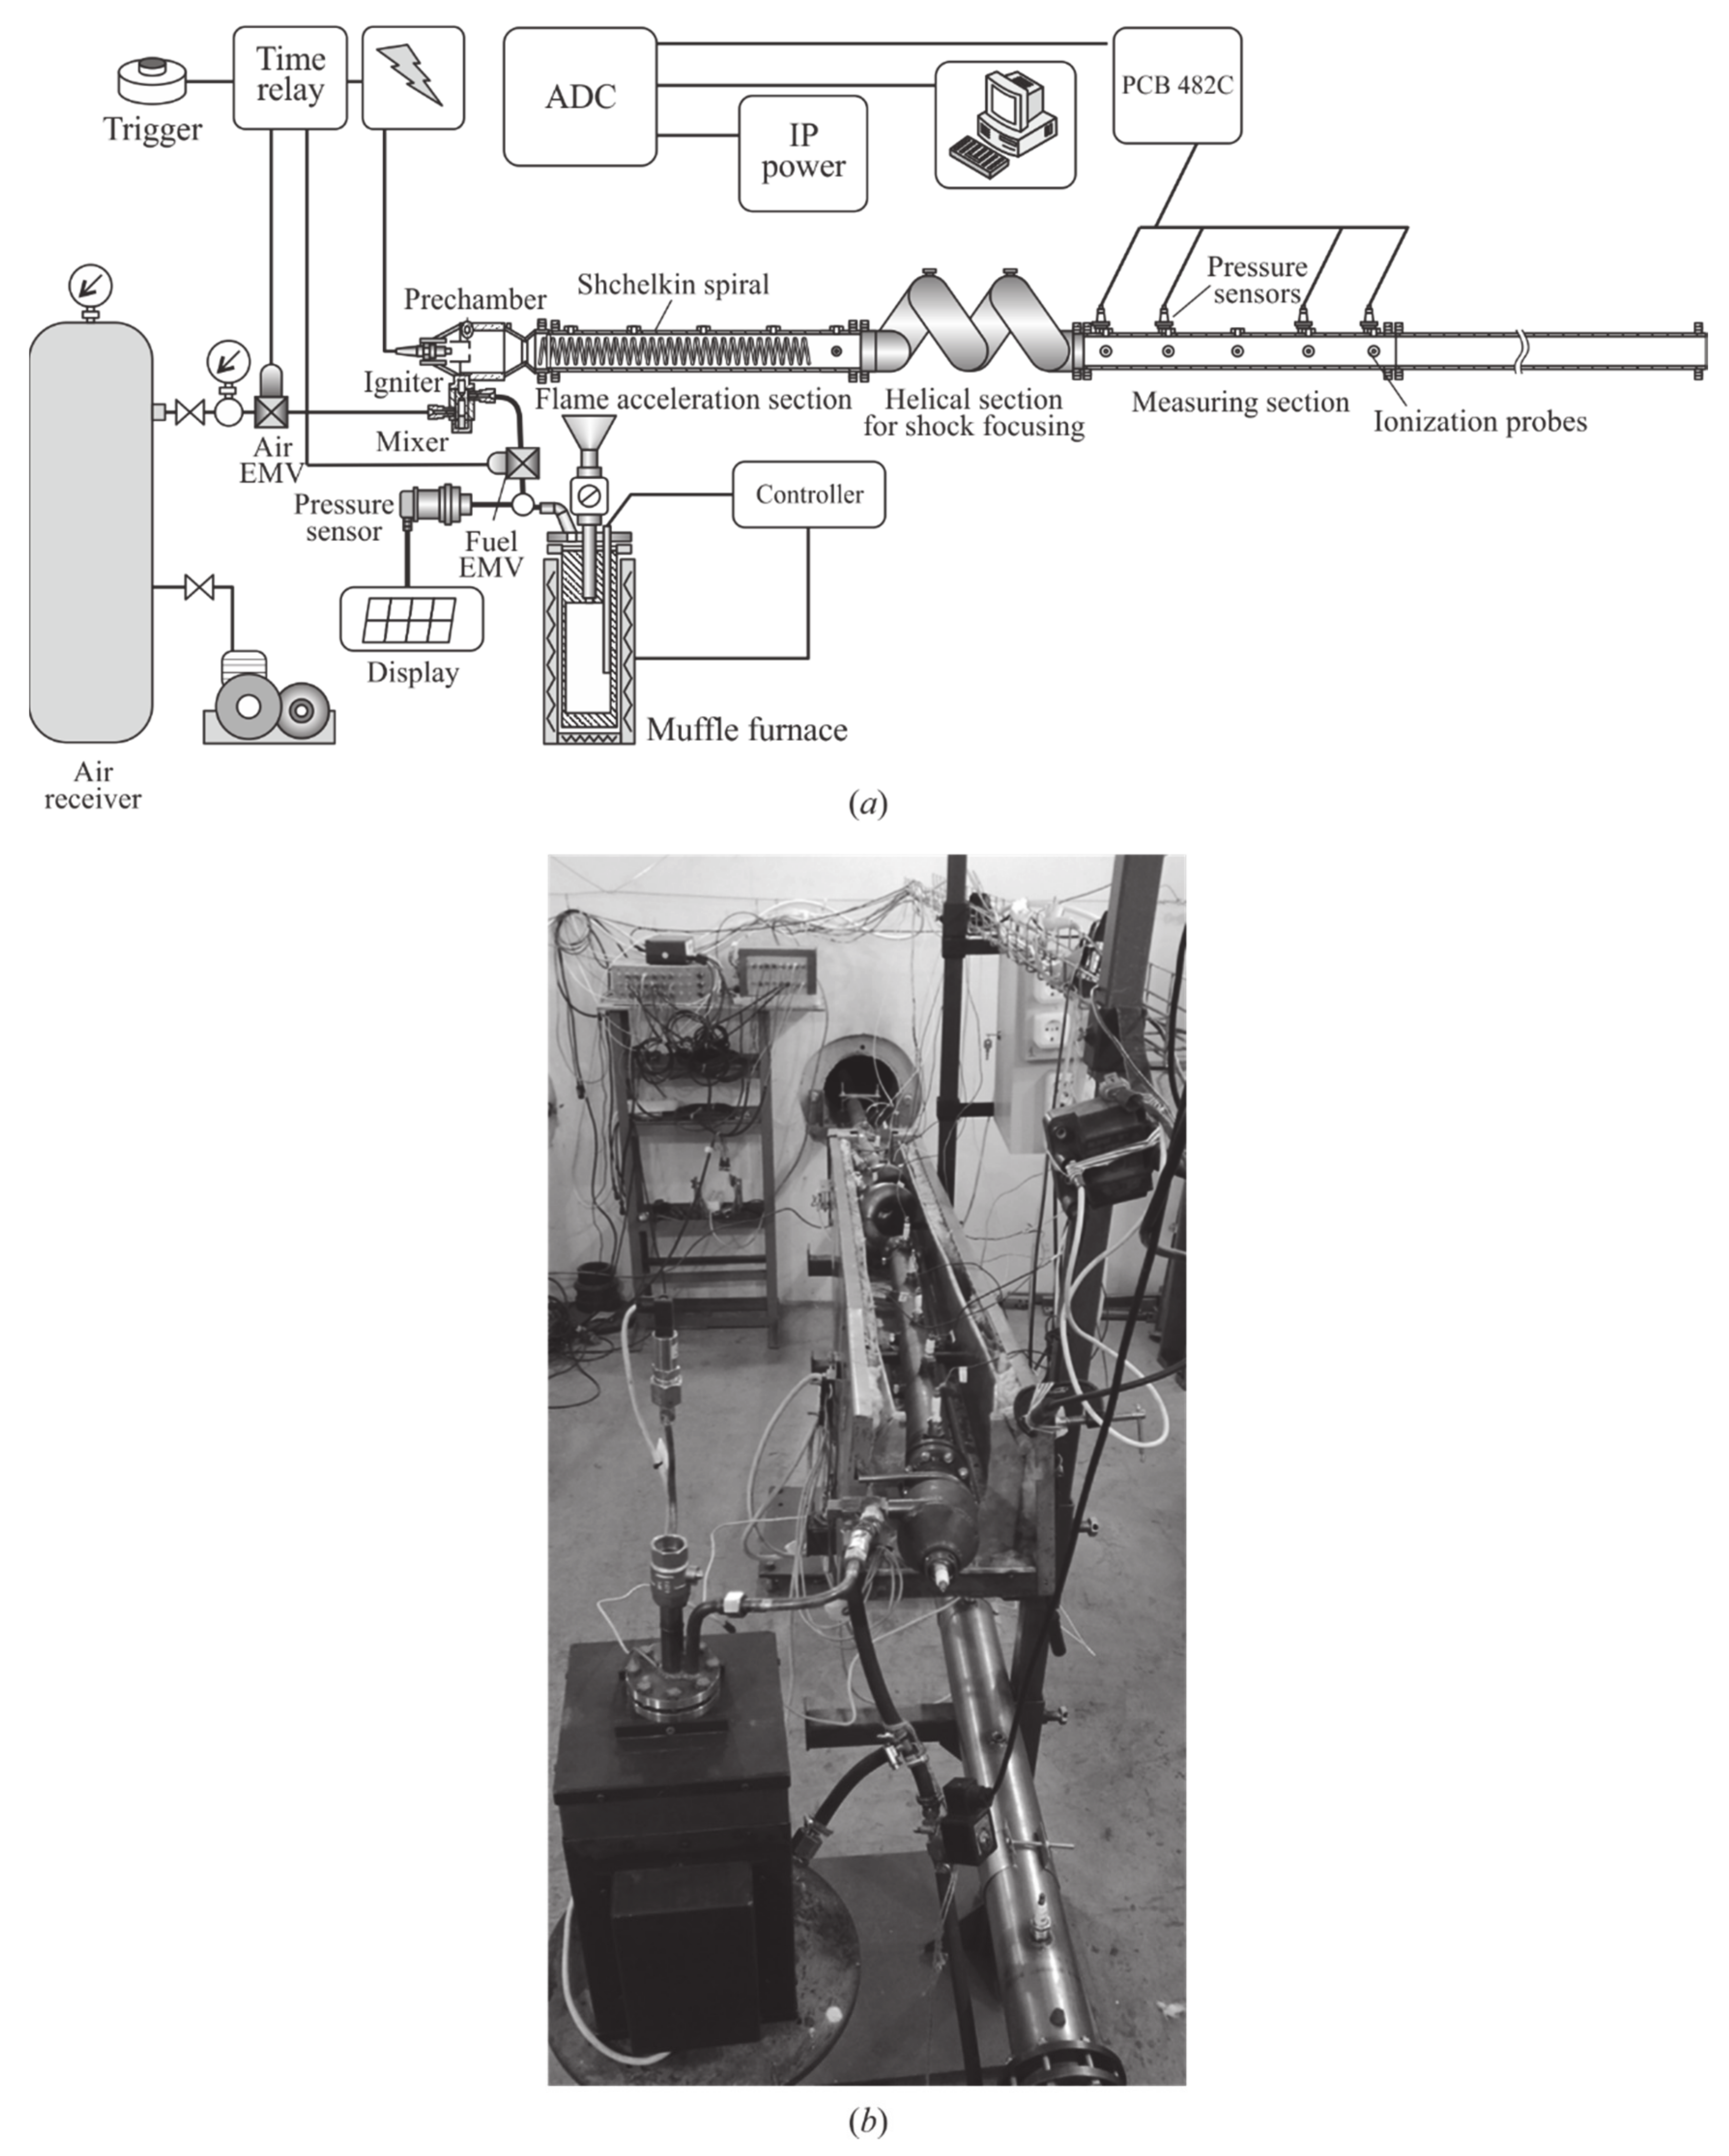
Experiments are performed on the test bench (Figure 1) described in detail in [23,24,25]. The test bench includes a standard pulsed detonation tube (PDT), thermostatic gas generator (GG), air supply system, mixer, control devices, ignition system, measuring probes and sensors, and data acquisition system. The main element of the test bench is the PDT (Figure 2), which consists of three sections: flame acceleration section with Shchelkin spiral; helical section for gasdynamic focusing of shock waves (SWs) running ahead of the flame; and measuring section. The internal diameter of the tube of all PDT sections is 50 mm. The total length of the PDT is about 5 m. The length of the measuring section is increased as compared to [23,24,25]: instead of 12 (see Figure 3 in [22]), 18 measuring stations are used, in which high-frequency pressure sensors (PS, PCB 113b24) and/or ionization probes (IP) are installed. Compared with [23,24,25], the design of the GG is also changed (Figure 3): instead of a massive insert, it applies a massive bottom with a spherical recess, and an additional thermocouple is used for measuring the temperature of the pyrogas at the outlet from the GG. Besides, an additional electromagnetic valve (EMV) is installed in the fuel main to control the supply of pyrogas in the mixer. The rest of the test bench is the same as in [23,24,25]. During the experiment, air and pyrogas are periodically supplied into the mixer through the EMVs in air and fuel mains, where they are effectively mixed. The mixture is then fed from the mixer to the PDT, where it is periodically ignited by a car spark plug. The resulting flame accelerates in the flame acceleration section and forms a leading SW, which enters the helical section. Multiple reflections of the SW in the helical section lead to DDT according to the mechanism of [26] and the onset of a detonation wave (DW) which further propagates in the measuring section of the PDT and exits to the atmosphere. Note that the geometry of the PDT and ignition arrangement were thoroughly optimized in [27] for obtaining the shortest possible DDT run-up distance.
Before conducting experiments on DDT in the air mixtures of pyrogas, we have determined the characteristics of GG and the composition of pyrogas during pyrolysis of PE samples in a closed and open GG. The measured characteristics of the GG include: the mass of solid PE sample, m0, decomposition temperature, Tp, pyrolysis time, tp, and the corresponding maximum pressure, Pp, the minimum temperature during pyrolysis, Tmin, and the time it is attained, tmin, the mass of solid residue (pyrocarbon) in the GG, mr, the mass of wax-like sediments in the mains at the outlet of the GG, mw, and the volume fraction of the i-th component in the pyrolysis gas, Xi. Table 1 shows the measurement errors of all listed characteristics. For the values measured directly we indicate the absolute instrumental errors. For pyrolysis time tp, the error is evaluated based on the apparent indefinity of pyrolysis completion. For Xi, the relative error is the error of gas chromatography. For mr and mw, the absolute errors take the methodical measurement error into account.

2.2. Polyethylene Pyrolysis in a Closed Gas Generator

The procedure for obtaining the characteristics of the GG and determining the pyrogas composition in a closed GG is as follows. The GG is heated up to a predetermined decomposition temperature Tp = 650–850 °C and kept at a constant temperature at least for 10 min. Then, the data acquisition system based on the analog-to-digital converter (ADC in Figure 1) is switched on (recording frequency 1 kHz), and a sample of granular PE grade HDPE 273-83 of a given mass (for example, 1 g) is poured into the GG.
White spherical PE granules have a diameter of 4 mm. Then the ball valve is closed and PE pyrolysis proceeds with an increase in pressure, which is controlled by a low-frequency PS (see Figure 3a). After time interval tp has elapsed, the pyrogas pressure in the GG reaches the Pp value, and the pyrogas temperature approaches the preset value of Tp, which is interpreted as the completion of pyrolysis: the exhaust valve opens, and the pyrogas expels into the atmosphere through the sampler (see Figure 3b). At the end of experiment, the GG furnace is cooled with the outlet valve closed, the GG is disassembled, and all solid residue is removed from it. The solid residue obtained in experiment is weighed on a balance, and a pyrogas sample in a sampler (see Figure 3c) is sent for chromatographic analysis.
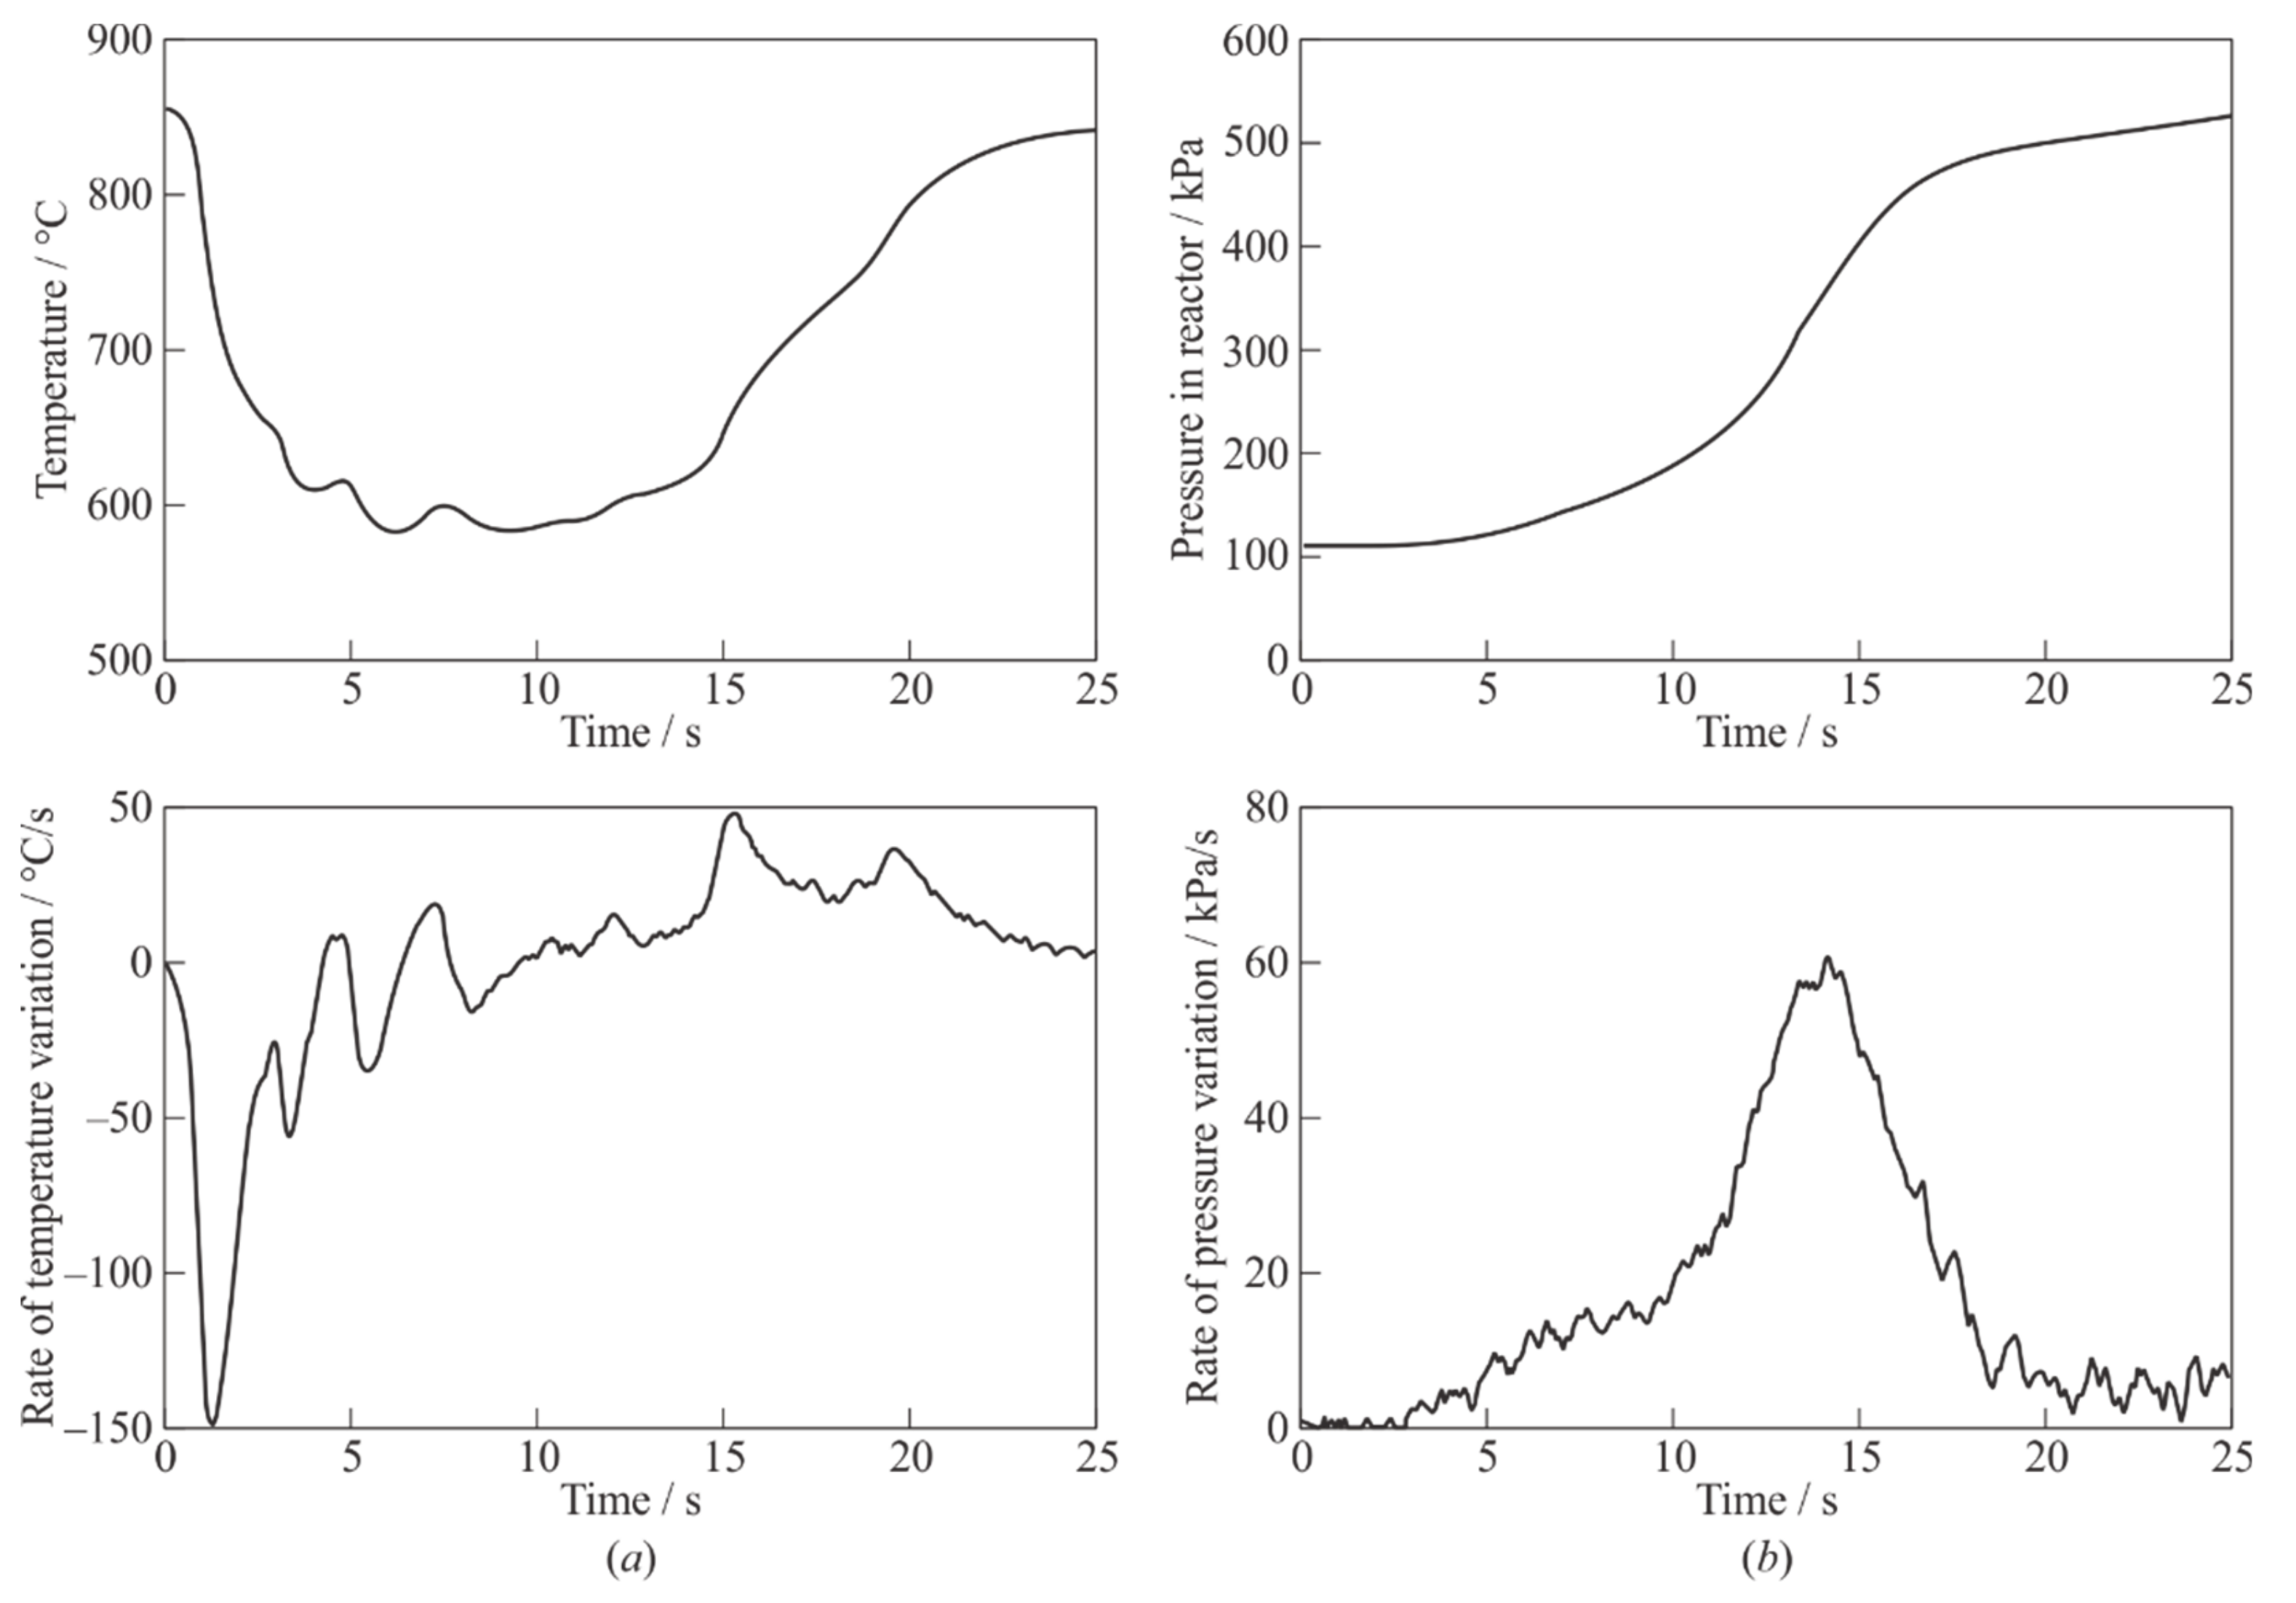
Figure 4 shows the examples of pyrogas temperature (Figure 4a) and pressure (Figure 4b) records in the GG, obtained using a thermocouple located on its bottom, and the PS, respectively, in an experiment with the decomposition temperature Tp = 850 °C and with a sample of granular PE of m0 = 1 g. For convenience, Figure 4a,b also show the rates of temperature and pressure variation in the closed GG. The zero point in time corresponds to the moment of filling the PE granules into the GG. The temperature of the thermocouple junction at the bottom of the GG first decreases due to the prevailing heat removal into PE granules and the endothermic process of their pyrolysis, reaches a minimum value (Tmin ≈ 580 °C) by the time tmin ≈ 6 s, and then increases reaching the preset value Tp ≈ 850 °C after complete transformation of PE granules and heating of pyrogas. The pyrogas pressure (see Figure 4b) increases monotonically, reaching a value of Pp ≈ 520 kPa at tp ≈ 25 s.
From the time histories of pyrogas temperature and pressure, T(t) and P(t), it is possible to estimate the average molecular mass of pyrogas, μ ¯ p , at pyrolysis temperature Tp using a simple formula based on the material balance equation for a closed GG:
μ ¯ p = R 1 x r m 0 V 0 0 1 T d P d t P T 2 d T d t d t 1
where R is the universal gas constant, xr is the mass fraction of solid residue, and V0 is the GG volume. The error in determining μ ¯ p by Equation (1) is estimated as 5%.
Table 2 shows the values of Tmin, tmin, Pp, tp, xr and μ ¯ p for three values of Tp: 650, 750, and 850 °C, when using a PE sample with m0 = 1 g. With an increase in the decomposition temperature, the pyrolysis process in a closed GG proceeds more intensely and is completed in a shorter time. The mass fraction of the solid residue reaches 70% at Tp = 850 °C, and the average molecular mass of pyrogas, on the contrary, decreases from ≈40 g/mol at Tp = 650 °C to ≈10 g/mol at Tp = 850 °C. Note that the values of Tmin, tmin, Pp, tp, and xr also depend on the initial mass of a PE sample. Thus, with an increase in the sample mass to 1.5 g, the parameter Pp takes on the values of 420, 775, and 695 kPa at Tp = 650, 750, and 850 °C, respectively, i.e., the pressure of pyrogas in the GG increases significantly.
Table 3 shows the results of chromatographic analysis of pyrogas samples taken from a closed GG at decomposition temperatures Tp = 650 and 850 °C. In metal samplers (see Figure 3c), pyrogas samples were taken from the GG at the pyrolysis temperature after the end of the active phase of gas generation, when the pressure in the GG reached a plateau.
For chromatographic analysis, pyrogas samples were taken from the samplers at room temperature (19–20 °C). To reduce the contamination of chromatographs, samples were taken from samplers with a syringe through a filter made of chromatographic glass wool treated with dimethylchlorosilane (DMCS, (CH3)2SiHCl) and were introduced into the evaporators of the chromatographs heated to 150 °C. Analysis of C1–C9 hydrocarbons (detailed analysis of C1–C4) was carried out using a CP-Al2O3/KCl PLOT capillary column 50 m length × 0.53 mm inner diameter × 10 μm thickness of the adsorption layer and a flame ionization detector. Hydrogen was determined using a HayeSep Q 80/100 packed column 3 m long and 2 mm in inner diameter and a thermal conductivity detector.
It follows from Table 3 that pyrogas mainly consists of hydrogen, methane, ethylene and ethane, and with the increase in the decomposition temperature from 650 to 850 °C, the content of hydrogen and methane increases significantly, and the discrepancy in the estimated average molecular mass of the pyrogas at the pyrolysis temperature (see Table 2) and at room temperature (see Table 3) decreases, which also indicates an increase in the content of substances in the pyrogas that remain gaseous at room temperature (19–20 °C).

2.3. Polyethylene Pyrolysis in an Open Gas Generator

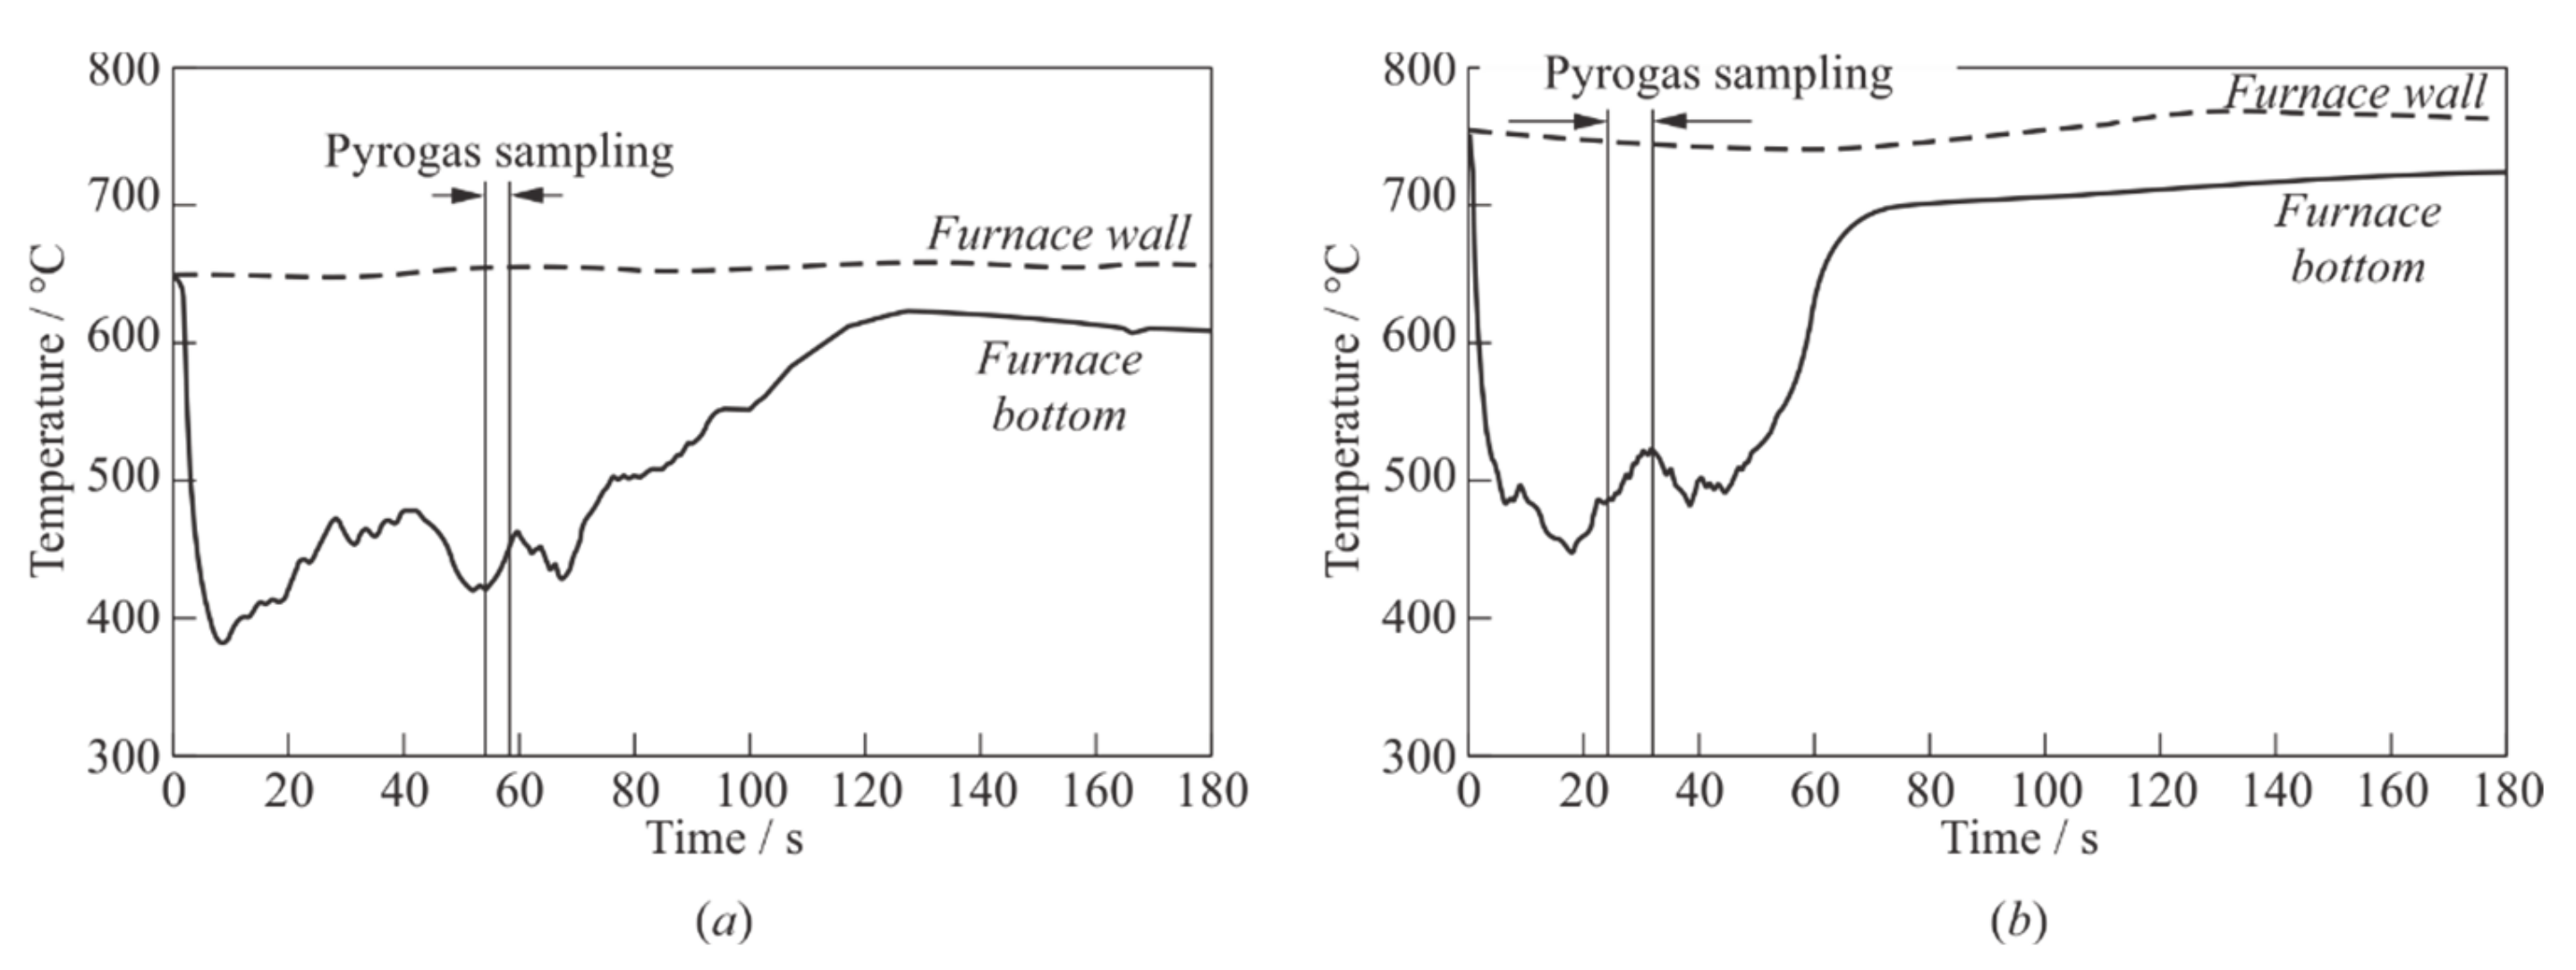
The characteristics of the GG and pyrogas composition in an open GG are determined under conditions when the pressure in the GG is close to atmospheric. As in the procedure described earlier in this paper, the GG is heated to a decomposition temperature Tp = 650–850 °C, and a weighed portion of granular PE of a given mass m0 = 15 g is poured into it. The difference is that during the entire pyrolysis process, except for the moment of sampling, the inlet and outlet valves of a sampler remain open, and the generated pyrogas continuously expels to the atmosphere. To collect the liquid fraction of PE pyrolysis products, pyrogas is passed through the cooler (see Figure 3b) in some experiments. Figure 5 shows examples of the time histories of pyrogas temperature, obtained in an open GG using a thermocouple located at GG bottom at Tp = 650 °C (Figure 5a) and 750 °C (Figure 5b) with PE samples of m0 = 15 g. The zero point in time corresponds to the moment of filling the PE granules into the GG. The temperature of the thermocouple junction at the bottom of the GG first decreases due to heat removal into PE granules and the endothermic process of their pyrolysis, reaches a minimum value Tmin by time tmin, and then increases as the pyrolysis process is completed, but the preset value of Tp during the observation time (180 s) is not reached. Table 4 shows the values of Tmin, tmin, and xr for three values of the decomposition temperature Tp = 650, 750, and 850 °C, when using PE samples with a mass of m0 = 15 g. Unlike pyrolysis in a closed GG, the mass fraction of the solid residue xr during pyrolysis in an open GG is much less (2–7%).
Table 5 shows the results of chromatographic analysis of pyrogas in an open GG at Tp = 650, 750, and 850 °C. As in the previous case, the sampling was made at the decomposition temperature, and the analysis of the composition was made at room temperature (19–20 °C). In contrast to pyrolysis in a closed GG (see Table 3), the proportions of hydrogen and methane in the composition of pyrogas in an open GG significantly decreased and the proportions of ethylene, ethane, propylene, and propane increased. The average molecular mass of pyrogas is almost constant ( μ ¯ p = 28–32 g/mol). Among the identified products of the C4 fraction, the largest amounts are represented by butadiene-1,3 (3.9%) and butylene-1 (4.4%), the fraction C5 mainly consists of unsaturated hydrocarbons–pentenes (C5H10), among which pentene-1 (1.9%) is present in the largest amount. The C6 fraction mainly contains unsaturated hydrocarbons C6H12, cyclohexene and minor amounts of other hydrocarbons of the C6H10 group.

2.4. Experimental Technique and Processing of the Results

Experiments to determine the detonability of air mixtures of pyrogas are performed according to the technique described in detail in [23,24,25]. We give here only a brief description of it. At the beginning of experiment, the muffle furnace is switched on, and the empty GG is heated to the preset decomposition temperature Tp and kept at this temperature for at least 30 min. Next, a prepared sample of granulated PE is loaded into the GG through the upper loading hopper, the ball valve closes and the control program on the time relay is started: the unit starts operating in a cyclic mode. Table 6 shows the settings of the time relay that controls the experiment. The operation cycle is set up implying that pyrogas and air are periodically supplied to the PDT in portions. A value of 0 in Table 6 corresponds to the channel state “closed” or “disabled,” and a value of 1 corresponds to the channel state “open” or “on.” During periods T1 and T2, when the fuel and air EMVs are open, pyrogas from the GG and air from the air receiver flow through the mains and enter the mixer, where they are mixed, and the mixture formed is sent to the PDT. The duration of interval T1 is selected from the condition of filling the entire PDT volume with the mixture at a given air flow rate. The mixture in the PDT is ignited at time instant (T1 + T2), corresponding to the end of time interval T2. Mixture ignition (from now on referred to as “PDT shot”) generates either a deflagration wave or a DW. After ignition (for time interval T3), the fuel and air EMVs shut off the supply of pyrogas and air to the PDT: the GG is completely closed. In time interval T3 + T4 = 0.5 s, the rate of pyrogas formation and the composition of a new portion of fuel mixture for the next operation cycle are estimated based on the pressure rise in the closed GG. During time interval T4, a portion of purge air is supplied to the mixer. The process repeats cyclically until the time relay is stopped. The operation time of the test rig exceeds the pyrolysis time. At the end of experiment, a solid pyrocarbon residue is taken from the cooled GG, and unburned products in the form of wax-like deposits are taken from the mixer and PDT.
It follows from the described experimental procedure that the pyrolysis process proceeds under variable conditions of a closed and open GG.
The main parameters of the experiment are determined as follows. The average mass flow rate of air, G ¯ a , is determined from the change in pressure in the air receiver ΔP for time interval Δt according to the following formula:
G ¯ a = ρ N V b P N P t
where ρ N and PN are the air density and pressure under normal conditions; Vb is the volume of the air receiver (50 L). The error in determining G ¯ a is estimated at 10%. The constancy of the air flow rate is ensured by an air reducer that maintains a constant pressure in front of the air EMV.
The mass of solid residues in the GG, mr, and wax-like deposits in the mixer and PDT, mw, are determined by weighing on a precision balance at the end of experiment. The mass of pyrogas, mp, supplied to the PDT is calculated using the material balance equation taking the mass fractions of solid residue, xr, and wax-like deposits, xw, into account:
m p = m 0 m r m w = m 0 1 x r x w
The average mass flow rate of pyrogas, G ¯ a , is calculated by the formula:
G ¯ p = m p t p
where t p is the pyrolysis time determined from the pressure and temperature records in the GG. The error in determining G ¯ p is estimated at 15%.
The average fuel-to-air equivalence ratio, Φ ¯ , is determined by the formula:
Φ ¯ = G ¯ p G ¯ a L 0
where L 0 is the stoichiometric coefficient. For pyrogas, L0 ≈ 14.8. The error of determining Φ ¯ is estimated at 20%. The temperature of pyrogas before entering the mixer, Tin, is measured by a thermocouple installed in the main. The error in determining Tin is estimated as 0.5%.
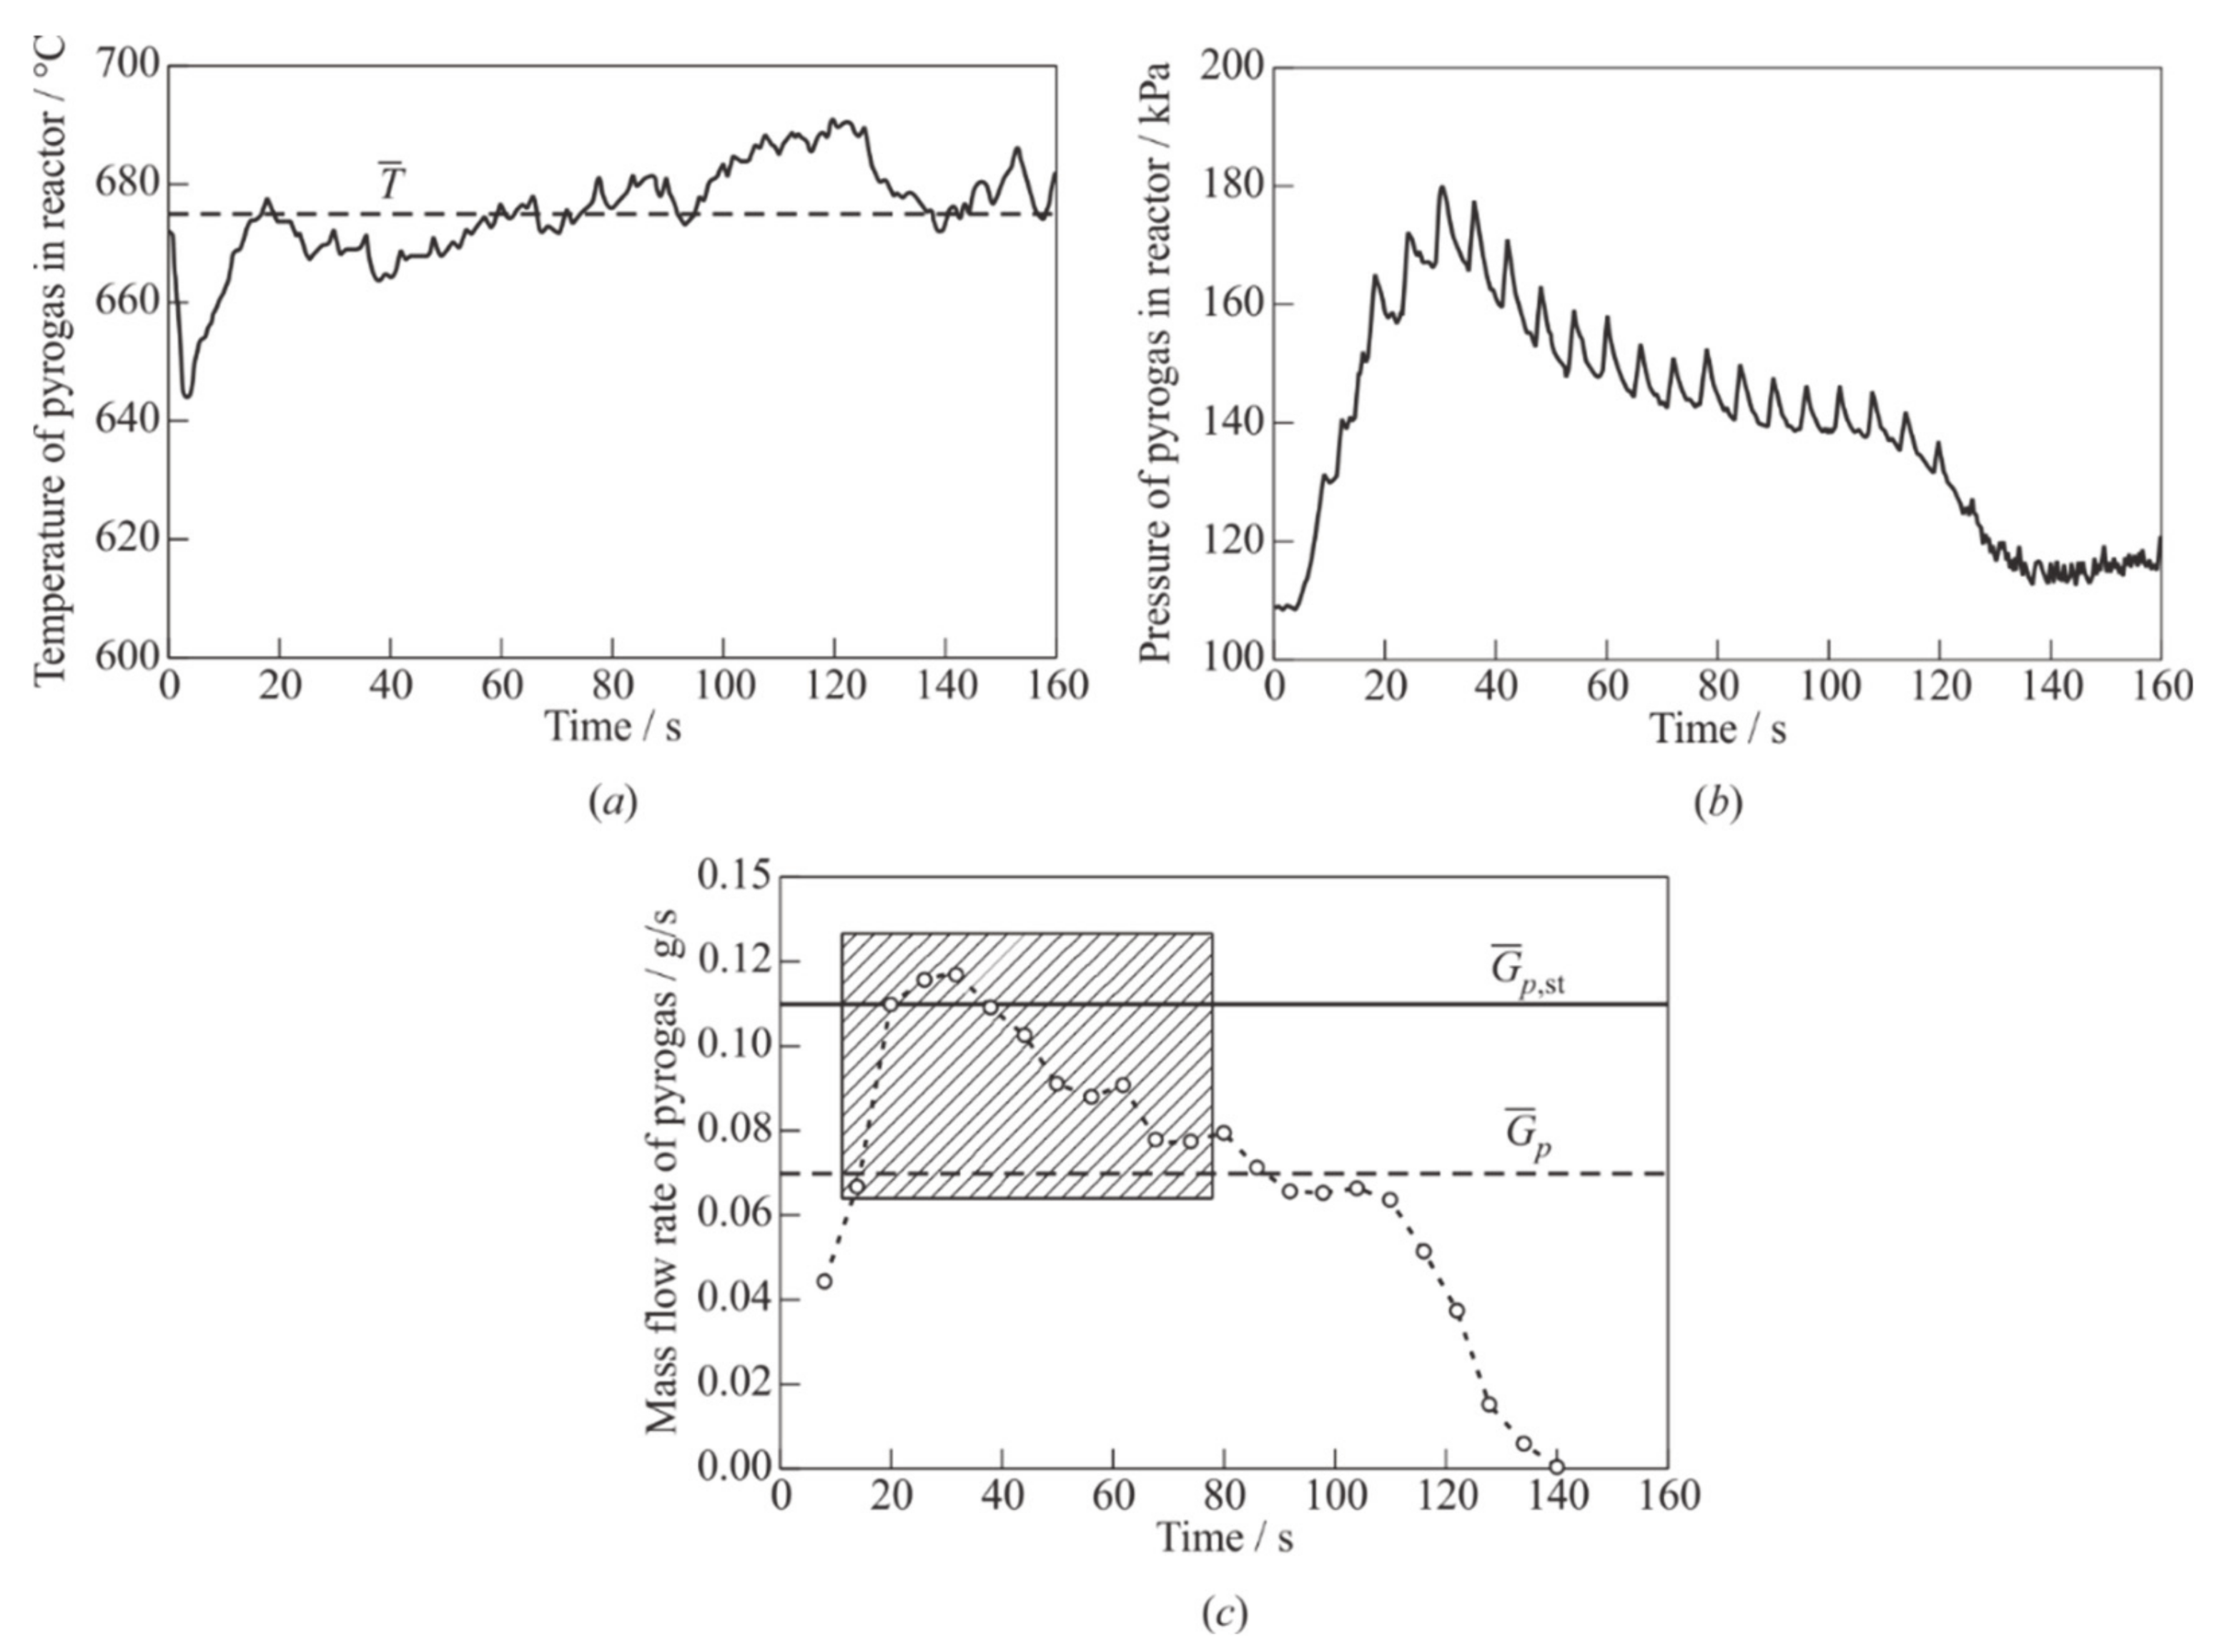
As an example, Figure 6a shows temperature records T(t), and Figure 6b shows pressure records P(t) in the GG in one of the experiments on the PDT with Tp = 765 °C and m0 = 10 g. It is seen from the temperature record that approximately 15s after loading the GG, pyrogas leaves it with an average temperature ≈ 675 °C, and temperature fluctuations are small (±10 °C). Note that in the main connecting the GG with mixer, the temperature of pyrogas significantly decreases and does not exceed 120 °C, and after mixing of pyrogas with air, it decreases to 30–40 °C. The pressure record (see Figure 6b) shows regular pulsations with an amplitude of up to 20 kPa and a duration of 0.5 s, caused by the closing/opening of the fuel EMV at each PDT shot. Following the pressure curve, the pyrolysis time of the PE sample, tp, under these conditions is about 130 s. In this experiment, the parameters G ¯ a , (xr + xw), G ¯ p , and Φ ¯ are approximately 1.66 g/s, 0.03, 0.07 g/s (see below), and 0.6, respectively. For this experiment Figure 6c shows the calculated dependence of the average (per PDT shot) mass flow rate of pyrogas at the moments of time when the GG is open (92% of the cycle time), plotted based on the calibration dependence of the mass flow rate of pyrogas on the pressure in the GG. The solid horizontal line G p , s t = 0.11 g/s corresponds to a stoichiometric fuel mixture at G ¯ a = 1.66 g/s. The dashed horizontal line corresponds to the integral averaged value of the pyrogas mass flow rate for a time interval of tp = 130 s. In the considered experiment, the mixture is, on average, fuel lean ( Φ ¯ ≈ 0.6), while the instantaneous values of the fuel-to-air equivalence ratio in this experiment vary from the minimum value of Φmin = 0.4 in the first PDT shot to the maximum value of Φmax = 1.2 in the fifth PDT shot. In a series of cycles in the time interval from 15 to 80 s, the composition of the mixture is close to stoichiometric (0.7 ≤ Φ ¯ ≤ 1.1) (gray shaded area in Figure 6c). It is in these cycles that DDT and the subsequent self-sustained steady-state propagation of the DW in the measuring section of the PDT are recorded in the experiment.
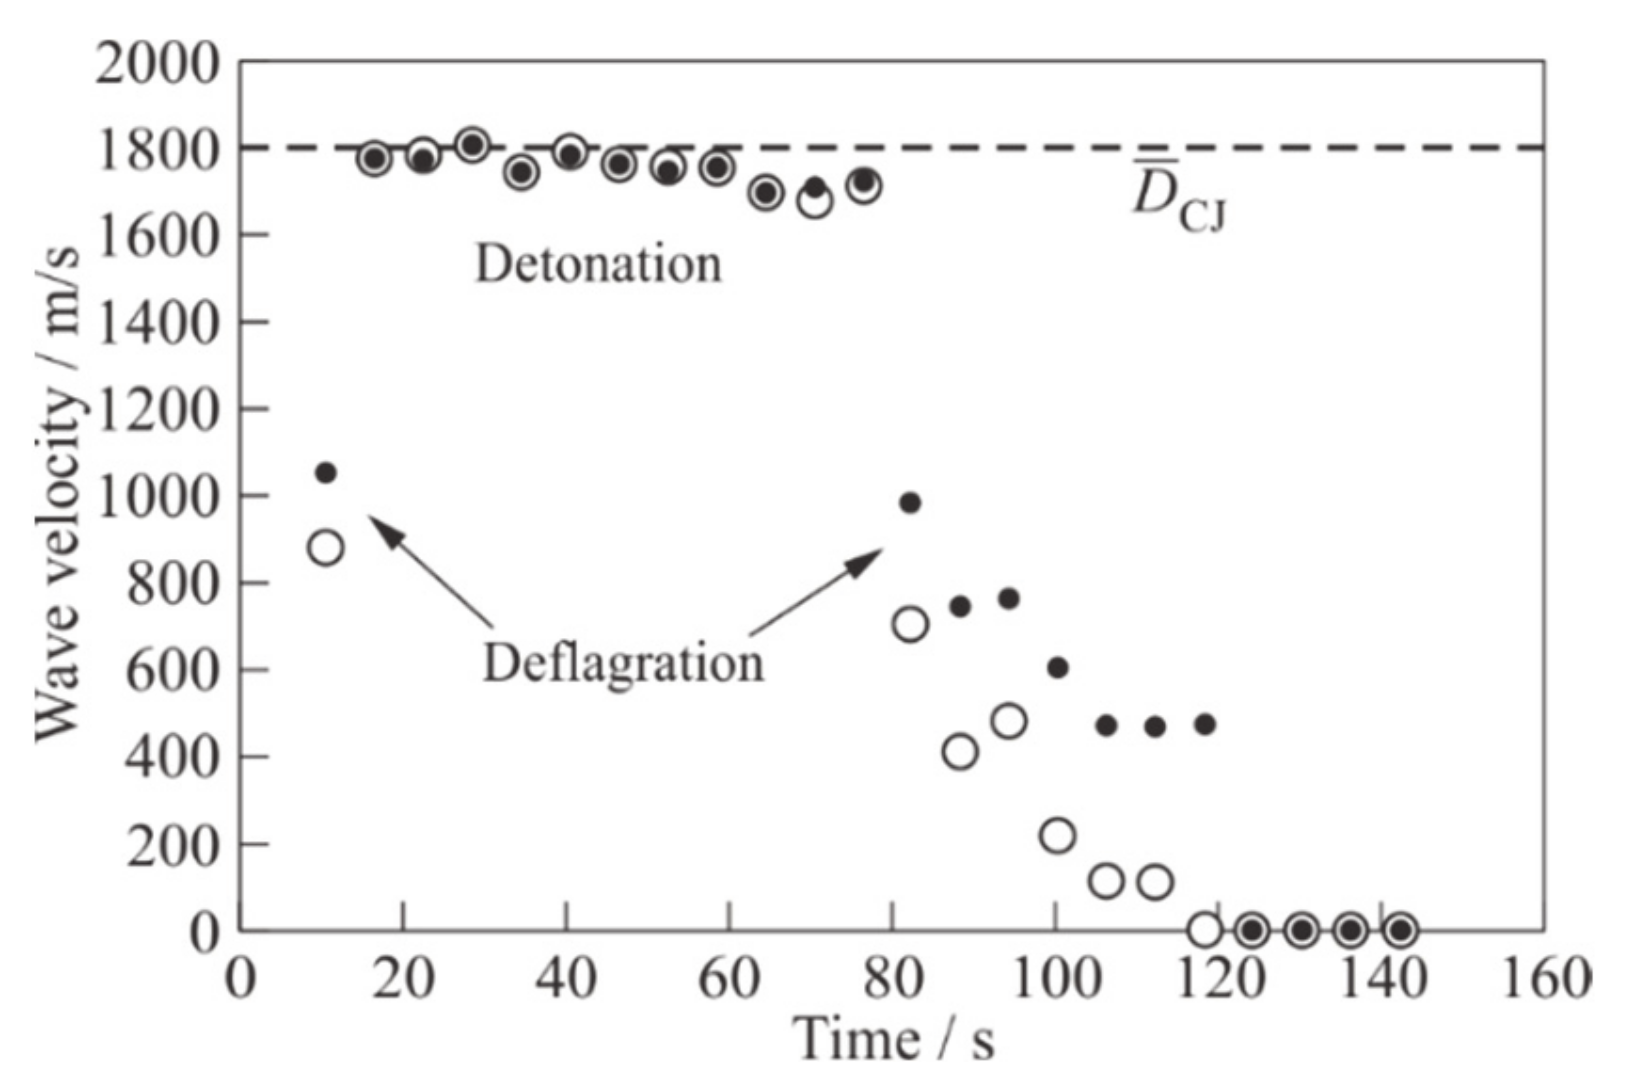
As a matter of fact, Figure 7 shows the measured values of the mean velocities of the SW (dark circles) and the flame front (light circles) in each PDT shot of this experiment. The SW velocity at any measuring segment of the PDT is determined by the known distance between the measuring stations (see Figure 2), in which the PSs are installed, and by the time interval between the moments of wave arrival at these PSs. The error of measuring the SW velocity is 3%. The flame front speed is determined in a similar way, but instead of PS records, IP records are used. The error of measuring the flame front velocity is 3%. The data in Figure 7 are obtained by averaging the velocities over all measuring segments between the measuring stations 9 and 12. In (11) (detonation PDT shots) in the time interval 15 ≤ t ≤ 80 s, the SW and the flame front propagate at the same supersonic velocity, close to the typical value of the Chapman-Jouguet (CJ) detonation velocity DCJ ≈ 1800 m/s in stoichiometric mixtures of hydrocarbon fuels (horizontal dashed line in Figure 7). In one shot in the time interval t < 15 s and in 7 shots at 80 ≤ t ≤ 120 s, the SW runs significantly ahead of the flame front, i.e., a deflagration wave propagates in the measuring section. In shots at t > 120 s, a fuel mixture in the PDT is not ignited.
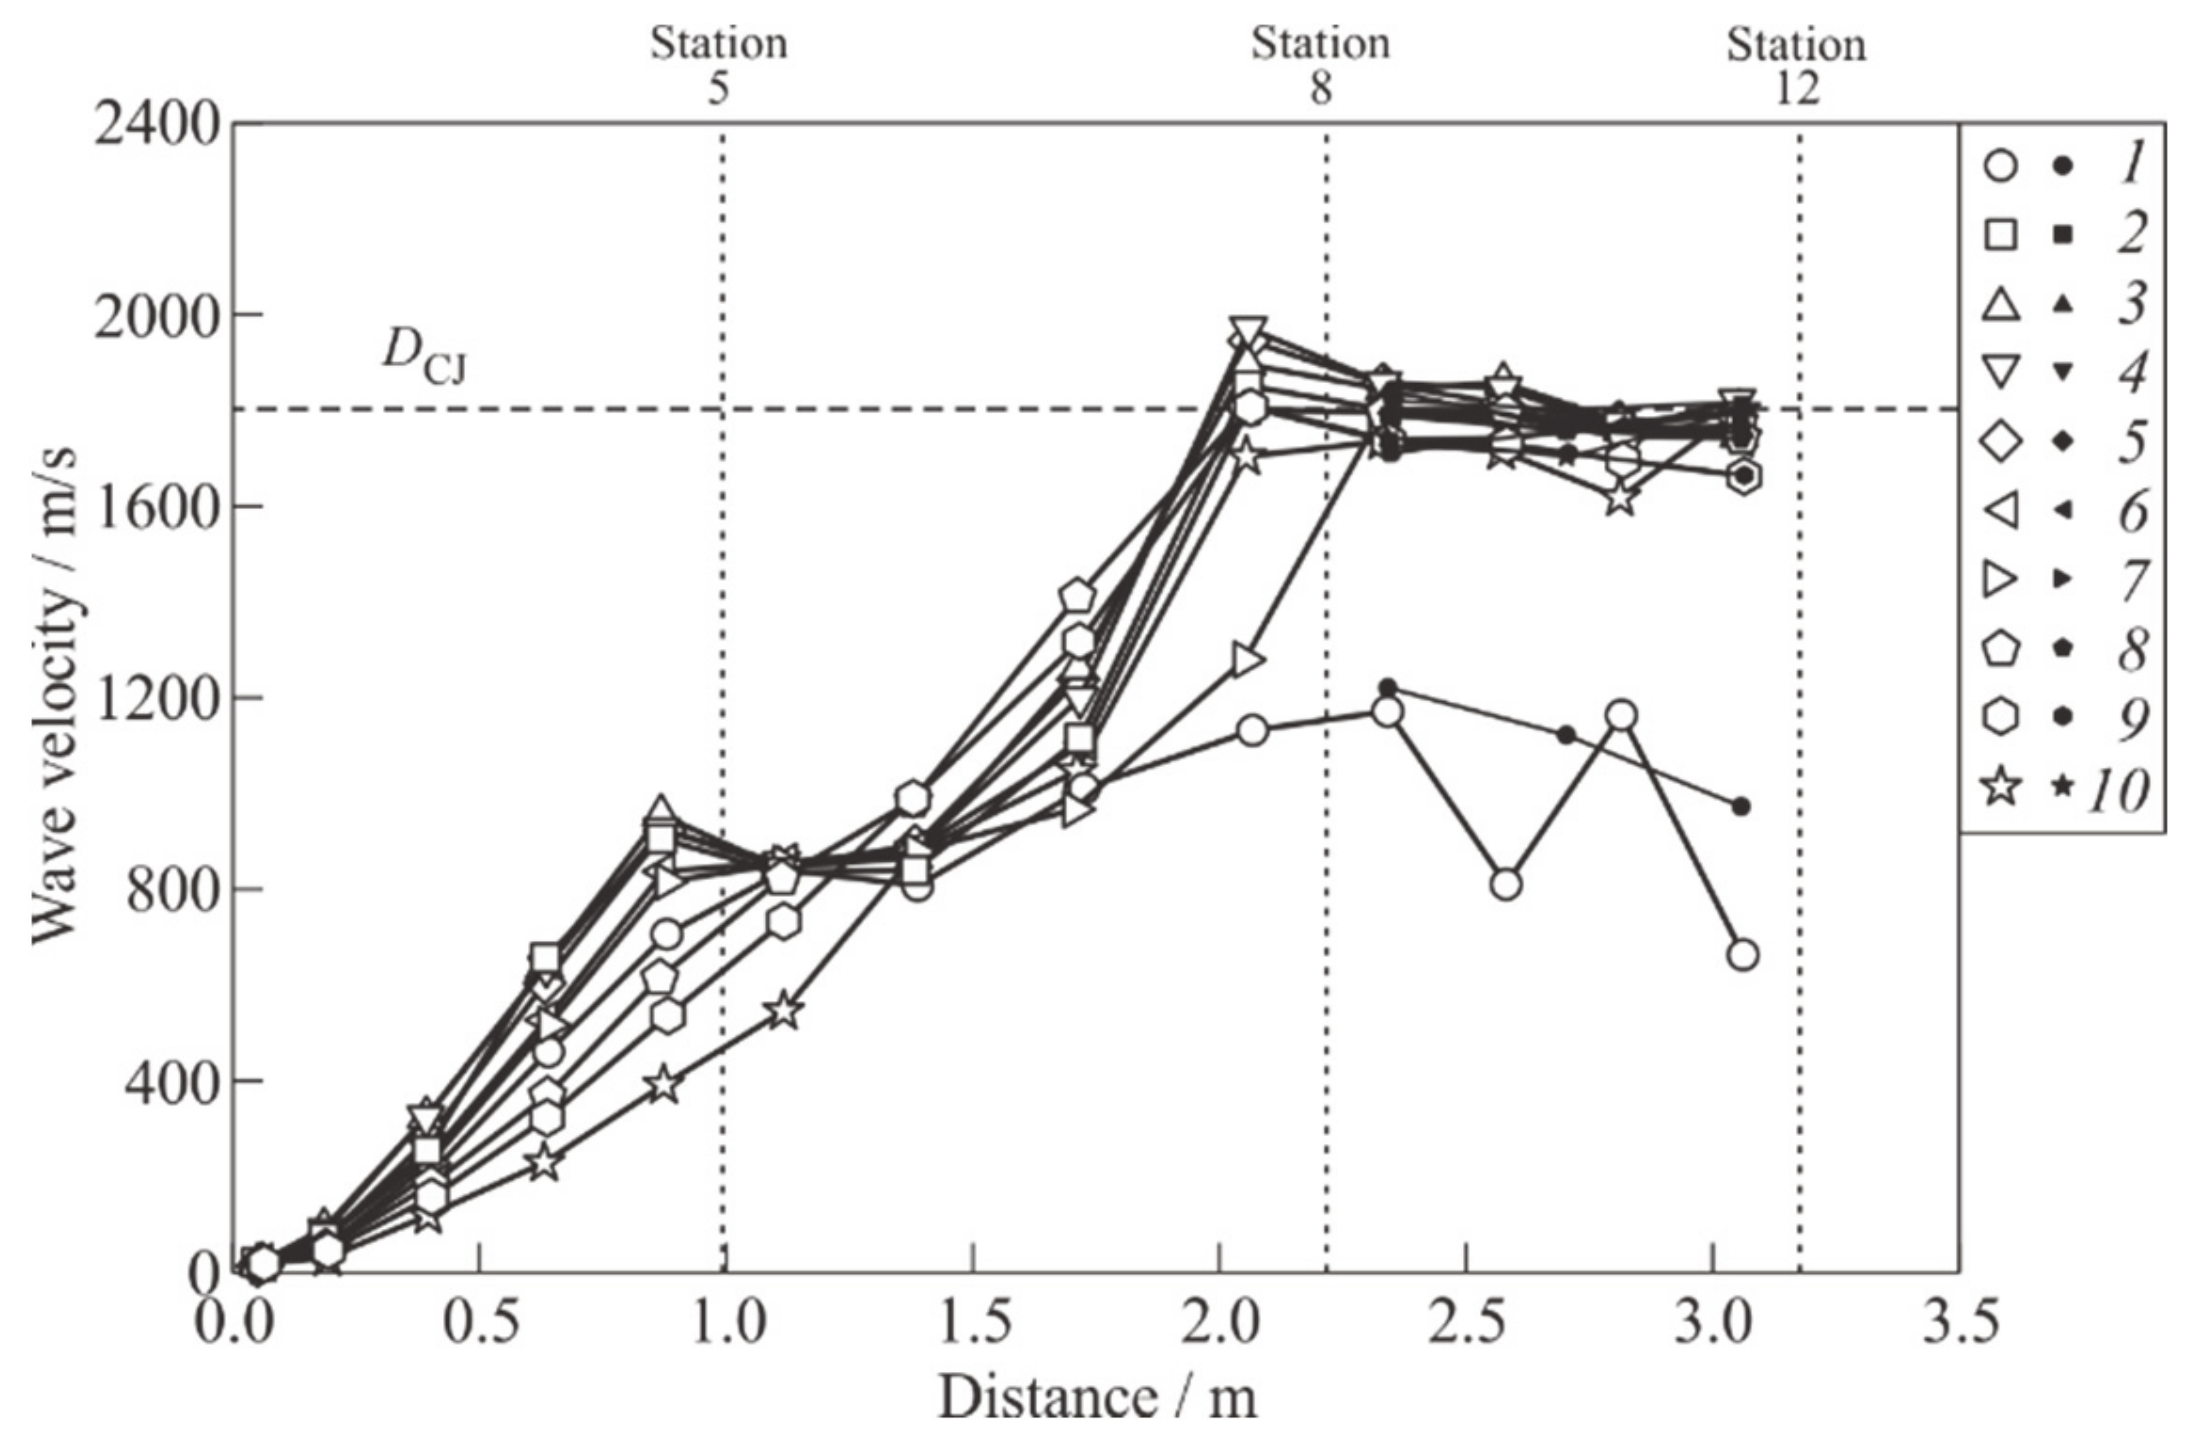
Figure 8 shows an example of the dependences of the SW and flame front velocities on the traveled distance in the considered experiment for a selection of 10 shots. The horizontal dashed line corresponds to DCJ. In detonation shots, the velocity of the “SW–flame front” complex reaches the DCJ value in the vicinity of measuring station 8 (at the exit from the PDT helical section) at about 2 m from the ignition source. As in [23,24,25], the distance at which this occurs is called the DDT run-up distance, LDDT. The time interval from the moment of mixture ignition to the moment of detonation onset is called the DDT run-up time, tDDT. The DDT run-up time, tDDT, is determined by joint consideration of wave velocity–distance and wave velocity–time dependences.
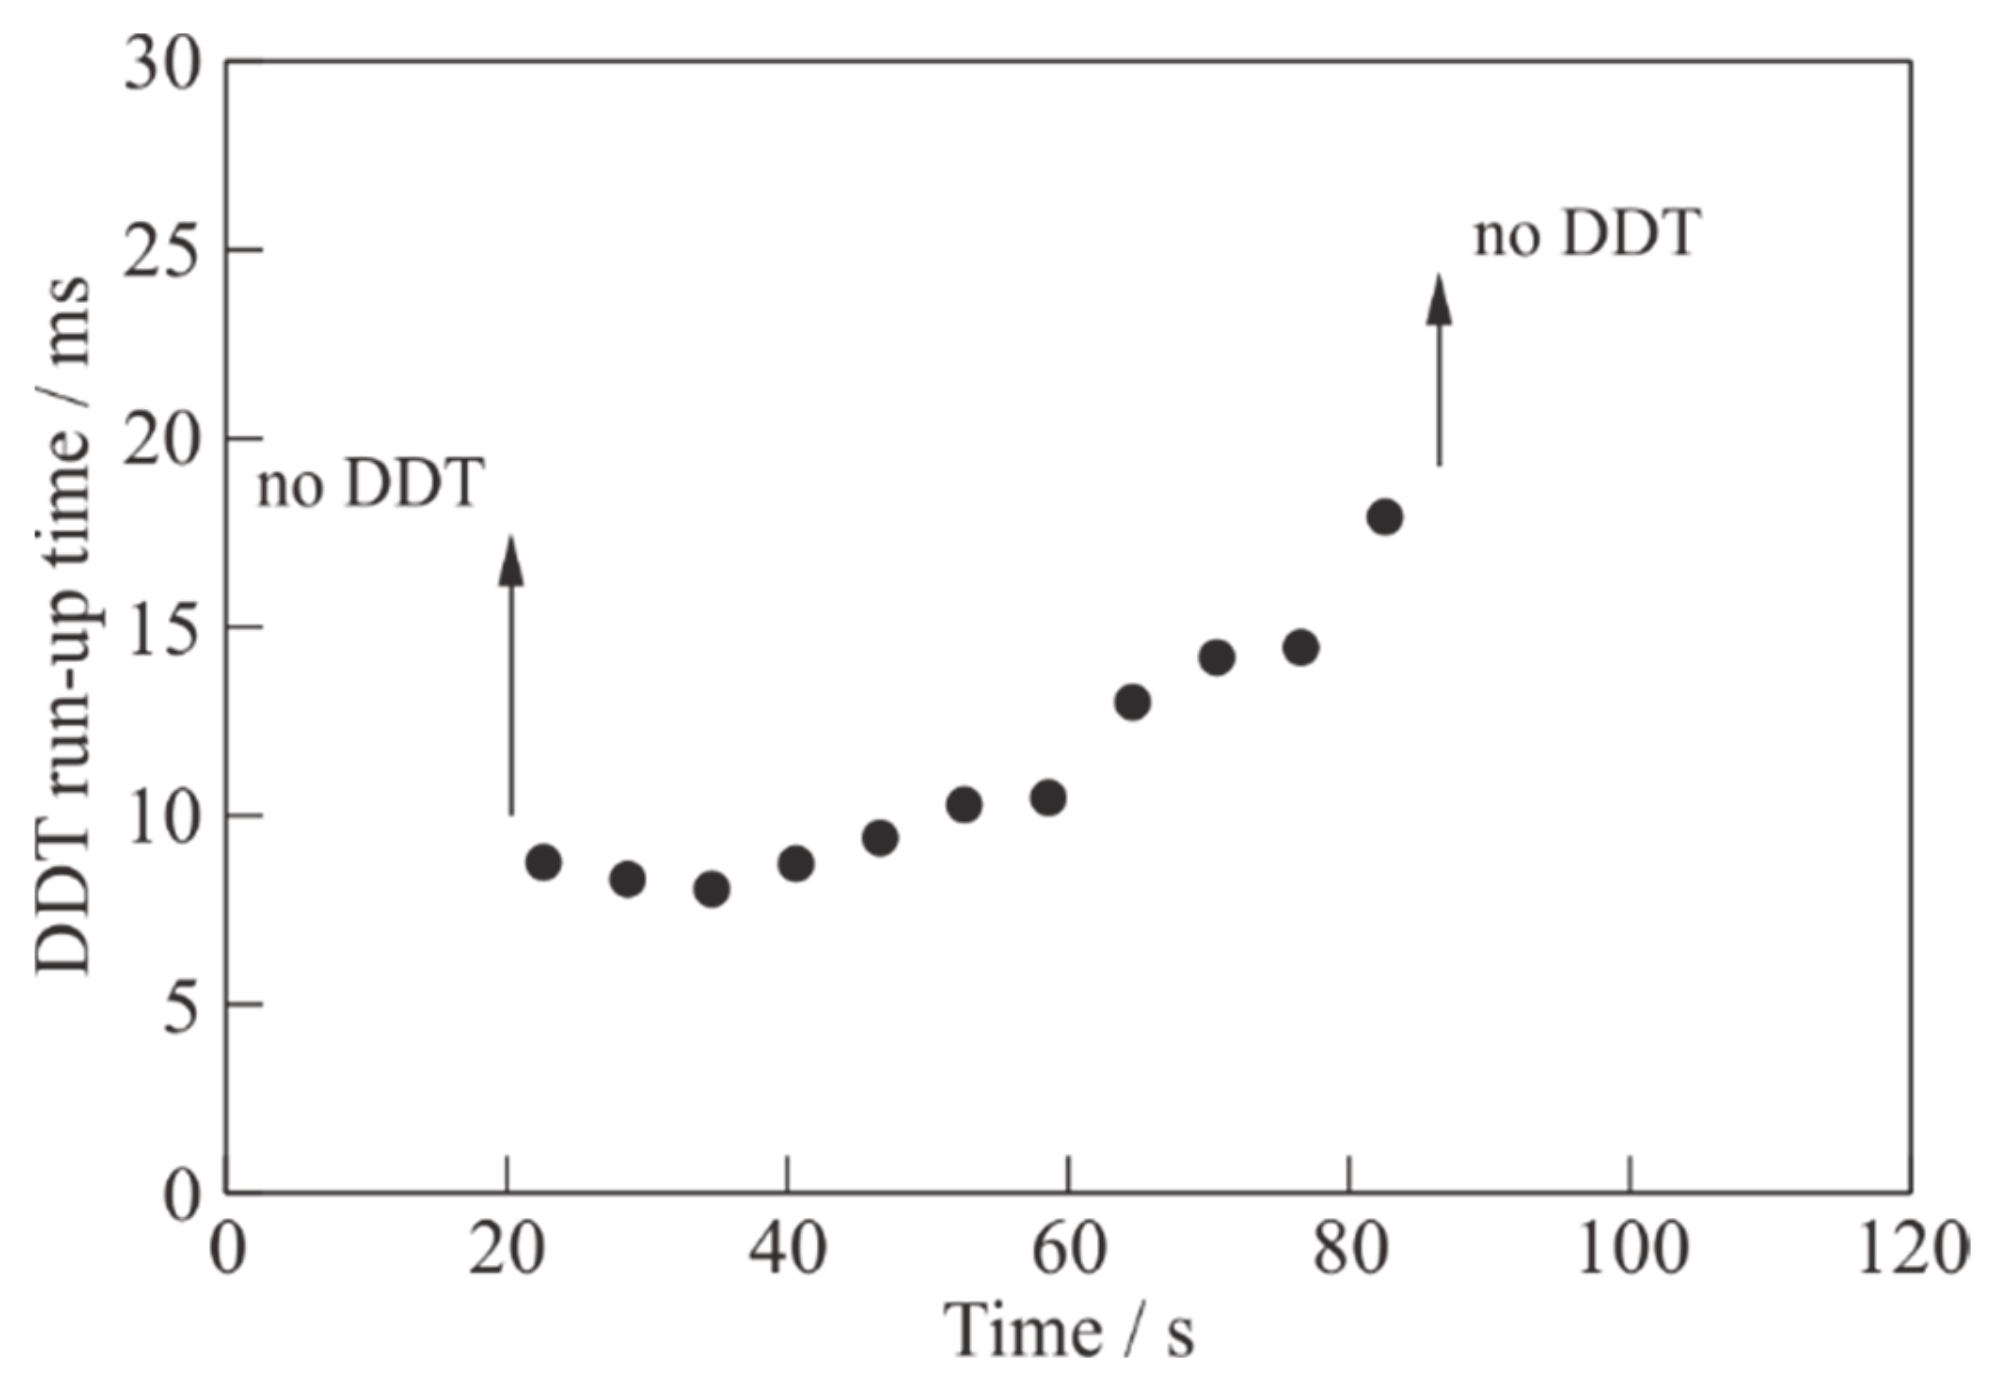
Figure 9 shows the measured values of the DDT run-up time in detonation shots in the considered experiment. The error in determining the DDT run-up time is estimated at 0.2 ms. The DDT run-up time varies from 8 to 18 ms. The minimum value of tDDT ≈ 8 ms is achieved in a detonation shot at t ≈ 35 s, when the instantaneous mass flow rate of pyrogas is close to the maximum value (see Figure 7), and the mixture is slightly fuel rich ( Φ ¯   = 1.05).

2.5. Results and Discussion

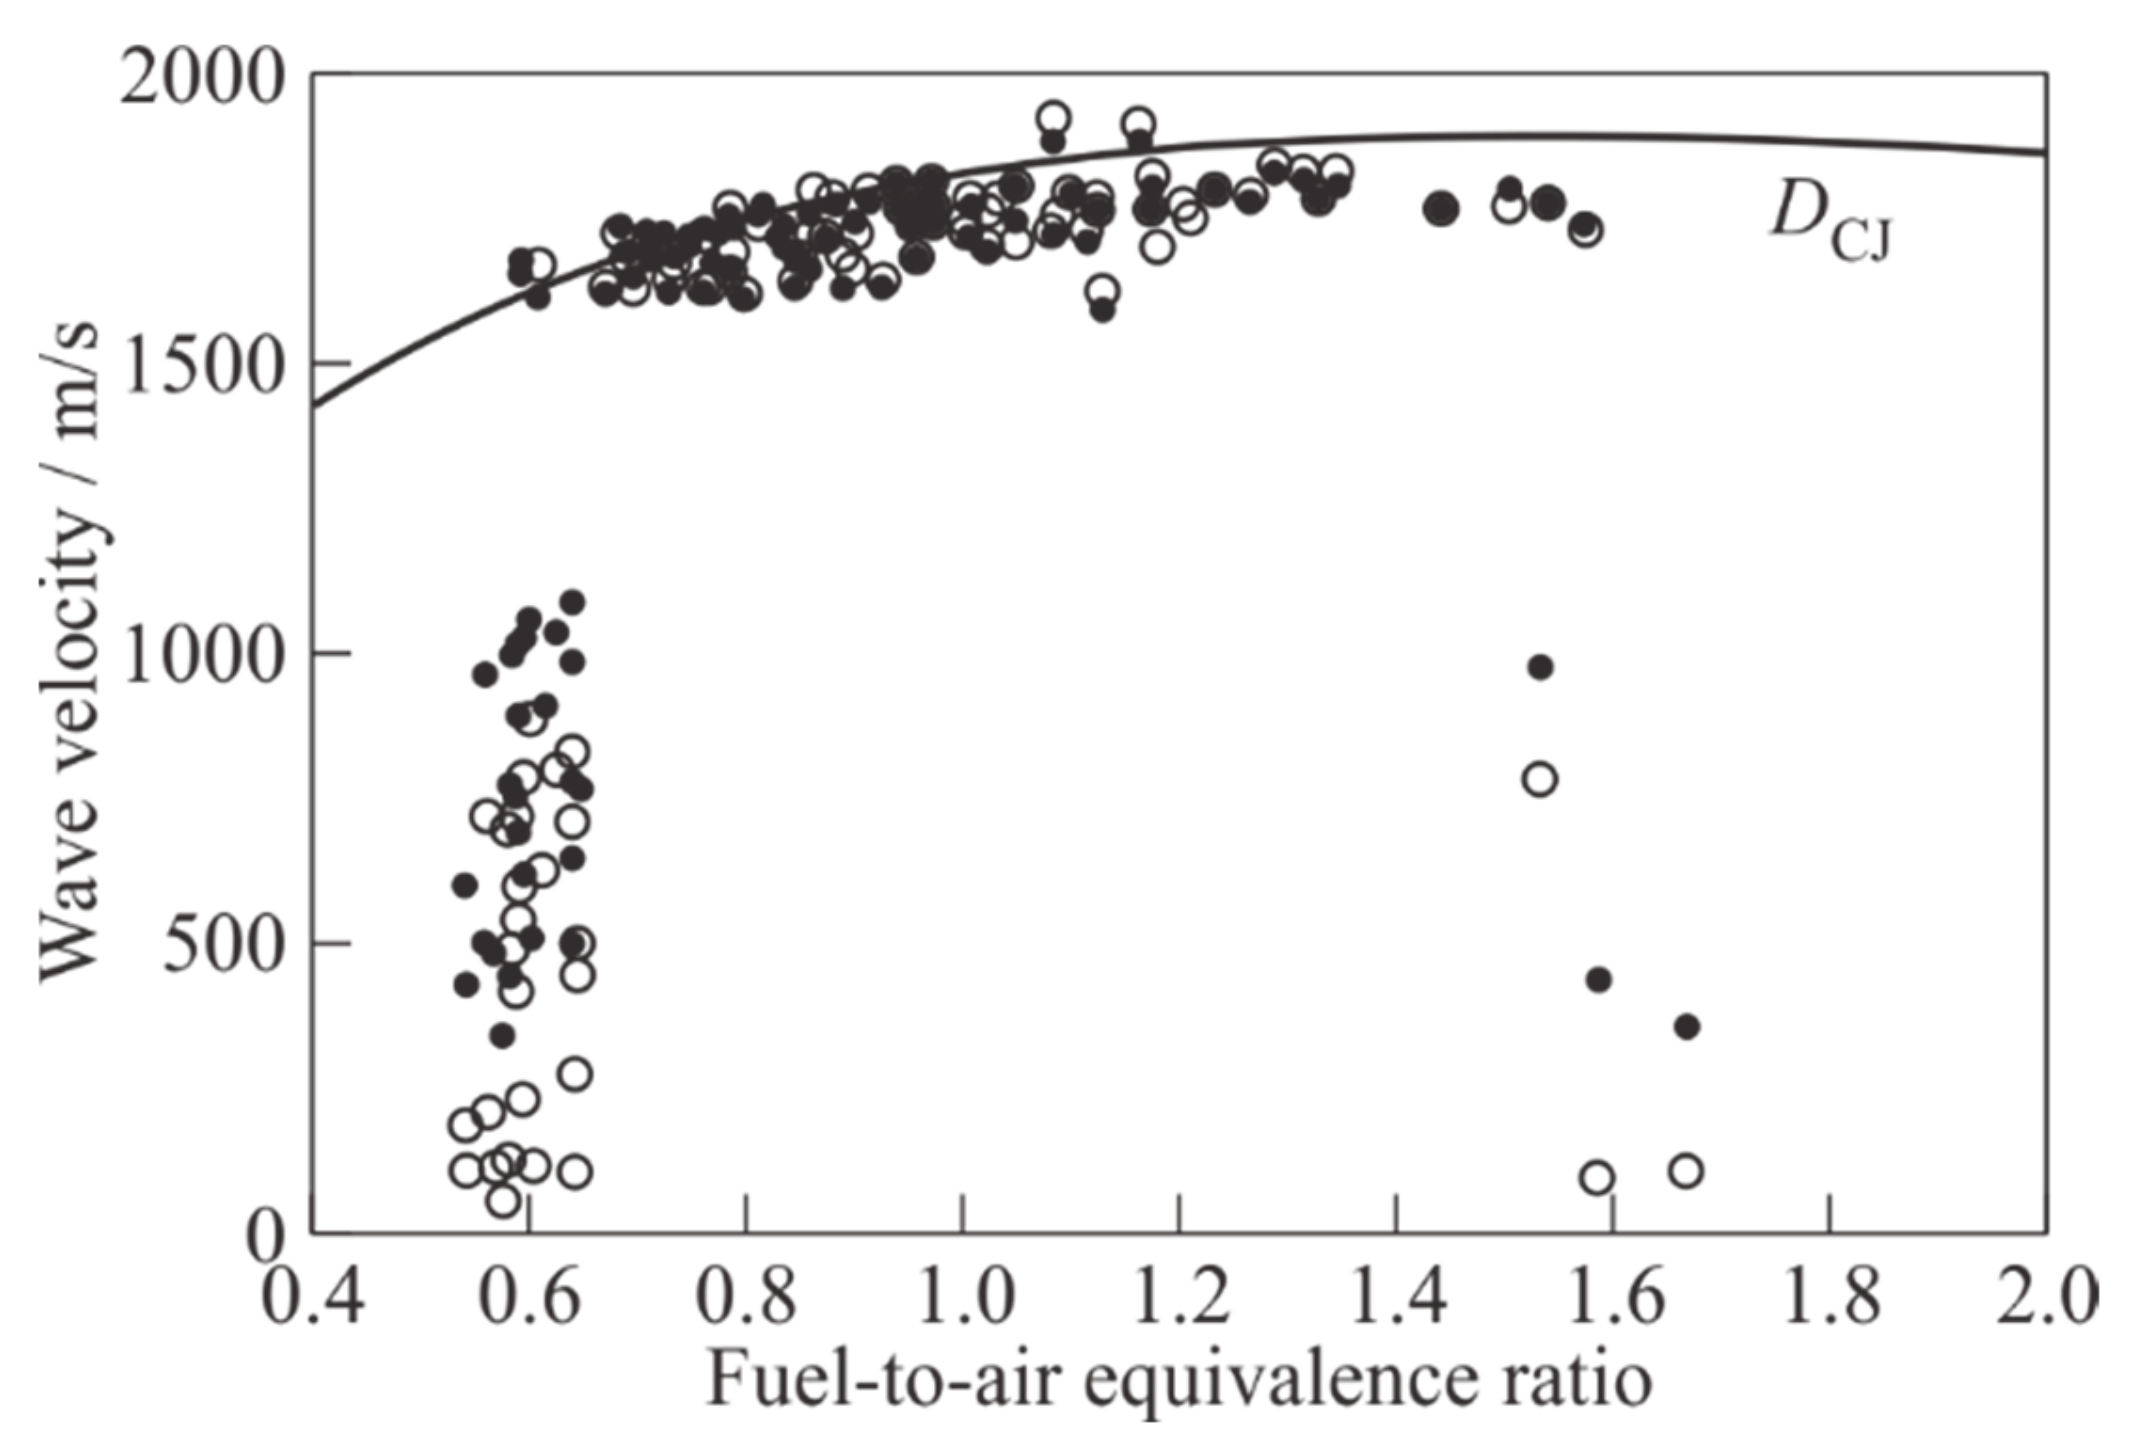
Using the procedures and techniques described above, we performed a large series of experiments to study the detonability of pyrogas. Figure 10 presents the cumulated experimental dependence of the average SW and flame front velocities in the measuring section of the PDT on the average fuel-to-air equivalence ratio in the mixture, determined for each individual shot. For comparison, the dependence of the theoretical detonation velocity DCJ in a homogeneous ethylene–air mixture, obtained using the TDS code [28], is also shown here.
The DDT in pyrogas–air mixtures is registered at 0.6 ≤ Φ ¯ ≤ 1.6. For each given value of Φ ¯ , the measured detonation velocities D ¯ turn out to be quite close to the DCJ value for the ethylene–air mixture, and the relative detonation velocity deficit, defined as |D − DCJ|/DCJ, does not exceed 10–12%.
Near the limiting values Φ ¯ ≈ 0.6 and 1.6, the mode of propagation of the reaction front is ambiguous: in some experiments, DDT is recorded with subsequent steady-state propagation of a DW in the measuring section of the PDT, in others, high-speed deflagration with a SW running noticeably ahead of the flame front is detected. Such effects were observed by other researchers during DDT in homogeneous fuel mixtures in the vicinity of concentration limits, for example, in hydrogen–air mixtures [29]. They are usually explained by the stochastic nature of the DDT phenomenon, associated with the occurrence of self-ignition centers in the region between the leading SW and the highly perturbed surface of the turbulent flame, resulting in “the explosion in the explosion” (according to the terminology of [30]). In addition to this factor, the reason for the ambiguity of the modes of propagation of the reaction front in Figure 10 may be an error in determining a value of Φ ¯ associated with the time-varying composition of fuel mixture.
In view of it, some important issues, namely, the effect of PE properties (age, additives, etc.) prior to pyrolysis and the scale of the detonation tube on the DDT concentration limits, still must be addressed. These issues are important for hazard assessment of accompanying risks and are worth of special studies.
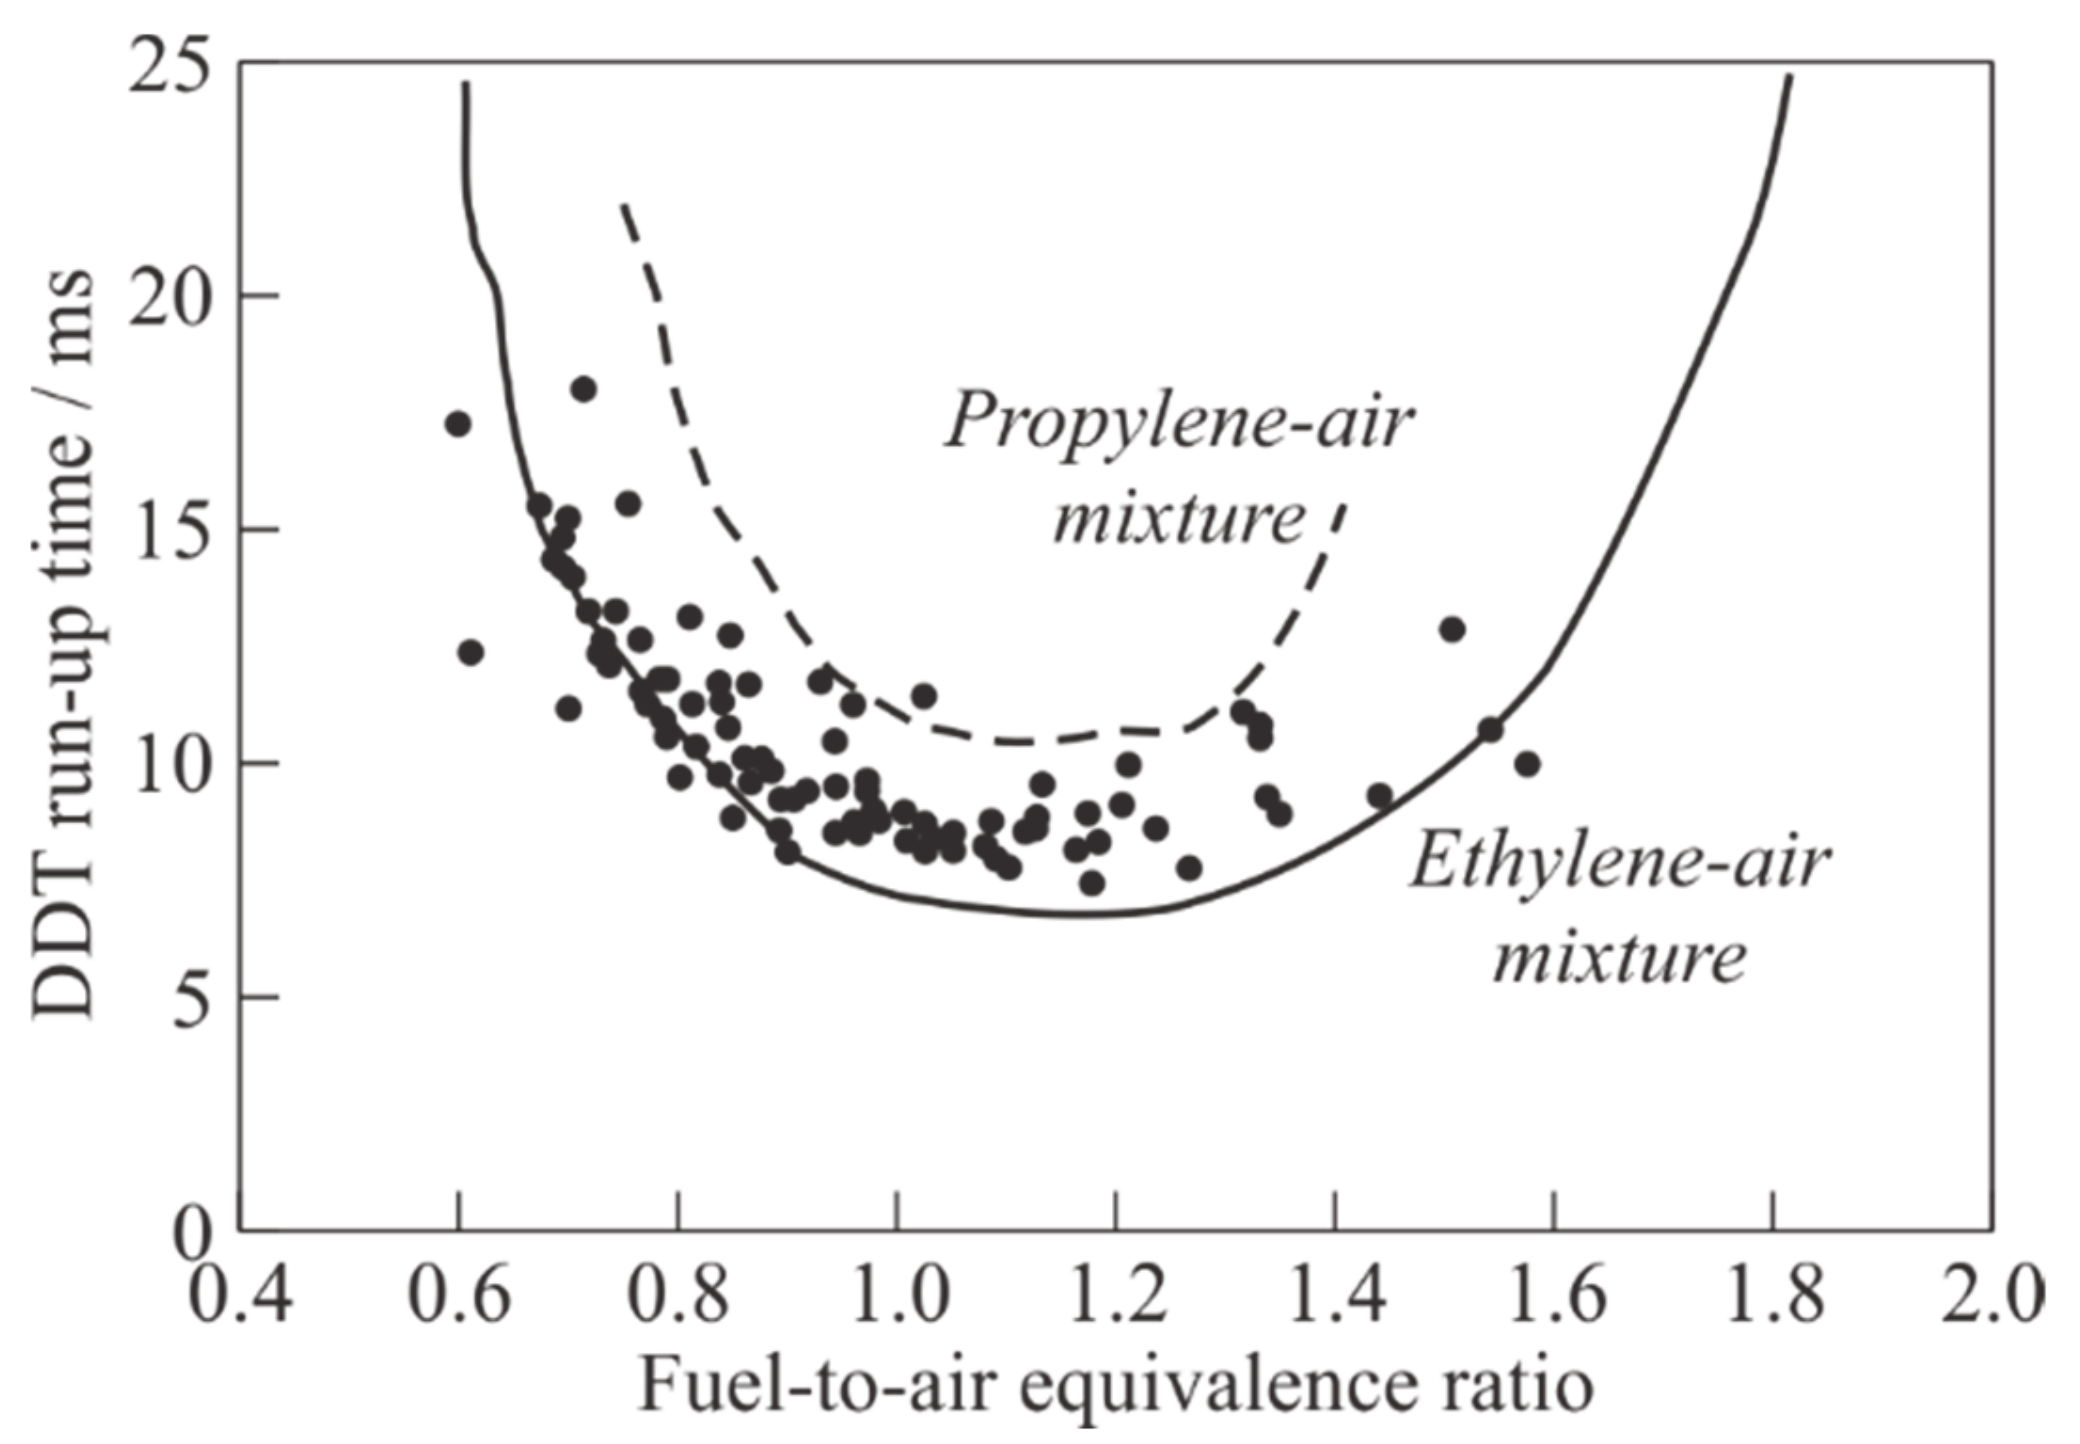
Figure 11 shows the cumulated dependence of the measured DDT run-up time in air mixtures of pyrogas (dark circles) on the average fuel-to-air equivalence ratio. Note that the DDT run-up distance, LDDT, in all the experiments was nearly constant (≈2 m), i.e., DDT occurred at the exit from the PDT helical section. To estimate the relative detonability of pyrogas, we add to this plot the experimental dependences tDDT(Φ) obtained in [25] for homogeneous ethylene-air (solid curve) and propylene-air (dashed curve) mixtures. It follows from considering Figure 11 that the detonability of pyrogas is close to that for air mixtures of its monomer, ethylene, especially for fuel-lean compositions ( Φ ¯ < 0.9). At Φ ¯ ≥ 0.9, the fuel mixtures based on pyrogas exhibit the detonability that is intermediate between the detonability of air mixtures of ethylene and propylene. The DDT run-up time for fuel mixtures based on pyrogas varies from ≈ 7 to 18 ms. The mixtures of pyrogas with air with Φ ¯ = 1.1–1.2 have the maximum detonability (the minimum value tDDT ≈ 7 ms). The concentration limits of detonation of pyrogas–air mixtures is seen to be somewhat narrower than those of homogeneous ethylene–air mixtures, but wider than those of homogeneous propylene–air mixtures.
The results obtained show that the pyrogas consisting mainly of a mixture of ethylene, propylene, methane, and hydrogen, has high detonability comparable to that of homogeneous ethylene–air and propylene–air mixtures. On the one hand, this indicates high explosibility of pyrogas, which can be formed, for example, during industrial and household fires. On the other hand, pyrogas, like PP pyrogas [23], can be considered as a promising fuel for solid-fuel DRs. However, it should be kept in mind that the products of PE pyrolysis contain much hydrogen (see Table 3) and the metal parts of such DRs may be prone to hydrogen embrittlement or high temperature hydrogen attack.
3. Solid-Fuel Detonation Ramjet

3.1. Conceptual Design

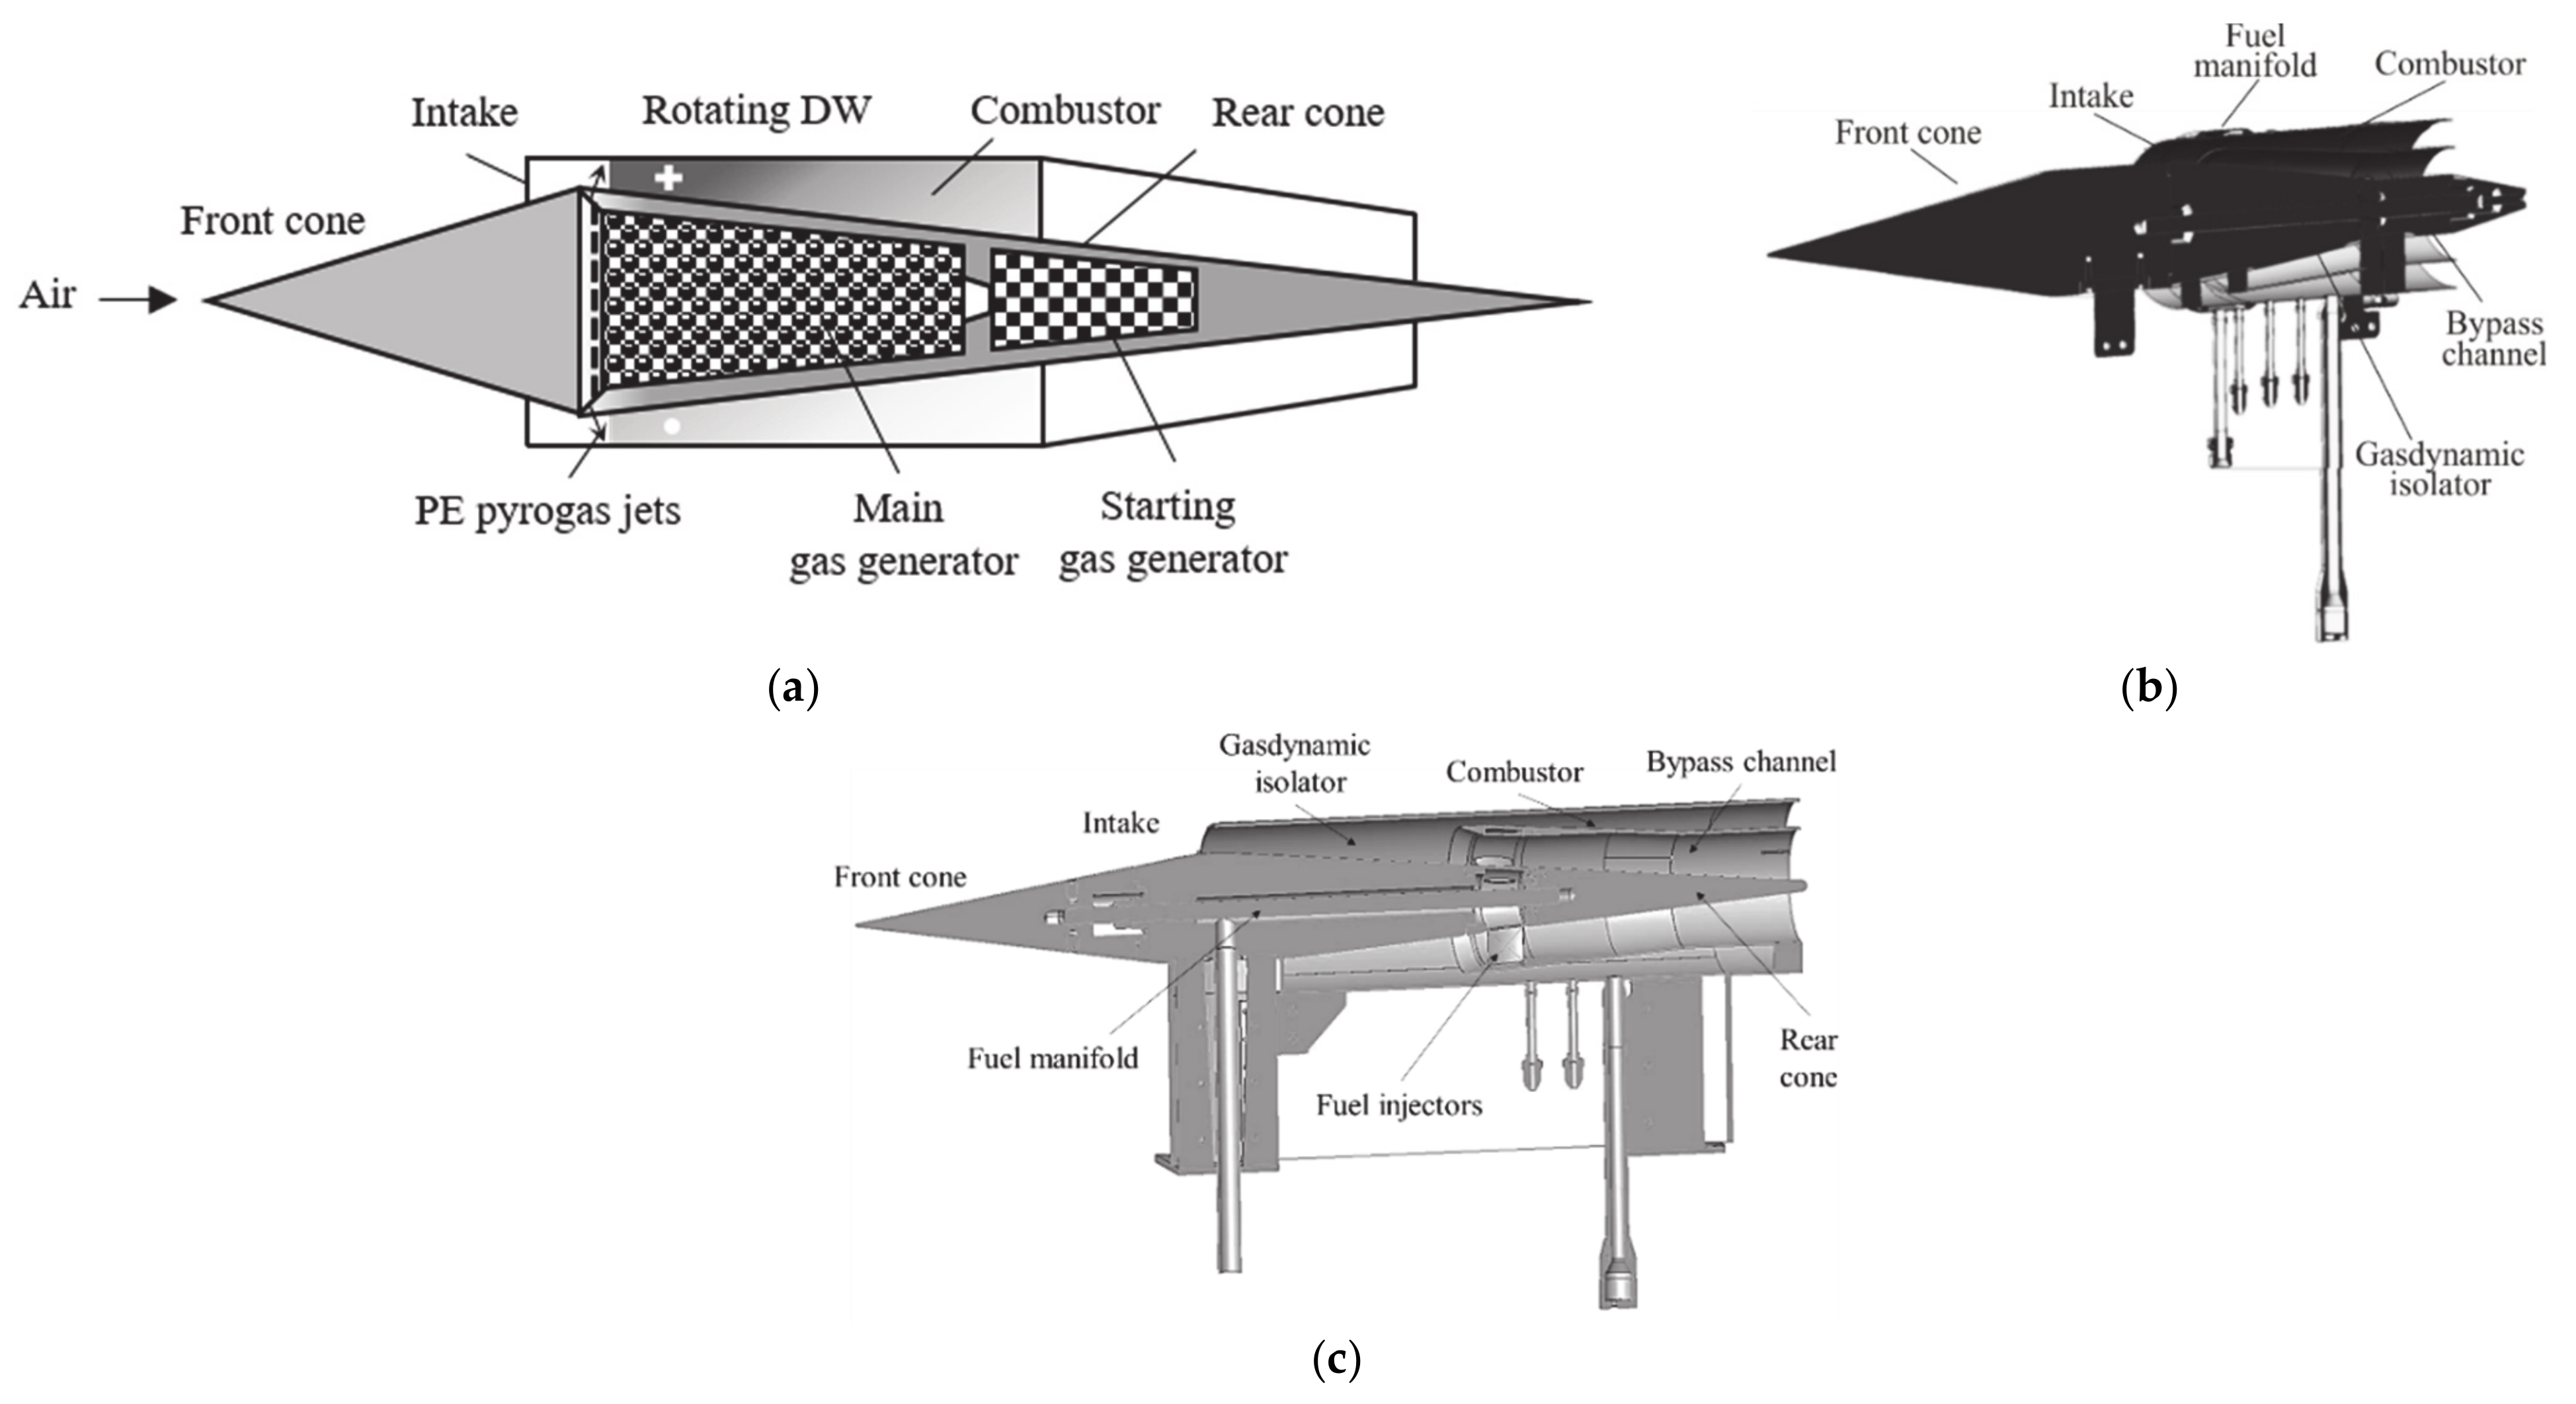
As a continuation of the studies described in Section 2 and following our patent [10], we have developed the novel conceptual design of the solid-fuel DR demonstrator, shown schematically in Figure 12a. The DR demonstrator contains two GGs: a starting GG and a main GG filled with PE granules and structural elements with high thermal conductivity (not shown in Figure 12a). The GGs are connected by a nozzle. The main GG is connected to a plenum, from which the pyrogas jets are supplied to the annular combustor of the DR through multiple radial holes due to elevated pressure in the GGs. The continuous detonation of pyrogas-air mixture in the annular combustor, e.g., in a single or several rotating DWs, produces a thrust force to the DR. The pyrolysis process is partly supported by the heat flux from the combustion zone to the main GG.
It is implied that, as a starting point, the DR demonstrator must operate on gaseous ethylene, as a good representative of pyrogas in terms of fuel detonability. Thereafter the DR demonstrator will operate on the pyrogas supplied from an external GG. Finally, the GG will be placed in the DR center body and the DR demonstrator will be fired autonomously using the pyrogas produced on-board.
As a basis for the conceptual design of the DR, we used the design of hydrogen-fueled dual-duct DR demonstrator developed, manufactured, and tested in [31,32] (Figure 12b) for the cruising flight speed of Mach 2 at sea level. The test fires in [31,32] were performed in a pulsed WT at approaching air stream Mach numbers M = 2 and 1.5. The most important result of the test fires was the experimental proof of the possibility of arranging steady-state continuous detonation of hydrogen in the DR at on-design (M = 2) and off-design (M = 1.5) flight speeds. Also, the startup Mach number of the DR was proved to be at the level of M = 1.5.
Figure 12b,c compare the design proposed in [31,32] and the modified design of an ethylene/pyrogas DR demonstrator. In both cases, the DR demonstrator contains a center body with a front cone, rear cone, and the intake with the flow splitter. After entering the intake, the airflow is split into two parts: one part enters the combustor and the other enters the bypass channel. Gaseous fuel is injected in the combustor through equidistant radial holes located downstream from the combustor entrance at a certain cross section. After ignition, continuous detonation of the fuel–air mixture is established in the combustor. The formed detonation products accelerate downstream to the annular nozzle, thus creating a quasi-steady exhaust jet plume and thrust. The operation process in the combustor is organized in such a way that neither the fuel–air mixture nor the detonation products move upstream the intake. The bypass channel provides the effective attenuation of SWs caused by the continuous detonation in the combustor and contributes to the propulsive force. The basic dimensions of the DRs are as follows. The external diameters of the combustor and the largest diameter of the center body are 120 and 90mm, respectively; the total length of the DRs is 700 mm.
In [31,32], the possibility of hydrogen-fueled DR operation at an approaching air stream Mach number as low as M = 1.5 with the positive effective thrust was associated with a combination of two factors. The first is the use of a dual-duct flow path and the second is the arrangement of continuous detonation rather than deflagration of fuel–air mixture. Note that the overall value of Φ at the entrance to the DR intake was about 0.3 even with Φ = 1 in the combustor. This means that most of the air passed through the bypass channel and did not participate in the combustion process, and the chemical energy release in the combustor did not lead to intake unstart. In the continuous spinning detonation wave, the zone of chemical energy release occupies only a small part of the combustor cross-section at each instant of time, which facilitates the on-design operation of the intake.
As compared to the DR design of [31,32], the DR demonstrator of the modified design possesses several basic modifications: (i) The gasdynamic isolator is extended upstream; (ii) The ratio of cross-sections of the combustor and bypass channel is decreased; (iii) Following [10], fuel is supplied to the combustor from the internal rather than external wall; and (iv) The supporting pylons are shifted farer away from the combustor to avoid their influence on the operation process.

3.2. Preliminary Test Fires

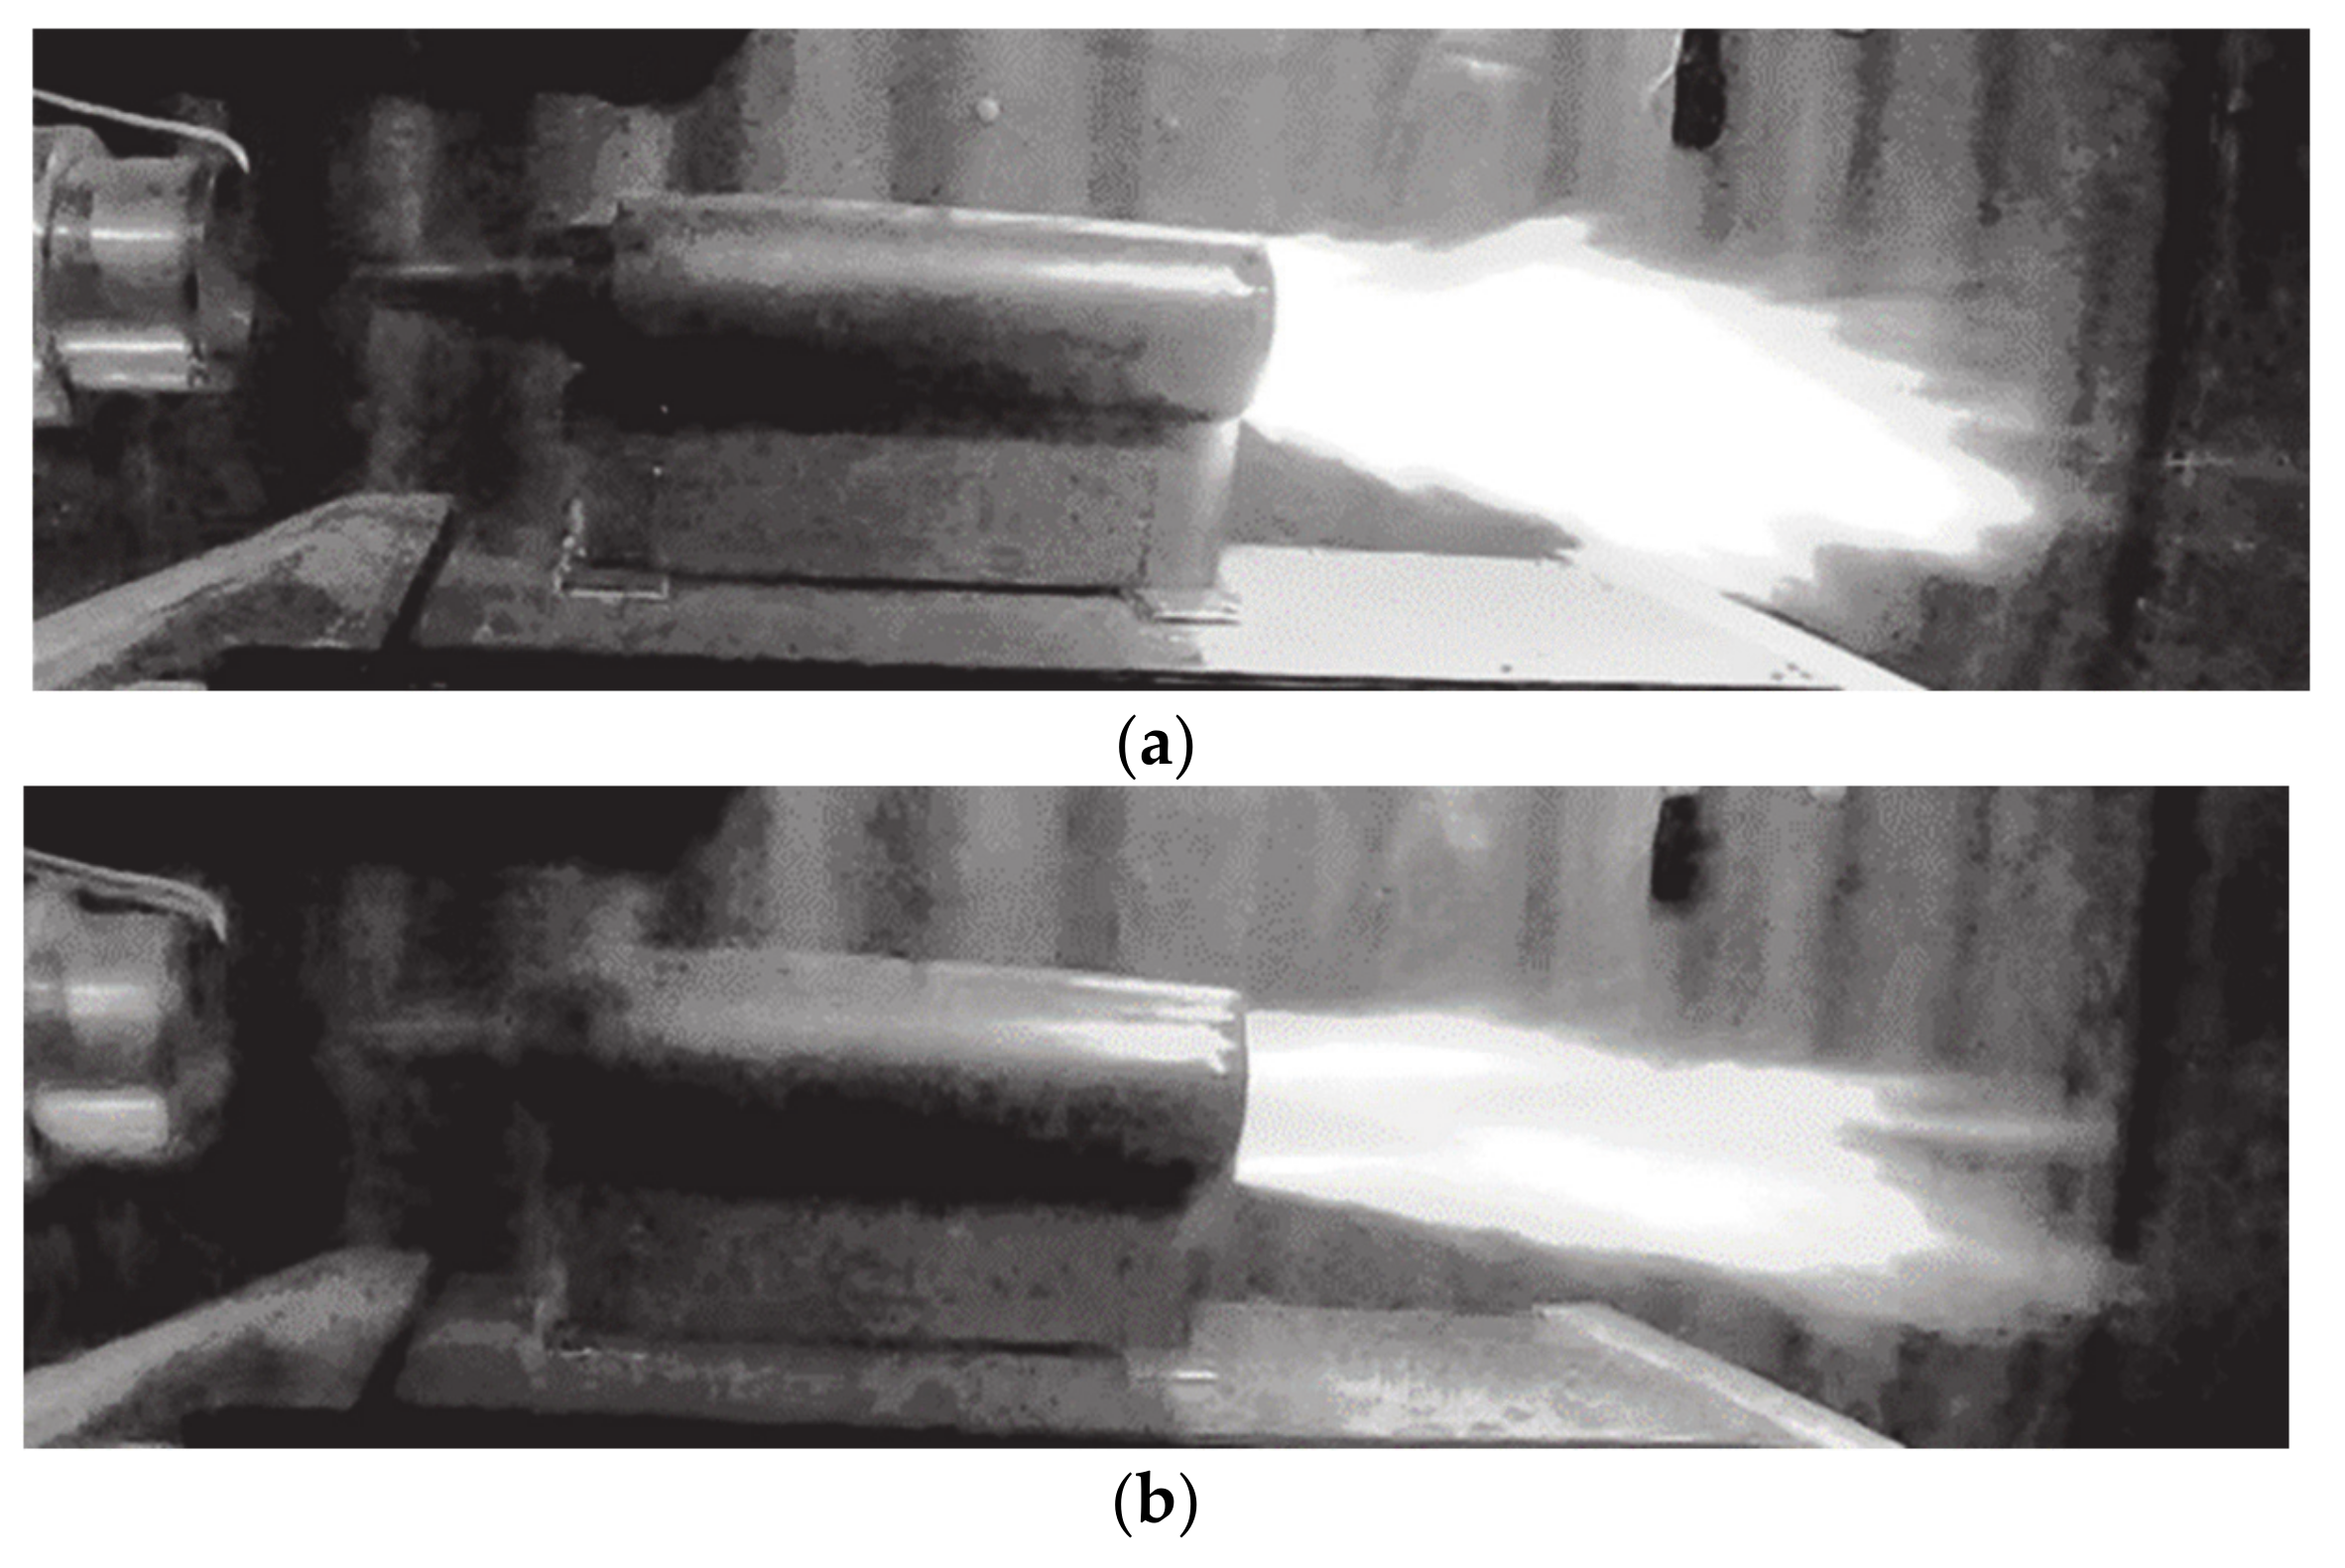
The preliminary test fires of the DR of the modified design are performed in the same pulsed WT as in [31,32]. The volume and the maximum air pressure in the WT receiver are 10.4 m3 and 1.6 MPa, respectively. Figure 13 shows the frames of video recording of preliminary test fires at M = 2 and M = 1.5 (stagnation pressure 0.8 and 0.4 MPa, respectively) with ethylene as a fuel. In the test fires, a short-term (about 50 ms long) onset of continuous spinning detonation of ethylene was registered at both Mach numbers with operation frequencies of 0.3 (longitudinally pulsating detonation, LPD) and 2.1 kHz (continuous spin detonation, CSD). The static pressure in the combustor and the effective thrust in the tests shown in Figure 13 are 0.25 MPa at M = 2 and 0.2 MPa at M = 1.5, respectively.

4. Conclusions

The relative detonability of pyrogas–air mixtures of different composition is determined for the first time. It is shown that the pyrogas–air mixtures exhibit detonability close to that of the homogeneous ethylene–air and propylene–air mixtures with a fuel-to-air equivalence ratio of 0.6 ≤ Φ ≤ 1.6 at normal pressure. Detonability is assessed by the measured values of the DDT run-up time in the standard pulsed detonation tube. Pyrogas is obtained in the gas generator at decomposition temperatures of 650–850 °C. Chromatographic analysis of pyrogas shows that at high decomposition temperatures on the level of 850 °C it mainly consists of hydrogen, methane, ethylene and ethane and has a molecular mass of about 10 g/mol, and at a low decomposition temperature (650 °C) it mainly consists of ethylene, ethane, methane, hydrogen, propylene and higher hydrocarbons and has a molecular mass of 24–27 g/mol. Due to the high detonability, pyrogas can be considered as a promising fuel candidate for advanced solid-fuel detonation ramjets. In view of it, we have developed the novel conceptual design of the dual-duct detonation ramjet demonstrator for the cruising flight speed of Mach 2 at sea level, manufactured and preliminarily tested it in a pulsed wind tunnel at Mach 2 and 1.5 conditions. In the test fires, a short-term onset of continuous detonation of ethylene was registered at both Mach numbers. Future work will be focused on (i) further testing the DR demonstrator on ethylene as a fuel; (ii) operating the DR demonstrator on the pyrogas supplied from an external gas generator; and (iii) operating the DR demonstrator on the pyrogas produced by the on-board gas generator.

Author Contributions

Conceptualization, S.M.F. and V.I.Z.; methodology, S.M.F., I.O.S., V.S.A. and V.S.I.; investigation, I.O.S., V.S.A., M.V.K., I.V.B. and V.S.I.; formal analysis, I.O.S., M.V.K., I.V.B.; writing-original draft preparation, S.M.F.; writing—review and editing, S.M.F.; supervision, S.M.F.; project administration, S.M.F.; funding acquisition, S.M.F. and V.S.I. All authors have read and agreed to the published version of the manuscript.

Funding

This research was funded by Russian Science Foundation (project 18-73-10196).

Institutional Review Board Statement

Not applicable.

Informed Consent Statement

Not applicable.

Data Availability Statement

The data presented in this study are available on request from the corresponding author.

Conflicts of Interest

The authors declare no conflict of interest.

Abbreviations

ADCanalog-to-digital converter
CJChapman–Jouguet
CSDcontinuous spin detonation
DDTdeflagration-to-detonation transition
DMCSdimethylchlorosilane
DRdetonation ramjet
DWdetonation wave
EMVelectromagnetic valve
FAMfuel–air mixture
GGgas generator
IPionization probe
LPDlongitudinally pulsating detonation
PBApropane-butane automotive
PDTstandard pulsed detonation tube
PEpolyethylene
PPpolypropylene
PSpressure sensor
SCMsolid combustible materials
SWShock wave
WTwind tunnel

Nomenclature

Ddetonation velocity
DCJChapman–Jouguet detonation velocity
G ¯ a average mass flow rate of air
G ¯ p average mass flow rate of pyrogas
Gp,staverage mass flow rate of pyrogas in a stochiometric fuel–air mixture
L0stoichiometric coefficient
LDDTDDT run-up distance
MMach number
m0mass of solid PE sample
mpmass of pyrogas
mrmass of solid residue (pyrocarbon) in the GG
mwmass of wax-like sediments in the mains at the outlet of the GG
PNair pressure under normal conditions
Ppmaximum pressure in the GG during pyrolysis
Runiversal gas constant
ttime
tDDTDDT run-up time
tmintime when the minimum temperature is attained in the GG
Tminminimum temperature in the GG during pyrolysis
Tpdecomposition temperature
tppyrolysis time
V0Volume of the GG
Vbvolume of the air receiver
xrmass fraction of solid residue
xwmass fraction of wax-like deposit
Xivolume fraction of the i-th component in the pyrolysis gas
ΔPchange in pressure in the air receiver
Δttime interval
μ ¯ p average molecular mass of pyrogas
ρNair density under normal conditions
Φfuel-to-air equivalence ratio
Φ ¯ average fuel-to-air equivalence ratio
Φmaxmaximum value of fuel-to-air equivalence ratio
Φminminimum value of fuel-to-air equivalence ratio

References

  1. Mouritz, A.P.; Mathys, Z.; Gibson, A.G. Heat release of polymer composites in fire. Compos. Part A 2006, 37, 1040–1054. [Google Scholar] [CrossRef]
  2. Ahmed, I.I.; Gupta, A.K. Hydrogen production from polystyrene pyrolysis and gasification: Characteristics and kinetics. Int. J. Hydrogen Energy 2009, 34, 6253–6264. [Google Scholar] [CrossRef]
  3. Lewis, B.; Von Elbe, G. Combustion Flames and Explosion of Gases, 2nd ed.; Academic Press Inc.: London, UK, 1961. [Google Scholar] [CrossRef]
  4. Shiplyuk, A.N.; Zvegintsev, V.I.; Frolov, S.M.; Vnuchkov, D.A.; Kiseleva, T.A.; Kislovsky, V.A.; Lukashevich, S.V.; Melnikov, A.Y.; Nalivaychenko, D.G. Gasification of low-melting hydrocarbon material in the airflow heated by hydrogen combustion. Int. J. Hydrogen Energy 2020, 45, 9098–9112. [Google Scholar] [CrossRef]
  5. Shiplyuk, A.N.; Zvegintsev, V.I.; Frolov, S.M.; Vnuchkov, D.A.; Kislovsky, V.A.; Kiseleva, T.A.; Lukashevich, S.V.; Melnikov, A.Y.; Nalivaychenko, D.G. Gasification of low-melting fuel in a high-temperature flow of inert gas. J. Propuls. Power 2021, 37. [Google Scholar] [CrossRef]
  6. Geld, C.V.D.; Korting, P.; Wijchers, T. Combustion of PMMA, PE, and PS in a ramjet. Combust Flame 1990, 79, 299–306. [Google Scholar] [CrossRef] [Green Version]
  7. Favaro, F.M.; Sirignano, W.A.; Manzoni, M.; DeLuca, L.T. Solid-fuel regression rate modeling for hybrid rockets. J. Propuls. Power 2013, 29, 205–215. [Google Scholar] [CrossRef] [Green Version]
  8. Musa, O.; Xiong, C.; Weixuan, L.; Wenhe, L. Combustion characteristics of a novel design of solid-fuel ramjet motor with swirl flow. Aerosp. Sci. Technol. 2019, 92, 750–765. [Google Scholar] [CrossRef]
  9. Zvegintsev, V.I.; Fedorychev, A.V.; Zhesterev, D.V.; Mishkin, I.R.; Frolov, S.M. Gasification of low-melting hydrocarbon materials in high-temperature gas flow. Combust. Explos. 2019, 12, 108–116. [Google Scholar] [CrossRef]
  10. Frolov, S.M.; Aksyonov, V.S.; Shamshin, I.O.; Nabatnikov, S.A.; Avdeev, K.A.; Shulakova, N.S. A Solid-Fuel Ramjet and the Method of Its Functioning. Patent of Russian Federation No. 2706870, 21 November 2019. (Priority date 25 February 2019). [Google Scholar]
  11. Braun, E.M.; Lu, F.K.; Wilson, D.R.; Camberos, J.A. Airbreathing rotating detonation wave engine cycle analysis. Aerosp. Sci. Technol. 2013, 27, 201–208. [Google Scholar] [CrossRef] [Green Version]
  12. Zel’dovich, Y.B. To the question of energy use of detonation combustion. Sov. J. Techn. Phys. 1940, 10, 1453–1458. [Google Scholar] [CrossRef]
  13. Frolov, S.M.; Barykin, A.E.; Borisov, A.A. Thermodynamic cycle with detonation combustion of fuel. Khimicheskaya Fizika 2004, 23, 17–25. (In Russian) [Google Scholar]
  14. Bykovskii, F.A.; Zhdan, S.A.; Vedernikov, E.F. Continuous spin detonations. J. Propusl. Power 2006, 22, 1204–1216. [Google Scholar] [CrossRef]
  15. Schwer, D.; Kailasanath, K. Numerical investigation of the physics of rotating-detonation engines. Proc. Combust. Inst. 2011, 33, 2195–2202. [Google Scholar] [CrossRef]
  16. Wolanski, P. Detonative propulsion. Proc. Combust. Inst. 2013, 34, 125–158. [Google Scholar] [CrossRef]
  17. Kasahara, J.; Frolov, S. Present Status of Pulse and Rotating Detonation Engine Research. In Proceedings of the 25th ICDERS, Leads, UK, 2–7 August 2015. [Google Scholar]
  18. Zhou, R.; Wu, D.; Wang, J.-P. Progress of continuously rotating detonation engines. Chin. J. Aeronaut. 2016, 29, 15–29. [Google Scholar] [CrossRef] [Green Version]
  19. Frolov, S.M.; Aksenov, V.S.; Ivanov, V.S.; Shamshin, I.O. Continuous detonation combustion of ternary “hydrogen-liquid propane-air” mixture in annular combustor. Int. J. Hydrogen Energy 2017, 42, 16808–16820. [Google Scholar] [CrossRef]
  20. Bykovskii, F.A.; Zhdan, S.A.; Vedernikov, E.F. Continuous detonation of the liquid kerosene—Air mixture with addition of hydrogen or syngas. Combust. Explos. Shock Waves 2019, 55, 589–598. [Google Scholar] [CrossRef]
  21. Kindracki, J.; Wacko, K.; Woźniak, P.; Siatkowski, S.; Mężyk, Ł. Influence of Gaseous Hydrogen Addition on Initiation of Rotating Detonation in Liquid Fuel–Air Mixtures. Energies 2020, 13, 5101. [Google Scholar] [CrossRef]
  22. Frolov, S.M.; Ivanov, V.S.; Shamshin, I.O.; Aksenov, V.S.; Vovk, Y.V.; Mokrynskij, I.V.; Bruskov, V.A.; Igonkin, D.V.; Moskvitin, S.N.; Illarionov, A.A.; et al. A detonation afterburner. Doklady Phys. 2020, 65, 70–73. [Google Scholar] [CrossRef]
  23. Frolov, S.M.; Zvegintsev, V.I.; Aksenov, V.S.; Bilera, I.V.; Kazachenko, V.V.; Shamshin, I.O.; Gusev, P.A.; Belotserkovskaya, M.S.; Koverzanova, E.V. Detonability of air mixtures of the polypropylene pyrolysis products. Combust. Explos. 2018, 11, 44–60. [Google Scholar] [CrossRef]
  24. Frolov, S.M.; Zvegintsev, V.I.; Aksenov, V.S.; Bilera, I.V.; Kazachenko, V.M.; Shamshin, I.O.; Gusev, P.A.; Belotserkovskaya, M.S. Deflagration-to-detonation transition in air mixtures of polypropylene pyrolysis products. Doklady Phys. Chem. 2019, 488, 29–133. [Google Scholar] [CrossRef]
  25. Frolov, S.M.; Zvegintsev, V.I.; Aksenov, V.S.; Bilera, I.V.; Kazachenko, M.V.; Shamshin, I.O.; Gusev, P.A.; Belotserkovskaya, M.S. Detonability of fuel–air mixtures. Shock Waves 2020, 1–19. [Google Scholar] [CrossRef]
  26. Frolov, S.M. Initiation of strong reactive shocks and detonation by traveling ignition pulses. J. Loss Prevent. Proc. 2006, 19, 238–244. [Google Scholar] [CrossRef]
  27. Frolov, S.M. Liquid-fueled air-breathing pulse detonation engine demonstrator: Operation principles and performance. J. Propuls. Power 2006, 6, 1162–1169. [Google Scholar] [CrossRef]
  28. Viktorov, S.B.; Gubin, S.A. Application of the TDS System of Thermodynamic Calculations for Modeling of Physical and Chemical Processes; Sci. Sess. “MEPhI-99:” Feb 1–4, 1999, Moscow, Collection of Research Works; February 1–4, 1999, Moscow; MEPhI Publs.: Moscow, Russia, 1999; Volume 8, pp. 73–74. [Google Scholar]
  29. Lee, J.H.S. The Detonation Phenomenon; Cambridge University Press: Cambridge, UK, 2008. [Google Scholar] [CrossRef]
  30. Oppenheim, A.K. Introduction to Gasdynamics of Explosions; Springer: Wien, Austria, 1972. [Google Scholar]
  31. Ivanov, V.S.; Frolov, S.M.; Zangiev, A.E.; Zvegintsev, V.I.; Shamshin, I.O. Ramjet with continuous-detonation combustion of hydrogen: Formation of a conceptual design based on multidimensional numerical simulations and test fires. Combust. Explos. 2020, 13, 66–83. [Google Scholar] [CrossRef]
  32. Ivanov, V.S.; Frolov, S.M.; Zangiev, A.E.; Zvegintsev, V.I.; Shamshin, I.O. Hydrogen fueled detonation ramjet: Conceptual design and test fires at Mach 1.5 and 2.0. Aerosp. Sci. Technol. 2021. [Google Scholar] [CrossRef]
Figure 1. Schematic (a) and photo (b) of the test bench with the standard pulsed detonation tube.
Energies 14 00820 g001
Figure 2. Schematic of the PDT with the indication of measuring segments. Dimensions are in millimeters. The symbol * indicates the place, from which we measure all distances. Actually, this is a position of the gap of the spark plug.
Energies 14 00820 g002
Figure 3. Schematic of GG with pyrogas sampling (a), simultaneous sampling of pyrogas and collection of liquid fraction (b), and photographs of samplers (c).
Energies 14 00820 g003
Figure 4. Time histories of pyrogas temperature and the rate of temperature variation (a) and pressure and the rate of pressure variation (b) in a closed GG at m0 = 1 g and Tp ≈ 850 °C.
Energies 14 00820 g004
Figure 5. Examples of records of the pyrogas temperature (weighed sample of granular PE is 15 g) in an open GG at decomposition temperatures of 650 (a) and 750 °C (b). Vertical lines correspond to the time interval during which a pyrogas sample is taken for chromatography.
Energies 14 00820 g005
Figure 6. Measured time histories of pyrogas temperature (a) and pressure (b) and the calculated time histories of the PDT shot-averaged consumption of pyrogas (c) in an experiment with Tp = 765 °C and m0 = 10 g.
Energies 14 00820 g006
Figure 7. The measured values of SW velocity (dark circles) and flame front velocity (light circles) in each PDT shot in the experiment of Figure 6 (Tp = 765 °C and m0 = 10 g). The horizontal dashed line corresponds to the typical value of the CJ detonation velocity, DCJ, in stoichiometric fuel mixtures of hydrocarbon fuels.
Energies 14 00820 g007
Figure 8. The measured dependences of the SW (filled symbols) and flame front (empty symbols) velocities on the distance traveled from the ignition source in each PDT shot in the experiment of Figure 6 (Tp = 765 °C and m0 = 10 g); the horizontal dashed line corresponds to the typical value of the detonation velocity DCJ in stoichiometric mixtures of hydrocarbon fuels: 1–shot 2; 2–3; 3–4; 4–5; 5–7; 6–8; 7–9; 8–10; 9–11; and 10–13.
Energies 14 00820 g008
Figure 9. The measured values of the DDT run-up time in detonation shots of the experiment of Figure 6 (Tp = 765 °C and m0 = 10 g).
Energies 14 00820 g009
Figure 10. The cumulated experimental dependences of the average velocities of the SW (dark circles) and the flame front (open circles) in the measuring section of the PDT on the fuel-to-air equivalence ratio in the pyrogas–air mixtures. The solid curve corresponds to the CJ detonation velocity DCJ in a homogeneous ethylene–air mixture.
Energies 14 00820 g010
Figure 11. The cumulative dependence of the DDT run-up time on the fuel-to-air equivalence ratio for pyrogas–air mixtures; solid curve is the DDT run-up time for premixed ethylene–air mixtures [25]; dashed curve is the DDT run-up time for premixed propylene–air mixtures [25].
Energies 14 00820 g011
Figure 12. Conceptual designs of (a) solid-fuel DR [9], (b) hydrogen-fueled dual-duct DR [29,30], and (c) ethylene/pyrogas fueled dual-duct DR for the cruising flight speed of Mach 2 at sea level.
Energies 14 00820 g012
Figure 13. Frames of video recording of preliminary test fires of a modified dual-duct DR demonstrator at (a) M = 2 and (b) M = 1.5 with ethylene as a fuel.
Energies 14 00820 g013
Table 1. Measurement errors.
m0 (g)Tp (℃)tp (s)Pp (kPa)Tmin (℃)tmin (s)mr (g)mw (g)Xi (%)
±0.02±10±2±1±10±0.1±0.05±0.15
Table 2. Characteristics of the GG during pyrolysis of granular PE at m0 = 1 g.
Tp (°C)Tmin (°C)tmin (s)Pp (kPa)tp (s)xr (%) μ ¯ p   ( g / mol )
6504408285404040
7505106500226011
8505806520197010
Table 3. Pyrogas composition (%(vol.)) during pyrolysis of granular PE in a closed GG at m0 = 1 g.
Tp (°C)H2CH4C2H4C2H6C3H6C3H8C6H6C4C5C6Rest μ ¯ p   ( g / mol )
6507.831.526.511.413.42.3-4.41.41.20.127.1
85053.640.91.82.40.040.011.2---0.059.9
Table 4. Characteristics of the GG during pyrolysis of granular PE in an open GG at m0 = 15 g.
Tp (°C)Tmin (°C)tmin (s)xr (%)
65038082
750450187
850640124
Table 5. Pyrogas composition (% (vol.)) during pyrolysis of granular PE in an open GG at m0 = 15 g.
Tp (°C)H2CH4C2H4C2H6C3H6C3H8C4C5C6Rest μ ¯ p   ( g / mol )
6504.518.032.610.819.03.88.41.90.90.132
75024.211.724.06.418.82.18.33.21.20.128
8505.216.138.19.016.43.08.12.11.80.232
Table 6. Cyclogram of PDT operation.
Channel No.Time, s (Sampling 0.01 s)
T1T2T3T4
5.490.010.10.4
C1 (ignition)offonoffoff
C2 (pyrogas)ononoffoff
C3 (air)ononoffon
Publisher’s Note: MDPI stays neutral with regard to jurisdictional claims in published maps and institutional affiliations.