
Clustering Techniques for Secondary Substations Siting


Abstract
1. Introduction
- Mathematical or numerical methods (e.g., integer or mixed-integer programming, branch and bound and, network-flow programming algorithm): the models allow to reach a global optimum of the solution but often incur in convergence problems when the size and complexity of the system grows substantially [15,16,17].
- Heuristic and metaheuristic algorithms: several techniques have been developed to solve problems with different sizes and characteristics. They do not guarantee the optimality of the solution and the convergence and depend on a variety of different input parameters, but when properly set could allow to solve complex problems with good accuracy. Genetic Algorithms [18], Imperialist Competitive Algorithm [19], Particle Swarm Optimization [20], are some examples of the wide variety of algorithms and methods present in the literature.
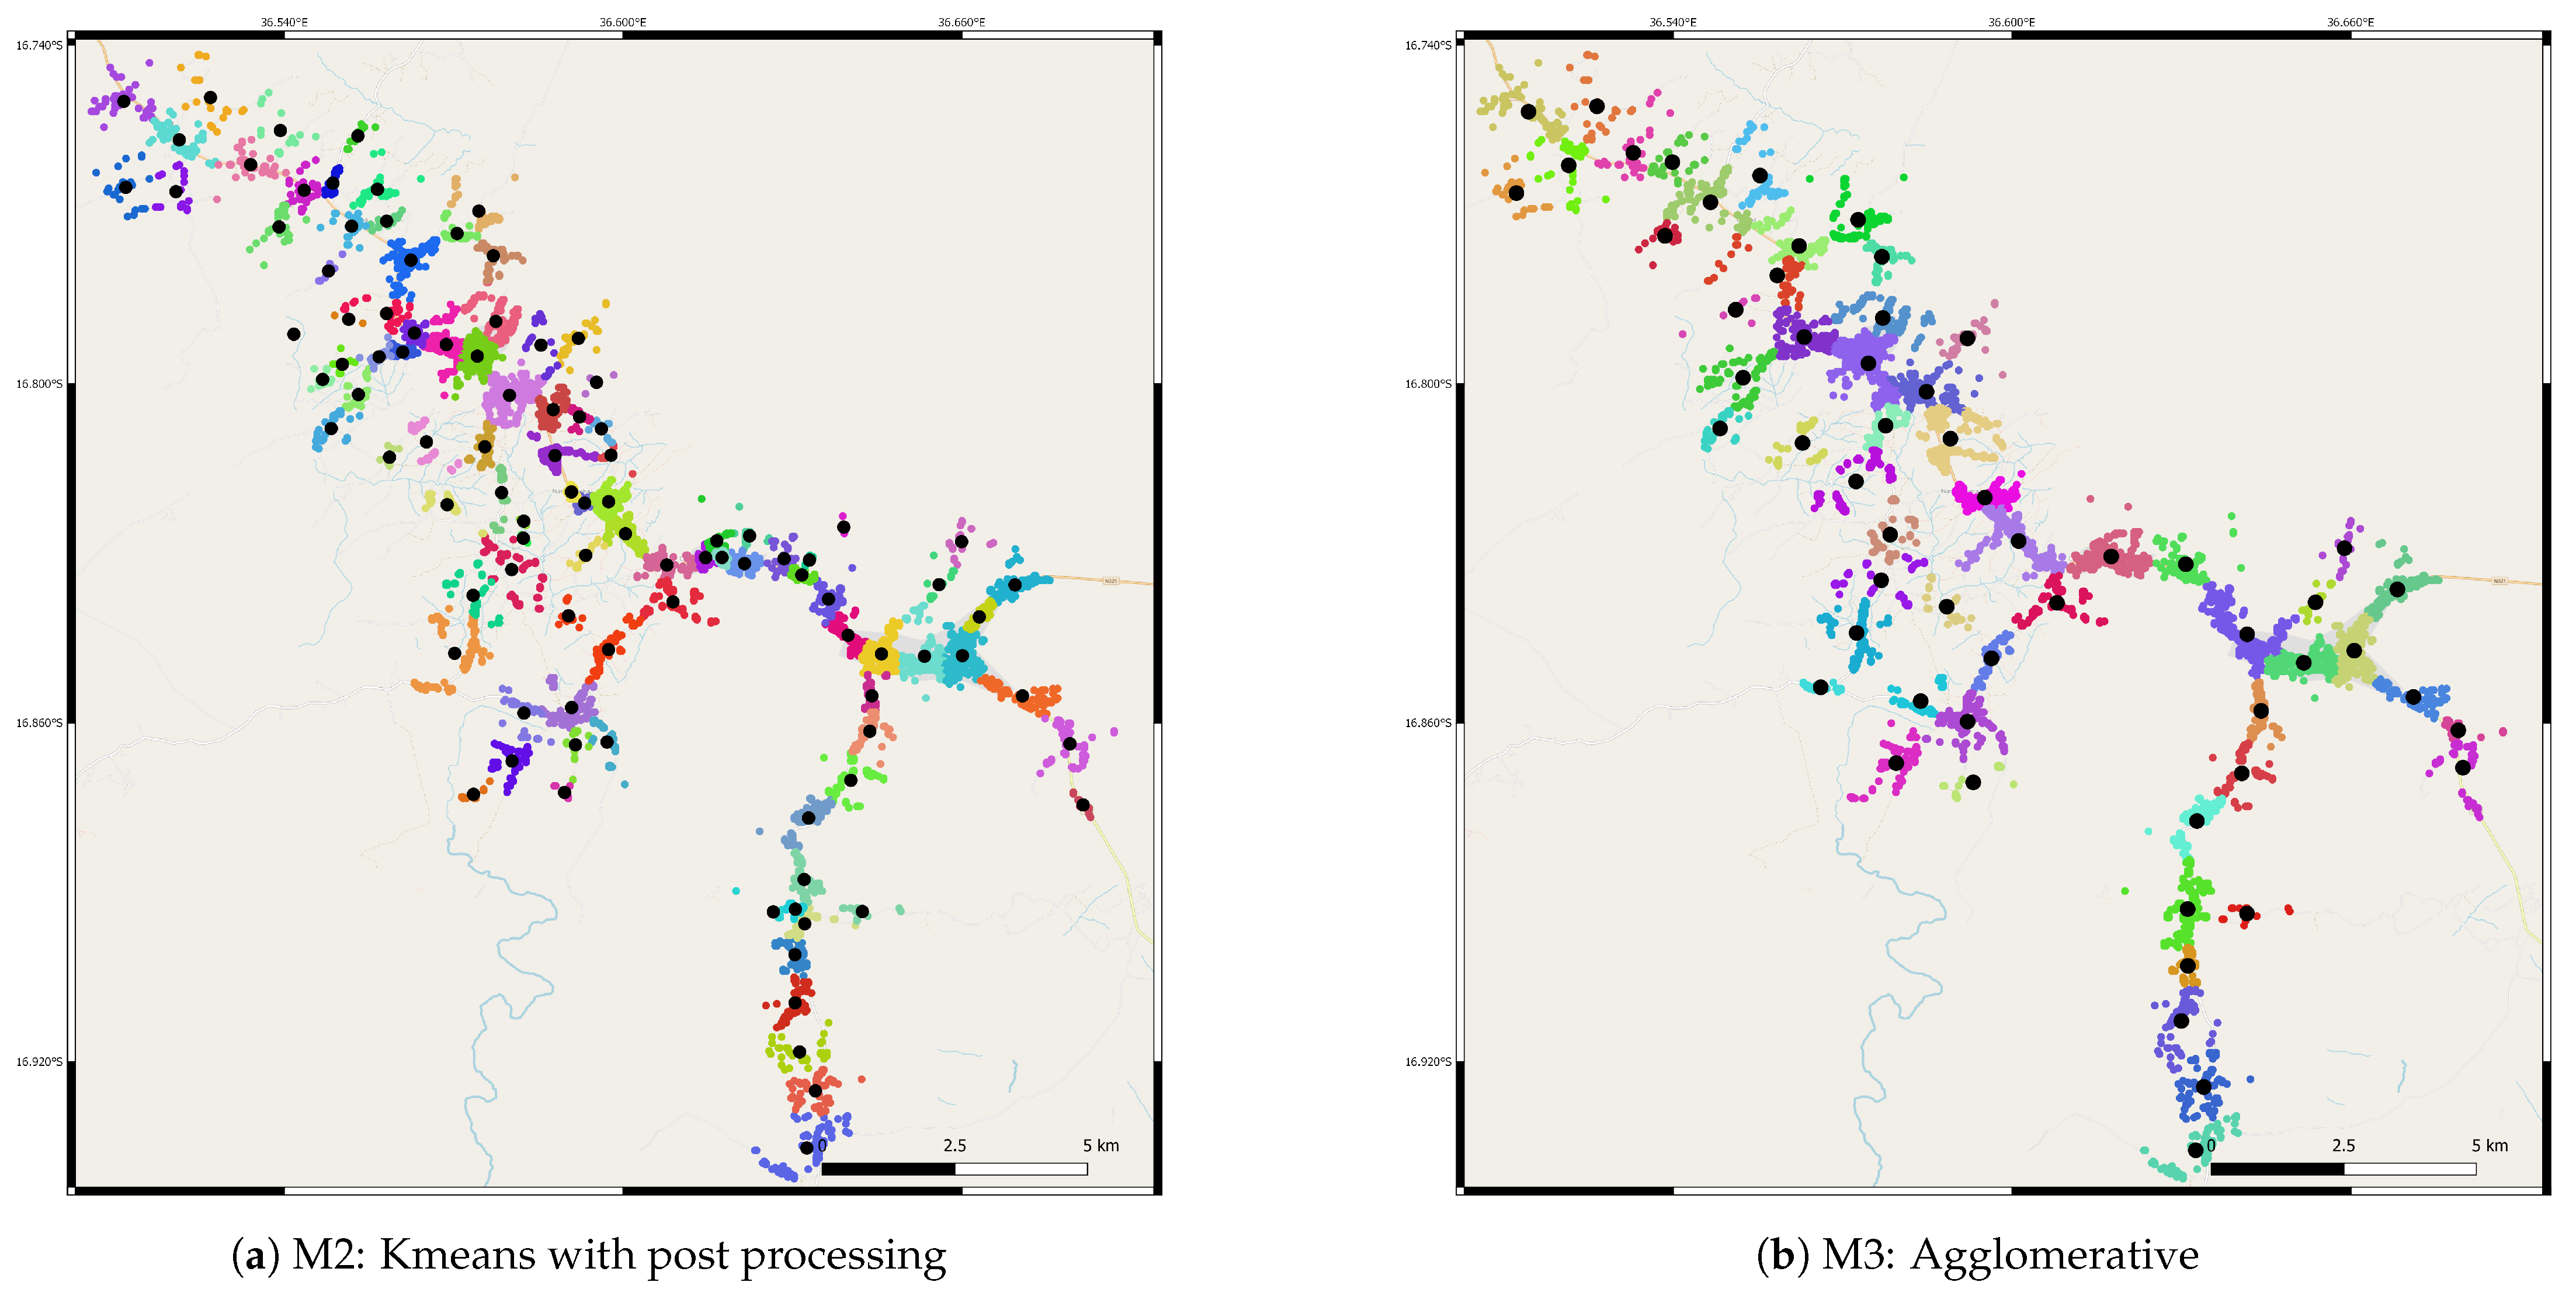
- Unsupervised learning techniques: data analysis techniques, and in particular clustering techniques, could be an effective way to find the optimal location of distribution substations on the basis of little input data, usually just the population density [21]. The most commonly used algorithm of this category is K-means. In [14], the authors use a combination of K-means and Dijkstra’s algorithm to design the LV grid. In [22] a GIS-based and Semi-Supervised Learning Algorithm based on K-means is developed, in [23] K-means with post processing techniques are used for large scale planning.
2. Gisele Project
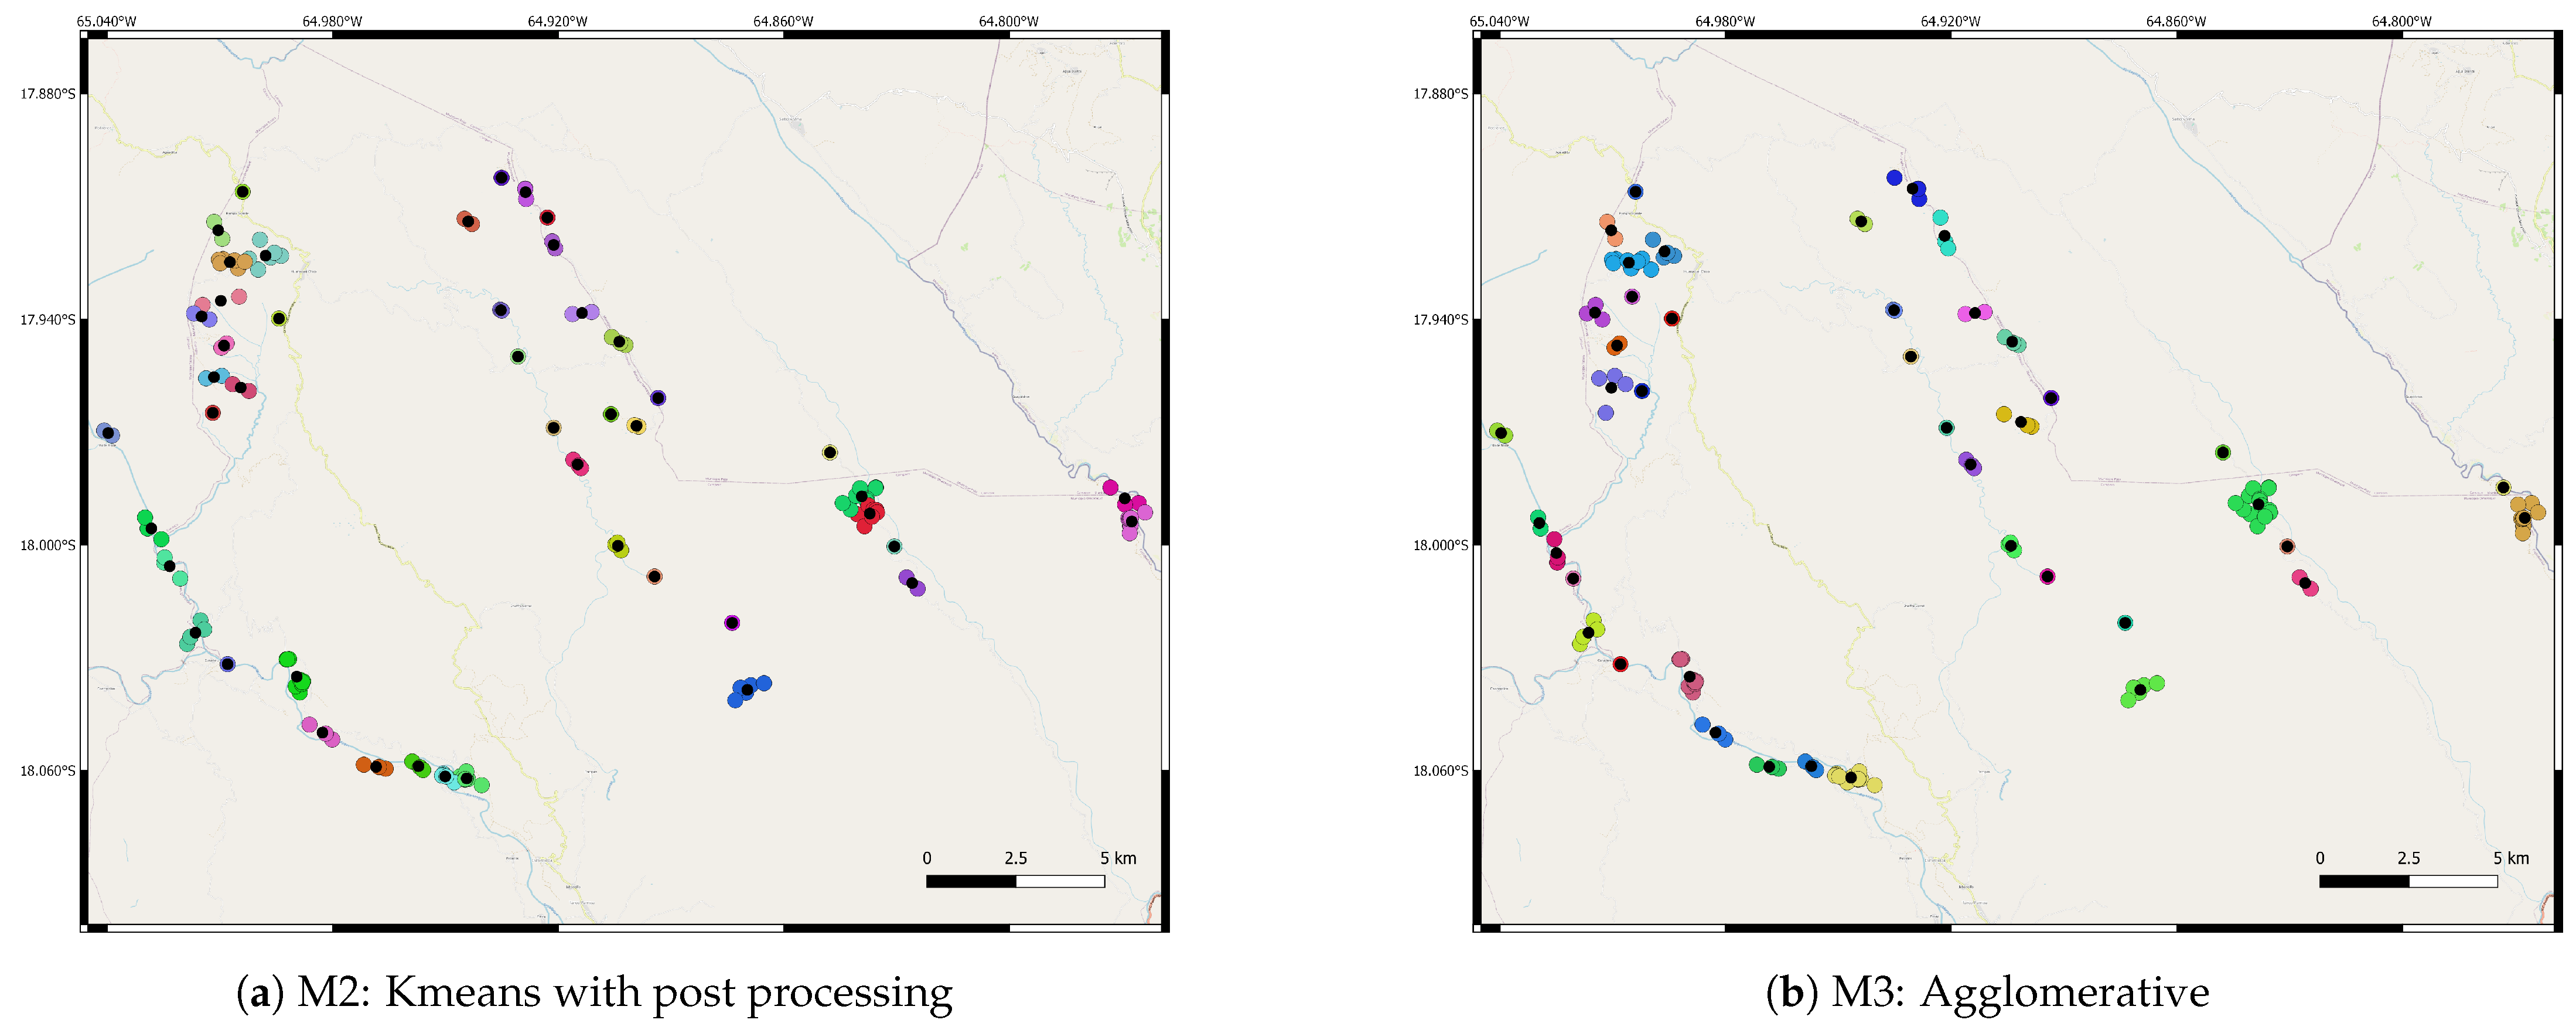
3. K-Means Based Clustering
- (1)
- Weighted k-means clustering: the distance of the point with respect to the centroids of the clusters is weighted according to the power associated (); the objective function becomes hence the followingThis process allows having more homogeneous clusters in terms of peak power load demand since centroids will be biased towards high power nodes.
- (2)
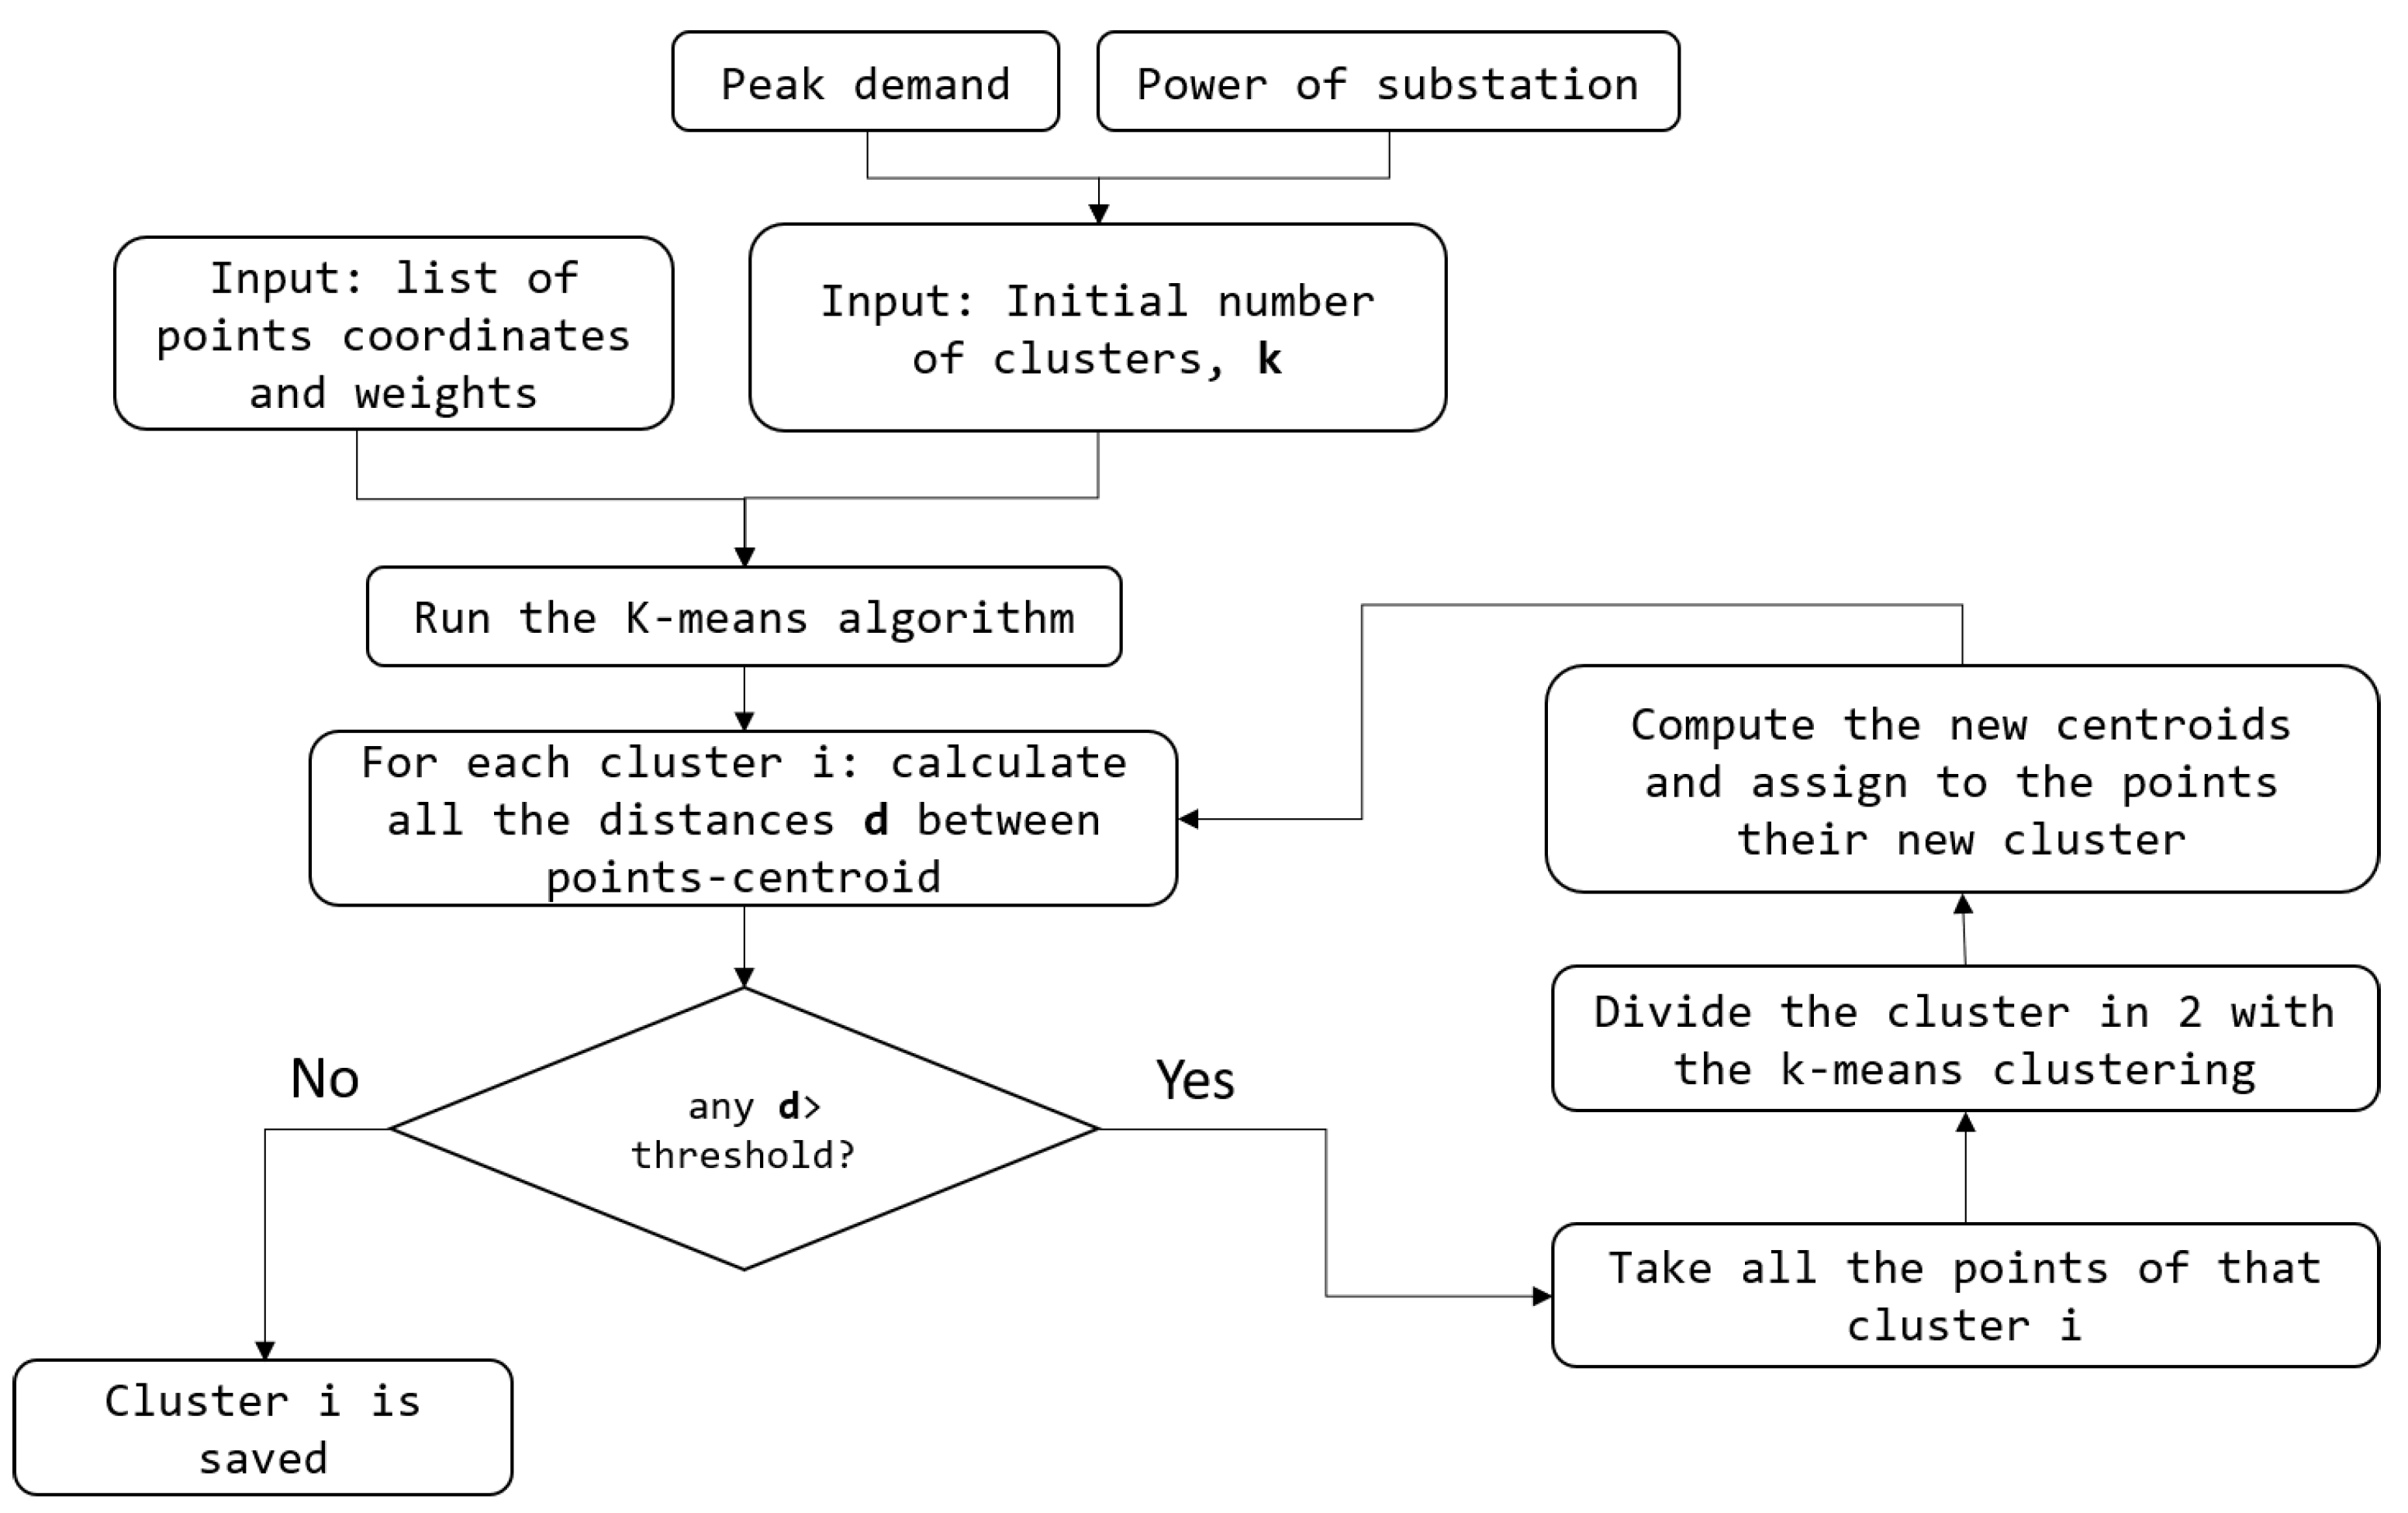
- Clusters post processing: the algorithm is iteratively run, subdividing wide clusters until all of them respect the distance constraint limits (i.e., distance threshold set equal to the LV grid maximum feeders’ length). The procedure is reported in the flowchart of Figure 2.
Input Data
4. Agglomerative Clustering
Input Data
5. Clustering and Substation Placement Based on LUKES
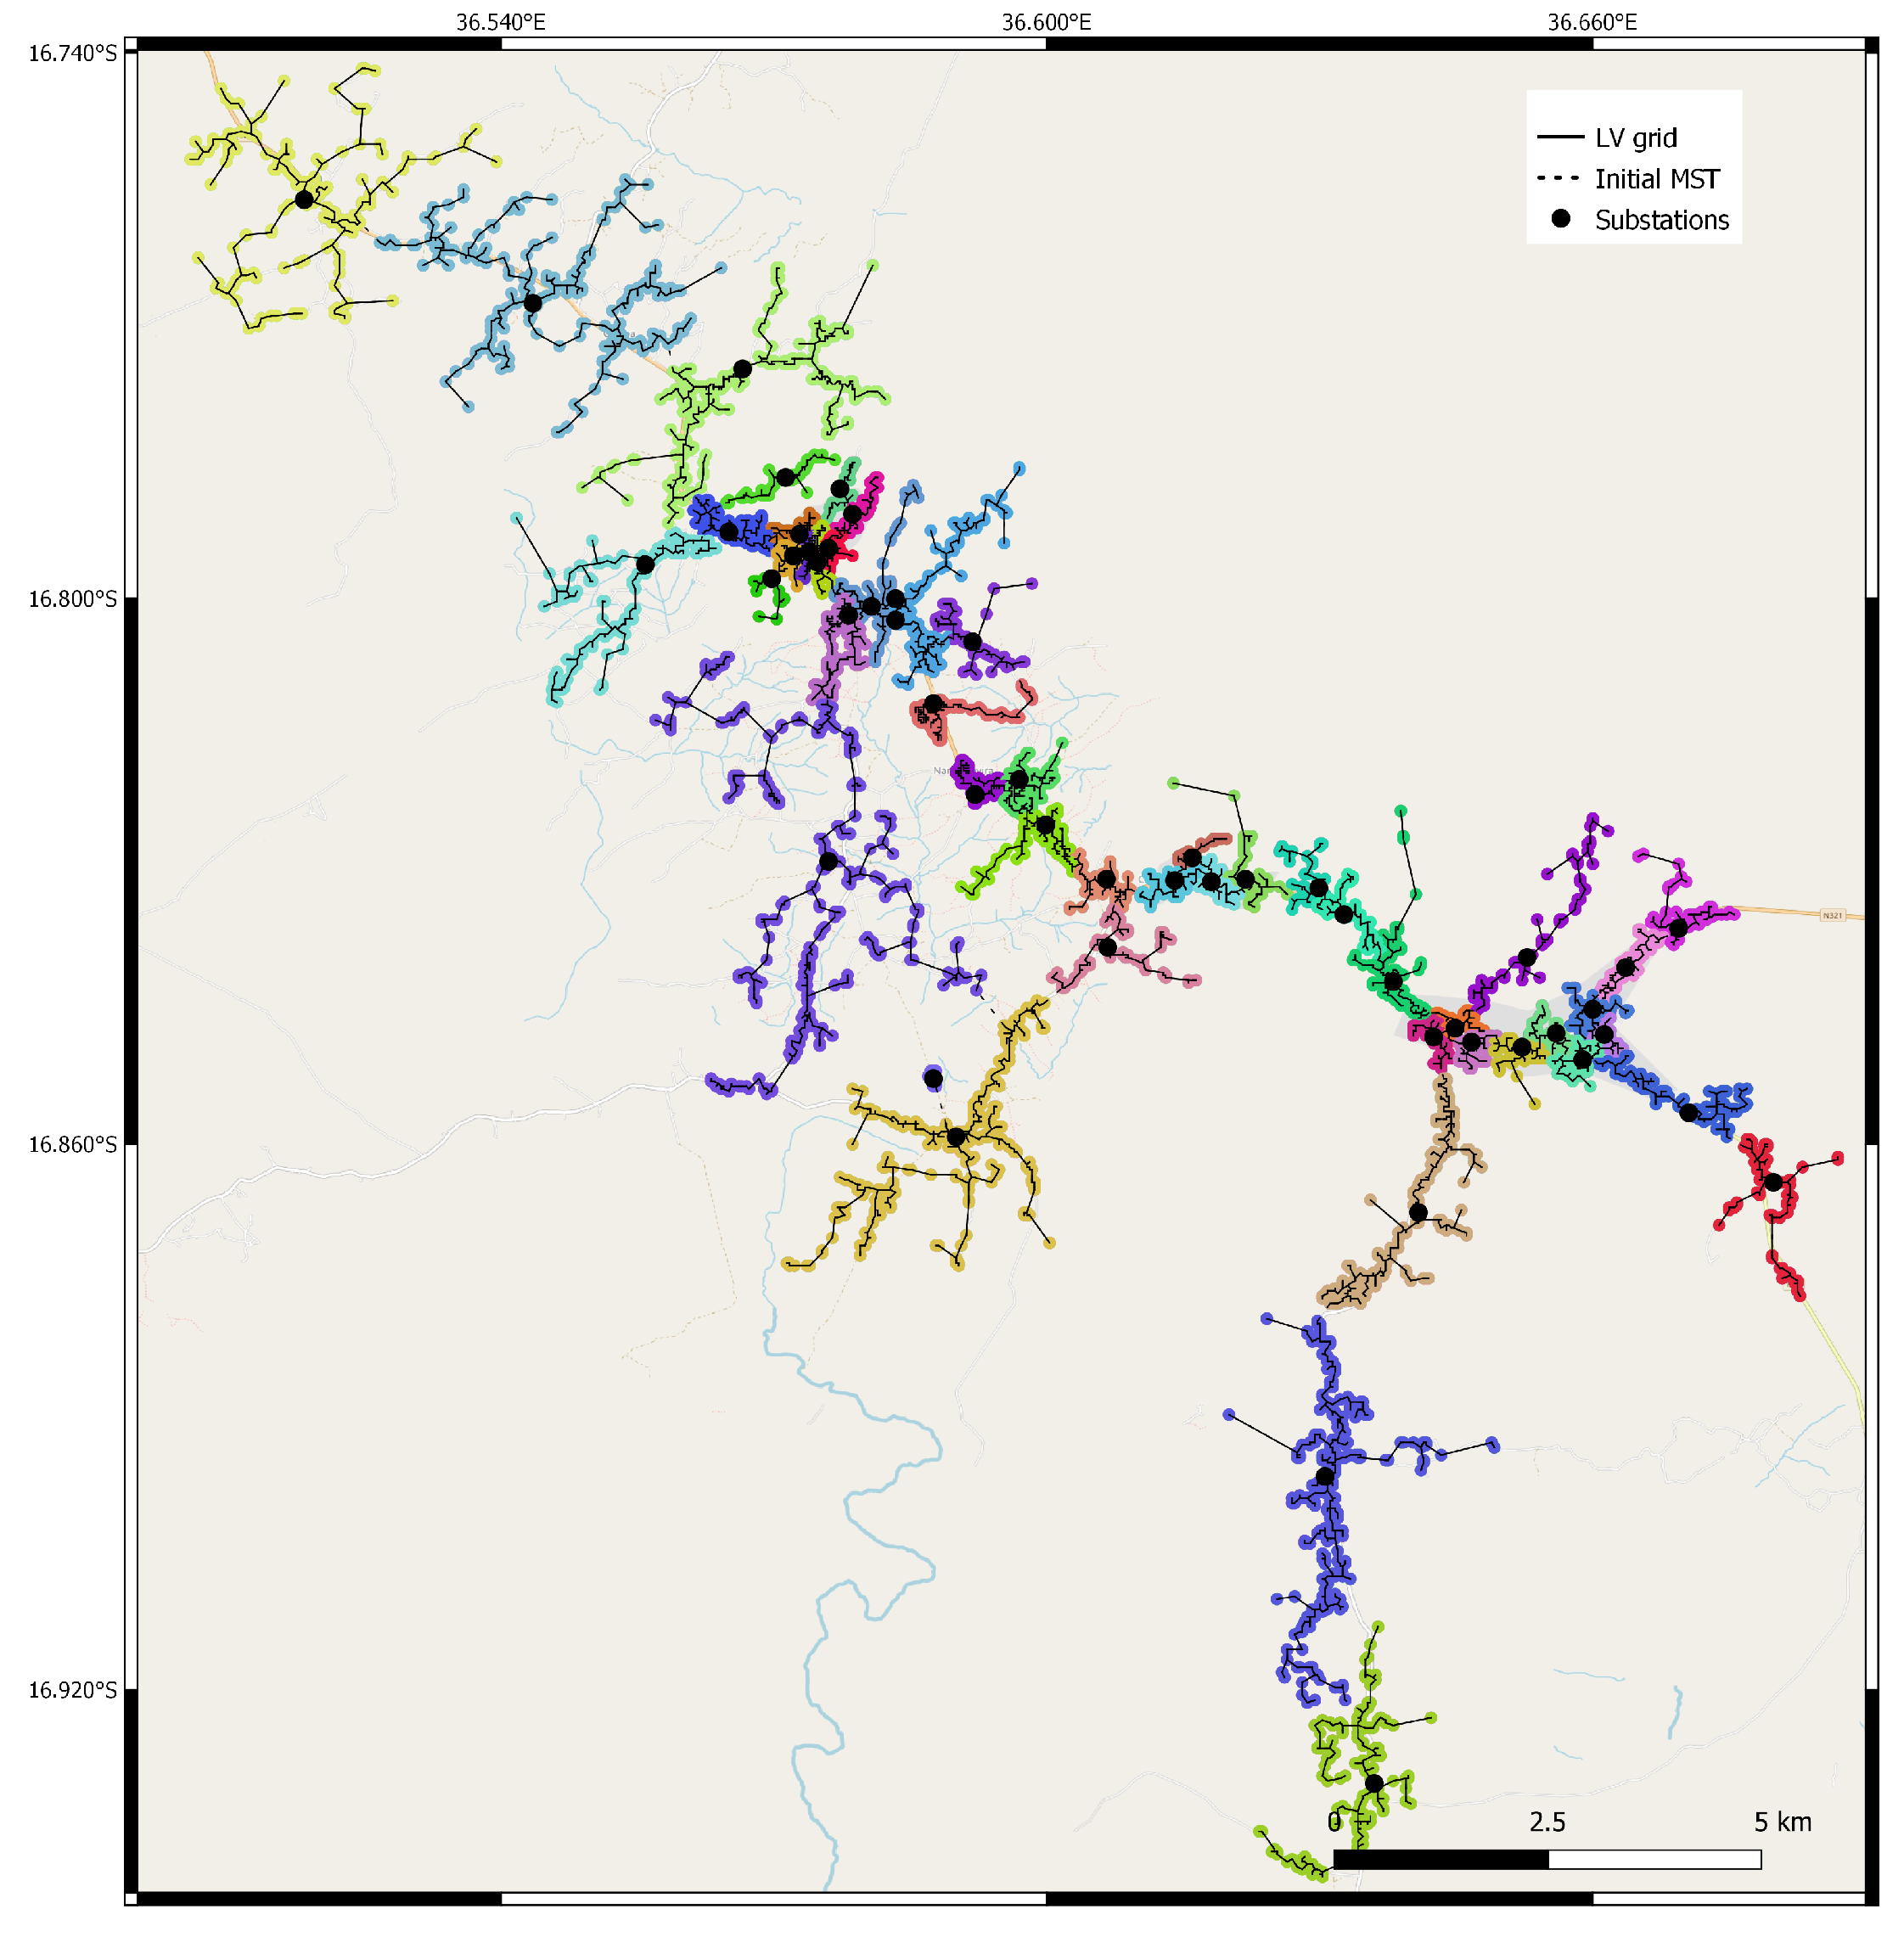
5.1. The LUKES Partitioning Algorithm
- The edge weights of the tree can be adapted to mirror arbitrary, non homogeneous metrics, representing e.g., obstacles or difficult terrain;
- The edges of the underlying tree can be forced to follow preferential paths. A typical example are streets. This makes the method suitable also for clustering tasks in urban areas where the street plan is available, and would influence the actual routing.
5.2. Dataset Preprocessing
5.3. Heuristic Node Reallocation
- Lie on the convex hull;
- Have neighbors (in the original graph) in another cluster.
- The first part includes at least one boundary node;
- the end-user nodes contained in the first part sum to a power under a certain global threshold .
5.4. Substation Placement
5.5. Input Data
6. Case Study
6.1. Mozambique-Namanjavira
6.2. Bolivia-Omereque
7. Results and Discussion
Preliminary Cost Analysis
8. Conclusions
Author Contributions
Funding
Institutional Review Board Statement
Informed Consent Statement
Data Availability Statement
Acknowledgments
Conflicts of Interest
References
- IEA. SDG7: Data and Projections, IEA, Paris. 2020. Available online: https://www.iea.org/reports/sdg7-data-and-projections (accessed on 20 December 2020).
- World Bank, Sustainable Energy for All ( SE4ALL ) Database from the SE4ALL Global Tracking Framework. Available online: https://data.worldbank.org/indicator/EG.ELC.ACCS.ZS (accessed on 20 December 2020).
- Berizzi, A.; Delfanti, M.; Falabretti, D.; Mandelli, S.; Merlo, M. Electrification Processes in Developing Countries: Grid Expansion, Microgrids, and Regulatory Framework. Proc. IEEE 2019, 107, 1981–1994. [Google Scholar] [CrossRef]
- Willis, H.L. Power Distribution Planning Reference Book; CRC Press: Hoboken, NJ, USA, 2004. [Google Scholar]
- Georgilakis, P.S.; Hatziargyriou, N.D. A review of power distribution planning in the modern power systems era: Models, methods and future research. Electr. Power Syst. Res. 2015, 31, 89–100. [Google Scholar] [CrossRef]
- Jordehi, A.R. Optimisation of electric distribution systems: A review. Renew. Sustain. Energy Rev. 2015, 51, 1088–1100. [Google Scholar] [CrossRef]
- Corigliano, S.; Carnovali, T.; Edeme, D.; Merlo, M. Holistic geospatial data-based procedure for electric network design and least-cost energy strategy. Energy Sustain. Dev. 2020, 58, 1–15. [Google Scholar] [CrossRef]
- Hongwei, D.; Yixin, Y.; Chunhua, H.; Chengshan, W.; Shaoyun, G.; Jian, X.; Yi, Z.; Rui, X. Optimal planning of distribution substation locations and sizes - Model and algorithm. Int. J. Electr. Power Energy Syst. 1996, 18, 353–357. [Google Scholar] [CrossRef]
- Sun, D.I.; Farris, D.R.; Cote, P.J.; Shoults, R.R.; Chen, M.S. Optimal distribution substation and primary feeder planning via the fixed charge network formulation. IEEE Trans. Power Appar. Syst. 1982, PAS-101, 602–609. [Google Scholar] [CrossRef]
- El-Kady, M.A. Computer-aided planning of distribution substation and primary feeders. IEEE Trans. Power Appar. Syst. 1984, PAS-103, 1183–1189. [Google Scholar] [CrossRef]
- Lin, W.M.; Tsay, M.T.; Wu, S.W. Application of geographic information system for substation and feeder planning. Int. J. Electr. Power Energy Syst. 1996, 18, 175–183. [Google Scholar] [CrossRef]
- Crawford, D.M. A mathematical optimization technique for locating and sizing dxstribution substations, and deriving their optimal service areas. IEEE Trans. Power Appar. Syst. 1975, PAS-94, 2–7. [Google Scholar]
- Díaz-Dorado, E.; Miguez, E.; Cidrás, J. Design of large rural low-voltage networks using dynamic programming optimization. IEEE Trans. Power Syst. 2001, 16, 898–903. [Google Scholar] [CrossRef]
- Cabrera-Celi, G.C.; Novoa-Guaman, E.G.; Vasquez-Miranda, P.F. Design of secondary circuits of distribution networks using clustering and shortest path algorithms. In Proceedings of the 2017 IEEE PES Innovative Smart Grid Technologies Conference-Latin America (ISGT Latin America), São Paulo, Brazil, 20–22 September 2017; pp. 1–6. [Google Scholar]
- Cossi, A.M.; Romero, R.; Mantovani, J.R.S. Planning and projects of secondary electric power distribution systems. IEEE Trans. Power Syst. 2009, 24, 1599–1608. [Google Scholar] [CrossRef]
- Esmaeeli, M.; Kazemi, A.; Shayanfar, H.A.; Haghifam, M.R. Sizing and placement of distribution substations considering optimal loading of transformers. Int. Trans. Electr. Energy Syst. 2015, 25, 2897–2908. [Google Scholar]
- El-Fouly, T.; Zeineldin, H.; El-Saadany, E.; Salama, M. A new optimization model for distribution substation siting, sizing, and timing. Int. J. Electr. Power Energy Syst. 2008, 30, 308–315. [Google Scholar] [CrossRef]
- Mendoza, J.E.; López, M.E.; Pena, H.E.; Labra, D.A. Low voltage distribution optimization: Site, quantity and size of distribution transformers. Electr. Power Syst. Res. 2012, 91, 52–60. [Google Scholar] [CrossRef]
- Najafi, S.; Gholizadeh, R. On optimal sizing, siting and timing of distribution substations. In Proceedings of the 18th Electric Power Distribution Conference, Kermanshah, Iran, 30 April–1 May 2013; pp. 1–6. [Google Scholar]
- Hasan, I.J.; Gan, C.K.; Shamshiri, M.; Ab Ghani, M.R.; Omar, R.B. Optimum feeder routing and distribution substation placement and sizing using PSO and MST. Indian J. Sci. Technol 2014, 7, 1682–1689. [Google Scholar] [CrossRef]
- Xu, D.; Tian, Y. A comprehensive survey of clustering algorithms. Ann. Data Sci. 2015, 2, 165–193. [Google Scholar] [CrossRef]
- Yu, L.; Shi, D.; Guo, X.; Jiang, Z.; Xu, G.; Jian, G.; Lei, J.; Jing, C. An efficient substation placement and sizing strategy based on GIS using semi-supervised learning. CSEE J. Power Energy Syst. 2018, 4, 371–379. [Google Scholar] [CrossRef]
- González-Sotres, L.; Domingo, C.M.; Sánchez-Miralles, Á.; Miró, M.A. Large-scale MV/LV transformer substation planning considering network costs and flexible area decomposition. IEEE Trans. Power Deliv. 2013, 28, 2245–2253. [Google Scholar]
- Navarro, A.; Rudnick, H. Large-scale distribution planning—Part II: Macro-optimization with voronoi’s diagram and tabu search. IEEE Trans. Power Syst. 2009, 24, 752–758. [Google Scholar] [CrossRef]
- Wang, S.; Lu, Z.; Ge, S.; Wang, C. An improved substation locating and sizing method based on the weighted voronoi diagram and the transportation model. J. Appl. Math. 2014, 9. [Google Scholar] [CrossRef]
- Bhatia, M.; Angelou, N. Beyond Connections: Energy Access Redefined; World Bank: Washington, DC, USA, 2015. [Google Scholar]
- Riva, F.; Ahlborg, H.; Hartvigsson, E.; Pachauri, S.; Colombo, E. Electricity access and rural development: Review of complex socio-economic dynamics and causal diagrams for more appropriate energy modelling. Energy Sustain. Dev. 2018, 43, 203–223. [Google Scholar]
- Riva, F.; Sanvito, F.D.; Tonini, F.T.; Colombo, E.; Colombelli, F. Modelling long-term electricity load demand for rural electrification planning. In Proceedings of the 2019 IEEE Milan PowerTech, Milan, Italy, 23–27 June 2019; pp. 1–6. [Google Scholar]
- Ciller, P.; Lumbreras, S. Electricity for all: The contribution of large-scale planning tools to the energy-access problem. Renew. Sustain. Energy Rev. 2020, 120, 109624. [Google Scholar] [CrossRef]
- Gan, G.; Ma, C.; Wu, J. Data Clustering: Theory, Algorithms, and Applications; SIAM: Philadelphia, PA, USA, 2020. [Google Scholar]
- MacQueen, J. Some methods for classification and analysis of multivariate observations. In Proceedings of the Fifth Berkeley Symposium on Mathematical Statistics and Probability; University of California Press: Oakland, CA, USA, 1967; Volume 1, pp. 281–297. [Google Scholar]
- Kodinariya, T.M.; Makwana, P.R. Review on determining number of Cluster in K-Means Clustering. Int. J. 2013, 1, 90–95. [Google Scholar]
- Chiang, M.M.T.; Mirkin, B. Intelligent choice of the number of clusters in k-means clustering: An experimental study with different cluster spreads. J. Classif. 2010, 27, 3–40. [Google Scholar] [CrossRef]
- Vahedi, S.; Banejad, M.; Assili, M. Optimal location, sizing and allocation of subtransmission substations using K-means algorithm. In Proceedings of the 2015 IEEE Power & Energy Society General Meeting, Denver, Colorado, 26–30 July 2015; pp. 1–5. [Google Scholar]
- Vinothkumar, K.; Selvan, M. Hierarchical agglomerative clustering algorithm method for distributed generation planning. Int. J. Electr. Power Energy Syst. 2014, 56, 259–269. [Google Scholar] [CrossRef]
- Lukes, J.A. Efficient Algorithm for the Partitioning of Trees. IBM J. Res. Dev. 1974, 18, 217–224. [Google Scholar] [CrossRef]
- Graham, R.L.; Hell, P. On the history of the minimum spanning tree problem. Ann. Hist. Comput. 1985, 7, 43–57. [Google Scholar] [CrossRef]
- Facebook Connectivity Lab and Center for International Earth Science Information Network–CIESIN–Columbia University, High Resolution Settlement Layer (HRSL)©2016 DigitalGlobe. 2016. Available online: https://ciesin.columbia.edu/data/hrsl/ (accessed on 21 December 2018).
- Al-Jaafreh, M.A.; Mokryani, G. Planning and operation of LV distribution networks: A comprehensive review. IET Energy Syst. Integr. 2019, 1, 133–146. [Google Scholar] [CrossRef]


| Namanjavira | Omereque | |
|---|---|---|
| N people | 18,920 | 700 |
| Area (km2) | 425 | 465 |
| Population density (pp/km2) People/household | 4 | 5 |
| Average load/household (kW) | 0.4 | 1.5 |
| LV feeders maximum length (m) | 1000 | 600 |
| Transformer nominal power (kW) | 50 | 20 |
| Model | Algorithm | Input Parameters | Value Omereque | Value Namanjavira |
|---|---|---|---|---|
| M1 | Weighted Kmeans | N clusters | 10 | 37 |
| M2 | Weighted Kmeans with post processing | N clusters distance constraint | 10, 600 m | 37, 1000 m |
| M3 | Agglomerative | distance constraint | 1200 m | 2000 m |
| M4 | Lukes | Substation power(cost) | 20(-)/100(3)-50(2.5)-20(2) kW | 50 kW |
| Namanjavira | Omereque | |||||||
|---|---|---|---|---|---|---|---|---|
| M1 | M2 | M3 | M4 | M1 | M2 | M3 | M4 | |
| N clusters | 37 | 100 | 58 | 49 | 10 | 47 | 42 | 12 |
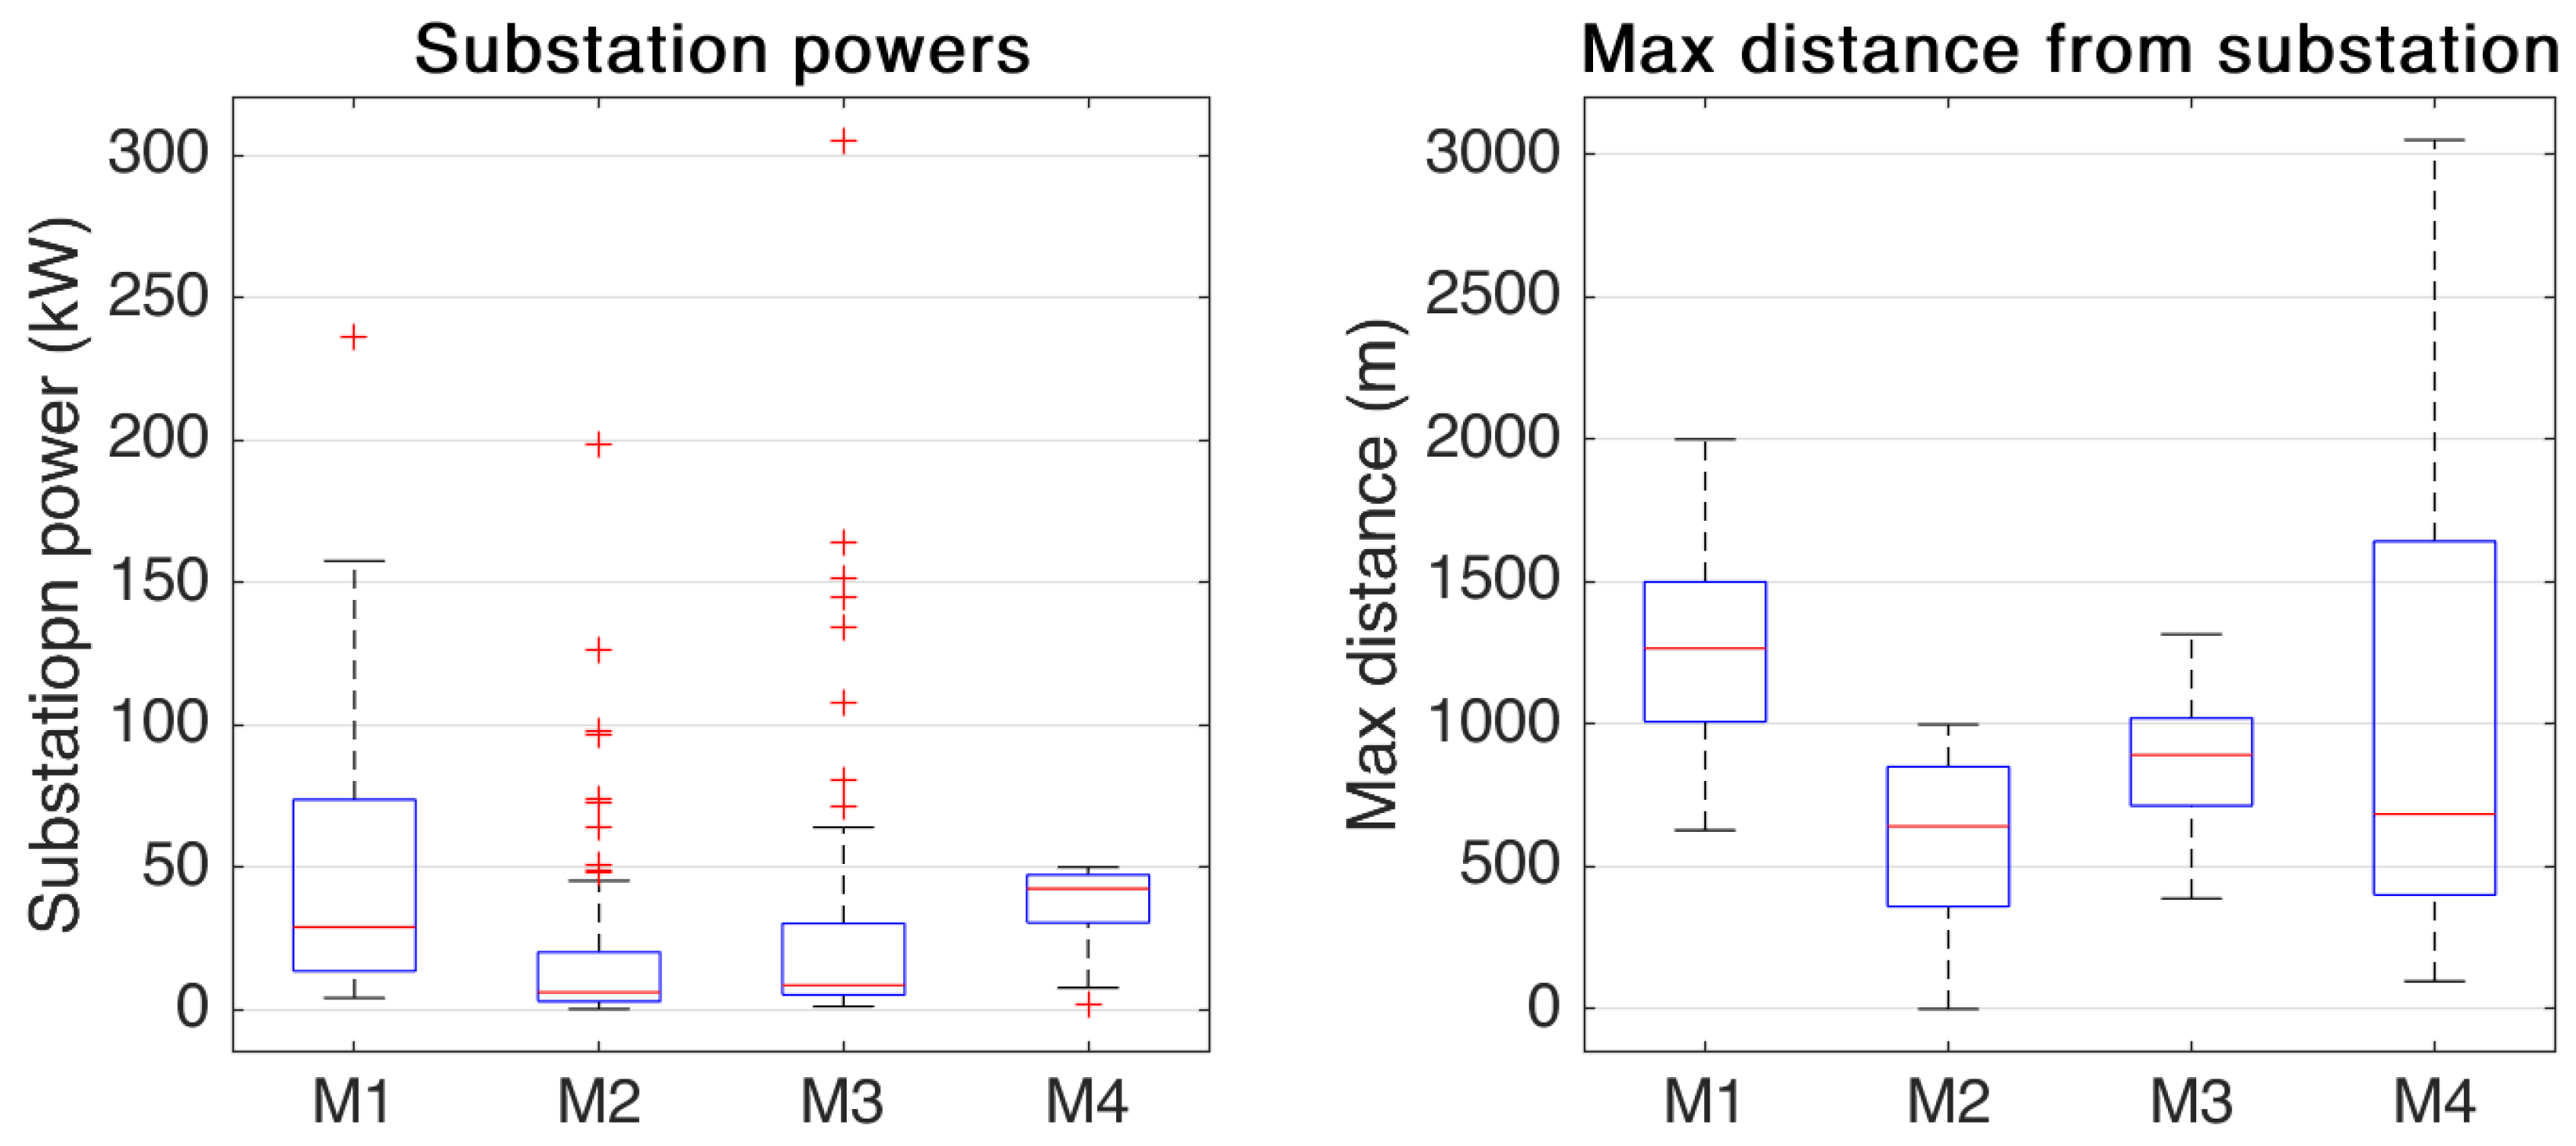
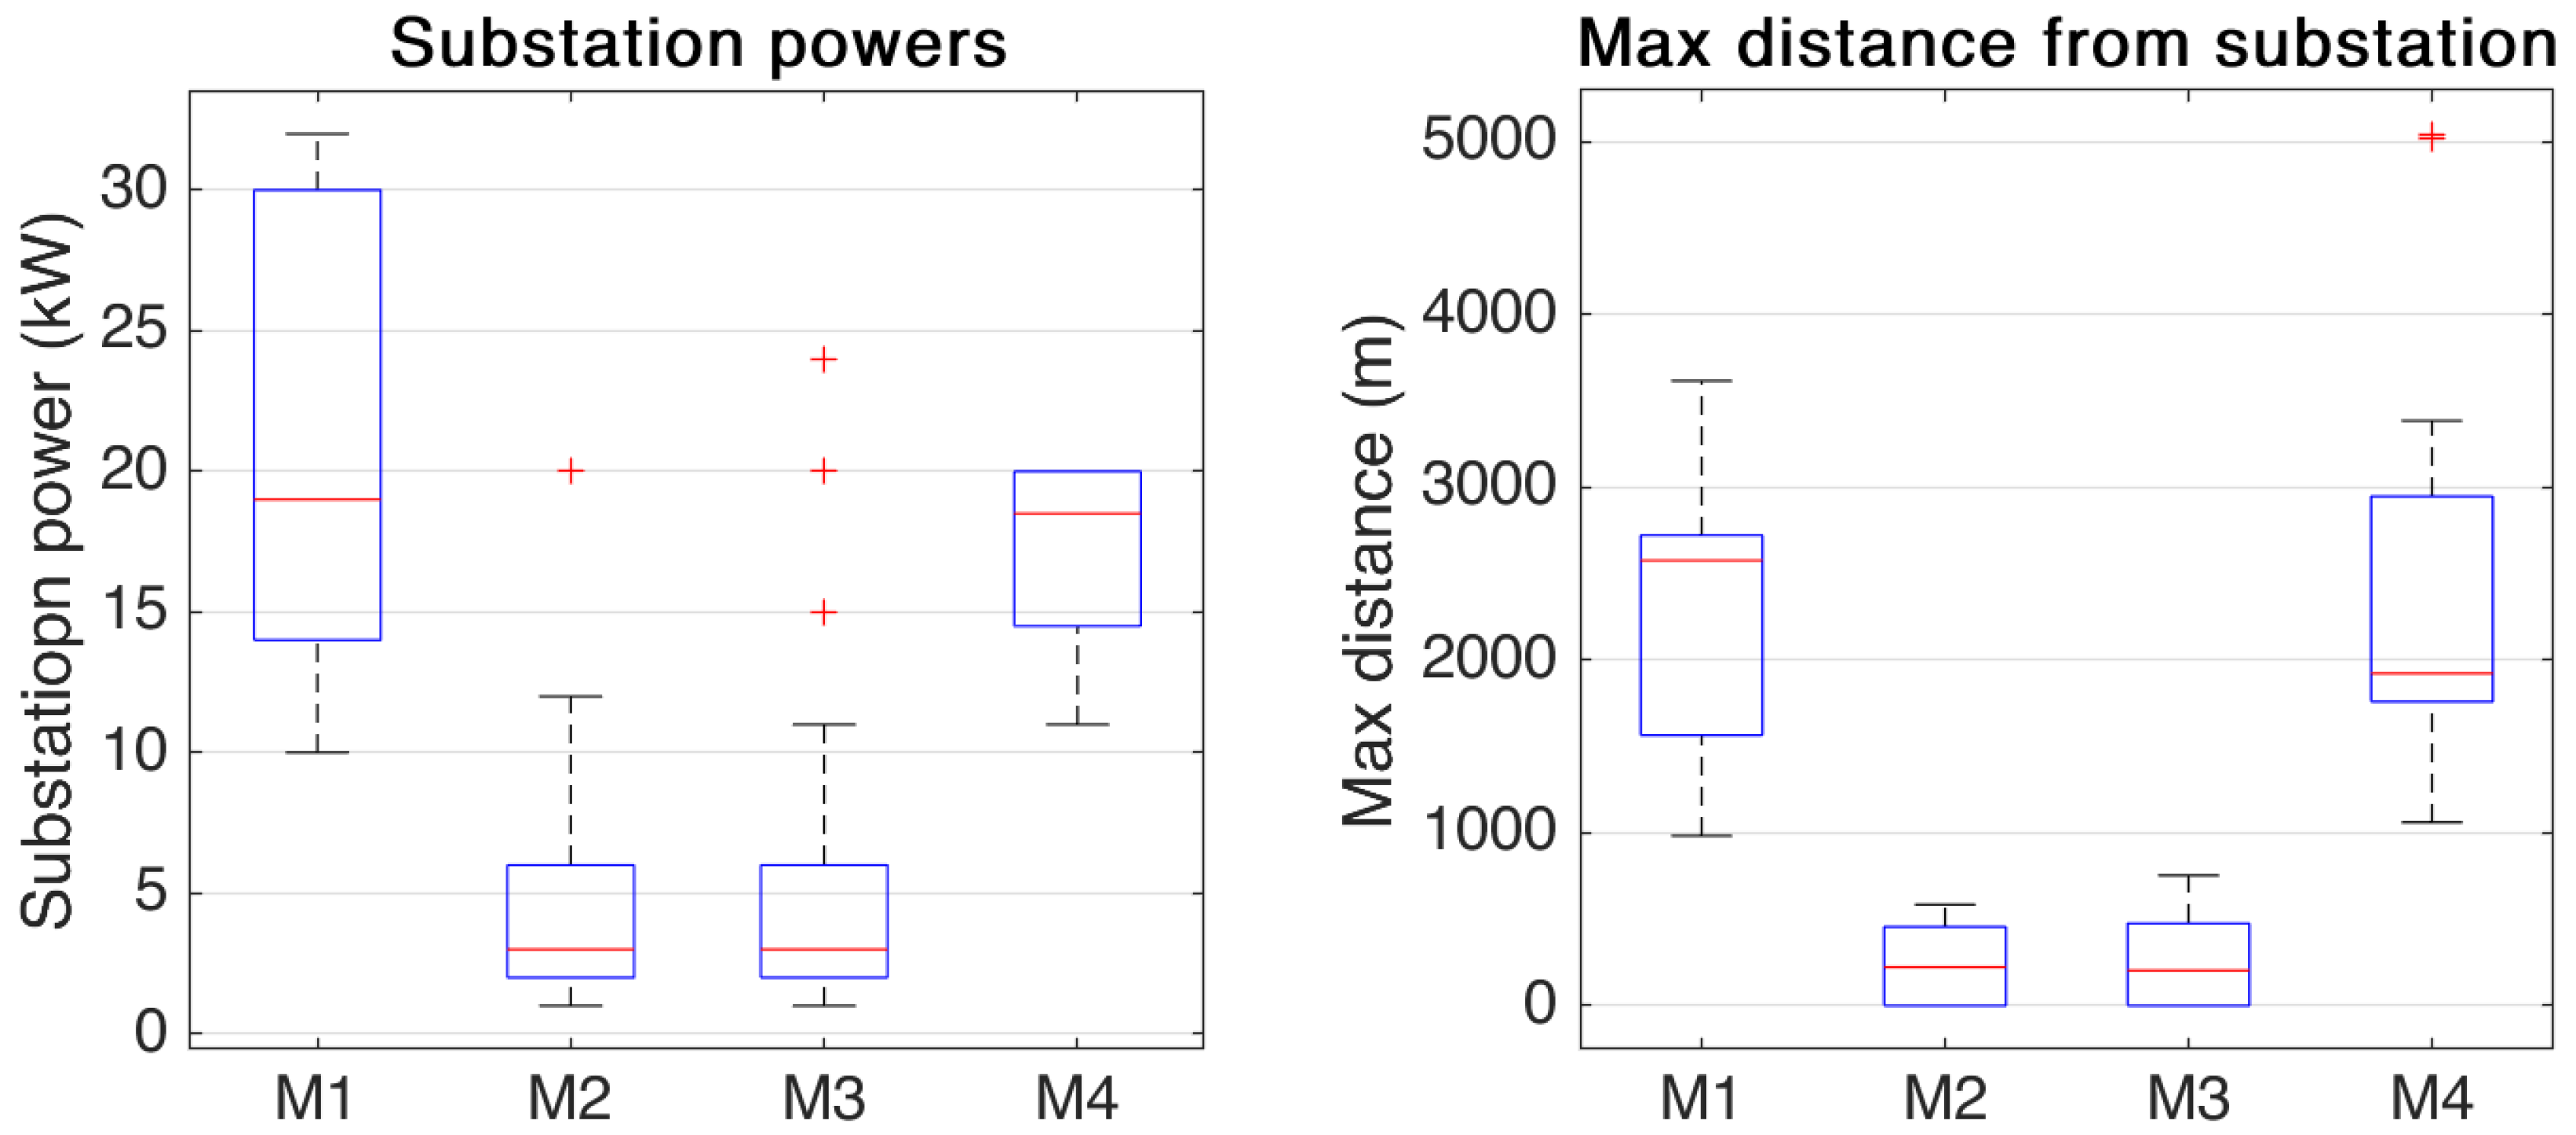
| Max cluster radius (m) | 2000 | 999 | 1316 | 3051 | 3614 | 585 | 754 | 5041 |
| Max cluster power (kW) | 236 | 198 | 305 | 50.0 | 32 | 20 | 24 | 20 |
| Min cluster power (kW) | 4 | 0.1 | 1 | 1.5 | 10 | 1 | 1 | 11 |
| Computational time (s) | 2.46 | 6 | 0.34 | 86,000 | 0.11 | 0.97 | 0.02 | 20 |
| P nom (kVA) | Namanj. Cost (k$) | Omereque Cost (k$) |
|---|---|---|
| 20 | 3.75 | 2.5 |
| 50 | 5.7 | 3.8 |
| 63 | 6.75 | 4.5 |
| 100 | 10.2 | 6.8 |
| 160 | 10.8 | 7.2 |
| 200 | 11.55 | 7.7 |
| 250 | 12.15 | 8.1 |
| 315 | 13.95 | 9.3 |
| Namanjavira | Omereque | |||||||
|---|---|---|---|---|---|---|---|---|
| M1 | M2 | M3 | M4 | M1 | M2 | M3 | M4 | |
| LV feeders length (km) | 281 | 270 | 271 | 262 | 63 | 23 | 24 | 65 |
| N substations (m) | 37 | 100 | 58 | 49 | 10 | 47 | 42 | 12 |
| LV Feeders cost (k$) | 4215 | 4050 | 4065 | 3930 | 378 | 138 | 144 | 394 |
| Substations cost (k$) | 240 | 473 | 309 | 283 | 32 | 119 | 108 | 35 |
| TOT cost (k$) | 4455 | 4523 | 4374 | 4213 | 410 | 257 | 252 | 429 |
Publisher’s Note: MDPI stays neutral with regard to jurisdictional claims in published maps and institutional affiliations. |
© 2021 by the authors. Licensee MDPI, Basel, Switzerland. This article is an open access article distributed under the terms and conditions of the Creative Commons Attribution (CC BY) license (http://creativecommons.org/licenses/by/4.0/).
Share and Cite
Corigliano, S.; Rosato, F.; Ortiz Dominguez, C.; Merlo, M. Clustering Techniques for Secondary Substations Siting. Energies 2021, 14, 1028. https://doi.org/10.3390/en14041028
Corigliano S, Rosato F, Ortiz Dominguez C, Merlo M. Clustering Techniques for Secondary Substations Siting. Energies. 2021; 14(4):1028. https://doi.org/10.3390/en14041028
Chicago/Turabian StyleCorigliano, Silvia, Federico Rosato, Carla Ortiz Dominguez, and Marco Merlo. 2021. "Clustering Techniques for Secondary Substations Siting" Energies 14, no. 4: 1028. https://doi.org/10.3390/en14041028
APA StyleCorigliano, S., Rosato, F., Ortiz Dominguez, C., & Merlo, M. (2021). Clustering Techniques for Secondary Substations Siting. Energies, 14(4), 1028. https://doi.org/10.3390/en14041028