Article

Determination of Zero Dimensional, Apparent Devolatilization Kinetics for Biomass Particles at Suspension Firing Conditions

1
Department of Chemical and Biochemical Engineering, DTU—Technical University of Denmark, Søltofts Plads 229, 2800 Kongens Lyngby, Denmark
2
Department of Energy and Process Engineering, NTNU—Norwegian University of Science and Technology, Kolbjørn Heies Vei 1b, 7491 Trondheim, Norway
*
Author to whom correspondence should be addressed.
Energies 2021, 14(4), 1018; https://doi.org/10.3390/en14041018
Submission received: 24 November 2020 / Revised: 7 February 2021 / Accepted: 9 February 2021 / Published: 15 February 2021
(This article belongs to the Section A: Sustainable Energy)

Abstract

:
As part of the strive for a carbon neutral energy production, biomass combustion has been widely implemented in retrofitted coal burners. Modeling aids substantially in prediction of biomass flame behavior and thus in boiler chamber conditions. In this work, a simple model for devolatilization of biomass at conditions relevant for suspension firing is presented. It employs Arrhenius parameters in a single first order (SFOR) devolatilization reaction, where the effects of kinetics and heat transfer limitations are lumped together. In this way, a biomass particle can be modeled as a zero dimensional, isothermal particle, facilitating computational fluid dynamic calculations of boiler chambers. The zero dimensional model includes the effects of particle aspect ratio, particle density, maximum gas temperature, and particle radius. It is developed using the multivariate data analysis method, partial least squares regression, and is validated against a more rigorous semi-2D devolatilization model. The model has the capability to predict devolatilization time for conditions in the parameter ranges; radius (39–1569 μ m), density (700–1300 kg/m 3 ), gas temperature (1300–1900 K), aspect ratio (1.01–8). Results show that the particle radius and gas phase temperature have a large influence on the devolatilization rate, and the aspect ratio has a comparatively smaller effect, which, however, cannot be neglected. The impact of aspect ratio levels off as it increases. The model is suitable for use as stand alone or as a submodel for biomass particle devolatilization in CFD models.

1. Introduction

An increased awareness of the need for a carbon neutral energy production has led to a corresponding increase in biomass combustion. The world’s primary energy consumption in 2019 amounted to 584 EJ of which coal constituted 27% and renewables (including biofuel) to 5%. In the European Union, the numbers are 69 EJ, 11%, and 11%, respectively [1]. Combustion of biomass can be regarded as a carbon neutral source for energy [2]. Coal releases approximately 93 × 10 6 tons CO 2 /EJ, depending on coal type and origin [3,4]. Byutilizing suspension firing technology in existing coal power plants rebuilt to combust biomass particles, a decrease in carbon emissions can be obtained, which enables the European Union’s Green deal of no net emission of green house gasses by 2050. In combined heat and power plants, up to 90% of the energy stored in woody biomass can be recovered as heat and electricity [2]. Thus, with this aim, the interest in retrofitting suspension firing units to combust biomass instead of coal has increased over the past decades. Suspension firing of biomass is typically done with small particle sizes ( d p = 0.1–3 mm), [5] at high temperatures (T > 1000 K), [6], and at high heating rates (>10 3 –10 5 K/s) [7]. 
In order to predict biomass flame behavior and boiler chamber conditions, modeling of biomass suspension firing is used [8,9]. A reasonably accurate representation of the devolatilization process is crucial in obtaining correct modeling results. Flame characterization and, consequently, flame attachment to the burner quarl in full sized industrial burners is dependent on the time for onset of devolatilization and the amount of volatiles released [8]. A better flame characterization will allow for higher fuel flexibility and plant efficiency. These challenges can be investigated through CFD combustion modeling.
Modeling a suspension firing unit often involves CFD simulations [10]. To avoid too high computational costs, subprocesses in the particle combustion modeling in CFD require simplifications. Coal particles have historically been modeled as isothermal in CFD combustion simulations, and this approach has sometimes been extended to also include modeling of biomass pyrolysis [11,12,13]. However, model work validated against experimental data [14,15] shows that biomass particles at sizes and temperatures relevant for suspension firing cannot be regarded as thermally thin, i.e., isothermal. Some thermally thick particle conversion models exists in CFD focusing on efficient use of computational power [16,17], which with some limitations adequately predicts biomass devolatilization at fluidized and fixed bed conditions. More complicated particle models are not feasible in CFD for industrial modeling purposes, due to high computational costs [9].
Simplified devolatilization models [9,15,18], which account for the complicated process of biomass devolatilization in a simple lumped fashion, have previously been presented. In these isothermal models, apparent devolatilization kinetic parameters have included heat transfer limitations, which were not otherwise included. None of the models, however, take the effect of biomass density, gas temperature, or particle morphology into account. These are important properties, influencing flame stability and onset of devolatilization.
To compromise between the need for a simple devolatilization model and the need for describing the complicated phenomenon of biomass particle pyrolysis, this paper introduces lumped Arrhenius kinetic parameters for a single first order global pyrolysis model. The parameters of a zero dimensional, isothermal model are found by fitting to predictions of a semi-two dimensional model [19] that previously has been validated against experimental data. The comparison is done for different gas temperatures, particle sizes, particle aspect ratios, and densities. The combined effect of these experimental properties on the Arrhenius parameters is quantified using the multivariate data analysis method, partial least squares regression (PLS). To the knowledge of the authors, no experimental data valid for suspension firing of woody biomass exist, which has not been used in the development of the semi-two dimensional model. Thus, the present model is not directly evaluated further against experimental data.

2. Method and Model Description

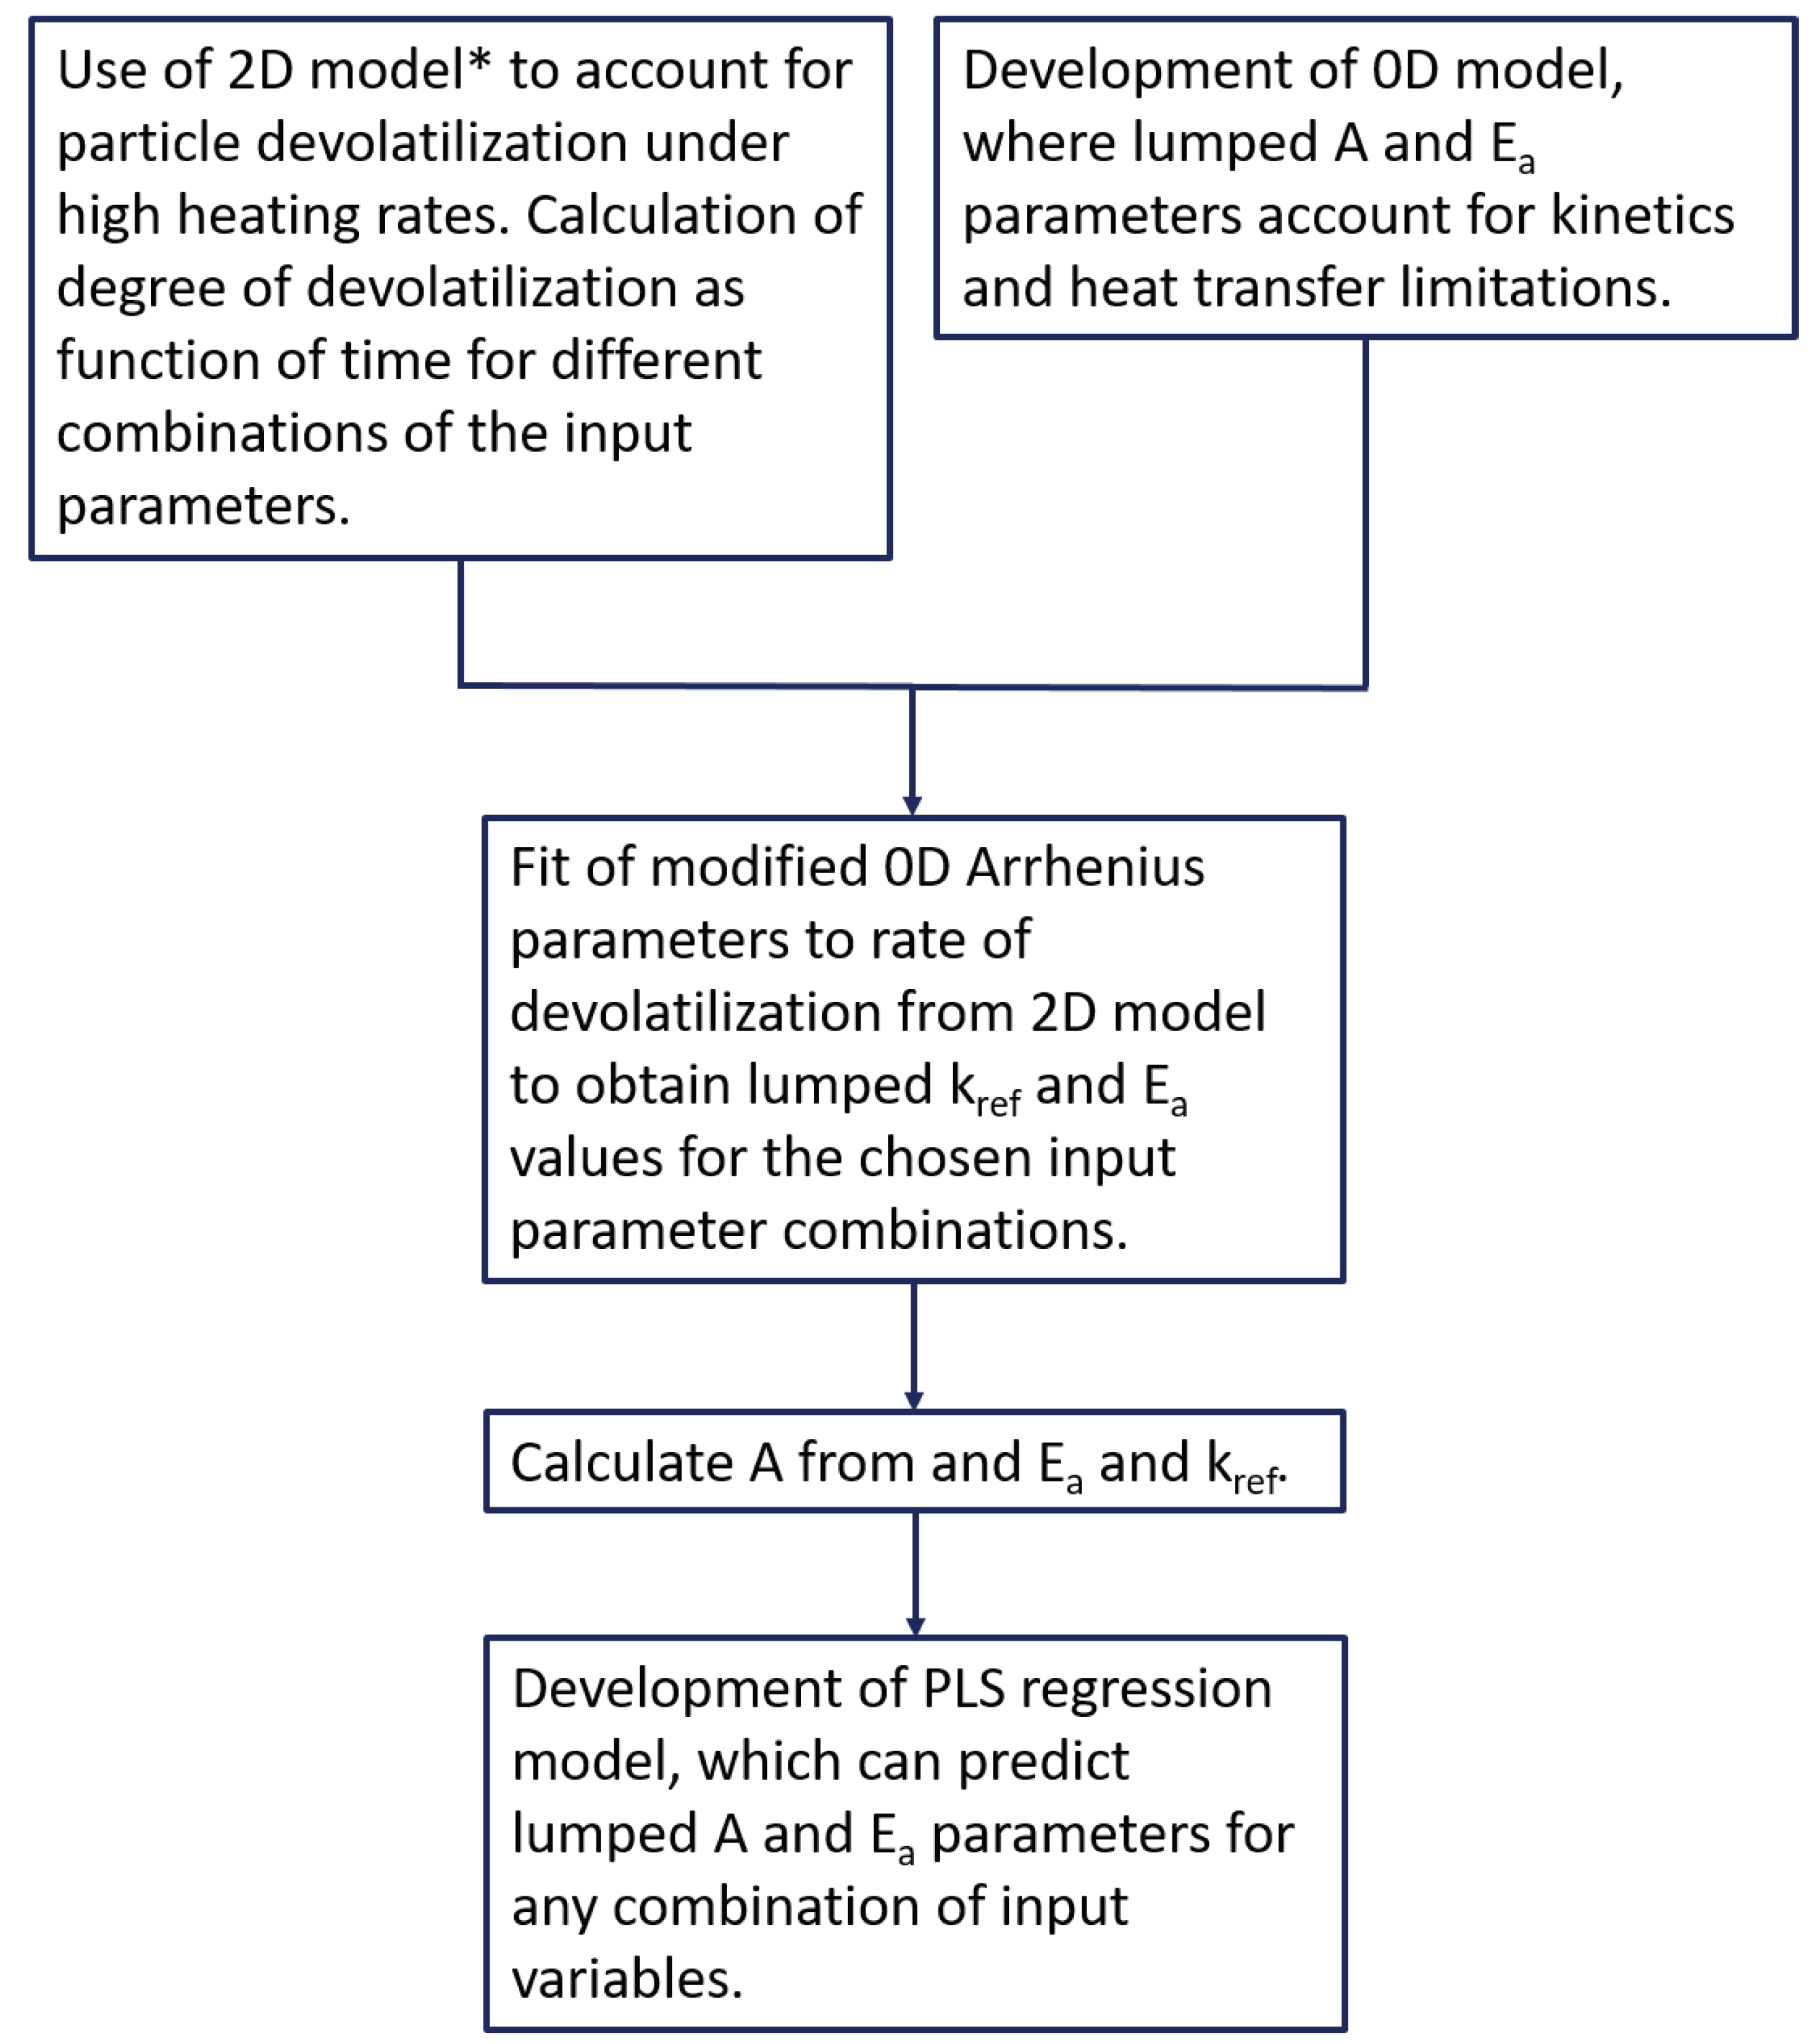
The model development process is done in two parallel tracks, which are subsequently compared and used for final model determination. An overview can be seen in Figure 1. In a previously published paper, a rigorous semi-2D model was developed [19]. In this paper, a 0D model is set up. Subsequently the lumped 0D Arrhenius parameters, A and E, which provide the best agreement between the 0D and the semi-2D model for a range of selected cases are determined. Then, a PLS model is established, which calculates the lumped Arrhenius parameters from particle radius, aspect ratio, particle density, and maximum gas temperature. The model development process is described in more detail in the subsequent sections.

2.1. The Semi-Two Dimensional Model

The semi-two dimensional model is described in detail elsewhere [19,20,21], and only a short introduction will be given here. The model was first presented for devolatilization at medium heating rates by Thunman et al. [20], and subsequently developed further by Ström and Thunman [21]. It was recently adapted to account for biomass devolatilized under suspension firing conditions by Leth-Espensen et al. [19]. The model is a shell model capable of describing both cylindrical and spherical geometries. The cylinder is the preferred simple geometry to model biomass particles, [22] whereas coal particles tend to be almost spherical in nature. The cylindrical model takes changes during devolatilization in both radius and length into account using one variable only. The decrease in particle length is assumed comparable to the decrease in radius, thus particle shrinking is described only by the radius. Overall, the cylindrical model accounts for the internal temperature gradient, the volume, and surface area in two dimensions, whereas the heat transfer is solved in a one dimensional manner. The spherical model is one dimensional. Regardless of the shape, in the model, the particle is divided into three concentric shells. The innermost layer consists of moist biomass, the middle layer is dry biomass, and the outer layer is char. The shells move inwards during the devolatilization, transforming the model particle from consisting of practically only a moist shell in the beginning to be all char after full devolatilization. The model accounts for intraparticle heat and mass transfer.

2.2. The Zero Dimensional Model

The 0D model is based on the following assumptions:
  • The particle is isothermal.
  • The particle has constant density (shrinking particle).
  • The particle is dry.
  • The particle is spherical.
  • The initial particle diameter, R, is defined as the initial cylinder diameter, according to recommendations in [19].
  • The devolatilization enthalpy is assumed to be 0.
  • Both the influences of kinetics and heat transfer are described by a single first order reaction model.
  • The wall radiation temperature is defined as T w = T g − 200 K.
The devolatilization process in the isothermal particle is modeled as a global reaction, using the single first order reaction (SFOR) model, described in Equation (1) [23].
d Y d t = k ( Y * Y )
Here, t is the time, Y is the fraction of volatiles released, Y * is the fraction of volatiles present in the particle at t = 0, and k is an Arrhenius reaction rate constant given in Equation (2).
k = A × e x p E R g T
R g is the gas constant, T is the particle temperature, and A and E are the Arrhenius pre-exponential factor and activation energy, respectively. The temperature in the particle is uniform and determined by the radiation and convective heat transfer and is given in Equation (3).
d T d t = 1 ρ C p 3 R σ ϵ ( T w 4 T 4 ) + h ( T g T )
Here, ρ is the density, C p is the specific heat capacity of the fuel, R is the particle radius, σ is the Stefan–Boltzmann constant, ϵ is the emissivity, T w is the radiation temperature (reactor wall temperature), and h is the heat transfer coefficient. Expressions for the model input parameters are given in Table 1. The two coupled differential equations are solved using the ode45 solver in Matlab®.

2.3. Fitting the Arrhenius Parameters

In order to approximate the semi-2D model with a 0D model, the Arrhenius equation must account both for the rate of the kinetics and for any heat transfer limitations in a given particle. The apparent kinetic parameters are obtained by fitting the Arrhenius equation. The pre-exponential factor, A, and the activation energy, E, in the Arrhenius equation are coupled, though, so the procedure suggested by Rawlings and Ekerdt [30] is used here. In order to minimize the correlation between the fitted parameters, a modified Arrhenius equation, as seen in Equation (4), has been used.
k ( T ) = k ( T r e f ) × e x p E R g 1 T 1 T r e f
k ( T r e f ) is the rate constant at a reference temperature, here 1600 K, the midpoint in the temperature interval. k ( T r e f ) and E are fitted to the result from the semi-2D devolatilization model using the lsqcurvefit command in Matlab®, which works by minimizing the residual sum of squares between the model results from the semi-2D model and the 0D model. The residual sum of squares is given in Equation (5). The value of A can be calculated from k ( T r e f ) and E.
R S S = t = 0 t e n d ( y 2 D y 0 D ) 2
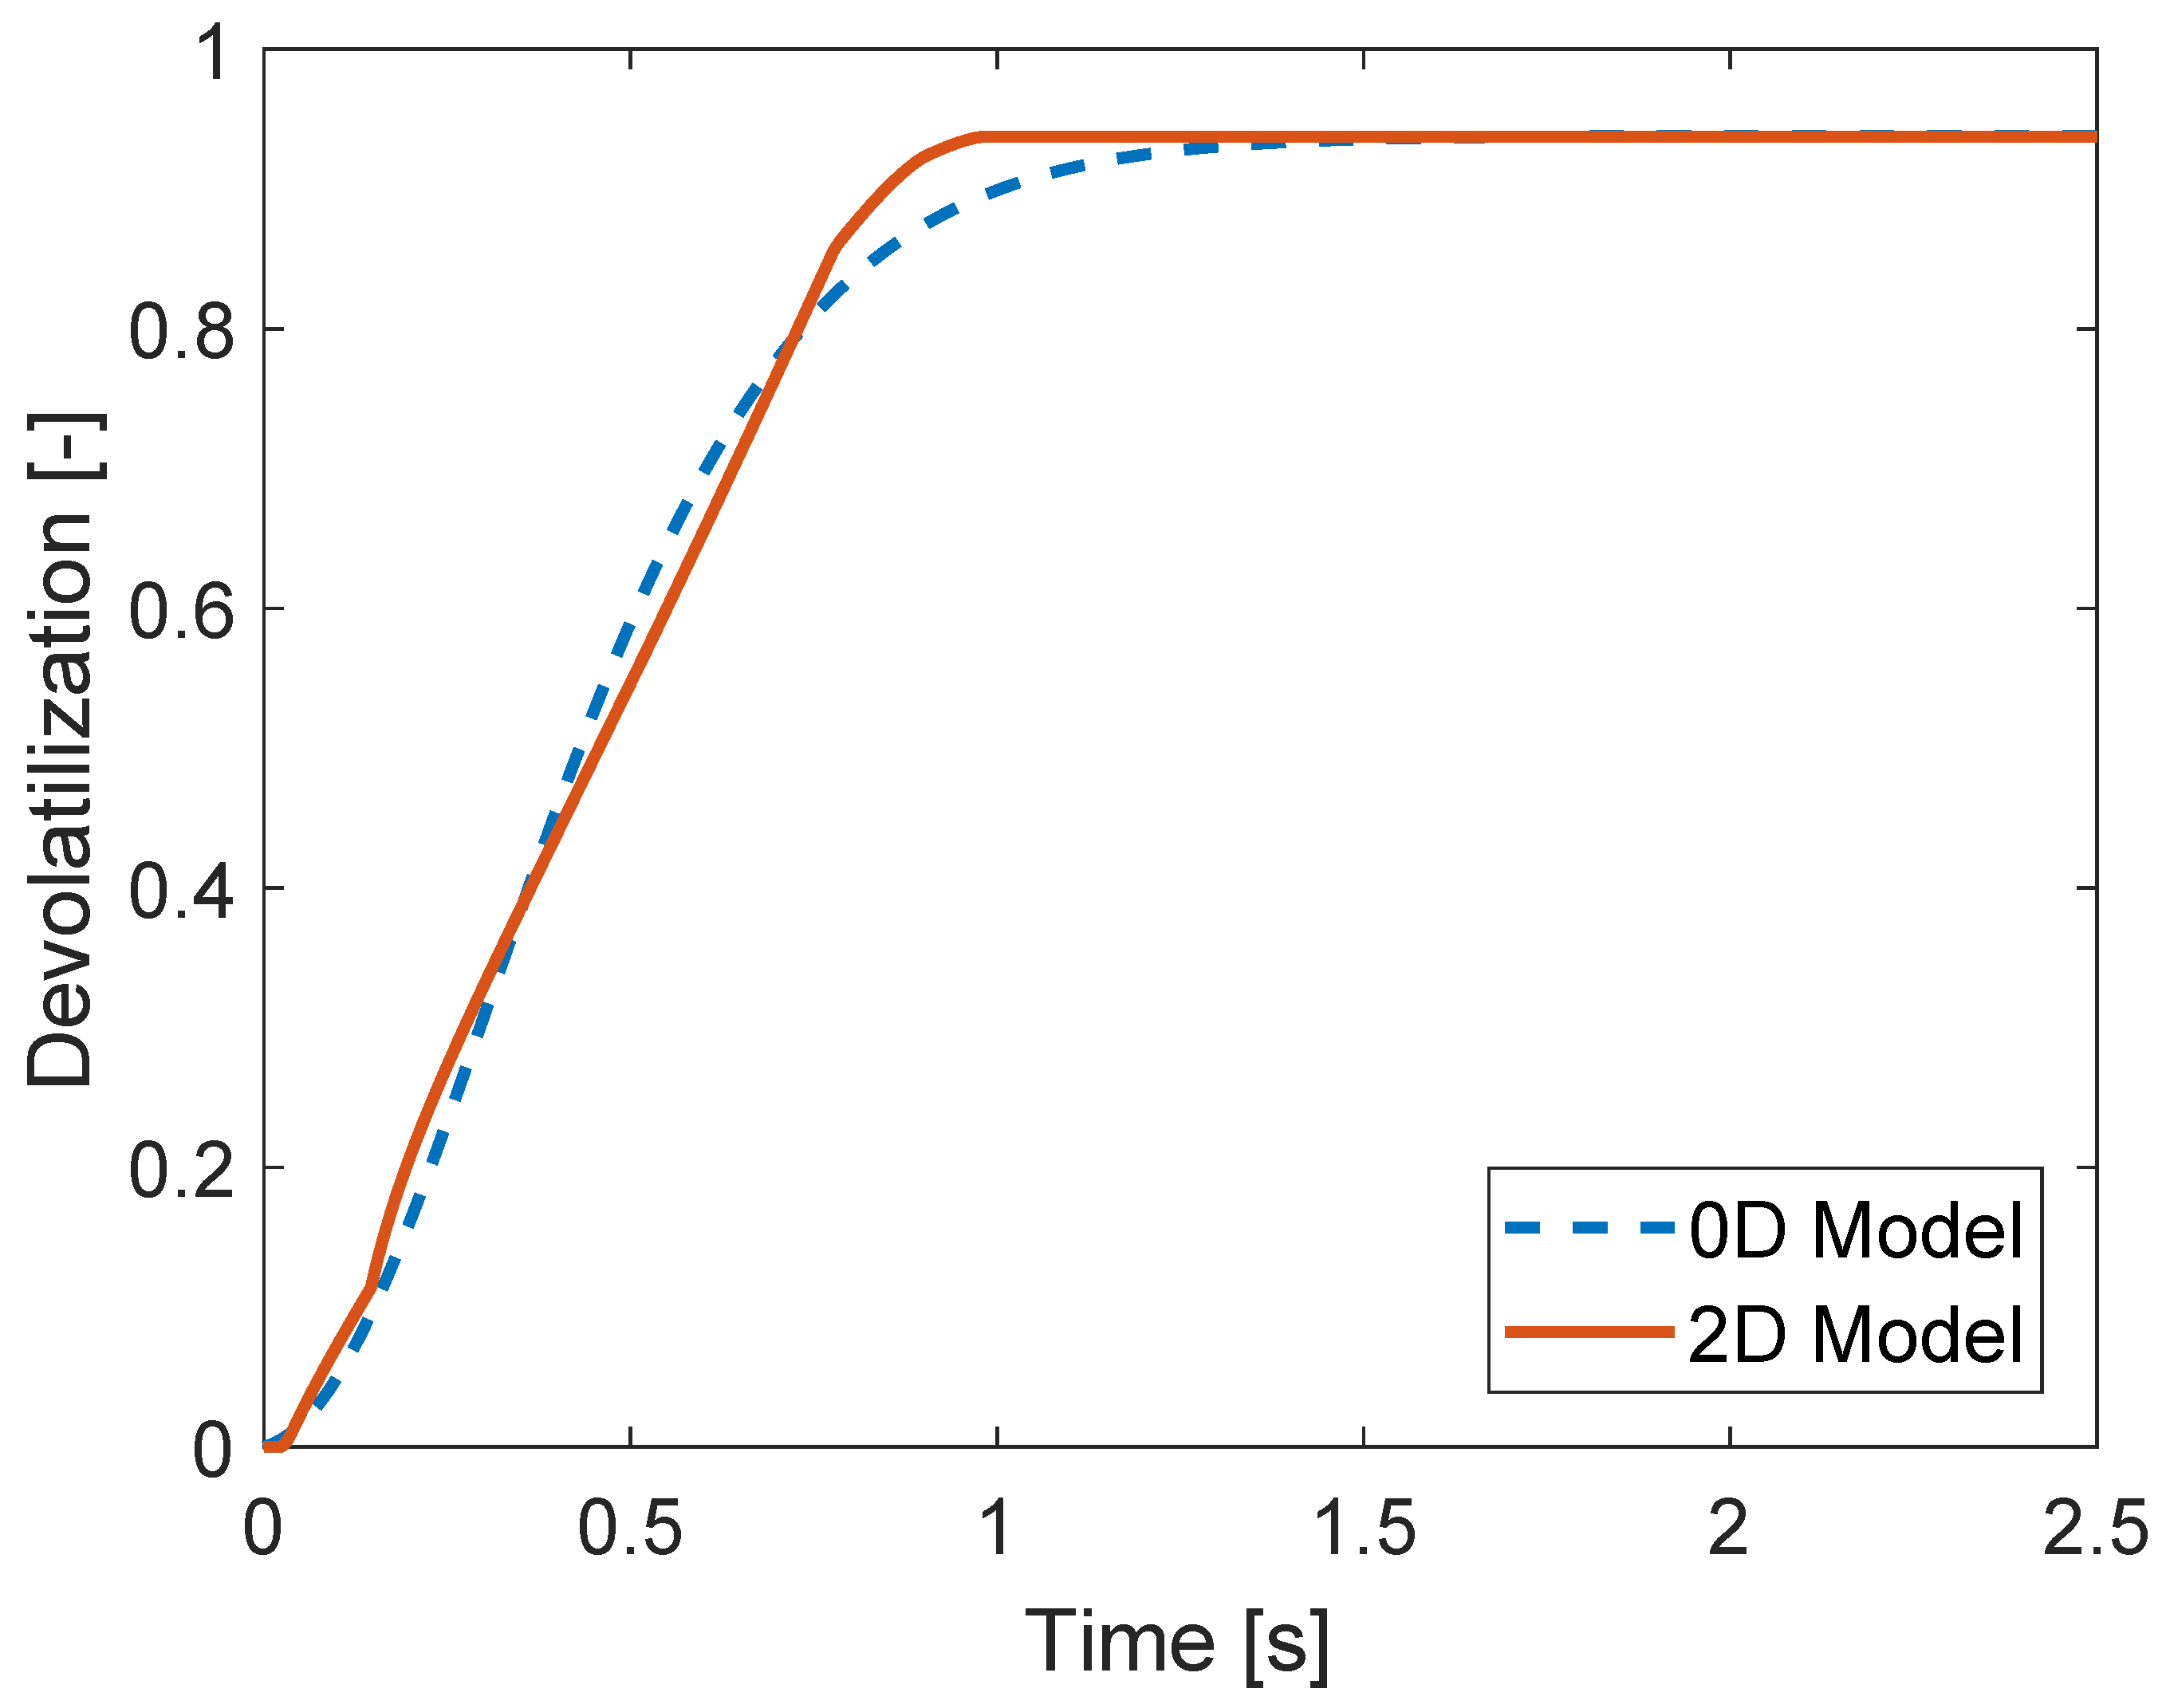
An example of a fitted curve and the semi-2D cylindrical model output can be seen in Figure 2.

2.4. Chemometrics

Chemometrics is a statistical approach to extract data from chemical or biological data sets. A common method within chemometrics is partial least squares regression (PLS) [31,32]. In PLS, a correlation between a matrix of input variables (X) and an output variable (Y) is determined. PLS is a linear regression method. An in depth description of PLS is beyond the scope of this manuscript, but can be found elsewhere [31,32,33,34]. The PLS models presented here are calculated in PLS Toolbox version 8.1.1 and Matlab version 9.3.0 (R2017b).

2.4.1. Parameter Definition

The input parameters tested for the calculation of A and E in the 0D model are particle radius, particle density, gas temperature, and particle aspect ratio, as they have previously [10,24,35] been shown to influence the devolatilization process. The applied parameter spans for each variable can be seen in Table 2. They cover the parameter variations relevant for biomass suspension firing conditions. A total of 35 simulations with the semi-2D model have been made to span the parameter space. The applied parameter values for each simulation can be seen in the 
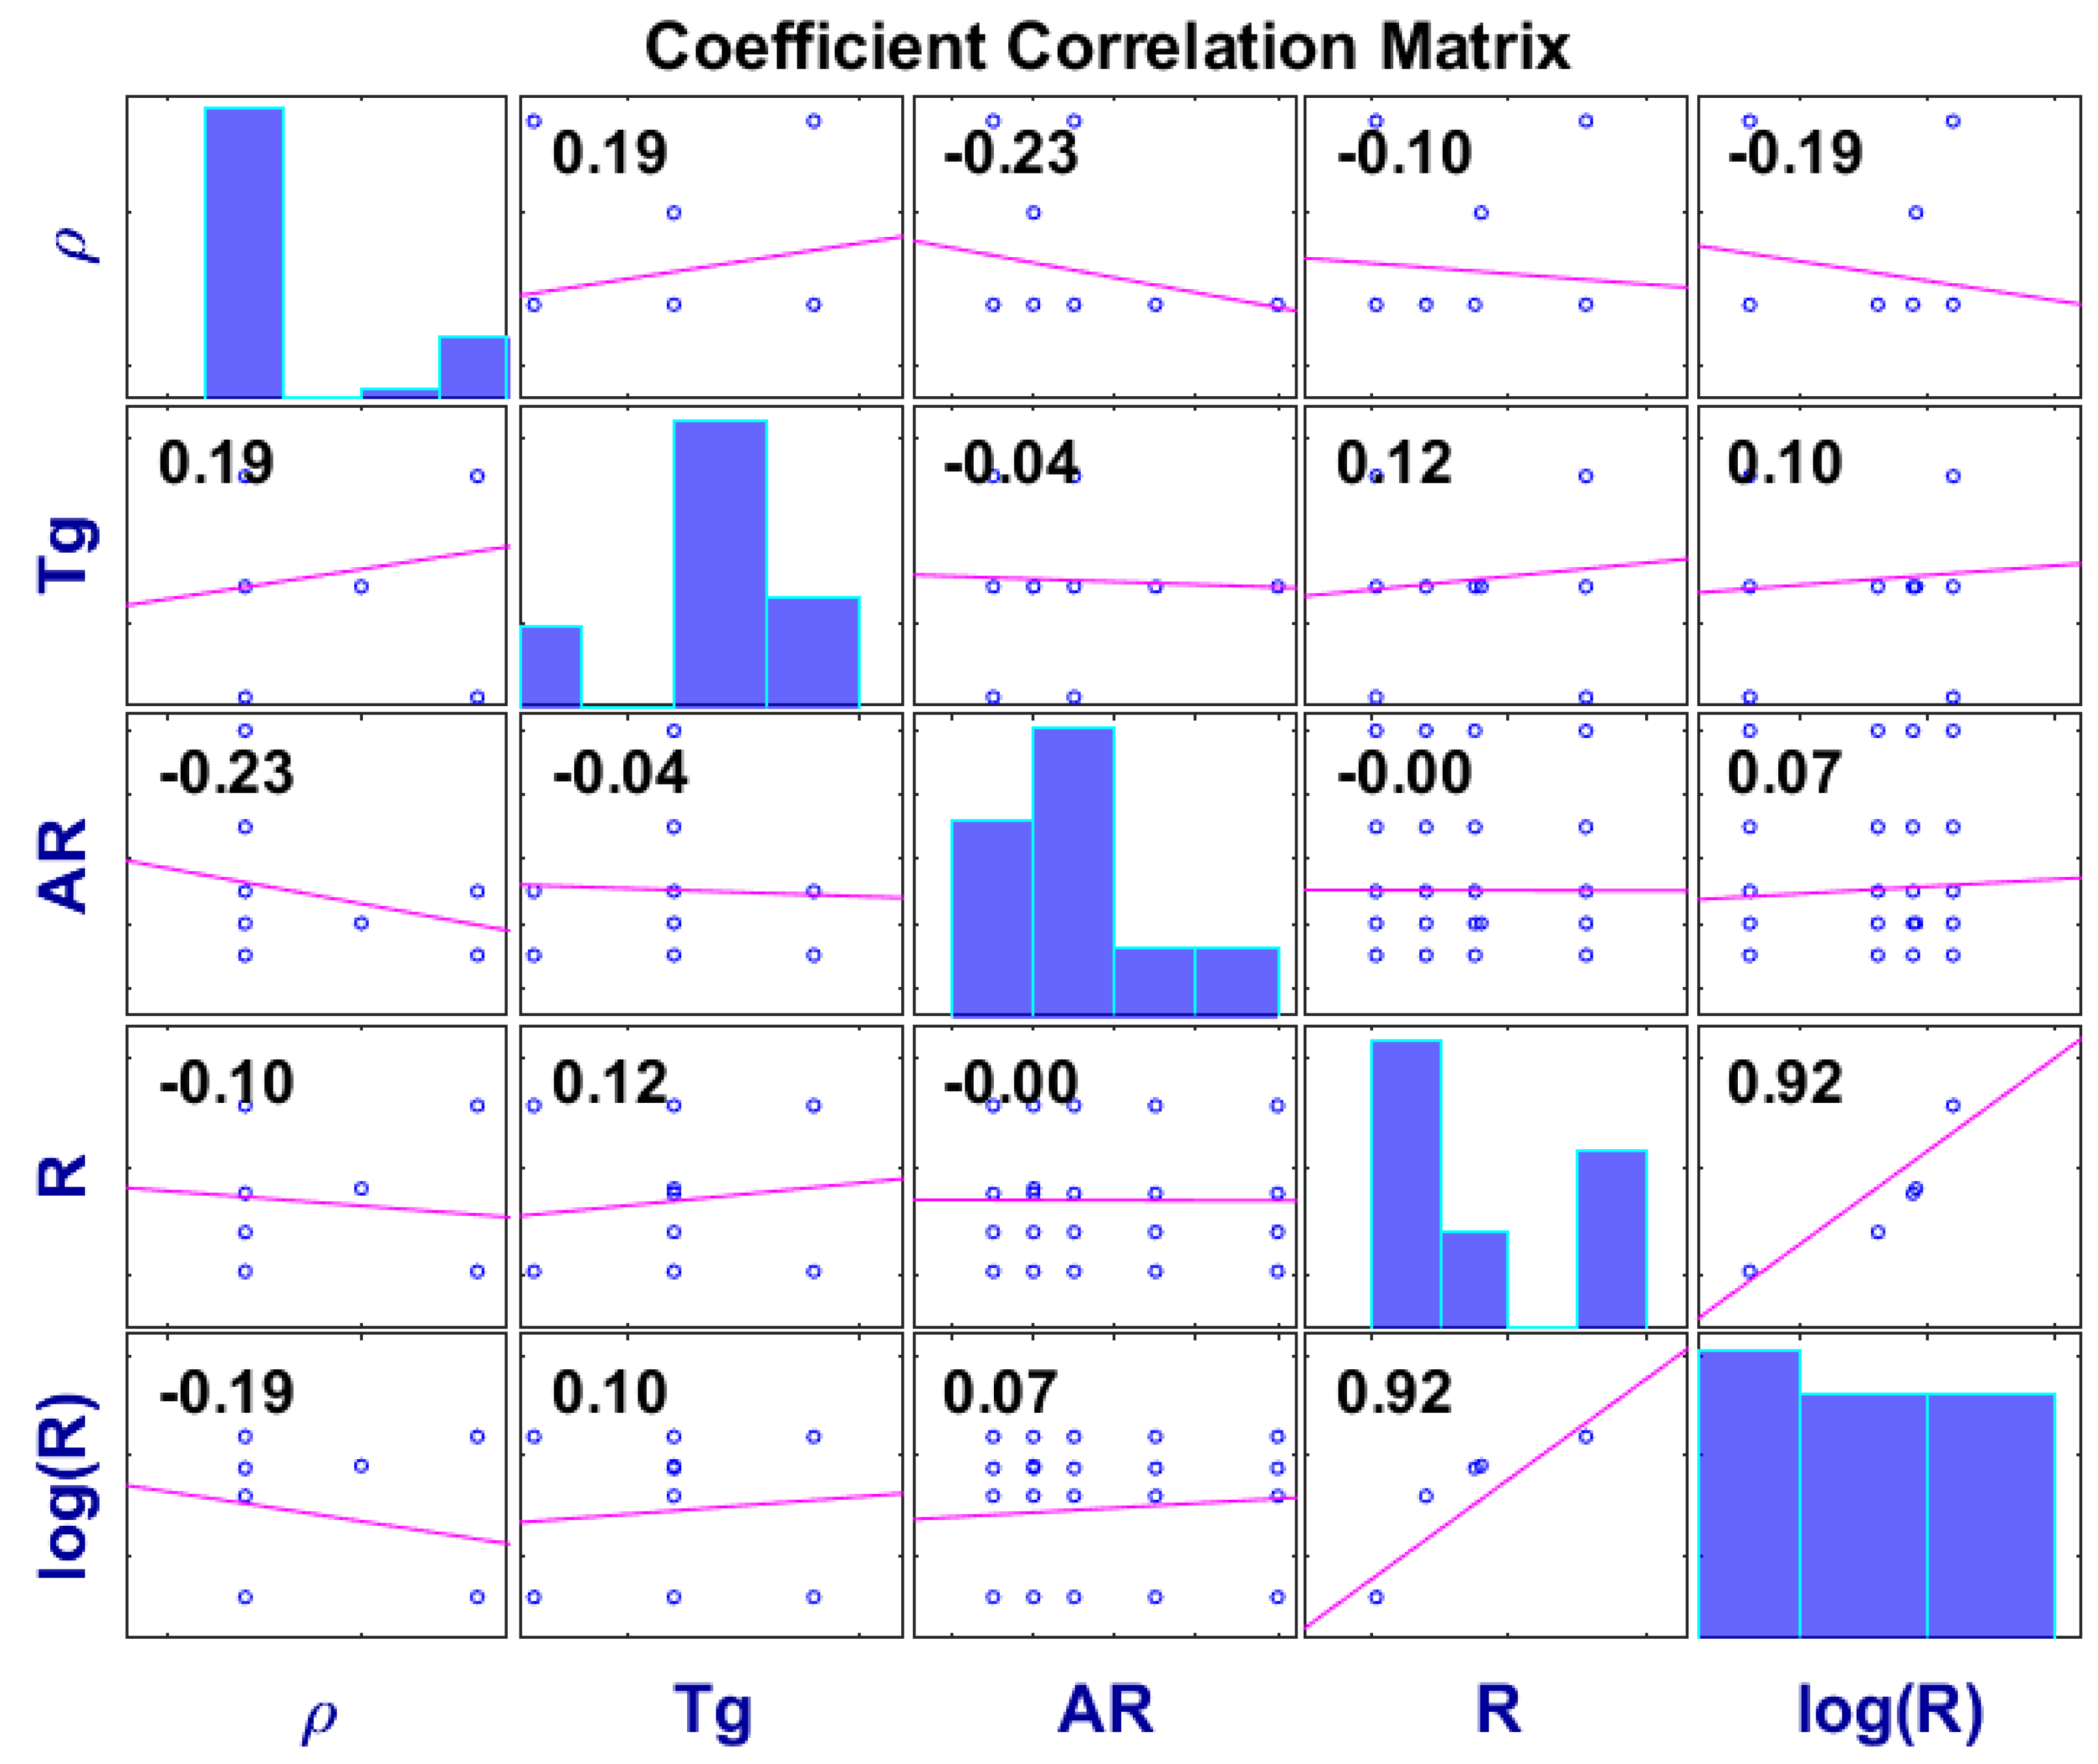
Appendix A. To show the correlation (negative or positive) between input parameters, the correlation coefficient chart is made. It is shown in Figure 3. The higher the absolute value in the correlation coefficient matrix, the higher degree of correlation between two input parameters. When the degree of correlation is high, the effect of each input parameter cannot be separated due to confounding. Here the degree of correlation is numerically low (≤0.23), which means the influences on the model results can largely be ascribed to each individual input parameter.

2.4.2. Preprocessing

Preprocessing is an important step in PLS, and the individual preprocessing methods tested can be seen in Table 3 and 
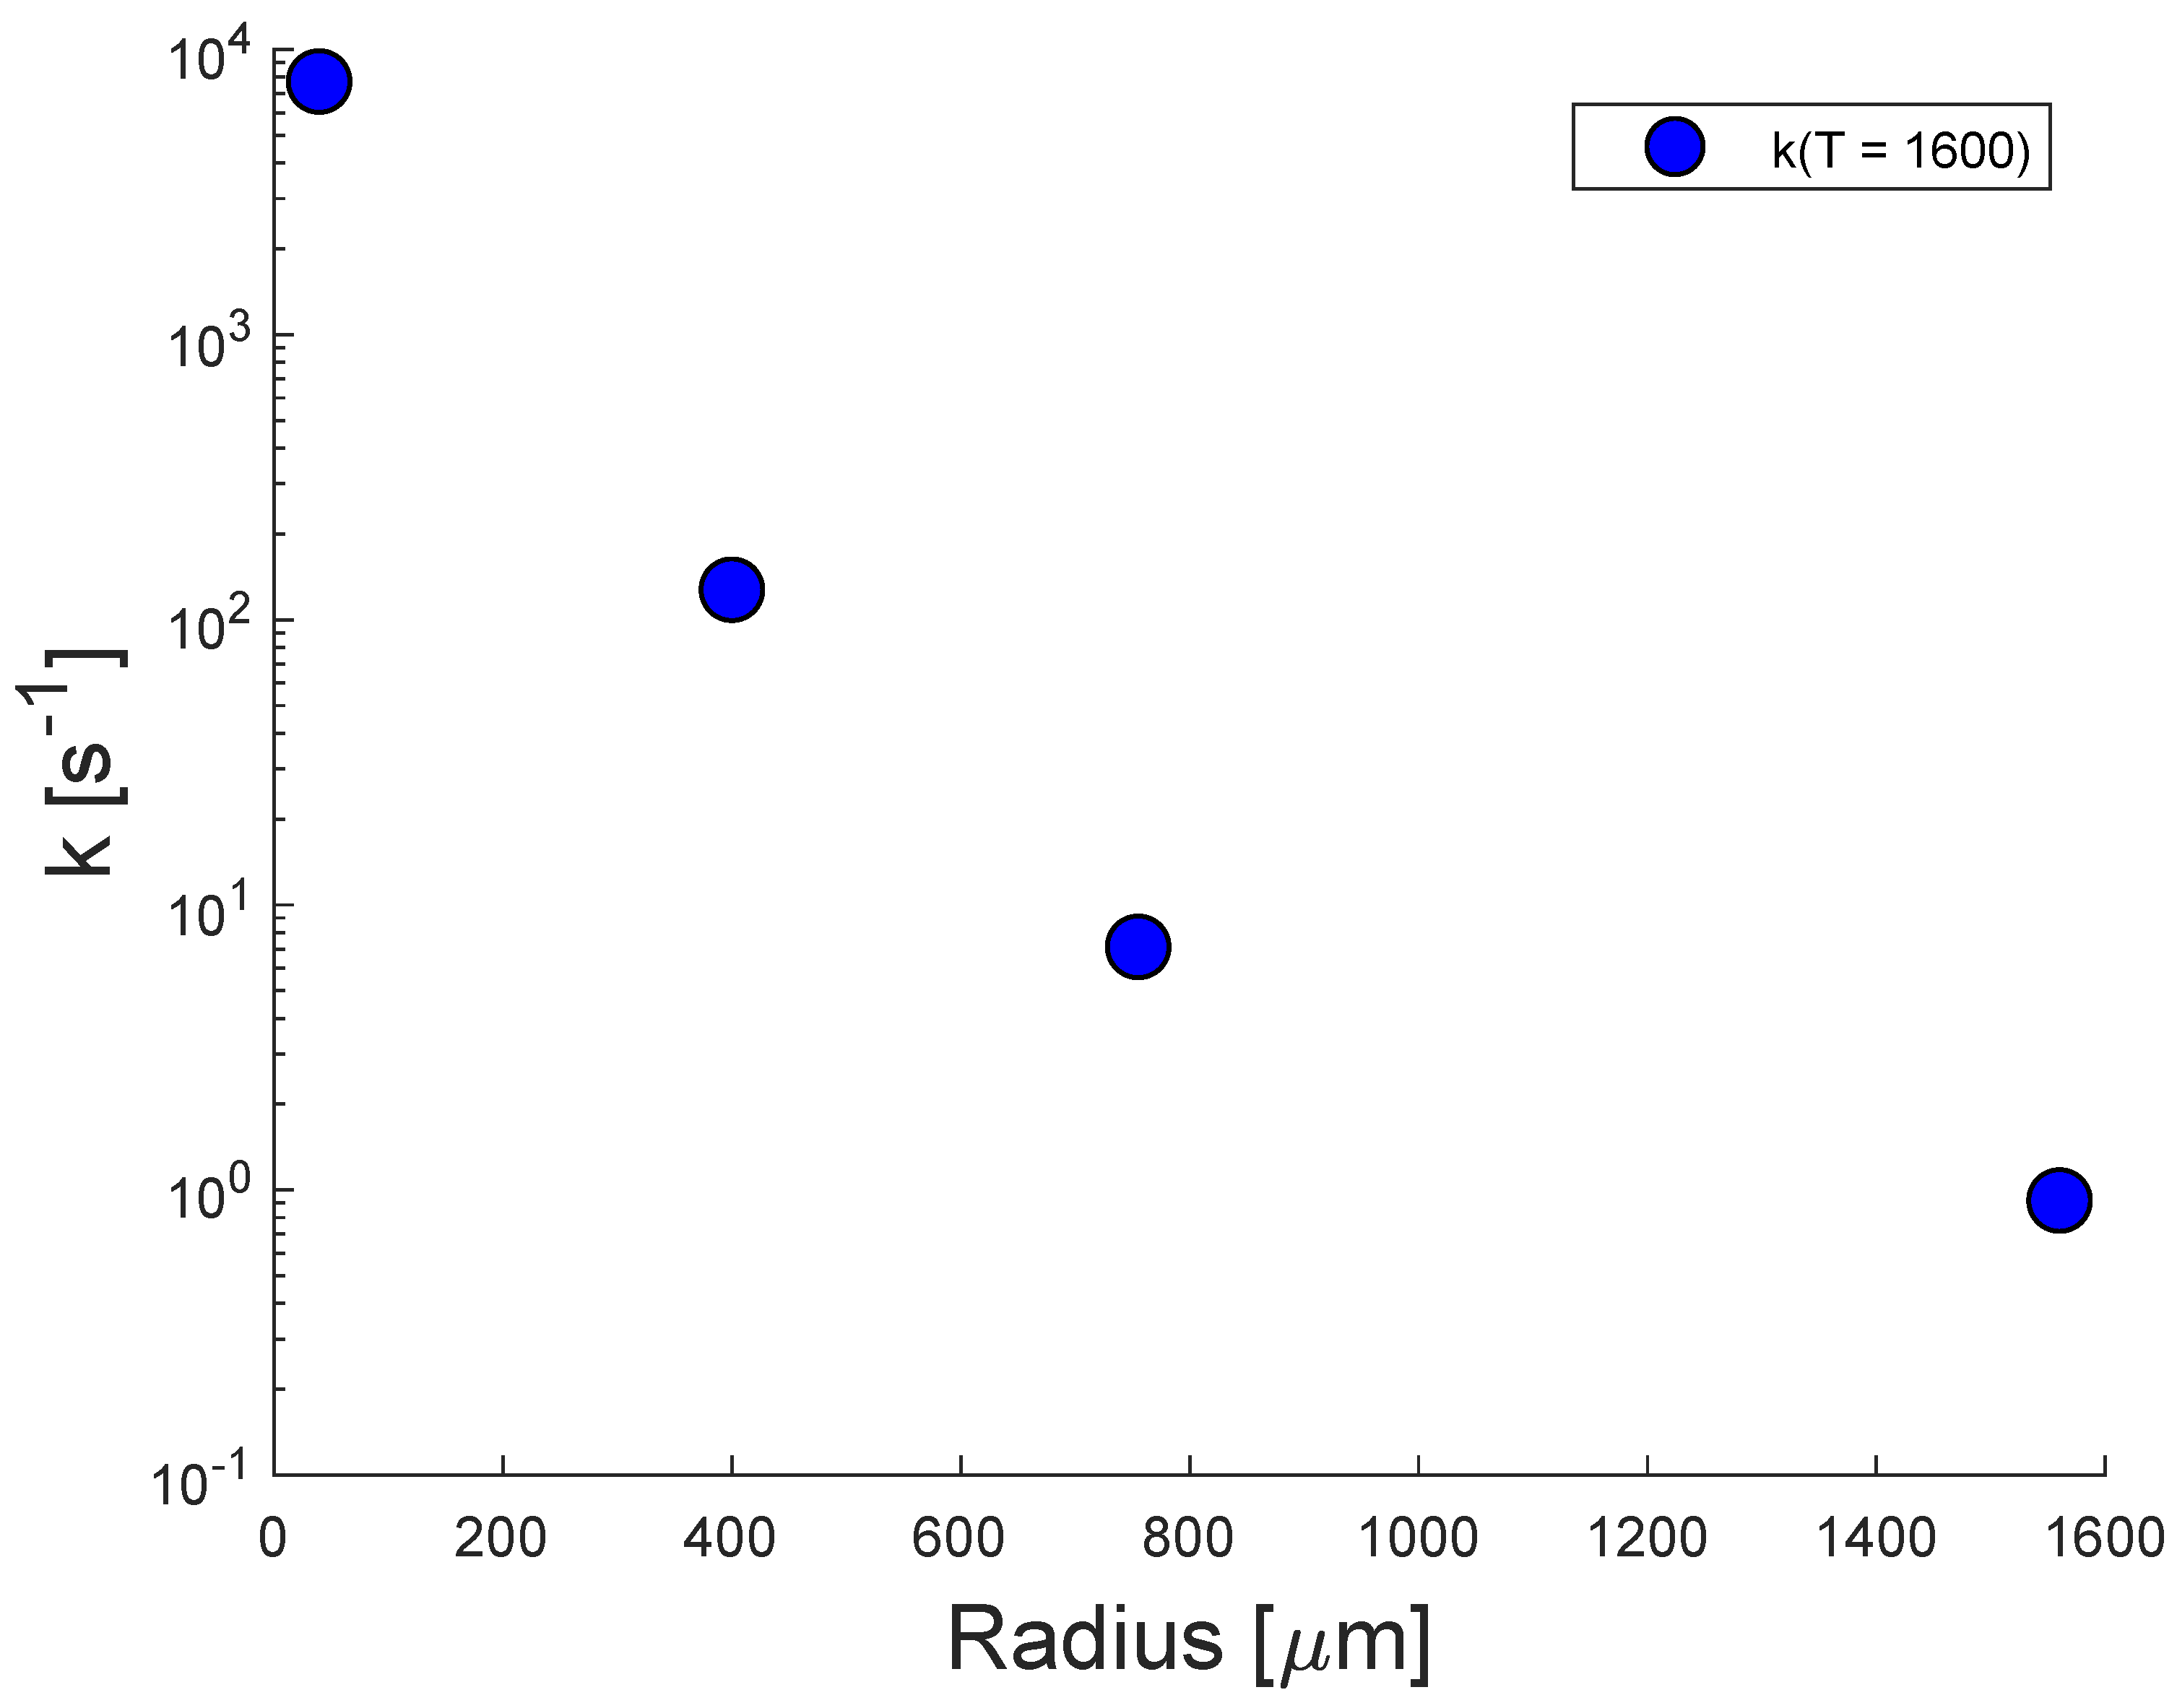
Table 4. When studying, e.g., the effect of the particle radius on the Arrhenius parameters, it is clear that the correlation is nonlinear as seen in Figure 4. Thus, both R, l o g ( R ) , R 1 / 2 , and R 1 / 3 have been tested, and the quality of the preprocessing is then determined based on the explained variance for the input matrix (ExpVar(X)), the output parameter (ExpVar(Y)), and the root mean squared error of cross validation (RMSECV) for both A and E, respectively. Similar considerations have been made for determining the preprocessing of ρ , T g , and A R . In these cases, the nonlinearity of the correlations between input and output variables are so weakly pronounced that no significant improvement is added to the model by choosing various more complex preprocessing methods and thereby increase model complexity beyond what is necessary.
Furthermore, the input variables here are not on the same scale, so to account for this, all input parameters have also been scaled to account for unit variance.

2.4.3. Cross Validation

The cross validation is made to ensure that the presented model is robust. It can be done in many ways; here, the random subset method [36] is used with 6 splits and 20 iterations, thus on average 17% of the data set is removed in each iteration. All models have been made with two PLS components. When doing the cross validation, preferably the obtained RMSECV values should be low, and ExpVar values high. The values in Table 3 and Table 4 are the basis for choosing the relevant preprocessings for a model. Due to the lower RMSECV(A) and RMSECV(E) and higher ExpVar(X) (compared to the number of input data in X) and ExpVar(Y) values, model 2 has been chosen both for A and E. If models appear equally good or almost equally good based on RMSECV and ExpVar data, the simpler model is usually preferred within PLS.

3. Results

3.1. Arrhenius Plots

The Arrhenius parameters for four different particle sizes ( d p = 78.8 μ m, d p = 800 μ m, d p = 1.51 mm, and d p = 3.12 mm) found by fitting the 0D model to the semi-2D model for different aspect ratios have been used to generate the Arrhenius plots in Figure 5. They have been determined for T = 1600 K, and plotted with these A and E values for a short temperature interval to illustrate the effects of the different parameters. It can be seen that the aspect ratio only has a minor influence on the Arrhenius parameters, and that the effect of aspect ratio levels off for higher values of A R . The effect of aspect ratio on the apparent rate constant is more pronounced for the smaller particles.
Furthermore, the change in apparent rate constant as a function of temperature is smaller for the large particles. It is due to the increased heat transfer limitations in the large particles. This is in contrast to the smaller particles, which are kinetically controlled, and where the temperature, consequently, has more influence over the apparent rate constant.

3.2. PLS Model

The PLS model presented here is developed to be able to predict the Arrhenius parameters in a lumped SFOR kinetic scheme accounting both for the reaction rate and the heat transfer limitations. A and E values have been found for multiple values spanning the parameter ranges (see Appendix A for all parameters combinations), by fitting the 0D model to the semi-2D model. A PLS model has then been generated using these new A and E values. Two graphs showing the 0D model predictions of log(A) and E as a function of the log(A) and E values given by fitting the 0D model to the semi-2D model (cf. Section 2.3) can be seen in Figure 6. The figure shows that there is good agreement between the values for log(A) and E predicted by the simple 0D model and by fitting to the semi-2D model. The Arrhenius parameters for the 0D model can be found through the regression vector. The regression vectors both for the preprocessed input parameters and for the raw input parameters can be seen in Table 5. The regression vectors for the preprocessed input parameters show that both for log(A) and E an increase in A R , T g , or log(R) would result in a decrease of log(A) and E. In other words, the PLS model analysis shows that if the gas temperature increases the apparent activation energy decreases. This is as expected, because the model covers both heat transfer limitations and kinetics. An increase in gas temperature means a higher absolute heat transfer as well as a higher reaction rate, resulting in a smaller apparent activation energy. The raw regression vector can be used for predictive purposes. In Equations (6) and (7), the values for log(A) and E can be estimated for pyrolysis situations similar to the ones used for model development.
l o g ( A ) = 20.19 4.071 × l o g ( R ) + 4.892 × 10 4 × ρ 0.04323 × A R 4.332 × 10 3 × T g
E = 28.57 × 10 4 5.295 × 10 4 × l o g ( R ) + 13.22 × ρ + 83.70 × A R 75.00 × T g
Here, A is the preexponential factor in s 1 , E is the activation energy in J/mol, R is the particle radius in μ m, ρ is the density in kg/m 3 , A R is the aspect ratio, and T g is the maximum gas temperature in Kelvin.

4. Discussion and Validation

4.1. Evaluation of Particle Conversion Predicted by the 0D Model and Semi-2D Model

Mass loss profile obtained from experiments is desirable for validating the proposed kinetic model. However, time-resolved mass loss data during devolatilization of biomass at high heating rates and peak temperatures is scarce in open literature. Although experiments using a flat flame burner can reach the desired conditions, such as the studies conducted by Johansen et al. [15] as well as Lewis and Fletcher [37], mass loss data at the initial conversion stage are difficult to obtain and have not been reported to the best knowledge of the authors. Therefore, validation of the 0D model (Equations (1)–(3) and Equations (6) and (7)) is here done by comparison of predictions to the results from the semi-2D model presented by Leth-Espensen et al. [19]. The semi-2D model was validated using a range of different studies. Agreement between the 0D and the semi-2D model has been checked for all input parameter combinations given in the Appendix A. Examples of conversion comparisons obtained by the semi-2D and the 0D model for the different particle sizes can be seen in Figure 7. The 0D model shows good agreement with the more complicated semi-2D model and predicts devolatilization times well. The model predictions are best for smaller particles as they are heated up rapidly, and thus closer to being isothermal, but it should be noted that the conversion time is relatively accurate for all particle sizes.

4.2. Comparison of Devolatilization Times Predicted by the 0D and Semi-2D Model

An overall comparison of the devolatilization time predicted by the semi-2D model and the 0D model can be seen in Figure 8. The devolatilization time is defined as the time, where 95% of full devolatilization is reached. The 0D model predicts most devolatilization times adequately, showing limitations only for particles with a large radius at a high gas temperature. In these cases the 0D model may predict negative activation energies, as can be deduced from Equation (7), see examples in the table in Appendix A. As negative E values entail that the reaction rate decreases for increasing temperatures, the model cannot be trusted in these instances and such values have been disregarded in Figure 8. From Figure 8, it can be seen that the 0D model tends to overpredict the devolatilization time for small particles and underpredict the devolatilization time for large particles, however, the prediction capability is overall good, and the trend is captured well by the model.

4.3. Comparison of the Arrhenius Parameters to Literature

The lumped Arrhenius parameters, which can be calculated from Equations (6) and (7) covers most of the area for Arrhenius parameters previously covered in literature [10,38,39] for simple first order reactions relevant for suspension firing. In Figure 9 a comparison can be seen. Previously reported SFOR Arrhenius parameters are often only determined short temperature span, but extrapolated outside this region, the model presented here has gas phase temperature as a parameter, thus allowing for a broader temperature interval, where the model is accurate. Consequently, it allows for better modeling of industrial sized suspension firing boilers. Furthermore, as the model also takes particle size into account one equation can describe all sizes relevant for suspension firing. The model’s tendency to predict slightly too low reaction rates for small particles at high temperatures, also described in Section 4.2, can be seen in Figure 9 by comparing to the Arrhenius parameters for small particles from Johansen et al. [10] as well. The model’s slightly higher predicted devolatilization times for small particles is the result of providing a model, which account for broad parameter ranges within particle size, density, gas temperature, and aspect ratio. Especially the particle size is an important factor in determining lumped kinetics for biomass devolatilization and covering almost two orders of magnitude results in less accuracy in the interval ends.

5. Conclusions

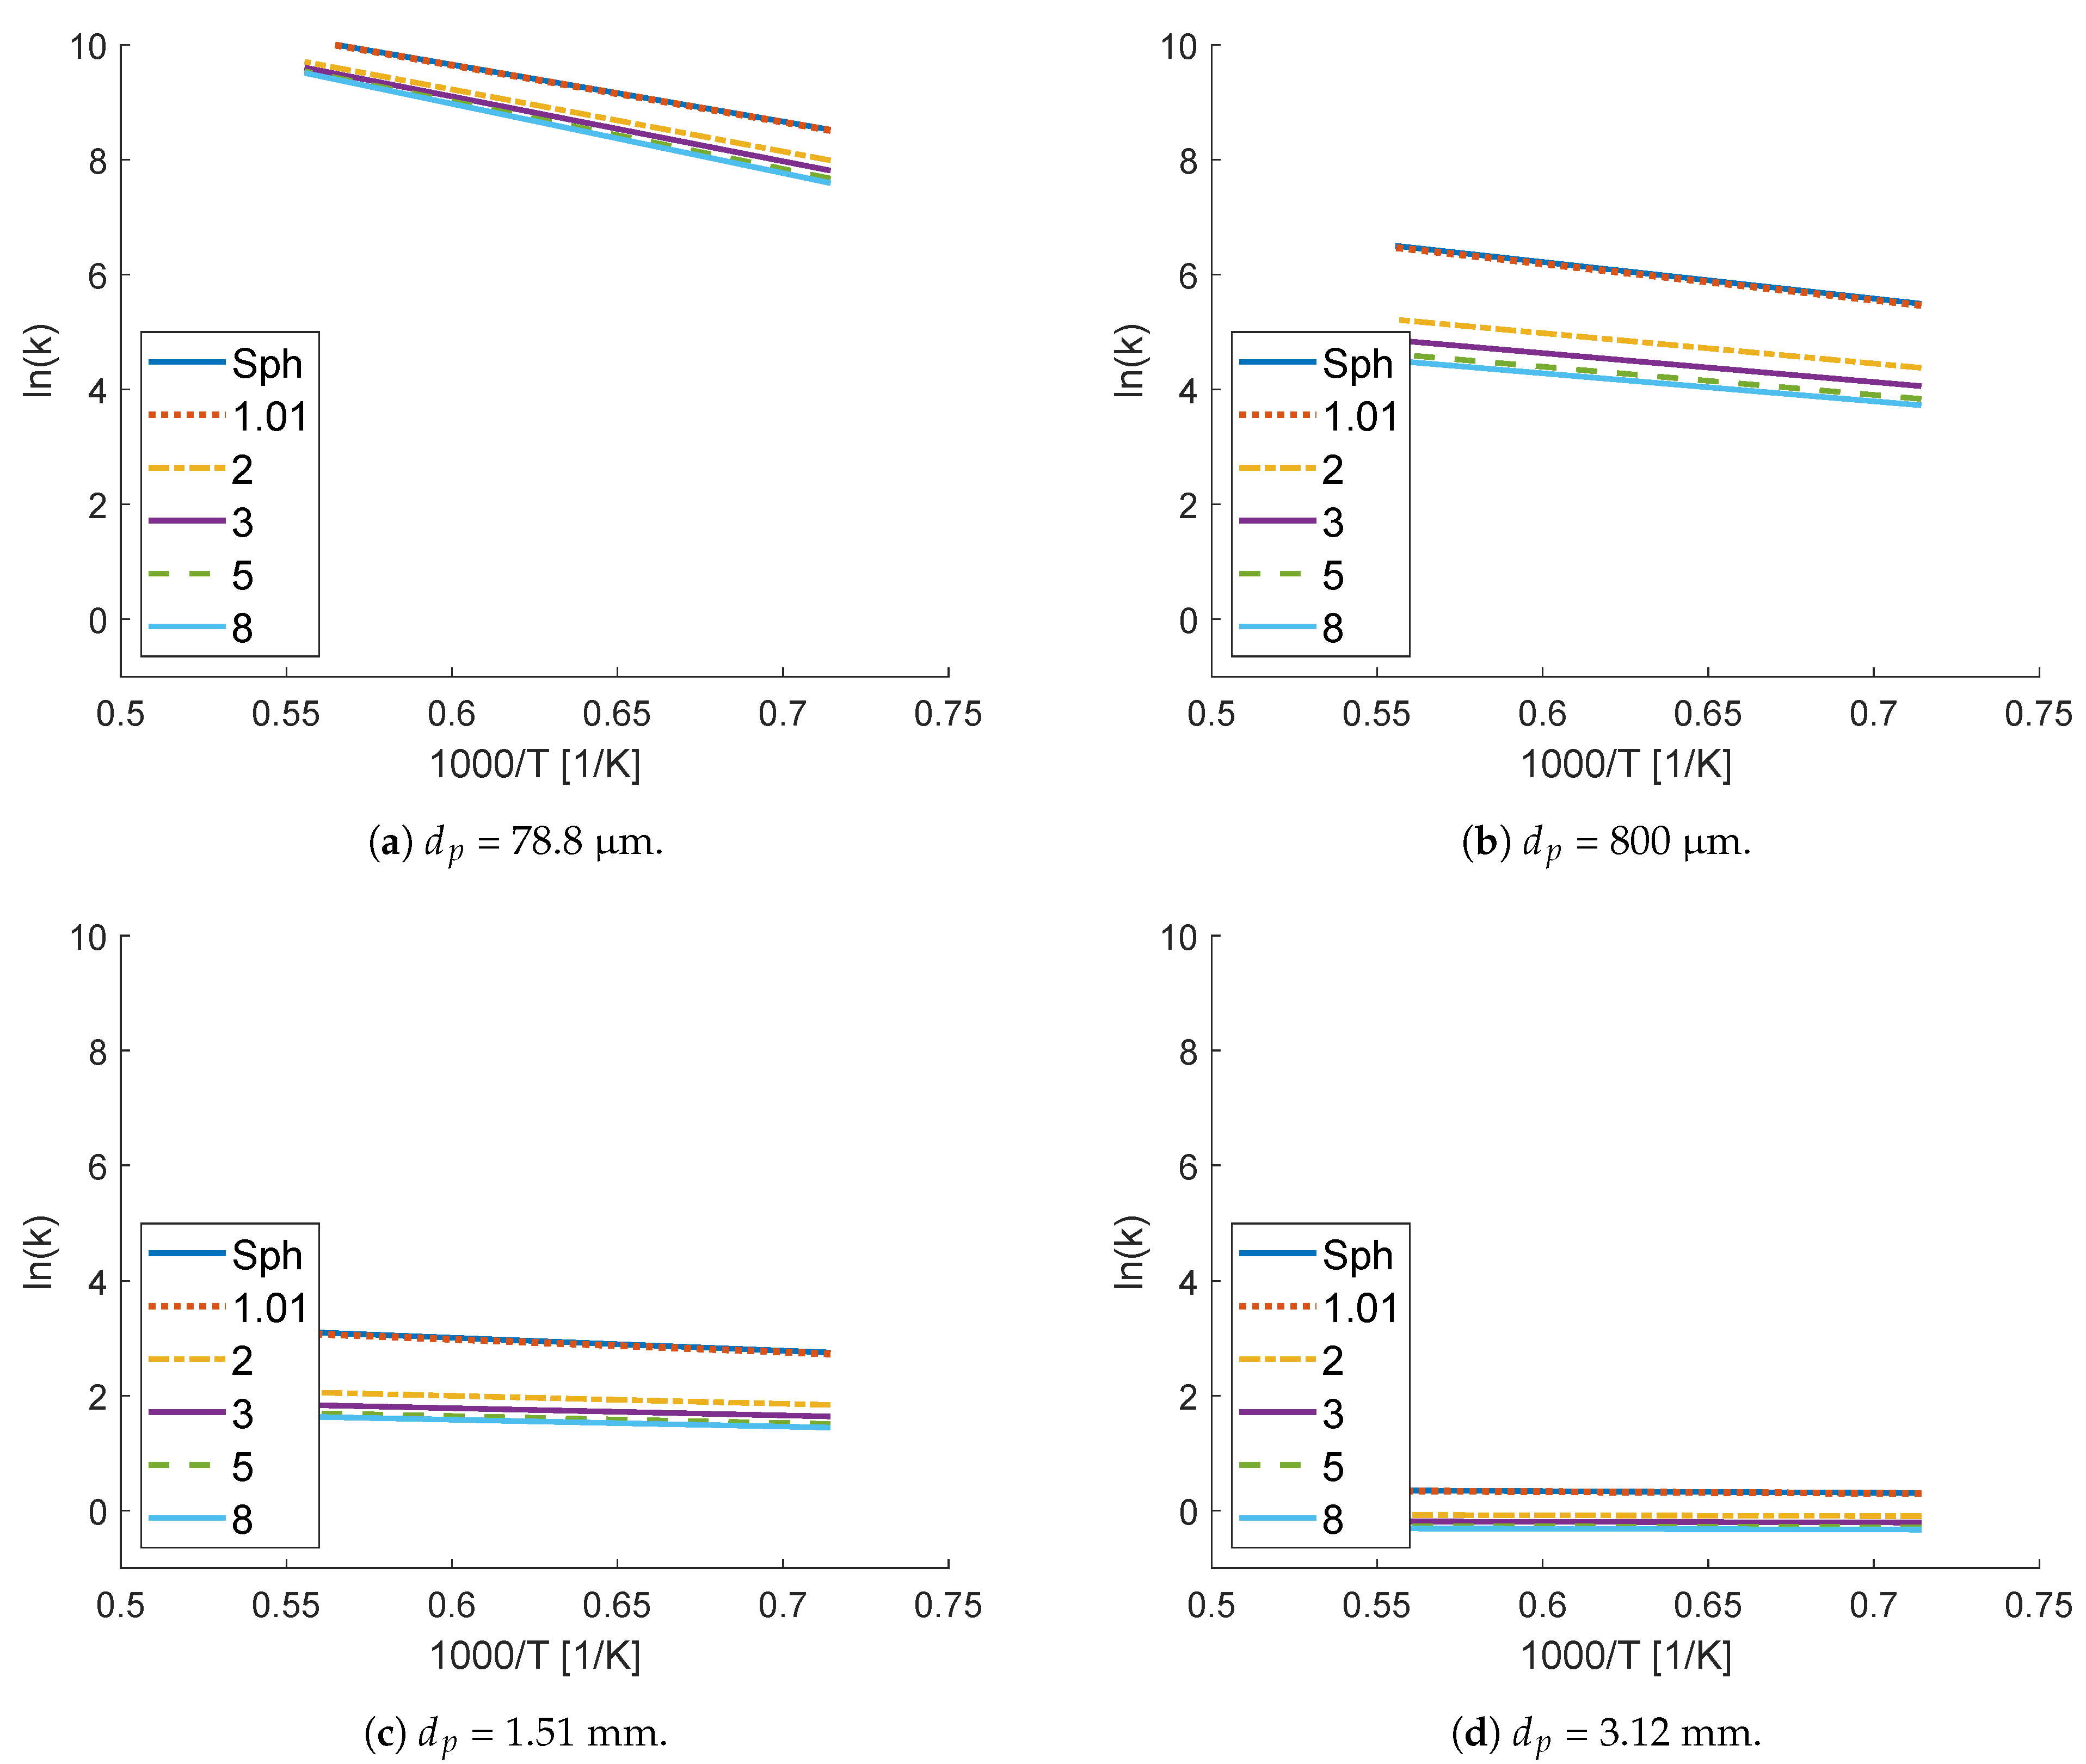
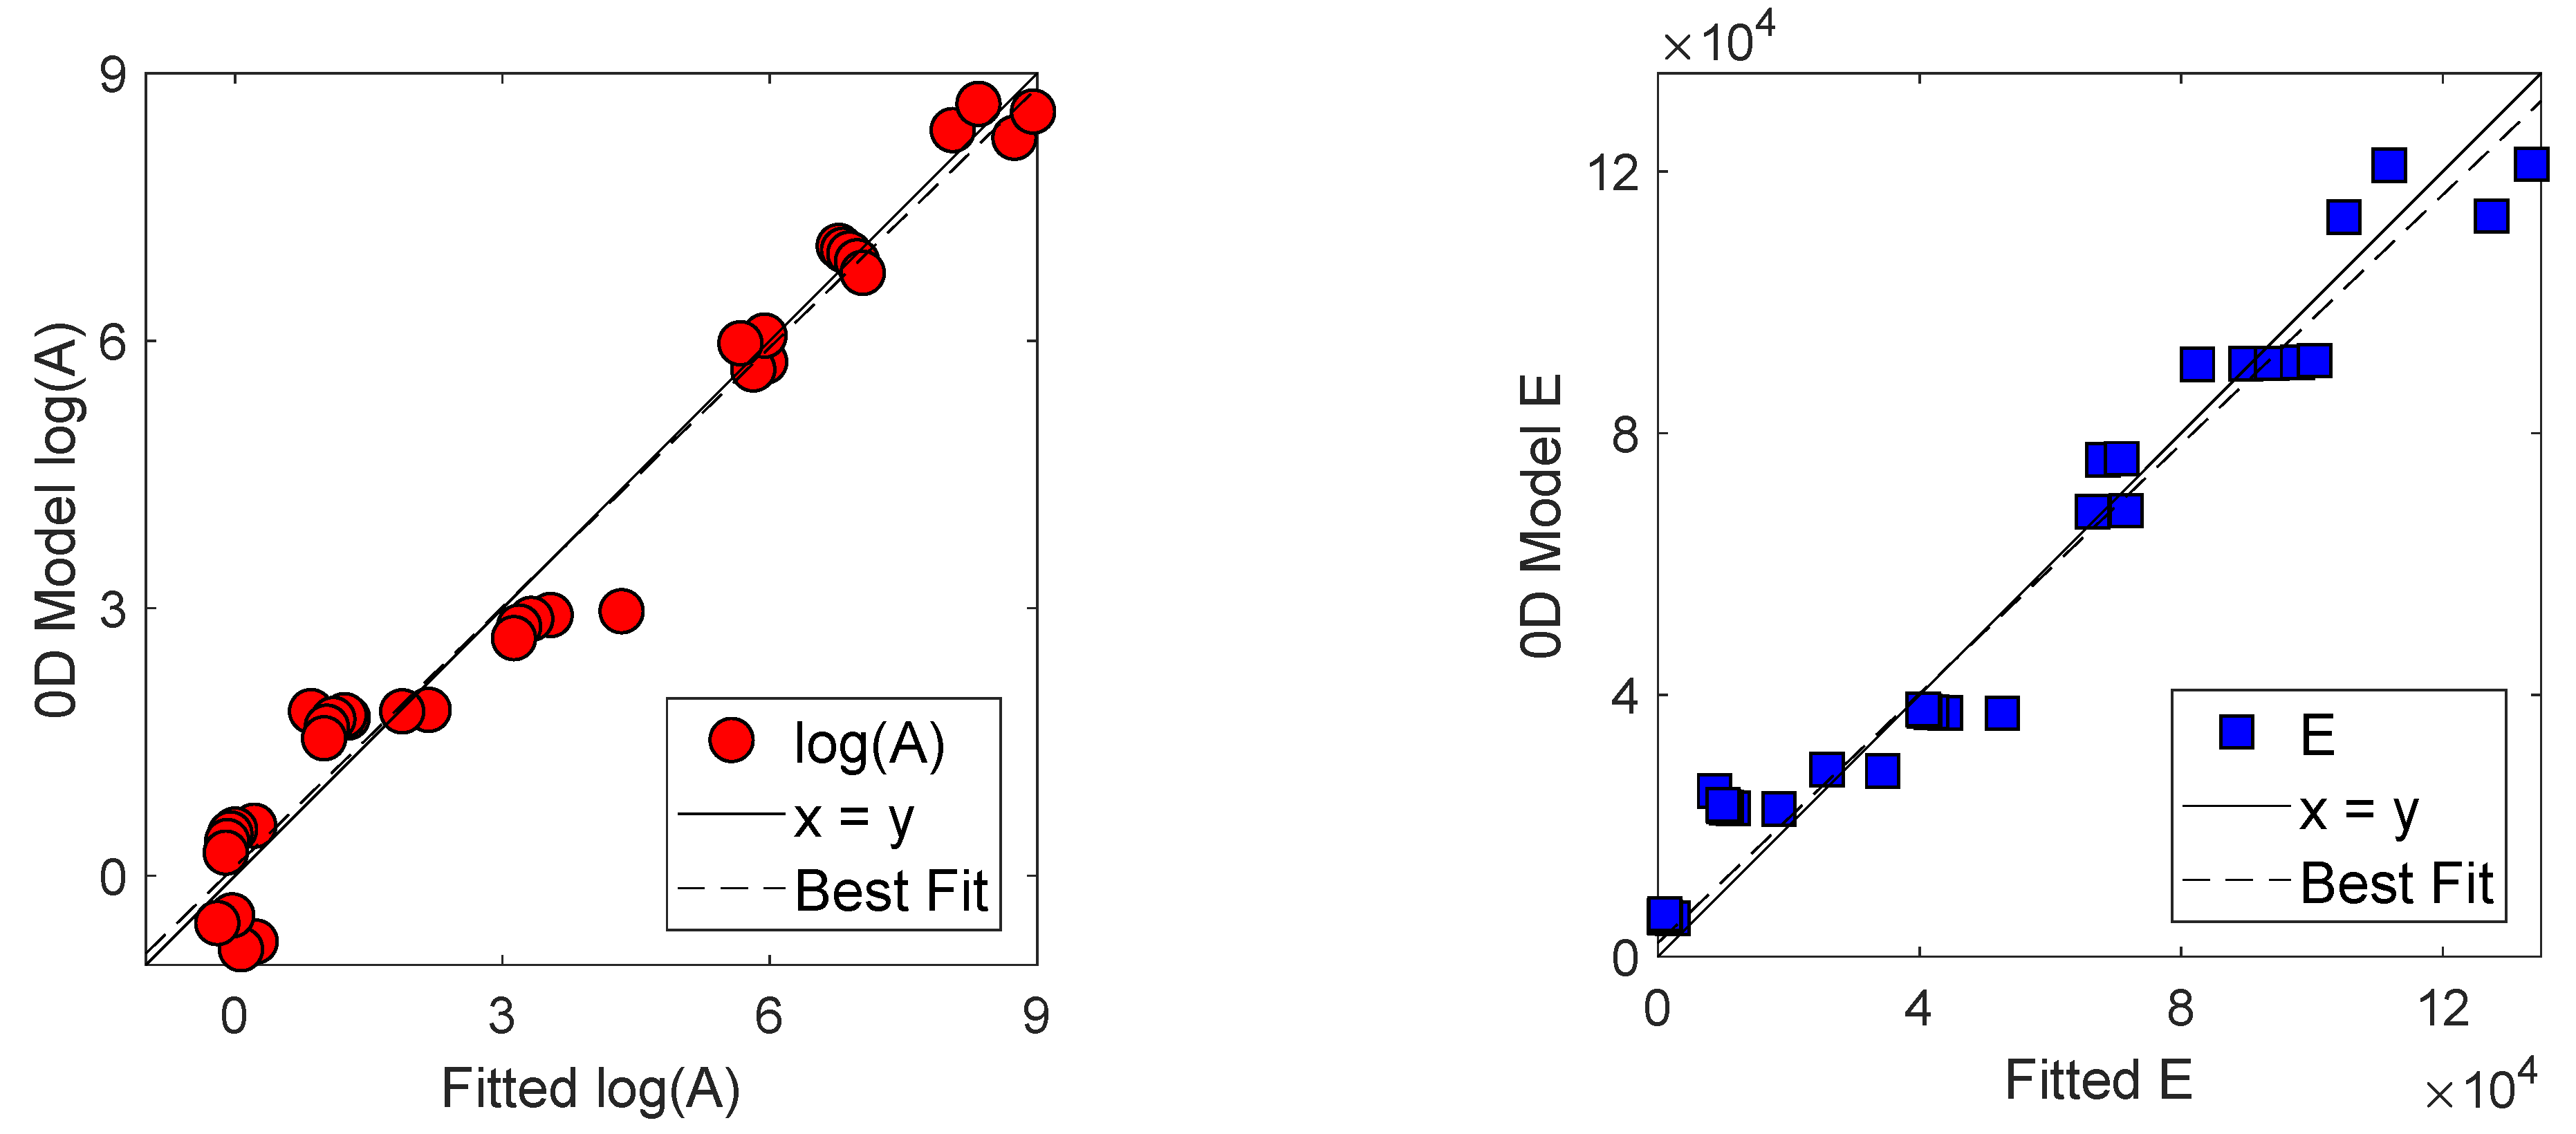
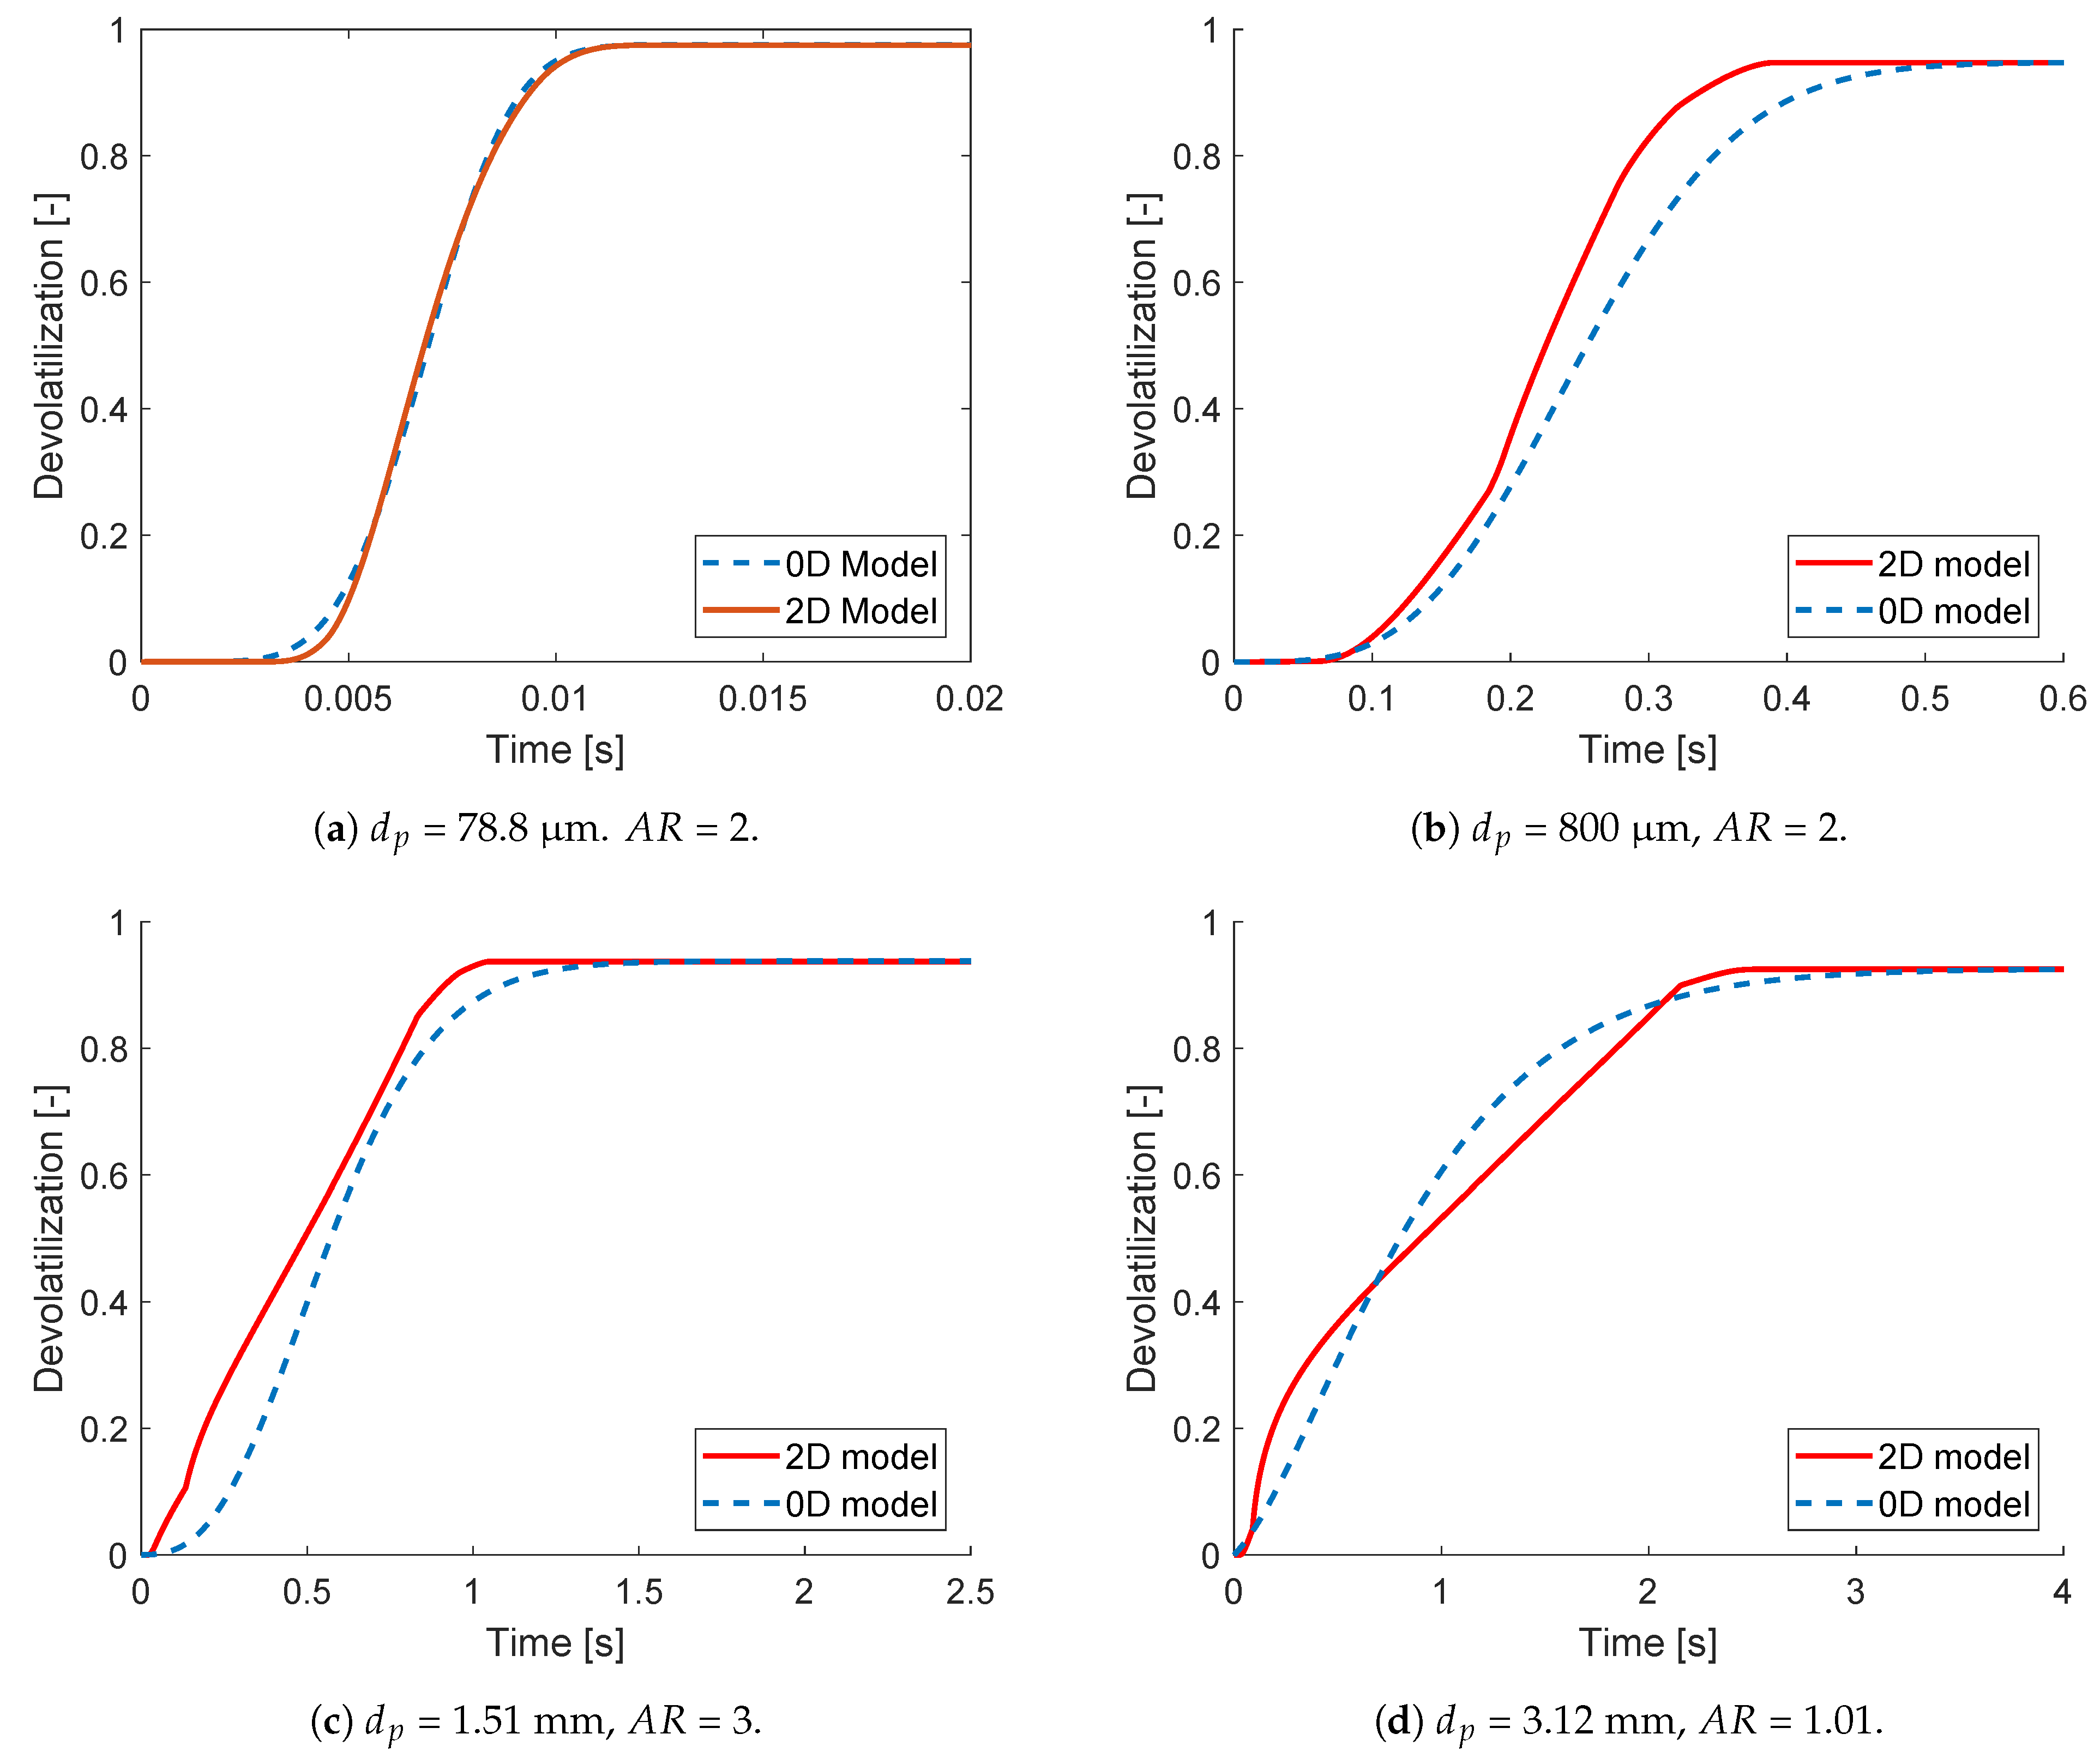
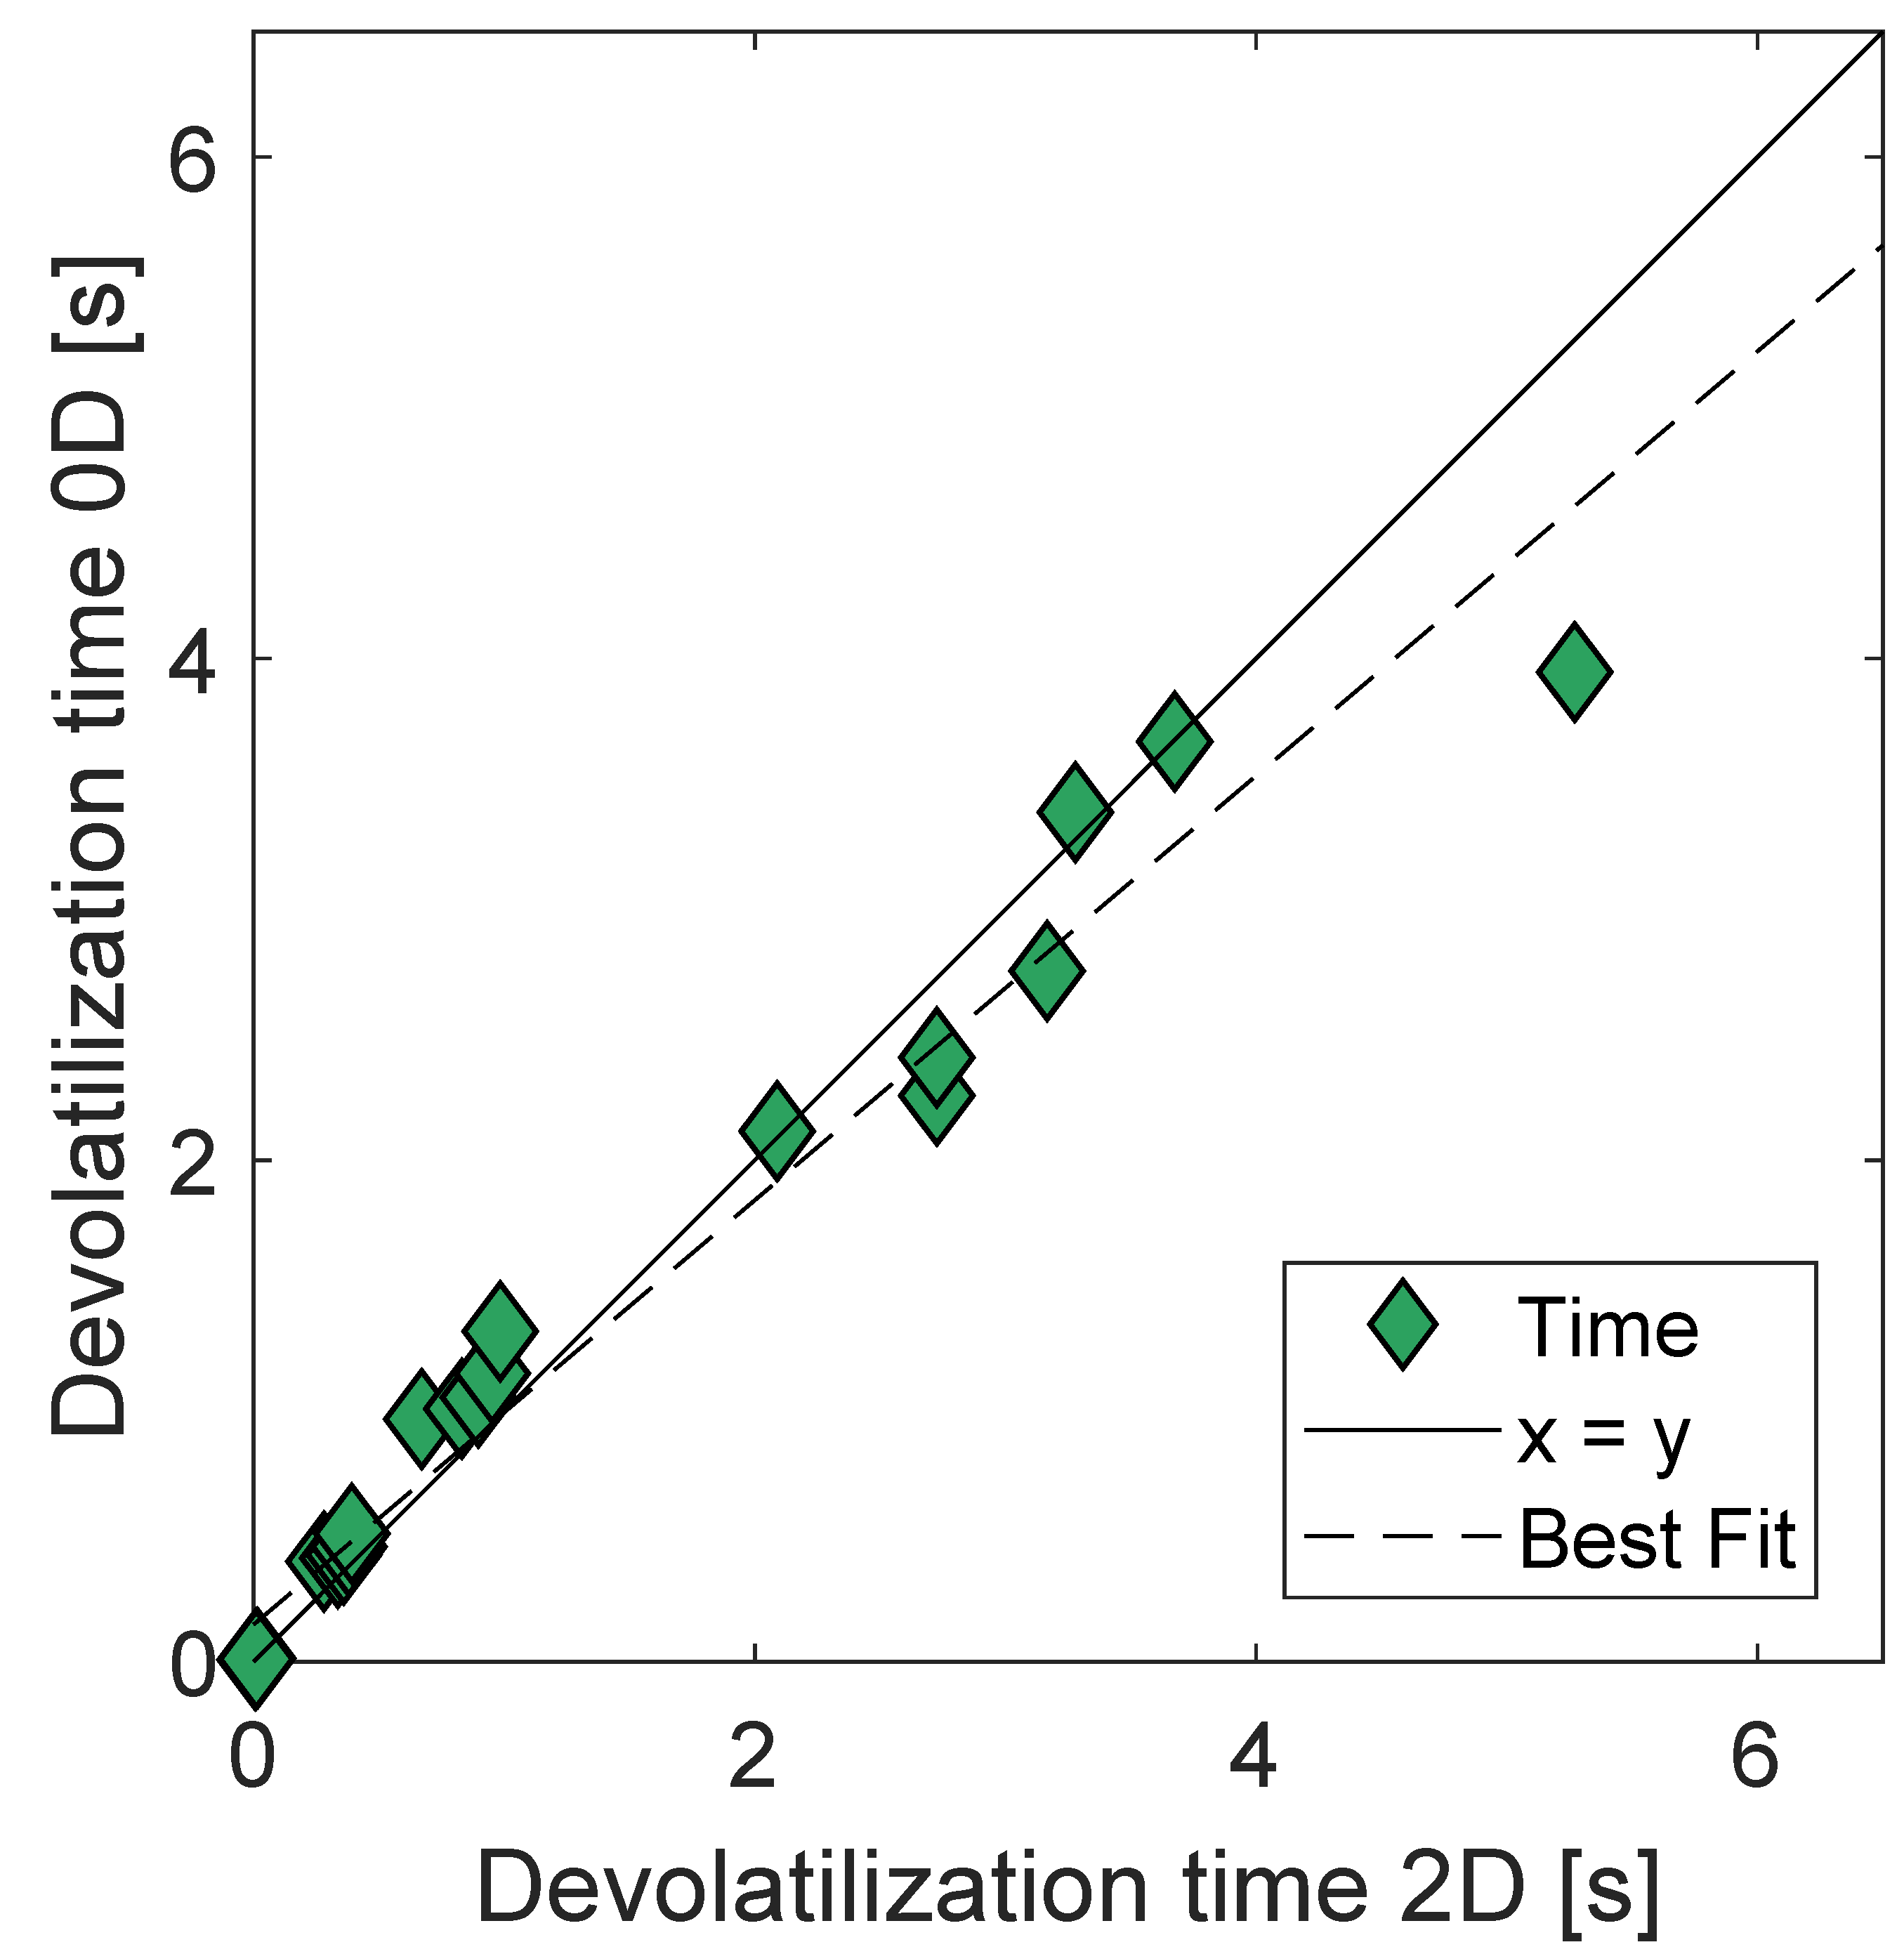
A 0D model has been developed to describe devolatilization of cylindrical biomass particles using a lumped single first order Arrhenius equation to account for both kinetics and heat transfer limitations in the particle. The model accounts for aspect ratio, particle density, gas temperature, and particle radius, because of their influence on devolatilization rate and on flame shape and stability. Including these parameters in the devolatilization model allows for better CFD simulations of industrial sized units. Calculations show that of these parameters, especially particle radius and temperature, are important for the prediction of the degree of particle devolatilization. Model predictions are compared to those of a more complicated semi-2D model, showing good agreement, especially for the smaller particles, where the heat transfer limitation is less severe. The presented model also shows that it is important to include differences in aspect ratio, but that the influence of aspect ratio on devolatilization rate levels off as aspect ratio increases and consequently end effects become less important.
The devolatilization model presented is simple and can be implemented into CFD without adding substantially to the computational costs. By implementation into CFD simulations, as, e.g., the ones described by Johansen et al. [8], it is likely that an even greater match between numerical simulations and the physical phenomena during flame development in a suspension firing unit can be obtained. Future work should include making the CFD simulation described above, and expanding the model to include different kinds of biomass and municipal waste.

Author Contributions

Formal analysis, A.E. and T.L. (Tian Li); funding acquisition, P.A.J.; methodology, A.E. and T.L. (Tian Li); project administration, P.A.J.; supervision, P.G., T.L. (Terese Løvås), and P.A.J.; validation, T.L. (Tian Li); writing—original draft, A.E.; writing—review and editing, A.E., T.L. (Tian Li), P.G., T.L. (Terese Løvås), and P.A.J. All authors have read and agreed to the published version of the manuscript.

Funding

This research was partly funded by Ørsted A/S, Burmeister & Wain Scandinavian Contractors A/S, and Rambøll A/S.

Data Availability Statement

The data presented in this study are available in the Appendix A.

Acknowledgments

The authors gratefully acknowledge the financial and advisory support received from Ørsted A/S, Burmeister, and Wain Scandinavian Contractors A/S, and Rambøll A/S. We also thank the Nordic Five Tech (N5T) alliance for financial support.

Conflicts of Interest

The authors declare no conflict of interest.

Abbreviations

The following abbreviations are used in this manuscript:
CFDComputational Fluid Dynamics
HRHeating rate
SFORSingle first order reaction
PLSPartial least squares
AArrhenius preexponential factors 1
C p specific heat capacityJ/(kg K)
d p particle diametermm/ μ m
E a Arrhenius activation energyJ/mol
hconvective heat transfer coefficientJ/(s×m 2 × K)
kreaction rates 1
Rinitial particle radiusm
R g gas constantJ/(mol K)
TtemperatureK
ttimes
Xinput matrix
Youtput matrix
ydegree of devolatilization at time t
ϵ emissivity coefficient
ρ densitykg/m 3
σ Stefan–Boltzmann constantJ/(s m 2 K 4 )
Y volatile fraction
Y *volatile fraction at t = 0
ggas
pparticle
refreference
wradiation temperature

Appendix A. Model Parameters

Table A1. Model input and output parameters. Cases with negative E values marked in gray.
ρ T g AR R Y * A (fit)E (fit)A (PLS)E (PLS) t devo , 2 D t devo , 0 D
kg/m 3 K- μ m-s 1 J/mols 1 J/molss
70013001.0139.496.91.13 × 10 8 1.05 × 10 5 2.31 × 10 8 1.13 × 10 5 0.01280.0131
70013001.01156090.11.49 × 10 2 3.44  × 10 4 7.26 × 10 1 2.82  × 10 4 3.683.669
7001300339.496.95.55 × 10 8 1.27 × 10 5 1.90 × 10 8 1.13 × 10 5 0.01580.0136
70013003156090.11.84 × 10 1 2.58  × 10 4 5.95 × 10 1 2.81  × 10 4 5.273.946
70019001.0139.498.08.86 × 10 5 6.64  × 10 4 5.83 × 10 5 6.78  × 10 4 6.10 × 10 3 6.9 × 10 3
70019001.01156094.21.704.52 × 10 11 1.83 × 10 1 −1.68  × 10 4 1.530.029
7001900339.498.06.52 × 10 5 7.16  × 10 4 4.78 × 10 5 6.77  × 10 4 7.50 × 10 3 7.3 × 10 3
70019003156094.21.171.72 × 10 6 1.50 × 10 1 −1.69  × 10 4 2.230.036
130013001.0139.496.52.19 × 10 8 1.12 × 10 5 4.55 × 10 8 1.21 × 10 5 0.02170.0225
13001300339.496.58.98 × 10 8 1.34 × 10 5 3.73 × 10 8 1.21 × 10 5 0.02700.0233
130019001.0139.497.78.72 × 10 5 6.81  × 10 4 1.15 × 10 6 7.58  × 10 4 0.01010.0112
130019001.01156093.49.29 × 10 1 1.00 × 10 9 3.59 × 10 1 −8.83 × 10 3 2.840.885
13001900339.497.74.68 × 10 5 7.09  × 10 4 9.40 × 10 5 7.56  × 10 4 0.01260.0117
130019003156093.46.32 × 10 1 9.83 × 10 8 2.95 × 10 1 −9.00 × 10 3 4.161.247
100016002.005799.793.27.128.67 × 10 3 7.02 × 10 1 2.50  × 10 4 1.271.422
70016001.0139.497.65.93 × 10 6 8.25  × 10 4 1.16 × 10 7 9.03  × 10 4 8.40 × 10 3 8.5 × 10 3
7001600239.497.66.63 × 10 6 8.99  × 10 4 1.05 × 10 7 9.03  × 10 4 9.80 × 10 3 8.7 × 10 3
7001600339.497.67.80 × 10 6 9.38  × 10 4 9.53 × 10 6 9.02  × 10 4 10.3 × 10 3 8.9 × 10 3
7001600539.497.69.52 × 10 6 9.78  × 10 4 7.81 × 10 6 9.00  × 10 4 10.8 × 10 3 9.2 × 10 3
7001600839.497.61.10 × 10 7 1.00 × 10 5 5.79 × 10 6 8.98  × 10 4 11.1 × 10 3 9.9 × 10 3
70016001.0140094.82.17  × 10 4 5.26  × 10 4 9.28 × 10 2 3.70  × 10 4 0.2810.399
7001600240094.83.47 × 10 3 4.40  × 10 4 8.41 × 10 2 3.70  × 10 4 0.3360.413
7001600340094.82.10 × 10 3 4.18  × 10 4 7.61 × 10 2 3.69  × 10 4 0.3600.427
7001600540094.81.54 × 10 3 4.08  × 10 4 6.24 × 10 2 3.67  × 10 4 0.3800.458
7001600840094.81.35 × 10 3 4.05  × 10 4 4.63 × 10 2 3.64  × 10 4 0.3920.51
70016001.0175593.87.50 × 10 1 1.85  × 10 4 6.99 × 10 1 2.24  × 10 4 0.6710.967
7001600275593.81.70 × 10 1 1.15  × 10 4 6.33 × 10 1 2.23  × 10 4 0.8311.008
7001600375593.81.27 × 10 1 1.05 × 10 4 5.73 × 10 1 2.23 × 10 4 0.8971.053
7001600575593.81.07 × 10 1 1.00 × 10 4 4.70 × 10 1 2.21 × 10 4 0.9521.149
7001600875593.89.979.94 × 10 3 3.48 × 10 1 2.18 × 10 4 0.9841.317
70016001.01156092.61.642.31 × 10 3 3.645.73 × 10 3 2.092.115
70016002156092.61.001.13 × 10 3 3.305.65 × 10 3 2.732.257
70016003156092.68.85 × 10 1 1.00 × 10 3 2.995.57 × 10 3 2.732.409
70016005156092.68.17 × 10 1 1.01 × 10 3 2.455.40 × 10 3 3.172.754
70016008156092.67.87 × 10 1 1.06 × 10 3 1.825.15 × 10 3 3.283.387

References

  1. BP. BP Statistical Review of World Energy 2020; Technical Report; BP: London, UK, 2020. [Google Scholar]
  2. The Danish Council on Ethics. RedegøRelse om Bioenergi, Fødevarer, og Etik i en Globaliseret Verden; Technical Report; The Danish Council on Ethics: Copenhagen, Denmark, 2012; pp. 39–42. [Google Scholar]
  3. Hong, B.; Slatick, E. Carbon Dioxide Emission Factors for Coal. In Energy Information Administration, Quarterly Coal Report; Energy Information Administration: Washington, DC, USA, 1994; pp. 1–8. [Google Scholar]
  4. Juhrich, K. CO2 Emission Factors for Fossil Fuels; Technical Report; German Environment Agency: Dessau-Roßlau, Germany, 2016. [Google Scholar]
  5. Masche, M.; Puig-Arnavat, M.; Wadenbäck, J.; Clausen, S.; Jensen, P.A.; Ahrenfeldt, J.; Henriksen, U.B. Wood pellet milling tests in a suspension-fired power plant. Fuel Process. Technol. 2018, 173, 89–102. [Google Scholar] [CrossRef] [Green Version]
  6. Johansen, J.M. Power Plant Burners for Bio-Dust Combustion. Ph.D. Thesis, DTU, Kongens Lyngby, Denmark, 2015. [Google Scholar]
  7. Dall’Ora, M. Reactivity and burnout of wood fuels. Ph.D. Thesis, DTU, Kongens Lyngby, Denmark, 2011. [Google Scholar]
  8. Johansen, J.S.; Myllerup, L.; Eriksson, J.; Clausen, S.N.; Fateev, A.; Nielsen, K.L.; Wadenbäck, J.; Tonell, M.; Jensen, P.A.; Glarborg, P. Analysis of a 30MWth Bio-Dust Fired Swirl Burner, Part II: Comparison of Experimental Measurements and CFD Simulations. Manuscript in preparation.
  9. Blondeau, J.; Jeanmart, H. Biomass pyrolysis in pulverized-fuel boilers: Derivation of apparent kinetic parameters for inclusion in CFD codes. Proc. Combust. Inst. 2011, 33, 1787–1794. [Google Scholar] [CrossRef]
  10. Johansen, J.M.; Gadsbøll, R.; Thomsen, J.; Jensen, P.A.; Glarborg, P.; Ek, P.; Martini, N.D.; Mancini, M.; Weber, R.; Mitchell, R.E. Devolatilization kinetics of woody biomass at short residence times and high heating rates and peak temperatures. Appl. Energy 2016, 162, 245–256. [Google Scholar] [CrossRef] [Green Version]
  11. Backreedy, R.; Fletcher, L.; Jones, J.; Ma, L.; Pourkashanian, M.; Williams, A. Co-firing pulverised coal and biomass: A modeling approach. Proc. Combust. Inst. 2005, 30, 2955–2964. [Google Scholar] [CrossRef]
  12. Ma, L.; Jones, J.; Pourkashanian, M.; Williams, A. Modelling the combustion of pulverized biomass in an industrial combustion test furnace. Fuel 2007, 86, 1959–1965. [Google Scholar] [CrossRef]
  13. Jiménez, S.; Remacha, P.; Ballesteros, J.C.; Giménez, A.; Ballester, J. Kinetics of devolatilization and oxidation of a pulverized biomass in an entrained flow reactor under realistic combustion conditions. Combust. Flame 2008, 152, 588–603. [Google Scholar] [CrossRef] [Green Version]
  14. Bharadwaj, A.; Baxter, L.L.; Robinson, A.L. Effects of Intraparticle Heat and Mass Transfer on Biomass Devolatilization: Experimental Results and Model Predictions. Energy Fuel 2004, 18, 1021–1031. [Google Scholar] [CrossRef]
  15. Johansen, J.M.; Jensen, P.A.; Glarborg, P.; Mancini, M.; Weber, R.; Mitchell, R.E. Extension of apparent devolatilization kinetics from thermally thin to thermally thick particles in zero dimensions for woody biomass. Energy 2016, 95, 279–290. [Google Scholar] [CrossRef] [Green Version]
  16. Gómez, M.A.; Porteiro, J.; Patiño, D.; Míguez, J.L. Fast-solving thermally thick model of biomass particles embedded in a CFD code for the simulation of fixed-bed burners. Energy Convers. Manag. 2015, 105, 30–44. [Google Scholar] [CrossRef]
  17. Li, T.; Thunman, H.; Ström, H. A fast-solving particle model for thermochemical conversion of biomass. Combust. Flame 2020, 213, 117–131. [Google Scholar] [CrossRef]
  18. Luo, H.; Wu, H.; Lin, W.; Dam-Johansen, K. Heat Transfer Corrected Isothermal Model for Devolatilization of Thermally-Thick Biomass Particles; Nordic Flame Days: Stockholm, Sweden, 2017. [Google Scholar]
  19. Leth-Espensen, A.; Li, T.; Glarborg, P.; Løvås, T.; Jensen, P.A. The influence of size and morphology on devolatilization of biomass particles. Fuel 2020, 264, 116755. [Google Scholar] [CrossRef]
  20. Thunman, H.; Leckner, B.; Niklasson, F.; Johnsson, F. Combustion of wood particles - A particle model for Eulerian calculations. Combust. Flame 2002, 129, 30–46. [Google Scholar] [CrossRef]
  21. Ström, H.; Thunman, H. CFD simulations of biofuel bed conversion: A submodel for the drying and devolatilization of thermally thick wood particles. Combust. Flame 2013, 160, 417–431. [Google Scholar] [CrossRef]
  22. Trubetskaya, A.; Beckmann, G.; Wadenbäck, J.; Holm, J.K.; Velaga, S.P.; Weber, R. One way of representing the size and shape of biomass particles in combustion modeling. Fuel 2017, 206, 675–683. [Google Scholar] [CrossRef] [Green Version]
  23. Badzioch, S.; Hawksley, P.G.W. Kinetics of Thermal Decomposition of Pulverized Coal Particles. Ind. Eng. Chem. Proc. Des. Dev. 1970, 9, 521–530. [Google Scholar] [CrossRef]
  24. Leth-Espensen, A.; Glarborg, P.; Jensen, P.A. Predicting Biomass Char Yield from High Heating Rate Devolatilization Using Chemometrics. Energy Fuel 2018, 32, 9572–9580. [Google Scholar] [CrossRef]
  25. Ražnjević, K. Handbook of Thermodynamic Tables and Charts; Hemisphere Publishing Corporation: New York, NY, USA, 1976. [Google Scholar]
  26. Grønli, M. A Theoretical and Experimental Study of the Thermal Degredation of Biomass. Ph.D. Thesis, NTNU, Trondheim, Norway, 1996. [Google Scholar]
  27. Chase, M.W., Jr. “Thermophysical Properties of Fluid Systems” in NIST Chemistry WebBook, NIST Standard Reference Database Number 69; National Institute of Standards and Technology: Gaithersburg, MD, USA, 1998.
  28. Merrick, D. Mathematical models of the thermal decomposition of coal. 2. Specific heats and heats of reaction. Fuel 1983, 62, 540–546. [Google Scholar] [CrossRef]
  29. Green, D.; Perry, R. Perry’s Chemical Engineers’ Handbook, 8th ed.; McGraw Hill Professional, McGraw-Hill Education: New York, NY, USA, 2007. [Google Scholar]
  30. Rawlings, J.; Ekerdt, J. Chemical Reactor Analysis and Design Fundamentals, 2nd ed.; Nob Hill Publishing: Wisconsin, WI, USA, 2002; pp. 515–520. [Google Scholar]
  31. Eriksson, L.; Johansson, E.; Kettaneh-Wold, N.; Wold, S. Multi- and Megavariate Data Analysis. Principles and Applications; Umetrics Academy: Umeå, Sweden, 2003; Volume 1, p. 71. [Google Scholar]
  32. Kjeldahl, K.; Bro, R. Some common misunderstandings in chemometrics. J. Chemom. 2010, 24, 558–564. [Google Scholar] [CrossRef]
  33. Wiklund, S.; Nilsson, D.; Eriksson, L.; Sjöström, M.; Wold, S.; Faber, N. A randomization test for PLS component selection. J. Chemom. 2007, 21, 427–439. [Google Scholar] [CrossRef]
  34. Zachariassen, C.B. Process Analytical Chemistry and Technology in Pectin Production. Ph.D. Thesis, University of Copenhagen, Copenhagen, Denmark, 2007. [Google Scholar]
  35. Trubetskaya, A.; Jensen, P.A.; Jensen, A.D.; Steibel, M.; Spliethoff, H.; Glarborg, P. Influence of fast pyrolysis conditions on yield and structural transformation of biomass chars. Fuel Proc. Technol. 2015, 140, 205–214. [Google Scholar] [CrossRef] [Green Version]
  36. Dubitzky, W.; Granzow, M.; Berrar, D.P. Fundamentals of Data Mining in Genomics and Proteomics; Springer: New York, NY, USA, 2007; p. 178. [Google Scholar]
  37. Lewis, A.D.; Fletcher, T.H. Prediction of Sawdust Pyrolysis Yields from a Flat-Flame Burner Using the CPD Model. Energy Fuel 2013, 27, 942–953. [Google Scholar] [CrossRef]
  38. Wagenaar, B.; Prins, W.; van Swaaij, W. Flash pyrolysis kinetics of pine wood. Fuel Process. Technol. 1993, 36, 291–298. [Google Scholar] [CrossRef] [Green Version]
  39. Ontyd, C.; Pielsticker, S.; Yildiz, C.; Schiemann, M.; Hatzfeld, O.; Ströhle, J.; Epple, B.; Kneer, R.; Scherer, V. Experimental determination of walnut shell pyrolysis kinetics in N2 and CO2 via thermogravimetric analysis, fluidized bed and drop tube reactors. Fuel 2021, 287, 119313. [Google Scholar] [CrossRef]
Figure 1. Sketch of model development process. * Semi-2D model development described elsewhere [19].
Energies 14 01018 g001
Figure 2. Example of fitting the 0D model to the semi-2D cylindrical model, here for a dry particle of d p = 1510 μ m, AR = 2, and ρ = 700 kg/m 3 with T g = 1600 K.
Energies 14 01018 g002
Figure 3. Correlation coefficient chart. Numbers give the r-values for the different correlations, dots show combinations of the input parameters constituting the data points, the magenta lines are the best straight lines through the dots, and the bars show the distribution for that specific input parameter. Correlation coefficient charts are used to illustrate if two input parameters or input and output parameters are correlated. Consequently, it can, among other things, be seen from a coefficient correlation chart whether the effect of the input parameters can be separated in the model, and it can be seen if the spans of the input parameters are represented adequately.
Energies 14 01018 g003
Figure 4. Reaction rate as a function of initial particle radius for particles simulated with the semi-2D code with ρ = 700 kg/m 3 , A R = 2.
Energies 14 01018 g004
Figure 5. Arrhenius plots for the fitted values for A and Ea for different aspect ratios for four particle sizes, ρ = 700 kg/m3, Tg = 1600 K. The Arrhenius parameters have been used to generate Arrhenius plots for a smaller temperature interval to illustrate the effects of the input variables.
Energies 14 01018 g005
Figure 6. Comparison of l o g ( A ) and E determined from a fit to the semi-2D model and as predicted by the 0D lumped kinetics from model 2 and 2, see Table 3 and Table 4. Best fit linear regressions have r 2 = 0.97 and r 2 = 0.95 for the l o g ( A ) and E graphs, respectively.
Energies 14 01018 g006
Figure 7. 0D model with the apparent kinetics modeled by the PLS model given in Equations (6) and (7) compared to a semi-2D devolatilization model [19]. ρ = 700 kg/m3, Tg = 1600 K.
Energies 14 01018 g007
Figure 8. Comparison of the time predicted by the semi-2D model and the 0D model with the best fit linear regression r 2 = 0.97. Conditions for data points are listed in the Appendix A.
Energies 14 01018 g008
Figure 9. Arrhenius plot comparing the presented model to lumped kinetics literature data for small ( d p = 0–112 μ m), medium ( d p = 112–616 μ m), and large ( d p = 616–2000 μ m) particles from Johansen et al. [10]. This model accounting for both kinetics and heat transfer is based on experimental data from two single particle combustors (HR = 10 2 –10 3 , T g = 1480–1831 K, d p = 1790–5800 μ m), (HR = 30, T g = 1050–1267 K, d p = 10 900 μ m) and an entrained flow reactor (HR = 10 5 , T g = 1405–1667 K, d p = 63–90 μ m), and kinetic data from Wagenaar et al. [38] obtained in an entrained flow reactor (HR = 2–12 K/s, T g = 773–873 K, d p = 100–212 μ m), and parameters from Ontyd et al. [39] obtained in a drop tube reactor (HR 3.7 × 10 3 –7.8 × 10 3 K/s, T g = 950–1300 K, d p = 100 μ m). The reaction rate predicted by the model depends on particle size, density, and aspect ratio. Here, ln(k) is shown for A R = 1 for comparative reasons, as the literature data are reported for spherical particles. The model’s ability to account for density and particle size changes means it covers a wider area, here shown in dark gray. Extrapolations of both the model presented here and literature models are shown in light gray.
Energies 14 01018 g009
Table 1. Input parameters to the 0D model.
ParameterValueRef.
h [J/(s m 2 K)]Estimated, empirical function of C p , g etc. [24]
Y * [-]Estimated, empirical function of T g etc. [24]
ϵ [-]0.85 [25,26]
C p , g [J/(kg K)] ( 19.50583 + 19.88705 × T g 1000 8.598535 × ( T g 1000 ) 2 + . . . [27]
. . . 1.369784 × T g 1000 3 + 0.527601 × 1000 T g 2 ) × 1000 28
C p , d r y w o o d [J/(kg K)] C p , d r y w o o d = ( g 1 + 2 × g 2 ) × 1000 × R /7.72 [28,29]
g 1 = z 1 2 × e x p ( z 1 ) / ( e x p ( z 1 ) 1 ) 2
g 2 = z 2 2 × e x p ( z 2 ) / ( e x p ( z 2 ) 1 ) 2
z 1 = 380 / T
z 2 = 1800 / T
Table 2. Input parameter span.
ParameterSymbolUnitMinMax
RadiusR μ m39.41560
Density ρ kg/m 3 7001300
Gas temperature T g K13001900
Aspect ratio A R -1.018
Table 3. Table of tested partial least squares regression (PLS) models for obtaining values of A. All models have two PLS components. ExpVar = explained variance, RMSECV = root means squared error of cross validation. x = parameter included, - = parameter not included.
No. ρ T g AR rAExpVarXExpVarYRMSECV A
kg/m 3 K μ ms 1 %%s 1
1xxxxlog(x)47871.3
2xxxlog(x)log(x)56970.60
3xxxx 1 / 2 log(x)53950.83
4xxxx 1 / 3 log(x)54960.69
5xxlog(x)log(x)log(x)56970.61
6xlog(x)xlog(x)log(x)55970.60
7xx 1 / 2 xlog(x)log(x)56970.59
8xx 1 / 3 xlog(x)log(x)56970.60
9x1/xxlog(x)log(x)55970.59
10log(x)xxlog(x)log(x)56970.60
11xx-log(x)log(x)65970.61
12-xxlog(x)log(x)65970.57
13-x-log(x)log(x)53960.61
Table 4. Table of tested PLS models for obtaining values of E. All models have two PLS components. ExpVar = explained variance, RMSECV = root means squared error of cross validation. x = parameter included, - = parameter not included.
No. ρ T g AR REExpVarXExpVarYRMSECV E
kg/m 3 K μ mJ/mol%%J/mol
1xxxxx498321 × 10 3
2xxxlog(x)x579511  × 10 3
3xxxx 1 / 2 x549115  × 10 3
4xxxx 1 / 3 x569313  × 10 3
5xxlog(x)log(x)x579511  × 10 3
6xlog(x)xlog(x)x569611  × 10 3
7xx 1 / 4 xlog(x)x579611  × 10 3
8xx 1 / 3 xlog(x)x579611  × 10 3
9x1/xxlog(x)x569611  × 10 3
10log(x)xxlog(x)x579511  × 10 3
11xx-log(x)x679511  × 10 3
12-xxlog(x)x659511  × 10 3
13-x-log(x)x549512  × 10 3
Table 5. Regression vectors for A (model 2) and E (model 2).
ParameterReg. AReg. EReg. AReg. E
PreprocessedPreprocessedRaw DataRaw Data
Intercept0020.1922.8567 × 10 5
log(R)−0.91578−0.33747−4.0709−52,955
ρ 0.0361810.0717020.0004892413.222
AR−0.0304360.0043212−0.04323483.703
T g −0.26579−0.87356−0.0043317−75.003
Publisher’s Note: MDPI stays neutral with regard to jurisdictional claims in published maps and institutional affiliations.

