Article

Users’ Sensations in the Context of Energy Efficiency Maintenance in Public Utility Buildings

by
Edyta Dudkiewicz
*,
Marta Laska
and
Natalia Fidorów-Kaprawy
Faculty of Environmental Engineering, Wroclaw University of Science and Technology, Wybrzeże Wyspiańskiego 27, 50-370 Wroclaw, Poland
*
Author to whom correspondence should be addressed.
Energies 2021, 14(23), 8159; https://doi.org/10.3390/en14238159
Submission received: 20 November 2021 / Revised: 1 December 2021 / Accepted: 1 December 2021 / Published: 5 December 2021

Abstract

:
Research towards understanding the relationship between maintaining thermal comfort and energy efficiency in the public utility buildings was undertaken among 323 1st year students during class hours. Questionnaires surveys and measurements of indoor conditions were performed. The article identified students’ sensations and perceptions concerning indoor conditions. Temperature, relative humidity, air velocity and CO2 concentration measured to assess room conditions showed that the auditorium had almost comfortable conditions according to the literature guidelines. The indices used to assess students’ perceptions were: Thermal Sensation Vote (TSV), Thermal Preference Vote (TPV), Air Freshness Sensation Vote (AfSV), Air Movement Preference Vote (AmPV), and Relative Humidity Preference Vote (RHPV). The interpretation of these indicators showed that while the students’ requests for temperature changes and increased air movement are adequate for the air conditions in the room, the evaluation of stuffiness and requests for changes in humidity levels are surprising. Striving uncritically to meet the desired room parameters, according to the users votes, can lead to deterioration of the air and not only the increase in energy consumption but even waste it. Better understanding of users’ preferences and behaviour and further application of this knowledge indirectly aim at increasing energy efficiency in buildings.

1. Introduction

Today, when analysing buildings, especially in the context of climate change and the approaching energy crisis, solutions are desired that lead to lower energy consumption. However, at this point the thermal comfort of the building users cannot be omitted. The influence of occupant behaviour is as important as the quality of the building envelope [1], therefore, the goals of reducing energy consumption in buildings will not be achieved without taking into account knowledge of occupants’ preferences and potential behaviour. When constructing new buildings from scratch, it is easy to implement all available and sophisticated solutions leading to energy savings. When existing buildings are considered, such improvements are not as easy to implement. The literature [2,3], International Energy Agency (IEA), European Council (EC) reports and documents [4,5,6,7] indicate that these buildings represent a significant potential in energy savings when simultaneously thermal comfort is one of the key elements influencing energy consumption [8].
In Poland, existing buildings, both residential and public utilities, are mostly naturally ventilated, equipped only with radiators, without any cooling system. In such constructions and implemented solutions, the main actions to maintain adequate internal conditions internal conditions (desired by users) internal conditions are opening or closing the windows and controlling temperature by using thermostatic heads or room thermostats. Building users’ behaviour, if they do not pay for the energy consumed (e.g., in workspaces) [9], is focused primarily on assuring their individual thermal expectations and overall well-being conditions and are leaning towards options that they perceive to be the most efficient in terms of providing comfortable thermal conditions without any awareness on energy efficiency issue [1]. Additionally, most of the users do not have a sufficient and proper knowledge about the correct level of comfort parameters, and thus their actions are focused on answering their actual comfort needs. Such situation, if not controlled would lead to excessive energy use, because of as frequent changes of temperatures in room.
Differences in users’ thermal perceptions could be related to their expectations of indoor environmental quality and may be higher in green or certified than in traditional office buildings [10,11,12,13]. Individual thermal comfort may also differ from the traditional approach to thermal neutrality defined in standards [14]. The indoor conditions of the human work environment and educational buildings are widely described in the literature [15,16,17,18,19,20,21,22] also for different locations around the world [23,24,25]. A school indoor environmental quality investigation reported that 64% of the tested classrooms did not meet the thermal comfort conditions and inadequate ventilation in some classrooms resulted in high concentrations of carbon dioxide (CO2) [26]. Thus, there is still a need for research on the influence of indoor environmental quality on students’ sensations in air-conditioned and naturally ventilated classrooms at universities with the special emphasis on understanding of human perceptions and users’ behaviours impact on building energy usage [23,26,27]. The relevance of motives and preferences can be illustrated by the rebound effect, e.g., in the case of residential renovation measures [1], where occupants maintain higher indoor temperatures after thermal upgrading and thus reduce the expected savings. Although the main factor influencing behaviour prior to renovation measures must have been the reduction of energy costs, increased energy efficiency has minimised the importance of this factor in favour of another: the desire for comfortable thermal conditions. It must be understood that thermal comfort is an individual sensation and is strictly related to energy efficiency of the building and human satisfaction from the indoor environment. The way in which users actively promote or passively accept higher comfort levels determines the effectiveness of measures to increase energy efficiency and reduce CO2 emissions [1]. However, the sensations described by standard indices do not go in line with real needs of the occupants, or the occupants cannot define them correctly due to problems with understanding the chosen comfort variables influencing human sensations. Therefore, there is a problem to find a solution that merges these aspects that are placed on two opposite poles. Nevertheless, creating healthy and desired indoor conditions is always in priority over reducing energy consumption [6,28]. One of the methods to assess the users’ perception and individual preferences in terms of thermal comfort is questionnaire survey. The presented paper is based on such a study carried out in the naturally ventilated lecture room.
The purpose of the article is to show that the preferences of indoor conditions of users can differ significantly from each other and are not always in line with the scientific interpretations and definitions of thermal comfort scales. Therefore, it must be considered if the layperson can control the indoor environment and maintain energy consumption at a low level at the same time. The authors’ purpose is also to determine the students’ willingness to work and subjective factors affecting it, as well as their well-being during the lectures.

2. Sultriness

One of the factors that influence well-being of the people inside the buildings is the level of sultriness caused by the high temperature and relative humidity [29]. As will be demonstrated in the following part of the article, it is the most difficult issue for respondents to recognize. Thus, in this chapter, a brief theory of the concept of sultriness is presented.
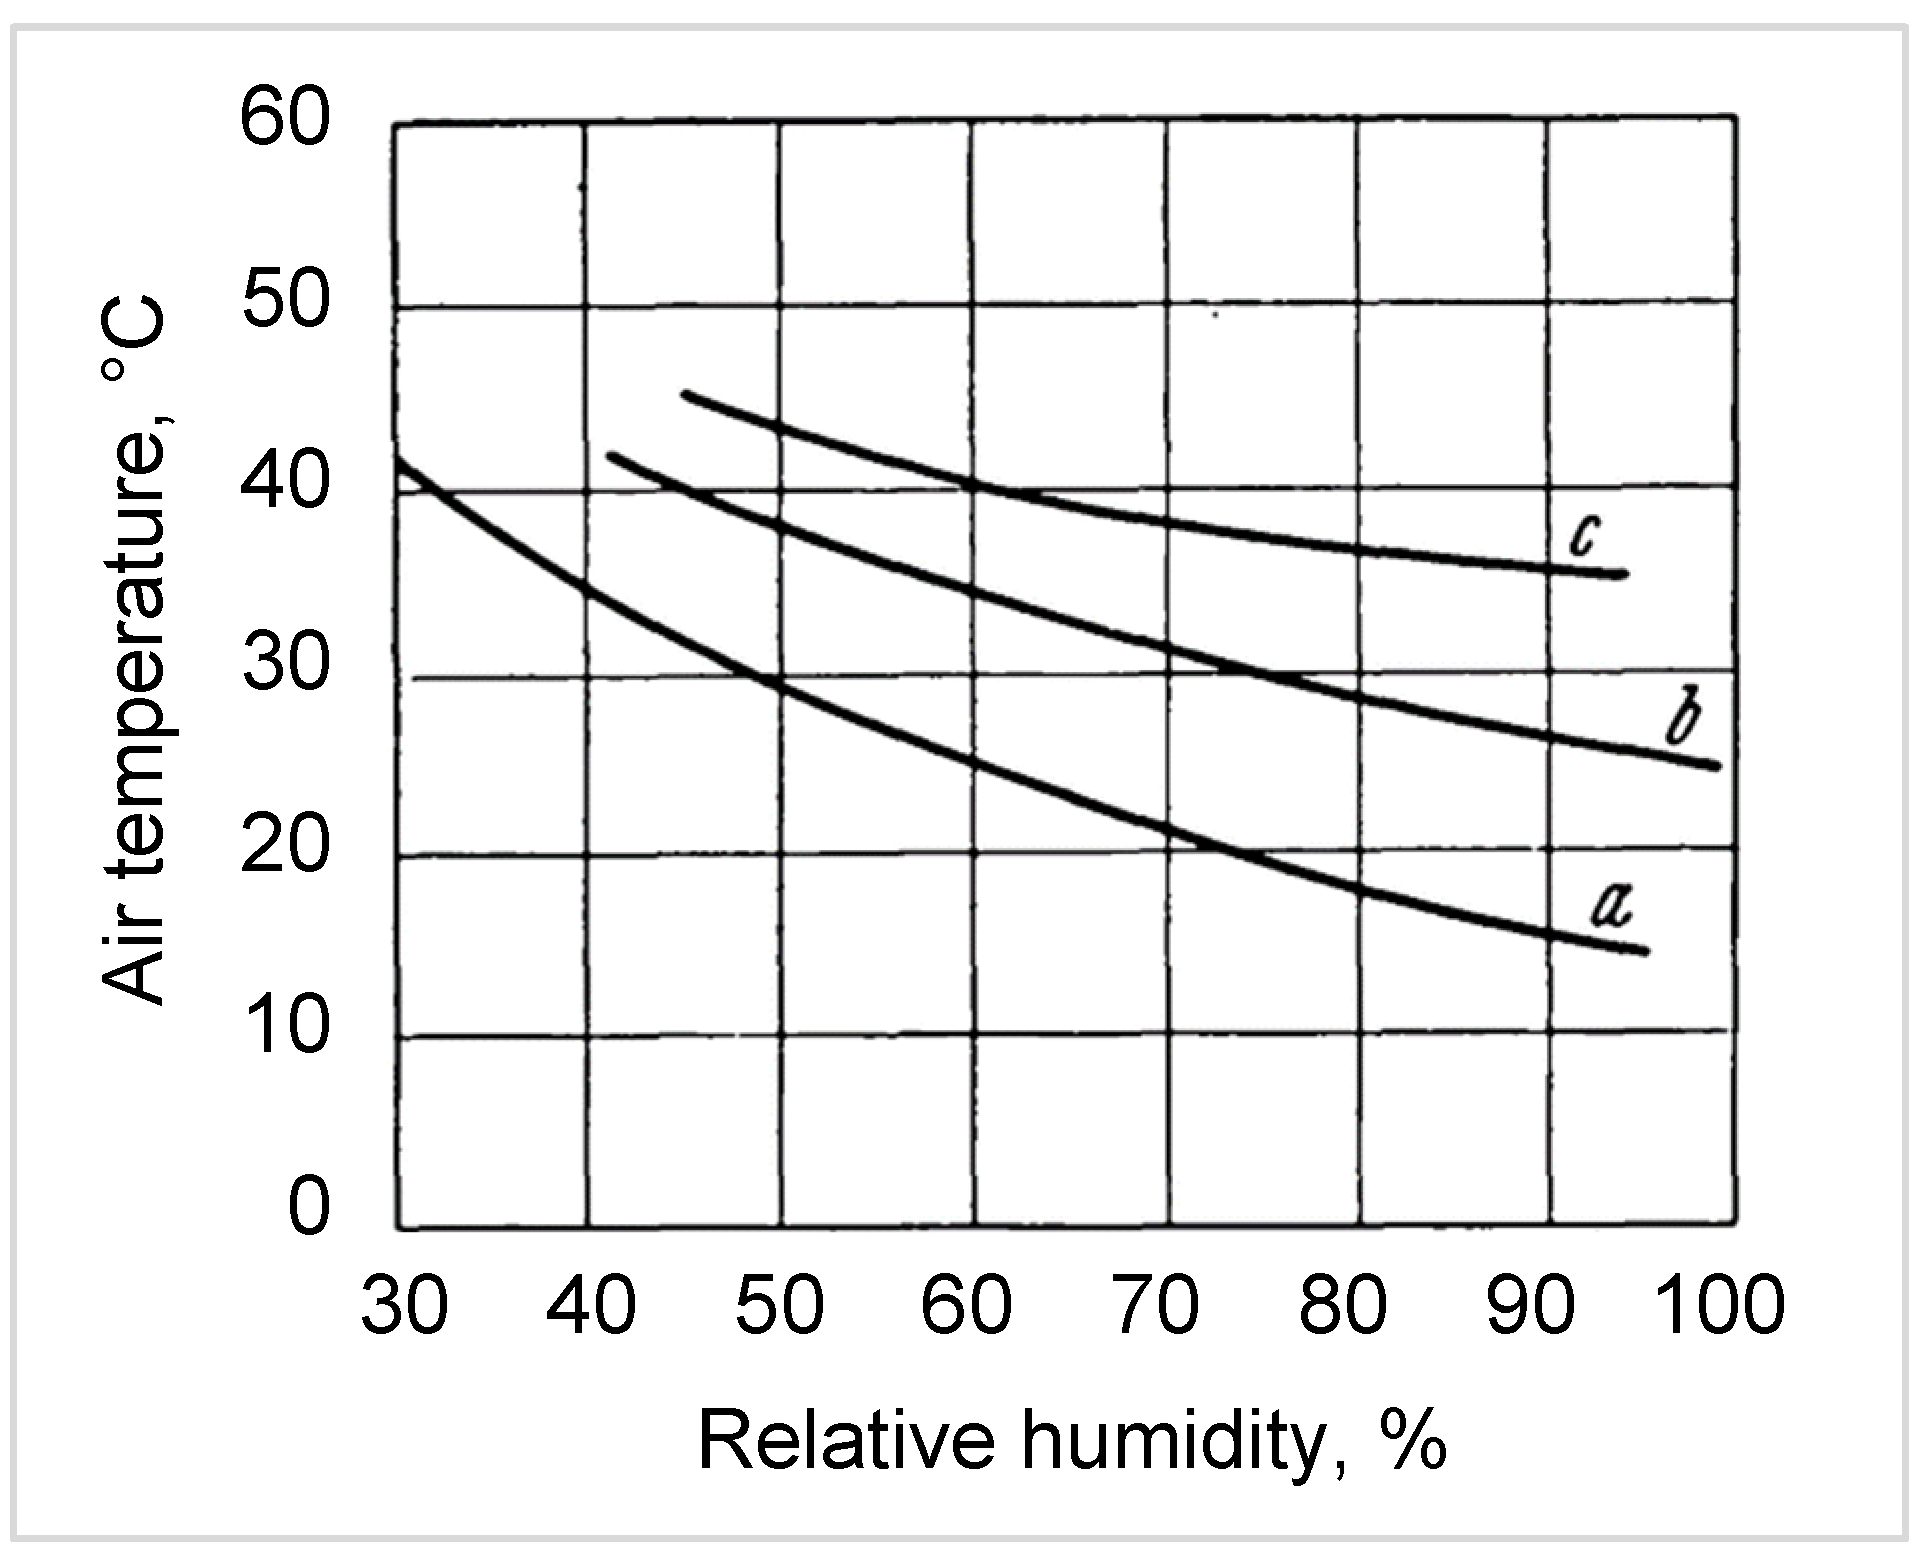
The upper limits of relative humidity for the sensation of thermal comfort at a specific temperature were indicated by Lancaster (1898) and presented as a graph, which later became known as the Lancaster-Castens sultriness curve [30]. The graph of the sultriness curve is shown in Figure 1.
The curve defines the boundary of sultriness with respect to temperature (T in °C) and relative humidity (RH in %). What is interesting, it indicates that the sultriness does not occur at temperatures below 16.5 °C even if the relative humidity reaches 100% [30].
This curve has been approved by many researchers, while the distance from the stuffiness border is described by the Equation [31]:
D = RH 21.55 100 T + 1.3
If D is equal to 0, the parameters express the sultry border, while positive values of D in the Equation indicate sultriness area. Some discrepancies can be noted between the values calculated and determined from the chart (Table 1).
When the parameters of the room are in the zone of stuffiness, the warm air inhaled by a person is not able to cool the body through the process of convection and evaporation. At high air temperatures, relative humidity determines the intensity of sweat evaporation. In general, dry and cool air is perceived as fresh and clean. On the other hand, air with the same chemical composition and degree of pollution, but with a higher temperature and humidity, gives the impression of being stale and stuffy [32]. Bad thermohumid conditions can cause dizziness, a feeling of shortness of breath, or weakening of the body.

3. Methodology

3.1. Participants and Experimental Procedure

The winter semester at the Polish university lasts 15 weeks. It starts on 1 October and ends at the end of January. The survey was carried out for three days: at the beginning (marked as day 1), in the middle (marked as day 2) and at the end of the semester (marked as day 3). Each day, the experiment was carried out in two different groups (A and B) among the same participants and thus in total 6 lectures were surveyed. The occupancy of the lecture room during the semester ranged from 17 to 110 people. Finally, a total of 323 questionnaires were collected. The numbers 1, 2, and 3 denote the beginning, the middle, and the end of the semester survey, respectively. At the end of each lecture, the students were asked to complete an anonymous questionnaire form (Appendix A). The structure of the survey and all background information are presented in Table 2, namely: the date of the classes, the number of participants, room occupancy, age, gender. The timing structure of the experiment carried out is presented in Figure 2. Participation in the survey was not paid.

3.2. Building and Room Characteristics

The lecture room (Figure 3) where the survey was conducted is located in the building constructed in 1955 on the top floor and has a form of an auditorium. The space area is about 360 m2 with a decreased height of 7.9 m in the front to 5.5 m in the back of the room. The sunlight is delivered to the room via facing west double-glazed windows of 22.6 m2 area equipped with internal sun blinds and 20 ceiling skylights. The room, dedicated to 300 students, is naturally ventilated and served with a classical radiator-based water central heating system.
The building itself is located in the most representative part of university campus [33,34,35], in the city centre and has status of a historic building [36]. Following Polish law, such building is not subject to the restrictive energy efficiency regulations, as it has other certain valuable architectural qualities [37,38]. The most popular solution for improving the old buildings’ energy efficiency, built between 1940–1980 of the 20th century in Poland, is to apply thermal modernization of their envelopes. However, the research [39] has shown large discrepancy between expected (theoretical)—higher and real—lower effect of such improvements. Additionally, any change or improvement in historic buildings is not easy to implement and must be approved by the municipal historic preservation officer.

3.3. Physical Measurements

The following indoor parameters were measured: indoor air temperature (Ta), relative humidity (RH), air velocity and CO2 concentration. Data were measured by an indoor air quality data loggers Rotronic CL11 and SensoData5500. Continuous measurement of the parameters was conducted for every survey, i.e., a 1.5-h lecture. The device was at the central point of the lecture room on the level of the student’s desk, away from any occupant’s influence. The external temperature was downloaded from the university building energy management system.

3.4. The Survey

Questionnaires are an important tool for analysing the thermal, acoustic or lighting conditions of indoor environments, subjective perception of occupants and energy savings preferences [20,40,41,42].
The survey questionnaire form (Appendix A), used in the described research, was divided into 4 parts:
  • Overall data: questions related to date, age, gender, height, weight, clothes.
  • Thermal sensations: (a) thermal comfort assessment (TSV—Thermal Sensation Vote), (b) indoor air quality (fresh/stuffy air; AfSV—Air Freshness Sensation Vote), and (c) preferences related to temperature (TPV—Thermal Preference Vote), relative humidity (RHPV—Relative Humidity Preference Vote) and air movement (AmPV—Air Movement Preference Vote). The evaluation of these parameters was carried out on a 7-point scale (from 1 to 7, which corresponds to a scale from −3 to +3 according to standard ISO 7730). The scales used are presented in Table 3.
  • Willingness to work. On the scale from −3 to +3 students assess their willingness to work. If the student marked that he/she is unwilling to work during class hours, then he/she should specify what factors would positively affect his/her willingness to work.
  • Health. The students answered the questions about their individual sensations related to their body and health. There were two possible answers: YES and NO for the following observations: headache, dizziness, drowsiness, dried/irritated eyes, dried/irritated nose, problem with visual acuity, problems with concentration, dried/irritated skin, and general fatigue.

4. Results

4.1. Thermal Conditions

The measured physical parameters describing the outdoor conditions and indoor climate in the auditorium room are presented in Table 4.
The outdoor temperature varied substantially from 22.0 °C in October to 2.0 °C in January. Indoor temperatures deviated slightly from 21.1 °C in December to 25.5 °C in October. The internal conditions generally did not exceed the values considered to be within the comfort range for heated and free-running buildings that were defined in [43] and presented in Figure 4 and values were also generally in the comfort range according to the adaptive comfort theory. Furthermore, the differences between indoor air and operative temperatures were in a reasonable range from 0.01 to 0.84 °C but mostly lower than 0.5 °C. Only during the first session the operative temperature was slightly above the upper range for free-running buildings (dashed red line). During this set of measurements, central heating was off due to the high instantaneous external temperature (above 21 °C), but the weighted mean running outdoor temperature could indicate for the general need for heating. In December and January, the external temperatures were much lower. The building was heated, therefore, the chart describing the comfort range follows different equations and is less steep. However, the mean operative temperature is still in the comfort range defined as ±2 °C from the comfort line. It is also important to note that both the air temperature and the operative temperature were similar during this research.

4.2. Students’ Sensations and Preference Votes

Analyzing Figure 4 one can notice that during the first day (A1, B1) the internal conditions are on the upper limit of the operative temperature in terms of adaptive comfort theory. Simultaneously, the second day (A2, B2) indicates lower temperatures, close to bottom margin, and the third day is the most optimal in terms of indoor temperature, when the measured temperatures are placed in the middle of the comfort range.
During the survey, students were asked to define their thermal sensation votes (TSV). The summary of their responses is presented in Figure 5. The responses generally fit the internal temperatures. On the first and third measurement days, it is centred ‘neutral’ or slightly shifted toward warm thermal sensation, while on the second measurement day it is almost symmetric with a slightly higher share of −1 than of +1.
Figure 6 shows the distribution of thermal preference votes (TPV). For the first and third measurement days, the TPV are centred on 0 (no change) and −1 (slightly cooler) and ‘no change’ and ‘slightly warmer’ during the second measurement day. Overall, during the whole survey period, the students evaluated their thermal environment mainly as warm, and their thermal preference was slightly cooler.
On the first day of the survey in the B group, room occupancy was 37% (Table 2) and indoor and outdoor temperature values were the highest, TSV were also the highest. The mean TSV was 0.97. On the second day of mid-term measurements for the A group, when the auditorium load was the lowest (only 6%), the room temperature was also the lowest of 21.1 °C, and the mean TSV was −0.24. It was the only case where TSV took a negative value and more than 50% of the students expressed a desire to increase the room temperature (Figure 5 and Table 5). In winter, in January (the third test day), the evaluation of TSV for the B group was higher than for the A group, while the TPV was adequately lower. The responses for all six subgroups about sensations: TSV, AfSV and preferences: TPV, AmPV, and RHPV are summarized in Table 5.
Student responses about the indoor air quality in the examined lecture room (fresh/stuffy air) are presented in more detail in Figure 7 with bubble chart. In Figure 7 it is shown that during the first and second measurement day, the distribution of AfSV is shifted more towards stuffy in more numerous groups B1 and B2, and towards fresh in smaller groups A1 and A2. Only during the third measurement day, the distribution in both groups is a bit more similar. In six questionnaire surveys, the mean grade of air freshness was from −0.44 to 1.0. On the day when the air was assessed the most stuffy, the room had the highest concentration of CO2 (1668 ppm).
The distribution of the students’ preference votes for stronger/weaker air movement (AmPV) is presented in Figure 8. In 5 groups, most of the students preferred that the air movement in the lecture room increase (Figure 8, Table 5). Even at higher air temperatures in the room (test day 1), more students preferred that the air moved faster than it was cooler. It can be noticed that the AmPV may be related to both the sense of stuffiness and temperature. This relationship was confirmed by Fang [44], who also found that perception of air freshness and acceptability improved greatly as the temperature decreased and the intensity of fatigue, headache, and difficulty in thinking clearly decreased at lower levels of air temperature.
Students’ preferences about more humid or drier air are shown in Figure 9. Although the respondents assessed the air in the lecture room as a bit stuffy, only a small share preferred the air to be drier. Many of them did not want the air relative humidity to change and some of them wanted the air to be more humid (Figure 9 and Table 5). This may mean that the students do not understand that humid air would increase the feeling of stuffiness.

4.3. Students’ Willingness to Work and Well-Being

In an open nature question students were asked to identify a factor that would positively influence their motivation to work during a lecture when they feel reluctant to be attentive. Figure 10 shows the percentage distribution of willingness to work for six subgroups, which shows that the majority of people were willing to work. The highest assessment of willingness to work was in the first class in the A1 group.
The students who were reluctant to work indicated factors that would positively affect their attitude to work. Some people responded that they felt reluctant to work but did not give an answer as to what would make them change attitude. The received responses were divided into 6 categories and presented in Figure 11.
Figure 12 shows the percentage distribution of students’ perceptions and feelings compiled for all test days. The answer ’yes’ is marked in blue and was chosen when discomfort occurred; ‘no’—is coloured orange, when the students did not report any aliments.
Most of the respondents, about 63%, complained of drowsiness and 54% of general fatigue; 44% confirmed problems with concentration and 31% with visual acuity. Headaches were reported by 18%.

5. Analysis and Discussion

5.1. Temperature

As mentioned in the introduction, the thermal comfort, as well as energy saving aspects, strongly depend on internal temperature. Higher temperature means higher energy use in heating season, so it is important to evaluate the neutral or preferred temperature, which would be satisfying for users but not too high (for energy saving purposes).
One of the most popular methods for estimating the neutral temperature is the linear regression of Thermal Sensation Votes (TSV) and indoor air temperature (Ta) or operative temperature (To). The linear regression equation describing the relation between TSV and To for the investigated study in the naturally ventilated lecture room is defined as follows:
TSV = 0.26 · T o 5.50
The calculated coefficient of determination amounts R2 = 0.82 (p < 0.005) and indicate the strong relationship between To and TSV. The neutral operative temperature calculated according to Equation (2) for the described study is 20.97 °C. This value is generally lower than the mean operative temperatures estimated during the previous studies, listed in Table 6 [45,46,47,48,49,50]. In the same auditorium, the authors conducted thermal comfort research in the spring semester. Then the calculated neutral operative temperature equalled to 21.88 °C [50] and was thus higher than for the winter and transition period. Cena and de Dear [45] had similar observations, they calculated a neutral winter temperature of 20.38 °C and 23.30 °C in summer (Table 6). This is in line with the shaping of the lower and upper limit of comfort temperatures presented in Figure 4 in relation to free-running and heated buildings, as well as to the variability of mean running external temperature. This could lead to the idea, that by making the internal temperature dependent on mean running external temperature could result in higher energy efficiency and in keeping users satisfied with conditions when compared to maintaining constant higher room temperature.
It is important to note that in many publications the ‘neutral’ answer was pointed out that it is not always the preferred option [14,23]. The latest research [12,51] indicates that the classical approach, that assumes that the answers on a 7-point scale should not be equally distanced and three middle answers should not be interpreted as comfort conditions. Furthermore, the methods to assess comfort conditions widely used by engineers, based on standards EN ISO 7730 and ASHRAE 55, are oversimplified. This approach fails to provide thermal comfort conditions in a built environment [
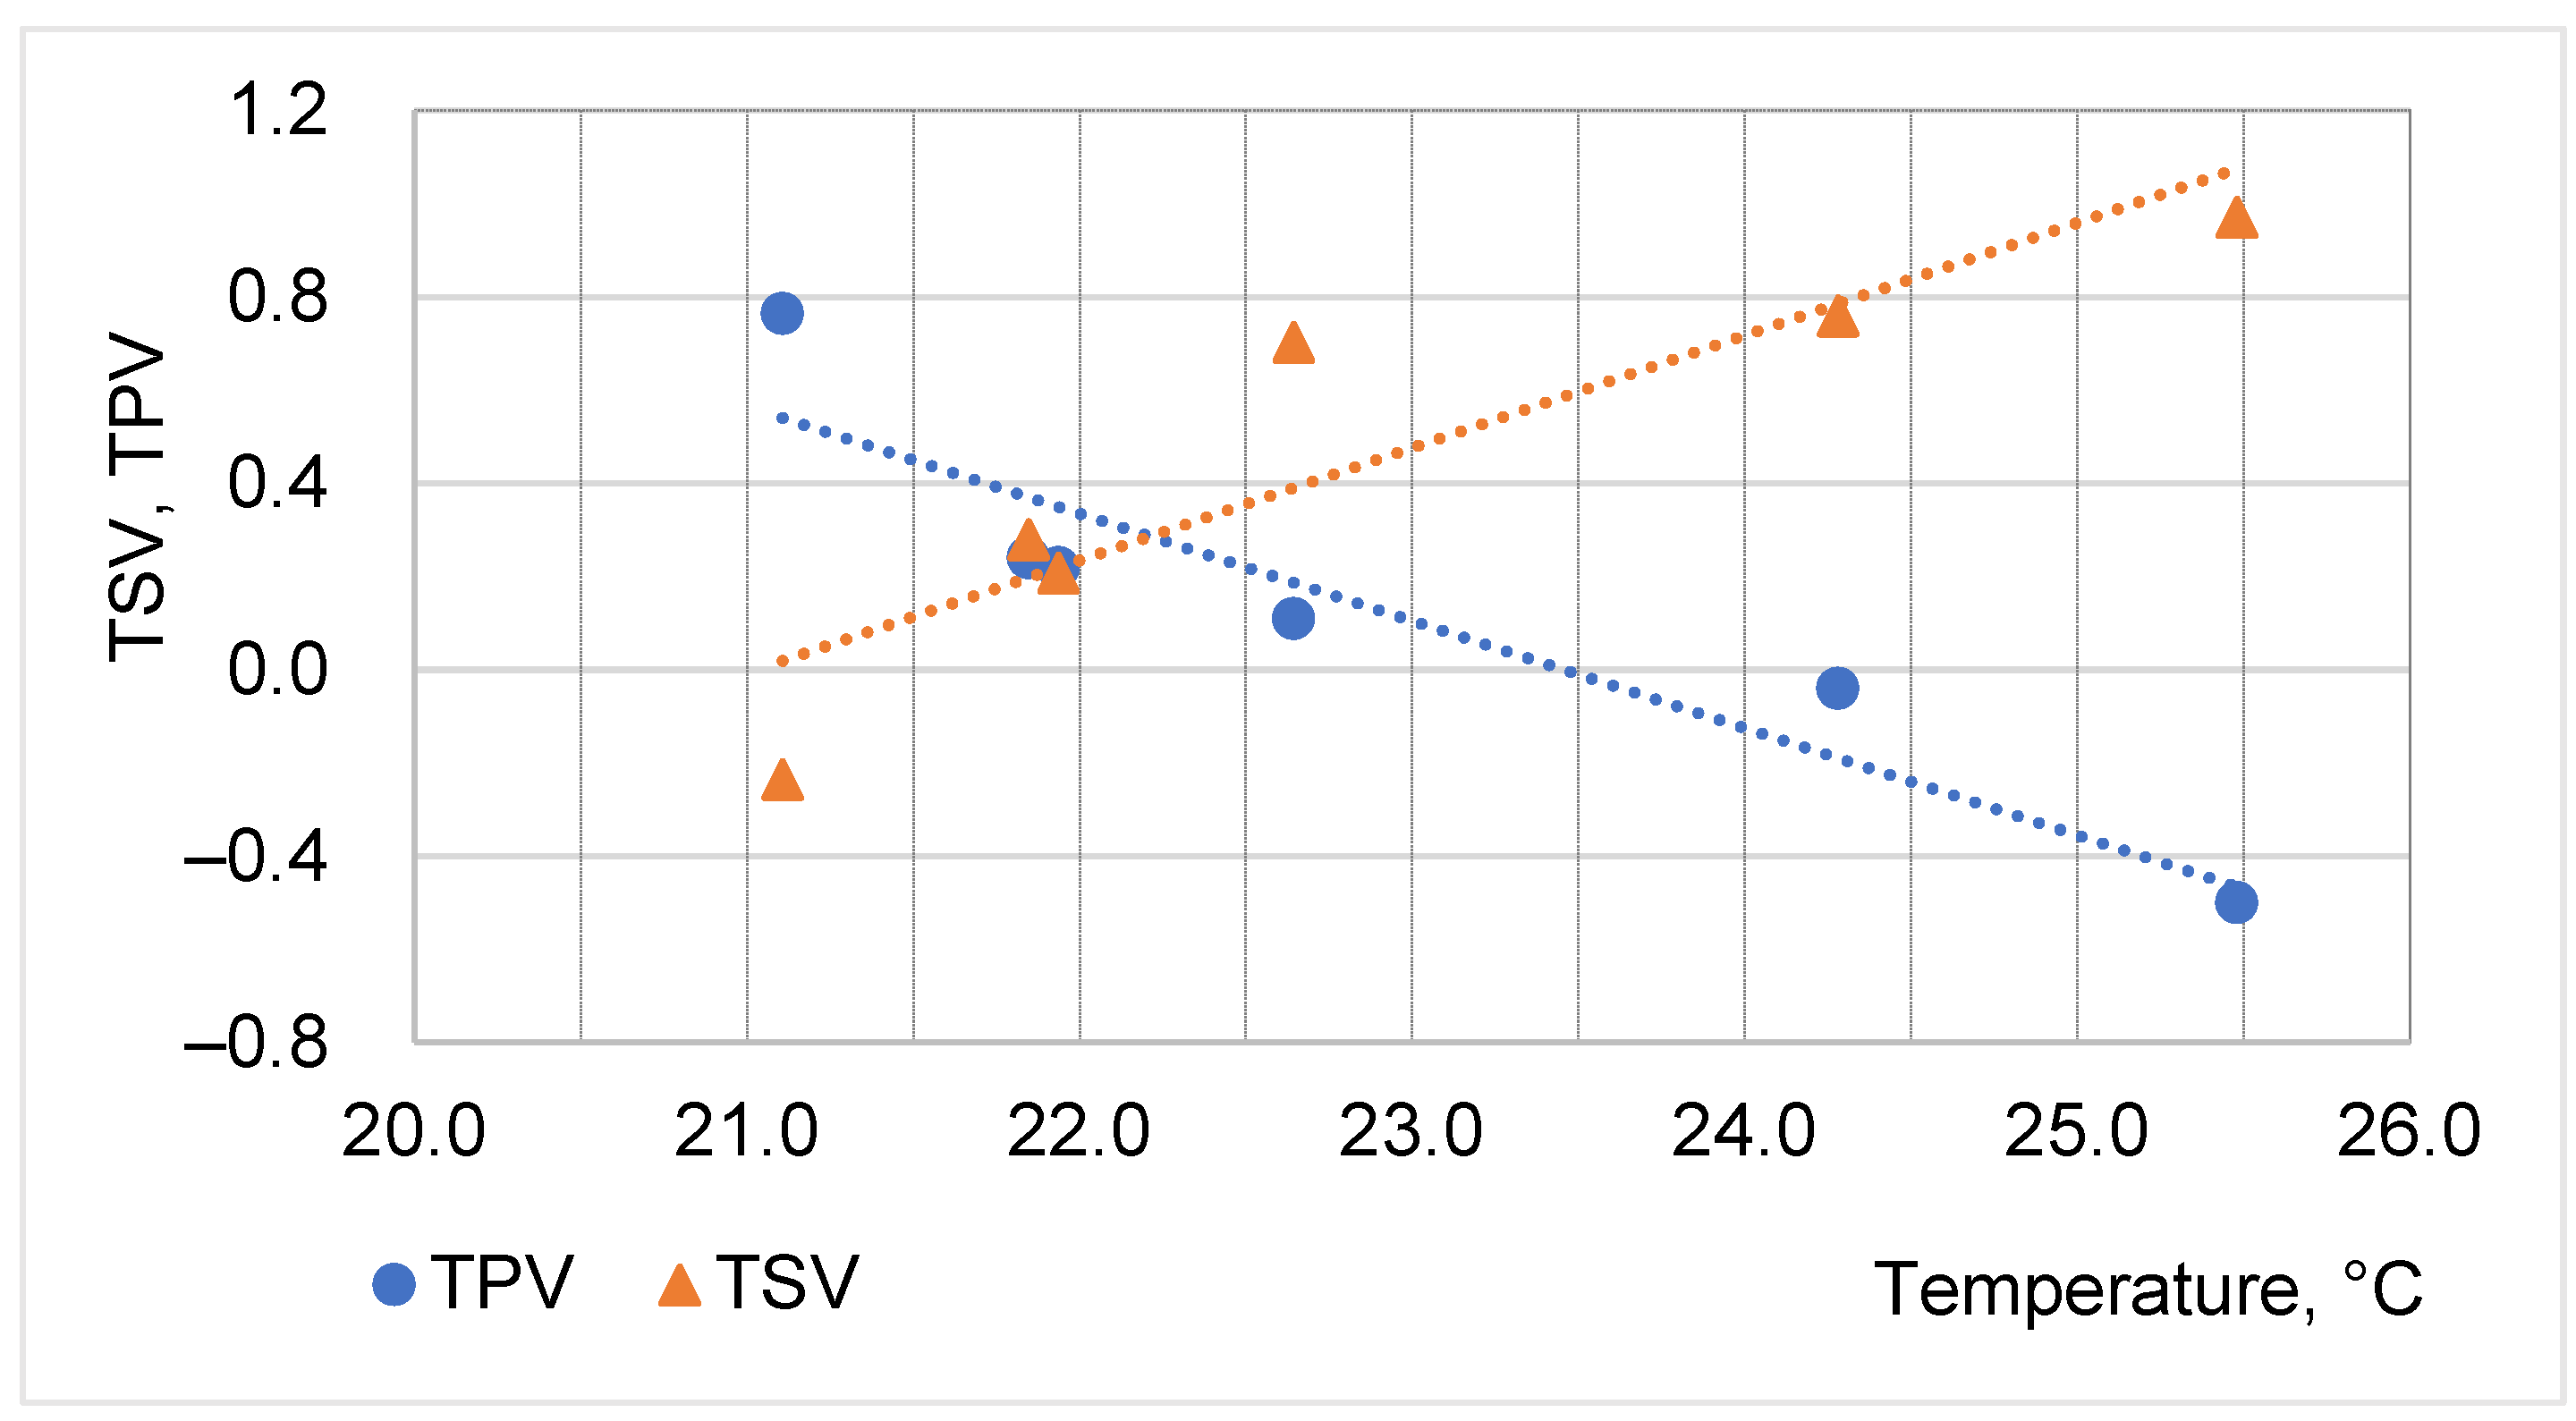
12]. The confirmation of this statement is the outcome of the current research. It indicates that, when the mean room temperature was 21.1 °C (group A2) and thus higher than neutral calculated from Equation (2), more than 50% of the respondents claimed for warmer conditions (mean TPV = 0.76). The relationship between TSV, TPV, and To for all research days and groups is presented in Figure 13. One can observe that the respondents indicate a temperature of about 24.0 °C as the upper limit of comfort conditions (TPV ≈ 0) and only at a temperature of 25.0 °C they start to claim for slightly cooler conditions.
An interesting issue is that during the winter season the design temperature for heating system sizing and energy calculations (according to EN12831) is 20 °C. This value is lower than the one preferred by the students. This indicates that on daily basis utilisation, the building may consume more energy than at it was designed and initially predicted. The aim of user behaviour and preferences studies is, among other, to bridge the gap between predicted (based on simulation) and actual (based on observation) energy consumption [1].

5.2. Freshness, Movement and Humidity of Air

The next important parameters of comfort conditions are air movement and air freshness [52]. During the whole research the measured air velocities reached very low values (
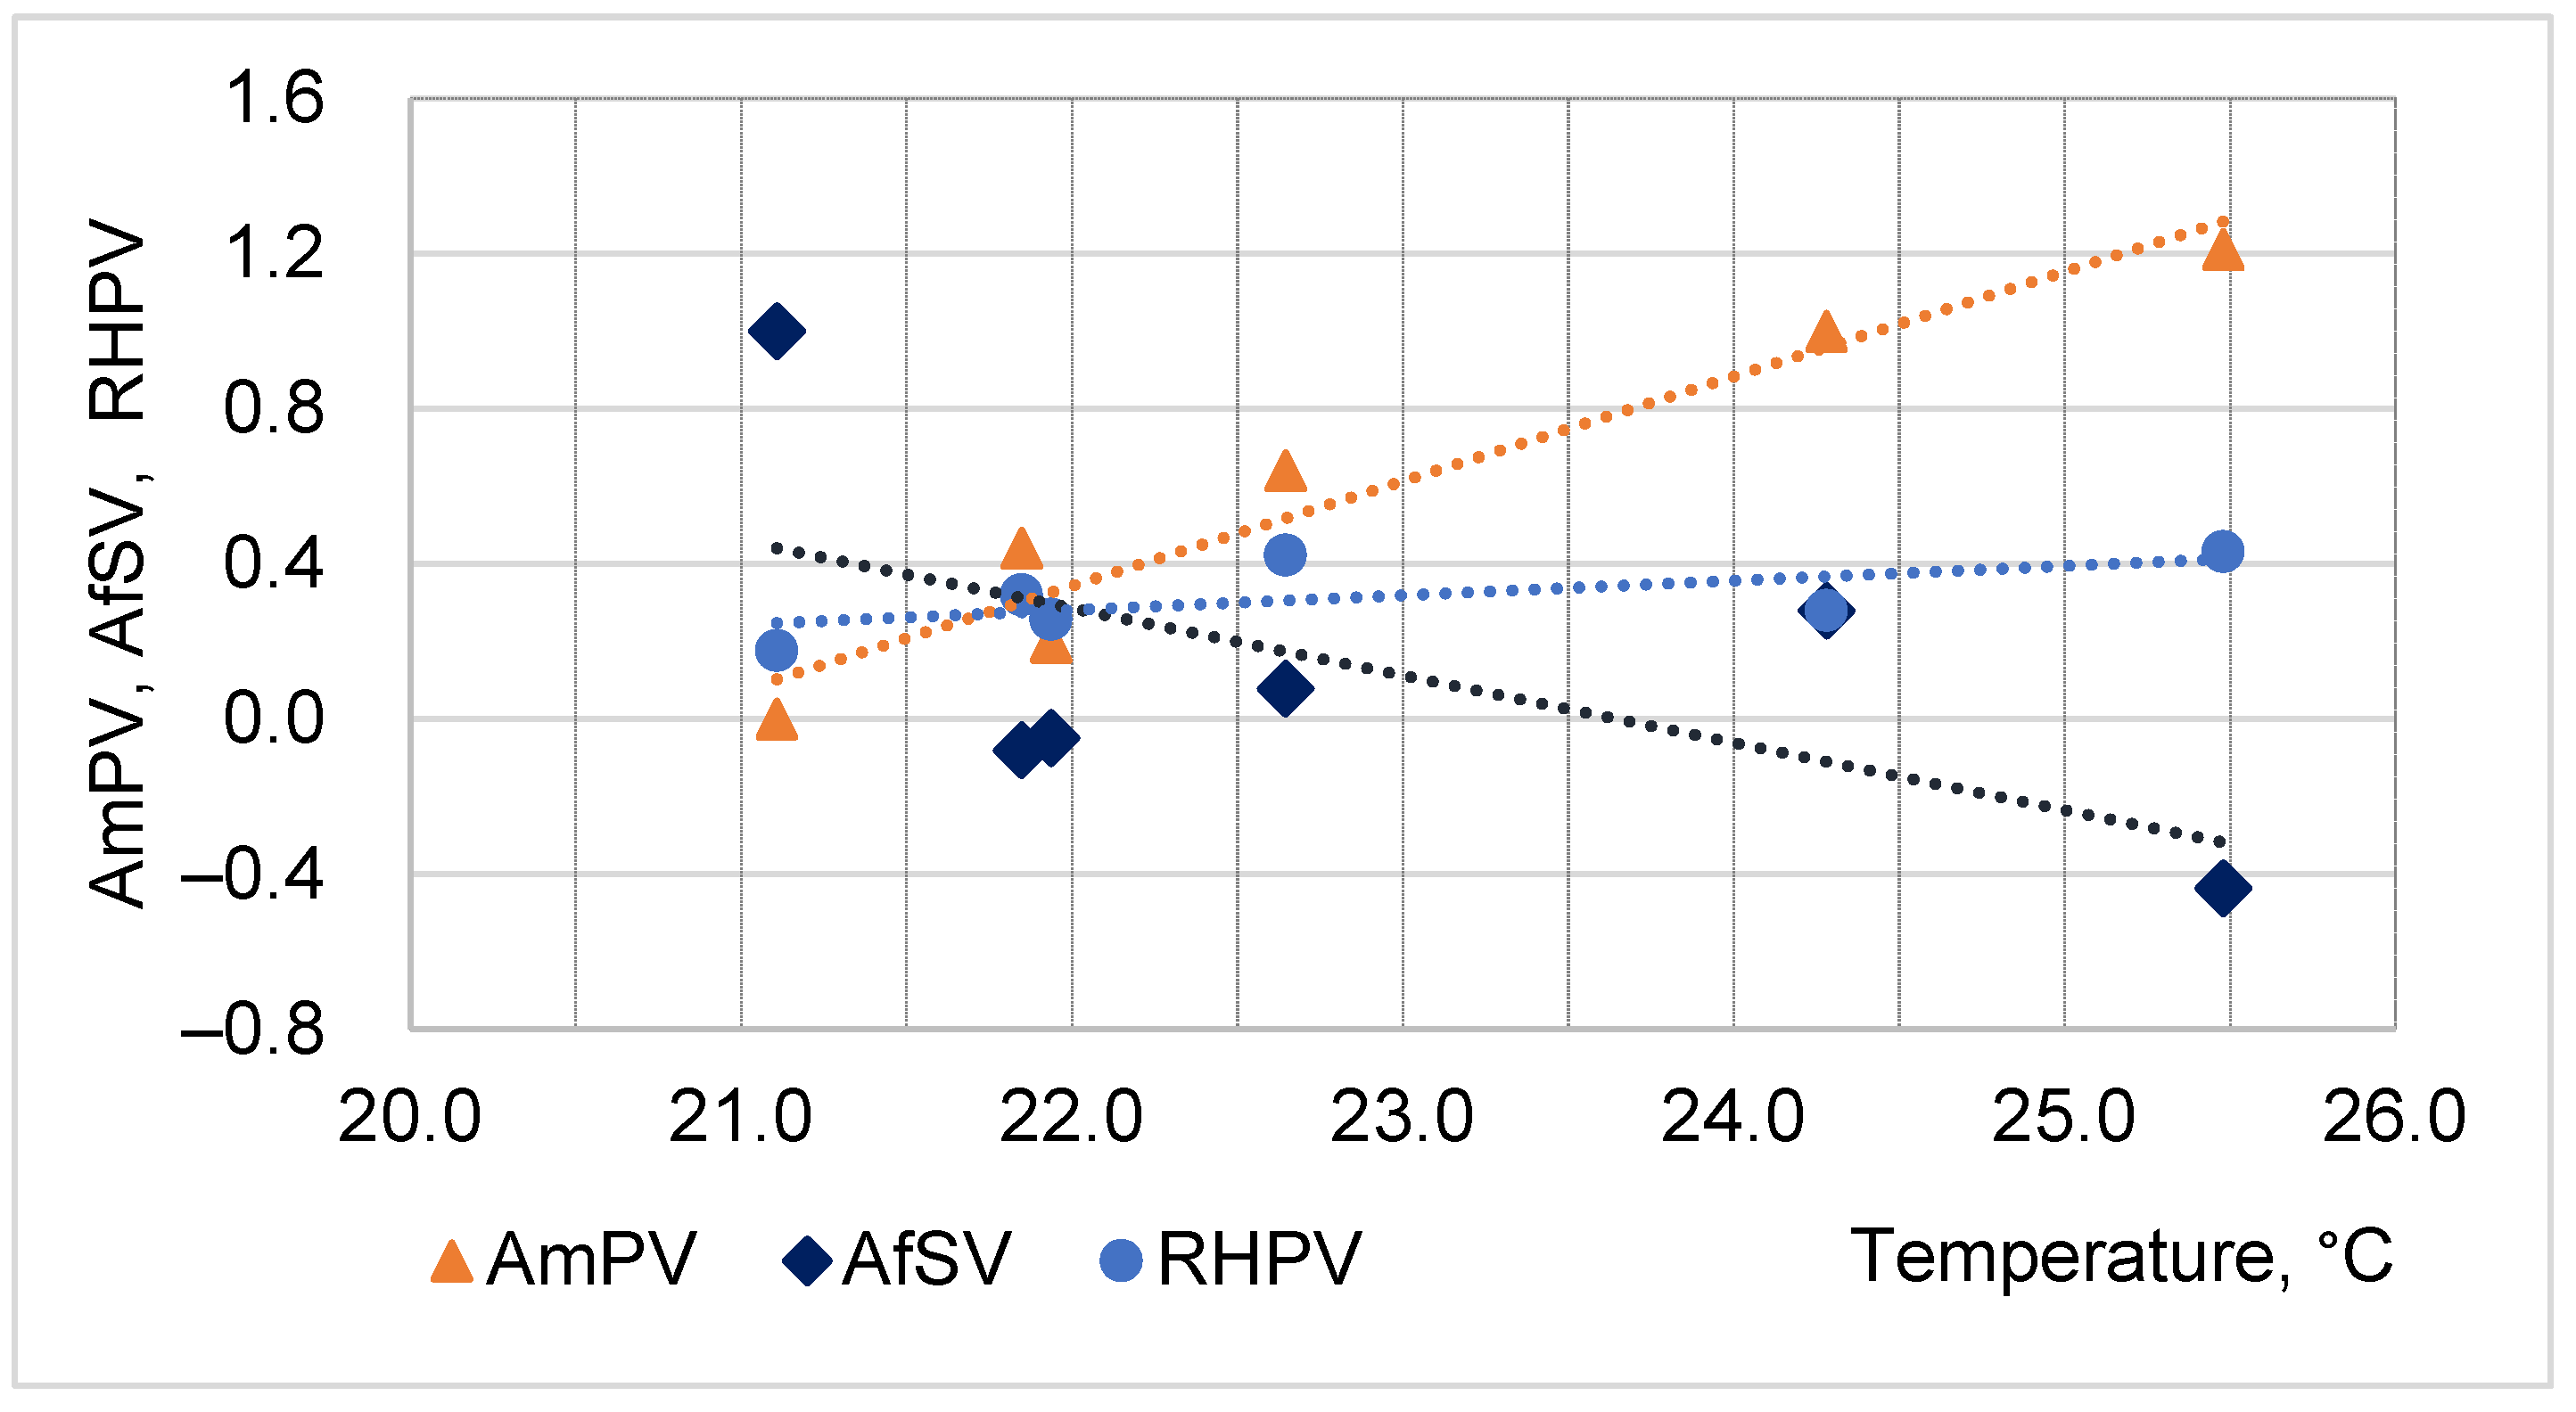
Table 4), because the auditorium is naturally ventilated, and thus suffers from the lack of proper air movement. The students’ preferences regarding the air movement (AmPV) consequently, throughout the whole study period, reach the values above zero almost in the entire temperature range (Table 5).
The relationship between AmPV and operative temperature is presented in Figure 14 and is described by the equation:
AmPV = 0.28 · T o 5.90
The lowest mean AmPV equal to 0 occurs simultaneously with the lowest operative temperature of 21.1 °C (group A2). When room temperature is the highest (25.5 °C, group B1), the mean AmPV is also the highest and equals 1.2.
The relationship between AmPV and TSV is presented in Figure 15. Most polls are placed in the first quarter of the chart, which means that with the growth of TSV, the need for air movement increases. Although AmPV is clearly correlated with operative temperature and TSV, the relationship between temperature To and AfSV is not so clear (Figure 14). The correlation coefficient did not confirm a strong statistical relationship. Generally, the lower the air freshness (AfSV), the more people declared the need for better room ventilation (AmPV). Furthermore, a similar trend can be observed showing the dependence of air freshness on the percentage of occupants demanding for cooling. When the mean AfSV = −0.44, 52% of students request cooler conditions (Table 5). The more air is perceived as fresh, the less people desire the room to cool down. This, together with the high level of higher temperatures’ acceptance in the transition period, rises the possibility that increasing the air exchange intensity (increasing air velocity) could delay the need to switch of cooling in rooms with air conditioning, and thus lead to energy savings.
Additionally, when room temperature is high, the air is assessed as stuffy (mean AfSV ≈ −0.44) but, when the room temperature is the lowest, the air is assessed to be fresh (mean AfSV = 1.0) and simultaneously the mean AmPV is the lowest (0.0).
The only way to control air movement in a naturally ventilated auditorium is to open and close the windows. In extreme cases, draughts (DR index according to EN 7730) causing thermal discomfort may occur locally. In the case of natural ventilation, it is extremely difficult to determine the amount of entering outside air and to control the energy consumption associated with its heating [53,54,55]. In order to improve air quality, it is recommended to increase the air change rate in the room. If ventilation rate is higher the electric energy use will also be higher [56,57]. Users of the buildings often have to choose between several behavioural options to achieve their goal. Such a goal could be, for example, to reduce thermal stress or increase air quality [1].
A further observation of the results of the questionnaires showed that regardless of the level of room relative humidity and whether the indoor conditions were perceived stuffy or not, the students demanded indoor air to be more humid. The authors were surprised by the RHPV index. On the day when the air humidity was 47% and the air was rated the stuffiest (group B1, AfSV = −0.44), up to 45% of the students requested an increase in the air humidity in the room, and only 10% a decrease in the relative humidity (Table 5). On the other hand, on the last day of measurement, when the air was quite dry (RH = 26.0–28.5%), fewer people expected an increase in humidity than on the stuffiest day. Simultaneously in all groups, only 8 to 18% of people expected the air to be drier. This may indicate a lack of students’ understanding of the physiological, natural cooling system of the human body, and a strong need to change the air conditions in the room due to their general malaise and poor air quality. For estimating relative humidity preferences in accordance with temperature To the linear regression was determined. It is shown in Figure 14, and the equation is as follows:
RHPV = 0.04227 · T o 0.64344
The relationship between the variables is not strong and statistically insignificant, because R2 = 0.49 and the p-value is equal to 0.12. Thus, the authors sought to clarify this doubt.

5.3. Sultriness

Following Table 5, the subjective assessment of the hygrothermal conditions by students from groups B1, B2, and A3 indicated that the air during the survey was perceived as excessively stuffy, i.e., the AfSV index was negative. Therefore, air quality was assessed in terms of sultriness. Based on Equation (1) the distances from the sultry curve were determined. The results for the parameters of indoor and outdoor air are presented in the Table 7. For all groups, the D values are negative, which means that according to Equation (1), the air parameters in the auditorium during the surveys were within a non-sultry zone. However, for group B1, which rated air as the most stuffy (AfSV = −0.44), the distance D is the smallest and amounts to −0.32. At the same time, the parameters of the outside air were also close to the sultry curve and the distance D for the time of the experiment was the smallest (−0.8).
The correlation between AmPV and the distance from the sultriness curve (D) and between AfSV and D was examined (Figure 16). The smaller the distance in negative values of D (the air is stuffier), the greater the preference for increased air movement. Although the correlation coefficient is not high (R2 = 0.53) it indicates a good trend in understanding the need for changes in indoor conditions. On the other hand, in the case of the feeling of air freshness/stuffiness in relation to the parameter D, it can be concluded that based on the students’ answers, such a correlation does not exist, as the R2 coefficient was 0.05. This shows a problem of understanding the phenomenon.

5.4. Regressions

Following the aforementioned observations, the authors aimed to find the relationships between analysed indices: TSV, TPV, AfSV, AmPV, RHPV, and indoor air parameters. The results are collected and presented in Table 8. The relationships between AfSV, AmPV, and D are also given in the table. The correlation coefficients (R2), indicating the strength of the relationship between the parameters, and the statistical significance coefficients p are also provided.
For regression equations TSV, TPV, AmPV and To the relationships between the variables are strong and statistically significant. Whereas in the case of AfSV and RHPV regressions are not statistically significant. The lack of correlation in these two cases may indicate: (1) the dependence of sensations of sultriness and moisture preference on other factors or (2) the misinterpretation and misnaming of sensations and needs in the context of the indoor environment. Further investigation by the authors was undertaken, because knowledge of the factors influencing the sensation of stuffiness and the need for changes in relative humidity of the room air would make it possible to provide internal conditions (IEQ) suitable for students’ work and ensure control of energy consumption at a reasonable level.
Analysing the first assumption, an attempt was made to determine the influence of CO2 concertation. A previous study by the authors [35,50] showed that for building users and their perception of the microclimate CO2 concentration is considered the key parameter for man-made air pollution. Table 9 presents the levels of CO2 that may cause health problems [58,59].
The acceptable CO2 level in rooms is 1400 ppm (1000 ppm above the external concentration) or defined by the WHO is 1500 ppm. During the first day of measurements, after the lecture of group B1, despite the low share of room occupancy (Table 2), the air temperature and the CO2 concentration were high (25.78 °C and 1668 ppm, respectively). This indicates problems with the room ventilation. On each test day, the CO2 concentration in the B group was significantly higher than the concentration in the A group, which is due to the number of people attending the lecture and again shows the poor performance of natural ventilation in the lecture room. The results demonstrate that changes in carbon dioxide concentration could influence student satisfaction with the indoor environment, which is also confirmed also by the work of other researchers [16]. Additionally, it was observed that the feeling of stuffiness was the highest when the CO2 concentration in the room was the highest (Table 4). Similar observation that the air quality is perceived as stuffier as CO2 concentration increases was noted by Gupta and Howard [60].
Taking into account the fact that not only temperature and humidity can influence the sensation of sultriness by room users, the authors decided to perform a multiple regression analysis, taking into account more than one parameter that can influence this phenomenon. Three basic parameters that affect the sensation of sultriness: To, RH and CO2 concentration were tested, the distance from the sultriness curve (Din) was included in the analysis, as well as the inverse of the operative temperature included in the Equation for the distance from the sultriness curve. The results of the analysis are summarized in Table 10.
It can be seen that compared to the linear regression using operational temperature (R2 = 0.336) or only D value (R2 = 0.049), the multiple regression gave better results in terms of the strength of the relationships (Table 10). The most complicated Equation (e) is characterised by the highest regression coefficient, but adjusted R2 (0.115) indicates that the amount of variables is excessive. This is also confirmed by cases (a) and (c), where the relationships are also strong and the adjusted regression coefficients are also higher than in case (e). However, the analysis of the statistical significance revealed that none of the regressions is significant and thus cannot be used to predict the users votes based on the measured conditions. The analysis of multiple regression led the authors to support the statement of users’ misinterpretation and misnaming of sensations and needs in the context of the indoor environment.

5.5. Students’ Subjective Factors

Following the literature [17,18,61] it was found that air temperature can affect perception of well-being and willingness to work. It was interesting for the authors to know if the students are aware that their perceived room conditions affect their motivation to work. The questions about willingness to work were related to the concept of adaptive strategy. The most significant negative influence can be observed in warm conditions (above 25 °C). Productivity decreases proportionally with the increase in air temperature [61] and in the range of 25 °C to 30 °C it can change by 2% per every 1 °C [17]. In comparison, lower temperatures do not significantly differ from neutral conditions in this aspect [
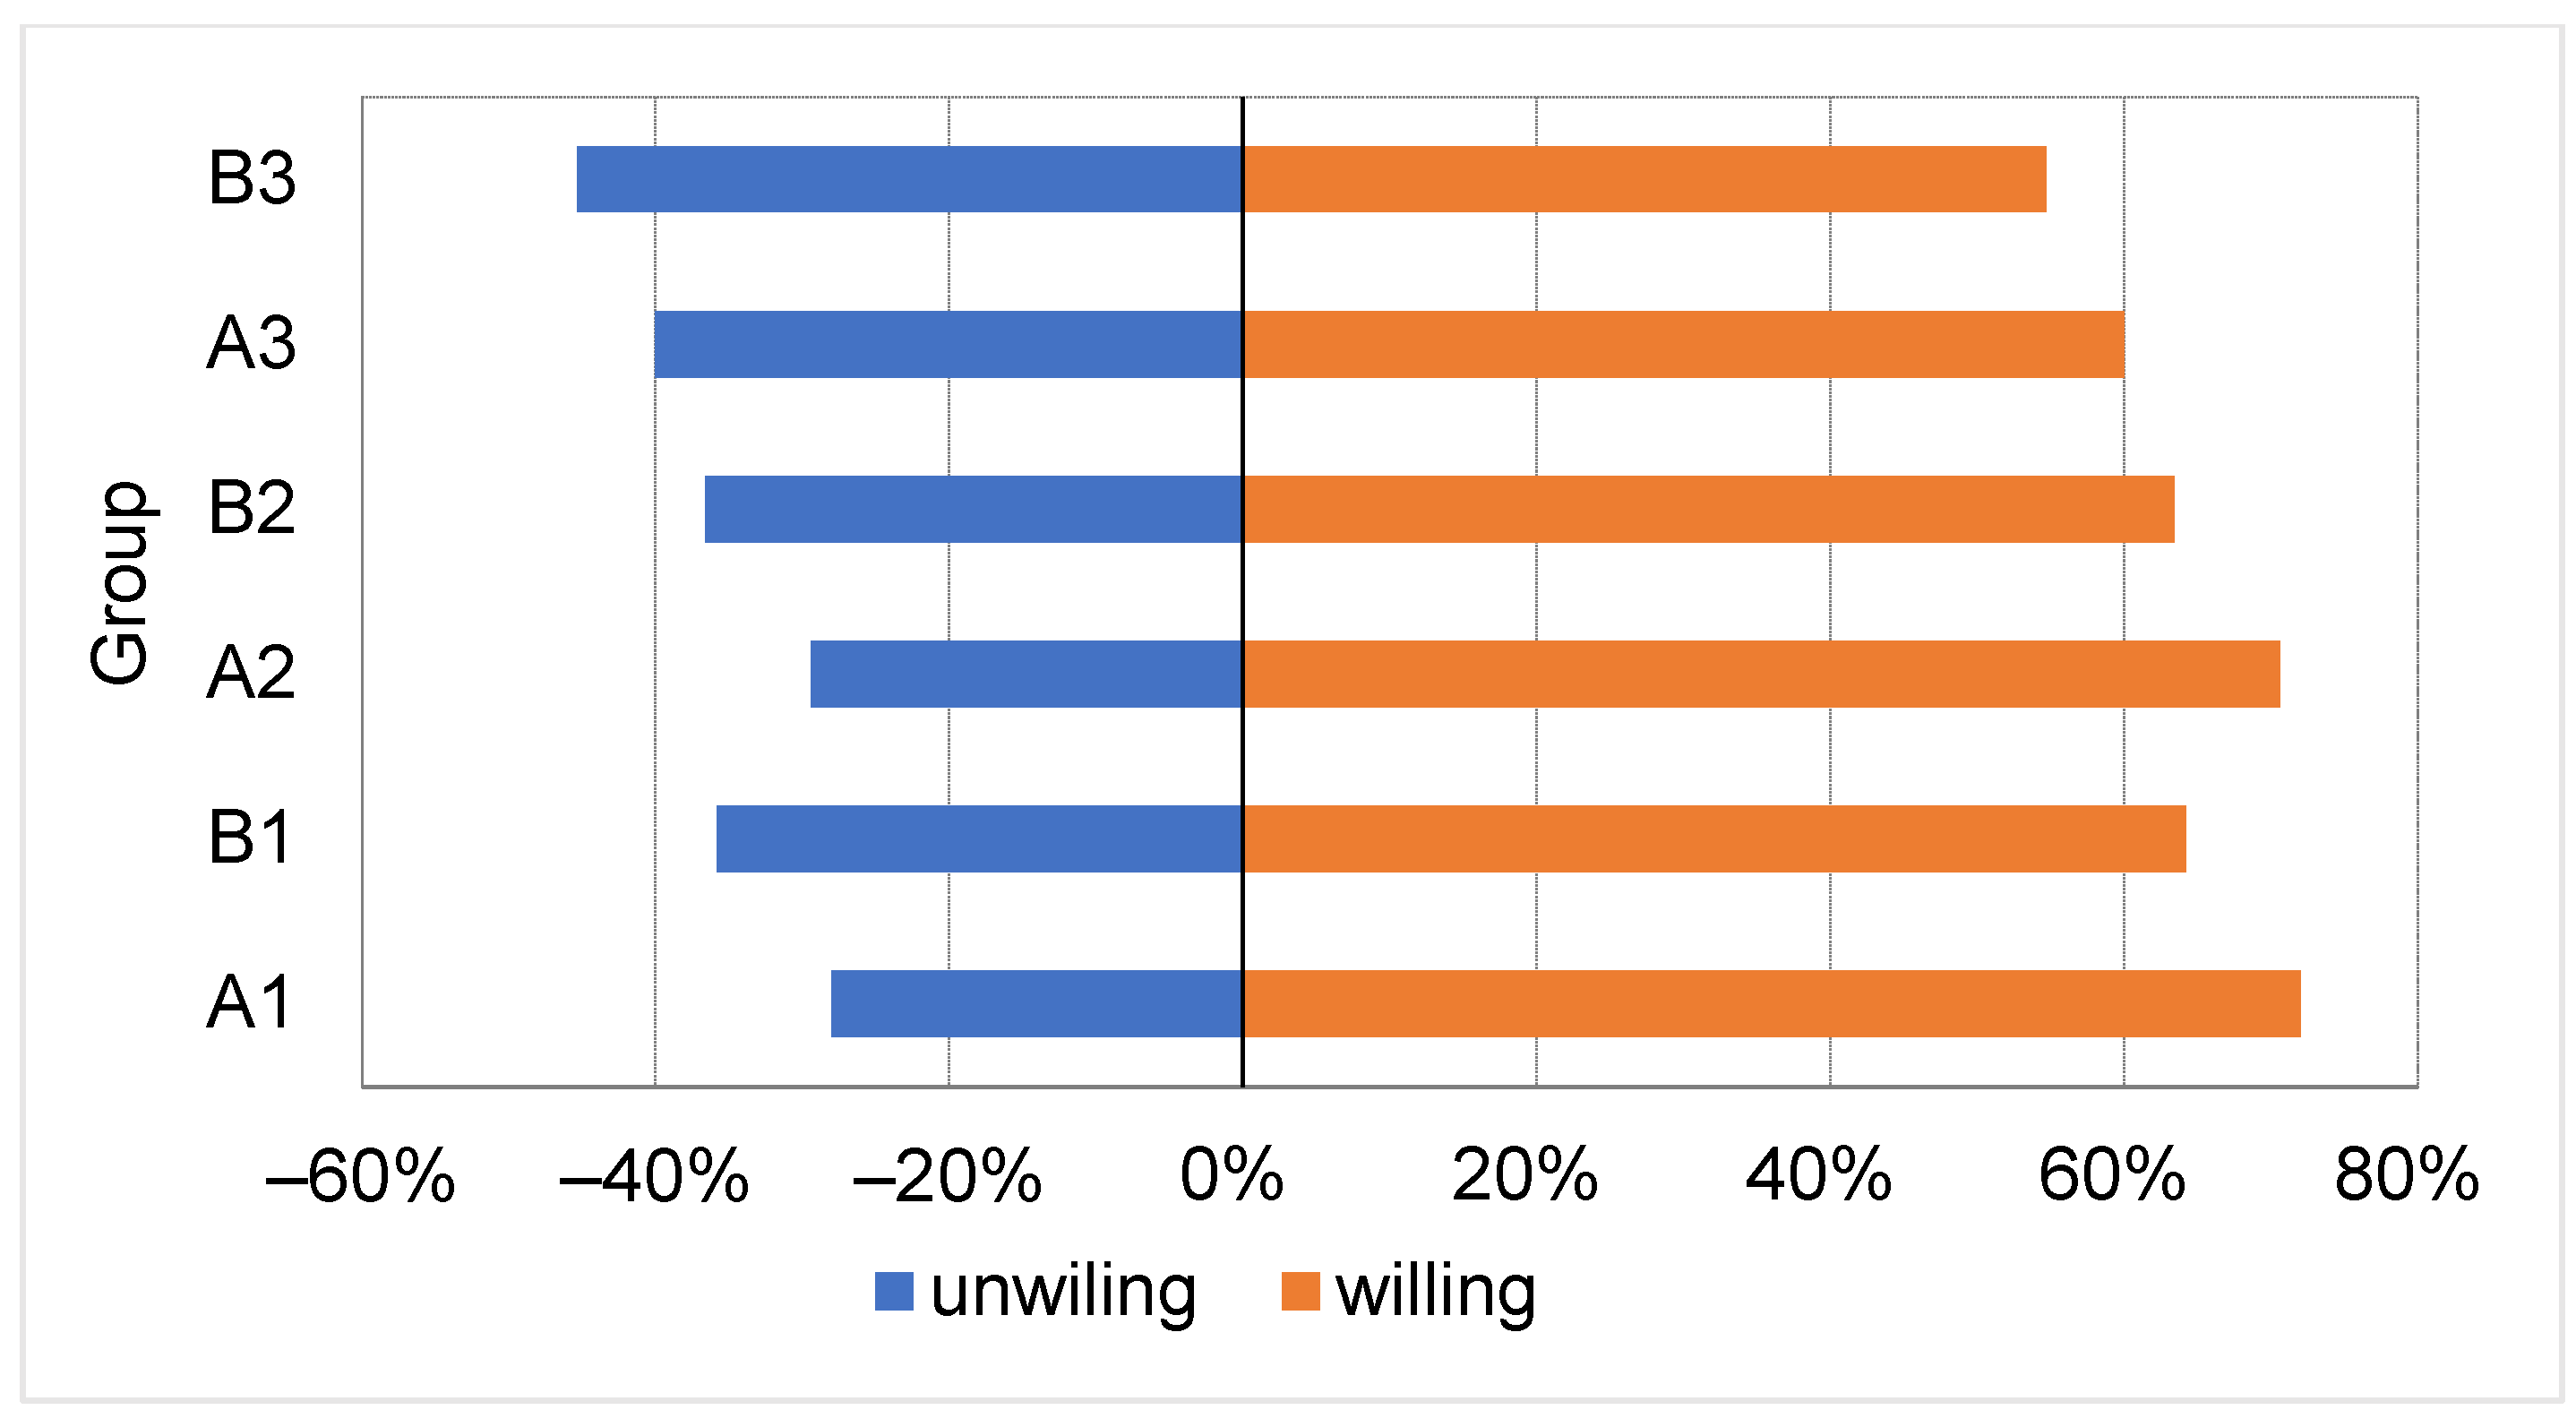
18], which is visible in the present research. The survey indicates that over 55% of all respondents (Figure 10) declare willingness to work. On each test day, in the less numerous A groups, the willingness to work was higher than in the larger B groups. The literature confirms that the temperature range of 21.0–25.0 °C is a stable range for office productivity [17], which is clearly seen in current research. However, the exact influence of temperature on willingness to work is difficult to define in such a narrow range of the experiment: from 21.1 to 25.5 °C (
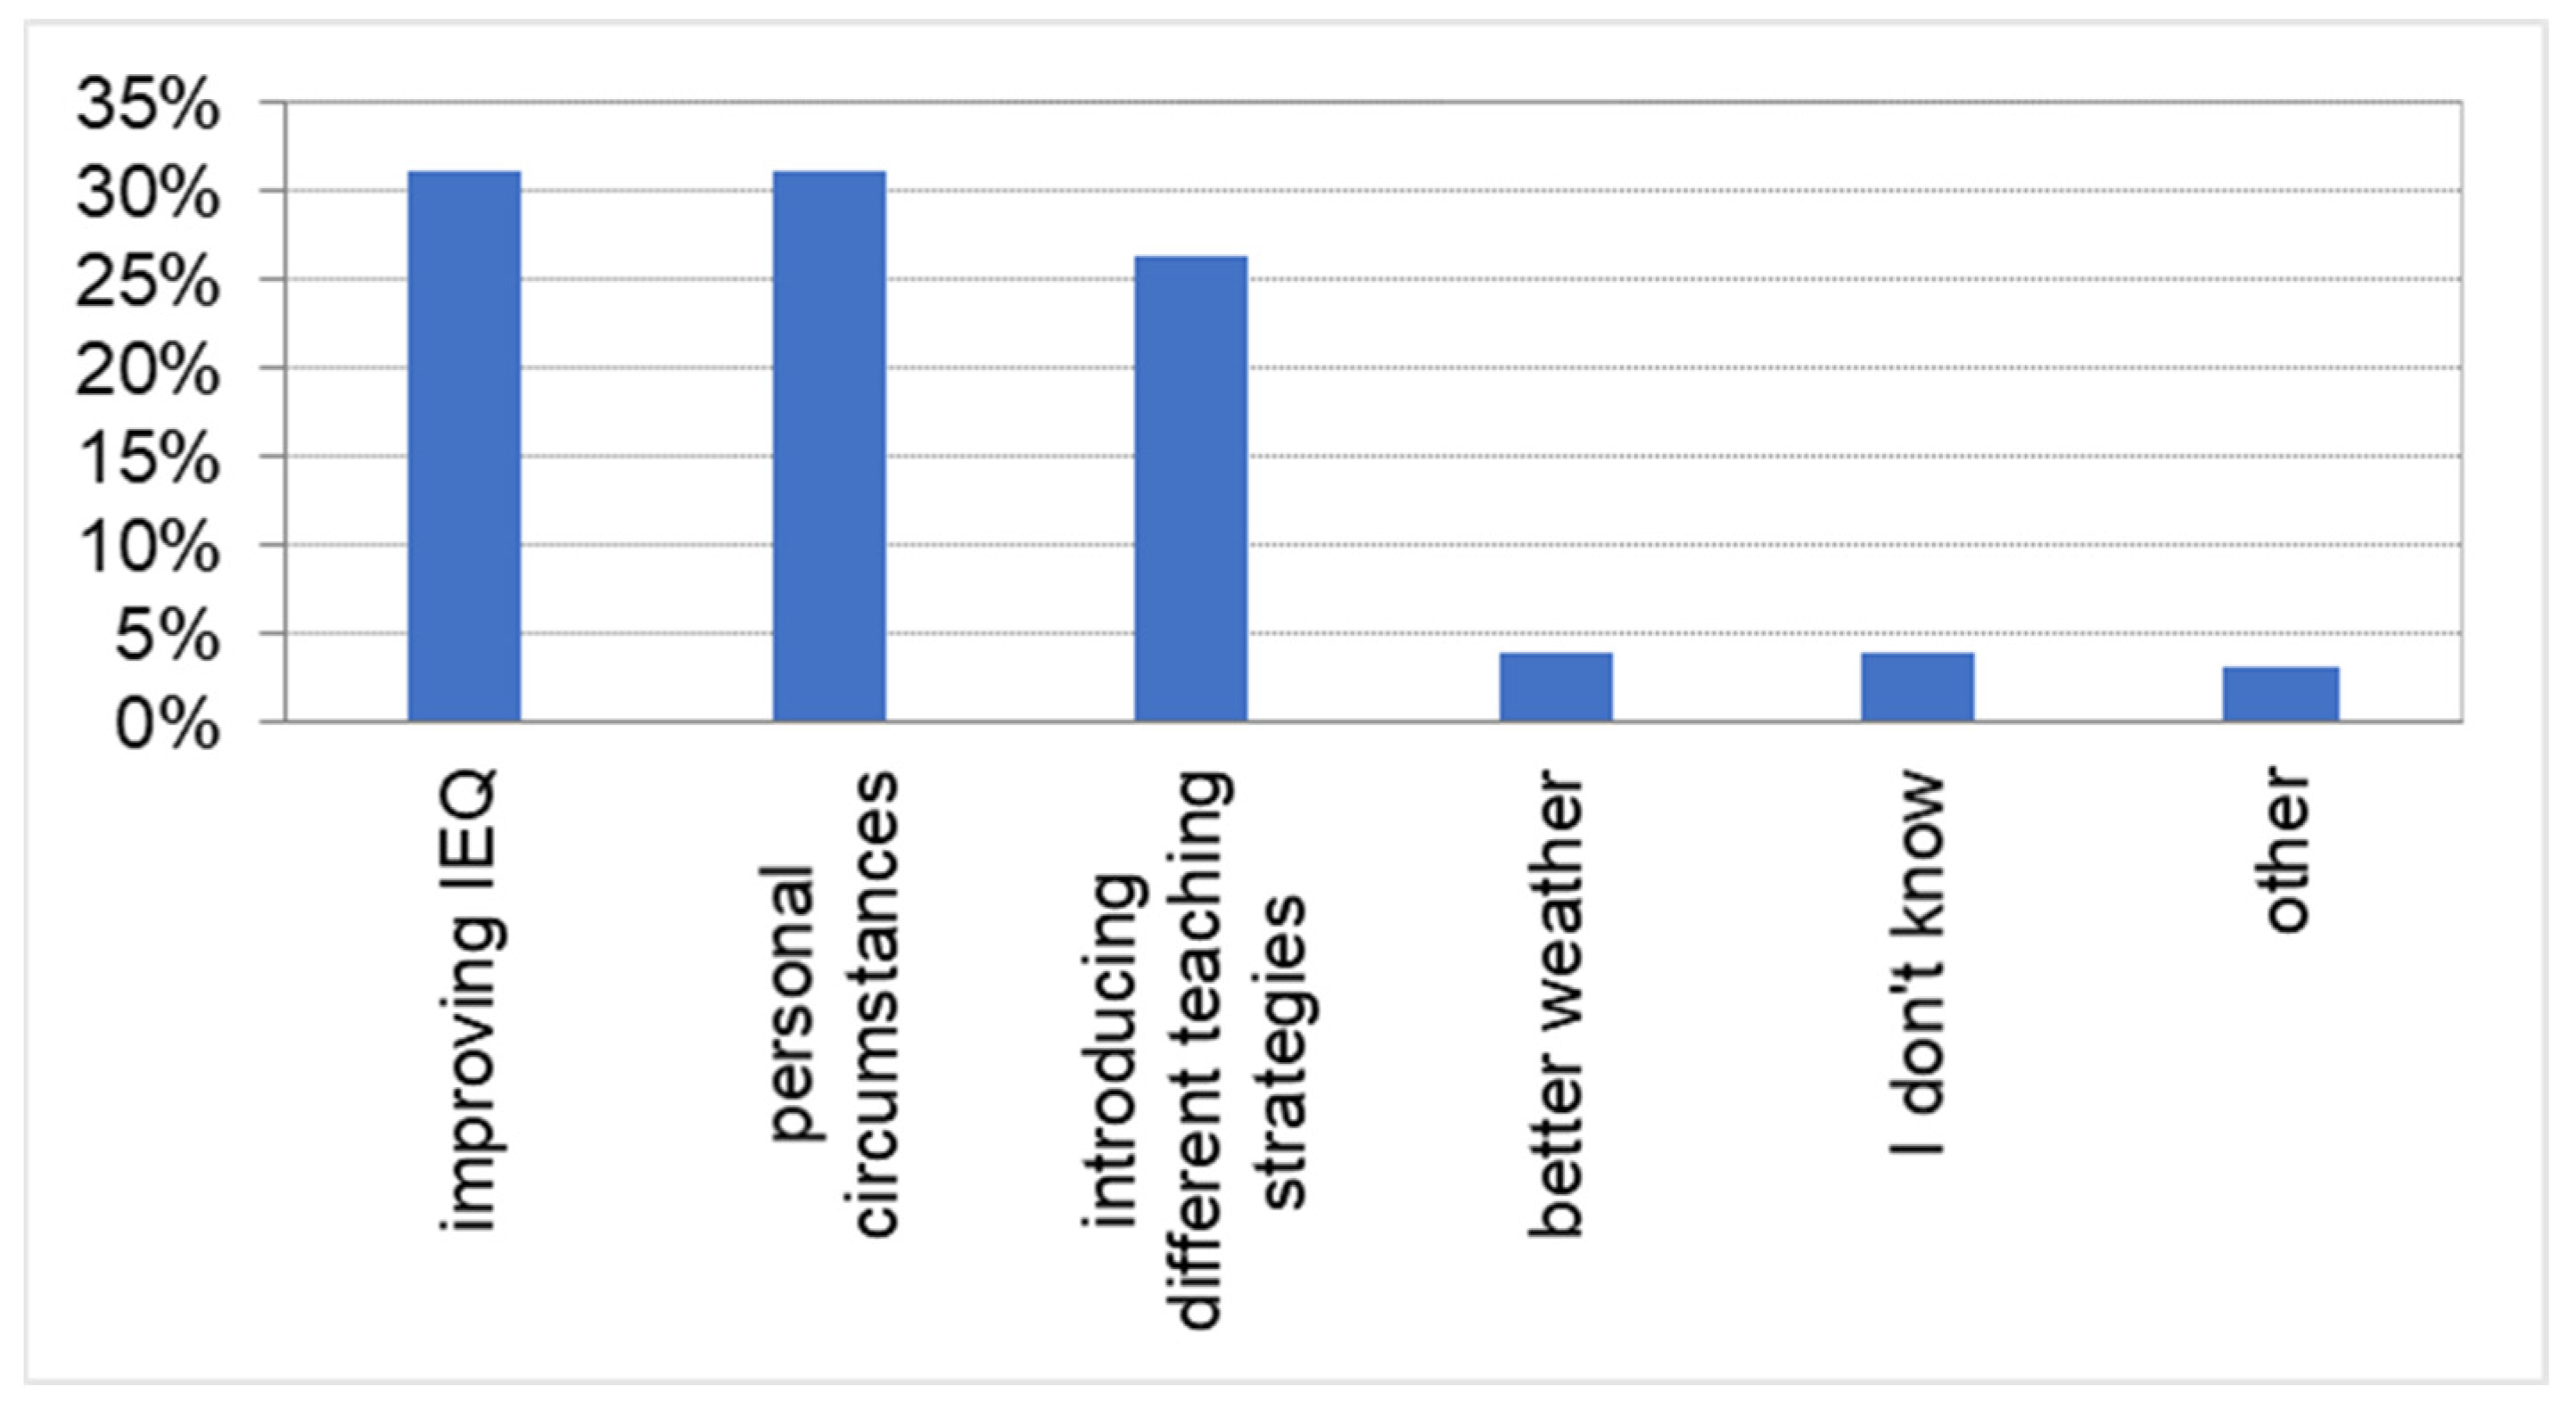
Table 4). The additional purpose of the question was to find the factors, important for respondents, that could motivate them more to work. The received responses were divided into 6 categories: improving Internal Environment Quality (IEQ), personal circumstances, introducing different teaching strategies, better weather, I don’t know, other. In the context of this article, the most relevant category is improving the IEQ as shown in Figure 11, which includes answers related to improving air quality (increase in air movement, humidity, cooling, share of fresh air), improvement of indoor lighting intensity (especially daylight) and acoustics, more comfortable seats and benches. Among all responses, 33% indicated a desire to improve IEQ, and these factors were as important as personal factors, that is., eating, drinking, relaxing, sleeping.
The next aspect related to indoor conditions are health factors, whose influence is discussed in [20]. The literature review indicates that health symptoms including earache and ear related, eye related, nose related, sore throat, or cough, and headache are the most common symptoms reported by students [61].
  • Headache is defined in the literature as one of the most common reasons for absenteeism among students [61]. In the present research, this symptom was reported by 18% of them (Figure 12).
  • Mucus nose and throat problems were an important health syndromes that affected the students. They companied on irritating of throat, nose and eyes—even up to 76% in group A1. It could be caused by high indoor temperature (24.3 °C), but what is interesting, at the same time, these health syndromes seem the students not to affect their willingness to work.
  • General fatigue was declared by about 55% of the students, they also pointed out problems with concentration. These ailments reported by students are consistent with somnolence and influence on well-being.
  • Somnolence has a high rank on the list of subjective factors affecting willingness to work by students. As high as 63% of the occupants pointed out that they felt somnolence during class hours (Figure 12).
Previous study of the authors and numerous publications [50,61,62,63] indicate that it is impossible to establish a clear relationship only between temperature and well-being while ignoring subjective human factors. However, the authors [15,17,18] indicate that lower temperatures are better for studying environment leading, at the same time, to a lower energy consumption by the building. Furthermore, the dependence the willingness to work of human factors and personal circumstances create a complex, difficult to describe and to measure issue that is strictly related to indoor conditions and thus energy consumption by the building. This research indicates that all of these aspects are still not sufficiently recognized and need further research.

6. Conclusions

Research concerning students’ sensations and preferences in the context of maintaining energy savings in existing public utility buildings were conducted and described. The survey, undertaken at Wroclaw University of Science and Technology in Poland, during three chosen days: at the beginning, in the middle and at the end of the winter semester, indicated that the indoor conditions were in range providing thermal comfort in accordance with the subject matter. Based on 323 collected questionnaires filled by first-year students (average age 19.5 years), it was found that indoor conditions were assessed partially in a way that was predictable for the researchers, but partially the responses surprised the authors and forced them to search for answers to the doubts that arose.
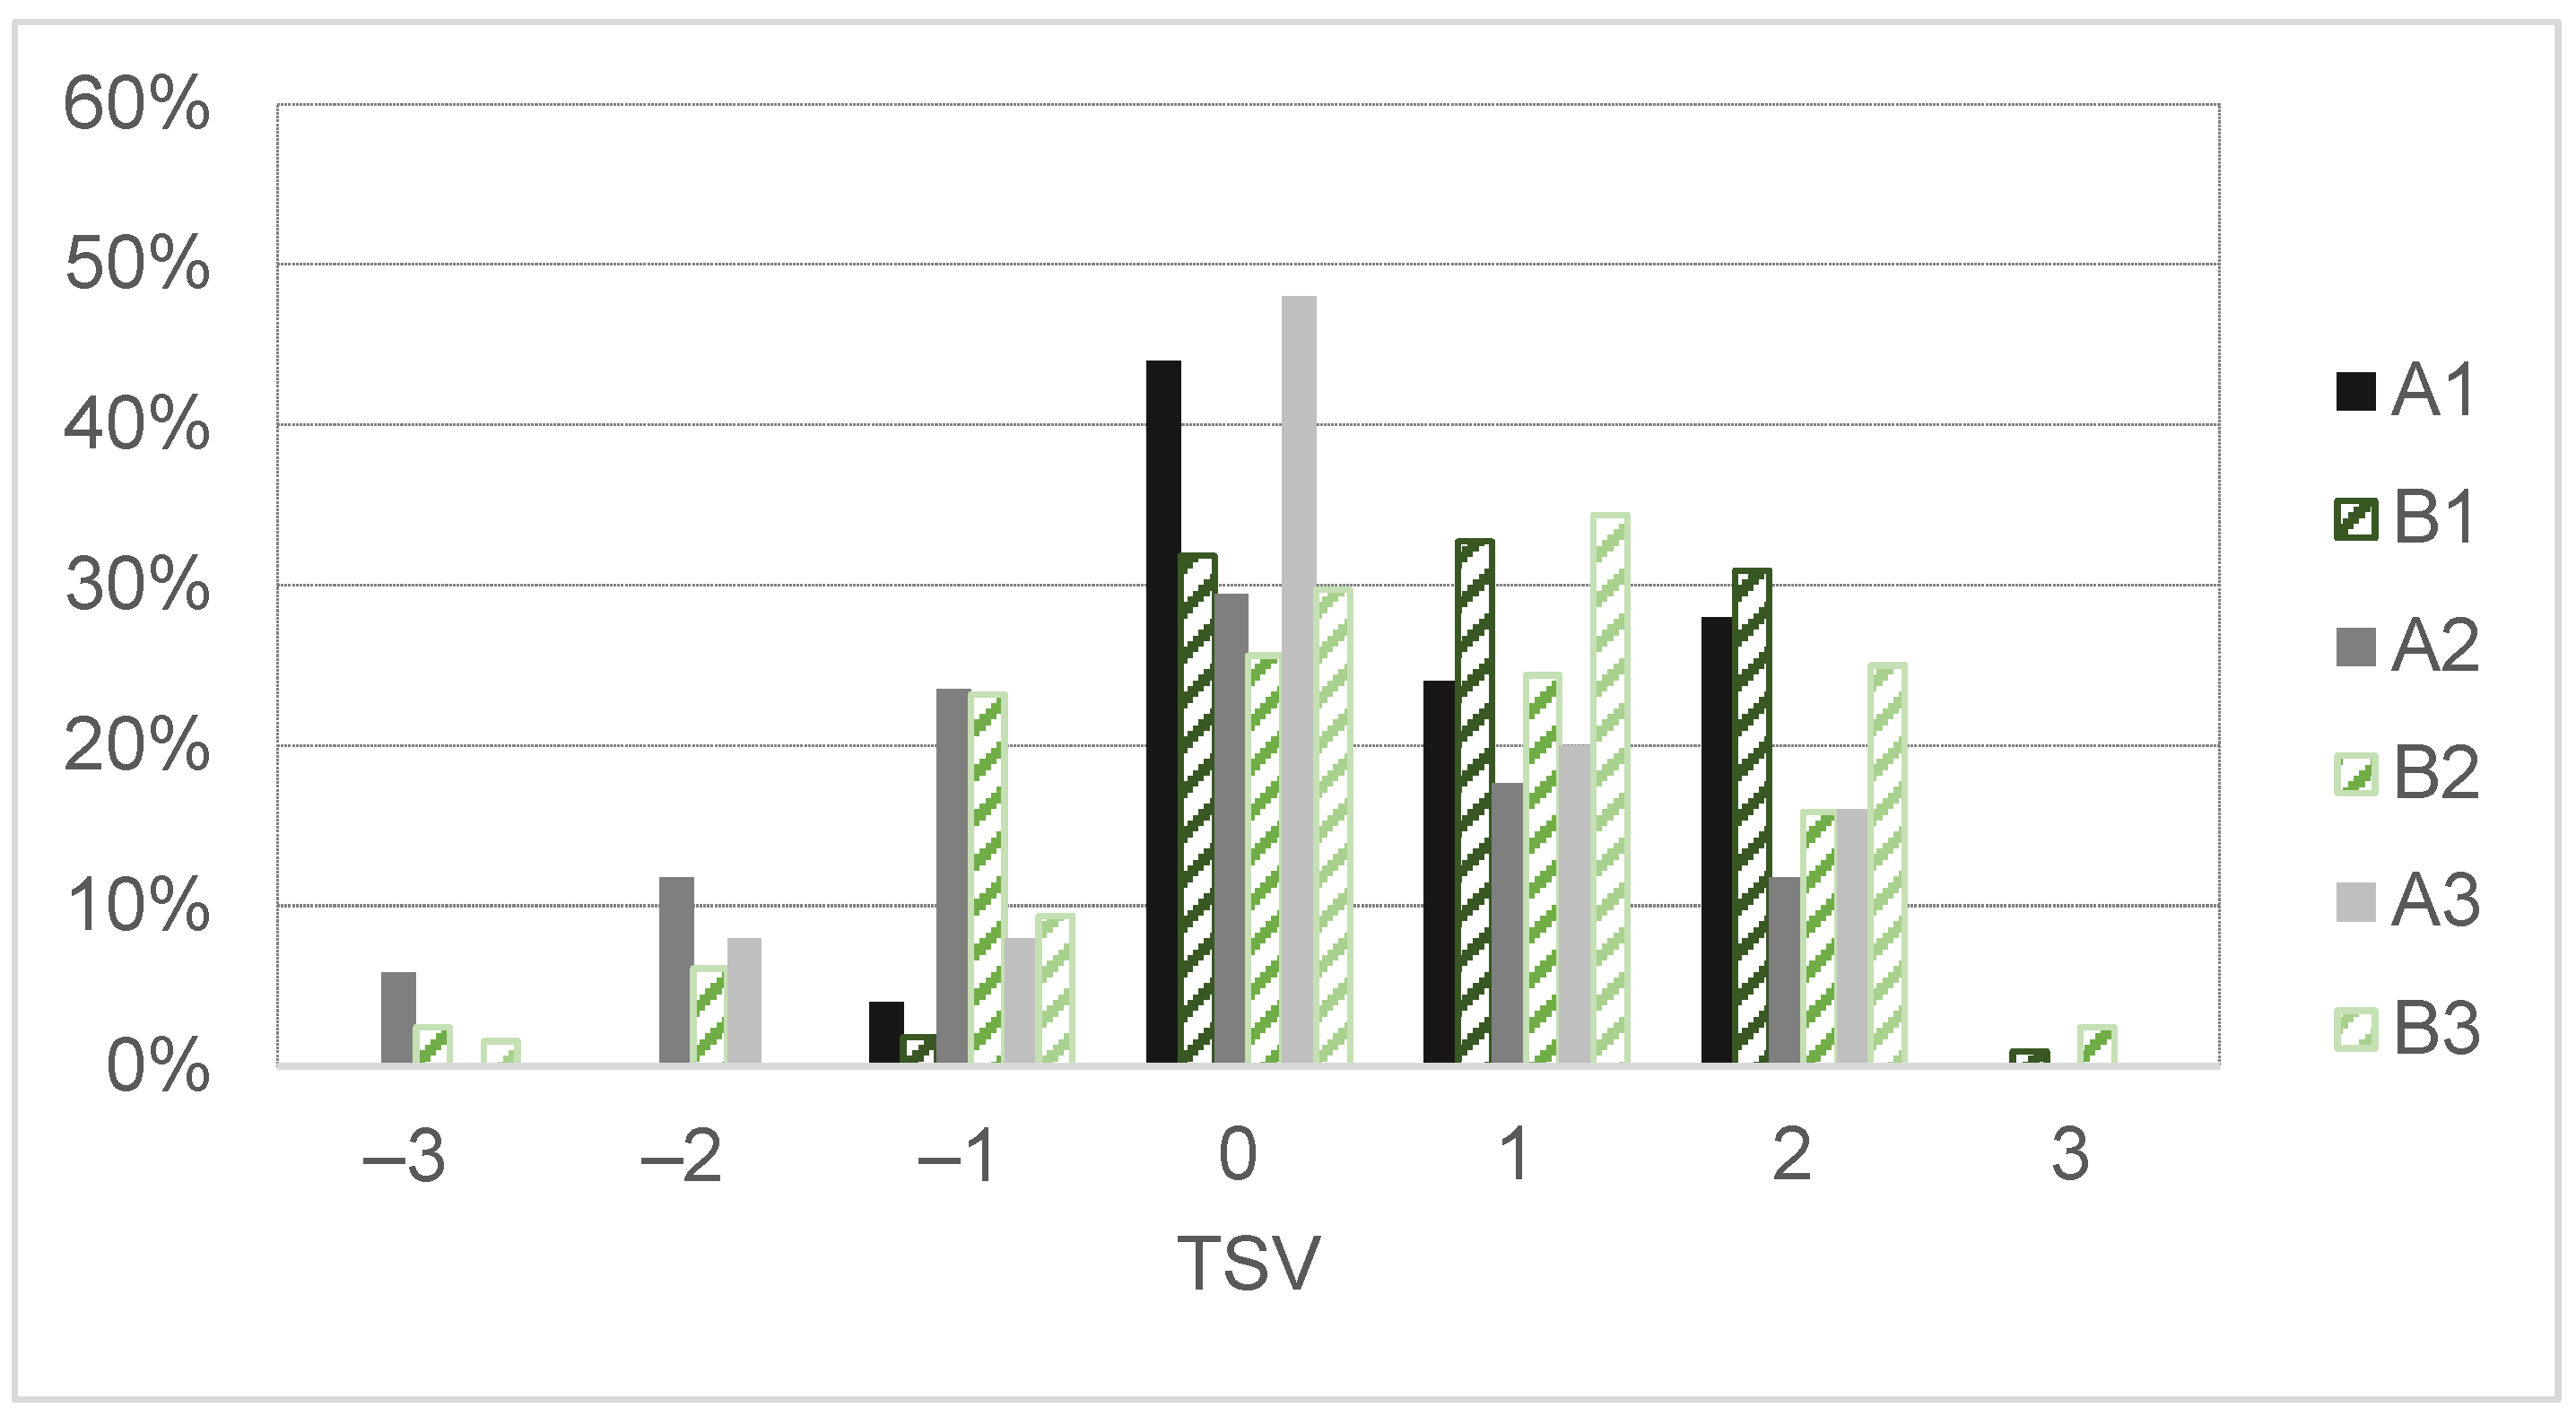
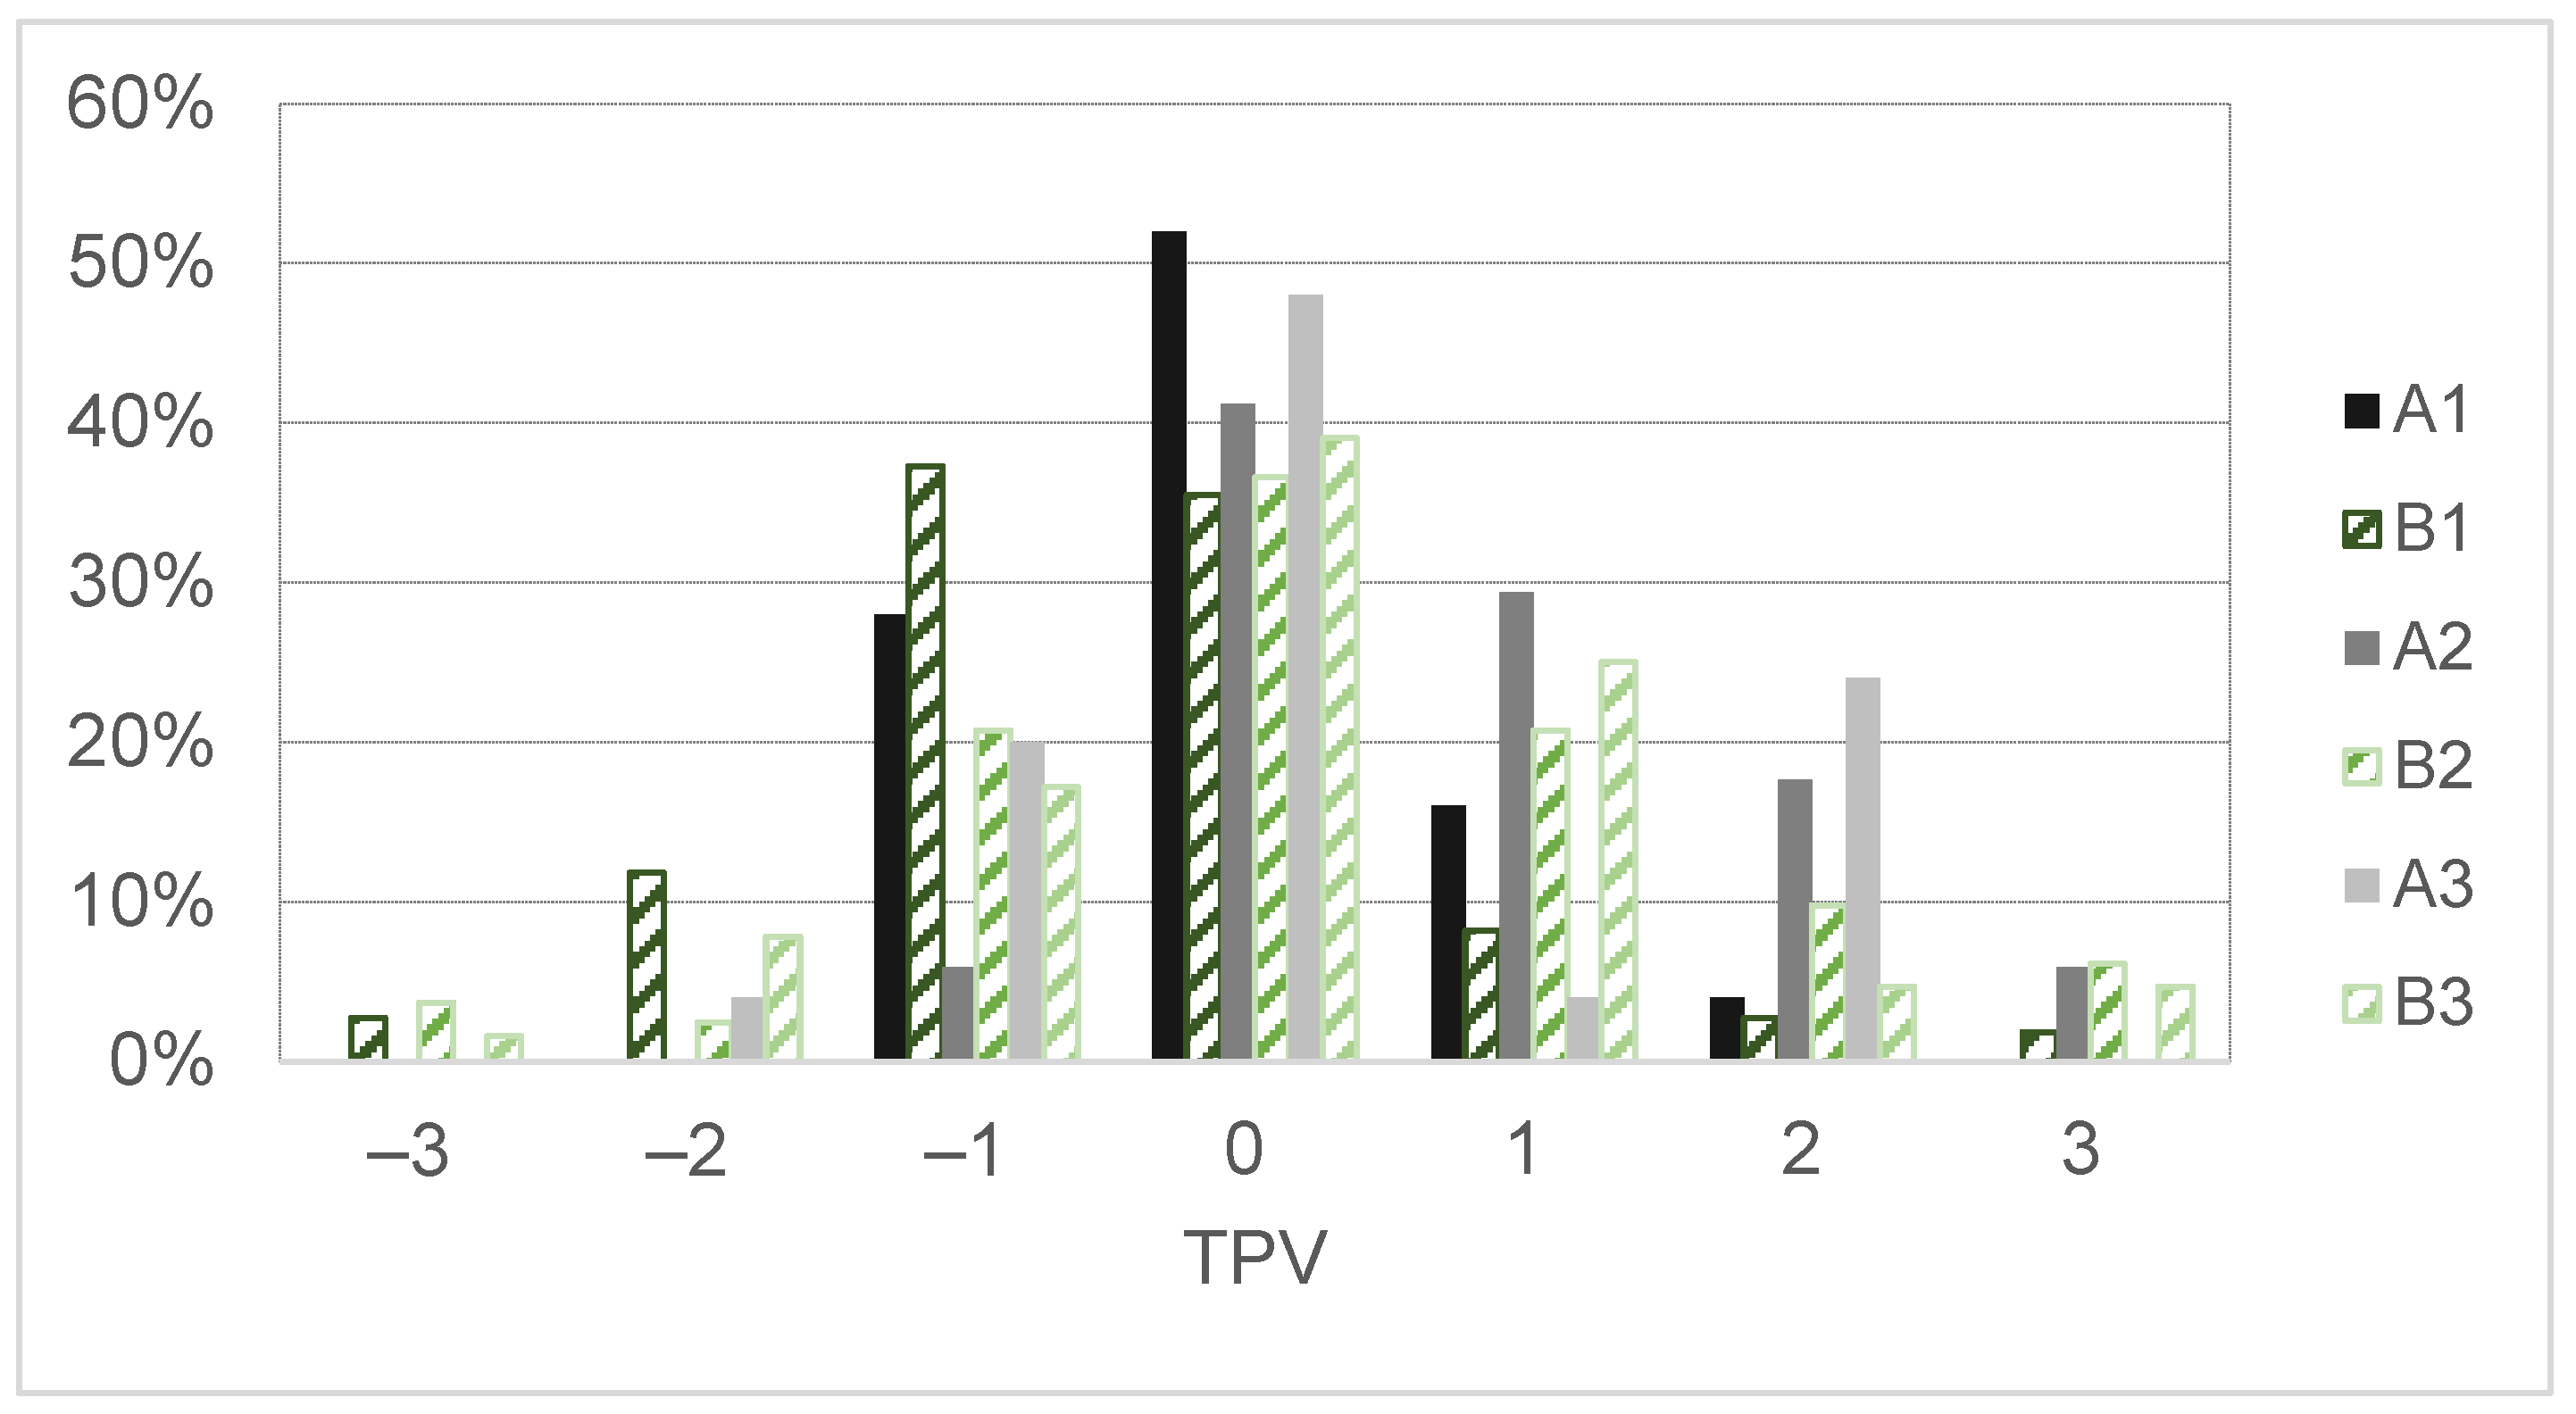
For the assessment of students’ sensations and preferences 7-point scales were used, with neutral sensation described as zero value. In addition to the traditionally known TSV and TPV indices, AmPV was used to assess air velocity preference, AfSV for freshness and RHPV for humidity preference.
Calculated neutral temperature for transition and winter (heating) period was lower than temperature estimated in former research undertaken for the same auditorium in spring semester. Similar difference between seasons is described also in literature. The research confirms the statement that the neutral temperature is not perceived as a comfort one. In the described research its value of 20.97 °C was estimated by the regression line and assessed by the students as too low. Simultaneously the comparison of TSV and TPV defined by respondents indicate that the surveyed groups recognize correctly their thermal sensations, i.e., TPV decreases with the increase of TSV. This proper understanding is important in terms of achieving reliable results in context of thermal comfort and energy saving. However, the room temperature required by users, higher than the design regulation’s value of 20 °C, results in higher energy consumption. What is important, the literature indicate that to rise the work effectiveness among students, the lower temperatures are required. It is not confirmed by the research, were the highest willingness to work was observed in the group with the mean room temperature of 24.28 °C. Such a high discrepancies indicate the need for further research especially when the aspect of energy consumption is considered. During the whole research the measured air velocities were achieving very low values and thus the students indicated the need for increasing air movement, and as a result in five groups AmPV were positive. The preferences of change in room temperature are strongly related to the opposite change of air movement. Low ventilated rates and need for high velocities are significant issues in naturally ventilated rooms. The simplest solution is to close and open the windows. However, this leads to lack of the control of energy needed to heat incoming air and thus increasing dynamic heat losses.
As the air in the three groups was rated as stuffy, the room indoor conditions were assessed following the equation determining the distance from the sultriness curve. The calculations did not confirm that the indoor conditions were in the stuffiness zone according to the Lancaster-Castens curve. However, according to the interpretation of the students’ needs, for some of them fresh air was related to relative humidity, hence they preference to increase the humidity on the day with the highest measured air humidity.
The students’ indication of air as stuffy get the authors to search for appropriate correlations. However, assessment of the relationship between AfSV and RHPV from To did not indicated on a statistical significance, which presumably could have indicated the dependence of students’ sensations and preferences on other factors.
The importance of the CO2 level in the room was investigated and it was found that during the lecture of group B1, when the air was rated as the most stuffy, the CO2 concentration was higher than the values recommended by WHO, namely 1668 ppm. This indicates the importance of proper ventilation system and its role in maintaining thermal comfort and indoor air quality. However, it should be noticed that natural ventilation is more energy-consuming than a mechanical ventilation systems.
Five regression equations were found between AfSV and other parameters. The analysis of the statistical significance revealed that none of the regressions is statistically significant and thus cannot be used to predict the users votes in the measured conditions. This led to the conclusion that the word “stuffy” is misinterpreted and misnamed by students.
According to the students’ subjective assessment, they are aware that the conditions in the room may be the cause of their malaise and unwillingness to work. In order to improve indoor environmental quality and maintain rational energy consumption, the need for thermal comfort must be addressed with a complete picture, by an expert who will consider all air parameters and including CO2 concentrations. The requests for changes in relative humidity levels is inadequate for the conditions inside the room and the possibility for users to individually adjust the room parameters can lead to a deterioration of the quality of the conditions and not only increase energy consumption but also waste.
Improving energy efficiency in existing naturally ventilated public buildings is extremely challenging. Better understanding of occupant behaviour in existing buildings will help to reduce the so-called prebound effect which describes the discrepancy between the calculated and the actual energy consumption before thermal upgrading which leads to false expectations of energy savings [1]. Meeting the thermal comfort needs of occupants and the lack of air exchange control at the same time requires a comprehensive approach. Building control or control strategies need to be based on an advanced understanding of user preferences and behavioural patterns. The study confirms the statement of Gram-Hanssen, cited in [1] that the issue is not whether to focus on technological efficiency or on user behaviour, but how to combine both in the most sensible and user-oriented way to improve energy efficiency in the building sector.
Appropriate education among the youngest generations could contribute to a change in the perception of the issue of importance of inner environmental quality on their well-being and productivity. The presented results of the surveys and their analyses can be used for cognitive specialties.

Author Contributions

Conceptualization, E.D., M.L. and N.F.-K.; methodology, E.D., M.L. and N.F.-K.; formal analysis, E.D., M.L. and N.F.-K.; investigation, E.D., M.L.; resources, M.L.; data curation, M.L.; writing—original draft preparation, E.D., M.L. and N.F.-K.; writing—review and editing, E.D., M.L. and N.F.-K.; visualization, N.F.-K.; supervision, E.D.; funding acquisition, E.D. All authors have read and agreed to the published version of the manuscript.

Funding

This research received no external funding. The APC was funded by Department of Air Conditioning, Heating, Gas Engineering and Air Protection, Faculty of Environmental Engineering, Wroclaw University of Science and Technology, Poland.

Institutional Review Board Statement

Not applicable.

Informed Consent Statement

Not applicable.

Data Availability Statement

Not applicable.

Acknowledgments

The authors would like to thank the lecturer of PWr for the possibility of conducting the research.

Conflicts of Interest

The authors declare no conflict of interest.

Appendix A

Questionnaire used in this study.
Energies 14 08159 i001

References

  1. Schweiker, M. Understanding Occupants’ Behaviour for Energy Efficiency in Buildings. Curr. Sustain. Renew. Energy Rep. 2017, 4, 8–14. [Google Scholar] [CrossRef]
  2. Akande, O.K.; Odeleye, D.; Coday, A. Energy efficiency for sustainable reuse of public heritage buildings: The case for research. Int. J. Sustain. Dev. Plan. 2014, 9, 237–250. [Google Scholar] [CrossRef] [Green Version]
  3. Hwang, R.L.; Lin, T.P.; Kuo, N.J. Field experiments on thermal comfort in campus classrooms in Taiwan. Energy Build. 2006, 38, 53–62. [Google Scholar] [CrossRef]
  4. Buildings. A Source of Enormous Untapped Efficiency Potential. Available online: https://www.iea.org/topics/buildings (accessed on 5 November 2021).
  5. Communication from the Commission to the European Parliament, the Council, the European Economic and Social Committee and the Committee of the Regions—A Renovation Wave for Europe—Greening Our Buildings, Creating Jobs, Improving. Available online: https://eur-lex.europa.eu/legal-content/EN/TXT/?qid=1603122220757&uri=CELEX:52020DC0662 (accessed on 5 November 2021).
  6. Building Retrofits Critical to Europe’s Low-Carbon Pathway. Available online: https://cordis.europa.eu/article/id/123617-building-retrofits-critical-to-europes-lowcarbon-pathway (accessed on 5 November 2021).
  7. Directive 2012/27/EU of the European Parliament and of the Council of 25 October 2012 on Energy Efficiency, Amending Directives 2009/125/EC and 2010/30/EU and Repealing Directives 2004/8/EC and 2006/32/EC. Available online: https://eur-lex.europa.eu/legal-content/EN/TXT/?uri=CELEX:32012L0027 (accessed on 2 December 2021).
  8. Attia, S.; Kosiński, P.; Wójcik, R.; Węglarz, A.; Koc, D.; Laurent, O. Energy efficiency in the polish residential building stock: A literature review. J. Build. Eng. 2022, 45, 103461. [Google Scholar] [CrossRef]
  9. Baborska-Narożny, M. Węglem i nie Węglem. Ogrzewanie Kamienic: Perspektywa Mieszkańców i Scenariusze Zmian. Rzeczywiste Koszty, Zużycie Energii i Warunki Korzystania z Różnych Systemów Ogrzewania; Oficyna Wydawnicza Politechniki Wrocławskiej: Wroclaw, Poland, 2020. [Google Scholar]
  10. Altomonte, S.; Schiavon, S. Occupant satisfaction in LEED and non-LEED certified buildings. Build. Environ. 2013, 68, 66–76. [Google Scholar] [CrossRef]
  11. Fuchs, X.; Becker, S.; Schakib-Ekbatan, K.; Schweiker, M. Subgroups holding different conceptions of scales rate room temperatures differently. Build. Environ. 2018, 128, 236–247. [Google Scholar] [CrossRef]
  12. Schweiker, M.; Fuchs, X.; Becker, S.; Shukuya, M.; Dovjak, M.; Hawighorst, M.; Kolarik, J. Challenging the assumptions for thermal sensation scales. Build. Res. Inf. 2017, 45, 572–589. [Google Scholar] [CrossRef] [Green Version]
  13. Schweiker, M.; Hawighorst, M.; Wagner, A. The influence of personality traits on occupant behavioural patterns. Energy Build. 2016, 131, 63–75. [Google Scholar] [CrossRef]
  14. Shahzad, S.; Brennan, J.; Theodossopoulos, D.; Calautit, J.K.; Hughes, B.R. Does a neutral thermal sensation determine thermal comfort? Build. Serv. Eng. Res. Technol. 2018, 39, 183–195. [Google Scholar] [CrossRef]
  15. Mishra, A.K.; Derks, M.T.H.; Kooi, L.; Loomans, M.G.L.C.; Kort, H.S.M. Analysing thermal comfort perception of students through the class hour, during heating season, in a university classroom. Build. Environ. 2017, 125, 464–474. [Google Scholar] [CrossRef]
  16. Krawczyk, D.A.; Rodero, A.; Gładyszewska-Fiedoruk, K.; Gajewski, A. CO2 concentration in naturally ventilated classrooms located in different climates—Measurements and simulations. Energy Build. 2016, 129, 491–498. [Google Scholar] [CrossRef]
  17. Al Horr, Y.; Arif, M.; Kaushik, A.; Mazroei, A.; Katafygiotou, M.; Elsarrag, E. Occupant productivity and office indoor environment quality: A review of the literature. Build. Environ. 2016, 105, 369–389. [Google Scholar] [CrossRef] [Green Version]
  18. Lan, L.; Lian, Z.; Pan, L. The effects of air temperature on office workers’ well-being, workload and productivity-evaluated with subjective ratings. Appl. Ergon. 2010, 42, 29–36. [Google Scholar] [CrossRef] [PubMed]
  19. Nico, M.A.; Liuzzi, S.; Stefanizzi, P. Evaluation of thermal comfort in university classrooms through objective approach and subjective preference analysis. Appl. Ergon. 2015, 48, 111–120. [Google Scholar] [CrossRef]
  20. Ricciardi, P.; Buratti, C. Environmental quality of university classrooms: Subjective and objective evaluation of the thermal, acoustic, and lighting comfort conditions. Build. Environ. 2018, 127, 23–36. [Google Scholar] [CrossRef]
  21. Buratti, C.; Ricciardi, P. Adaptive analysis of thermal comfort in university classrooms: Correlation between experimental data and mathematical models. Build. Environ. 2009, 44, 674–687. [Google Scholar] [CrossRef]
  22. Mishra, A.K.; Ramgopal, M. Field studies on human thermal comfort—An overview. Build. Environ. 2013, 64, 94–106. [Google Scholar] [CrossRef]
  23. Singh, M.K.; Kumar, S.; Ooka, R.; Rijal, H.B.; Gupta, G.; Kumar, A. Status of thermal comfort in naturally ventilated classrooms during the summer season in the composite climate of India. Build. Environ. 2018, 128, 287–304. [Google Scholar] [CrossRef]
  24. Lamberti, G.; Salvadori, G.; Leccese, F.; Fantozzi, F.; Bluyssen, P.M. Advancement on thermal comfort in educational buildings: Current issues and way forward. Sustainability 2021, 13, 10315. [Google Scholar] [CrossRef]
  25. Damiati, S.A.; Zaki, S.A.; Rijal, H.B.; Wonorahardjo, S. Field study on adaptive thermal comfort in office buildings in Malaysia, Indonesia, Singapore, and Japan during hot and humid season. Build. Environ. 2016, 109, 208–223. [Google Scholar] [CrossRef]
  26. Lee, M.C.; Mui, K.W.; Wong, L.T.; Chan, W.Y.; Lee, E.V.M.; Cheung, C.T. Student learning performance and indoor environmental quality (IEQ) in air-conditioned university teaching rooms. Build. Environ. 2012, 49, 238–244. [Google Scholar] [CrossRef]
  27. Domínguez, A.; Saenz-De-Navarrete, J.; De-Marcos, L.; Fernández-Sanz, L.; Pagés, C.; Martínez-Herráiz, J.J. Gamifying learning experiences: Practical implications and outcomes. Comput. Educ. 2013, 63, 380–392. [Google Scholar] [CrossRef]
  28. Wood, G.; Day, R.; Creamer, E.; van der Horst, D.; Hussain, A.; Liu, S.; Shukla, A.; Iweka, O.; Gaterell, M.; Petridis, P.; et al. Sensors, sense-making and sensitivities: UK household experiences with a feedback display on energy consumption and indoor environmental conditions. Energy Res. Soc. Sci. 2019, 55, 93–105. [Google Scholar] [CrossRef]
  29. Steadman, R.G. The Assessment of Sultriness. Part I: A Temperature-Humidity Index Based on Human Physiology and Clothing Science. J. Appl. Meteorol. 1979, 18, 861–873. [Google Scholar] [CrossRef] [Green Version]
  30. Bradtke, F.; Liese, W. Regulatorisches Verhalten des Körpers bei Bestimmten Klimafaktoren, Hilfsb. Für Raum-Und Außenklimatische Messungen; Springer: Heidelberg, Germany, 1952. [Google Scholar]
  31. Mahmoudi, P.; Tavousi, T.; Wereski, S.; Kamak, M.M. Comparative evaluation of sultry indices in the mid-south of Iran. Theor. Appl. Climatol. 2019, 137, 3041–3053. [Google Scholar] [CrossRef]
  32. Meshkat, M.; Hassani, M. Demotivating factors in learning english: The case of Iran. Procedia-Soc. Behav. Sci. 2012, 31, 745–749. [Google Scholar] [CrossRef] [Green Version]
  33. Majczyk, J.; Tomaszewicz, A. Aleja Profesorów (Avenue of Professors) in the main campus of Wrocław University of Technology—History of the spatial system development. Architectus 2015, 1, 69–86. [Google Scholar] [CrossRef]
  34. Bocheński, S.; Piskozub, J. Construction of the Wrocław University of Technology buildings for the Faculty of Electrical Engineering D1 and Faculty of Aviation Engineering D2—History of some illusion. J. Herit. Conserv. 2015, 41, 65–73. [Google Scholar]
  35. Laska, M.; Dudkiewicz, E. Research of CO2 concentration in naturally ventilated lecture room. E3S Web Conf. 2017, 22, 00099. [Google Scholar] [CrossRef]
  36. Municipal Register of Historic Monuments. Available online: https://geoportal.wroclaw.pl/mapy/gez/ (accessed on 29 November 2021).
  37. Ustawa z Dnia 7 Lipca 1994 r. Prawo Budowlane (Last Changes Dz.U.2020.1333). Available online: https://isap.sejm.gov.pl/isap.nsf/DocDetails.xsp?id=WDU19940890414 (accessed on 2 November 2021).
  38. Ustawa z Dnia 23.07.2003 r. o Ochronie Zabytków i Opiece nad Zabytkami (Last Changes 2021). Available online: https://isap.sejm.gov.pl/isap.nsf/DocDetails.xsp?id=WDU20031621568 (accessed on 2 November 2021).
  39. Krawczyk, D.A. Theoretical and real effect of the school’s thermal modernization—A case study. Energy Build. 2014, 81, 30–37. [Google Scholar] [CrossRef]
  40. Heracleous, C.; Michael, A. Thermal comfort models and perception of users in free-running school buildings of East-Mediterranean region. Energy Build. 2020, 215, 109912. [Google Scholar] [CrossRef]
  41. Clements-Croome, D.; Kaluarachchi, Y. Assessment and measurement of productivity. In Creating the Productive Workplace; Taylor & Francis: London, UK, 2001. [Google Scholar]
  42. Kordana-Obuch, S.; Starzec, M.; Słyś, D. Assessment of the feasibility of implementing shower heat exchangers in residential buildings based on users’ energy saving preferences. Energies 2021, 14, 5547. [Google Scholar] [CrossRef]
  43. Kim, J.; de Dear, R. Thermal comfort expectations and adaptive behavioural characteristics of primary and secondary school students. Build. Environ. 2018, 127, 13–22. [Google Scholar] [CrossRef]
  44. Fang, L.; Wyon, D.P.; Clausen, G.; Fanger, P.O. Impact of indoor air temperature and humidity in an office on perceived air quality, SBS symptoms and performance. Indoor Air 2004, 14, 74–81. [Google Scholar] [CrossRef] [PubMed]
  45. Cena, K.; de Dear, R.J. Field study of occupant comfort and office thermal environments in a hot, arid climate. ASHRAE Trans. 1999, 105, 204. [Google Scholar]
  46. Jing, S.; Lei, Y.; Wang, H.; Song, C.; Yan, X. Thermal comfort and energy-saving potential in university classrooms during the heating season. Energy Build. 2019, 202, 109390. [Google Scholar] [CrossRef]
  47. Donnini, G.; Molina, J.; Martello, C.; Lai, H.K.; Lai, D.H.C.; Chang, C.Y.; Laflamme, M.; Nguyen, V.H.; Haghighat, F. Field study of occupant comfort and office thermal environments in a cold climate. ASHRAE Trans. 1996, 132. Available online: https://www.proquest.com/docview/192574407?pq-origsite=gscholar&fromopenview=true (accessed on 2 November 2021).
  48. Cao, B. Research on the Impacts of Climate and Built Environment on Human Thermal Adaptation. Ph.D. Thesis, Tsinghua University, Beijing, China, 2012. [Google Scholar]
  49. Auliciems, A. Advances in Bioclimatology; Springer: Berlin/Heidelberg, Germany, 1994. [Google Scholar]
  50. Dudkiewicz, E.; Laska, M. Thermal comfort study in naturally ventilated lecture room based on questionnaire survey. In Proceedings of the 10th Windsor Conference: Rethinking Comfort, Windsor, UK, 12–15 April 2018; Available online: https://www.researchgate.net/publication/325385377 (accessed on 2 November 2021).
  51. Schweiker, M.; André, M.; Al-Atrash, F.; Al-Khatri, H.; Alprianti, R.R.; Alsaad, H.; Amin, R.; Ampatzi, E.; Arsano, A.Y.; Azar, E.; et al. Evaluating assumptions of scales for subjective assessment of thermal environments—Do laypersons perceive them the way, we researchers believe? Energy Build. 2020, 211, 109761. [Google Scholar] [CrossRef]
  52. Toftum, J. Air movement—Good or bad? Indoor Air 2004, 14, 40–45. [Google Scholar] [CrossRef]
  53. Kowalski, P.; Szałański, P. Airtightness test of single-family building and calculation result of the energy need for heating in Polish conditions. E3S Web Conf. 2018, 44, 00078. [Google Scholar] [CrossRef]
  54. Cepiński, W.; Szałański, P. Increasing the efficiency of split type air conditioners/heat pumps by using ventilating exhaust air. E3S Web Conf. 2019, 100, 00006. [Google Scholar] [CrossRef] [Green Version]
  55. Kapalo, P.; Spodyniuk, N. Effect of the variable air volume on energy consumption—Case study. IOP Conf. Ser. Mater. Sci. Eng. 2018, 415, 012027. [Google Scholar] [CrossRef]
  56. Gładyszewska-Fiedoruk, K.; Krawczyk, D.A. The possibilities of energy consumption reduction and a maintenance of indoor air quality in doctor’s offices located in north-eastern Poland. Energy Build. 2014, 85, 235–245. [Google Scholar] [CrossRef]
  57. Amanowicz, Ł.; Ratajczak, K.; Szczechowiak, E. Analiza możliwości stosowania systemu wentylacji zdecentralizowanej w budynkach edukacyjnych. Instal 2019, 10, 20–26. [Google Scholar]
  58. Testo. CO2—Überwachung und Raumluftqualität. 2020. Available online: https://static-int.testo.com/media/cb/6c/79472566e769/fachartikel-testo-160-iaq-co2-raumluftqualitaet-leseprobe.pdf (accessed on 2 November 2021).
  59. What Are Safe Levels of CO and CO2 in Rooms? Available online: https://www.kane.co.uk/knowledge-centre/what-are-safe-levels-of-co-and-co2-in-rooms (accessed on 2 November 2021).
  60. Gupta, R.; Howard, A. A real-world empirical investigation of indoor environment and workplace productivity in a naturally-ventilated office environment. In Proceedings of the 10th Windsor Conference: Rethinking Comfort, Windsor, UK, 12–15 April 2018; Available online: https://www.semanticscholar.org/paper/A-real-world-empirical-investigation-of-indoor-and-Gupta-Howard/69bc0611e850155b79fb70687af1080022d183a6 (accessed on 29 November 2021).
  61. Haverinen-Shaughnessy, U.; Shaughnessy, R.J.; Cole, E.C.; Toyinbo, O.; Moschandreas, D.J. An assessment of indoor environmental quality in schools and its association with health and performance. Build. Environ. 2015, 93 Pt 1, 35–40. [Google Scholar] [CrossRef]
  62. Cui, W.; Cao, G.; Ouyang, Q.; Zhu, Y. Influence of dynamic environment with different airflows on human performance. Build. Environ. 2013, 62, 124–132. [Google Scholar] [CrossRef]
  63. Hew, K.F.; Huang, B.; Chu, K.W.S.; Chiu, D.K.W. Engaging Asian students through game mechanics: Findings from two experiment studies. Comput. Educ. 2016, 92–93, 221–236. [Google Scholar] [CrossRef]
Figure 1. The limit values: (a) sultriness curve acc. Lancaster-Castens, (b) decrease in performance during heavy physical work acc. Ehris-Mann-Hasse, (c) limit of endurance acc. Wezler-Thauer [30].
Energies 14 08159 g001
Figure 2. The experiment and measurement procedure.
Energies 14 08159 g002
Figure 3. The lecture room where the survey was conducted.
Energies 14 08159 g003
Figure 4. Relationship between weighted mean running outdoor temperature (Trm) and operative temperature (To) in the investigated room. Continuous lines are dedicated for heating mode, dashed—for free-running buildings. Green lines indicate the comfort temperature, where the red and blue line define the upper and lower limit of comfort temperatures, respectively. Black and white dots represent the room operating temperatures during the 3 days of the survey.
Energies 14 08159 g004
Figure 5. Relative frequency of TSV for both groups (A and B)—three survey days.
Energies 14 08159 g005
Figure 6. Relative frequency of TPV for both groups (A and B)—three survey days.
Energies 14 08159 g006
Figure 7. The distribution of students’ responses about indoor air quality (fresh/stuffy air) for all groups during the three measurements days (AfSV).
Energies 14 08159 g007
Figure 8. Air Movement Preference Votes (AmPV) from all 323 surveys.
Energies 14 08159 g008
Figure 9. Relative Humidity Preference Votes distribution RHPV.
Energies 14 08159 g009
Figure 10. Percentage distribution of willingness to work for six groups.
Energies 14 08159 g010
Figure 11. Subjective factors affecting the willingness to work defined by students.
Energies 14 08159 g011
Figure 12. The percentage distribution of students’ perceptions and feelings.
Energies 14 08159 g012
Figure 13. Relationship between Thermal Sensation Vote (TSV), Thermal Preference Vote (TPV) and operative temperature To.
Energies 14 08159 g013
Figure 14. Relationship between Air Freshness Sensation Vote (AfSV), Air Movement Preferences Vote (AmPV), Relative Humidity Preference Vote (RHPV) and operative temperature To.
Energies 14 08159 g014
Figure 15. Relationship between TPV and AmPV.
Energies 14 08159 g015
Figure 16. Relationship between AmPV and AfSV, depending on distance from sultriness curve.
Energies 14 08159 g016
Table 1. Sultriness curve parameters based on Lancaster-Castens theory and the Equation (1).
Temperature,
(T, °C)
Values acc. to Lancaster-Castens from the Graph, (RH, %)Values from Equation (1), (RH, %)
207480
217175
226870
236566
246362
256058
265855
275552
285449
295146
Table 2. Data on measurements and participants.
Group and Day NumberA1B1A2B2A3B3
Date9 October4 December15 January
Number of participants2511017822564
Room occupancy (100% indicates no available seats)837627821
Age18–2118–2919–2418–2219–2218–29
Gender:• Male14658481442
• Female11439341122
• Not given-2----
Table 3. Thermal and freshness sensation, thermal, humid and air movement preferences scales used in the questionnaire.
ParameterScale
TSV−3−2−10+1+2+3
ColdCoolSlightly coolNeutralSlightly warmWarmHot
AfSV−3 −2−10+1+2+3
Definitely stuffy Definitely fresh
TPV−3−2−10+1+2+3
Much colder Much warmer
RHPV−3−2−10+1+2+3
Much drier More humid
AmPV−3−2−10+1+2+3
Weaker air movement Stronger air movement
Table 4. Summary of measured and surveyed parameters.
Group and Day Number A1B1A2B2A3B3
Indoor temperature, °CMean24.2825.4821.1121.9421.8522.64
Min24.2025.2720.9421.6721.7222.56
Max24.4525.7821.4422.2221.9422.89
S.D.0.080.150.110.110.070.10
Operating temperature, °CMean23.9624.9820,721.121.121.9
Min23.8824.9620.621.021.4222.61
Max24.0525.020.921.521.7022.90
S.D.0.03 0.03 0.10.10.120.32
Outdoor temperature, °C 21.022.08.77.42.02.0
Indoor humidity, % Mean45.547.136.935.925.527.8
Min45.245.835.134.425.227.0
Max45.948.741.736.826.028.5
S.D.0.230.891.600.600.200.40
Outdoor humidity, % 525380798787
CO2 concentration, ppmMean7251345688946629853
Min639818645776614782
Max79116687881014655913
S.D.4627138691235
Indoor air velocity, m/sMean<0.1 *<0.1 *0.030.040.010.04
Min--0.0020.0060.0020.01
Max--0.070.080.020.07
S.D.--0.030.020.010.02
* during the first day, the indoor air velocity has not been measured. However, all former records indicate that the air velocity in the room does not exceed value of 0.1 m/s. Therefore, this value was assumed for further investigation.
Table 5. Summary of students’ responses.
GroupTo, °CTemperature Air MovementAir relative Humidity
TSV MeanTPV MeanCoolerNo ChangeWarmerAfSV MeanAmPV MeanWeaker Air MovementNo ChangeStronger Air MovementRHPV MeanMuch DrierNo ChangeMore Humid
A124.30.76−0.0428%52%20%0.281.004%24%72%0,2812%56%32%
B125.50.97−0.5052%35%13%−0.441.215%19%76%0,4310%45%45%
A221.1−0.240.766%41%53%1.000.0041%24%35%0,1818%53%29%
B221.90.210.2227%37%37%−0.050.2028%28%43%0,2615%50%35%
A321.80.280.2424%48%28%−0.080.4424%28%48%0,328%64%28%
B322.60.700.1127%39%34%0.080.6414%31%55%0,4213%44%44%
Table 6. Regression models of TSV from field studies done in classrooms [45,46,47,48,49,50].
AuthorRegressionTo for TSV = 0 [°C]R2
de Dear and Auliciems, 1985TSV = 0.522 To − 12.6724.270.985
Donnini et al., 1997TSV = 0.493 To − 11.6923.710.989
Cena and de Dear, 1999TSV = 0.21 To − 4.28 (winter)20.380.843
TSV = 0.27 To − 6.29 (summer)23.300.888
Wang et al., 2003TSV = 0.199 To − 4.158 (male)20.890.658
TSV = 0.243 To − 5.33 (female)21.930.800
Kim and de Dear, 2018TSV = 0.16 Tdiff + 0.24 (primary school)To = Tn − 1.50.790
TSV = 0.15 Tdiff + 0.12 (secondary school)To = Tn − 0.80.740
Singh et al., 2018TSV = 0.19 Ta − 5.0426.530.610
Cao, 2012TSV = 0.081 To − 1.92723.79-
Zhang et al., 2007TSV = 0.0448 To − 0.962821.490.374
Teli et al., 2012TSV = 0.27 To − 5.5520.560.545
Laska and Dudkiewicz, 2018TSV = 0.2275 To − 4.977921.880.565
Liu et al., 2019TSV = 0.41 To − 8.4220.600.790
Jing et al., 2019TSV = 0.1481 To − 3.829425.860.670
This studyTSV = 0.2622 To − 5.499320.970.818
Table 7. Distance D from sultriness curve.
Distance from Sultriness CurveA1B1A2B2 A3 B3
Dinterior−0.66 −0.32 −1.43 −1.49 −2.05 −1.75
Dexterior−1.0 −0.8 −6.5 −8.5 −44.7 −44.7
Table 8. The outcomes of the regression analysis for indices of sensations and preferences.
ParameterRegressionR2pComments
TSV TSV = 0.26222 · T o 5.49925 0.8897<0.0048the relationship between the variables is strong and statistically significant
AfSV AfSV = 0.17603 · T o + 4.12316 0.3359<0.2279the relationship between the variables is not statistically significant
TPV TPV = 0.20663 · T o + 4.73746 0.7867<0.0185the relationship between the variables is strong and statistically significant
AmPV AmPV = 0.28594 · T o + 5.90202 0.9737<0.0003the relationship between the variables is strong and statistically significant
RHPV RHPV = 0.04227 · T o 0.64344 0.4903<0.1214the relationship between the variables is fairly strong but not statistically significant
AfSV AfSV = 0.1631 · D   0.0771 0.0493<0.6723the relationship between the variables is not statistically significant
AmPV AmPV = 0.5094 · D + 1.2352 0.5254<0.1032the relationship between the variables is fairly strong but not statistically significant
Table 9. CO2 concentration levels description and its impact on the well-being and health [58,59].
ConcentrationDescription and Impact on Well-Being and Health
350–450 ppmNormal background concentration in outdoor ambient air
600–800 ppmTypical concentration for well ventilated indoor spaces
1000 ppmStill reliable indoor air quality
1000–2000 ppmComplaints of drowsiness and poor air.
2000–5000 ppmHeadaches, sleepiness and stagnant, stale, stuffy air. Poor concentration, loss of attention, increased heart rate and slight nausea may also be present.
5000 ppmMaximum concentration in work spaces above 8 h. Workplace exposure limit (as 8-h TWA) in most jurisdictions
6000–30,000 ppmNot harmful, only for short term exposure
3–8%Increased respiratory rate, headache
>10%Nausea, vomiting, loss of consciousness
>20%Rapid loss of consciousness, death
>40,000 ppmExposure may lead to serious oxygen deprivation resulting in permanent brain damage, coma, even death
Table 10. The outcomes of the multiple regression analysis between AfSV and internal conditions.
Ind.VariablesRegressionR2R2adjp-Value
(a)To, RH, CO2 AfSV = 4.101 0.216 · T o 0.001 · CO 2 + 0.045 · RH 0.8010.5030.283
(b)Din, CO2 AfSV = 1.624 + 0.284 · D in 0.001 · CO 2 0.4250.0420.436
(c)To, Din, CO2 AfSV = 11.276 0.399 · T o 0.001 · CO 2 + 0.980 · D in 0.7950.4870.291
(d)1/To, RH, CO2 AfSV = 5.802 + 114.768 · 1 T o 0.044 · RH 0.001 · CO 2 0.8040.5080.280
(e)To, RH, Din, CO2 AfSV = 48.401 + 1.131 · T o 0.372 · RH 0.001 · CO 2 7.162 · D in 0.8230.1150.594
Publisher’s Note: MDPI stays neutral with regard to jurisdictional claims in published maps and institutional affiliations.

