
Evaluation of the Level of Electricity Generation from Renewable Energy Sources in European Union Countries


Abstract
:1. Introduction
2. Literature Review
- At the UN Summit in Poznań in December 2008, the ‘Climate Package’, which was developed by the European Commission, was adopted. Its approval obliges Poland to develop renewable energy and increase energy efficiency in accordance with the 3 × 20 Programme [6].
- On 24 November 2010, Directive 2010/75/EU of the European Parliament and of the Council on industrial emissions (IED) was adopted, under which permissible standards for dust, sulphur oxide, and nitrogen oxide emissions must be lowered. It came into force in 2016 [7].
- At the beginning of March 2011, the European Commission presented a document entitled ‘A roadmap for moving to a competitive low-carbon economy’, which includes a long-term plan for reducing carbon dioxide emissions after 2020 [8]. According to this plan, greenhouse gas emissions should be cut by 80% by 2050. The EC, by its decision of 27 April 2011, allocated for Poland approximately 477 million emission allowances for the period 2013–2020.
- On 6 December 2012, at the UN COP 18 summit in Doha, Qatar, with participants from 194 countries, the first Kyoto Protocol was extended to 2020. At this conference, a nuclear power expert—Alan McDonald—presented the IAEA agency’s report ‘Climate Change and Nuclear Power 2012’, which classified nuclear power as a clean source [9].
- The document entitled ‘A roadmap for moving to a competitive low-carbon economy’ contains provisions according to which the reform may be carried out in the event of low prices of pollution allowances, occurring since the beginning of 2013, when the price dropped to 4 euros per tonne. On 14 March 2013, the European Parliament voted on and approved this reform, which in practice means the withdrawal of 900 million allowances and a loss of around one billion euros in budget revenues for Poland.
- On 28 March 2014 the Government approved the draft of the Renewable Energy Sources Act [10], which sets out how their development will be supported in the country.
- -
- Directive 2003/87/EC of the European Parliament and of the Council of 13 October 2003, establishing a scheme for greenhouse gas emission allowance trading within the Community and amending Council Directive 96/61/EC (Text with EEA relevance) (OJ L 275, 25 December 2003) [11].
- -
- Directive 2008/98/EC of the European Parliament and of the Council of 19 November 2008 on waste and repealing certain Directives (Text with EEA relevance) (OJ L 22 November 2008) [12].
- -
- Directive 2010/75/EU of the European Parliament and of the Council of 24 November 2010 on industrial emissions (integrated pollution prevention and control) [7].
- -
- Directive (EU) 2018/2001 of the European Parliament and of the Council of 11 December 2018 on the promotion of the use of energy from renewable sources [13].
3. Material and Methods
- k—number of diagnostic variables;
- n—number of objects (here: countries).
4. Results
- X1—share of electricity generation from renewable sources in total electricity generation (in %);
- X2—electricity generation from water energy (in GWh per capita);
- X3—electricity generation from wind energy (in GWh per capita);
- X4—electricity generation from solar energy (in GWh per capita);
- X5—electricity generation from biomass (in GWh per capita).
- p—number of potential diagnostic variables.
- -
- Classic least squares method (KMNK) estimator;
- -
- Fixed effect (FE) estimator;
- -
- Random effect (RE) estimator.
5. Conclusions
Limitations of the Study
Author Contributions
Funding
Institutional Review Board Statement
Informed Consent Statement
Conflicts of Interest
References
- Twidell, J.; Weir, T. Renewable Energy Resources, 3rd ed.; Taylor&Francis Ltd.: London, UK, 2015. [Google Scholar]
- Rehman, S.; Al-Hadhrami, L.M.; Alam, M. Pumped hydro energy storage system: A technological review. Renew. Sustain. Energy Rev. 2015, 44, 586–598. [Google Scholar] [CrossRef]
- Pramod, J. Wind Energy Engineering; McGraw-Hill Education: New York, NY, USA, 2016. [Google Scholar]
- Trela, M.; Dubiel, A. Efektywność Ekonomiczna Elektrowni Fotowoltaicznych Oraz Uniknięte Koszty Zewnętrzne w Wyniku ich Funkcjonowania. 2014. Available online: https://tinyurl.com/3exstvb4 (accessed on 3 October 2021).
- Gary, B.R.; Cagle, D.S. Biomass Energy; Oak Ridge National Lab. (ORNL): Oak Ridge, TN, USA, 2010. Available online: https://www.osti.gov/biblio/1050890, (accessed on 3 October 2021).
- European Commision. Climate Package. 2008. Available online: https://ec.europa.eu/clima/eu-action/climate-strategies-targets/2020-climate-energy-package_en (accessed on 5 September 2021).
- Directive 2010/75/EU of the European Parliament and of the Council of 24 November 2010 on Industrial Emissions (Integrated Pollution Prevention and Control). 2010. Available online: https://eur-lex.europa.eu/LexUriServ/LexUriServ.do?uri=OJ:L:2010:334:0017:0119:en:PDF (accessed on 5 September 2021).
- European Commision. A Roadmap for Moving to a Competitive Low-Carbon Economy in 2050. 2011. Available online: https://www.eea.europa.eu/policy-documents/com-2011-112-a-roadmap (accessed on 3 October 2021).
- IAEA. Climate Change and Nuclear Power. 2012. Available online: https://www.iaea.org/sites/default/files/climate_change.pdf (accessed on 5 September 2021).
- The Draft of Renewable Energy Sources Act. 2014. Available online: https://wysokienapiecie.pl/18095-analysis-draft-amendment-renewable-energy-sources-act/ (accessed on 5 September 2021).
- Directive 2003/87/EC of the European Parliament and of the Council of 13 October 2003 Establishing a Scheme for Greenhouse Gas Emission Allowance Trading within the Community and Amending Council Directive 96/61/EC. 2003. Available online: https://eur-lex.europa.eu/legal-content/EN/ALL/?uri=celex:32003L0087 (accessed on 5 September 2021).
- Directive 2008/98/EC of the European Parliament and of the Council of 19 November 2008 on Waste and Repealing Certain Directives (Text with EEA Relevance) (OJ L 22 November 2008). 2008. Available online: https://eur-lex.europa.eu/LexUriServ/LexUriServ.do?uri=OJ:L:2008:312:0003:0030:en:PDF (accessed on 5 September 2021).
- Directive (EU) 2018/2001 of the European Parliament and of the Council of 11 December 2018 on the Promotion of the Use of Energy from Renewable Sources. 2018. Available online: https://eur-lex.europa.eu/legal-content/EN/TXT/PDF/?uri=CELEX:32018L2001&from=EN (accessed on 5 September 2021).
- Chakraborty, S.K.C.; Mazzanti, M. Renewable electricity and economic growth relationship in the long run: Panel data econometric evidence from the OECD. Struct. Chang. Econ. Dyn. 2021, 59, 330–341. [Google Scholar] [CrossRef]
- Halkos, G.; Gkampoura, E.-C. Examining the Linkages among Carbon Dioxide Emissions, Electricity Production and Economic Growth in Different Income Levels. Energies 2021, 14, 1682. [Google Scholar] [CrossRef]
- Szopik-Depczynska, K.; Kędzierska-Szczepaniak, A.; Szczepaniak, K.; Cheba, K.; Gajda, W.; Ioppolo, G. Innovation in sustainable development: An investigation of the EU context using 2030 agenda indicators. Land Use Policy 2018, 79, 251–262. [Google Scholar] [CrossRef]
- Szopik-Depczynska, K.; Cheba, K.; Bąk, I.; Stajniak, M.; Simboli, A.; Ioppolo, G. The study of relationship in a hierarchical structure of EU sustainable development indicators. Ecol. Indic. 2018, 90, 120–131. [Google Scholar] [CrossRef]
- Pao, H.-T.; Fu, H.-C. Renewable energy, non-renewable energy and economic growth in Brazil. Renew. Sustain. Energy Rev. 2013, 25, 381–392. [Google Scholar] [CrossRef]
- Lin, M.-X.; Liou, H.M.; Chou, K.T. National Energy Transition Framework toward SDG7 with Legal Reforms and Policy Bundles: The Case of Taiwan and Its Comparison with Japan. Energies 2020, 13, 1387. [Google Scholar] [CrossRef] [Green Version]
- Pietrzak, M.; Igliński, B.; Kujawski, W.; Iwański, P. Energy Transition in Poland—Assessment of the Renewable Energy Sector. Energies 2021, 14, 2046. [Google Scholar] [CrossRef]
- Grosse, T.G. Low Carbon Economy Policy in Poland: An Example of the Impact of Europeanisation. Equilibrium 2011, 6, 9–39. [Google Scholar] [CrossRef]
- Chovancová, J.; Tej, J. Decoupling economic growth from greenhouse gas emissions: The case of the energy sector in V4 countries. Equilib. Q. J. Econ. Econ. Policy 2020, 15, 235–251. [Google Scholar] [CrossRef]
- Zielenkiewicz, M. Institutional Environment in the Context of Development of Sustainable Society in the European Union Countries. Equilibrium 2014, 9, 21–38. [Google Scholar] [CrossRef]
- Sustainable Development Solutions Network and the Institute for European Environmental Policy. 2019 Europe Sustainable Development Report, Sustainable Development Solutions Network and Institute for European Environmental Policy. 19 November 2019. Available online: https://www.sdgindex.org/reports/ (accessed on 5 September 2021).
- Piekut, M. The Consumption of Renewable Energy Sources (RES) by the European Union Households between 2004 and 2019. Energies 2021, 14, 5560. [Google Scholar] [CrossRef]
- Yu, B.; Fang, D.; Yu, H.; Zhao, C. Temporal-spatial determinants of renewable energy penetration in electricity production: Evidence from EU countries. Renew. Energy 2021, 180, 438–451. [Google Scholar] [CrossRef]
- Markandya, A.; Arto, I.; González-Eguino, M.; Román, M.V. Towards a green energy economy? Tracking the employment effects of low-carbon technologies in the European Union. Appl. Energy 2016, 179, 1342–1350. [Google Scholar] [CrossRef] [Green Version]
- Kacperska, E.; Łukasiewicz, K.; Pietrzak, P. Use of Renewable Energy Sources in the European Union and the Visegrad Group Countries—Results of Cluster Analysis. Energies 2021, 14, 5680. [Google Scholar] [CrossRef]
- Simoes, S.G.; Amorim, F.; Siggini, G.; Sessa, V.; Saint-Drenan, Y.-M.; Carvalho, S.; Mraihi, H.; Assoumou, E. Climate proofing the renewable electricity deployment in Europe—Introducing climate variability in large energy systems models. Energy Strat. Rev. 2021, 35, 100657. [Google Scholar] [CrossRef]
- Mehedintu, A.; Soava, G.; Sterpu, M.; Grecu, E. Evolution and Forecasting of the Renewable Energy Consumption in the Frame of Sustainable Development: EU vs. Romania. Sustainability 2021, 13, 10327. [Google Scholar] [CrossRef]
- Marra, A.; Colantonio, E. The path to renewable energy consumption in the European Union through drivers and barriers: A panel vector autoregressive approach. Socio-Economic Plan. Sci. 2020, 76, 100958. [Google Scholar] [CrossRef]
- Marinaș, M.-C.; Dinu, M.; Socol, A.-G.; Socol, C. Renewable energy consumption and economic growth. Causality relationship in Central and Eastern European countries. PLoS ONE 2018, 13, e0202951. [Google Scholar] [CrossRef] [Green Version]
- Belke, A.; Dobnik, F.; Dreger, C. Energy consumption and economic growth: New insights into the cointegration relationship. Energy Econ. 2011, 33, 782–789. [Google Scholar] [CrossRef] [Green Version]
- Overland, I. Energy: The missing link in globalization. Energy Res. Soc. Sci. 2016, 14, 122–130. [Google Scholar] [CrossRef] [Green Version]
- Remeikiene, R.; Gasparenien, L.; Fedajev, A.; Szarucki, M.; Ðeki´c, M.; Razumiene, J. Evaluation of Sustainable Energy Development Progress in EU Member States in the Context of Building Renovation. Energies 2021, 14, 4209. [Google Scholar] [CrossRef]
- Aklin, M. Do high electricity bills undermine public support for renewables? Evidence from the European Union. Energy Policy 2021, 156, 112400. [Google Scholar] [CrossRef]
- Percebois, J.; Pommeret, S. Efficiency and dependence in the European electricity transition. Energy Policy 2021, 154, 112300. [Google Scholar] [CrossRef]
- Schreiner, L.; Madlener, R. A pathway to green growth? Macroeconomic impacts of power grid infrastructure investments in Germany. Energy Policy 2021, 156, 112289. [Google Scholar] [CrossRef]
- Hiesl, A.; Ajanovic, A.; Haas, R. On current and future economics of electricity storage. Greenh. Gases Sci. Technol. 2020, 10, 1176–1192. [Google Scholar] [CrossRef]
- Cárdenas, B.; Swinfen-Styles, L.; Rouse, J.; Hoskin, A.; Xu, W.; Garvey, S. Energy storage capacity vs. renewable penetration: A study for the UK. Renew. Energy 2021, 171, 849–867. [Google Scholar] [CrossRef]
- Aqachmar, Z.; Ben Sassi, H.; Lahrech, K.; Barhdadi, A. Solar technologies for electricity production: An updated review. Int. J. Hydrog. Energy 2021, 46, 30790–30817. [Google Scholar] [CrossRef]
- Perkins, G. Perspectives and economics of combining biomass liquefaction with solar PV for energy storage and electricity production. Energy Sources Part B Econ. Plan. Policy 2020, 16, 118–134. [Google Scholar] [CrossRef]
- De Negri, J.F.; Pezzutto, S.; Gantioler, S.; Moser, D.; Sparber, W. A Comprehensive Analysis of Public and Private Funding for Photovoltaics Research and Development in the European Union, Norway, and Turkey. Energies 2020, 13, 2743. [Google Scholar] [CrossRef]
- Eurostat. Database. Available online: https://ec.europa.eu/eurostat/web/main/data/database (accessed on 3 October 2021).
- Cheba, K.; Szopik-Depczyńska, K. Multidimensional comparative analysis of the competitive capacity of the European Union countries and geographical regions. Oeconomia Copernic. 2017, 8, 487–504. [Google Scholar] [CrossRef] [Green Version]
- Rollnik-Sadowska, E.; Dąbrowska, E. Cluster analysis of effectiveness of labour market policy in the European Union. Oeconomia Copernic. 2018, 9, 143–158. [Google Scholar] [CrossRef]
- Ginevičius, R. Multi-criteria assessment of socioeconomic systems’ conditions based on hierarchically structured indicator systems. Econ. Sociol. 2020, 13, 256–266. [Google Scholar] [CrossRef] [PubMed]
- Kukuła, K. Metoda Unitaryzacji Zerowanej; Wydawnictwo Naukowe PWN: Warszawa, Poland, 2000. [Google Scholar]
- Statystyczne Metody Analizy Danych; Ostasiewicz, W. (Ed.) Wydawnictwo Akademii Ekonomicznej im. Oskara Langego we Wrocławiu: Wrocław, Poland, 1999. [Google Scholar]
- Walesiak, M. Uogólniona Miara Odległości GDM w Statystycznej Analizie Wielowymiarowej z Wykorzystaniem Programu R; Wydawnictwo Uniwersytetu Ekonomicznego we Wrocławiu: Wrocław Poland, 2016. [Google Scholar]
- Stiglitz, J.E.; Sen, A.; Fitoussi, J.-P. Report by the Commission on the Measurement of Economic Performance and Social Progress. Executive Summary. 2009. Available online: https://ec.europa.eu/eurostat/documents/8131721/8131772/Stiglitz-Sen-Fitoussi-Commission-report.pdf (accessed on 10 November 2021).
- Osińska, M.; Kośko, M. Modele danych panelowych. In Ekonometria Współczesna; Osińska, M., Ed.; Towarzystwo Naukowe Organizacji i Kierownictwa: Toruń, Poland, 2007; pp. 416–418. [Google Scholar]
- Kufel, T. Ekonometria. Rozwiązywanie Problemów z Wykorzystaniem Programu Gretl; Wydawnictwo Naukowe PWN: Warszawa, Poland, 2007. [Google Scholar]
- Maddala, G. Introduction to Econometrics, 2nd ed.; Macmillan Publishing Company: New York, NY, USA, 1992. [Google Scholar]
- Baltagi, B.H. Econometric Analysis of Panel Data; John Wiley & Sons Ltd.: Chichester, UK, 2001. [Google Scholar]
- Dańska-Borsiak, B. Dynamiczne Modele Panelowe w Badaniach Empirycznych; Wydawnictwo Uniwersytetu Łódzkiego: Łódź, Poland, 2011. [Google Scholar]
- Huterski, R.; Huterska, A.A.; Łapińska, J.; Zdunek-Rosa, E. The problem of savings exclusion and gross savings in the new European Union member states. Entrep. Sustain. Issues 2020, 7, 2470–2480. [Google Scholar] [CrossRef]


| Country | Ranking Position in the Year: | |||
|---|---|---|---|---|
| 2004 | 2009 | 2014 | 2019 | |
| Austria | 4 | 2 | 2 | 3 |
| Belgium | 22 | 14 | 11 | 10 |
| Bulgaria | 20 | 25 | 23 | 22 |
| Croatia | 8 | 11 | 13 | 14 |
| Cyprus | 26 | 27 | 26 | 25 |
| Czechia | 21 | 21 | 18 | 21 |
| Denmark | 5 | 7 | 3 | 4 |
| Estonia | 27 | 20 | 19 | 12 |
| Finland | 2 | 5 | 4 | 2 |
| France | 17 | 17 | 22 | 20 |
| Germany | 6 | 4 | 6 | 5 |
| Greece | 15 | 16 | 12 | 13 |
| Hungary | 24 | 23 | 27 | 27 |
| Ireland | 16 | 13 | 16 | 15 |
| Italy | 13 | 12 | 8 | 9 |
| Latvia | 9 | 9 | 14 | 18 |
| Lithuania | 23 | 24 | 21 | 19 |
| Luxembourg | 3 | 8 | 9 | 6 |
| Malta | 28 | 28 | 28 | 26 |
| Netherlands | 12 | 15 | 24 | 17 |
| Poland | 25 | 26 | 25 | 28 |
| Portugal | 10 | 6 | 5 | 7 |
| Romania | 14 | 19 | 15 | 23 |
| Slovakia | 18 | 18 | 20 | 24 |
| Slovenia | 11 | 10 | 10 | 16 |
| Spain | 7 | 3 | 7 | 11 |
| Sweden | 1 | 1 | 1 | 1 |
| United Kingdom | 19 | 22 | 17 | 8 |
| Taxonomic Measures of Development * | C. Net Electricity Exports ** (as % of Electricity Production) | |||||||
|---|---|---|---|---|---|---|---|---|
| A. Ranking (with Bio) | B. Ranking (without Bio) | |||||||
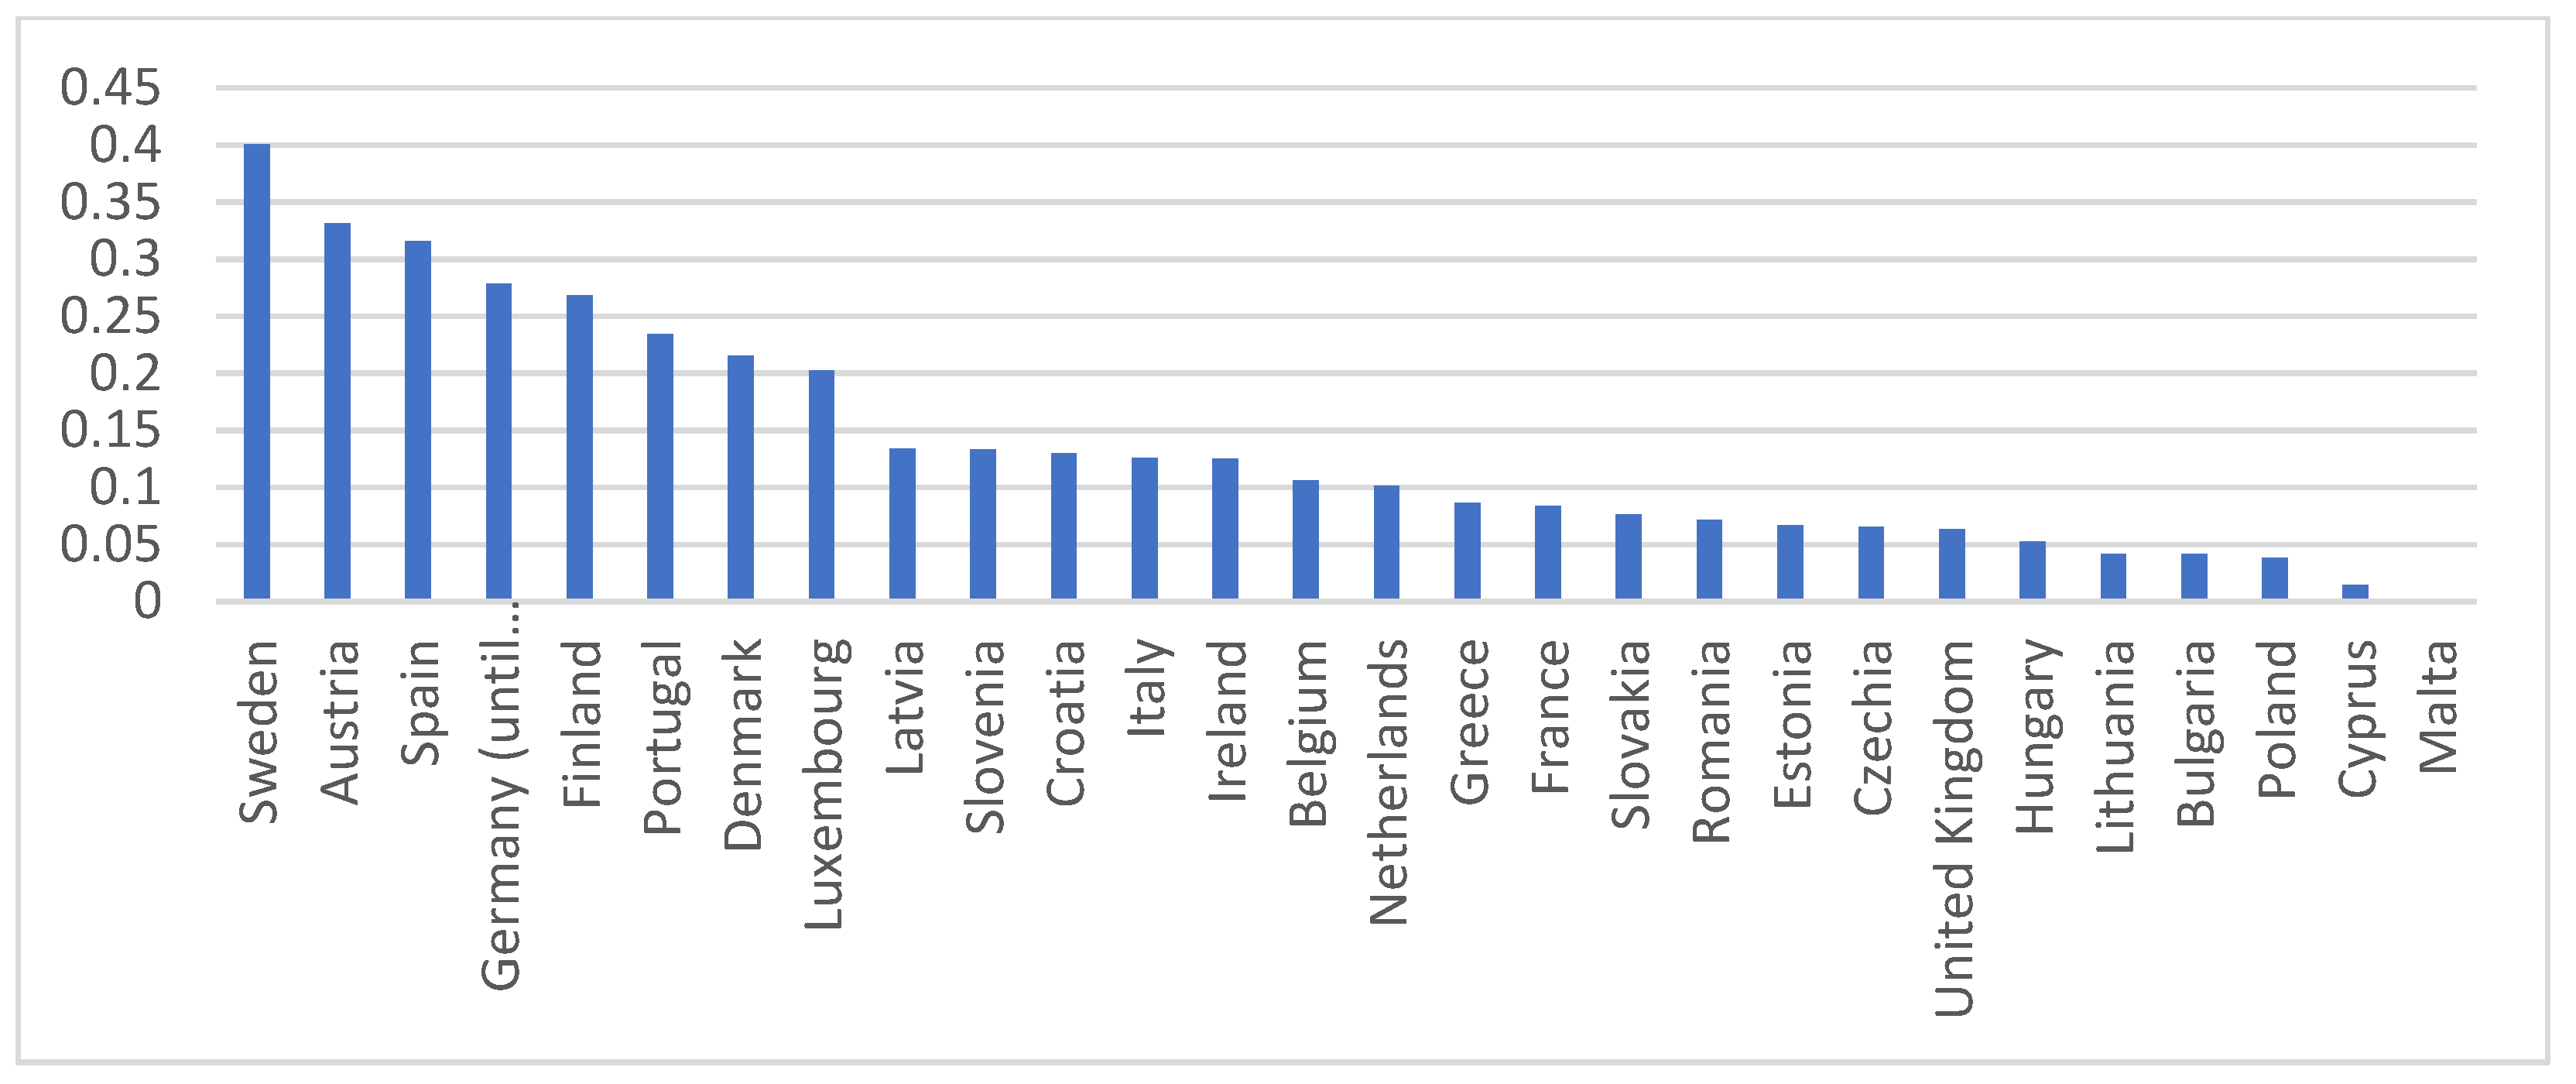
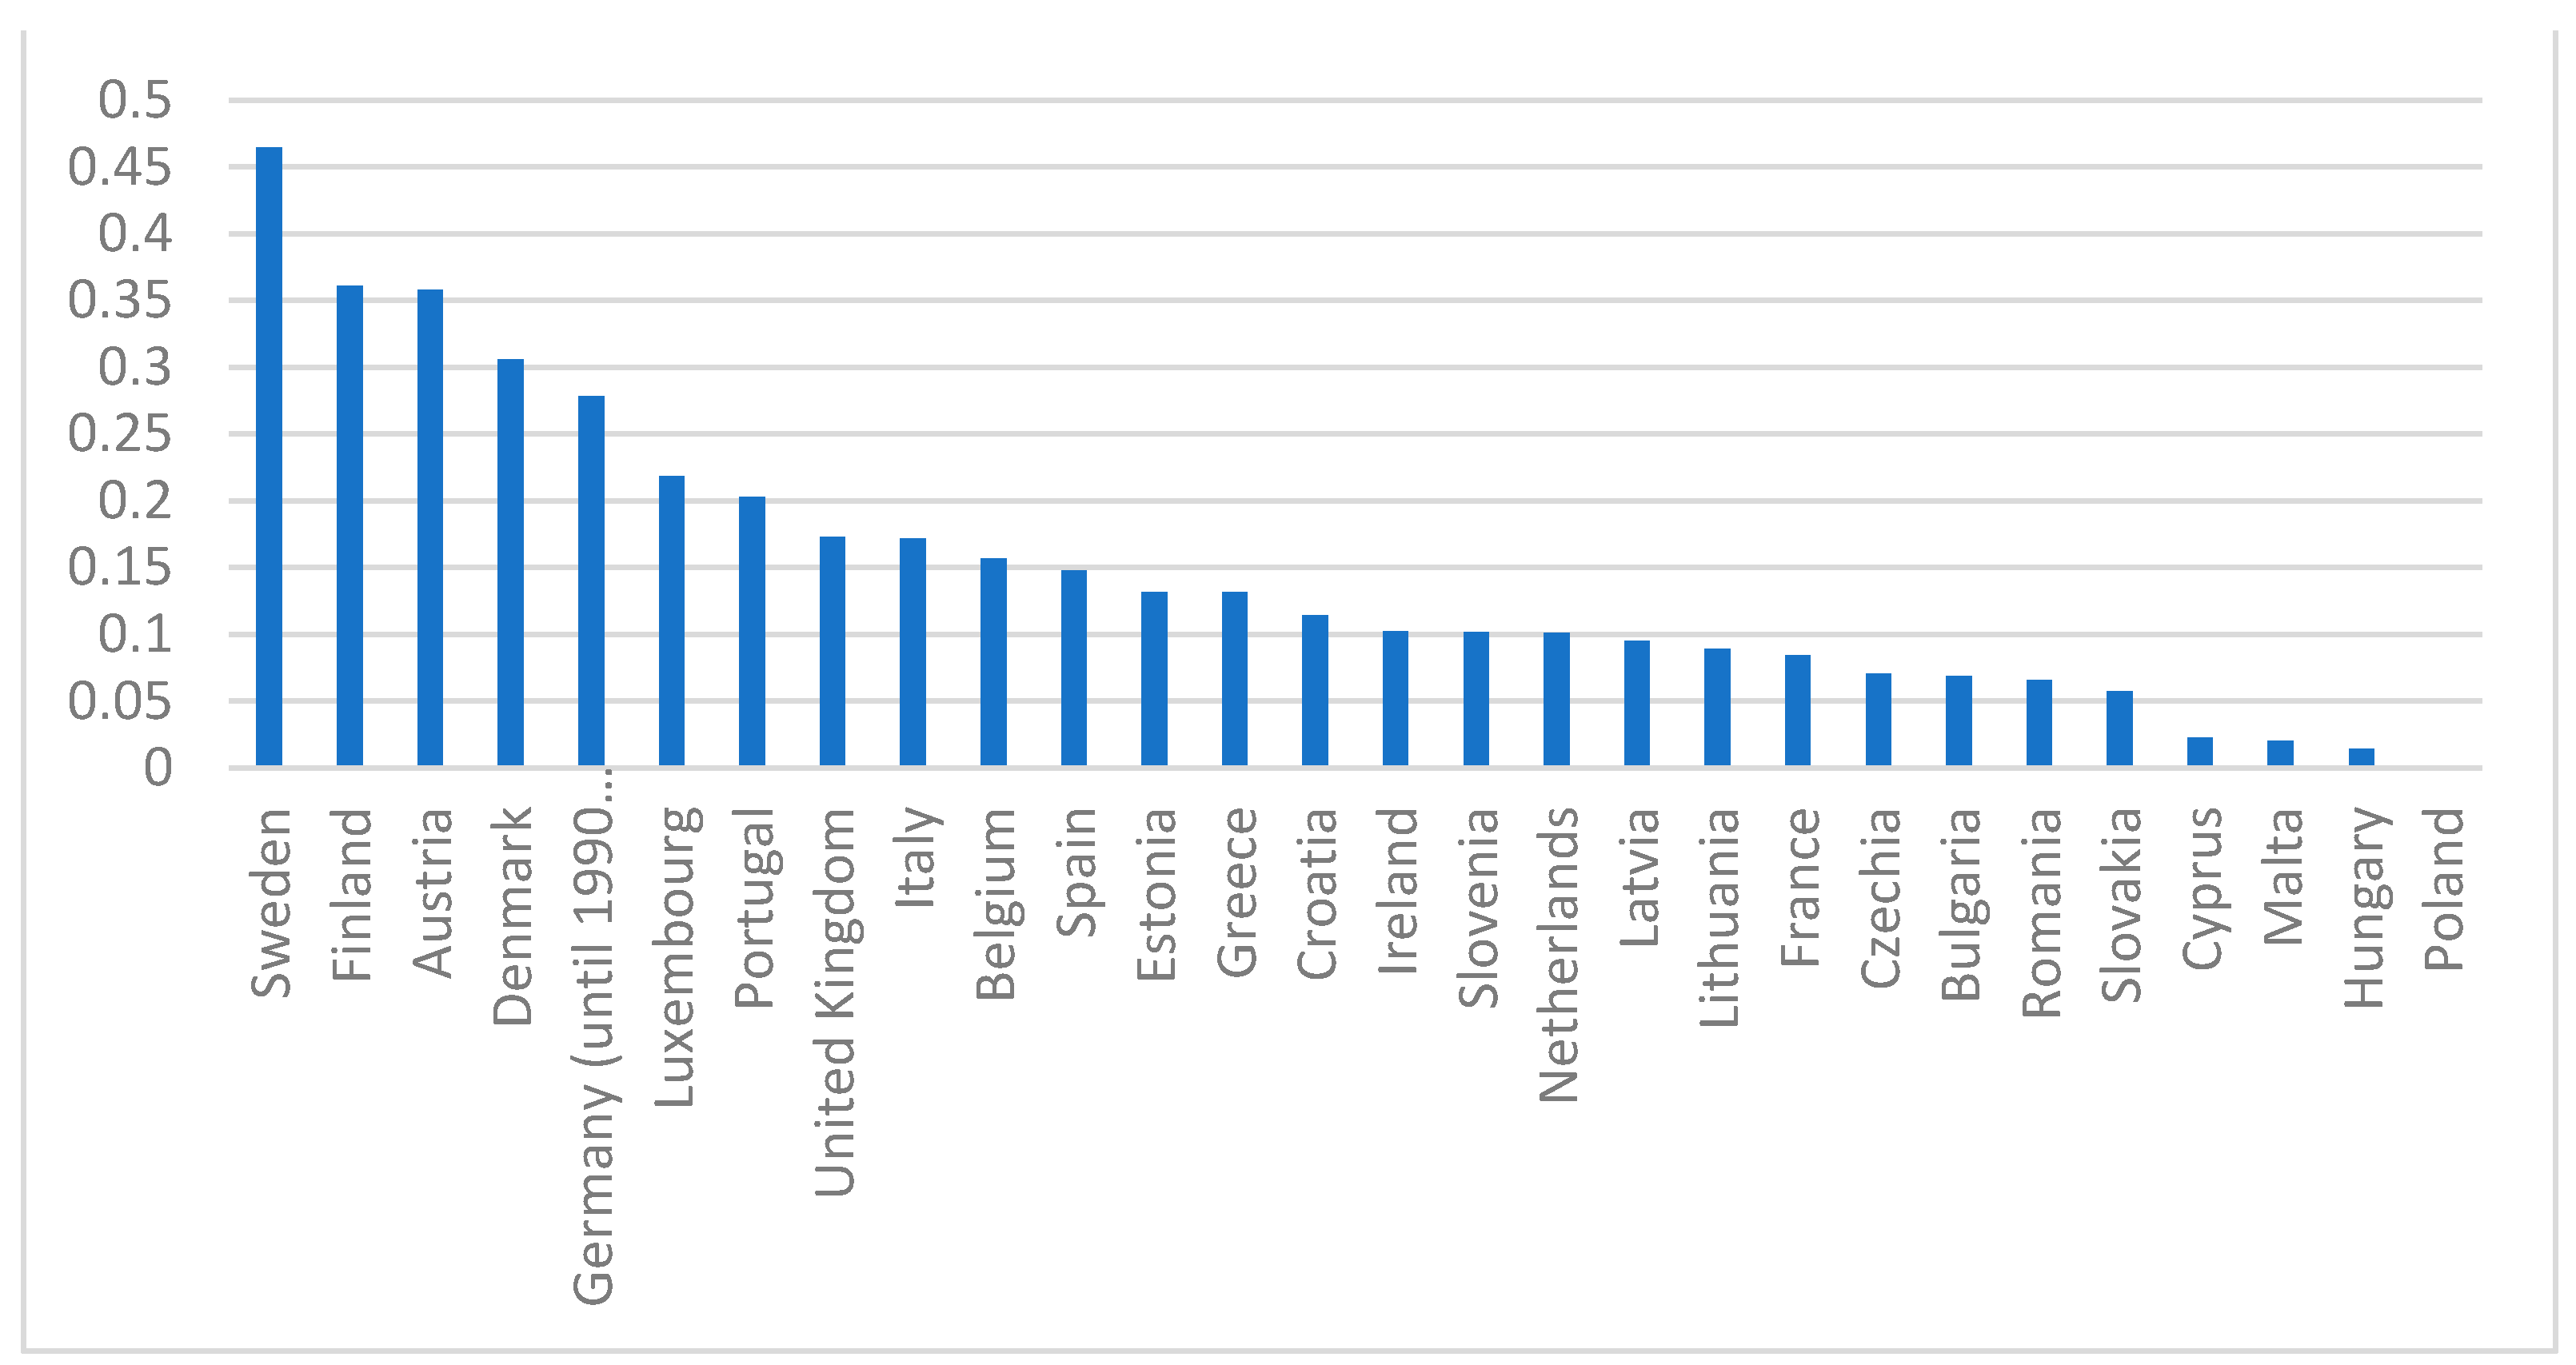
| 1. O | Sweden | 0.4645 | 1. O | Sweden | 0.4792 | 1. O | Sweden | 15.5 |
| 2. O | Finland | 0.3611 | 2. O | Austria | 0.4641 | 2. N | Czechia | 15.1 |
| 3. O | Austria | 0.3580 | 3. O | Germany | 0.3293 | 3. N | Bulgaria | 13.1 |
| 4. O | Denmark | 0.3058 | 4. O | Denmark | 0.3025 | 4. O | France | 10.1 |
| 5. O | Germany | 0.2784 | 5. O | Luxembourg | 0.2778 | 5. O | Germany | 5.4 |
| 6. O | Luxembourg | 0.2186 | 6. O | Portugal | 0.2726 | 6. O | Belgium | 2.0 |
| 7. O | Portugal | 0.2030 | 7. O | Finland | 0.2482 | 7. N | Slovenia | 2.0 |
| 8. O | United Kingdom | 0.1726 | 8. O | Spain | 0.2345 | 8. N | Cyprus | 0.0 |
| 9. O | Italy | 0.1717 | 9. O | Italy | 0.2269 | 9. O | Netherlands | −0.7 |
| 10. O | Belgium | 0.1565 | 10. O | Greece | 0.2257 | 10. O | Ireland | −2.1 |
| 11. O | Spain | 0.1474 | 11. O | Belgium | 0.1861 | 11. O | Spain | −2.5 |
| 12. N | Estonia | 0.1317 | 12. O | United Kingdom | 0.1836 | 12. N | Romania | −2.5 |
| 13. O | Greece | 0.1312 | 13. O | Ireland | 0.1645 | 13. O | Austria | −4.2 |
| 14. N | Croatia | 0.1143 | 14. N | Slovenia | 0.1610 | 14. N | Slovakia | −6.0 |
| 15. O | Ireland | 0.1021 | 15. N | Croatia | 0.1583 | 15. O | Portugal | −6.4 |
| 16. N | Slovenia | 0.1013 | 16. O | France | 0.1412 | 16. N | Poland | −6.5 |
| 17. O | Netherlands | 0.1011 | 17. O | Netherlands | 0.1393 | 17. O | United Kingdom | −6.5 |
| 18. N | Latvia | 0.0948 | 18. N | Lithuania | 0.1305 | 18. O | Italy | −13.0 |
| 19. N | Lithuania | 0.0889 | 19. N | Romania | 0.1290 | 19. N | Latvia | −17.4 |
| 20. O | France | 0.0845 | 20. N | Bulgaria | 0.0852 | 20. O | Denmark | −19.7 |
| 21. N | Czechia | 0.0709 | 21. N | Latvia | 0.0791 | 21. O | Greece | −20.4 |
| 22. N | Bulgaria | 0.0688 | 22. N | Malta | 0.0655 | 22. N | Estonia | −28.3 |
| 23. N | Romania | 0.0657 | 23. N | Slovakia | 0.0599 | 23. O | Finland | −29.3 |
| 24. N | Slovakia | 0.0575 | 24. N | Cyprus | 0.0573 | 24. N | Malta | −30.6 |
| 25. N | Cyprus | 0.0225 | 25. N | Estonia | 0.0552 | 25. N | Hungary | −37.0 |
| 26. N | Malta | 0.0205 | 26. N | Czechia | 0.0505 | 26. N | Croatia | −48.1 |
| 27. N | Hungary | 0.0143 | 27. N | Hungary | 0.0168 | 27. N | Lithuania | −249.3 |
| 28. N | Poland | 0.0000 | 28. N | Poland | 0.0000 | 28. O | Luxembourg | −308.1 |
| Share of Renewable Sources (in %) | ||||||||
|---|---|---|---|---|---|---|---|---|
| A. Electricity Production * | B. Electricity Consumption ** | C. Energy Consumption *** | ||||||
| 1. O | Luxembourg | 85.9 | 1. O | Austria | 87.5 | 1. O | Sweden | 56.4 |
| 2. N | Lithuania | 81.9 | 2. O | Sweden | 77.7 | 2. O | Finland | 43.1 |
| 3. O | Denmark | 78.2 | 3. O | Denmark | 71.2 | 3. N | Latvia | 41.0 |
| 4. O | Austria | 77.8 | 4. O | Portugal | 59.1 | 4. O | Denmark | 37.2 |
| 5. N | Croatia | 66.2 | 5. N | Croatia | 51.0 | 5. O | Austria | 33.6 |
| 6. O | Sweden | 58.7 | 6. N | Romania | 50.5 | 6. N | Estonia | 31.9 |
| 7. O | Portugal | 54.2 | 7. O | Germany | 48.6 | 7. O | Portugal | 30.6 |
| 8. N | Latvia | 49.6 | 8. N | Latvia | 48.0 | 8. N | Croatia | 28.5 |
| 9. O | Finland | 46.6 | 9. O | Spain | 42.6 | 9. N | Lithuania | 25.5 |
| 10. N | Romania | 42.0 | 10. O | Ireland | 42.1 | 10. N | Romania | 24.3 |
| 11. O | Germany | 40.9 | 11. O | United Kingdom | 40.5 | 11. N | Slovenia | 22.0 |
| 12. O | Italy | 40.1 | 12. O | Italy | 39.0 | 12. N | Bulgaria | 21.6 |
| 13. O | Ireland | 38.9 | 13. O | Finland | 38.4 | 13. O | Greece | 19.7 |
| 14. O | United Kingdom | 37.8 | 14. N | Slovenia | 38.1 | 14. O | Spain | 18.4 |
| 15. O | Spain | 37.8 | 15. O | Greece | 31.2 | 15. O | Italy | 18.2 |
| 16. O | Greece | 33.2 | 16. N | Estonia | 27.5 | 16. O | Germany | 17.4 |
| 17. N | Slovenia | 32.6 | 17. N | Lithuania | 26.9 | 17. O | France | 17.2 |
| 18. N | Estonia | 28.1 | 18. O | France | 26.7 | 18. N | Slovakia | 16.9 |
| 19. N | Slovakia | 24.2 | 19. N | Slovakia | 26.4 | 19. N | Czechia | 16.2 |
| 20. O | Belgium | 21.9 | 20. O | Luxembourg | 25.6 | 20. N | Cyprus | 13.8 |
| 21. O | France | 20.7 | 21. N | Bulgaria | 25.2 | 21. N | Hungary | 12.6 |
| 22. O | Netherlands | 18.9 | 22. O | Belgium | 24.4 | 22. O | United Kingdom | 12.3 |
| 23. N | Bulgaria | 18.0 | 23. O | Netherlands | 19.7 | 23. N | Poland | 12.2 |
| 24. N | Poland | 16.0 | 24. N | Czechia | 18.7 | 24. O | Ireland | 12.0 |
| 25. N | Hungary | 13.8 | 25. N | Poland | 17.2 | 25. O | Belgium | 9.9 |
| 26. N | Czechia | 12.9 | 26. N | Hungary | 11.3 | 26. O | Netherlands | 8.8 |
| 27. N | Malta | 10.5 | 27. N | Cyprus | 10.9 | 27. N | Malta | 8.5 |
| 28. N | Cyprus | 10.0 | 28. N | Malta | 8.7 | 28. O | Luxembourg | 7.0 |
| Variables | Variables Description |
|---|---|
| Y1jt | Share of electricity production from RES in total electricity production (in %) |
| Y2jt | Electricity production from water per capita (in GWh) |
| Y3jt | Electricity production from wind per capita (in GWh) |
| Y4jt | Electricity production from solar per capita (in GWh) |
| Y5jt | Electricity production from biogas per capita (in GWh) |
| Explanatory Variables | |
| X1jt | GDP per capita |
| X2jt | Public spending by countries on energy as a percentage of GDP |
| vjt | The random error in the object j, in the time period t, which consists of the following components: et—impulses affecting all observations in the time period t; uj—impulses affecting all the observations in the object j; εjt—impulses affecting only observations in the object j, in the time period t. |
| Test | Hypotheses | Model | Test Statistics | p Value | Decision * |
|---|---|---|---|---|---|
| The Wald’s test | H1: the homogeneous model constant terms, independent of the item and time (OLS estimator) H2: the heterogeneous terms for individual items, but constant over time (FE estimator) | Y1 | F1 = 85.3686 | p ≈ 0.00 | Rejection of H1 |
| Y2 | F2 = 777.714 | p ≈ 0.00 | Rejection of H1 | ||
| Y3 | F3 = 52.1408 | p ≈ 0.00 | Rejection of H1 | ||
| Y4 | F4 = 14.4418 | p ≈ 0.00 | Rejection of H1 | ||
| Y5 | F5 = 258.451 | p ≈ 0.00 | Rejection of H1 | ||
| The Breusch–Pagan’s test | H3: the variance of the random component of individual effects insignificantly differs from zero (OLS estimator) H4: the variance of the random component of individual effects significantly differs from zero (RE estimator) | Y1 | LM1 = 2062.31 | p ≈ 0.00 | Rejection of H3 |
| Y2 | LM2 = 3174.36 | p ≈ 0.00 | Rejection of H3 | ||
| Y3 | LM3 = 1514.2 | p ≈ 0.00 | Rejection of H3 | ||
| Y4 | LM4 = 437.889 | p ≈ 0.00 | Rejection of H3 | ||
| Y5 | LM5 = 2832.37 | p ≈ 0.00 | Rejection of H3 | ||
| The Hausman’s test | H5: both FE and RE estimators are unbiased (RE estimator is more effective) H6: FE estimator is unbiased but RE estimator is biased (FE estimator) | Y1 | χ21 = 24.5178 | p ≈ 0.000 | Rejection of H3 |
| Y2 | χ22 = 2.83383 | p ≈ 0.24246 | No grounds for rejection of H5 | ||
| Y3 | χ23 = 35.5537 | p ≈ 0.000 | Rejection of H5 | ||
| Y4 | χ24 = 39.4448 | p ≈ 0.000 | Rejection of H5 | ||
| Y5 | χ25 = 2.96674 | p ≈ 0.22687 | No grounds for rejection of H5 |
| Dependent Variable Y1, Share of Electricity Production from RES in Total Electricity Production (%) (WLS) | |||||
| Independent variables | Coefficient | St. Error | t-ratio | p-value | Significance a |
| Constant | 10.6331 | 1.18383 | 8.982 | <0.0001 | *** |
| X1jt | 0.000486 | 0.000042 | 11.68 | <0.0001 | *** |
| X2jt | 10.7911 | 0.177197 | 6.090 | <0.0001 | *** |
| Observations | 448 | ||||
| Standard error residuals | 0.977433 | ||||
| R2 | 0.265472 | ||||
| F(2, 445) = 80.41575 | p-value for test F < 0.00001 | ||||
| Dependent Variable Y2, Electricity Production from Water per Capita (in GWh) (Model REM) | |||||
| Independent variables | Coefficient | St. Error | t-ratio | p-value | Significance a |
| Constant | 0.00103611 | 0.000302482 | 3.425 | 0.0006 | *** |
| X1jt | −0.00000000001099 | 0.00000000243479 | −0.004512 | 0.9964 | |
| X2jt | 0.0000931543 | 0.0000502918 | 1.852 | 0.0640 | * |
| Observations | 448 | ||||
| Standard error residuals | 0.001577 | ||||
| Dependent Variable Y3, Electricity Production from Wind per Capita (in GWh) (WLS) | |||||
| Independent variables | Coefficient | St. Error | t-ratio | p-value | Significance a |
| Constant | 0.00001506 | 0.0000166 | 0.9074 | 0.3647 | |
| X1jt | 0.00000001029 | 0.00000000079 | 12.95 | <0.0001 | *** |
| X2jt | −0.0000147311 | 0.0000212765 | −0.6924 | 0.4891 | |
| Observations | 448 | ||||
| Standard error residuals | 0.942170 | ||||
| R2 | 0.279467 | ||||
| F(2, 445) =86.29923 | p-value for test F <0.00001 | ||||
| Dependent Variable Y4, Electricity Production from Solar per Capita (in GWh) (WLS) | |||||
| Independent variables | Coefficient | St. Error | t-ratio | p-value | Significance a |
| Constant | −0.0000115383 | 0.00000506263 | −2.279 | 0.0231 | ** |
| X1jt | 0.000000001475 | 0.000000000176 | 8.373 | <0.0001 | *** |
| X2jt | 0.000103074 | 0.00000962641 | 10.71 | <0.0001 | *** |
| Observations | 448 | ||||
| Standard error residuals | 0.947601 | ||||
| R2 | 0.272744 | ||||
| F(2, 445) =83.44460 | p-value for test F <0.00001 | ||||
| Dependent Variable Y5, Electricity Production from Biogas per Capita (in GWh) (Model REM) | |||||
| Independent variables | Coefficient | St. Error | t-ratio | p-value | Significance a |
| Constant | −0.0000707669 | 0.0000780464 | −0.9067 | 0.3646 | |
| X1jt | 0.000000011876 | 0.00000000104695 | 11.34 | <0.0001 | *** |
| X2jt | 0.000169734 | 0.0000220063 | 7.713 | <0.0001 | *** |
| Observations | 448 | ||||
| Standard error residuals | 0.000399 | ||||
Publisher’s Note: MDPI stays neutral with regard to jurisdictional claims in published maps and institutional affiliations. |
© 2021 by the authors. Licensee MDPI, Basel, Switzerland. This article is an open access article distributed under the terms and conditions of the Creative Commons Attribution (CC BY) license (https://creativecommons.org/licenses/by/4.0/).
Share and Cite
Huterski, R.; Huterska, A.; Zdunek-Rosa, E.; Voss, G. Evaluation of the Level of Electricity Generation from Renewable Energy Sources in European Union Countries. Energies 2021, 14, 8150. https://doi.org/10.3390/en14238150
Huterski R, Huterska A, Zdunek-Rosa E, Voss G. Evaluation of the Level of Electricity Generation from Renewable Energy Sources in European Union Countries. Energies. 2021; 14(23):8150. https://doi.org/10.3390/en14238150
Chicago/Turabian StyleHuterski, Robert, Agnieszka Huterska, Ewa Zdunek-Rosa, and Grażyna Voss. 2021. "Evaluation of the Level of Electricity Generation from Renewable Energy Sources in European Union Countries" Energies 14, no. 23: 8150. https://doi.org/10.3390/en14238150
APA StyleHuterski, R., Huterska, A., Zdunek-Rosa, E., & Voss, G. (2021). Evaluation of the Level of Electricity Generation from Renewable Energy Sources in European Union Countries. Energies, 14(23), 8150. https://doi.org/10.3390/en14238150