1. Introduction
The study of a vortex flow from the technical and scientific perspectives is required for investigating gas-flow movement and its effect on recirculation processes. One of the application areas of a vortex flow is that of cyclones, which are widely used in various industrial processes for cleaning the contaminated gas flows [
1,
2]. The work of traditional cyclones is based on the separation of solid particles using only centrifugal forces [
3,
4,
5]. Therefore, they do not demonstrate high gas-cleaning efficiency, particularly in the cases where gas flows are polluted with fine solid particles (about 20 µm in diameter). For cleaning nonaggressive gases polluted with fine solid particles (SPs) exceeding 1 µm in diameter, new-generation multi-channel cyclone separators are more widely used now. Their operation is based on cleaning solid particles from a contaminated gas flow when it is passed through the system of the cyclone separator’s channels found in its separation chamber, using not only the centrifugal force, but also by retaining a certain amount of solid particles in the process of filtration. This additional deposition of solid particles takes place when the peripheral gas flow and the gas flow entering the first cyclone separator’s channel join. In other channels, the filtration takes place when gas flowing from the peripheral channel and gas flowing from one channel to another (transitional) channel join. The processes of constructing and using both ordinary and multi-channel cyclone separators are not complicated.
In the study of aerodynamic parameters, which was performed experimentally in the laboratory, single-phase, two-phase, or polyphase gas flows (consisting of the air and admixtures) were investigated [
6]. In many cases, the air supplied to the cyclone separators is assumed to be relatively clean if a polluted air flow is not additionally simulated. The studies of the dynamics of the particular phases [
7] demonstrate the advantages of numerical simulation [
8]. The results obtained in this work could help to improve the operation of the device, though the dynamics of flows is a complicated subject, requiring the study of the vortex dynamics and the circular zones of a reverse flow [
9]. In the case of a multiphase flow, the development of the model is particularly complicated [
10,
11].
The specific features of a great number of the flows’ fields have not been described yet in the theories of the closed vortex flow [
12]. The problem associated with the mathematical modeling of the detailed flow’s structure involves the solution of the closely connected linear and nonlinear partial differential equations of mass and impulse and does not have an analytical solution [
13]. Moreover, the estimation of turbulence based on the assumption of isotropy (e.g., the hypothesis of eddy viscosity) can hardly be applied to rapidly changing flows [
14,
15].
The specific feature of a multi-channel cyclone separator’s structure is that its symmetrical curved elements make channels for the continuous movement of the gas flows from the inflow opening to the central axis. The smoke flue of the vertical gas outflow is located near the cover of the separating chamber. In addition to the movement of a gas flow from the inflow opening to the outflow, the distribution of gas flows to the peripheral and transit flows takes place in the area at the beginning of each new channel. The previous research helped to determine the optimal geometry of the curved elements. Therefore, the elements in the form of a quarter of a circle, with the opening made by the incompletely cut-out plate raised above the curved element’s surface to make a 5° angle with the element’s surface, were chosen for investigation. The additional recirculation of the gas flows was performed through the considered opening. This process makes the development of the numerical model, as well as the computational mesh and the calculations, even more complicated.
Vaitiekūnas (2011) has offered the time-averaged Navier and Stokes equations of gas phases associated with the anisotropic turbulence model and k-ε (epsilon) model, as well as a number of algebraic stress equations. This innovative work was followed by a number of turbulence studies for more accurate determination of rate and pressure in modifying turbulence models. All these studies deal with the axial symmetry, allowing the authors to use a two-dimensional model, with the assumption that a solid phase does not fall on the gas field.
Braz (2004) has made the calculations of the industrial cyclone separator’s flow (CFD). Since the three-dimensional vortex flows found in the cyclone separator are highly complicated, the process of the separation of solid particles from a gas flow in the cyclone separator has not been properly explained yet, though the movement of the flow of the suspension of gas and solid particles in cyclone separators has been an object of theoretical and practical research in the experimental cyclone separators for a long time [
16]. To investigate the flow‘s structure, various methods of measurement are often used. However, the drawbacks of these methods do not allow the researchers to fully realize a complicated nature of the flow [
17].
The automatic selection function is often used for the computational mesh development and the selection of the viscosity model and its variables [
18]. It is assumed that without describing the details of the computational mesh and modeling results’ convergence, the results obtained by using a numerical model would not correlate with the data obtained by using a physical model. In the absence of sensitivity analysis of the viscosity model’s variables, high accuracy could hardly be achieved and the specific processes presented by the model could hardly be defined.
A structure of a multi-channel cyclone is fundamentally different from the conventional one. The multi-channel cyclone is a new-generation design of widely used air pollution control device. The separation principle of particulate matter is fundamentally different. A physical model of multi-channel cyclone and its claims were presented in the specification of its European patent [
19]. The cylindrical multi-channel cyclone filter comprises internal quarter-rings with adjusted spacing at the ends (
Figure 1, 1), openings cut in quarter-rings with their plates bent outwards at an angle of 5 ÷ 15° in the direction of the movement of dusty air (
Figure 1, 5). At the end of the cyclone casing a conical hopper is arranged. The operating principle of the cylindrical multi-channel cyclone filter is based on the biphasic air flow, i.e., the air contaminated with particulate matter moves tangentially to all channels of the device where particulates are removed from the airflow under the action of centrifugal forces and filtration processes taking place in all channels (
Figure 1, 10). The inner design of the device can be optimized by changing the flow distribution ratios before each channel of the cyclone. The main flow is divided into two flows—peripheral (to the previous channel) (
Figure 1, 8) and transitional (towards the next channel) (
Figure 1, 9).
Under the influence of centrifugal forces, rather large particulate matter (particles of 20 µm and bigger) is separated, and the process of filtration separates fine and ultra-fine particles of less than 20 µm and even those that are 1 ÷ 10 µm in diameter. The design of the device, depending on the required volume of cleaning air, can consist of several cyclones installed in a single casing one above the other and interconnected to a common tangential air inlet and to a central air outlet.
The present work is aimed at studying the applicability of various viscosity models and their modified versions to simulate single-phase flow aerodynamic processes in a primary design multi-channel cyclone separator with a single inflow and symmetrical channels, using the computational fluid dynamics. The main purpose of this study is to provide information on how the new design of the multi-channel cyclone affects the distribution of gas flow in the cyclone’s channels. Also, the ability of the models to capture the significant phenomenon in a not-conventional cyclone will be the main focus. The research results obtained in the numerical simulation are compared to the experimental results obtained by using a physical model. This research is a part of multi-channel studies. The second part of the research was presented in publication [
20].
2. Materials and Methods
The numerical simulation was used for determining the aerodynamic parameters of a new-generation gas-treatment device with a single inflow opening and the specific distribution of the rate and pressure of the gas flows and their paths in the cyclone separator’s symmetrical channels. The design of the cleaning system’s model was obtained in the CAD graphical editor program for producing flat and three-dimensional elements. The parameters of the model were chosen to match the parameters of the multi-channel cyclone separator on the experimental stand.
The investigation and analysis of a single-phase gas flow in the device were made using the ANSYS Fluent. The studies of other researchers are mainly centered on the investigation of a single viscosity model, which is usually obtained by using the function of the automatic selection of parameters. To avoid this problem, the authors of this paper have chosen various widely used viscosity models according to their variables, while in sensitivity analysis the modified versions of the model were used.
The performed calculations involved the study of the most widely used viscosity models. Since the experimental studies and theoretical mathematical calculations have revealed that fluidity is of a turbulent nature, the laminar fluidity model was not used. The solution models, using the variables of two equations, i.e.,
k-ε and
k-ω (omega), were selected for the study. Their standard forms and modifications were investigated. They included
k-ω SST,
k-ω BSL, as well as low-Re corrections,
k-ε RNG and
k-ε Realizable and Enhanced Wall Treatment. A single-phase air flow with the density of 1.225 and viscosity of 1.789·10
−5 kg/m·s was studied.
SST k-
ω was determined as optimal, and its detailed description of numerical scheme is presented hereinafter. Model constants were equal to:
= 1; α
inf = 0.52;
= 0.09; a
1 = 0.31; β
i (inner) = 0.075; β
i (outer) = 0.0828; TKE (inner) Prandtl # = 1.176; TKE (outer) Prandtl # = 1; SDR (inner) Prandtl # = 2; SDR (outer) Prandtl # = 1.168; production limiter clip factor = 10. The material of the solid object was chosen as stainless steel: density—8030 kg/m
3. Boundary conditions were used for one inlet and one outlet. An alternative viscosity model to the first was
k-
ε RNG Enhanced wall treatment. A detailed description of the numerical scheme is presented hereinafter. Model constants were equal to: C
µ = 0.0845; C
1-ε = 1.42; C
2-ε = 1.68. Material and boundary conditions were the same as
SST k-
ω model. According to the initial conditions, the inflow rate of the flow in the device was 12.5 m/s, while the drop of pressure was not increased during the gas outflow. The parameters of turbulence were accepted according to the settings of the model as follows: turbulence intensity was equal to 5%, while the turbulent viscosity ratio was 10 [
21,
22,
23]. The first- and second-order discretization equations were used in each experiment using the coupled type by the pressure–velocity coupling scheme. Optimal relaxation coefficients lead to residuals equal to 10
−4. Solution controls were chosen for
SST k-
ω model: flow courant number—20; explicit relaxation factors for momentum and pressure were equal to 0.1 and 0.3 respectively. Under-relaxation factors were used: density—1; body forces—1; turbulent kinetic energy—0.5; specific dissipation rate—0.5; turbulent viscosity—1. Solution controls were chosen for the
k-
ε RNG enhanced wall treatment model: flow courant number—20; explicit relaxation factors for momentum and pressure were equal to 0.1 and 0.3 respectively. Under-relaxation factors were used: density—1; body forces—1; turbulent kinetic energy—0.8; turbulent dissipation rate—0.8; turbulent viscosity—1.
In making the calculations, several viscosity models were found, which yielded the smallest residuals, while the curves obtained in the calculation process for each variable were uniformly lowering (without any considerable fluctuations or other calculation errors). The major models are the turbulent viscosity models, including
k-
ω and
k-
ε, and their modifications
k-ε and
k-ε RNG (renormalization group) (the improved model of turbulent kinetic energy and the model of kinetic energy dissipation rate), as well as
k-
ω SST (the model of the relative dissipation rate of turbulent kinetic energy) [
24]. Based on the
k-
ε model, the system of two nonlinear diffusion equations (Equations (1) and (2)) of turbulent kinetic energy density (K
p) and dissipation rate of kinetic energy (
ε) are expressed as follows:
here:
ρ is the phase density, kg/m
3;
dEk/
dt is time variation of turbulence kinetic energy, J/s;
ε1 is the dissipation coefficient;
GS is the coefficient of the varying turbulence;
GB is the coefficient of gravitation turbulence;
υT is turbulent kinematic viscosity, m
2/s;
Prk is the Prandtl number for the case of the turbulent kinetic energy;
is the Laplacian operator;
ε is the dissipation rate of kinetic energy;
cε3 is uniform turbulence coefficient under sudden compression;
cε2 is the flow turbulence suppression coefficient;
cε1 is the variation coefficient of the turbulent flow in the wall;
cε0 is the gravitational mixing coefficient of fluid; and
Prε is Prandtl number for the particular conditions of kinetic energy dissipation.
The standard models of
k-ε (Equations (3) and (4)) and
k-ε RNG (Equations (5) and (6)) are expressed as partial derivatives [
25] as follows:
here:
Gk is the variation of turbulent kinetic energy (TKE) due to the internal rate gradient, which according to Businesko’s hypothesis, is equal to
;
µt is turbulent dynamic viscosity;
S is the deformation tensor;
Gb is the variation of TKE due to the average flow rate gradient, which is equal to
; β is the temperature expansion coefficient;
Prt is the Prandtl number of energy turbulence;
gi is the gravitation vector in direction
I;
YM is fluid rate distribution due to space movement under turbulent compression, which is equal to
;
Mt is the turbulence Mach number, a coefficient;
C1ε,
C2ε, and
C3ε are the constants;
σε and
σk denote the Prandtl number for
ε and
k variables;
Sε and
Sk are the users chosen.
Opposite to the case of using the k-ε model, wall functions are not evaluated in the enhanced version and the model is used for the whole area of the flow. In applying the viscosity model, a more detailed computational mesh is required not only for the wall, but also for the whole area, where the flow is characterized by the decreasing turbulence (small Re number). The alternative solution could be the choice of an automatic model for the wall and consequent detailing of the computational mesh in these zones. Sometimes, using of the standard k-ε model is sufficient to obtain small errors in calculations. By using the improved model, more accurate simulation results referring to separation of a flow and the interaction between various gas flows are obtained. By using the model k-ω, the two nonlinear diffusion equations, which describe the relative rate of dissipation of turbulent kinetic energy and this energy made of the equations for the shear stress transport and turbulent viscosity, is solved. This model is commonly used for low Reynolds numbers and when the degree of separation from the wall is small. Another modification of k-ω and k-ε model, i.e., standard, GEKO, BSL, and standard and realizable, respectively, were tested using different near-wall treatments, but the solution was not converged.
The standard
k-ω model (Equations (7) and (8)) and the model of shear stress transport (
k-ω SST) (Equations (7) and (9)) are expressed in terms of partial derivatives [
26] as follows:
here:
Gk is the variation of turbulent kinetic energy (TKE) caused by the average flow rate gradient;
Gω is the variable obtained due to the variation of
ω; Γ
k and Γ
ω are effective diffusion variables,
k and
ω, respectively, where
and
;
Yk and
Yω are dissipation variables
k and
ω associated with turbulence;
Sk and
Sω are the variables specified by the users;
Dω is the diffusion variable equal to
and
F1 is the function of the fluid mixing.
Menter (2009) has found that the turbulence viscosity model k-ω SST is more accurate and reliable than the standard and other SST models for investigating a wider class of fluid flows (especially, in the case, when the inverse pressure gradient flows, aerodynamic surfaces, and sudden shock waves are present).
To achieve high accuracy and reliability of a numerical model, a detailed and representative computational mesh should be used. For this purpose, three meshes of a multi-channel cyclone separator with a single gas inflow opening were formed in the
ANSYS CFD Fluent software (
Figure 2).
A computational mesh consists of cells with 20-mm long ribs for a high level, 25-mm—for average, and 30-mm—for a low level of detailing, while the elements are spaced at a distance of 50 mm for each case. A defeature size is 0.025 mm, and the curvature minimum size is 0.05 mm. The height of the first layer is 0.1 mm. In the boundary zone, the mesh has eight layers. A growth rate is 1.1. A collision avoidance was selected as stair stepping, when the gap factor is 0.8 and the maximum height over the base is 0.2 mm. The value of the y+ in the first cell next to the solid boundary was 0.34 for all three meshes. It was used a standard solution initialization. The mesh with a low detailing level is made of 7,760,225 elements, while the mesh with an average detailing level has 8,880,597 elements, and the mesh with a high level of detailing consists of 9,917,267 elements. The research [
27] for a periodic channel segment showed that grids of the same quality provide the same accuracy of results in the numerical model. Another study [
28] presents the model of the trapezoidal channel. The authors analyzed the impact of the height of ribs of the same turbulence model on inducing secondary flow, and showed that the results are not suitable.
The length of the multi-channel cyclone separator’s model in various directions of the axis is as follows: x is 662 mm, y is 251 mm, and z is 740 mm (
Figure 2). The main geometrical parameters for the cyclone were presented in research [
29].
3. Results
The numerical simulation aimed to investigate the developed model of a new design device with a single inlet opening by using various improved viscosity models of the software package. For this purpose, three computational meshes with different levels of detailed elaboration were developed for studying a multi-channel cyclone separator. The determining of the optimal viscosity models and their combination for the investigated multi-channel cyclone separator was based on using a method of the smallest number of errors obtained in calculating the model’s variables.
The case presenting the data most closely matching the experimental research results and having the smallest number of errors obtained in the model’s variables was chosen as an optimal version for studying the processes of the gas flow movement in the multi-channel cyclone separator’s model. The average-detailing level grid was chosen as optimal for this study. This case was identified as the most suitable, additional comparisons being drawn with research on particles and air flow dynamics [
30,
31].
Additionally, a dependence of the overall pressure losses on the grid size was analyzed (
Table 1). The overall pressure losses calculated by the difference of static pressure in the inlet and outlet. It was verified that the obtained total pressure losses did not differ by more than 3.4 Pa using different detailing grids. The maximum deviation from the value of the experimental studies was up to 1.14% when a high-detail grid was applied. Differences between overall pressure losses are not significant, so it can be assumed in this case that this parameter is no more dependent on the grid size for the optimal average detailing level mesh.
To choose the optimal viscosity model, the distribution of the gas flow rate in the area where the first cyclone separator’s channel begins (
Figure 3) was studied. In using the numerical modeling of the gas flow rate distribution, the variation of values was studied based on 15 points. The overall channel’s height was divided into five sections and its width was divided into three sections, while the values were recorded at the intersections of the lines.
The results obtained were graphically presented based on the calculations made using the ANSYS 16.1 Fluent. In
Figure 3, wall layers can be observed by the peripheral wall (
Figure 3e) and near the external surface of the element in the form of the quarter of a circle (
Figure 3f), where the gas flow is completely stopped. At the same time, maximum gas flow rates, reaching 13.6–16 m/s, can be observed near the internal surface of the curved element (
Figure 3g), which is behind the wall layer.
One of the most important factors associated with the gas movement, which strongly influences the deposition of solid particles refers to the gas flow distribution through the cracks at the bottom. As can be observed, the flows were similar in all cases. However, using a moderately detailed mesh as shown in
Figure 3c, the thickest wall layer was detected both across the separation chamber’s bottom and in the crack in the spaces between the joint of the separation chamber and the hopper and the bottom rib. In the latter case, the highest rates were found only within that space and reached 12.0–12.8 m/s, while near the wall, they did not exceed 2.4 m/s (
Figure 3h). However, in the case presented in
Figure 3b, a not-clearly-noticeable wall layer was found near the joint of the separation camera and the hopper, while the gas rates in the whole zone (from the wall to the middle of the gap) were considerably larger, and reached 4.8–13.6 m/s.
Using the computational mesh with the highest degree of detailed elaboration (
Figure 3d), the gas flow rate distribution similar to that shown in
Figure 3b was obtained. The areas of the wall layers with the negligible gas flow rates could not be accurately defined near the ribs of the separation chamber’s bottom either. Therefore, in the case presented in
Figure 3d, the distribution of the gas flow rates over the separation chamber’s bottom is similar to the rate values found for vertical zones. It allows for assuming that the turbulence of the gas flow in the case presented in
Figure 3d is the lowest, compared to that given in
Figure 3b,c.
The distribution of gas flow rate was poorly predicted at the bottom using the k-ε turbulent viscosity model. In the latter case, the separation chamber, the area where the gas flow goes through the cracks to the hopper and the hopper itself are like separated zones. It is assumed that this viscosity model is not suitable for that small space and low flow rate zone. Hence, the gas flow rates in the whole zone were considerably much larger, and reached 8.6–15.2 m/s.
The modeling and experimental research [
29] allowed the researchers to determine the gas flow rate distribution in channel 4. The highest errors made in modeling are found at the last points, which are considered [
28]. For this purpose, the rates of the gas flows obtained in the experimental research and modeling have been analyzed and the results of their comparative analysis are presented (
Figure 4).
The specific design of a multi-channel cyclone causes peripheral and transitional flows to meet at the inflow into the new channel. These flows create air turbulence at the beginning of each channel and additional errors of numerical model. In these zones, multiple studies to obtain the precise values of the airflow parameters (including the airflow velocity) were performed. The experimental research had shown that the rate of channel 4 was by 12–15% higher than that obtained in modeling, when computational meshes of minimally and maximally detailed elaboration were used. However, in the case of using moderately detailed meshes, the rate value differed only by 0.15%. At the midpoint of the channel, the above values varied slightly (from 5.42 to 5.60 m/s) in all three cases when computational meshes of various detailed elaboration were used. The closest value remained only in the case when the mesh of moderately detailed elaboration was used. In that case, the experimentally determined gas flow rate was by 14.9% higher and reached 6.5 m/s.
At the end of channel 4, the situation was similar to that at the midpoint of the channel, when the highest air flow rate was found experimentally and reached 6.9 m/s. The rate values obtained by using the numerical simulation were lower and ranged from 16.6 to 21 %, while the average value was equal to 5.6 m/s. It can be assumed that the difference between the considered cases referring to the area at the beginning of the channel was insignificant, with the average relative error reaching 8.9%. However, the gas flow rate values obtained by modeling for the area at the end of the channel differed to some extent, while the average error reached 19.5%. It should also be noted that the considered gas flow rate values differed by only 5.2% from each other in the area at the end of the channel. Therefore, it is assumed that the value of the physical model is considered as the true value against which the value of the numerical model is compared. According to the physical model, MESH 2 was assumed to best meet these parameters and was accepted as the primary case.
The rate values obtained by using k-ε model were less accurate and the average error reached 24–28%. The distribution of the data shows that the difference between the experimentally obtained air flow rate values and the data obtained by using the numerical simulation increases when the points which are most distant from the reference point are considered.
The comparative analysis of all gas flow rate values obtained for channel 1 of the cyclone separator allows the authors to conclude that the slightest difference can be observed (when the experimental results are compared) in the case of using a computational mesh of moderately detailed elaboration with the relative average error of 0.98% (an absolute error is 10.21%), while the errors in the cases of using meshes with low and high degrees of detailed elaboration reach 6.38 and 6.12%, respectively. It can be concluded that the results obtained in all the cases are similar, while the trends of the variation in values differ at the particular points of the channel, which does not, however, allow for excluding any cases for their inaccuracy. Therefore, all the cases may be considered to be representative. Based on the numerical simulation data, the conclusion was made that in the case of using k-ε Enhanced Wall Treatment viscosity model, the smallest residuals were obtained only when the least detailed computational mesh was used. However, k-ω SST was optimal in the cases when moderately and highly detailed computational meshes were used. This viscosity model, along with a moderately detailed computational mesh, yielded the smallest errors compared to those of the experimental results.
A solution using the k-ε viscosity model was complicated by high fluctuation of residuals especially at initial iterations of second order discretization. Therefore, this case was chosen as the optimal one for further analysis.
The analysis of the results obtained in the experimental research and the numerical simulation was performed, taking into account the rates of the gas flow in four cyclone-separator channels. The relative and absolute errors were calculated by using variously detailed computational meshes as follows: case 1 presents the least detailed mesh, case 2 demonstrates a moderately detailed mesh and case 3 shows the most highly detailed mesh (
Table 2).
Based on the calculated errors, it can be concluded that the rates in the areas at the beginning of the first two channels vary most slightly, depending on the ways of their determination, with their relative errors ranging from 5.16% to 11.20%. The variation in the rate values was from −10.92% to 21.01%. It should also be noted that the analysis of case 2, when the optimal computational mesh was used, demonstrates much smaller errors, while the variation in the air flow rate values in the areas at the beginning of all four channels is in the range from −2.24% to 8.89%. It can also be observed that the rate values determined by simulation for the areas at the end of all four channels with the errors in the range from 6.04% to 21.49% are smaller than the experimentally obtained values.
The relative errors of the gas flow rate values obtained using
k-
ε viscosity model were much higher compared with cases using
k-
ω, presented in
Table 2. The relative errors in the Channel 1 were—11.52–19.54, in the Channel 2—1.3–3.5% bigger. Relative errors were increased gradually from Channel 3 to Channel 4 and were approximately 6.78–10.85 bigger for all mesh cases. Thus, the average absolute error of the rate values in channels was equal to 9.67 (at the midpoint of the channel using 1 mesh case). A high discrepancy was detected in each mesh case, e.g., the error was equal to 28.6% at the beginning of the channel (Mech case 3), 26.1% at the midpoint of the channel (Mech case 3), 29.7% at the end of the channel (Mech case 3).
The calculated absolute errors, as the moduli of the values for all cyclone-separator channels, smooth out the observed differences between the experimental and numerical simulation results. It can be assumed that when only the deviation from the obtained values is taken into account, none of the determined values exceed 20%. The smallest absolute error referred to the rate values analyzed at the midpoints of the channels in case 1 and was equal to 4.11%. It was assumed that the observed distribution could result from the fact that a slightly detailed mesh could assess only a part of the elements of the internal cyclone-separator structure. The mesh of this type has a smaller amount of the calculation cells (by 1.14 and 1.28 times) than those of the moderately and highly detailed meshes. Therefore, it is assumed that some significant features of the internal geometry, which have an influence on the gas flow movement and its rate, can hardly be evaluated. However, the absolute error obtained when a moderately detailed mesh was used varied in the small range from 10.47% to 10.63%. The greatest errors, varying in the range of 14.66–19.67%, were obtained when the computational mesh presented by case 3 was used. It should be noted that the highly detailed mesh seems to have a too-large space between the widely spread computational cells. Therefore, it is assumed that, in this case, the cells hinder each other in performing calculations, which can result in the emergence of more errors in determining the rate.
The absolute error of the simulation results compared to the experimental studies using the k-ε model was larger, and the magnitude of the obtained values varied over a large range. The errors in the first channel were close to the cases using the k-ω model. In other channels, the errors were higher by more than 6.5% and the average error was 17.8%. The largest error between the results of gas flow rate calculations was obtained in the last channel, which was equal to 28.7% compared with experimental studies, which meant that this viscosity model was assigned as less accurate.
In general, the k-ε model is not very accurate when simulating flows in a region with highly arcing geometry, but the model is accurate for solution of flow around bodies of complex geometric shapes. In its outline, the k-ω model is similar to k-ε, but in the latter, the equation for the specific rate of dissipation of the kinetic energy (ω) is solved. The k-ω model has an advantage over k-ε, when modeling internal flows, flows through strongly curved channels, separated flows, and jet flows.
In this work, we also used the k-ω SST model, which is a combination of these two models: the equations of the k-ε model are used to calculate the flow in a free flow, and the equations of the k-ω model are used in the region near the walls. The accuracy of result depending on the grid density is similar, but this model is free from the drawbacks of k-ω and k-ε.
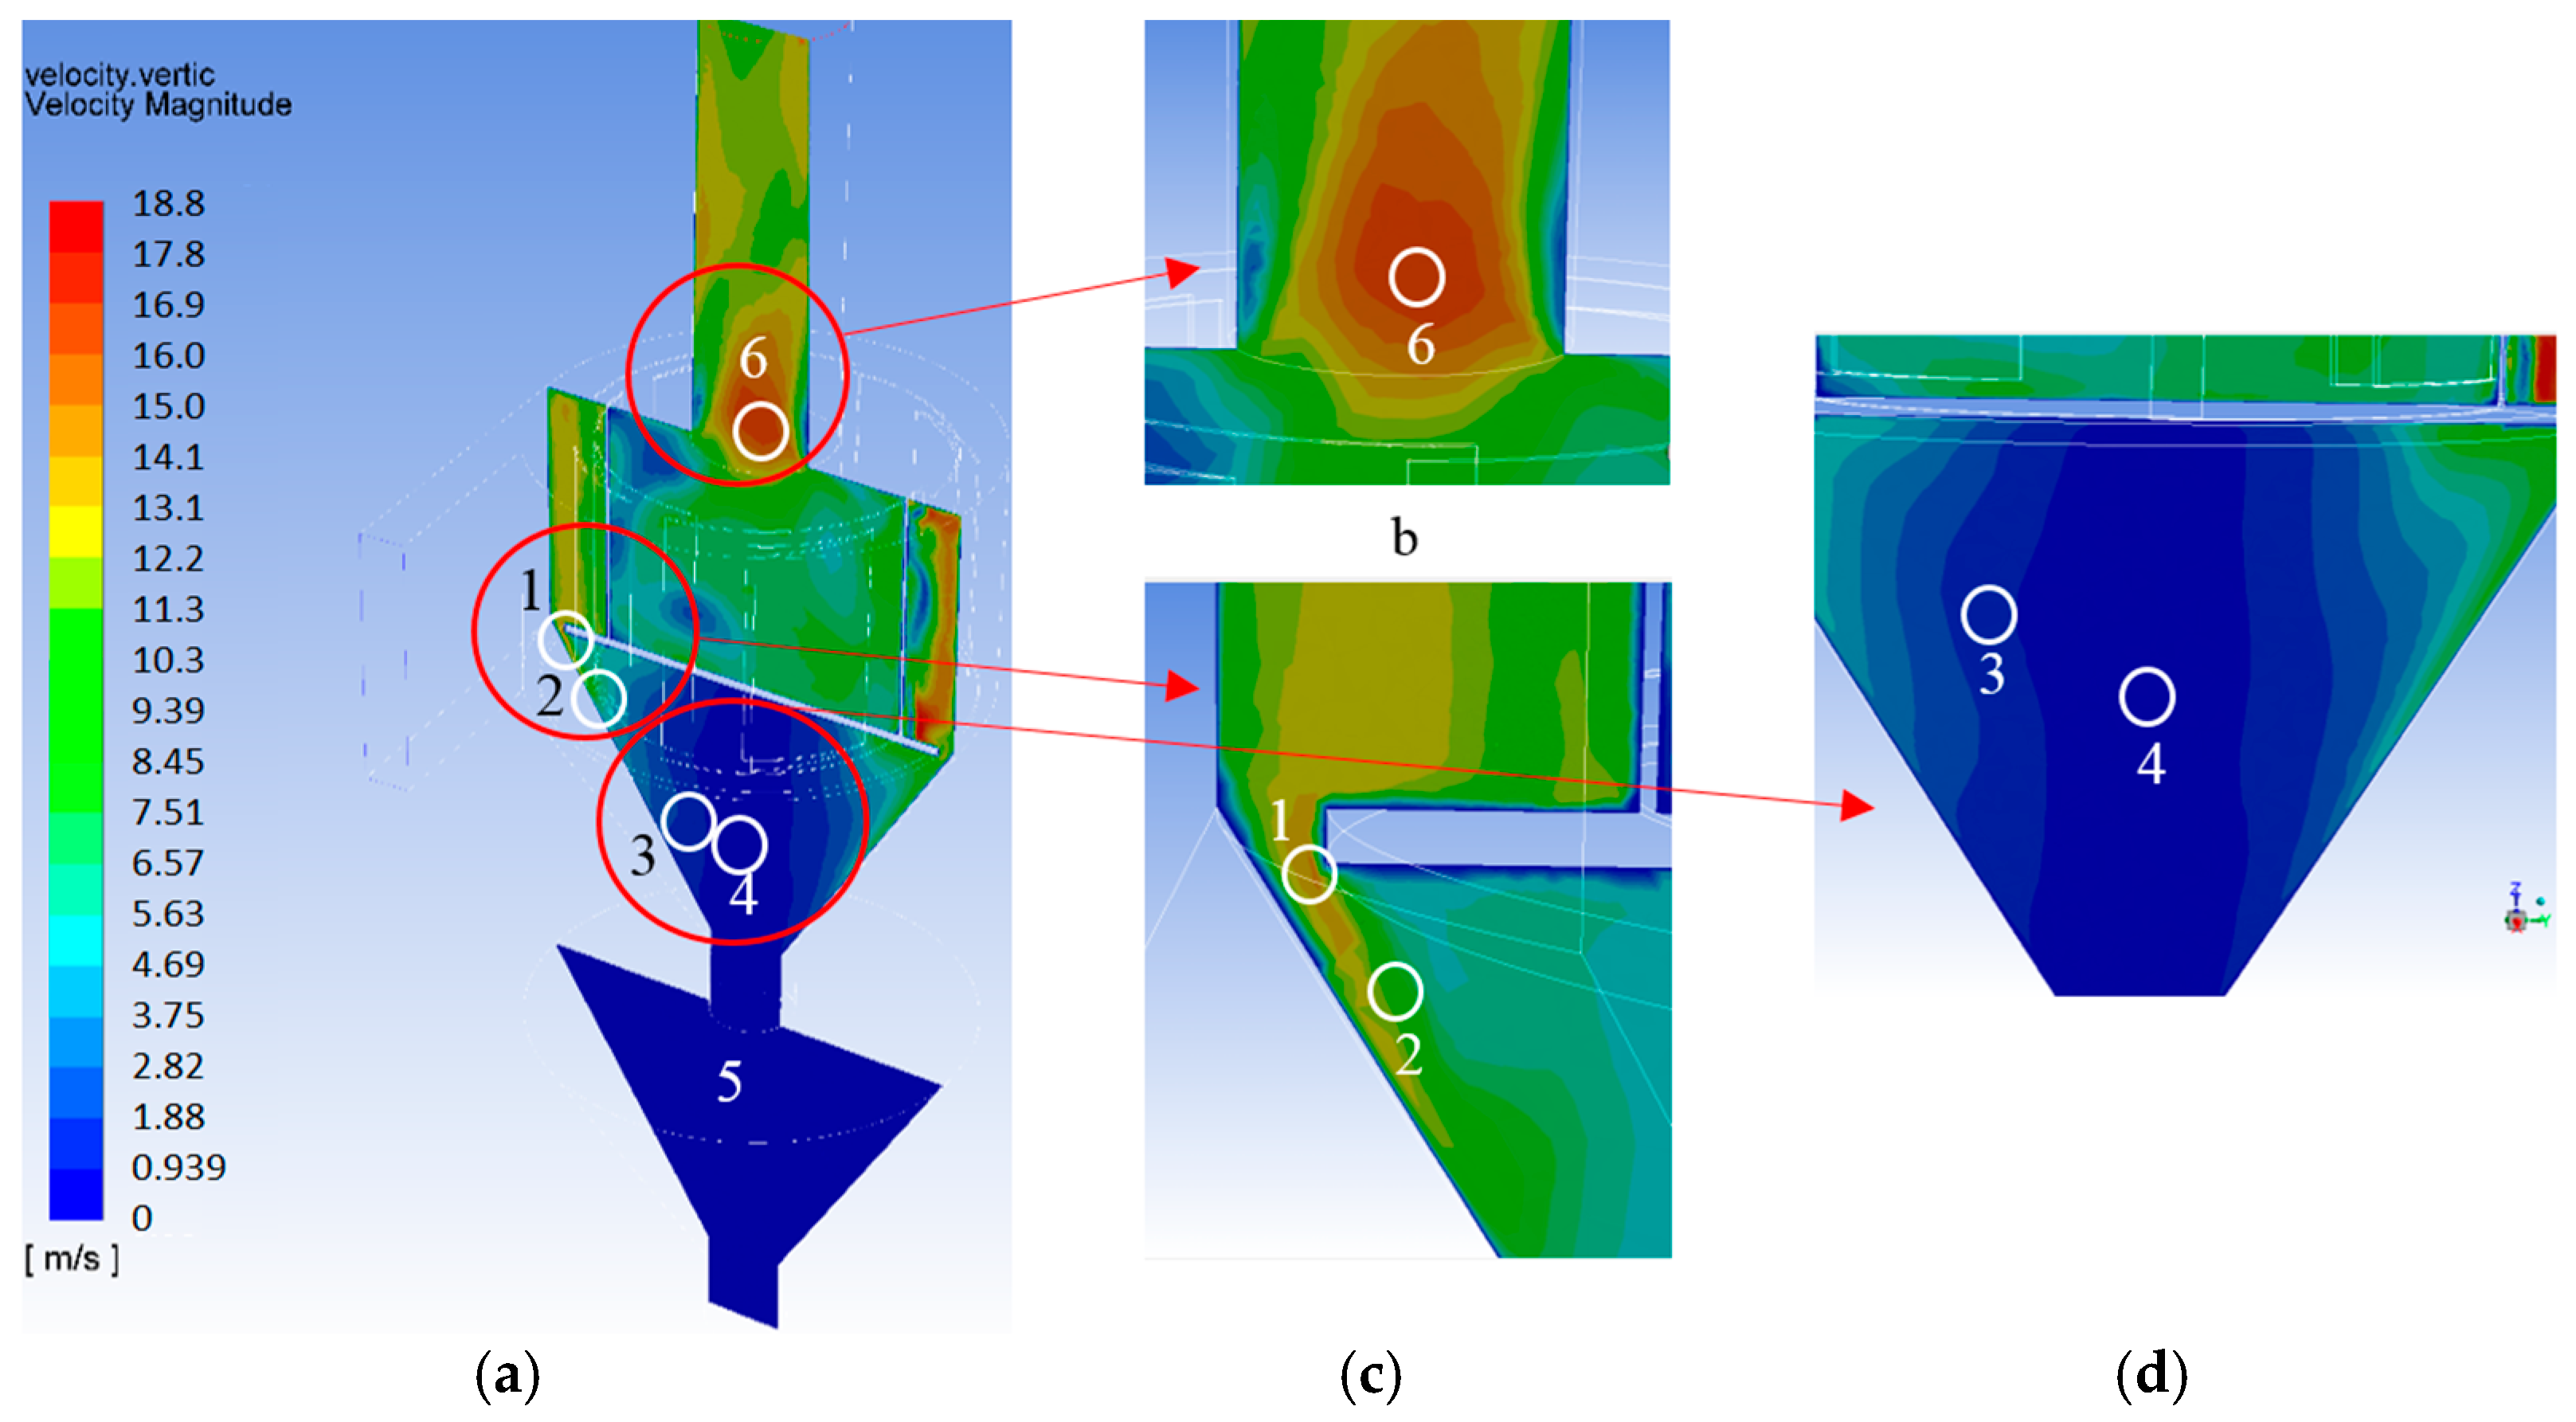
In a multi-channel cyclone separator, recurrent gas flow filtration and distribution in the channels takes place. Therefore, gas flow movement can be analyzed, taking into account its path in vertical and horizontal directions. A gas flow getting into the cyclone separator through the inlet opening moves along the channels as a transit flow and a peripheral flow. Therefore, the path of the gas flow movement changes on the horizontal plane. The gas flow that gets into channel 1 through the inlet cross-section moves to the cyclone separator’s axis and goes out through the air duct (on the axis of the separation chamber’s cover in its upper part). A gas flow moves through the cyclone separator’s channels made in the separation chamber surrounded by the curved elements from the inlet to the outlet opening, and thus the path of the gas flow changes on the vertical plane.
The numerical simulation was performed to analyze the distribution of the gas flow rates, and the front and back views of the rate distribution at various heights of the device are presented (see
Figure 5). The planes of the sections at the heights of 5, 15, and 25 cm are presented and the spectral view of the gas flow rate values is given. The obtained values show that the rate of the gas flow through the center of the inlet opening, where the rate values reach 12.4–14.5 m/s, is the highest. The lowest gas flow rate of 10.9 m/s is found at the height of 25 cm, just before the gas flows into channel 1 of the cyclone separator (point 1).
The conclusion can be made that the described distribution is formed due to the retarding of the gas flow near the wall layer, which results in the highest gas flow rate in the middle of the cross-section, and is expected to remain the highest in this case. On the other hand, the areas of the increased air flow rate can be observed around the cyclone separator’s inlet (2a and 2b), and the rate value increases when the air flow approaches the cross-section, which is 5 cm away from the bottom of the separation chamber. The gas flow moves along the separation chamber’s bottom; however, only a small proportion goes to the hoppers, which is shown in
Figure 3h and
Figure 6, point 1 of the vertical cross-sections. It is assumed that the extended external peripheral slit has a properly chosen width, which prevents speedy vortexes from getting there and causes the absorption of solid particles when a multi-channel cyclone separator is used for cleaning the dusted air flow.
In the calculated numerical model, the highest rate was found in the first and second channels (out of four external cyclone-separator channels). The gas flow rate increases more greatly at the end sections of these channels, with its values reaching 17.6–18.6 m/s (
Figure 5b, points 3a and 3b). The greatest rate value can be found on the top and the bottom of the separation chamber, while in its middle part the maximal value reaches 17.1 m/s. It can be seen in
Figure 5 that the highest gas flow rate increases only in the middle of the channel’s cross-section, while when the gas flow approaches its walls, the rate suddenly decreases to about 5 m/s. In channel 3 of the device, the value is rather uniform, varying in the range of 12.4–16.5 m/s, while at the height of 5 cm from the separation chamber’s bottom it decreases by about 20 %, i.e., the rate values vary in the range of 9.3–14.5 m/s. A noticeable decrease in the gas flow rate can be observed only in channel 4, where the rate values are equal to 6.2–10.3 m/s. Moreover, the greatest decrease in the gas flow rate can be observed at the midpoint and at the end of channel 4, in the lower cross-section found at the distance of 5 cm from the bottom, where the gas flow rate values reach only about 4.5 m/s. The conclusion was made that there were two reasons for this: (1) that the gas flow, moving along the channels of the cyclone separator, lost the greatest part of its kinetic energy due to pressure losses and local obstacles; (2) that the gas flow, moving away from the inlet and having a larger amount of the kinetic energy, suppressed the development of weak gas flows, emerging (as mentioned above) in the lower part of the separation chamber.
To describe the vertical gas flow distribution, the cross-section plane, crossing the area at the beginning of channel 1 and going through the cyclone separator’s axis, which, finally, crosses the area of the beginning of channel 3 (
Figure 6a), was chosen. Based on the obtained isolines, the gas flow rate in the cyclone separator’s hopper decreases from 6.6 m/s (
Figure 6, point 2) to 1.9 m/s (
Figure 6, point 3). The areas below the external oblong peripheral slits (
Figure 6, point 1), where gas flow rate increases to 13.1 m/s, should be mentioned. On the contrary, in the most isolated zone found on the axis of the upper cone-shaped part of the hopper (
Figure 6, point 4) and in the whole lower cone-shaped part of the hopper (point 5), the value does not exceed 0.9 m/s. The gas flow distributions are not symmetrical in the upper part of the hopper. This shows the influence of the air flowing into the cyclone separator, which causes the formation of more speedy air flows. However, they slow down the axial line of the device. The zone of the hopper where the gas flow rate is the lowest can be found at a distance of about 0.06 m from the cyclone separator’s axial line and spreads in both directions. Low gas flow rate in the cyclone separator’s hopper is important because, in this case, any solid particles that get into it cannot be carried back to the separation camera, and the efficiency of cleaning will be increased [
31,
32,
33].
The outlet of the gas flow and the air duct are located in the upper part of the separation chamber, along the central axis of the treatment device. In this particular zone, the gas flow distributions vary considerably. The area with the highest gas flow rate values, reaching 16.9 m/s, can be distinguished (
Figure 6, point 6).
The paths of a gas flow can be analyzed based on the obtained static pressure distribution (
Figure 7a). In aerodynamics, static pressure characterizes the potential energy of a gas flow, which is equal to the pressure on the walls around the considered equipment [
34,
35,
36,
37]. In the presented specter, four various zones can be distinguished. In the first zone, the inlet air duct and the area at the beginning of the channel are found (
Figure 7a, point 1). In this zone, the largest static pressure values, reaching 310–336 Pa, are presented. However, at the end of channel 1, the gas flow static pressure decreases to 256 Pa. The second zone spreads from the midpoint of channel 1 to the end of channel 4 (
Figure 7a, point 2). As can be observed at the beginning of each channel, the static pressure in this area increases by about 55 Pa (
Figure 7a, point 3). This shows that the movement of the peripheral gas flow takes place along with the continuous gas flow movement from one channel to another. The above reverse gas flow joins the moving gas flow, thus maintaining the appropriate air flow rate in all cyclone separator’s channels and helping to effectively clean a gas flow from finely dispersed solid particles. The average static pressure in this zone is equal to 242 Pa. The largest values, reaching 309.7 Pa, were found for the areas at the beginning of second channel and at the end of the fourth channel (
Figure 7a, point 4). The smallest values of the static pressure on the separation chamber’s peripheral wall, reaching 229.3 Pa (
Figure 7a, point 5), were found for the area in the middle of channel 3 of the cyclone separator. It should also be noted that one of the smallest static pressure values of 202.5 Pa (
Figure 7a, point 6) was found for the top cover of the separation chamber in channels 2 and 3 of the cyclone separator. All these values were determined in the external cyclone separator’s channels. However, in the central internal channel, the static pressure values varied insignificantly when the area of the separation chamber’s cover in the considered zone with the variation of static pressure from 122.2 to 175.8 Pa was taken into account (
Figure 7a, point 7). Therefore, this zone can be considered as zone 3. It can be observed in
Figure 7 that the values of the isolines sharply increase when they approach the ribs of the curved elements (
Figure 7a, point 1). It has been established that the variation in the gas flow’s distribution and intense turbulence of the flows take place at the distance of about 50 mm from this zone. Therefore, a conclusion can be made that in the distribution zone of the peripheral and transit static pressure varies in the range of 162–216 Pa.
In the hoppers of the considered multi-channel cyclone separator, static pressure distribution varies slightly, though it depends on the area considered. The first area is the area of the first cone-shaped part, which is at the height of 100 mm from the separation chamber’s bottom. Static pressure values in this area are similar to those of the above-mentioned zone 2 and vary from 256.1 to 282.9 Pa (
Figure 7a, point 8). Its distance from the separation chamber’s bottom reaches 150 mm and is larger compared to the area below channel 1 and channel 2. This can be accounted for by the influence of the gas, flowing through the inlet and its location with respect to other channels. The static pressure in this area does not change until the lower portion of the second (lower) cone-shaped part is reached, and its average value is equal to 242.8 Pa (
Figure 7a, point 9). The static pressure is slightly lower in the initial channels using the
k-
ε viscosity model; the mean value was 323 Pa. However, values are approximately 8% higher in the axis zone of the separation chamber and vary from 150.3 to 160.9 Pa compared with the values found using
k-
ω models.
The overall pressure losses of the device were investigated at 8–16 m/s. The pressure drop in the four-channel cyclone was 370 Pa at the case of 16 m/s. Maintaining an appropriate rate of 12 m/s in the cyclone channels, the values of the aerodynamic resistance, 1.9 times lower, compared with case at 16 m/s. The lowest resistance was 85 Pa at an air flow rate of 8 m/s.
The highest treatment efficiency from wood ash (particles size up to 20 µm) is equal to 86.9% and it was achieved at an average gas flow rate of 12 m/s in the channels. When the gas flow rate was reduced to 8 m/s, the efficiency decreased by 2.4%. The efficiency of purification is decreasing slightly at higher than 16 m/s, when the maximum was equal to 86%. Detailed experimental studies of multi-channel cyclone separators were presented in the paper [
29].
In using both
k–epsilon(
ε)
RNG, and
k–omega(
ω)
SST viscosity models, one of the major turbulent movement parameters was considered to be turbulent kinetic energy. The distribution of the values of this parameter in the developed multi-channel cyclone separator’s model is shown in
Figure 7b. It is well-known that this parameter accounts for turbulent transfer by diffusion due to the rate and pressure pulsation, as well as molecular diffusion transfer, turbulent energy conversion to heat, and the work performed by pressure. The turbulent kinetic energy of a gas flow (
k) in the model varied from 1.65 10
−14 m
2/s
2 to 5 m
2/s
2. The parameter’s maximum values were found in the area of gas flowing in channel 1, close to the peripheral slit between the separation chamber and the cone-shaped top of the cyclone separator (
Figure 7b, point 2). The greatest values of the parameter k were also obtained by the ribs of the curved elements at the beginning of each channel (
Figure 7b, point 3). The smallest values were obtained for the whole zone 1 (
Figure 7b, point 1), which coincided with the zone at point 9 (
Figure 7a), when the static pressure was analyzed.
A general trend of the increase in the turbulent kinetic energy (by about 1.8 times) was established when the points at the beginning and at the end of a channel were analyzed. However, in channels 1 and 3 (
Figure 7b, points 4 and 5) the values varied from 1 m
2/s
2 to 1.75 m
2/s
2, while in channel 2 they varied from 1.25 m
2/s
2 to 2.25 m
2/s
2. In channel 4, this variation could not be observed. Based on the considered data, it can be assumed that a gas flow becomes extremely turbulent when it flows round an obstacle and collides with the rib of a curved element on its way to the bunker through the slits made at the bottom. A conclusion is also made that the variation in the value of the parameter k in channel 4 is the smallest and uniform due to the lowest gas flow rate, which leads to a great decrease in the Reynolds number or turbulence.


 ,
, 


