Article

Application of Time-Voltage Characteristics in Overcurrent Scheme to Reduce Arc-Flash Incident Energy for Safety and Reliability of Microgrid Protection

1
Department of Electrical Engineering, Faculty of Engineering, The Hashemite University, P.O. Box 330127, Zarqa 13133, Jordan
2
College of Electrical and Electronics Technology, Algwarsha, Benghazi, Libya
3
Department of Electrical and Computer Engineering, Sultan Qaboos University, Muscat 123, Oman
4
Department of Electrical Engineering, University of Benghazi, Benghazi, Libya
5
Authority of Natural Science Research and Technology, Tripoli, Libya
*
Author to whom correspondence should be addressed.
Energies 2021, 14(23), 8074; https://doi.org/10.3390/en14238074
Submission received: 6 November 2021 / Revised: 20 November 2021 / Accepted: 29 November 2021 / Published: 2 December 2021

Abstract

:
The interconnection between diverse Distribution Generations (DGs) that utilize various technologies and complex structure of networks are the most characteristic of modern Distribution Networks (DN). The wide adoption of DGs considerably affects the power flow dynamics in the DN and consequently the fault characteristics. The excessive level of fault currents can pose risks of heat (high temperature) and pressure in accordance to Arc Flash (AF) incident energy in microgrids. This research studies the relationship between AF severity and the solving of coordination problem of Overcurrent Relays (OCRs) in DN, and introduces a novel equation that considers the AF qualities in solving the coordination problem for OCRs. In this study, a novel optimization problem, the AF severity with the optimal coordination of OCRs in DN is presented and the Water Cycle Optimization Method (WCOM) is employed to find the best combination of the OCR’s settings in the DN while considering the AF induced energy. The proposed optimization approach and the novel equation are evaluated with an IEC microgrid and compared with the conventional protection method and Particle Swarm Optimization (PSO) used in optimizing the coordination of OCR in the DN. The optimal settings of the OCR scheme are achieved and examined on the modified IEC microgrid benchmark system. In order to verify the result, an industrial simulation package (ETAP) and OCR (GE Multiin, model-750/760) was used in this work.

1. Introduction

1.1. Background

Currently, due to their extensive inclination to integrate more sustainable and clean energy sources, together with the development of transmission and distribution technologies, DNs have turned into groups partially independent of the networks [1]. The most straightforward possible description of microgrids is that of a group of DGs connected directly to the load areas. It may be fully or partially fed from the main utility through an intelligent management system [2]. A microgrid’s unique nature poses challenges that do not appear in conventional distribution networks [3]. Nevertheless, the need for more reliable, efficient, flexible, and cost-effective networks reinforces the trend of transforming DNs into active networks [4,5,6,7]. One of the challenges that microgrids bring, which are one the most important fields of research nowadays, is the coordination of protection schemes to be more responsive and reliable in case of faults [8,9,10,11]. The renewable energy resources, or DGs, have converted the conventional DN from a radial system into a multi-looped system. As a result of the fact that workers perform their tasks on charged conductors, workers should have Personal Protective Equipment (PPE) to handle the high degree of AF incident energy [12]. The importance of such measures is demonstrated by the ten-year study conducted by Electricite de France on 120,000 workers, which showed that electrical arc wounds caused more than 77% of the injuries [13]. The excessive energy generated by integrating more energy sources into the network than the equipment’s operational limits, may cause equipment damage and longer repair time in addition to costly repair expenses. Such faults shorten the life of the equipment and also limit the capabilities of protection schemes. The ability to operate the DN with DGs with the aim of limiting the impact of AF in the DN will increase the selectivity and protection coordination complexity. Therefore, selecting the optimal protection scheme is becoming one of the most challenging and important tasks to safely and securely operate the DN with DG systems. In this article, the fault current, AF incident energy characteristics and the OCRs coordination challenges in DN equipped with DGs can be described as a novel optimization problem. The solving of the novel optimization problem will help to find and adjust the OCR’s settings by considering the AF qualities in order to minimize the total operation time for OCRs and increase the reliability of the DN.

1.2. Literature Review

Evaluation of arc risks is one of the most critical factors that needs to be estimated and assessed in case of faults to reduce the amount of energy produced by AF. According to the reports and statistics provided by national associations (NFPA [14] and OSHA [15]), there are 30,000 cases of injury as a result of AF incidents annually in the US. There were also 7000 burn injuries caused by AFs, of which 2000 were admitted to hospitals annually. In addition, 400 deaths annually as a result of injuries from incidents were also counted. According to NFPA, the evaluation and analysis of arc risks and the labeling of AF is one of the necessary prerequisites for selecting the appropriate protection devices when operators work on a charged cable within the boundaries of AF safety zones.
Various solutions have been proposed to reduce AF risk. Among these solutions, there are the proposal to introduce arc-resistant switchgear, subsidiary breaker management assembly, arc reduction switch, and a relay with optical sensor for lights during arc incidence. Such methods are criticized for the expensive cost of upgrading the equipment in sub-stations. Further, several authors have suggested changing the setting of the relays to minimize the energy generated by AF incidents through minimizing the overall operation time of relays [16,17]. The authors in [18] suggested merging OCR coordination considering the AF. In this study [18], the minimum operational time is obtained while preserving an adequate coordination time interval. In another study, the FPA-based method was used to obtain the best possible solution in terms of total operation time for the overcurrent relays [19].
A number of studies have discussed and presented AF problem for DNs. For example, the authors in [20] studied the relationship between cables length and AF. While in [21], the effect of electrode geometry on the limits of the protection of AF were studied, and the author recommended that this effect should be increased according to IEEE 1584–2018 specifications. The effect of AF on the fault calculations via IEC and ANSI were studied in [22], whereas the authors in [23] compared both methodologies integrated and momentary method to improve AF calculation. A simplified hazards analysis of arc-flash using boundary curves were conducted in [24]. In [25,26], current limiting fuses were leveraged to minimize Arc Flash Incident Energy (AFIE), while in [27,28] researchers developed an approach that can detect and mitigate the AF at the speed of light and sound. An MV high speed grounding switch was used for AF mitigation in [29,30]. In [31], the authors improved the protection level in relays to detect AF. In [32,33], researchers used a graphical approach to analyze accident energy and knock, to discover the maximum and minimum value of AFIE. The study in [34] introduces a simplified arc-flash analysis methodology to assess the settings of over-current protective devices and arc rated PPE. In [15], the author suggested taking into account the anti-islanding schemes actions and procedures to eliminate AF as well as focusing on the interconnect transformer, as it increases the percentage of zero sequence sources and temporarily de-sensitizes the feeder protective relay. Most approaches for the OCR coordination problem in relevant research are formulated as a constrained optimization problem [20,21,22,23,24,25,26,27]. However, no study to date has considered AF in the optimization problem with OCRs. In Saad et al. [35], the primary investigation, which used OCRs to minimize the AFIE, was presented by employing the water cycle algorithm. However, the proposed approach in [35] did not consider the benefits of employing definite regions to minimize the total operation time for all OCRs and to minimize the AFIE. The paper [35], did not present and investigate the performance of the proposed approach with a different fault level or fault location. In addition, the authors in [35] did not investigate and compare the performance of the WCOM to common and powerful algorithm such as PSO. This article aims to develop and employ powerful optimization algorithms (WCOM and PSO) due to the limited number of studies that have considered the significance of using these new metaheuristic algorithms. In this paper, the investigation of the benefits of using the proposed optimization methods to achieve the minimum operating time for all relays (primary and backup) and the minimum level of the AFIE in the network, while maintaining an appropriate coordination time (CTI), are extended and presented. The proposed new optimization problem aims to guarantee the mixed coordination between OCRs and AF in a way will not affect the traditional function of OCRs by using WCOM and by being compared to PSO. This paper is one of the first extensive investigations looking into the best combination of the OCR’s settings in the DN while considering the AF induced energy for different operations and fault scenarios by using the WCOM and PSO algorithms.

1.3. Contribution of the Paper

The current of the AF in DN systems varies considerably depending on the fault current type and the DN configuration. The variation being mostly due to the impedance of the arc itself. The AF analysis can be used in two main purposes to help identify specifications with respect to relay settings to minimize AFIE levels within the equipment capability at different network topologies. Although overcurrent relays need to be coordinated to have sufficient Coordination Time Interval (CTI) between main and backup pairs, AF analysis necessitates that the total clearing time must be as minimal as possible to minimize the intensity of the AFIE. Given this, most OCR coordination procedures with inverse Time–Current Characteristics (TCC)s are in compliance with the AF analysis to simplify acquiring the optimal setting considering arc-flash analysis in DN systems
The contributions of this paper are listed below:
  • A novel optimization problem to present the AF severity with the optimal coordination of OCRs in DN. In this problem, additional constraints are suggested to be placed on the optimization problem in order to reduce AF incident energy. Moreover, this paper suggests a new constraint to the optimization problem to comply with the operational limitation of industrial relays. In this work, a defined region was the optimization problem with the AFIE categories. This aims to find the optimum setting of OCRs that considers the AFIE categories; definite regions and DGs would provide a significantly more secure environment for workers and equipment. The proposed new optimization problem aims to guarantee the mixed coordination between OCRs and AF in away will not affect the traditional function of OCRs by using WCOM, as described in following subsection.
  • A new optimal coordination scheme of OCRs in DN that incorporates the DGs and the AF qualities for different scenarios is presented and solved by a new optimization method (WCOM) and compared to the powerful algorithm PSO.
  • The tripping time of OCR installed on the DG bus is discussed by presenting a new coordination strategy (non-standard) for the OCR model. The proposed relay characteristic is compared with the traditional TCC in terms of the minimum operation time for a notable drop in the bus voltage.
  • A comparative investigation is performed between the standard and non-standard techniques for OCR coordination, which does not include the AF, and the approach suggested considers the AF within the OCR coordination optimization model under different fault scenarios. This will provide the DN operators and engineers an indicator about the impact of AF on the protection and operation of power systems.
  • The proposed OCR scheme approach is tested and verified by the use of ETAP industrial software, to provide sufficient analysis and prove the robustness of the new approach.

1.4. Outline of Paper

This paper is outlined as follows: Section 2 introduces the problem statement and the mathematical model for the AF protection problem. Section 3 and Section 4 present the novel optimal protection coordination scheme for the OCRs. The case study and the analysis of results are discussed in Section 5. The summary and conclusions of this paper are presented and discussed in Section 6.

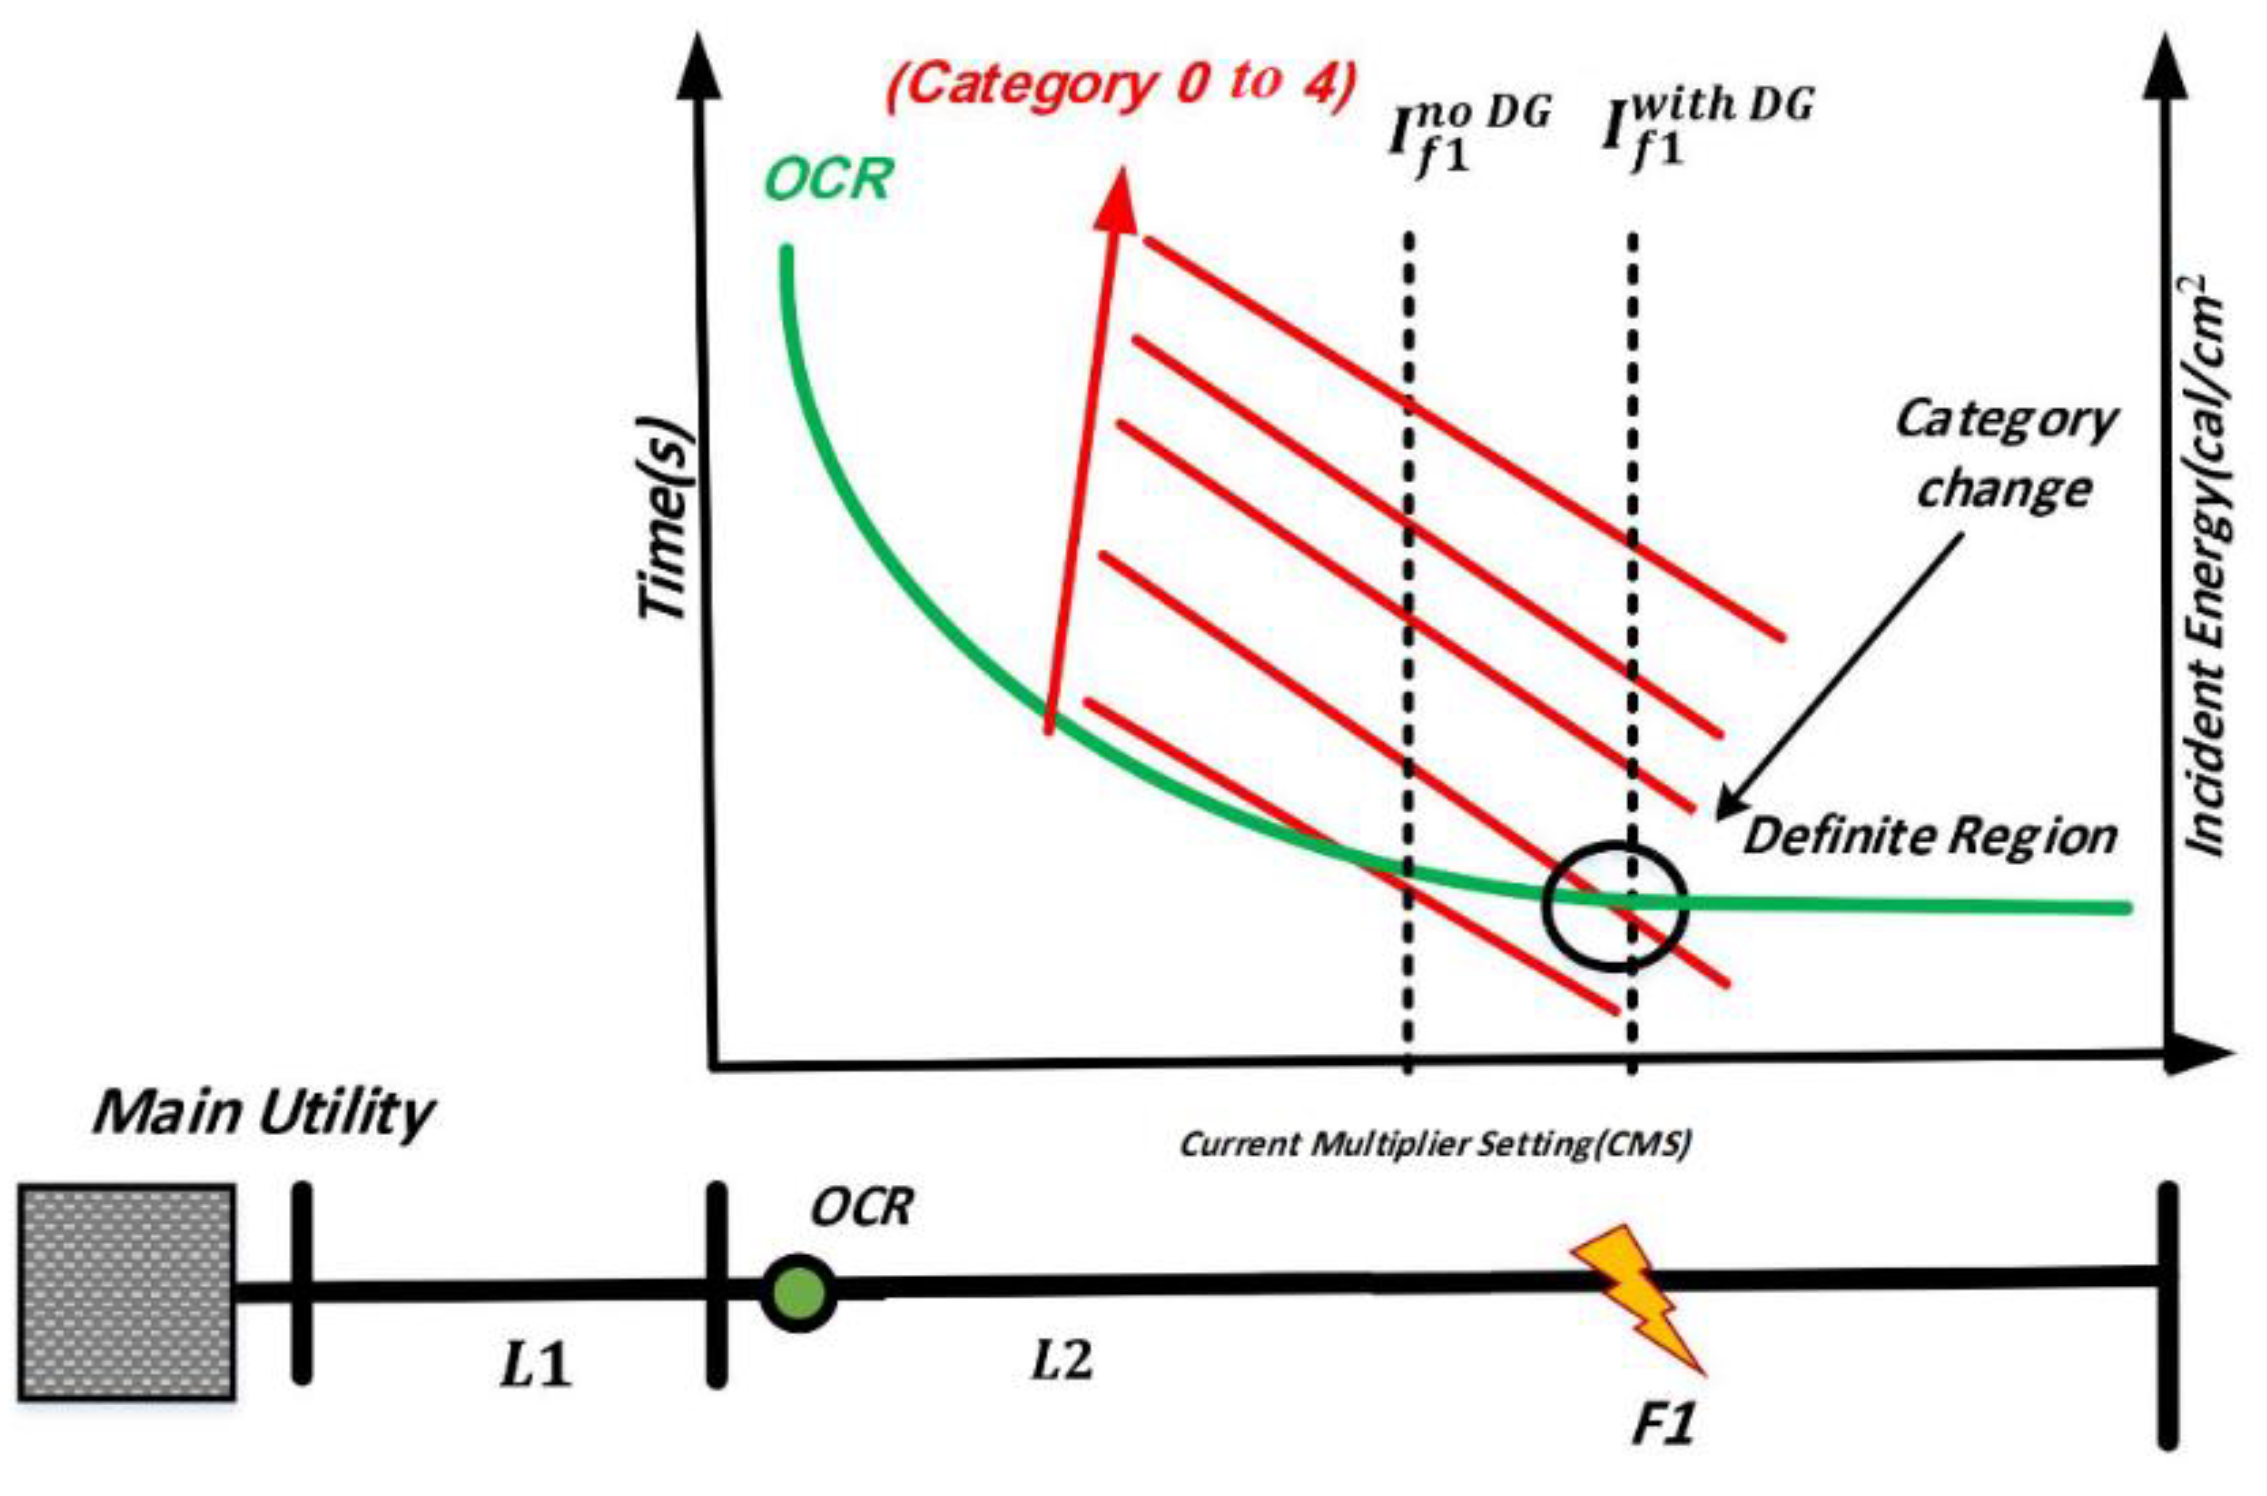
2. Problem Description: Arc-Flash Protection

Arcing short-circuits in LV and MV switchgear are one of the hazard places in the event of a fault, which causes several operational hazards and damage to equipment in addition to individual casualties. A somewhat considerable tripping time of the overcurrent scheme commonly used in DNs may cause the perpetuation of the arcing energy. Therefore, reducing the tripping time, even to a few hundreds of milliseconds, will maintain the safety requirements in sub-stations [36]. The inverse TCCs and AF categories shown in Figure 1 are an indicator to identify AF hazard categories. Figure 1 shows the relationship between AFIE and OCRs for a DN without DG. If the AF categories are not considered when coordinating overcurrent relays, then category 0 is basically located under the fault defined region in the TCCs. Therefore, it is possible that when a fault occurs, the AFIE will be higher than the incident energy assigned to category 0 and thus will increase the risk of exposing equipment and operators to risk.
The fault characteristics and tripping time are different in the DN with and without DG systems. In addition, the AF Category increases the complexity of choosing the optimal OCR setting. For DNs equipped with DGs, the category 0 will be updated to a higher level than the OCR characteristics because of the increased fault current compared with DNs without DGs. Therefore, the category of AFIE will change from 0 to 1, which mean higher risks compared to DNs without DG. In conventional DNs, which do not connect to DGs in the distribution level, the AF incident energy category is less than the inverse TCCs of the designated OCR. However, with the interconnection of DGs, as in Figure 1, the AF incident energy category will increase from the category of 0 to 1, which requires wearing PPE that matches the energy generated by the electric arc in the event of a fault. Thus, coordinating the TCCs of OCRs and the AFIE category is an urgent necessity to ensure that the AFIE category resulting from the fault remains below the fault point on the TCC of OCRs as in Figure 1. For example, the DN with DG will have a fault current where category 0 is located
Above the OCR curve, and therefore it was considered in the calculation as shown in Figure 1. However, when DG is connected to the grid, the fault current may change the AFIE category from 0 to 1, which makes the situation more dangerous compared to the DN without DG (as shown in Figure 1).
As indicated by Figure 1, when DG is connected, the OCR may enter the definite region, consequently increasing the AFIE category from 0 to 1 and 2. This introduces higher risk than the previous operation conditions. Therefore, the DN will require having more secure PPEs and clothes. Therefore, finding the optimum settings of OCRs that consider the AFIE categories, definite regions, and DGs would provide a significantly more secure environment for workers and equipment. Several studies have used a light sensor (energy sensor) or differential protection to detect the occurrence of AF [36,37,38,39]. The occurrence of AF with circuit breakers inside sub-stations makes it possible to use the existing voltage transformers inside those substations to obtain voltage readings, which can be implemented in the inverse TCC of the overcurrent relay to obtain the least possible time in case of fault, as well as the possibility of adjusting the TCC within the numerical OCRs that are commonly installed and utilized in the existing DNs. Thus, the total operational time of OCRs will depend on the voltage and current by introducing the possibility of interpreting voltage measurements in the characteristic’s equation of the overcurrent relay without the need for changing the current protection group settings.

Calculation of the AFIE

Many factors, such as the magnitude of arcing current, the total clearing time for fault events, and the dimensions of the working area, significantly affect the AFIE. Therefore, minimizing the tripping time of OCRs in line with the coordination between the relays (primary and backup) may be one of the most influential and feasible solutions to reduce the level of AFIE. The mathematical expression in Equation (1) shows the relationship between the AFIE at the specific working dimensions and the total clearing time as follows [19]:
AFIE = 4.184   C f E n ( t 0.2 ) ( 610 W D ) x 0.24
where E n is the normalized AFIE over time period, C f is the estimation variable (1.5 for LV and 1 for HV), t is the total tripping time, W D is the operating distance, and x is an exponent factor [19,39]. Thus, AFIE can be measured for a voltage level up to 15 kV by applying the following equation:
E n = 10 ( z 1 + z 2 + 1.081   log ( I arc ) + 0.0011 G p )
where the z 1 and z 2 are configurations based on the grounded systems, I arc is the arcing current, and G p is the gap distance between conductors. Equation (3) describes the arcing current for a voltage level higher than 15 kV.
I arc = 10 ( 0.00402   log ( I f ) )
I f is three-phase short circuit current in kA. As can be seen from Figure 1, it is related to the AFIE category. The incident energy can be higher in active DNs with high DG-share, based on the network topology and nature of the fault. This alone highlights the need to revise the OCR coordination strategy taking into account the arc-flash analysis.

3. Optimal Coordination Problem of OCRs and AFIE

The proposed model in this article aims to minimize AFIE. In this work, with the help of AFIE considerations achieved from AF analysis, OCR coordination will reduce the overall operational time while maintaining coordination between the relays (primary and successive backup). More operational details for coordinating OCR are found in [40,41]. In the following subsection, the objective function that describes the AFIE problem and the optimization model constrains are presented and discussed.

3.1. Formulation of OCR Coordination Problem

The constrained coordination problem (objective function, OF) of OCR in DNs can be represented in the following Equation (4):
min OF = j = 1 n W   t j , k
where the number of OCRs form j = 1 to n, t j , k is the tripping time of relay j at short-circuit current location k. The weight that defines the chance of event of a fault on a selected line is presented by W. Here, the weight value is assumed to be one [19,41], and the fault incident has an equal probability on each line. The total tripping time of the OCRs is limited by the relays and network operation constraints as regards.

3.1.1. Coordination Criteria

The selection of CTI is fundamentally depended on the tripping time for the primary OCR, overshooting time, and the clearing time of breaker. The time coordination constraints can be demonstrated in Equation (5):
t 2 , k t 1 , k Δ t
where t 2 , k and t 1 , k   are the tripping time of backup and primary OCR for a short-circuit current at location k, respectively. The ∆t is the CTI, which is regularly produced in range of 0.2–0.5 s [42] and it set as 0.3 s in this study.

3.1.2. Relay Operating Time Constraints

The tripping time of overcurrent relays is expressed as a constrained variable to obtain the limits for the highest and lowest tripping time, t max and t min , respectively, for OCR j as follows:
t min < t j , k < t max

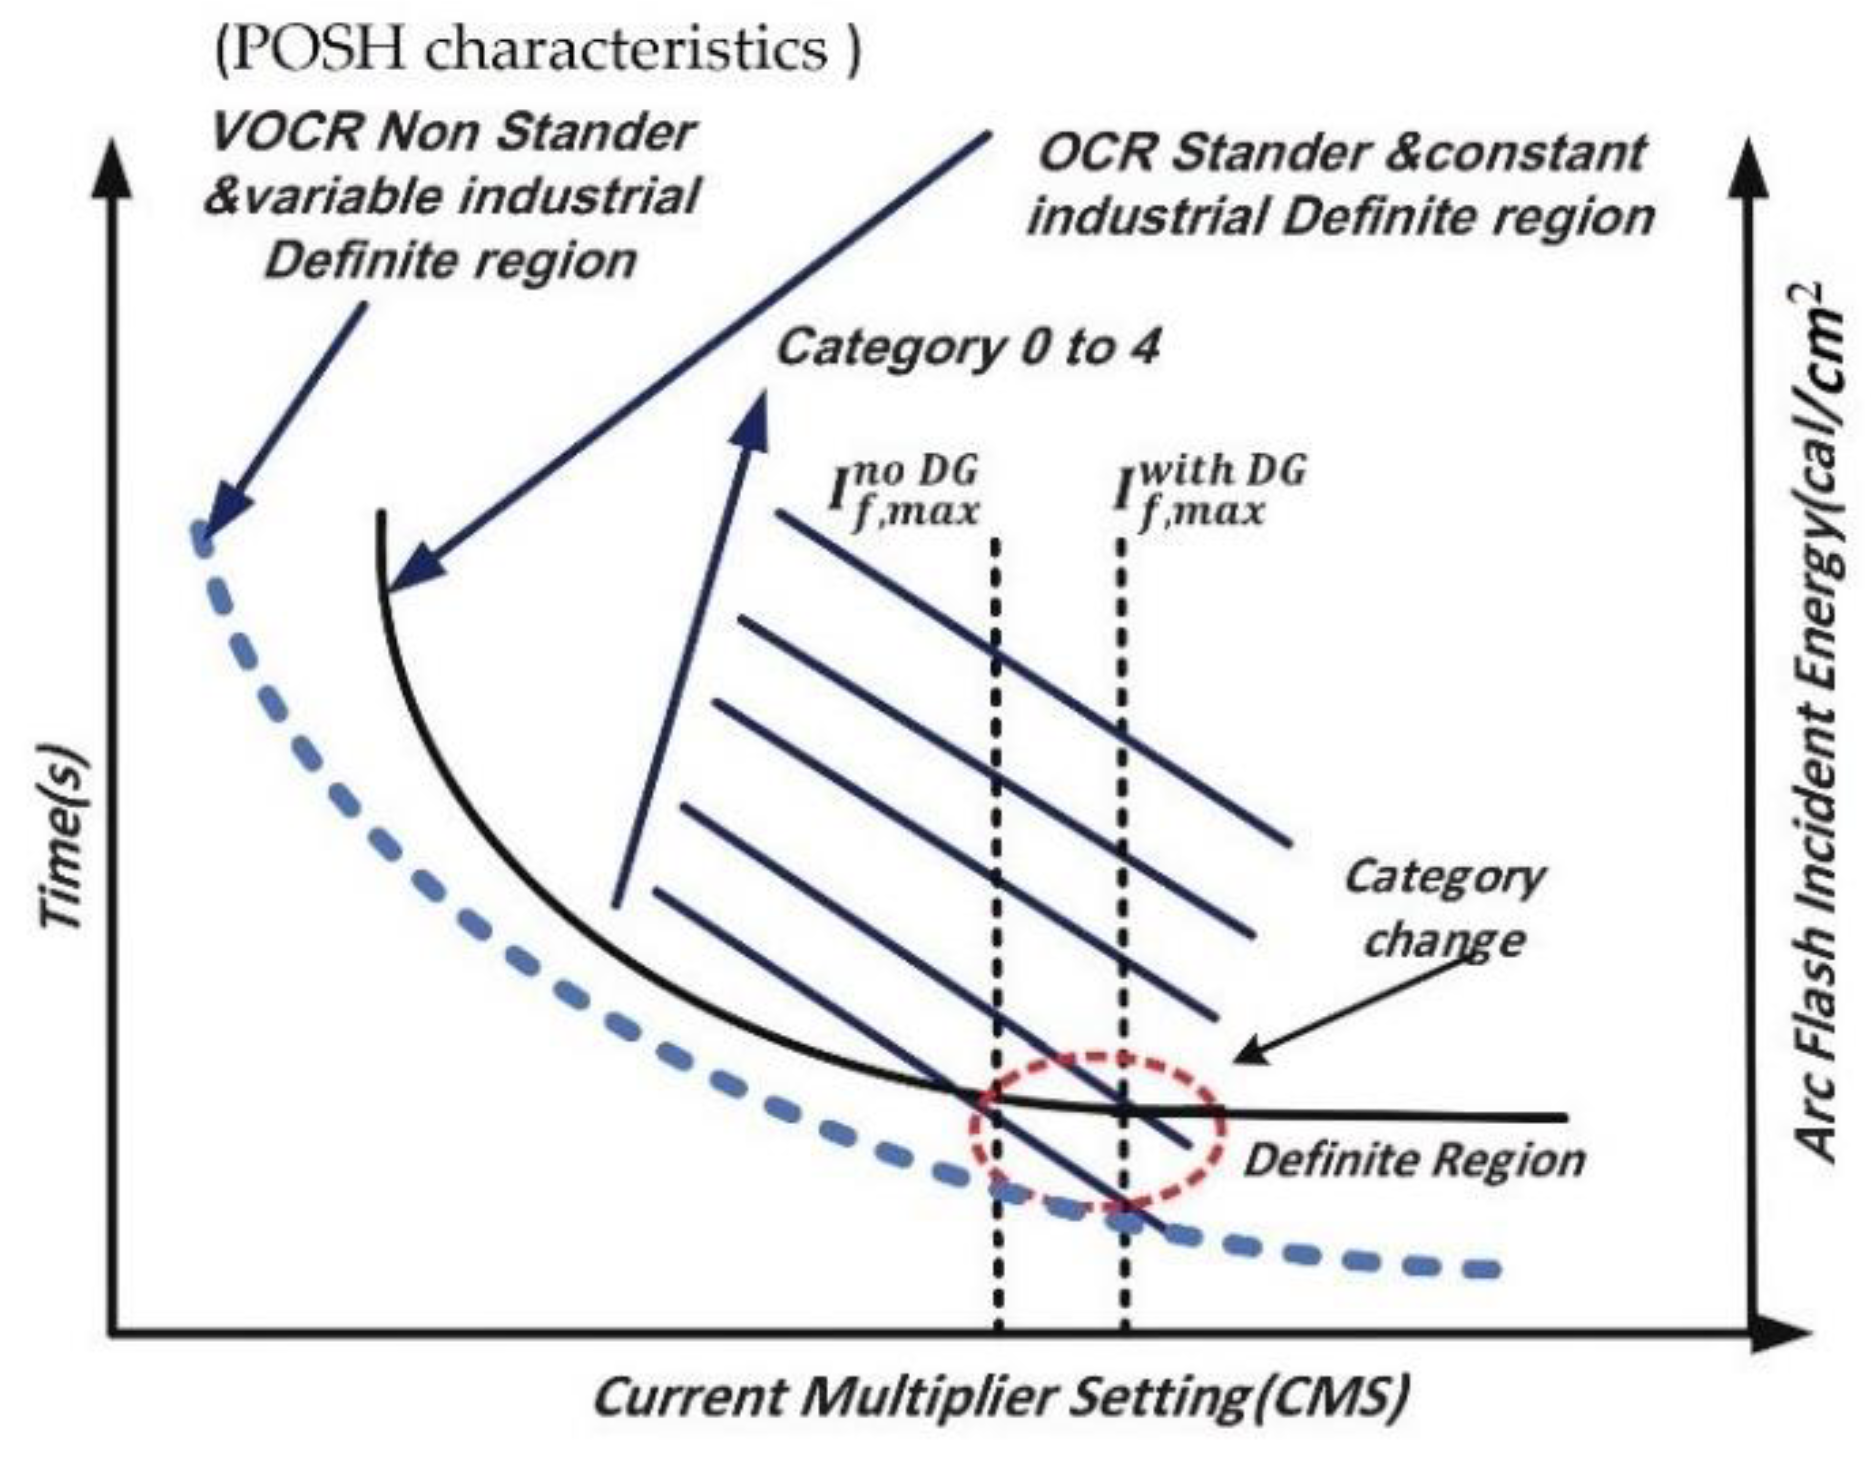
3.1.3. Proposed Current Multiplying Setting (CMS) of Industrial Relay Characteristics

This paper also introduces the addition of the operational limitation constraint of industrial relay characteristics to the formulation of inverse OCR coordination. The highest limit for the inverse characteristics of OCR, CMS max , was defined as high as 100, while the lowest possible limit, CMS min , was chosen as 1.1. The following equation describes this relation:
CMS min < CMS j , k < CMS max

3.1.4. The TMS and PS Constraints

TMS is the primary variable in managing the OCR scheme coordination time and PS is the plug setting for the OCR. Accordingly, the value of the TMS and PS need to be between the lowest and maximum value of TMS and PS, TMS min , PS min , TMS max and PS max , respectively, as following:
TMS min < TMS j , k < TMS max
PS min < PS j , k < PS max

3.1.5. The Relay Constraints Considering AFIE

In this paper, a new objective function for OCRs considering AFIE is formulated by creating a voltage–current-based time inverse for the OCR model. The reduction in total operational time of this suggested is based on a reduction in the bus voltage when fault occurs near DG’s bus-bar when DG connected with the distribution system to develop relay variables including TMS, pickup current, and OCR parameters. OCR scheme is essentially employed to protect low-voltage DNs. The highest and lowest tripping time are determined by calculating the operation time of OCRs, which is complex and non-linear equation and can be expressed for Standard Inverse (SI) characteristic as follows:
t j , k = 0.14 TMS j , k   ( CMS j , k ) 0.02 1
In order to minimize the tripping time of the OCR scheme, an exponential term was added to the traditional SI equation, and thus less the AFIE. The new OCR equation after modification become as follows:
t j , k = ( 1 e 1 v j , k ) q 0.14 TMS j , k   ( CMS j , k ) 0.02 1
where v j , k is pre-phase fault voltage measured in per unit on OCR bus voltage for relay j and fault location k. q is a fixed variable and is selected as two [19,40].

4. Addressing Water Cycle Optimization Method (WCOM) in Solving the Complex Overcurrent Relays Coordination Optimization Problem

The WCOM is an innovative heuristic optimization algorithm that is inspired by nature from the water cycle in seas and rivers [43]. In general, The WCOM is a powerful optimization solver as presented in [44] and it can be developed by The Optimization Toolbox in 295 MATLAB/ SIMULINK (MathWorks, Inc., Natica, MA, USA) [45]. This article aims to develop and employ a new powerful optimization algorithm (WCOM) as limited studies have considered the significant of using the new metaheuristic algorithms compared to common algorithms such as PSO. In this paper, the proposed new optimization method (WCOM) aims to achieve the minimum operating time for all relays (primary and backup) and the minimum level of the AFIE in the network while maintaining an appropriate coordination time (CTI). The proposed new optimization problem aims to guarantee the mixed coordination between OCRs and AF in away will not affect the traditional function of OCRs by using WCOM and compared to PSO, as described in following subsection. The new optimization algorithm (WCOM) and common algorithm PSO [10] have been used and employed in this work for solving different operation mode in microgrid. WCOM is mainly carried out through an iteration process. Firstly, WCOM will initially have random parameters and solution for solving the optimization problem in Equation (4). Then, the solution position will be updated based on the best results in previous step. In the next step, the swapping between the solutions locations and importing random new solution aims to achieve the optimum solution and avoid local optimal solutions. Finally, the WCOM algorithm will achieve the best possible solution at the end of the iteration process. The following steps show the main procedures of WCOM:
Step 1: set the main parameter of WCOM: the main parameters of WCOM have been determined by testing each of the parameters over a wide range of values, as shown in Table 1, then the optimal (best) parameter value was chosen to obtain the simulation results in this article [46].
Step 2: generating a random initial population of solutions (streams).
Step 3: determining the number of the number of streams and the decision variables.
Step 4: calculating the objective function value for each possible solution by using the overcurrent optimization problem (Equation (4)).
Step 5: updating the solution position and selecting the new location for the best results in previous step.
Step 6: swapping between the solutions locations to achieve the optimum solution and avoid local optimal solutions.
Step 7: adding a new random solution to avoid local and saturation in choosing the optimal solution.
Step 8: the WCOM is an iteration algorithm, the above process from step 2 is repeated until the maximum number of iterations are achieved.

Illustration of the Proposed Strategy to Reduce Arc-Flash Energy in Over Current Protection Scheme

An efficient arc-flash reduction strategy can significantly reduce the energy level, reduce the possibility of electrical hazard risk accident, decrease equipment damage, and maintain electrical continuity. During an AF event, the generated energy is dependent on voltage, current, and duration of the arc event. Some proposed options recommend reducing system voltages or fault current level through a grounding system. Still, the most effective and least expensive strategy is to minimize the fault-clearing time by using adaptive setting groups in numerical relays and utilizing wireless communications already available in DNs to avoid harming operators and technicians.
This article aims to present a strategy for addressing the coordination problems of protective relays, which include assessing AF in the grid. In the proposed approach, the minimum operating time for all relays (primary and backup) were obtained. As a result, the AFIE levels were reduced in the network while maintaining an appropriate coordination time (CTI). The proposed coordination strategy (voltage OCR with nonstandard scheme) is described in Figure 2 and shows the standard inverse TCCs of overcurrent relays when a fault occurs, and their relation to the AF Categories. In the event of a fault (I) where the AF categories not taken into account, the AF category level will increase from level 0 to level 1 and thus poses a risk to the life of the operators and damage to the equipment. The employment of proposed optimization scheme (POSH) will ensure that the AF category does not increase from level 0 to 1 by providing less tripping time. As a result, the POSH characteristics will be located under the lowest AF category, which is a less risky situation for operators and equipment.
In integrating DGs into the distribution network, the possibility of increasing the AF categories will become more significant. When fault (I) occurs and AF analysis is not considered in overcurrent coordination, the AF event will become more dangerous since the fault current enters the relay’s definite region. As a result, the AF category of the fault will change from level 1 to level 2. This situation requires wearing safer protective clothes. Consequently, consideration of AF assessment in overcurrent coordination is essential to ensure operators’ safety and avoid equipment damage. When POSH characteristics are utilized, these characteristics will ensure a short tripping time so the fault current will not reach the definite region of the relay. Therefore, IE will not increase so high that it may cause losses in lives and equipment.

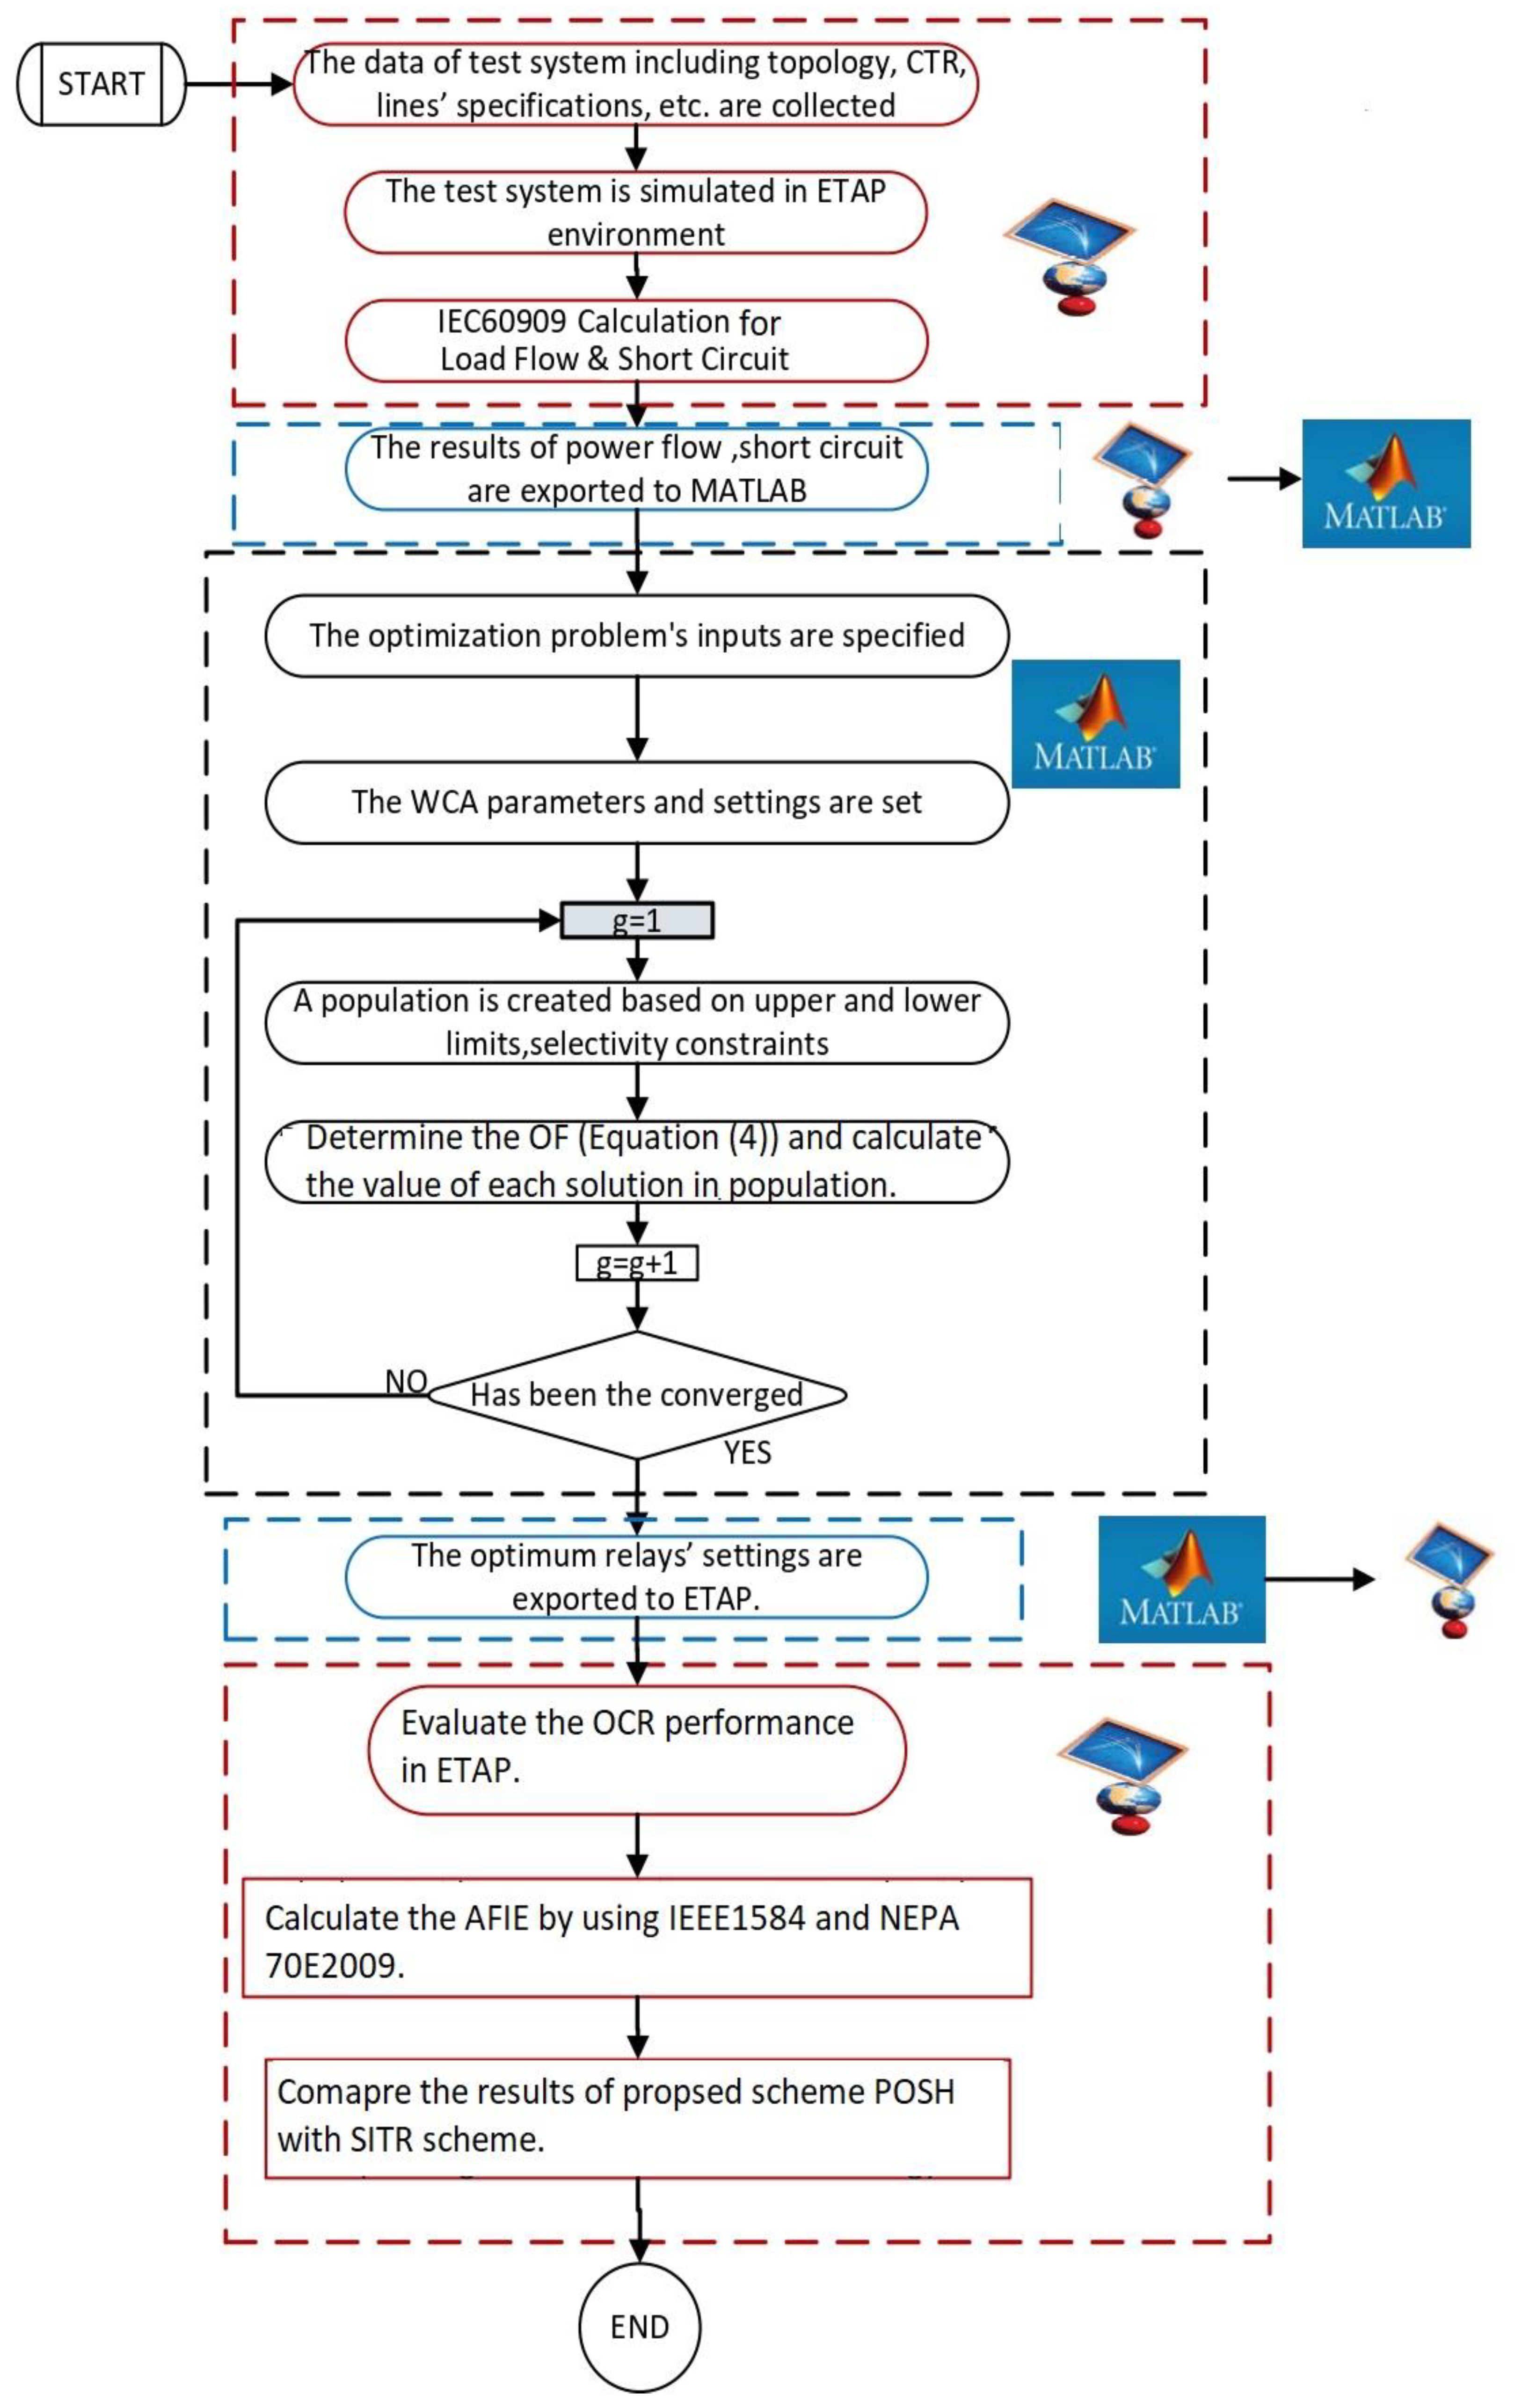
Work-Flow and Procedures of the Proposed Strategy

In this work, an optimal solution approach for OC relays coordination problem considering AF events was developed and compared to the traditional coordination scheme. The WCOM as described in previous section is used to find the optimal TMS values for all OC relays considering AF events [41]. The proposed approach in this work is tested by using two DN scenarios. The first DN operation scenario (Mode 1). The second scenario (Mode 2) is a microgrid fed by the utility and with DGs. The proposed optimal solution approach aims to adjust the TMS value for all the OC relays and the relays coordination is selected by considering AF events as shown in the work-flow.
Figure 3 presents the main steps involved in the proposed novel approach for acquiring the optimal coordination of overcurrent relays. In the beginning, the ETAP program was used to implement the IEC microgrid benchmark by specifying and defining the data of each of the transmission lines, Current Transformer Ratio (CTR), and network topology. Execution for the simulated system’s load flow was made to initially identify the proper CTRs and adjust the relay settings. Then, three-phase fault simulations were carried out at different locations in the network in the two simulated modes (Mode 1 and Mode 2). The acquired results through load flow and short-circuit calculations in ETAP were exported to MATLAB/SIMULINK software to solve the optimization problem. The inputs and settings for WCOM were specified to create the population based on the upper and lower limits and the constraints designated in overcurrent coordination problems. Computation for the objective function in each raindrop was conducted to check the convergence of the optimization problem. The extracted optimal setting is inserted into the ETAP program to implement and evaluate the obtained overcurrent relay setting. The calculation of Incident Energy is based on IEEE1584 while AFIE level is determined by NEPA 70E 2009. This work presents a comparative analysis for the proposed inverse time OCR approach (POSH) with the conventional Standard Inverse Time Relay (SITR) coordination approach in terms of CTI and overall operational time and overall incident energy.

5. Simulation Results and Discussion
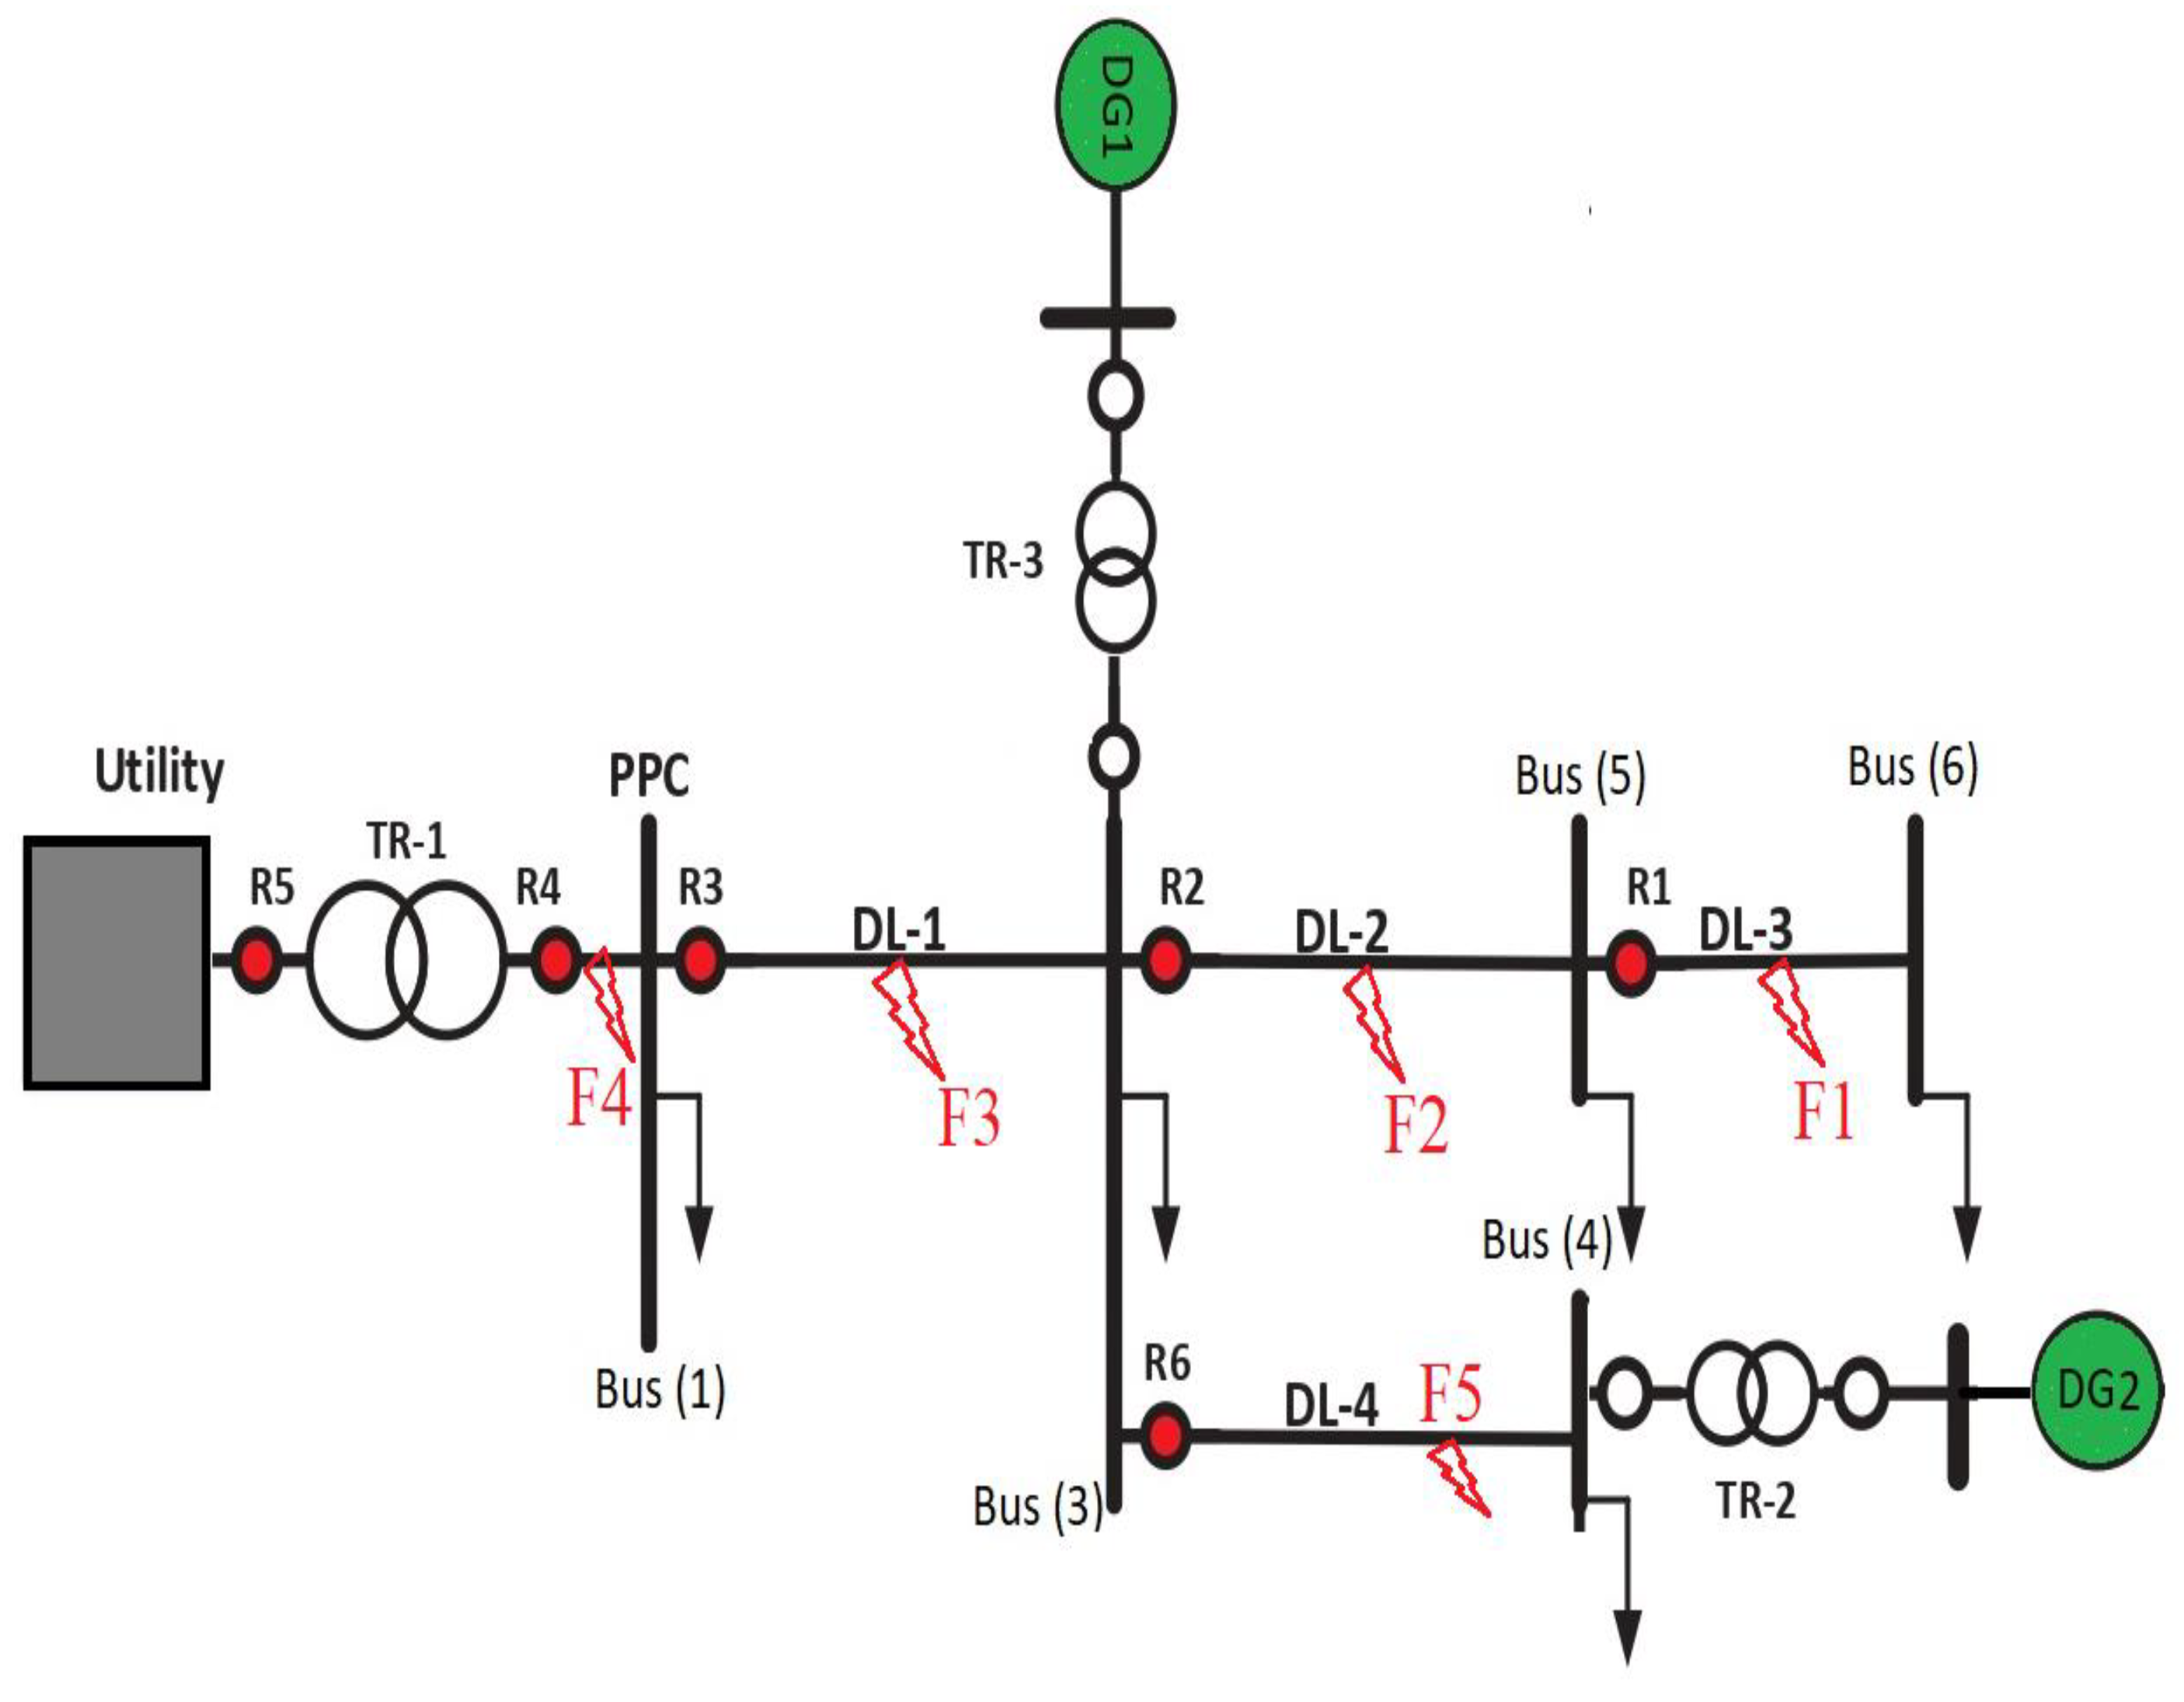
The presented formulation of the AF severity with the optimal coordination for over current relays in Section 2 and Section 3 is evaluated and examined using a modified IEC microgrid with two DGs. This section aims to discussed and show the effectiveness of the proposed new optimal approach (POSH) for OCRs in DNs that incorporate the DGs and the AF qualities for all possible three-phase faults scenarios. In the following subsection, the description of the case study considering the network specifications is presented. Then, the results of the proposed scheme of OCRs and the AF in microgrid are presented and discussed under different IEC network scenarios. Finally, the proposed optimal coordination scheme is tested using the industrial software (ETAP). The case study and the analysis of results are described and discussed in this section.

5.1. Case Study

In this paper, the main case study is presented in Figure 4. The proposed case study is a modified IEC microgrid model including two DGs. The base power in the proposed case study has been selected to be 10 MVA and the detailed information of the studied DN is given as by [46]. The case study network contains six OCRs, as presented in Figure 4. Table 2 presents the Plug Setting (PS), Current Transformer Ratio (CTR), and Pickup current (IPP) for each OCR. In order to evaluate the proposed solution, three-phase fault has been simulated at different locations. In addition, this work aims to investigate and present the performance of the proposed solution under different network operation scenarios (with and without DGs). The microgrid system is first considered as a radial network without DG and is protected by the OCR scheme with time–current inverse characteristics for the implementation of the procedure. However, the fault contribution is shared between the utility source and DG when DG is added to the system. The power flow is bidirectional, reducing the capability of the OCR scheme. In order to evaluate the advantages and benefits of the proposed approach in terms of providing minimum Overall Operational Time (OOT) for different fault locations, as shown in Figure 4, with respect to the CTI between primary and secondary OCR pairs, the CMS, fault current, and CMS in different fault locations are presented in Table 3 and Table 4.

5.2. Results Analysis and Discussion

The results of the proposed POSH and conventional SITR schemes are presented over different network operation scenarios. In this subsection, we will compare the POSH and SITR schemes performance using WCOM optimization algorithm for a DN based on the following configurations:
  • Mode 1: the utility fed the microgrid (without DG).
  • Mode 2: the utility and DGs fed the microgrid (with DG).

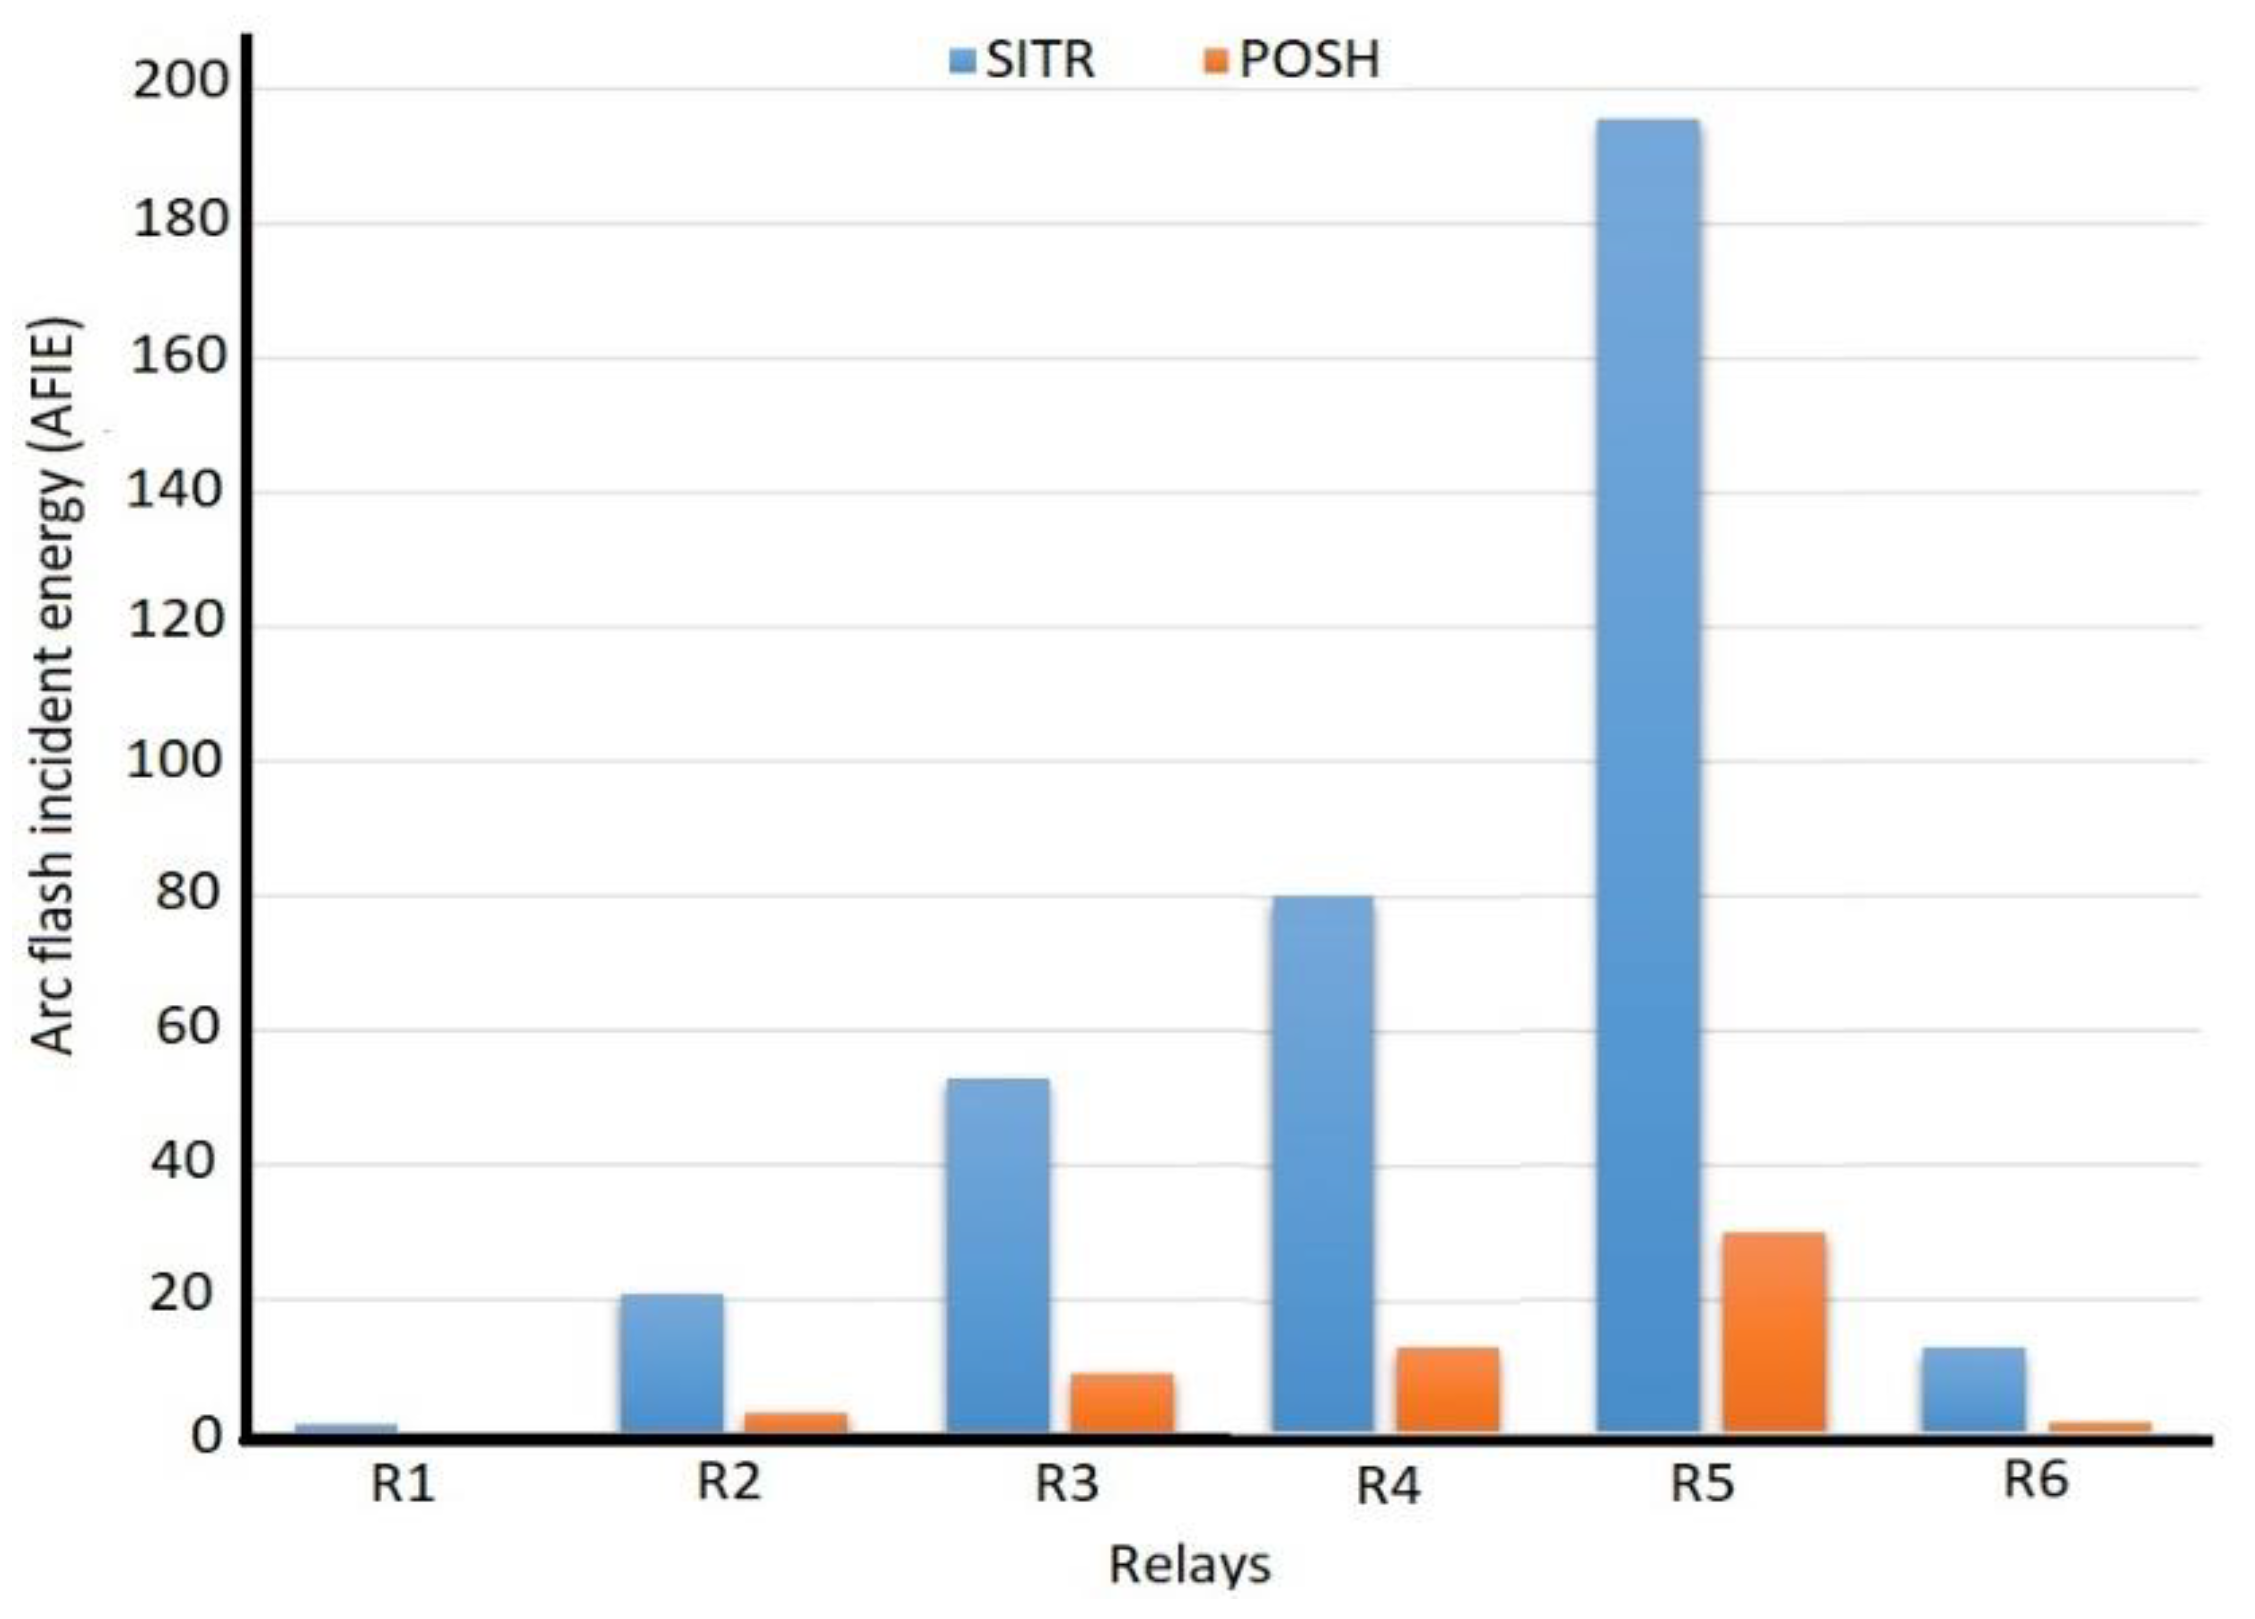
Numerical Results for the Proposed POSH and Conventional SITR Schemes

The proposed optimal OCR (POSH) and the conventional SITR schemes are evaluated and compared in terms of CTI, overall relays operational time and overall incident energy using WCOM optimization algorithm are evaluated in this section. Firstly, Table 5 presents the OOT and TMS value for all relays under the three-phase fault condition. In addition, the results were obtained for both network operation scenarios (Mode 1 and Mode 2). The OOT was significantly decreased by using the proposed POSH approach compared to the conventional SITR approach, as presented in Table 5. For example, the OOT decreased from 5.68 S (SITR) to 2.565 S (POSH) in Mode 1 scenario. The OOT increased in Mode 2 compared to Mode 1 for both POSH and SITR approaches. This indicates that the DGs at the network increases the complexity of the coordination problem and OOT for OCRs. However, the POSH approach outperformed the SITR for both modes, where the POSH decreased the OOT by 57.2% and 54.8% at Mode 2 and Mode1, respectively. Figure 5 presents the percentage improvement of using the PITR and compared to SITR schemes in term of OOT for Modes 1 and 2.
In this work, to evaluate the performance of the proposed POSH and conventional SITR approaches on the clearing of arc faults, Table 6 and Table 7 are presented. The main comparison terms for the dealing with arc faults are the clearing time for arc fault (FCT, s), the incident energy of arc (AFIE, Cal/ cm 2 ), the level of energy producing during fault (EL), and the boundary of arc flash (AFB, ft), as shown presented in Table 6 for Mode 1 and Table 7 for Mode 2. Firstly, the EL significantly decreased by using the proposed POSH approach compared to the conventional SITR approach. For example, the EL decreased from level 3 (SITR) to level 1 (POSH) in the Mode 1 scenario at relays R2 and R6. Table 7 showed that the EL decreased from level 4 (SITR) to level 0 (POSH) in the Mode 2 scenario at relays R2 and R6. This practice will help to presents an effective solution to deal with the arc fault energy in DNs with DGs and significant enhancement in safety. Secondly, the clearing time for arc fault FCT was significantly decreased by using the proposed POSH approach, as shown in Table 6 for Mode 1 and Table 7 for Mode 2. For example, the FCT decreased from 1.17 S and 0.163 S (SITR) to 0.18 S and 0.02 S (POSH) in the Mode 1 scenario for relays R5 and R6, respectively. Finally, the boundary of AF, AFB, and the incident energy of arc (AFIE) decreased in Mode 1 and 2 when using POSH approach compared to SITR. This indicates the ability of the proposed POSH to deal with AF problem and minimize the impact of it. For example, the AFB decreased from 195.5 ft and 12.74 ft (SITR) to 20.03 ft and 3.42 ft (POSH) in Mode 1 scenario for relays R5 and R6, respectively. Its significant to consider the AF analysis in order to solve the OC relays coordination problem in the microgrid network. The reduction in the incident energy of arc (AFIE) shows how the model is applicable to deal with AF problem. Figure 6 presents and compares the AFIE for the proposed POSH and conventional SITR approaches. The results showed that proposed POSH approach considering AF analysis has successfully reduced the AFIE in different fault scenarios and for all relays compared to SITR approach.

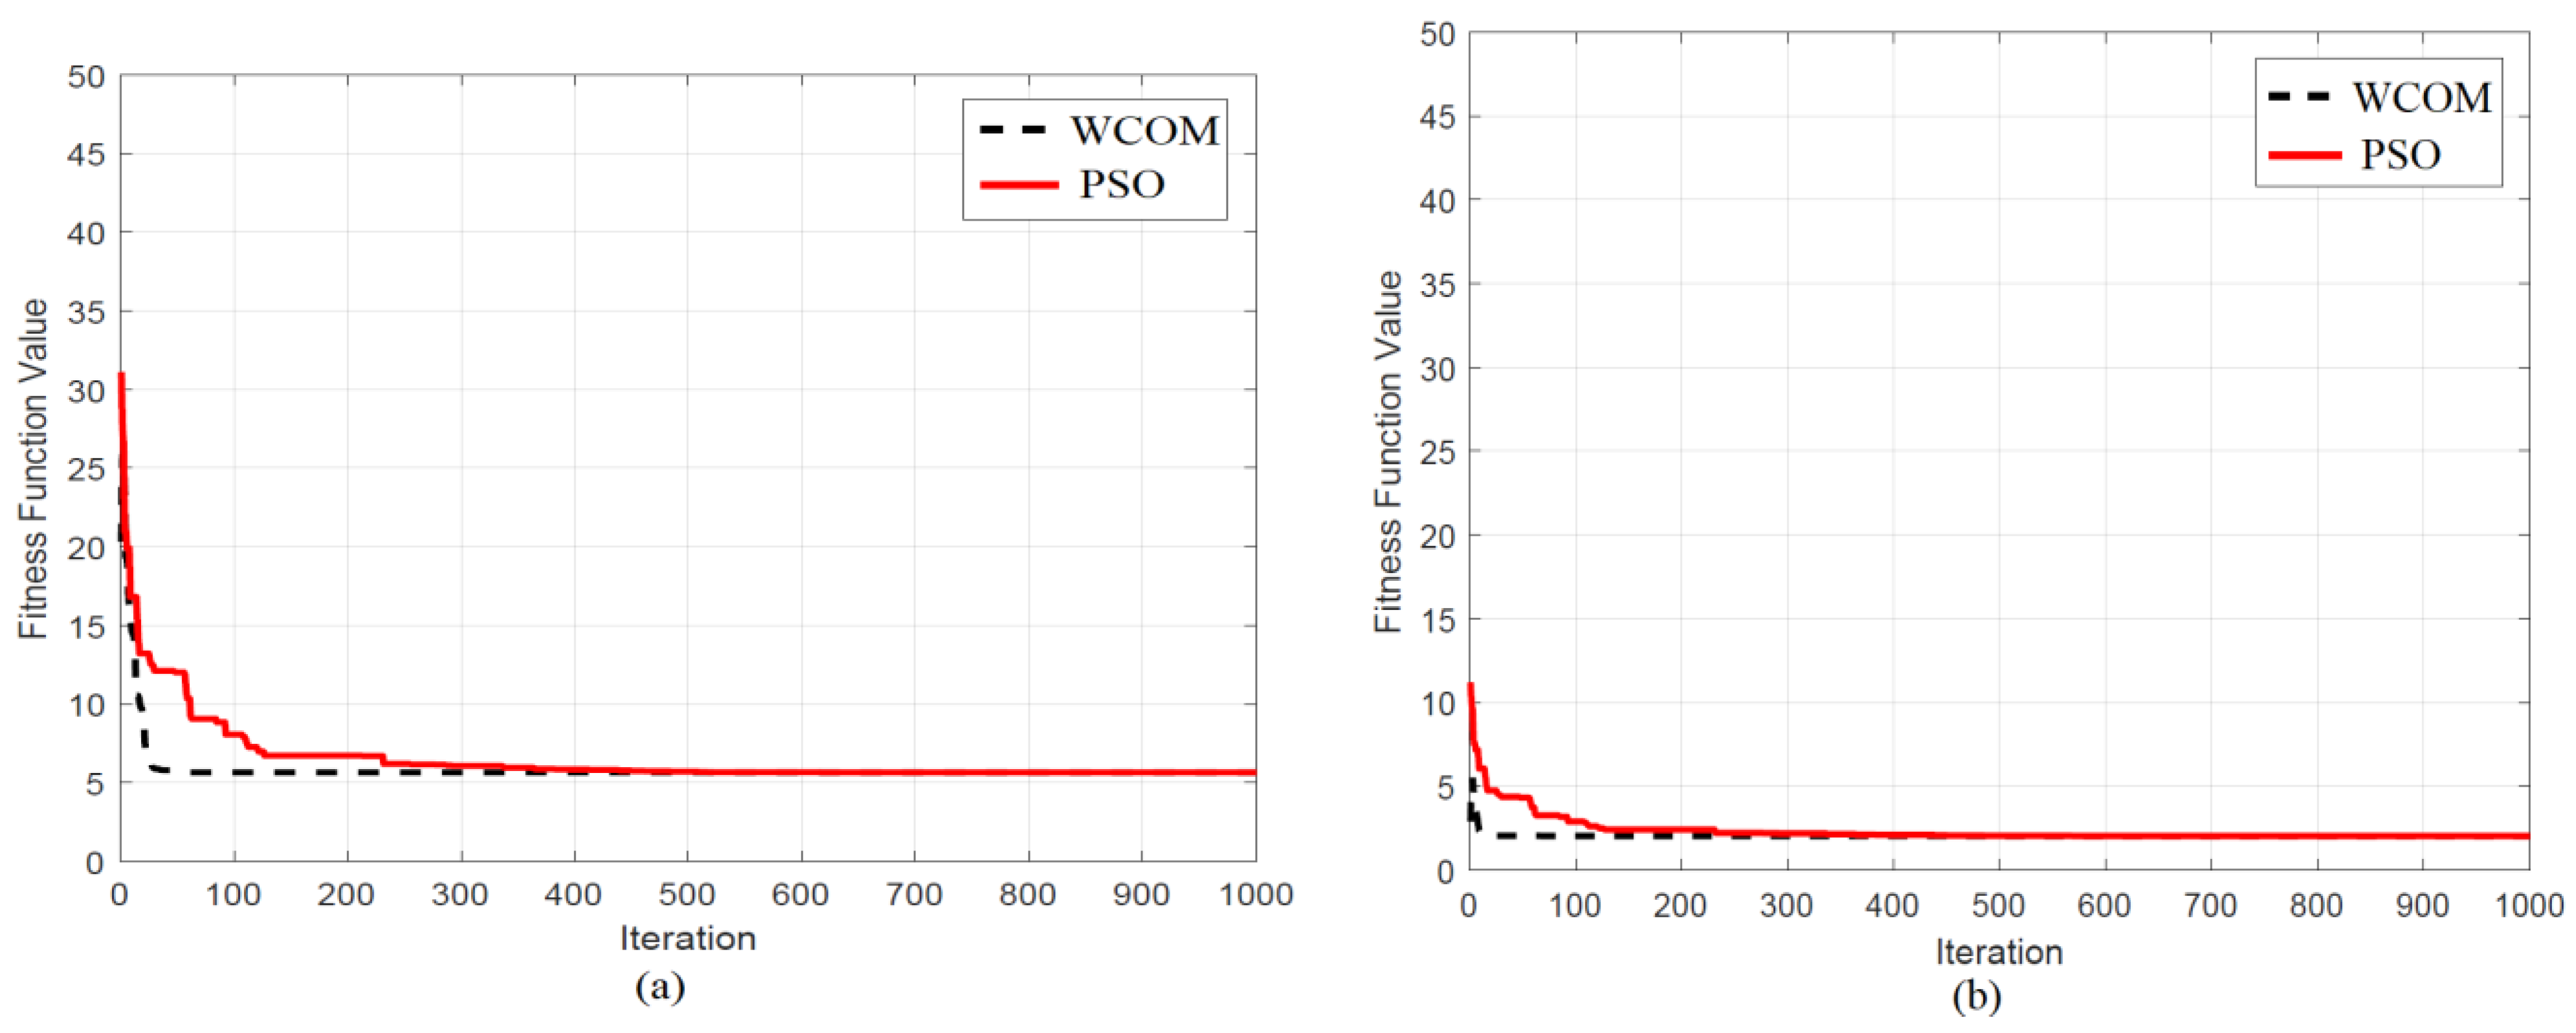
5.3. Discussion and Comparison for Different Optimization Algorithms

In this section, we aim to compare the performance of the new WCOM algorithm and the common PSO [10] algorithm under different operational scenarios. The WCOM and PSO have been tested and envaulted with the proposed POSH approach and the conventional SITR approach over the two microgrid operation scenarios (Mode 1 and Mode 2). Firstly, the OOT for all relays in Mode 1 and 2 is presented in Table 8. The WCOM outperformed PSO and obtained the best results of OOT in Mode 1 and 2 by using SITR and POSH approaches. For example, the WCOM achieved an OOT in Mode 2 equal to 6.1 s and 2.613 s compared to 6.21 s and 2.7 s by PSO algorithm for SITR and POSH approaches, respectively. In addition, the compactional cost for the optimization algorithm is presented in Table 8 through the elapsed time term. As shown in Table 6, the WCOM requires less compactional cost to obtain the optimal results compared to the PSO algorithms over all scenarios. The WCOM decreased the elapsed time by 41.8% and 20.8% at Mode 1 and Mode 1 for SITR approach, respectively, compared to PSO algorithm. In order to present the performance of both optimization algorithms (WCOM and PSO) in term of utilization efficiency in CPU, Figure 7 introduces the convergence curves for Mode 1 and 2 with the proposed POSH approach and the conventional SITR approach. The WCOM algorithm outperformed the PSO and achieved higher utilization efficiency in CPU for all cases, as shown in Figure 7. In general, the WCOM curves were more speedy and smoother compared to the PSO algorithm, and the WCOM achieved optimal values for Mode 1 and 2 under the SITR and POSH approaches with the smaller number of iterations.

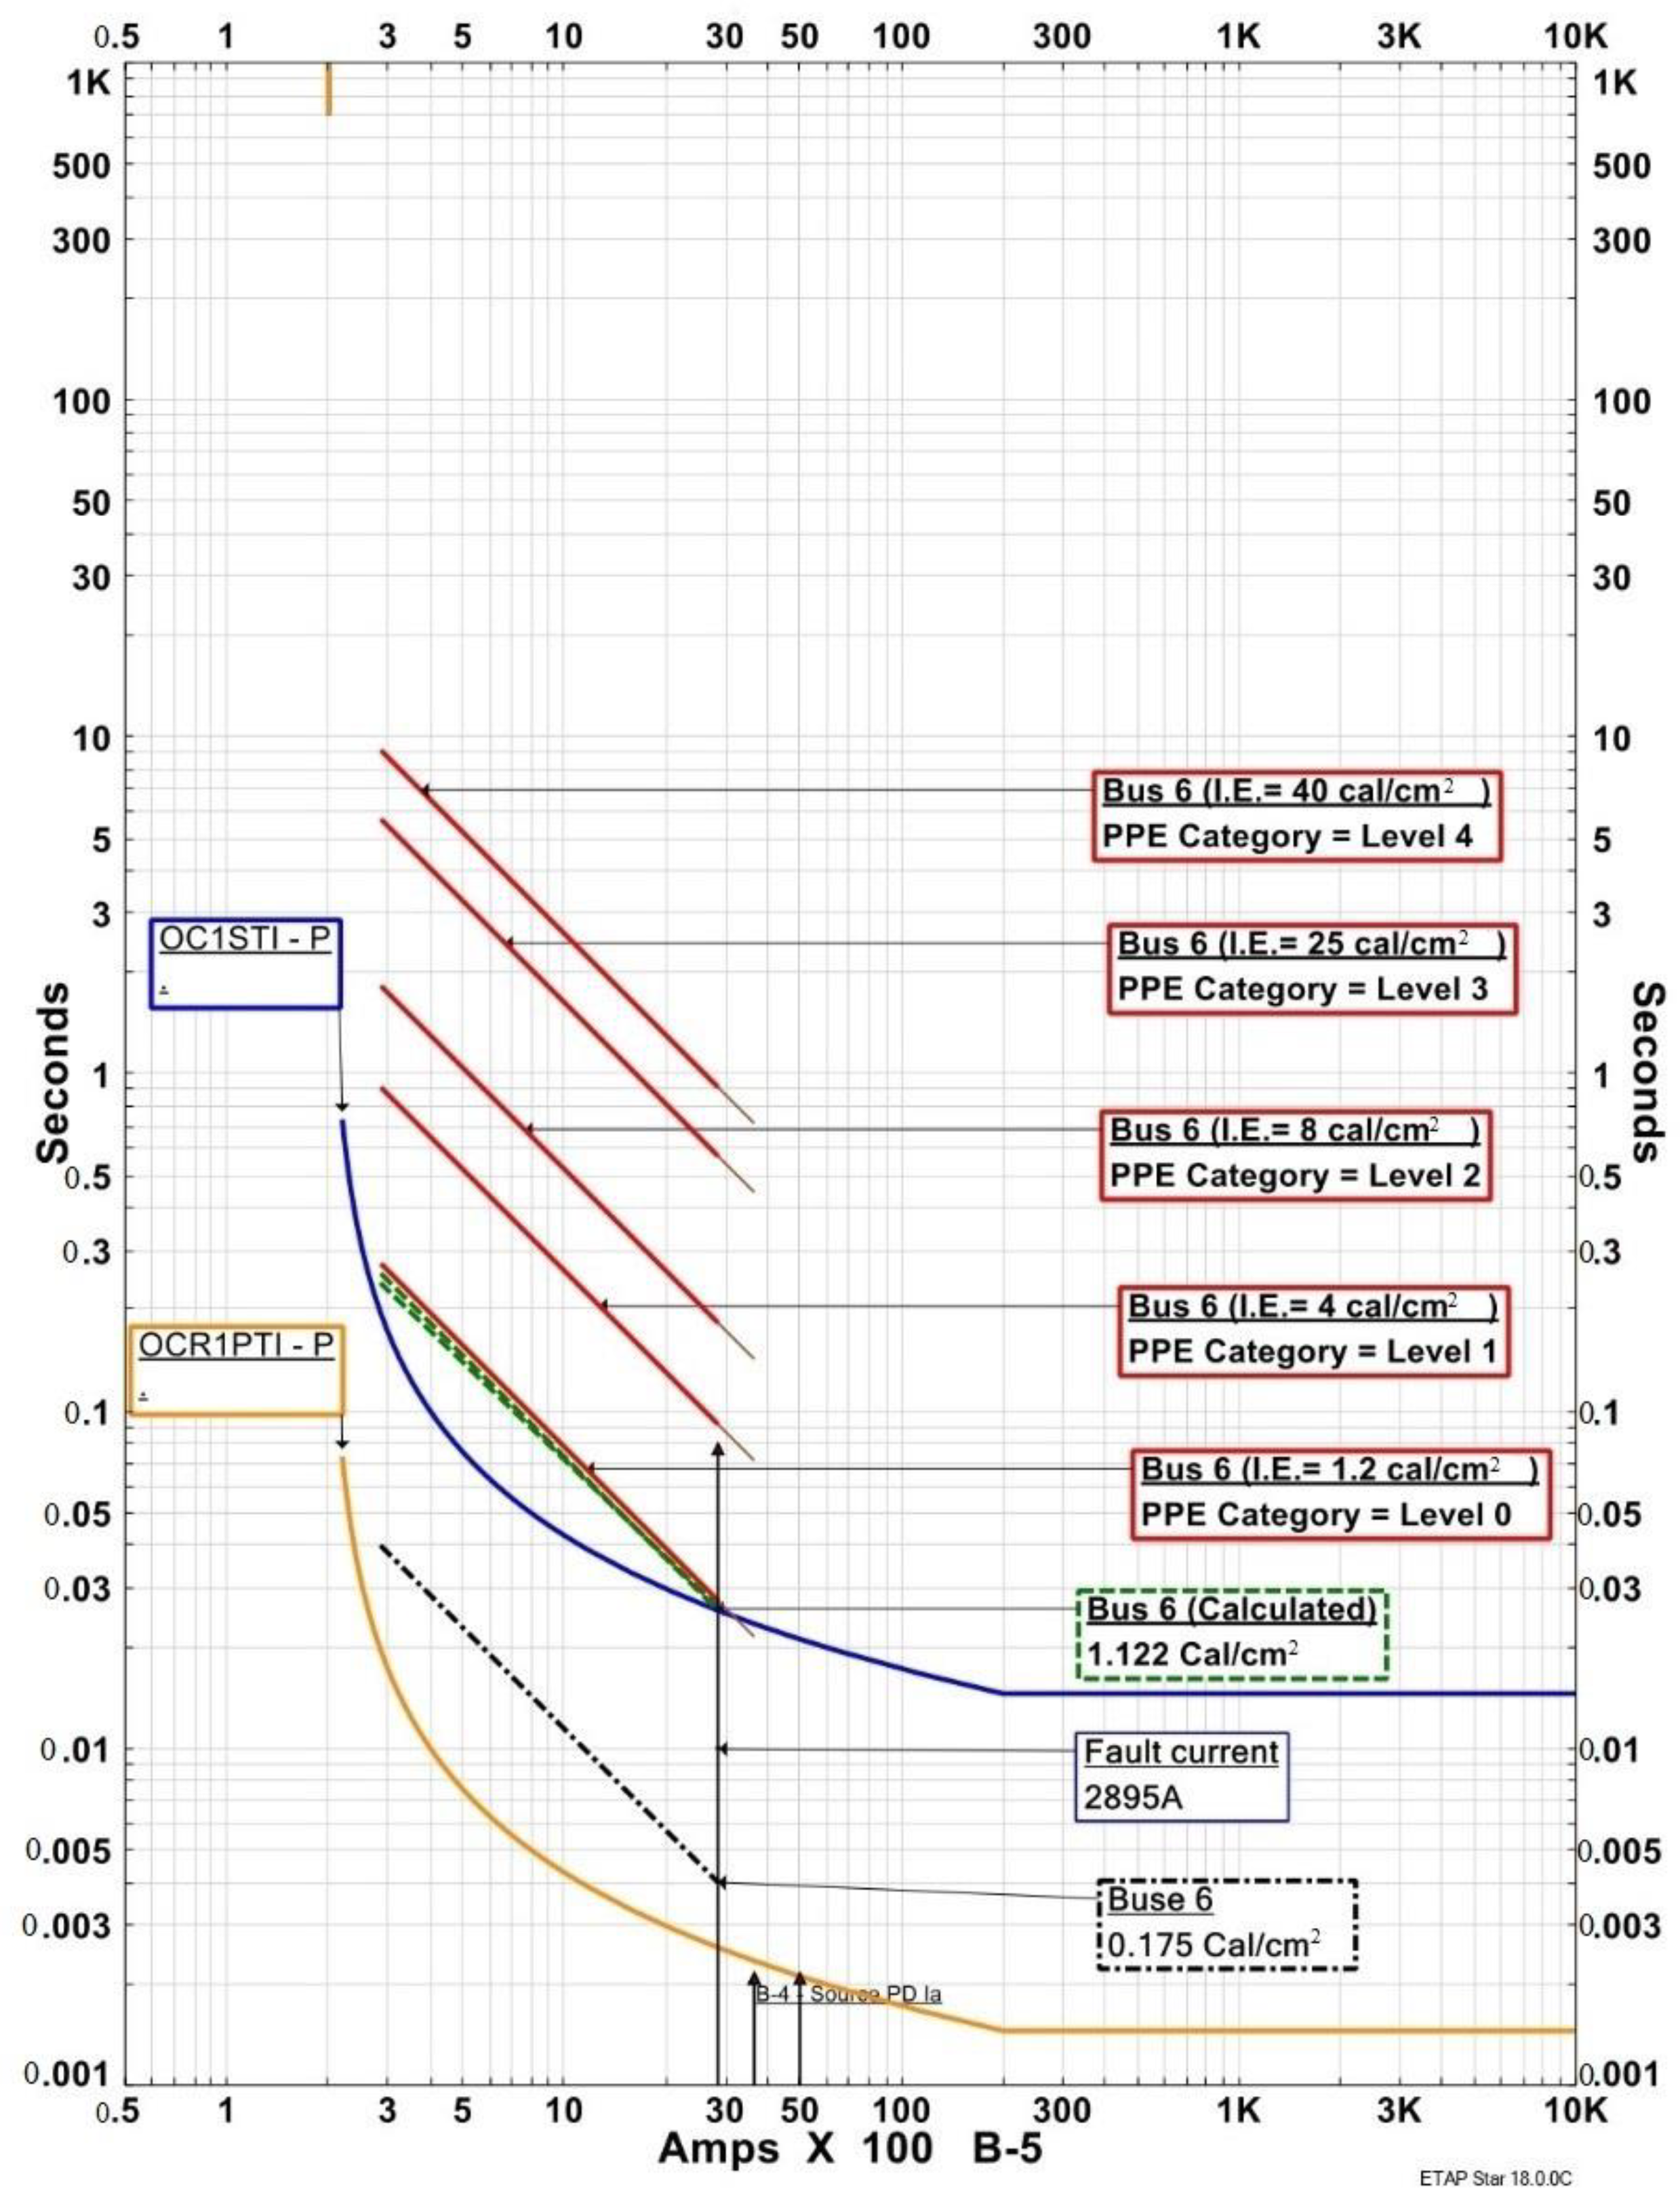
5.4. Evaluation Using the ETAP Software

This section aims to evaluate the proposed POSH and conventional SITR approaches by using powerful industrial software, ETAP software packages. In order to determine and estimate the magnitude of accident energy of AF, a location-specific C-Line was used in ETAP and the normal TCC was considered. As previously described, the specific C-Line indicates that it can be modified within a specific region to minimize the AF energy. The proposed solution in this paper aims to determine and select the optimal C-line configuration with minimum AF energy and relay time operation that leads to optimal OCRs coordination. Figure 8 presents and shows the tripping characteristics and arc energy level outlined by the IEEE Standard 1584TM-2002 for primary OCR (R1). In Figure 8, the lowest line for AFIE category (0 to 4) is presented as the lowest constant energy with the value 1.2 Cal/ cm 2 , and this value was obtained by traditional scheme without considering the AF analysis. The proposed OCR curve (POSH) recorded the lowest value of energy with 0.175 Cal/ cm 2 . In addition, the SITR approach recorded a 1.12 Cal/ cm 2 , which is lower than that of the traditional AFIE category scheme, as shown in Figure 8.

6. Conclusions

In general, AF events generate dangerous level of heat, energy, radiation, and pressure which can cause a human injuries and equipment damage. High-speed arc-flash detection can significantly reduce the energy level and lower the electrical hazard risk, saving lives, minimizing equipment damage, and maintaining process continuity. In this work, a complex OC relays coordination problem for a microgrid network with DGs considering the AF events was tested and investigated. This presented two approaches to achieve the minimum overall operation time for all relays in IEC microgrid. The proposed POSH and conventional SITR schemes using the WCOM optimization algorithm were tested and compared over different network operation scenarios. The overall relays operational time and overall incident energy were significantly decreased by using the proposed POSH approach compared to the conventional SITR approach. In addition, ETAP implementation and results show a reduction in arc-flash incidences that demonstrate the effectiveness of the proposed approach. Furthermore, they provide some significant insights into industry representations of prospective AF impact. In this paper, a typical industrial relay is used as an example of how to implement this proposed scheme. Finally, ETAP results quantify the levels to which the proposed approach reduces arc-flash energy and its impact on safety. Certainly, the addition of arc-flash analysis improves overcurrent coordination when compared to the traditional methodologies

Author Contributions

Conceptualization, F.A., S.M.S. and N.E.-N.; methodology, A.E., F.A., S.M.S. and N.E.-N.; software, S.M.S. and N.E.-N.; validation, A.E., F.A., S.M.S. and N.E.-N.; formal analysis, A.L., T.H., F.A.M.; investigation, F.A., S.M.S. and N.E.-N.; resources, all authors; data curation, all authors; writing—original draft preparation, F.A., S.M.S. and N.E.-N.; writing—review and editing, all authors; visualization, all authors; supervision, all authors; project administration, F.A., S.M.S. and N.E.-N. All authors have read and agreed to the published version of the manuscript.

Funding

This research received no external funding.

Institutional Review Board Statement

Not applicable.

Informed Consent Statement

Not applicable.

Data Availability Statement

Not applicable.

Acknowledgments

We would like to thank the Renewable Energy, Water, and the Environment Center at The Hashemite University for their support.

Conflicts of Interest

The authors declare no conflict of interest.

Abbreviation

The following abbreviation are used in this article:
DGDistribution Generations
DNDistribution Network
AFArc Flash
WCOMWater Cycle Optimization Method
OCROvercurrent Relay
PPEPersonal Protective Equipment
CTICoordination Time Interval
TCCTime–Current Characteristic
AFIEArc Flash Incident Energy
CMSCurrent Multiplying Setting
TMSTime Multiplying Setting
OFObjective Function
OOTOverall Operational Time
PSPlug Setting
SIStandard Inverse
C f Estimation variable
E n normalized of AFIE
W D Operating distance
z 1 and z 2 Configuration factor based on the grounded systems
I arc Arcing current
G p Gap distance between conductors
I f Three-phase short circuit current
t j , k Tripping time of relay j at short-circuit current location k
WWeight factor
t min Lowest tripping time
t max Highest tripping time
C M S m i n   Minimum CMS
CMS max Maximum CMS
TMS min Minimum TMS
TMS max Maximum TMS
PS min Minimum PS
PS max Maximum PS

References

  1. Georgilakis, S.; Hatziargyriou, D. Optimal distributed generation placement in power distribution networks: Models, methods, and future research. IEEE Trans. Power Syst. 2013, 28, 3420–3428. [Google Scholar] [CrossRef]
  2. Alasali, F.; Nusair, K.; Obeidat, A.M.; Foudeh, H.; Holderbaum, W. An analysis of optimal power flow strategies for a power network incorporating stochastic renewable energy resources. Int. Trans. Electr. Energy Syst. 2021, 31, e13060. [Google Scholar] [CrossRef]
  3. Sen, S.; Kumar, V. Microgrid control: A comprehensive survey. Annu. Rev. Control 2018, 45, 118–151. [Google Scholar] [CrossRef]
  4. Nikkhajoei, H.; Lasseter, H. Distributed generation interface to the certs microgrid. IEEE Trans. Power Deliv. 2009, 24, 1598–1608. [Google Scholar] [CrossRef]
  5. Baziar, A.; Kavousi-Fard, A. Considering uncertainty in the optimal energy management of renewable micro-grids including storage devices. Renew. Energy 2013, 59, 158–166. [Google Scholar] [CrossRef]
  6. Nusair, K.; Alasali, F. Optimal Power Flow Management System for a Power Network with Stochastic Renewable Energy Resources using Golden Ratio Optimization Method. Energies 2020, 13, 3671. [Google Scholar] [CrossRef]
  7. Pietrosanti, S.; Alasali, F.; Holderbaum, W. Power management system for RTG crane using fuzzy logic controller. Sustain. Energy Technol. Assess. 2020, 37, 100639. [Google Scholar] [CrossRef]
  8. Zamani, A.; Yazdani, A.; Sidhu, S. A communication-assisted protection strategy for inverter-based medium-voltage microgrids. IEEE Trans. Smart Grid 2012, 3, 2088–2099. [Google Scholar] [CrossRef]
  9. Mirsaeidi, S.; Said, M.; Mustafa, W.; Habibuddin, H.; Ghaffari, K. Progress and problems in micro-grid protection schemes. Renew. Sustain. Energy Rev. 2014, 37, 834–839. [Google Scholar] [CrossRef]
  10. Alasali, F.; El-Naily, N.; Zarour, E.; Saad, S.M. Highly sensitive and fast microgrid protection using optimal coordination scheme and nonstandard tripping characteristics. Int. J. Electr. Power Energy Syst. 2021, 128, 106756. [Google Scholar] [CrossRef]
  11. Kamel, R.M.; Chaouachi, A.; Nagasaka, K. Comparison the Performances of Three Earthing Systems for Micro-Grid Protection during the Grid Connected Mode. Smart Grid Renew. Energy 2011, 02, 206–215. [Google Scholar] [CrossRef] [Green Version]
  12. Neitzel, D.K. Electrical safety by design and maintenance. In Proceedings of the 2016 IEEE Pulp, Paper & Forest Industries Conference (PPFIC), Austin, TX, USA, 19–23 June 2016; Volume 550, pp. 6–13. [Google Scholar] [CrossRef]
  13. Lee, W.-J.; Gammon, T.; Zhang, Z.; Johnson, B.; Vogel, S. IEEE/NFPA Collaboration on Arc Flash Phenomena Research Project. IEEE Power Energy Mag. 2012, 10, 116–123. [Google Scholar] [CrossRef]
  14. Doan, R.; Sweigart, A. A summary of arc-flash energy calculations. IEEE Trans. Ind. Appl. 2003, 39, 1200–1204. [Google Scholar] [CrossRef]
  15. Kou, G.; Deverick, J.; Phelps, K.; Nguyen, T.; Velez-Cedeno, F.G. Impact of Distributed Energy Resources on Arc Flash Incident Energy. IEEE Trans. Power Deliv. 2019, 35, 531–539. [Google Scholar] [CrossRef]
  16. Chang, K. Mitigation of high energy arcing faults in nuclear power plant medium voltage switchgear. Nucl. Eng. Technol. 2019, 51, 317–324. [Google Scholar] [CrossRef]
  17. Parsons, A.; Gray, J. Living with arc flash mitigation. In Proceedings of the IEEE/IAS 53rd Industrial and Commercial Power Systems Technical Conference, Niagara Falls, ON, Canada, 6–11 May 2017; pp. 1–9. [Google Scholar]
  18. Paul, S.; Jewell, W. Optimization Methodology for Minimizing the Arc Flash Incident Energy. In Proceedings of the 2018 IEEE Industry Applications Society Annual Meeting (IAS), Portland, OR, USA, 23–27 September 2018; pp. 1–6. [Google Scholar] [CrossRef]
  19. El-Fergany, A. Optimal directional digital overcurrent relays coordination and arc-flash hazard assessments in meshed networks. Int. Trans. Electr. Energy Syst. 2015, 26, 134–154. [Google Scholar] [CrossRef]
  20. Ventruella, J. Arc flash hazard when overestimating under estimates a problem. IEEE Trans. Ind. Appl. 2019, 55, 3287–3293. [Google Scholar] [CrossRef]
  21. Zhang, Z.; Wang, P.; Rau, H.; Lee, J. Effect of electrode geometry on arc flash protection boundary. IEEE Trans. Ind. Appl. 2019, 56, 57–64. [Google Scholar] [CrossRef]
  22. Majd, A.; Luo, R.; Devadass, M.A.; Phillips, J. Comprehensive Overview and Comparison of ANSI Versus IEC Short-Circuit Calculations: Using IEC Short-Circuit Results in IEEE 1584 Arc Flash Calculations. IEEE Trans. Ind. Appl. 2019, 55, 5487–5493. [Google Scholar] [CrossRef]
  23. Majd, A.; Luo, R. An Improved Arc Flash Energy Calculation Method and Its Application. IEEE Trans. Ind. Appl. 2017, 53, 5062–5067. [Google Scholar] [CrossRef]
  24. Parsons, C.; Leuschner, B.; Jiang, X. Simplified arc-flash hazard analysis using energy boundary curves. IEEE Trans. Ind. Appl. 2008, 44, 1879–1885. [Google Scholar] [CrossRef]
  25. Gammon, T.; Saporita, V. Current-Limiting Fuses: New NFPA 70-2017 Section 240.67, Arc Modeling, and an Assessment Based on the IEEE 1584-2002. IEEE Trans. Ind. Appl. 2016, 53, 608–614. [Google Scholar] [CrossRef]
  26. Prigmore, J.; Schaffer, S. Triggered current limiters their arc flash mitigation and damage limitation capabilities. IEEE Trans. Power Deliv. 2016, 32, 1114–1122. [Google Scholar] [CrossRef]
  27. Olsen, A. Incorporating NFPA 70E at A Utility. In Proceedings of the 2018 IEEE IAS Electrical Safety Workshop (ESW), Fort Worth, TX, USA, 19–23 March 2018; pp. 1–5. [Google Scholar] [CrossRef]
  28. Parikh, P.; Allcock, D.; Luna, R.; Vico, J. A Novel Approach for Arc-Flash Detection and Mitigation: At the Speed of Light and Sound. IEEE Trans. Ind. Appl. 2013, 50, 1496–1502. [Google Scholar] [CrossRef]
  29. Catlett, R.; Lang, M.; Scala, S. Considerations for the Application of an MV High-Speed Grounding Switch for Arc Flash Mitigation of LV Equipment. IEEE Trans. Ind. Appl. 2016, 53, 1709–1716. [Google Scholar] [CrossRef]
  30. Divinnie, D.; Stacy, K.; Parsons, C. Arc flash mitigation using active high-speed switching. IEEE Trans. Ind. Appl. 2014, 51, 28–35. [Google Scholar] [CrossRef]
  31. Catlett, R.; Martin, D.; Wilson, R.A. Improving Relay Protection Levels in Medium-Voltage Switchgear. IEEE Trans. Ind. Appl. 2013, 50, 1630–1638. [Google Scholar] [CrossRef]
  32. Lutz, R.; Charbonneau, M.; Garcia, M. A graphical approach to incident energy analysis. IEEE Trans. Ind. Appl. 2017, 1–6. [Google Scholar] [CrossRef]
  33. Simms, J.; Johnson, G. Protective Relaying Methods for Reducing Arc Flash Energy. IEEE Trans. Ind. Appl. 2013, 49, 803–813. [Google Scholar] [CrossRef]
  34. Saad, S.M.; El Naily, N.; Elhaffar, A.; Hussein, T.; Mohamed, F.A. Time-Current-Voltage Overcurrent Scheme for Reliable Microgrids Protection Considering Arc Flash Incident Energy. In Proceedings of the 11th International Renewable Energy Congress (IREC 2020), Hammamet, Tunisia, 29–31 October 2020; pp. 1–6. [Google Scholar] [CrossRef]
  35. Marroquin, A.; Parsons, A. Application of Incident Energy Reference Boundary Area Plots in TCCS Considering IEEE 1584-2018 Input Parameter Variability. IEEE Trans. Ind. Appl. 2019, 369–380. [Google Scholar] [CrossRef]
  36. Das, J. Arc Flash Hazard Analysis and Mitigation; John Wiley & Sons: Hoboken, NJ, USA, 2012. [Google Scholar]
  37. Mohajeryami, S.; Arefi, M.; Salami, Z. Arc flash analysis: Investigation, simulation and sensitive parameter exploration. In Proceedings of the 2017 North American Power Symposium (NAPS), Morgantown, WV, USA, 17–19 September 2017; pp. 1–6. [Google Scholar] [CrossRef]
  38. Sutherland, P.E. Arc Flash and Coordination Study Conflict in an Older Industrial Plant. IEEE Ind. Appl. Annu. Meet. 2007, 2133–2138. [Google Scholar] [CrossRef]
  39. Walker, G. Arc-Flash energy reduction techniques: Zone-Selective interlocking and energy-reducing maintenance switching. IEEE Trans. Ind. Appl. 2013, 49, 814–824. [Google Scholar] [CrossRef]
  40. El-Naily, N.; Saad, S.M.; Mohamed, F.A. Novel approach for optimum coordination of overcurrent relays to enhance microgrid earth fault protection scheme. Sustain. Cities Soc. 2019, 54, 102006. [Google Scholar] [CrossRef]
  41. El Naily, N.; Saad, S.M.; El Misslati, M.M.; Mohamed, F.A. Optimal Protection Coordination for IEC Microgrid Benchmark Using Water Cycle Algorithm. In Proceedings of the 10th International Renewable Energy Congress (IREC), Sousse, Tunisia, 23–25 October 2019; pp. 1–6. [Google Scholar] [CrossRef]
  42. Tjahjono, A.; Anggriawan, D.O.; Faizin, A.K.; Priyadi, A.; Pujiantara, M.; Taufik, T.; Purnomo, M.H. Adaptive modified firefly algorithm for optimal coordination of overcurrent relays. IET Gener. Transm. Distrib. 2017, 11, 2575–2585. [Google Scholar] [CrossRef]
  43. Eskandar, H.; Sadollah, A.; Bahreininejad, A.; Hamdi, M. Water cycle algorithm–a novel metaheuristic optimization method for solving constrained engineering optimization problems. Comput. Struct. 2012, 110, 151–166. [Google Scholar] [CrossRef]
  44. Sadollah, A.; Eskandar, H.; Kim, J.H. Water cycle algorithm for solving constrained multi-objective optimization problems. Appl. Soft Comput. 2015, 27, 279–298. [Google Scholar] [CrossRef]
  45. Coleman, T.; Branch, M.; Grace, A. Optimization Toolbox, For Use with MATLAB. User’s Guide for MATLAB 5; Version 2; Relaese II; The MathWorks Inc.: Natica, MA, USA, 1990. [Google Scholar]
  46. Kar, S. A comprehensive protection scheme for micro-grid using fuzzy rule base approach. Energy Syst. 2016, 8, 449–464. [Google Scholar] [CrossRef]
Figure 1. The OCR characteristics and AFIE categories in DN with and without DG.
Energies 14 08074 g001
Figure 2. The proposed relay coordination strategy based on OCR characteristics and AFIE categories.
Energies 14 08074 g002
Figure 3. The process and work-flow of the proposed protection scheme (POSH)for OCRs considering AFIE.
Energies 14 08074 g003
Figure 4. The benchmark IEC microgrid.
Energies 14 08074 g004
Figure 5. Overall operational time comparison of Mode 1 (blue) and Mode 2 (red).
Energies 14 08074 g005
Figure 6. The AFIE during the microgrid operation modes (Mode 1 and Mode 2).
Energies 14 08074 g006
Figure 7. Convergence curves of the proposed WCOM and PSO optimization algorithms for (a) SITR, Mode 1; (b) POSH, Mode 1; (c) SITR, Mode 2; (d) POSH, Mode 2.
Energies 14 08074 g007aEnergies 14 08074 g007b
Figure 8. The industrial software analysis (ETAP) for R1 during under Mode 1 operation scenario.
Energies 14 08074 g008
Table 1. The main parameters of the WCOM.
ParametersValue
The maximum number of Iteration1000
Number of populations50
The constant of evaporation condition 1 × 10 5
Number of stream and sea4
Table 2. The OCR parameters (CTR, PS, and IPP) in the proposed microgrid.
RelayCTRPSIPP (A)
R1400/10.5200
R2400/10.5200
R3400/10.5200
R41200/10.961152
R5300/10.83249
R6400/10.35140
Table 3. The short-circuit currents values, PS, and CMS setting for IEC network with DG.
Fault
Location
Fault
Current (A)
CTPSCMSRelay
F14550400/10.522.75R1
F14550400/10.522.75R2
F25130400/10.525.65R2
F25130400/10.525.65R3
F38380400/10.541.9R3
F383801200/10.967.274306R4
F483801200/10.967.274306R4
F41790300/10.837.188755R5
F55130400/10.525.65R6
F55130400/10.525.65R3
Table 4. The short-circuit currents values, PS, and CMS setting for IEC network without DG.
Fault
Location
Fault
Current (A)
CTPSCMSRelay
F12890400/10.514.45R1
F12890400/10.514.45R2
F23695400/10.518.475R2
F23695400/10.518.475R3
F35130400/10.525.65R3
F351301200/10.964.453125R4
F483801200/10.967.274306R4
F48380300/10.8333.65462R5
F53695400/10.518.475R6
F53695400/10.518.475R3
Table 5. The TMS and overall relays operational time (OOT) for all relays.
RelayMode 1Mode 2
SITR (TMS)POSH (TMS)SITR (TMS)POSH (TMS)
R10.010.010.010.01
R20.1270.1450.1470.153
R30.25620.1850.2920.199
R40.18050.090.2390.096
R50.48010.220.3260.223
R60.38461.7060.4361.85
OOT5.682.5656.12.613
Table 6. The results of SITR and POSH approaches in term of (FCT, AFIE, AF, and EL) in Mode 1.
RelaySITRPOSH
FCTAFIEAFBELFCTAFIEAFBEL
R10.0231.3123.1410.030.1681.120
R20.26620.7512.530.043.1234.841
R30.46252.7921.12 < 40.078.978.223
R40.62379.8624.52 < 40.112.8269.863
R51.17195.551.15 > 41.1829.9920.034
R60.16312.749.7930.021.563.421
Table 7. The results of SITR and POSH approaches in term of (FCT, AFIE, AF, and EL) in Mode 2.
RelaySITRPOSH
FCTAFIEAFBELFCTAFIEAFBEL
R10.0221.53.3610.030.2071.2490
R20.2837.1916.7340.4230.4231.7850
R30.52780.3924.6 > 415.2515.2510.713
R40.827126.0830.81 > 420.7420.7412.493
R51.14203.6852.2 > 431.931.920.664
R60.2837.1916.7340.4230.4231.7850
Table 8. The results of WCOM and PSO algorithms in OOT and elapsed time in Mode 1 and 2.
RelayMode 1Mode 2
SITR (TMS)POSH (TMS)SITR (TMS)POSH (TMS)
WCOMPSOWCOMPSOWCOMPSOWCOMPSO
R10.010.010.010.010.010.010.010.01
R20.1270.1280.1450.1470.1470.1480.1530.155
R30.25620.2620.1850.190.2920.2950.1990.2
R40.18050.1810.090.090.2390.2400.0960.099
R50.48010.4850.220.2250.3260.330.2230.23
R60.38460.3861.7061.70.4360.441.851.9
OOT (s)5.685.742.5652.666.16.212.6132.7
Elapsed time (s)4.377.394.445.424.225.334.225.77
Publisher’s Note: MDPI stays neutral with regard to jurisdictional claims in published maps and institutional affiliations.

