Article

Application of Artificial Intelligence Technologies to Assess the Quality of Structures

by
Anton Zhilenkov
1,
Sergei Chernyi
1,2,3,* and
Vitalii Emelianov
4
1
Department of Cyber-Physical Systems, St. Petersburg State Marine Technical University, 190121 Saint-Petersburg, Russia
2
Complex Information Security Department, Admiral Makarov State University of Maritime and Inland Shipping, 198035 Saint-Petersburg, Russia
3
Department of Ship’s Electrical Equipment and Automatization, Kerch State Maritime Technological University, 298309 Kerch, Russia
4
Financial University under the Government of the Russian Federation, 49 Leningradsky Prospekt, 125993 Moscow, Russia
*
Author to whom correspondence should be addressed.
Energies 2021, 14(23), 8040; https://doi.org/10.3390/en14238040
Submission received: 16 October 2021 / Revised: 13 November 2021 / Accepted: 30 November 2021 / Published: 1 December 2021
(This article belongs to the Special Issue Advanced Cyber-Physical System for Engines and Power System)

Abstract

:
The timeliness of the complex automated diagnostics of the metal condition for all characteristics has been substantiated. An algorithm for the automation of metallographic quality control of metals is proposed and described. It is based on the use of neural networks for recognizing images of metal microstructures and a precedent method for determining the metal grade. An approach to preliminarily process the images of metal microstructures is described. The structure of a neural network has been developed to determine the quantitative characteristics of metals. The results of the functioning of neural networks for determining the quantitative characteristics of metals are presented. The high accuracy of determining the characteristics of metals using neural networks is shown. Software has been developed for the automated recognition of images of metal microstructures, and for the determination of the metal grade. Comparative results of carrying out metallographic analysis with the developed tools are demonstrated. As a result, there is a significant reduction in the time required for analyzing metallographic images, as well as an increase in the accuracy of determining the quantitative characteristics of metals. The study of this problem is important not only in the metallurgical industry, but also in production, the maritime industry, and other engineering fields.

1. Introduction

The level of industrial development of leading countries in modern times is characterized not only by the overall production and the range of products, but also by indicators of their quality. In order to improve the quality of products, industrial enterprises are constantly increasing the amount of control and diagnostics operations, as well as the number of monitoring personnel. An important means of solving this problem is the use of objective physical methods for diagnosing the state of objects, such as non-destructive methods and metallographic analysis [1]. The constant increase in requirements for the quality of ferrous metals of different groups and classes necessitates the development of models and tools for automated diagnostics of the state of metals and product quality. It should be noted that traditional methods of non-destructive testing are unsuitable for determining defects at an early stage of their development. Scientists in [2] noted that classical flaw detection methods are not enough to determine the residual life, since they detect already developed defects, while metallography allows detecting defects at an early stage—the stage of formation.
Moreover, to output high-quality products, the study of the properties of industrial metal materials, and the use of the latest methods of their control and research are of particular importance. One of the methods of quality control of alloy and metal products is the metallographic method [3], which is introduced into a number of existing standards.

2. Related Works

Among the most significant works in the field of automation of diagnostics of the metals state and metallographic analysis, performed earlier by other authors, one can single out papers [4,5,6,7,8], as well as a software development by companies such as SPECTR MET, SIAMS, DeepLab, andVideoTest, considered to be “New expert systems”. Scientists in the papers [9] have developed recommendations for the automation of metallographic quality control, which speaks of the need to use software image analyzers when processing the metal microstructure. The insufficient level of automation of the central factory laboratories of industrial enterprises is high-lighted as well.
Since the metallographic analysis is based on the acquisition and interpretation of images of metal microstructures, it is urgent to develop new methods for processing metallographic images, which make it possible to increase the efficiency and the performance of determining the quantitative characteristics of metals, as well as methods that allow diagnosing the state of the metal for all characteristics. One of the most promising methods for solving this problem is the use of neural networks.
Authors in [10] resort to CNN-based segmentation methods, and achieve significant performance to recognize metallographic images. Fully Convolution Networks (FCNs) have shown a lot of promise towards semantic segmentation [11]. In [12], a fully convolutional neural network to segment the steels microstructure was proposed. In paper [13], the DeepLab network was used for metallographic images segmentation. In paper [14], a neuronal network-based method was proposed for automatic segmentation of nickel alloy secondary phases from SEM images. These methods achieved satisfactory results, but they fail to work well on the devices due to limited computation resources and being too heavy to apply in real-time application.
However, the developed tools do not solve the problems of complex automated diagnostics of the state of metals for all characteristics (chemical composition, structure, properties), and the methods considered in them allow only quantitative metallographic analysis. Thus, there is a need to improve automatic tools and information support for metallographic analysis to automate of diagnostics of the metals state for all characteristics.

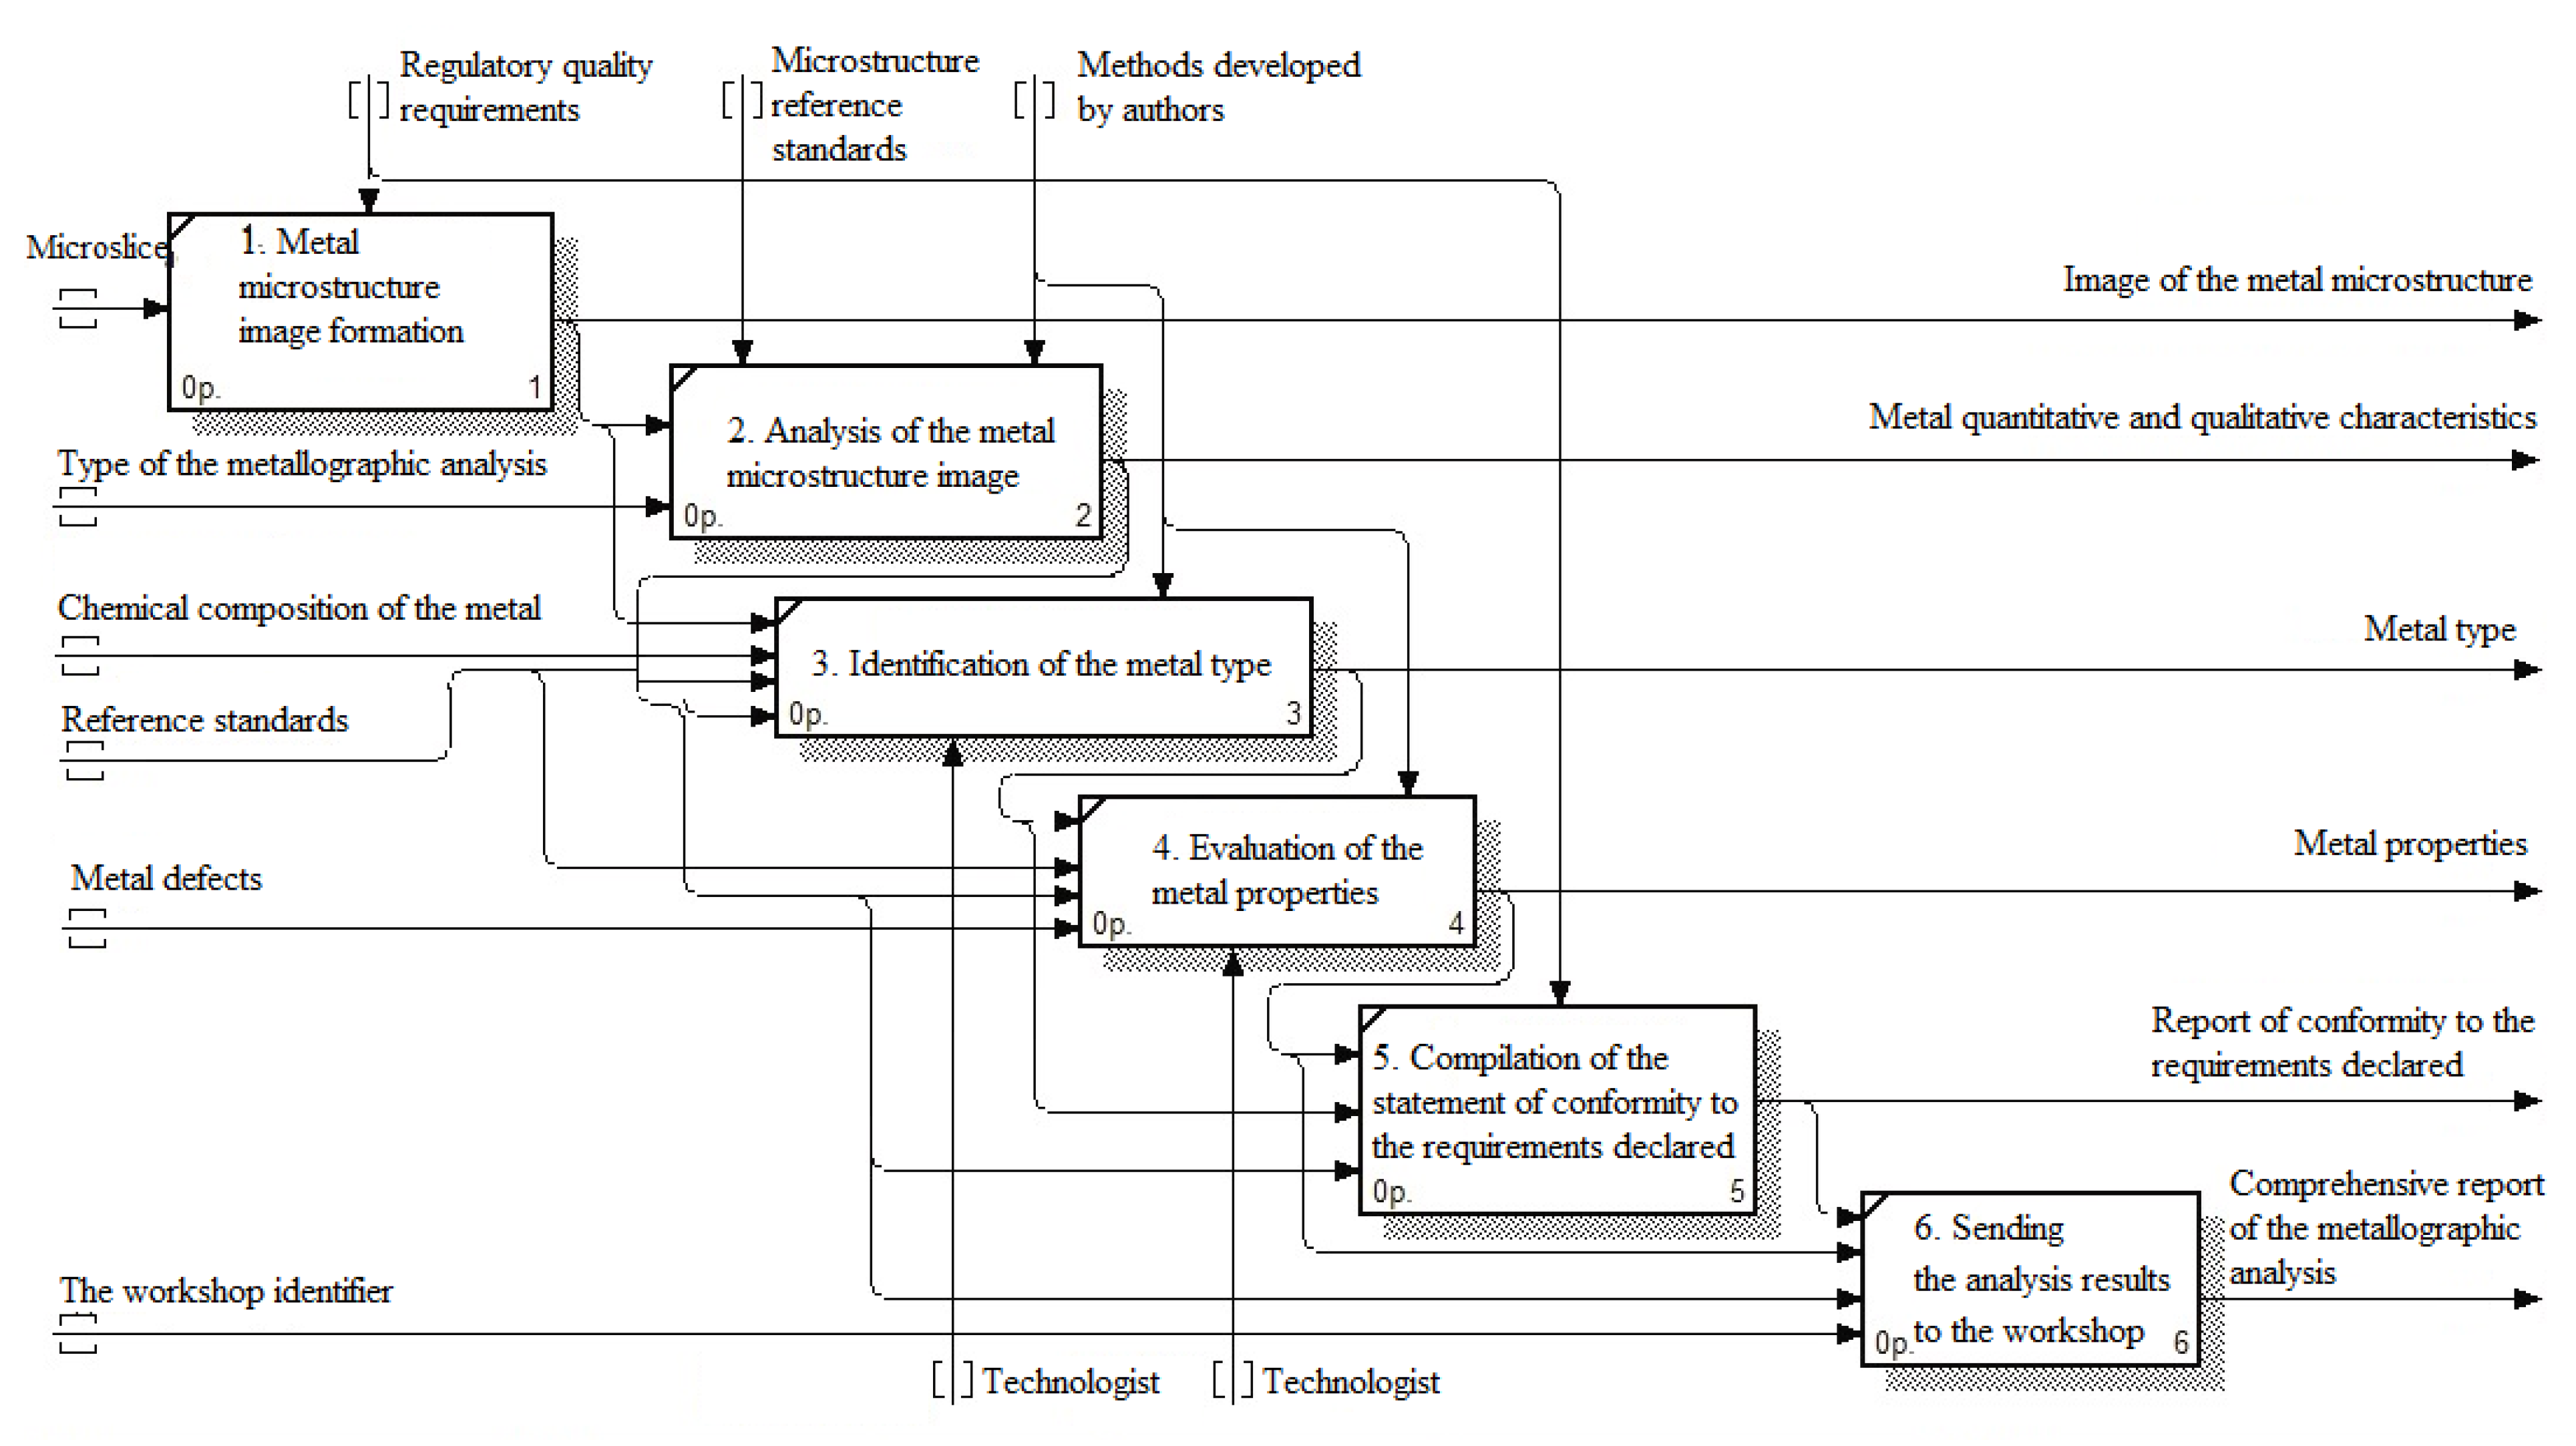
3. Algorithm for Automating Metallographic Quality Control of Metals

Classical metallographic analysis is the definition of a list of parameters I characterizing the image of the metal microstructure, which can be considered as an informational description, presented in the form:
I i = { f i ( x , y ) , m r i , E i ( ) , N i ( ) , Q i ( ) } , i = 1 , 2 n , ,
where f i ( x , y ) is i-th image of the microstructure of the metal sample under examination;
m r i is the metal grade (for example: steel 10ChSND(S420N));
E i ( ) is the expert resolution about the metal sample under examination;
N i ( ) is the set of quantitative characteristics of metal;
Q i ( ) is a set of quality characteristics of the metal.
This paper proposes an algorithm for the automation of metallographic quality control of metals in production, the implementation of which makes it possible to obtain the required sets of quantitative (N) and qualitative characteristics (Q) of diagnosed metals. The main stages of the algorithm are as follows:
Step 1.
Formation of an image of the metal microstructure in digital form f(x,y).
Step 2.
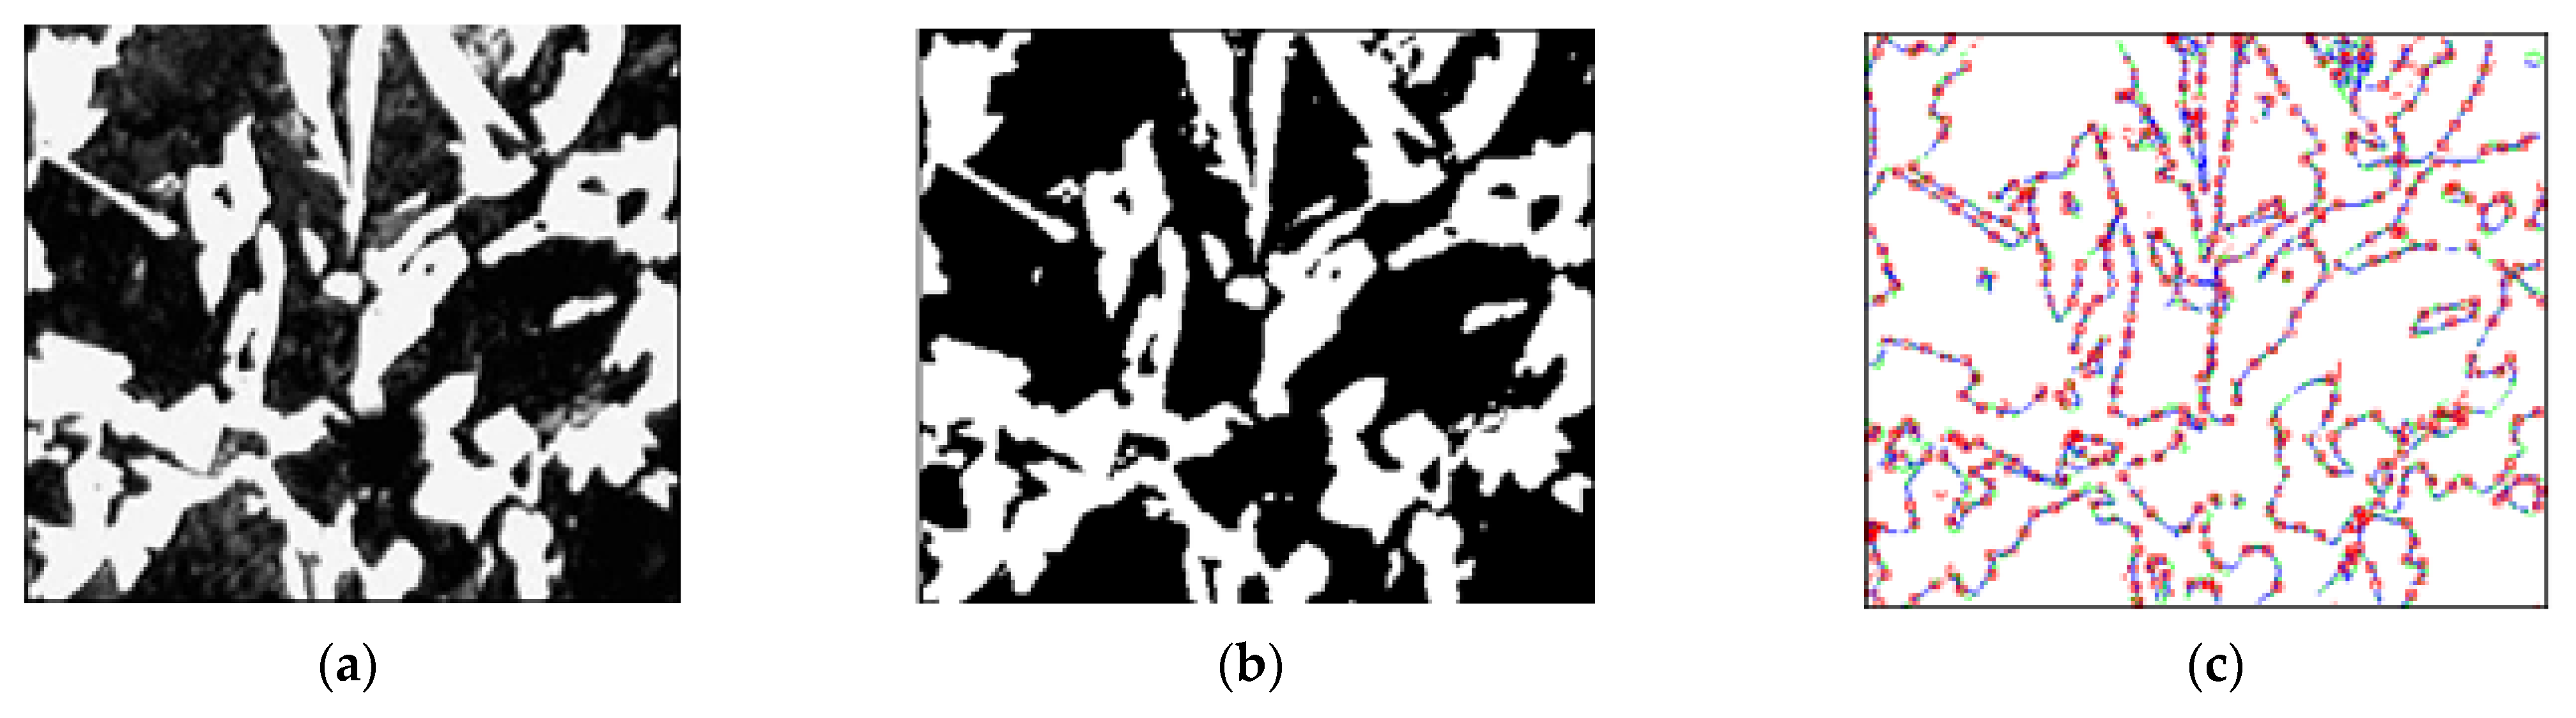
The image of the metal microstructure is analyzed. At the second stage, preliminary processing and analysis of the image of the metal microstructure is carried out. Many quantitative characteristics of the metal under study are formed, as well as many of its qualitative characteristics:
N = < g f , c f , p h f , t p f , v f > ,
Q = < m f , m v [ ] > .
Step 3.
The definition of the metal grade is performed. At the third stage, based on the chemical composition of the metal and the obtained quantitative characteristics, the metal grade mr is determined.
Step 4.
The determination of the properties of the metal is performed based on the sets of its characteristics N, Q, and existing defects.
Step 5.
A conclusion on the metal for compliance with the requirements is formed, and the group of metal use is determined
E = < r f , g r o u p >
Step 6.
Sending the result of metallographic analysis to the workshop for further decision-making.
IDEF0- the diagram showing the stages of the algorithm is presented in Figure 1.
Let us consider these stages in more details.
At the first stage, a digital image of the metal microstructure is formed using a metallographic microscope. After the image is formed, binarization of the image of the metal microstructure is performed. For binarization, it is proposed that Otsu’s method [15] is used (determination of the optimal threshold). The choice of Otsu’s method is due to the fact that this method is the most effective of the methods of global binarization [15]. For further processing of the image of the microstructure of the metal, it is necessary to determine the informative features of the image of the microstructure, which will make it possible to characterize both individual areas and the image of the image of the microstructure of the metal as a whole.
As is known in [15], from the point of view of recognition and analysis of objects in the image, the most informative ones are the characteristics of their boundaries, i.e., contours rather than the values of the brightness of objects. The selection of contours consists in the construction of an image of precisely the boundaries of objects and outlines of homogeneous regions using the Prewitt filter, as is shown in [16]. An example of preprocessing (vectorization) of a metal microstructure image according to the described algorithm is shown in Figure 2.
After fixing the base points on the image and its vectorization, the values characterizing the image segments of the metal microstructure are determined. Segment elements are shaped by triangle hypotenuses, which are formed by perpendiculars dropped from two adjacent base points. The values of the sine and cosine of the segment elements (sin (A), cos (A)) are fed to the input of the neural network for learning. The input parameter is also the Prewitt gradient (Gp) [16], which determines the contrast value.
Subsequently, neural network processing of the received input values is performed with segmentation of the image of the metal microstructure in the hidden layer of the neural network to determine and classify the characteristics of the metal. To process the received input values, one can use multilayer neural networks (perceptron and RBF networks), which have an input layer, a hidden layer, and an output layer of neurons. The number of neurons in the input layer is calculated by multiplying by three the number of base points in the sample of metal images (since 1 base point is characterized by three parameters: sin, cos, Gp—brightness). The size of the hidden layer of the neural network is calculated by dividing the number of neurons in the input layer by three, since, in the hidden layer, the image of the metal microstructure is segmented based on the base points of the image segments. The size of the output layer is determined by the number of metal grades to be recognized.
The structure of the neural network for performing metallographic analysis to determine the grain point in the metal structure is shown in Figure 3.
To train neural networks, the backpropagation algorithm [17] with a sigmoidal activation function was chosen:
y i = 1 1 + e x i
To measure the quality of recognition, the mean-square error was calculated using the formula:
E = 1 n i = 1 n ( y i y ( k i ) ) 2 ,
where, Е is the recognition error; y i is the value of the i-th output of the network when recognizing the image of the metal microstructure; and y ( k i ) is the value of the i-th reference output of the network, which corresponds to the class of metallographic images.
The neural network was learnt on the basis of reference images of metal microstructures described in the standards. The training sample consisted of 950 images of microstructures, of which 475 images belonged the “correct” class, and 475 images to the “incorrect” class. Images belonging to the “correct” class were a set of reference metal microstructures, and the “incorrect” class implies reference images distorted by noise, which led to incorrect recognition (classification) of the image by the neural network. By dividing the training sample into two classes, the neural network was trained in incorrect recognition, i.e., responding to incorrect images. As a control sample, 450 images of metal microstructures were used.
In the research, multilayer neural networks with different structures were designed for the respective standards. For example, a multilayer perceptron for determining the grain point according to the GOST 5639-82 standard has the structure 510-170-1, i.e., 510 neurons in the input layer, 170 in the hidden layer, and 10 in the output layer. Graphs of changes in the value of learning and recognition errors for a multilayer perceptron are shown in Figure 4. As shown in Figure 4b, the error is increased when steps are more than 800. This fact is explained by the retraining process [18]. To prevent the retraining process [18], the set of microstructure images is divided into two sub-sets, namely learning and control ones. Based on the graphs of learning and classification errors, the optimal number of learning epochs was calculated to be 800 epochs for this neural network structure. In this case, the root-mean-square error was E = 0.02437. In total, 720 images of metal microstructures were used as a test sample. Of these, 224 images were recognized (classified) correctly according to GOST 5639-82.
The results of the functioning of the developed neural networks to determine the quantitative characteristics of the metal are summarized in Table 1.
At the third step of the algorithm, the grade of the metal is determined based on its chemical composition and quantitative characteristics (for example, the ratio of ferrite and perlite). Since a different set of chemical elements with a different proportion of their inclusion in the metal form different situations, the solution of which allows the metal to be attributed to a certain grade, the method of precedents was applied to solve the problem of classifying a metal grade.
Initially, a base of use cases is formed regarding metals and their chemical composition. The algorithm for forming the base of use cases includes the following phases [19]:
Phase 1. Setting feature weights to determine the significance level of a use case. The evaluation function of features is determined, which allows further selection of relevant use cases using a similarity relation built on the set of the most important features.
Therefore, it is necessary to determine the values of the weighting coefficients of the features w in such a way that the value of the evaluation function is minimal. For a given set of feature weights w j ( w j [ 0 , 1 ] , j = 1 n ) , and a couple of use cases ep and eq, expression (7) determines the weighted measure of proximity dpq(w) (it is suggested using Euclidean distance), and expression (8)—a measure of use case similarity SMpq(w).
d p q ( w ) = ( j = 1 n w i 2 ( x p j x q i ) 2 )
S M p q ( w ) = 1 1 + d p q ( w )
where x are the values of features.
The feature evaluation function is defined as follows:
E ( w ) = 2 ( p q ( q < p ) ( S M p q ( w ) ( 1 S M p q ) ( 1 S M p q ( w ) ) S M p q ) ) / ( N ( N 1 ) )
where N is the number of use cases in the use case base.
Phase 2. The next step is to cluster the use case base, as shown in [20].
Phase 3. After the initial base is divided into separate clusters, the procedure for searching for similar use cases (based on the similarity relation) is implemented. The deviation of the characteristics of the metal under study, i.e., ΔXi, is determined as:
Δ X i = X э X i ¯
By defining the utility function, the characteristics of the metal Xi are reduced to an isomorphic form. In this case, the value of the characteristics of the metal is determined using the criterion normalization formula:
X i ¯ = X i X min X max X min
where: Xi is the value of the i-th feature of the metal; Xmin is the minimum value of a metal characteristic; and Xmax is the maximum value of a metal characteristic.
After normalization, the values of all characteristics of the metal will be brought to a general form, and their value will vary in the range [0…1]. A multifactorial general estimate of the distance of the characteristics of the metal from the standard will be as follows:
L = i = 1 n a i Δ X i
where ai is weighting factors of the relevancy of individual characteristics of the metal.
Then, the principle of optimality, on the basis of which the choice of the required use case is made, will have the form:
X n o = arg x = X min i = 1 n a i Δ X i
Thus, on the basis of the similarity relation and the choice of a use case from the knowledge base about the metal, it is possible to determine its grade.
The development of use cases for determining the grade of metal is carried out by experts who work directly with the assessment of metals. The results of the functioning of the software developed by the authors, which implements the above-described algorithm for determining the metal grade, are shown in Table 2.
Thus, based on the precedent method, it becomes possible to automatically determine the grade of the metal in accordance with the known chemical composition and quantitative characteristics that define the situation to be solved.

4. Experimental Studies of the Developed Tools

To implement Stages 4, 5, and 6 of the previously proposed algorithm, the client-server software MetalNeuro was developed (Figure 5), which operates in two modes: analysis mode, and learning mode.
The functions of the MetalNeuro software in analysis mode are as follows:
(1)
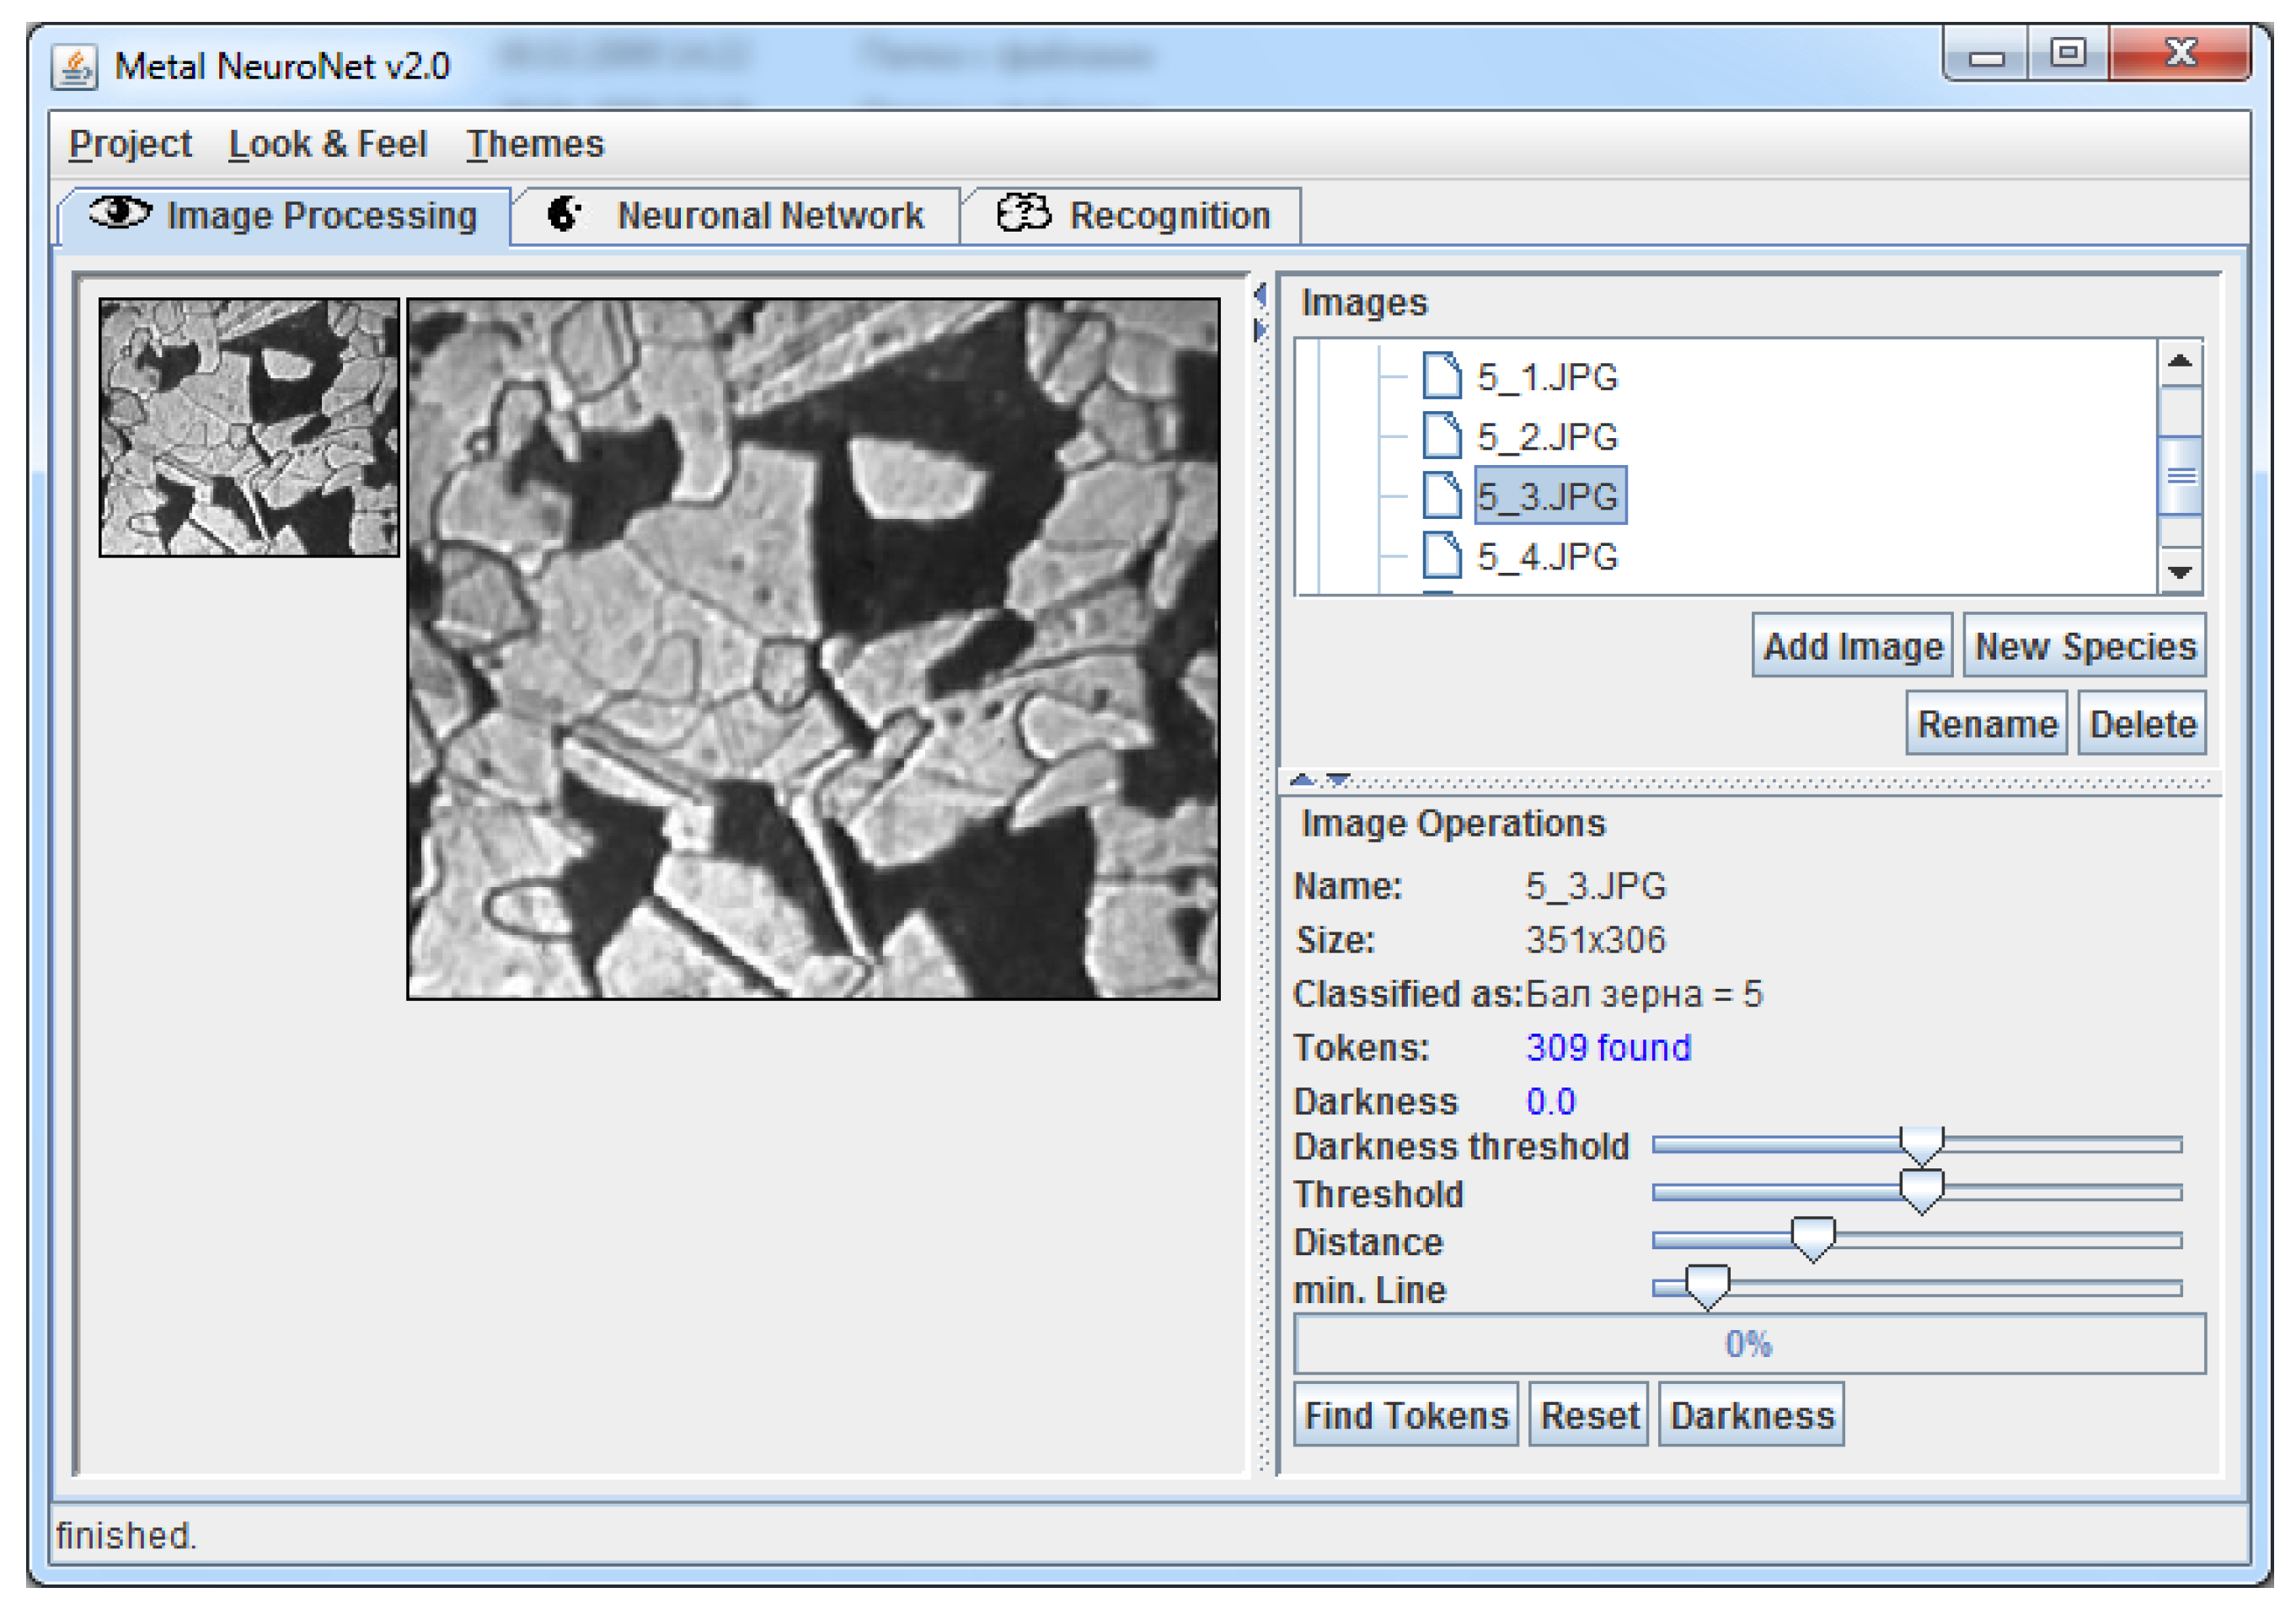
setting by the user of the type of analysis of microstructures of alloys;
(2)
input of the image of the metal microstructure;
(3)
preliminary processing of the image;
(4)
quantitative assessment of the metal;
(5)
determination of the grade and properties of the metal;
(6)
formation of a conclusion and producing recommendations regarding the analyzed metal sample;
(7)
Sending the analysis results to the workshop.
In the learning mode, MetalNeuro software supports:
(1)
user input of the base of reference images of metal microstructures;
(2)
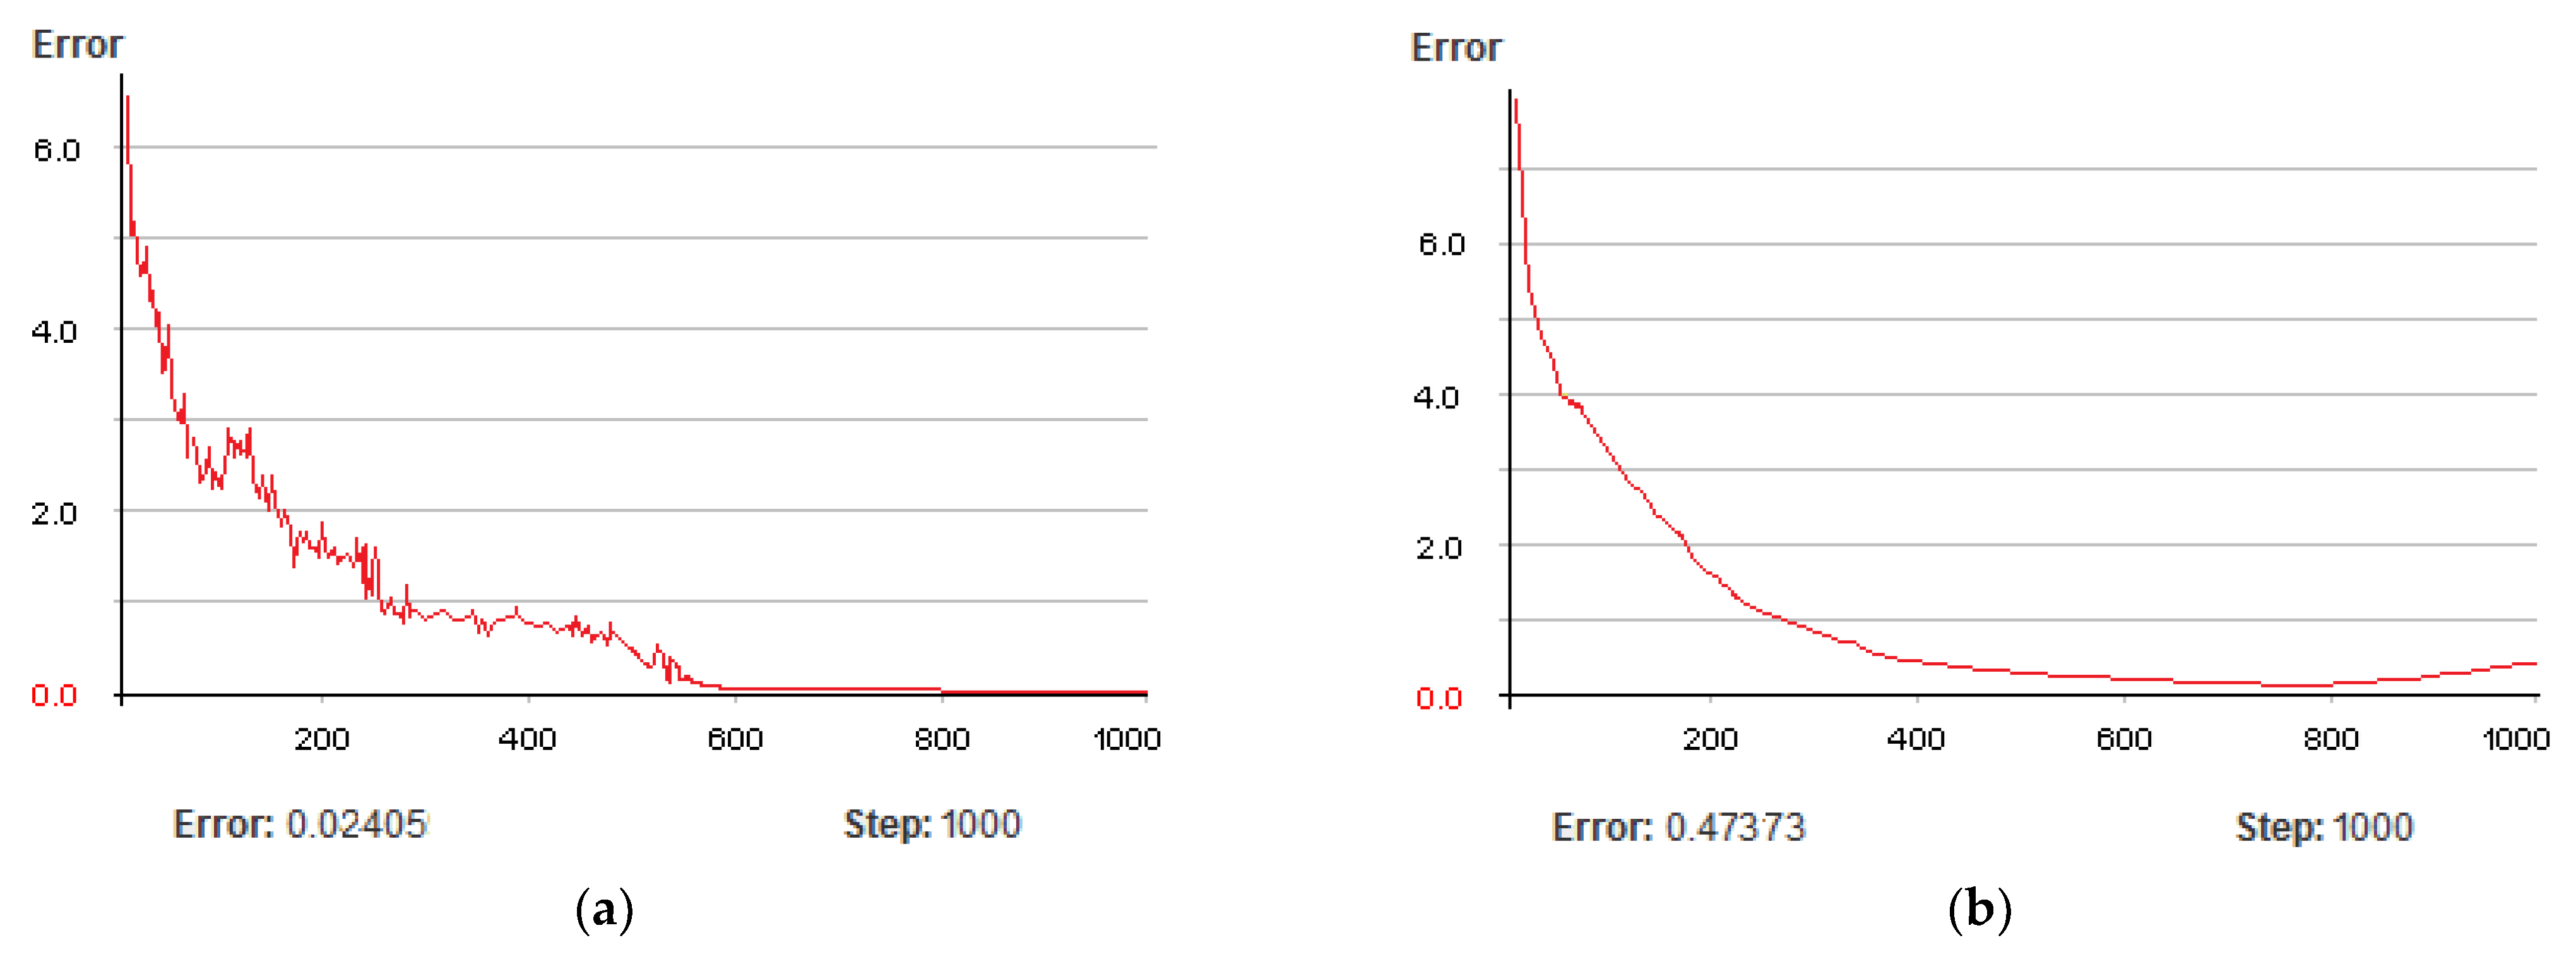
the choice of the architecture of the neural network for the recognition of images of metal microstructures;
(3)
learning a neural network based on the introduced standards of metal microstructures;
(4)
saving the parameters of the learnt neural network for further recovery on demand and analysis based on this network.
To develop the MetalNeuro software, Java coding language and Eclipse IDE for Enterprise Java Developers were used. A part of the “MetalImage.class” code is shown in Listing 1. The code is for microstructure image processing, including preliminary processing (evaluating sin and cos for a neural network). To evaluate sin and cos, the class MetalImage has methods calcSinus() and calcCosinus(). To determine the base points on the microstructure image the class MetalImage has method getTokens().
Listing 1. A part of the “MetalImage.class” code.
public class metalImage
{
private Image image = null;
private ArrayList tokens = null;
private File filename = null;
private metalSpecies species = null;
public metalImage(File fileopen)
{
if(fileopen.isFile())
{
filename = fileopen;
image = new ImageIcon(fileopen.getPath()).getImage();
}
tokens = new ArrayList();
}
public double[] getTokens(int inputs)
{
double[] tokenVector = new double[inputs];
for(int i = 0; i < inputs; i++)
{
if(i < tokens.size())
{
   metalToken token = (metalToken)tokens.get(i);
   if(i%2 == 0) tokenVector[i] = token.getCOS();
   else tokenVector[i] = token.getSIN();
}
else tokenVector[i] = −1.0;
}
return tokenVector;
}
public void addToken(metalToken token)
{
tokens.add(token);
}
public void setTokens(ArrayList tokens)
{
this.tokens = tokens;
}
private void calcCosinus()
{
int ax, ay;
 double hyp;
ax = x2-x1;
 ay = y2-y1;//calculate the hypotenuse c = sqrt(a2+b2)
 hyp = Math.sqrt(ax*ax + ay*ay);
 if(hyp == 0.0) cos = 0.0;
 else cos = ay/hyp;
}
private void calcSinus()
{
 int ax, ay;
 double hyp;
 ax = x2-x1;
 ay = y2-y1;//calculate the hypotenuse c = sqrt(a2+b2)
 hyp = Math.sqrt(ax*ax + ay*ay);
 if(hyp == 0.0) hyp = Math.abs(ax);
 sin = ax/hyp;
}
}
Using the developed software, an experiment was carried out to recognize images of microstructures of steels of different grades. The results of the analysis to determine the percentage of carbon in steel grade 10ChSND(S420N) are summarized in Table 3.
The developed software has passed the testing stage at the Alchevsk Iron and Steel Works in the Central Laboratory. The results of evaluating the developed tools are presented in Table 4 (Assessment of the functioning of the developed tools at the Alchevsk Iron and Steel Works). The system was developed as the following hardware configuration: the technician’s computer (CPU-Intel Core i5 2.0 GHz; RAM—8 GB DDR3), the workshop server (CPU—Intel Xeon Gold 3.1 GHz; RAM—32 GB DDR4). The set of metallographic images for evaluating the functioning of the developed tools was 248 images. In the course of the experiment, the analysis of the images of this set was carried out first by an outdated metallographic analysis system, and then by an upgraded system with the developed software [21,22].

5. Discussion

As it can be seen from the analysis of the data in Table 4, after the implementation of the proposed tools, the efficiency of metallographic analysis increased more than three times, and the accuracy of determining the quantitative characteristics was more than 95% (as evidenced by the low deviation of the grain parameters).
The analysis of the hardware configuration (the technician’s computer and the workshop server) indicates the applicability of the developed system in production conditions. Therefore, the proposed solution worked well on the devices with limited computation resources.
In the future, the proposed tools can be effectively used to assess a wide class of objects in the metallurgical industry, for example, to assess the state of the pipes, long steel products etc.
The ability of the ship’s hull to withstand the load, called the strength of the vessel, is an important and urgent task where this study is necessary. This value determines at what indicators the ship does not collapse, and what effect of temporary and permanent forces can affect it. When calculating the strength of a vessel, it is imperative to calculate the local and total strength, since these values play an important role under various operating conditions [23].

6. Conclusions

Thus, the following results were obtained in the research:
  • An algorithm for the automation of diagnostics of the state of metals has been proposed and described. The proposed algorithm implies the use of neural networks and precedent theory, which allows, due to the learning property, to adapt the proposed metallographic analysis tools for any enterprise.
  • Developed software for metallographic images recognition. The developed software makes it possible to automatically determine the grade and quantitative characteristics of metals.
  • The use of the developed tools made it possible to reduce the analysis time of metallographic images by three times, as well as to increase the accuracy of determining the quantitative characteristics of metals.

Author Contributions

Conceptualization, S.C. and V.E.; methodology, S.C.; software, V.E.; validation, A.Z., V.E.; formal analysis, S.C.; investigation, V.E.; resources, V.E.; data curation, S.C.; writing—original draft preparation, V.E.; writing—review and editing, A.Z.; visualization, V.E.; supervision, V.E.; project administration, S.C.; funding acquisition, A.Z. All authors have read and agreed to the published version of the manuscript.

Funding

The research is partially funded by the Ministry of Science and Higher Education of the Russian Federation as part of World-class Research Center program: Advanced Digital Technologies (contract No. 075-15-2020-903, dated November 16, 2020).

Conflicts of Interest

The authors declare no conflict of interest.

References

  1. Smallman, R.E.; Ashbee, K.H.G. Modern Metallography: The Commonwealth and International Library: Metallurgy Division; Elsevier: Amsterdam, The Netherlands, 2013; 224p. [Google Scholar]
  2. Gordon, Y.; Kumar, S.; Freislich, M.; Yaroshenko, Y. The modern technology of iron and steel production and possible ways of their development. Steel Transl. 2015, 45, 627–634. [Google Scholar] [CrossRef] [Green Version]
  3. Colpaert, H. Metallography of Steels: Interpretation of Structure and the Effects of Processing; ASM International: Russell Township, OH, USA, 2018; 699p. [Google Scholar]
  4. Martyushev, N.; Skeeba, V. The method of quantitative automatic metallographic analysis. J. Phys. Conf. Ser. 2017, 803, 012094. [Google Scholar] [CrossRef]
  5. DeCost, B.L.; Holm, E.A. A computer vision approach for automated analysis and classification of microstructural image data. Comput. Mater. Sci. 2015, 110, 126–133. [Google Scholar] [CrossRef] [Green Version]
  6. Bezyazychnyi, V.F.; Palamar, I.N.; Azikov, N.S. Automation of Analysis of the Structure of a Material with Details Based on Controlled Functional Systems. J. Mach. Manuf. Reliab. 2020, 49, 341–346. [Google Scholar] [CrossRef]
  7. Wu, W.-H.; Lee, J.-C.; Wang, Y.-M. A Study of Defect Detection Techniques for Metallographic Images. Sensors 2020, 20, 5593. [Google Scholar] [CrossRef] [PubMed]
  8. Chen, D.; Liu, Y.; Liu, S.; Liu, F.; Chen, Y. Framework of Specific Description Generation for Aluminum Alloy Metallographic Image Based on Visual and Language Information Fusion. Symmetry 2020, 12, 771. [Google Scholar] [CrossRef]
  9. Niezgoda, S.R.; Kanjarla, A.K.; Kalidindi, S.R. Novel microstructure quantification framework for databasing, visualization, and analysis of microstructure data. Integr. Mater. Manuf. Innov. 2013, 2, 54–80. [Google Scholar] [CrossRef] [Green Version]
  10. Lin, J.; Ma, L.; Yao, Y. Segmentation of casting defect regions for the extraction of microstructural properties. Eng. Appl. Artif. Intell. 2019, 85, 150–163. [Google Scholar] [CrossRef]
  11. Long, J.; Shelhamer, E.; Darrell, T. Fully convolutional networks for semantic segmentation. In Proceedings of the IEEE Conference on Computer Vision and Pattern Recognition, Boston, MA, USA, 7–12 June 2015; pp. 3431–3440. [Google Scholar]
  12. Azimi, S.M.; Britz, D.; Engstler, M.; Fritz, M.; Mücklich, F. Advanced steel microstructure classification by deep learning methods. Sci. Rep. 2018, 8, 2128. [Google Scholar] [CrossRef] [PubMed]
  13. Ma, B.; Ban, X.; Huang, H.; Chen, Y.; Liu, W.; Zhi, Y. Deep learning-based image segmentation for al-la alloy microscopic images. Symmetry 2018, 10, 107. [Google Scholar] [CrossRef] [Green Version]
  14. De Albuquerque, V.H.; Silva, C.C.; Menezes, T.I.; Farias, J.P.; Tavares, J.M. Automatic evaluation of nickel alloy secondary phases from SEM images. Microsc. Res. Tech. 2011, 74, 36–46. [Google Scholar] [CrossRef] [PubMed]
  15. Vijayalakshmi, D. Malaya Kumar Nath Taxonomy of Performance Measures for Contrast Enhancement. Pattern Recognit. Image Anal. 2020, 30, 691–701. [Google Scholar] [CrossRef]
  16. Dougherty, G. Pattern Recognition and Classification; Springer: Berlin/Heidelberg, Germany, 2013; 206p. [Google Scholar]
  17. Kenji, S. Artificial Neural Networks: Architectures and Applications; IntechOpen Limited 5 Princes Gate Court; SW7 2QJ: London, UK, 2013; 264p. [Google Scholar]
  18. Suresh Kumar, P.; Behera, H.S.; Anisha Kumari, K.; Nayak, J.; Naik, B. Advancement from neural networks to deep learning in software effort estimation: Perspective of two decades. Comput. Sci. Rev. 2020, 38, 100288. [Google Scholar] [CrossRef]
  19. Richter, M.M.; Weber, R. Case-Based Reasoning; Springer: Berlin/Heidelberg, Germany, 2013; 546p. [Google Scholar]
  20. Alqurashi, T.; Wang, W. Clustering ensemble method. Int. J. Mach. Learn. Cybern. 2019, 10, 1227–1246. [Google Scholar] [CrossRef] [Green Version]
  21. Emelianov, V.; Emelianova, N.; Zhilenkov, A.; Chernyi, S. Application of Information Technologies and Programming Methods of Embedded Systems for Complex Intellectual Analysis. Entropy 2021, 23, 94. [Google Scholar] [CrossRef] [PubMed]
  22. Yemelyanov, V.; Chernyi, S.; Yemelyanova, N.; Varadarajan, V. Application of neural networks to forecast changes in the technical condition of critical production facilities. Comput. Electr. Eng. 2021, 93, 107225. [Google Scholar] [CrossRef]
  23. Kramar, V.; Rodkina, A.; Ivanova, O.; Chernyi, S.; Zinchenko, A. Analysis Technology and Cathodic Protection for Hull Structures of Ships and Floating Facilities. Inventions 2021, 6, 74. [Google Scholar] [CrossRef]
Figure 1. IDEF0- sequence diagram of an automated metal quality control process.
Energies 14 08040 g001
Figure 2. The result of the preliminary processing of the image of the metal microstructure: (a) grayscale microstructure image; (b) binarization of the metal microstructure image; (c) image thinning operation and boundary detection with Prewitt’s filter.
Energies 14 08040 g002
Figure 3. The structure of the neural network for determining the quantitative characteristics of the metal.
Energies 14 08040 g003
Figure 4. Graph of changes in the dependence of the learning error (a) and recognition error (b) on the number of learning epochs.
Energies 14 08040 g004
Figure 5. Developed software for automated metallographic analysis.
Energies 14 08040 g005
Table 1. The results of the functioning of neural networks for determining the characteristics of metal standard.
Standard and Characteristics of the AlloyStructure of the Neural NetworkRecognition ErrorOptimal Number of the Learning EpochsTotal Amount of the Alloy Analyzed ImagesA Number of Correctly Recognized Images
GOST
5639-82
Grain amount510-170-100.0243800231224
GOST
8233-56
Ratio
Ferrite/Perlite
375-125-100.0384950121119
Ratio
Martensite/Troostite
375-125-100.03511300121118
Size of carbide network210-70-60.0259850121118
GOST
1778-70
Grade of line nitrides210-70-50.0163700142134
Grade of sulphides210-70-50.0095850142133
ASTME1382Size of ferrite grain600-200-190.05731300231217
Table 2. Determination of the metal grade based on the precedent method.
Types of SteelValues of the Metal
Characteristics—Xi
(the Situation to Be Solved—si),
The Number of the Use Case in the Use Case Base Steel Grade
—the Situation to Be Solved is ri
Carbon Tool Steel 0.7C; 0.18Cr; 0.2Mn; 0.024S; 0.018P25У7(C 70W2)
Carbon Tool Steel0.87C; 0.22Cr; 0.27Mn; 0.02S; 0.023P33У9A(C 70W1)
Structural Steel0.1C; 0.09Cr; 0.35Mn; 0.01S; 0.03P1208кп(A 622)
Structural Steel0.2C; 0.24Cr; 0.6Mn; 0.02S; 0.02P1920пc(A 29 1020)
Structural Steel0.09C; 0.2 Si; 0.43 Mn; 0.03S; 0.03P3Cт1cп(A192 Gr A)
Structural Steel 0.18C; 0.2Cr; 0.3Mn; 0.03Si; 0.04S6Cт3кп (A 107)
Table 3. Results of image analysis for carbon content and determination of the structural component using the proposed tools.
MicrostructureProcessing Time, MinStructural ComponentCarbon, % (C)The Form of InclusionNon-Metal InclusionsResistance to Rupture, MPa
Energies 14 08040 i001<1Ferrite,
Perlite
0.21GrainOxides (amount = 2)520
Energies 14 08040 i002<1Ferrite,
Perlite
0.53GrainOxides (amount = 3)540
Energies 14 08040 i003<1Ferrite,
Perlite
0.78GrainOxides (amount = 3)450
Table 4. Structural indicators of the experiment using the Metallographic System.
Evaluated Metallographic SystemAverage Time of Metallographic Image Analysis (Including Image Recognition Time), MinDeviation of Grain Parameters in the Analyzed Metallographic Image, %
Metallographic analysis system prior to the implementation of the proposed tools (based on classical approaches for recognizing images of metal microstructures)185–10
Upgraded metallographic system after the implementation of the proposed tools (based on neural networks and precedent theory)53–4
Existing metallographic systems
(SPECTR MET, SIAMS, etc.)
75–8
Publisher’s Note: MDPI stays neutral with regard to jurisdictional claims in published maps and institutional affiliations.

