Article

A Study on the Possibility of Measuring Sludge Sedimentation Using Contrast Detection Characteristics of CdS Photoresistors

1
Department of Energy Environment System Engineering, University of Seoul, Seoul 02504, Korea
2
Center for Bio-Resource, Institute for Advanced Engineering, Yongin-si 17180, Korea
*
Author to whom correspondence should be addressed.
Energies 2021, 14(22), 7817; https://doi.org/10.3390/en14227817
Submission received: 26 September 2021 / Revised: 9 November 2021 / Accepted: 16 November 2021 / Published: 22 November 2021
(This article belongs to the Special Issue Sustainable Management of Waste for Renewable Energy Resources)

Abstract

:
Although operators periodically measure the sludge volume index (SVI) to stabilize the bioreactor and solid–liquid separation during the wastewater treatment process, there is a problem of inconsistency attributed to the subjective judgment of the operator. This study aims to investigate the possibility of securing objective data by employing CdS (cadmium–sulfur) photoresistors for SVI measurements. The sedimentation velocity of settling sludge was measured using LED (Light Emitting Diode) lights at the same level as the installed CdS photoresistors. As a result of the experiment, the settling velocity of sludge in the CdS photoresistors’ installation position H1 to H8 (non-flocculent settling), H9 to H12 (discrete flocculent settling) and H13 to H18 (zone settling and compressive settling), was 0.594 mm/s, 0.180 mm/s and 0.056 mm/s, respectively. Through this study, it was confirmed that measuring sludge sedimentation using the CdS photoresistors is possible. If the measurement of solid matter in sludge using several sludge sedimentation measurements is enabled in the future, it will be possible to develop calculation algorithms to measure the SVI.

1. Introduction

The proper treatment of the organic matter and nutrients in wastewater is important because the unauthorized discharge of wastewater that was not properly treated may cause adverse effects, such as waterborne infectious diseases and eutrophication, in humans and ecosystems [1]. For these reasons, the rapid and nuisance-free removal of wastewater from its sources of generation, followed by treatment is essential, for the environment and human society. In most countries, to prevent problems resulting from untreated wastewater being leaked to streams, it is mandatory to comply with wastewater treatment regulations before discharging wastewater into a stream [2].
The activated sludge process is the most popular waste treatment technology for the removal of contaminants from wastewater. Although there are several modified processes for the activated sludge process, in principle, all activated sludge processes are composed of (1) a bioreactor where wastewater is primarily treated or selected wastewater flows, (2) a settling tank (secondary settling tank) where treated wastewater is separated from the solid matter in the mixed liquid suspended sludge (MLSS) that is generated in the bioreactor, and (3) the equipment for transferring the sludge settled in the settling tank to the inlet of the bioreactor [3]. The precipitation of sludge during the wastewater treatment and the important unit process for determining the reduction and thickened sludge generated during the wastewater treatment process. Anaerobic digestion is used as a useful way to reduce the treatment cost of sludge generated during wastewater treatment and produce bioenergy and fertilizer. In order to increase the efficiency of anerobic digestion, the precipitation efficiency of sludge during the wastewater treatment process is important [4]. The performance of the wastewater treatment process based on the activated sludge process depends on the behavior of the secondary settling tank. In other words, biological reactions for the treatment and removal of organic materials, nitrogen, and phosphorus included in wastewater [5,6,7,8] should occur simultaneously alongside the solid–liquid separation. To this end, for indirectly identifying the status of microorganisms in the bioreactor in the sewage treatment process and predicting the level of solid–liquid separation in the post-process, the sludge volume index (SVI) introduced by Mohlman in 1934 has become the standard tool for quantifying the physical characteristics of the activated solid sludge. SVI is defined as “mL-unit volume that 1 g of activated sludge occupies after settling the aerated liquor for 30 min”. In the SVI test, the volume of sludge obtained after settling the MLSS sample in a standard 1 L cylinder for 30 min is measured. SVI was used to measure the approximate sludge settling capacity that could be utilized in the normal operation of the wastewater treatment process as a means of monitoring the physical status of activated sludge. However, because of the simplicity of the SVI testing method, it is widely utilized for operating wastewater treatment facilities and in research on waste treatment. It was claimed that the measured SVI value could be used to set the circulating rate for returning the settled sludge, which is used to adjust the amounts of microorganisms in the bioreactor and the secondary settler or to adjust the concentration of the MLSS that should be maintained in the bioreactor [9]. However, it was reported that since SVI is affected by various factors including influent characteristics and the form and operating pattern of the wastewater treatment process, examination and prediction of the sludge settleability depends on the empirical and subjective judgment of the operator. Therefore, during the wastewater treatment process, SVI measurement results may have low consistency and permanence if measurements are conducted by unskilled operators. Thus, an objective diagnostic system is required.
To obtain objective data on SVI values, Banadda et al. [10] and Kim et al. [11] developed SVI measuring devices using image analysis methods and devised methods that enable operators to secure data on the settling characteristics of the sludge through image data. Banadda et al. [10] measured the sludge bulking or the deflocculation of sludge based on parameter equation parameters related to the precipitation characteristics of sludge in raw and phase contrast images measured through image analysis through a CCD (Charge-Coupled Device) camera attached to a light microscope. Furthermore, when the precipitation of sludge filling a 1 L cylinder was performed in dark room, Kim et al. [11] measured the sludge bulk phenomenon or the deflocculation of sludge by settling color information parameters according to the sludge precipitation phenomenon. Study of Kim et al. [11], it was explained that the experiment was performed in the darkroom because the CCD camera image acquired by LED light source can be stably converted to an RGB (Red, Green, Blue) value.
The measurement of SVI using CCD camera image analysis method can be used to measure the size of particle of sludge, but if it isn’t in darkroom that it can also cause error in CCD camera measured data by ambient light source(natural light source) [12]; further, to analyze the measured RGB values, a complicated method is needed to determine the measured color according to the color and luminance information of the RGB color space [13].
To this end, this study aims to investigate the possibility of measuring SVI using a CdS photoresistor [14] that has low sensitivity to color in the visible light range of 400–750 nm. The difference between the image analysis method using a CCD camera [9,10] and the measurement method using the CdS photoresistors used in this study is the sensing method. The sedimentation of sludge’s phenomenon in 1 liter cylinder, such as in Banadda et al. [10] and Kim et al. [11], is imaged by the CCD camera measurment. This study presents a method of measuring the sludge precipitation phenomenon with the electronic values received by the CdS photoresistors installed in a 1 L cylinder at a certain height interval. The CdS photoresistor, also called a CdS photocell, is a semiconductor produced by attaching metal legs to the cadmium sulfide crystals generated by combining cadmium and sulfur. The CdS photoresistor has a characteristic wherein electricity does not flow in it when visible light is absent, and it behaves as an insulator, but when visible rays touch, electricity flows well in the CdS photoresistor and it behaves as a conductor. In other words, it is a resistor with varying values depending on the amount of light it is subjected to. The CdS photoresistor is mainly utilized in electric circuits detecting light or in electric switch circuits that open and close depending on the presence of light [15]. In addition, the CdS photoresistor varies depending on the wavelength of light, and is not recognized when it exceeds a specific range of wavelengths, so it is sensed without disturbance of light by ambient light [16].

2. Materials and Methods
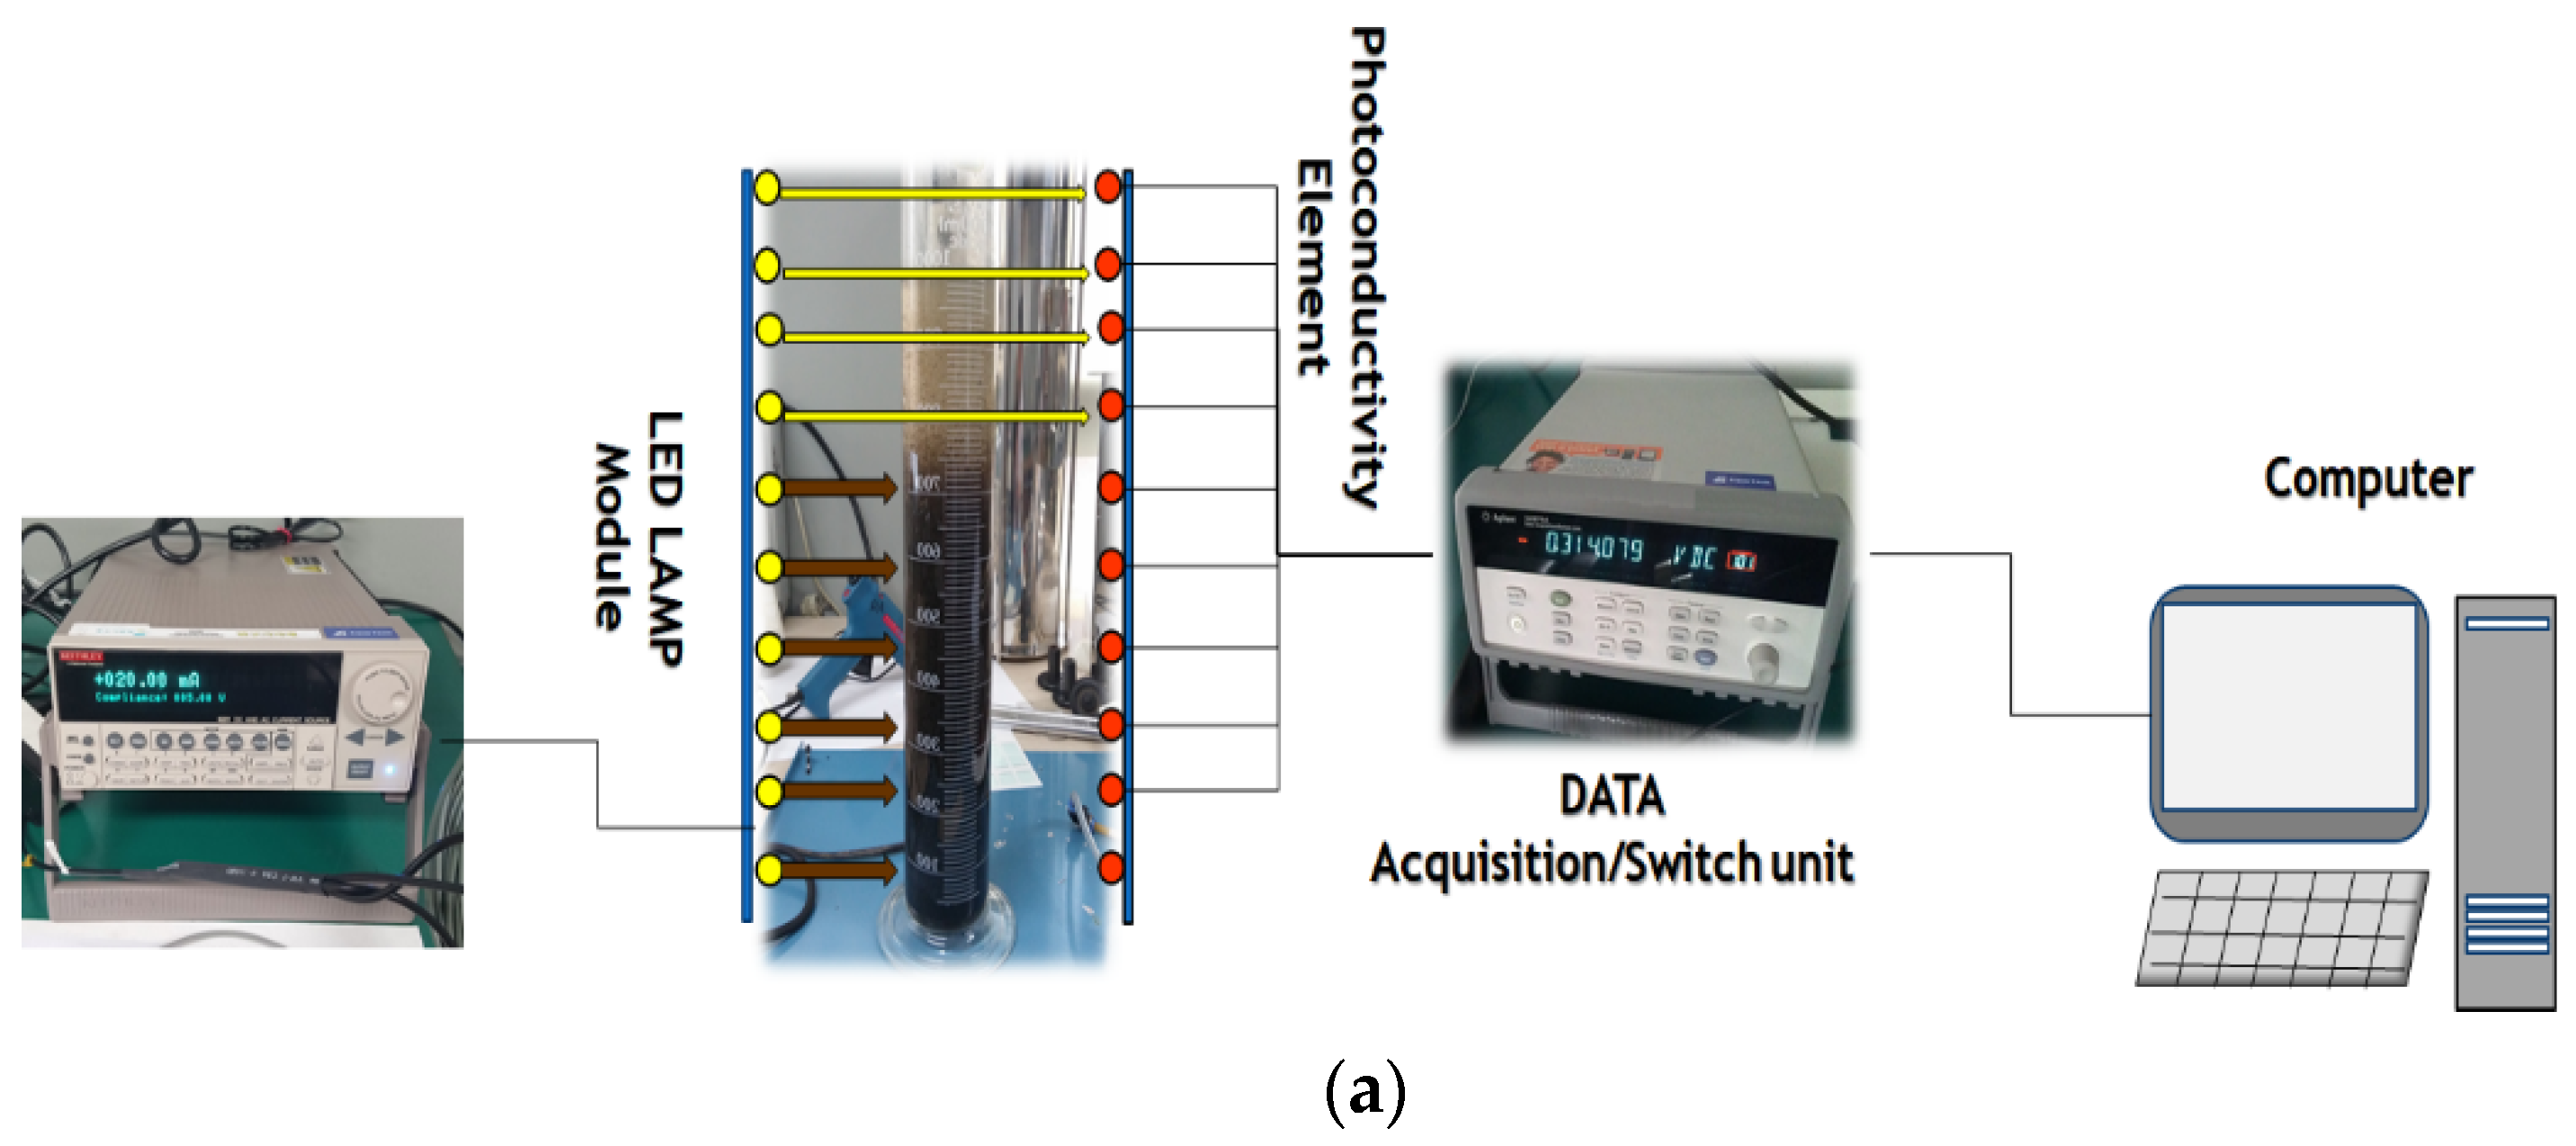
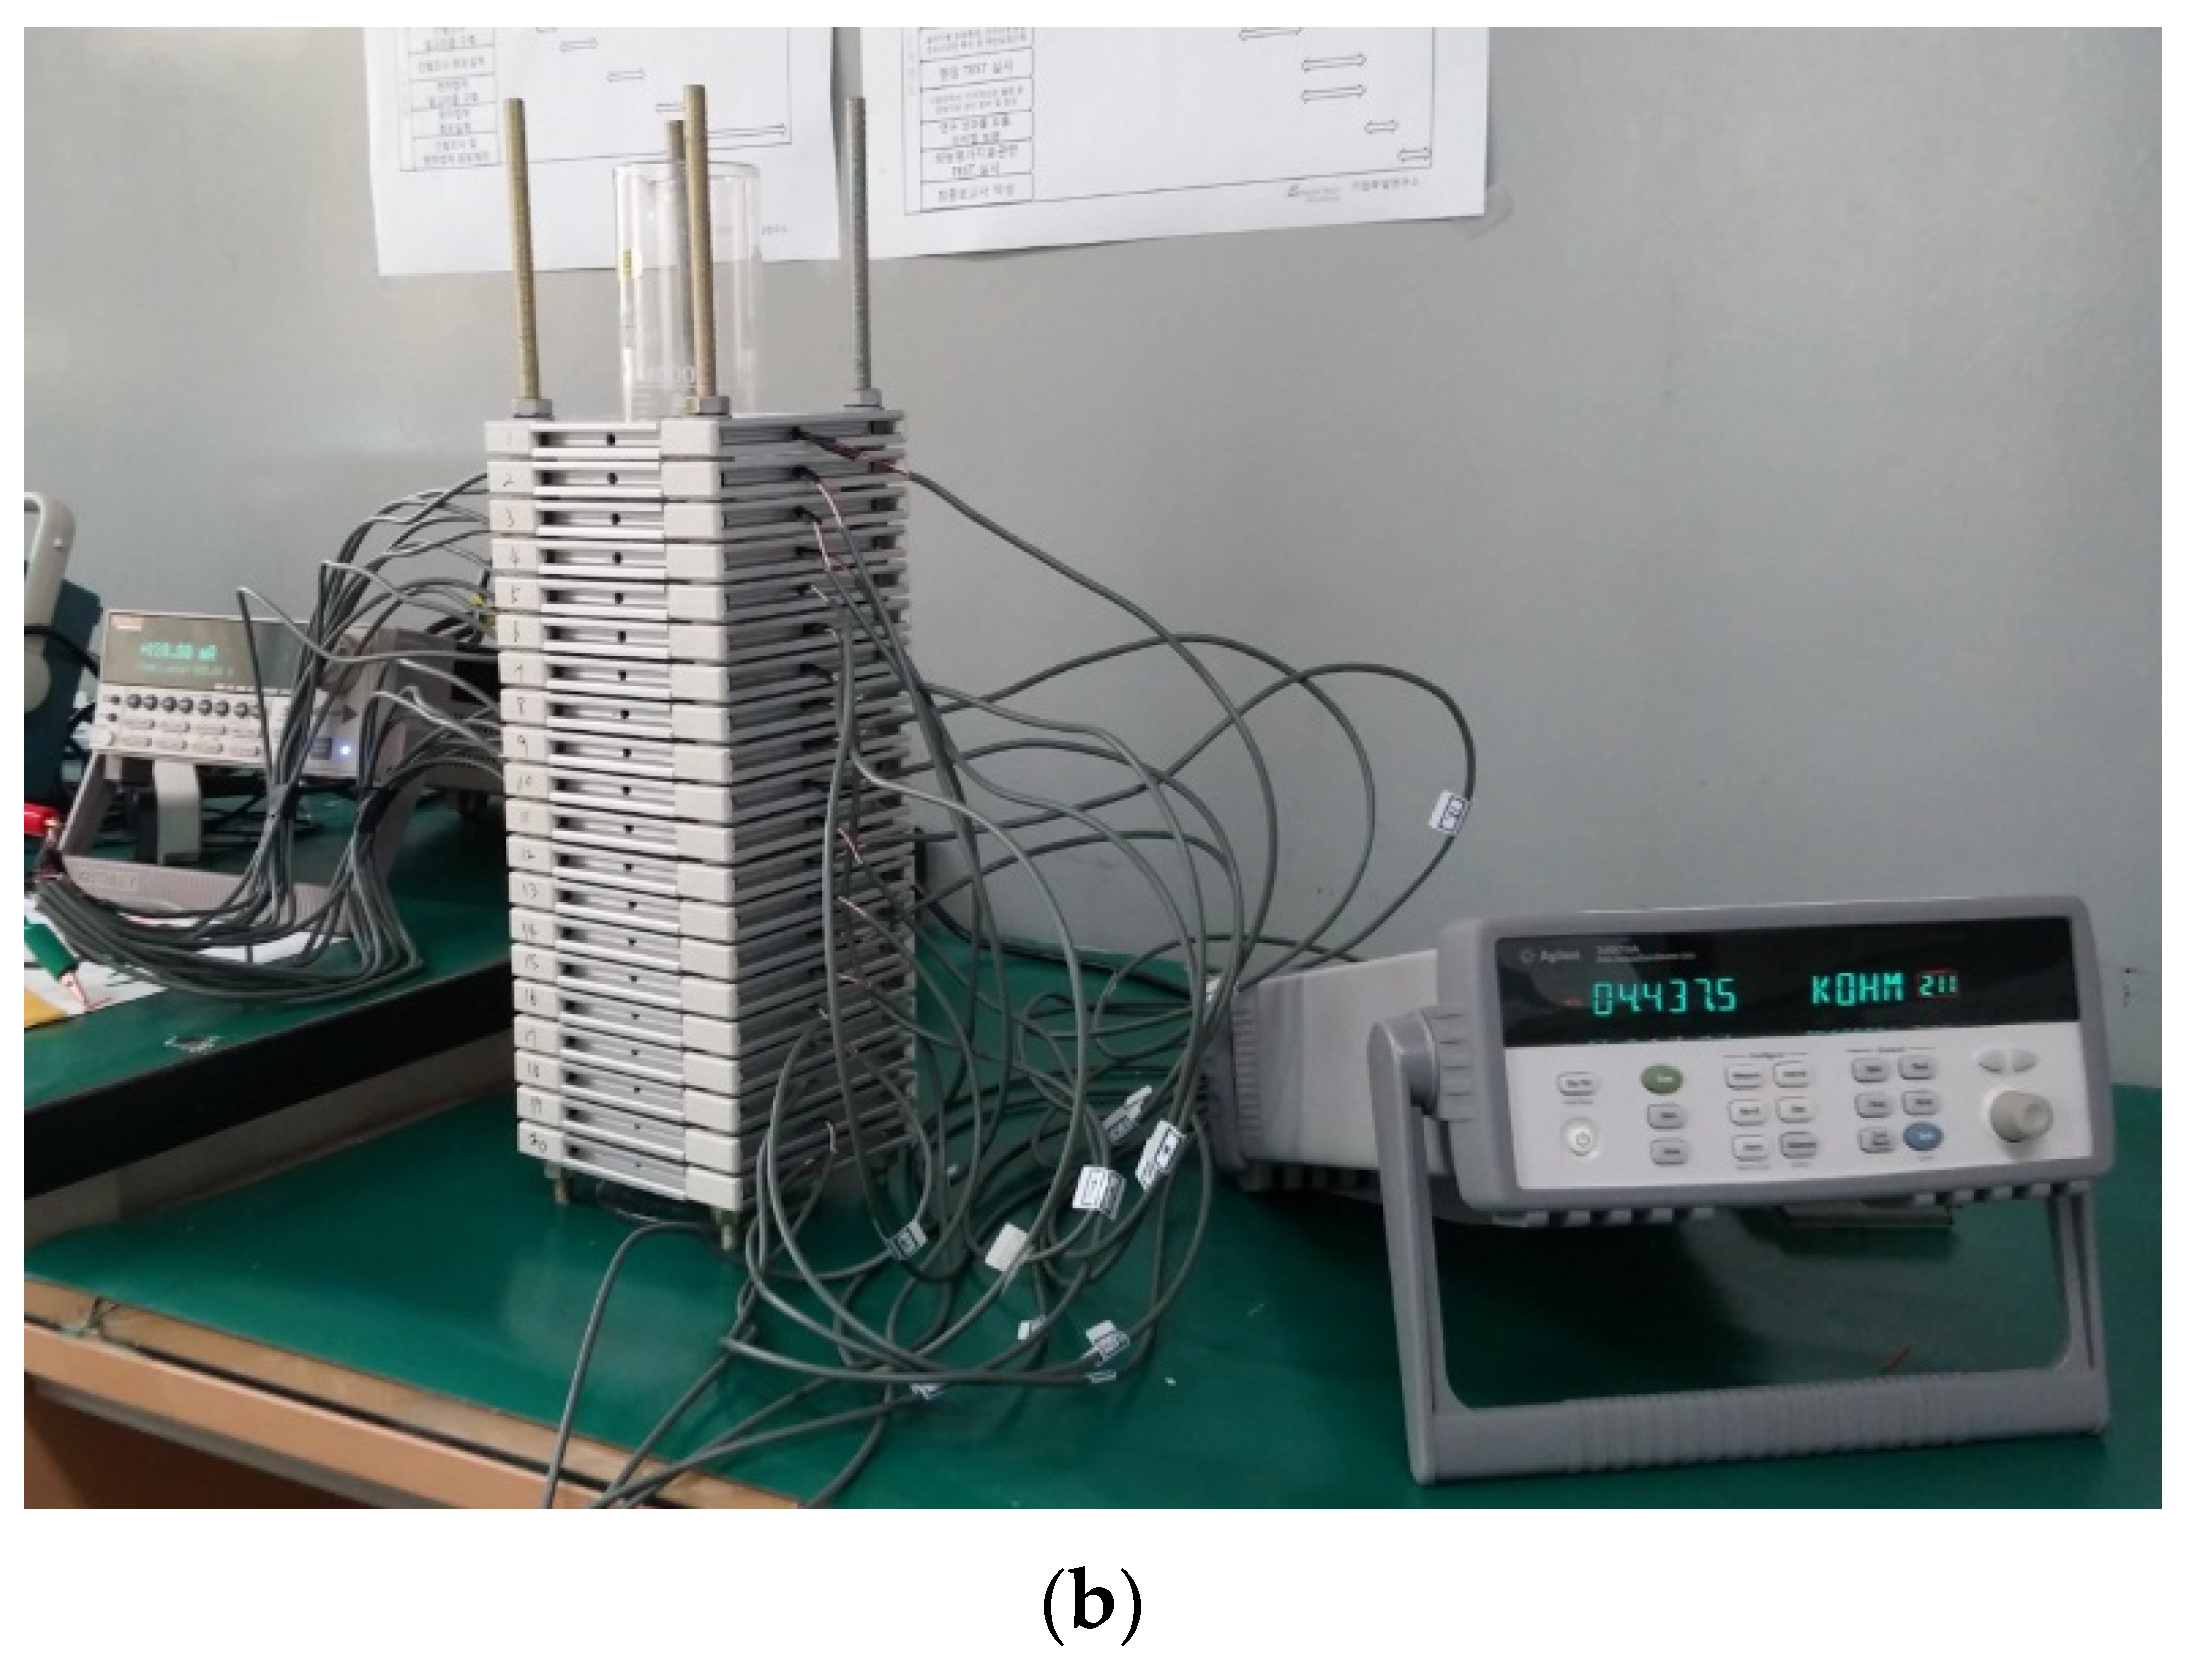
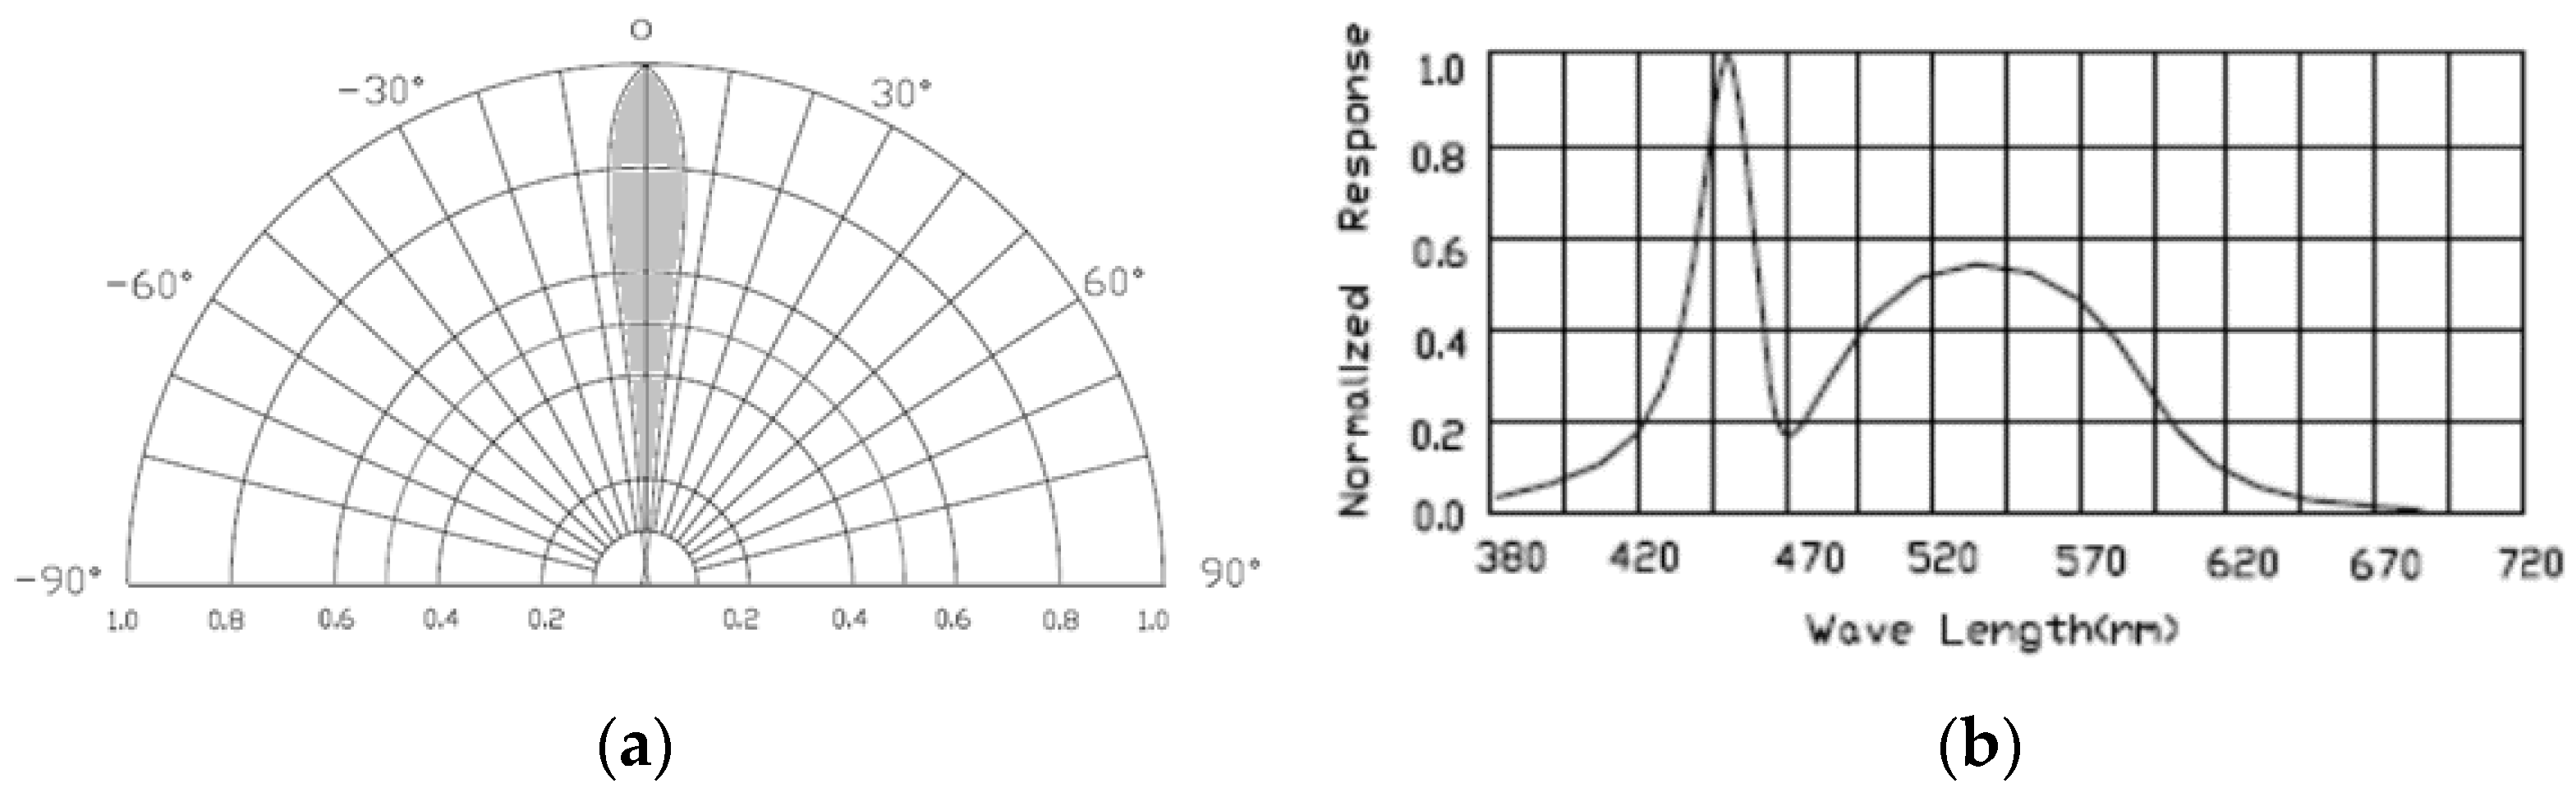
2.1. Test Devices

The volume of sludge used in this study was 1 L. The transparent cylinders (Pyrex Inc., Glendale, AZ, USA; 70 mmD × 452 mmH) used in the study were made of glass and were based on the specifications described by Dick and Vesilind [9]. The test equipment of sludge settling consisted of the CdS photoresistors unit and the LED unit. It is installed on the device and assembled in such a way that the cylinder is fixed and the outside of the fixed cylinder was 5 mm away from the lights of the LED unit and from the CdS photoresistors. Here, the stirrer (1 rpm) proposed by Dick and Vesilind [9] was not installed. The reason for excluding the stirrer in the composition is that the stirrer impeller could interfere with the light from the LED light source and cause interruptions in the measurement of the CdS photoresistors (Figure 1).
For the LED unit, 20 LED lamps (model: FYL-5014UMIC, Foryard Co., Ltd., Ningbo, China, Table 1, Figure 2) [17] were installed vertically at 17 mm intervals starting from a height of 12.3 mm from the cylinder bottom. For the light-receiving unit, 20 CdS photoresistors (model: A905012, Perkin Elmer Co., Waltham, MA, USA) [18] were installed such that each photoresistor could be used for horizontal measurements by receiving light from the corresponding LED lamp at the same height. To maintain a stable voltage of 5 V and a current of 20 mA in the LEDs installed at the LED unit, DC/AC Bench Power Supply (model: 6221, Keithley Co., Ltd., Beaverton, OR, USA) was utilized. In terms of the electric signals measured at the CdS photoresistors, the electrical resistance values (unit: Ω, Ohm) were converted to data values using the DATA Acquisition/Switch unit (model: 34972A, Agilent Co., Santa Clara, CA, USA) and stored in the computer (Figure 1).

2.2. Material of Test

The mixed liquor used as sludge in this study was from the bioreactor of a wastewater treatment plant in the city of Gyeonggi-do, Korea. This wastewater treatment plant was operated with A2O Process (Anaerobic/Anoxic/Aerobic) [19]. The mixed liquor was mostly collected at a collecting location where the operator of the wastewater treatment plant collects samples to indirectly identify the sludge settling capacity inside the secondary settling tank; this sampling location was placed such that the sample consisted of sludge from the rectangular bioreactor just before it flowed into the secondary settling tank. The characteristics of the collected sludge are tabulated in Table 1.
The analyses of the sludge characteristics were repeated three times using the water analysis method called the Standard Method (APHA) [20]. Among the sludge analysis items, CODcr was analyzed with DR2800 (Hach Co., Ltd., Loveland, CO USA), and MLSS were characterized through the gravimetric method. The characteristic of bioreactor condition and bioreactor sludge are shown in Table 2.
Choi et al. [21] reported that the error in the measurement data was generated due to the presence of ambient light during the measurement of incident light from the LED lamp. Therefore, in this study, errors in the sludge settleability measurements using CdS photoresistors due to ambient light were examined. The correction standards for changes in the optical measurements due to LED light were established according to the corresponding measurements when the cylinder was exposed to ambient light; under this condition, optical data were measured from the ambient light at CdS photoresistors at different installation heights on LED lights.
For the blank test, the electrical resistance values (kΩ) of H1–H20 of CdS photoresistors were measured while LED lamps were turned on at H1–H20 points using the DATA Acquisition/Switch Unit.
Regarding the sludge settleability measurements with the CdS photoresistors, the device for sludge sedimentation measurements using CdS photoresistors directly irradiated light from the LED light source to the CdS device. As sludge sedimentation occurs over time, the transparency of the supernatant increases and the permeability of the LED light source proportionally increases with time, starting from the time point at which the filling of the sample into the 1 L transparent cylinder is completed, under the condition of light from the LED light source being irradiated at all times. During this process, in the CdS photoresistors, the signal is measured in Ohm (Ω) according to the measurement status of the light source. The measurement of the sludge sedimentation interface over time is carried out at the DATA Acquisition/Switch unit, and the measured values are recorded by the computer program in real-time.
In this study, experiments were performed without blocking out the ambient light (natural light), unlike the study by Banadda et al. [10] and Kim et al. [11].
The variations in light intensity of the LED lights during sludge sedimentation were detected by the CdS photoresistors installed at various heights on the test device (Figure 3). They were detected inside the cylinder by the LED light source in the sludge sedimentation measuring device with the CdS photoresistors without a darkroom. The experiments were finished when the change rate of height was within 2%.
As shown in Equation (1), the settling velocity of sludge blanket is derived from the correlation according to the change in the detecting height and detecting time of the CdS photoresistors installed (Figure 1) in the test device.
VSL (mm/s) = [{(HX + 12.3) − (HX+1)}/(tHX+1 − tHX)]
VSL: Settling Velocity of Sludge Blanket (mm/s);
Hx: Height of Detected Sludge Blanket level (mm);
X: initial number of the CdS photoresistor;
X + 1: The CdS photoresistor installed right below the X position;
12.3: Height from the floor to H20 (12.3 mm).
Furthermore, the sludge sedimentation velocity inside the cylinder of the sludge sedimentation measuring device was estimated based on changes in the measured resistance values of the CdS photoresistors over time, which corresponded to the height of the supernatant produced by the sludge settling phenomenon over time.
To confirm the reliability of the measured sludge settleability values obtained using the CdS photoresistors, 1 L of sludge was used to fill a 1 L transparent cylinder made of glass, and the interface height over time due to the sedimentation of sludge was measured at 1 min intervals based on Standard Method 2710C (APHA) [20].

3. Result and Consideration

3.1. Variation of CdS Photoresistors in Ambient Light

The angle at which light is concentrated in the CdS photoresistors is show in Figure 2. The amount of light irradiated by the CdS photoresistors after intensity without the sludge is 27 cd (Candela, Luminous Intensity unit), which is equal to approximately 27 lux (Illuminance Unit). Therefore, the LED light source is irradiated to a range of 18 to 44 kΩ (Table 3). Before the CdS photoresisots experiment by the LED light sources, it was confirmed whether there was a change in the CdS photoresistors measurement by cylinder.
Average electrical values (kΩ) of H5–H20 of CdS photoresistors were measured thrice by the DATA Acquisitions/Switch unit when LED lamps were turned on at H5–H20 points with no sludge present in the equipment cylinder. This is presented in Figure 4.
In terms of the measured values of light sources with different cylinder heights, the average difference between cases with cylinders and those without cylinders was 2.3%, indicating no significant change. Here, higher measured values corresponded with lower heights because the measured value of the CdS photoresistors decreased in the presence of a bright light source due to natural light, whereas the measured value of the CdS photoresistors increased in the case of low brightness [20].
Moreover, in blank tests with and without a cylinder, the measured value at the height of 29.3 mm (H20) was found to be 46.7 kΩ, which was relatively low. This could be because no sensor structure was at the corresponding location and, in turn, the intensity of natural light irradiated to the cylinder location was brighter than that of lights irradiated by the other CdS photoresistors.

3.2. Comparison of CdS Resistors Variation Detected Data and Classical Test Results

Settling characteristics of MLSS generated in the activated sludge method are classified into four types—non-flocculent settling (Class I), discrete flocculent settling (Class II), zone settling (Class III), and compression settling (Class IV), and they are mostly dependent on interactions between particles [18]. On the basis of this theory, the settleability characteristics by the CdS photoresistors measurement were compared with those of the classical test results.
Classical tests were repeated thrice and average values were presented (Figure 5). The sludge interface was measured at 1 min intervals and, subsequently, at 10 min intervals (Figure 5). During this process, the function of height (y) and time (x) was calculated to be “y = −44.16 x + 38.3”, and the slope was –44.6 for the 5 min measurement. The function of sludge interface height and time for the same time was calculated to be “y = −2.345 x + 153.8” with the slope of –2.345. Specifically, the sludge sedimentation velocity was fast for 5 min, while the sludge tended to be settled slowly afterward.
Overall measured values at seconds interval (real-time) of the CdS photoresistors during the sludge sedimentation inside the cylinder filled with sludge are presented in Figure 6. In this study, experiments were concluded at 1200 s (20 min), which corresponded to the change in sludge sedimentation height of <2% using the CdS photoresistors. Based on the change rate of values measured by the CdS photoresistors, H1–H8, H9–H12, and H13–H20 sections are divided, analyzed, and shown in Figure 7, Figure 8 and Figure 9 respectively.
Figure 7 shows the section of 233.3 (H1)–352.0 (H8) mm height from the cylinder bottom as the average sludge sedimentation reduced from 91.2 kΩ (H1) to 18.6 kΩ (H8) after 200 s. This presented the discrete particle settling characteristics (Class I) of particulate solids, and the light arrival time with the sludge sedimentation could be calculated with the average of –0.363 kΩ/s. This was because these characteristics showed decreasing electrical values measured at the CdS photoresistors, with increasing intensity of light as the sludge settled in the H1–H8 section [20]. During this process, based on the end time of light detection by the CdS photoresistors installed at the H1–H8 heights, the sludge sedimentation velocity was calculated to be 0.594 mm/s in the section where the discrete particle settling occurred for 200 s. In the classical tests (Figure 5), the sludge interface height changed from 390 mm to 140 mm in 480 s and, hence, the sludge sedimentation velocity was calculated to be 0.521 mm/s, indicating a similar trend to the sludge sedimentation velocity obtained using the CdS photoresistor-measured values. The sludge sedimentation velocity obtained based on the CdS photoresistor measurement and that based on the classical test results varied slightly because the classical tests were measured every minute.
The temporary increase in each value of the CdS photoresistor by due to 200 to 400 s in H9 to H19 is because the LED light sources were blocked by the thickening of H9 to H12 sludge during H1 to H8. When the LED light sources irradiated the CdS phtoresisors, the difference of about 62.2 times compared to that of the LED light source blocked by sludge tends to be similar to that of Jung et al. [22].
The CdS photoresistor installation height of H9–H12 was 165 (H9)–216 (H12) mm, and the average value of 67.3 kΩ decreased to 60.3 kΩ in 280 s, diminishing by 7.0 kΩ (Figure 8). The average change rate of measured values of the CdS photoresistor was low (–0.025 kΩ/s) in the H9–H12 section, demonstrating the characteristics of the flocculent particle settling (Class II) where the particulate solids flocculated into Floc. It was calculated to be 0.183 mm/s based on calculation of the sludge sedimentation velocity in the flocculent particle settling section used in these tests.
The H13–H19 section where the CdS photoresistors were installed was between 46.3 (H13) and 148.3 (H19) mm, and the average value rose from 70.3 kΩ to 96.7 kΩ in 280 s (Figure 9). This highlighted the zone settling (Class III) characteristics of the solid matter. The sludge concentration increased for 280 s in the H13–H19 section due to the rapid decline in the enrichment and transparency of the light source. As the height of the CdS photoresistors installed from H13 reduced after 280 s, the change rate of the light source (slope) was decreased as well. Furthermore, the fact that the average measured value diminished from 96.7 kΩ at 280 s to 86.6 kΩ by 1200 s (the completion of the experiments) due to the sludge sedimentation phenomenon in the H18–H19 section was because of the compression settling (Class IV) characteristics attributed to the elevated effect of gravity, with the increase in thickness due to the sludge enrichment. Here, the average change of the light source due to the compression settling of the sludge was calculated to be –0.01 kΩ/s. In blank tests, the maximum value of 61.9 kΩ was obtained in the case of penetration of light and, based on this value, it is judged that the sludge was not settled at the height of H18–H20. Therefore, the height of the zone settling and compression settling was the H13–H18 section, suggesting that the sludge was settled in 63.3–148.3 mm, and the corresponding sludge sedimentation velocity was calculated to be 0.056 mm/s.
The height of H20 is the section where the sludge sedimentation did not occur, and measured values of the CdS photoresistors did not significantly change.

4. Conclusions

This study aimed to investigate the possibility of measuring SVI using CdS photoresistors. The following conclusions were drawn in this study:
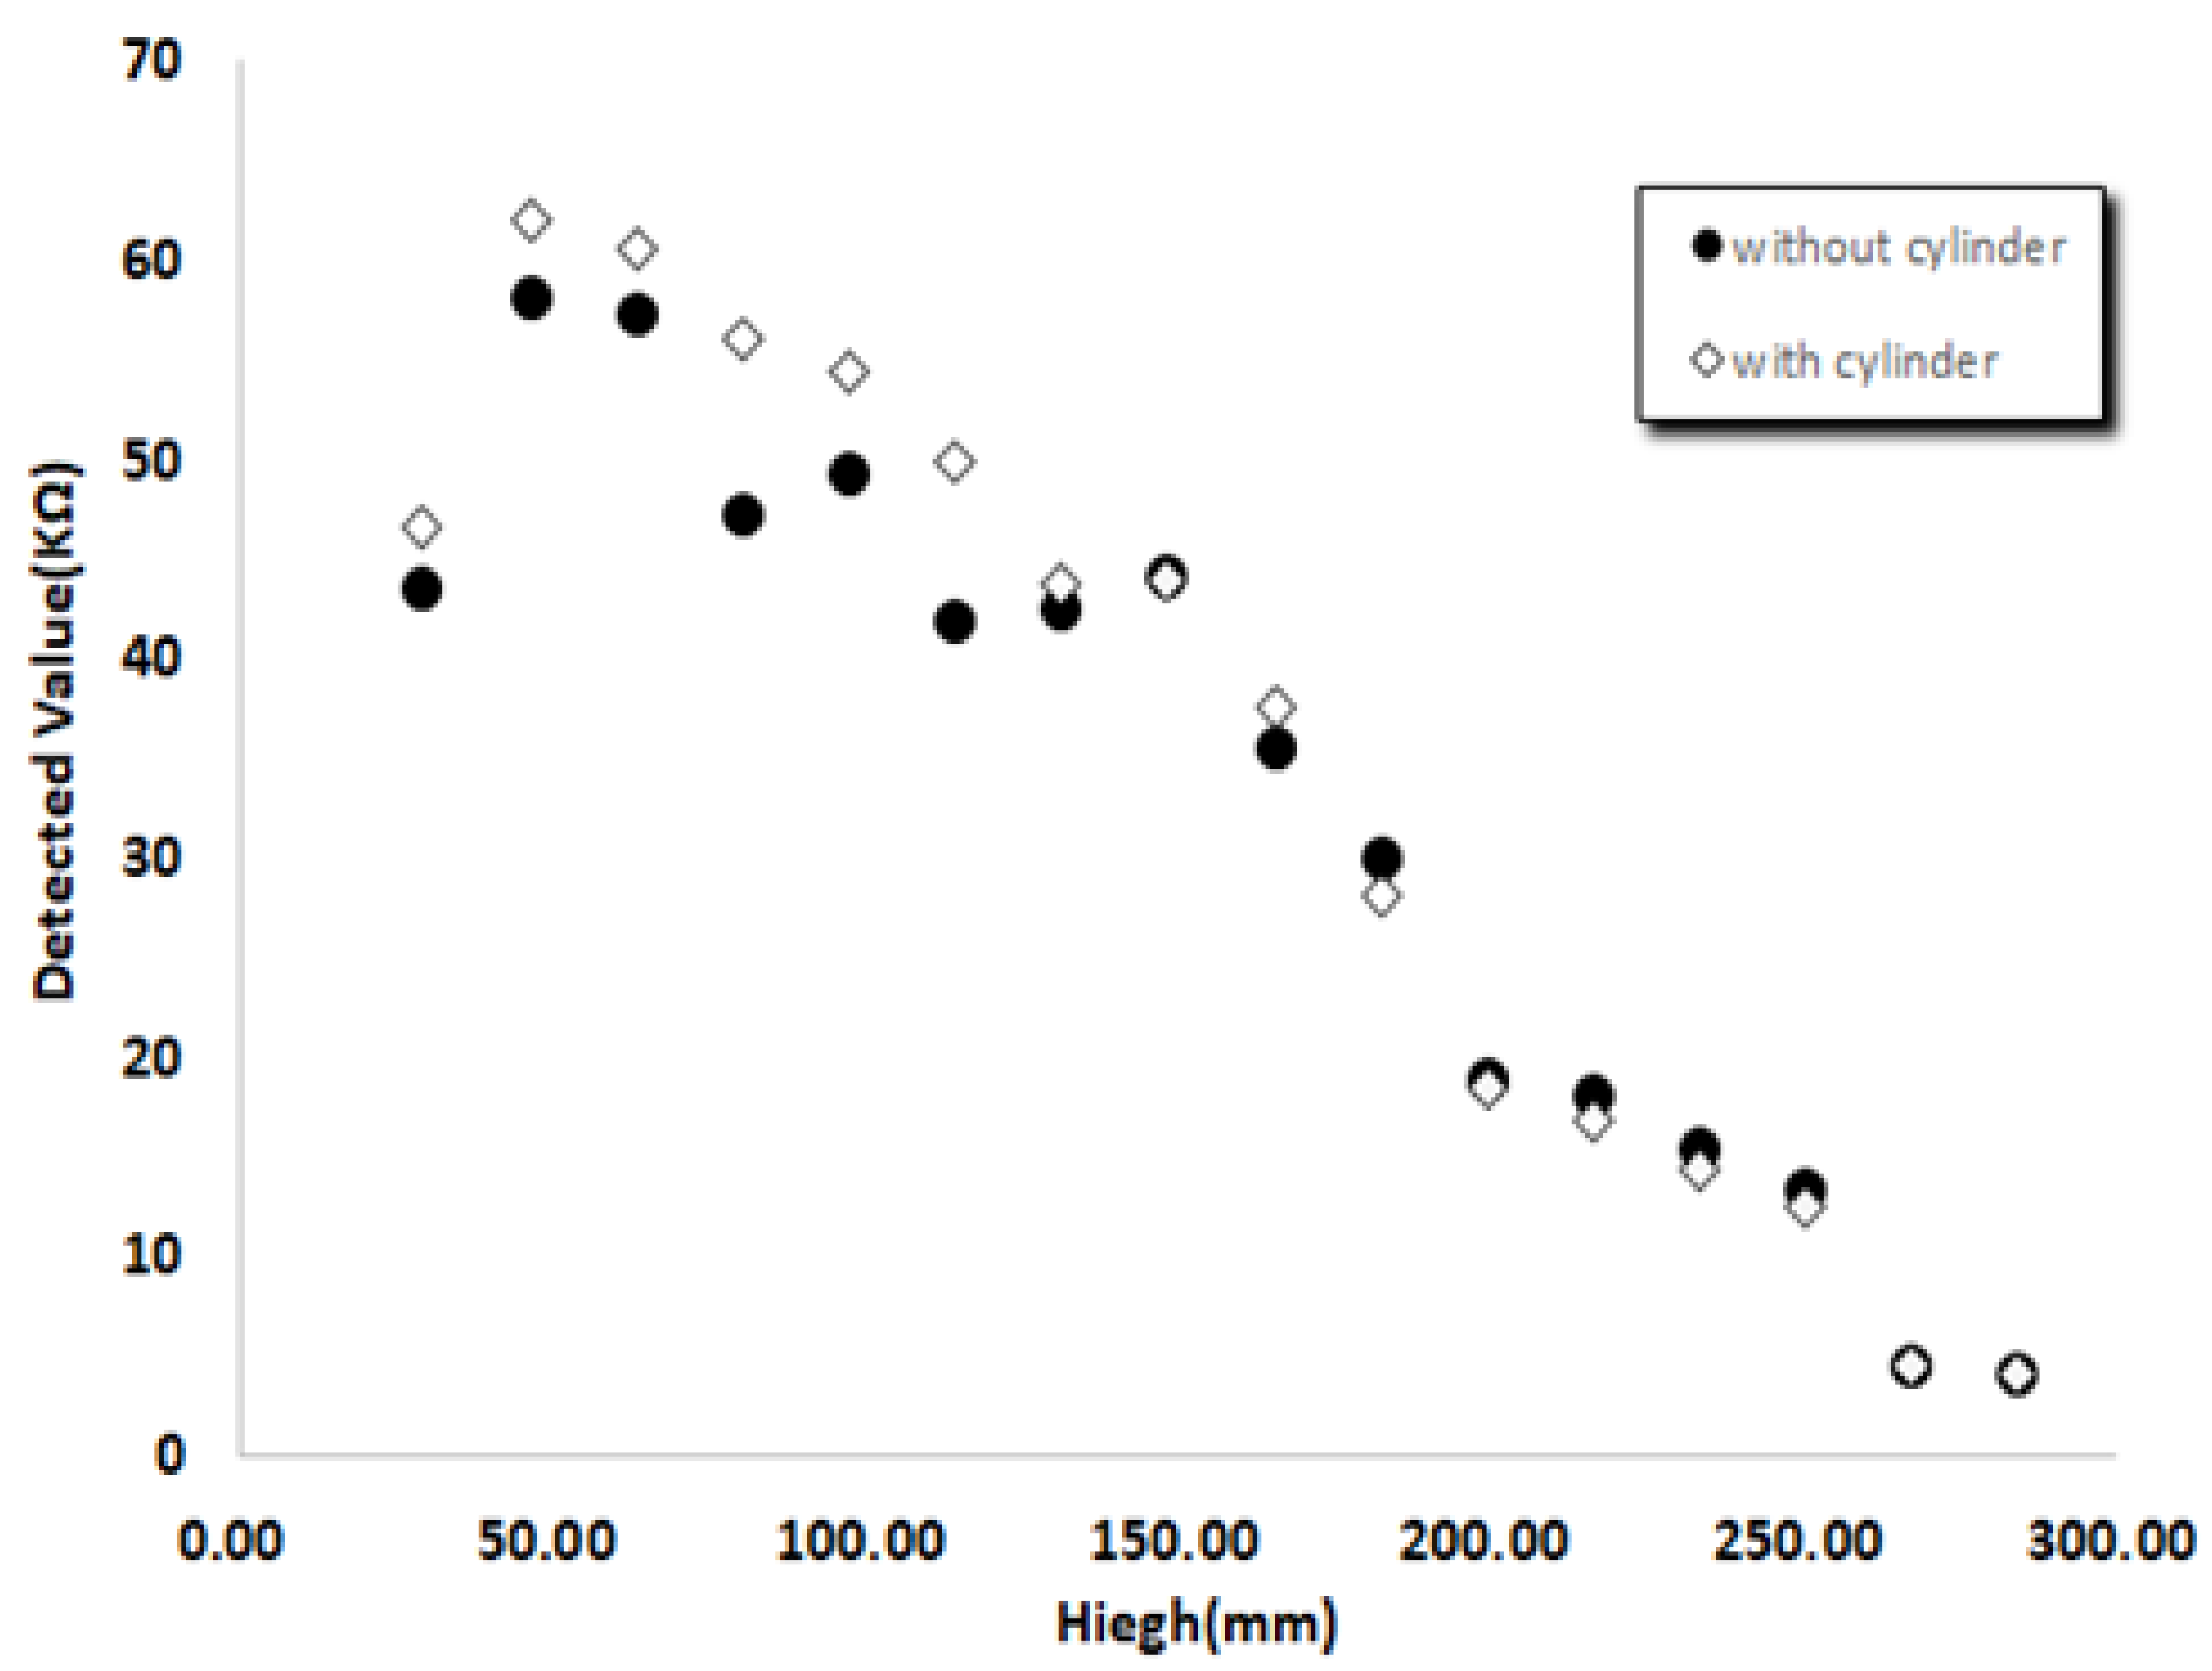
  • The average deviation of the effect of ambient light using the CdS photoresistors with and without the transparent cylindrical cylinder made of glass was found to be 2.3%, indicating no significant difference.
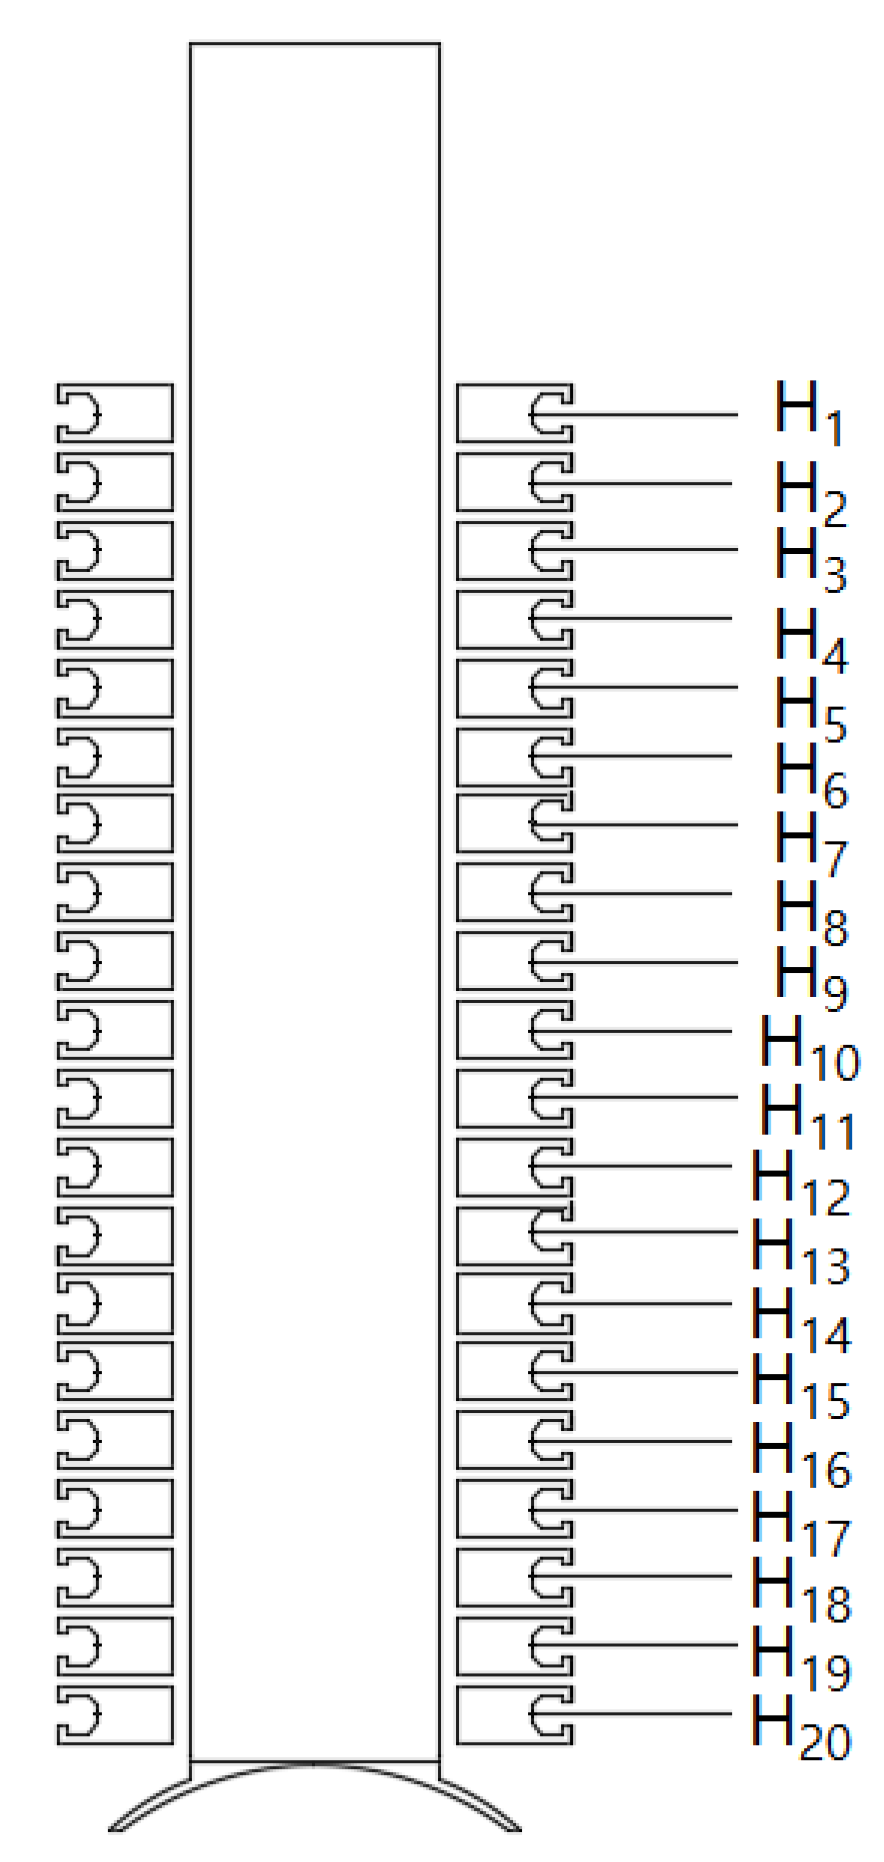
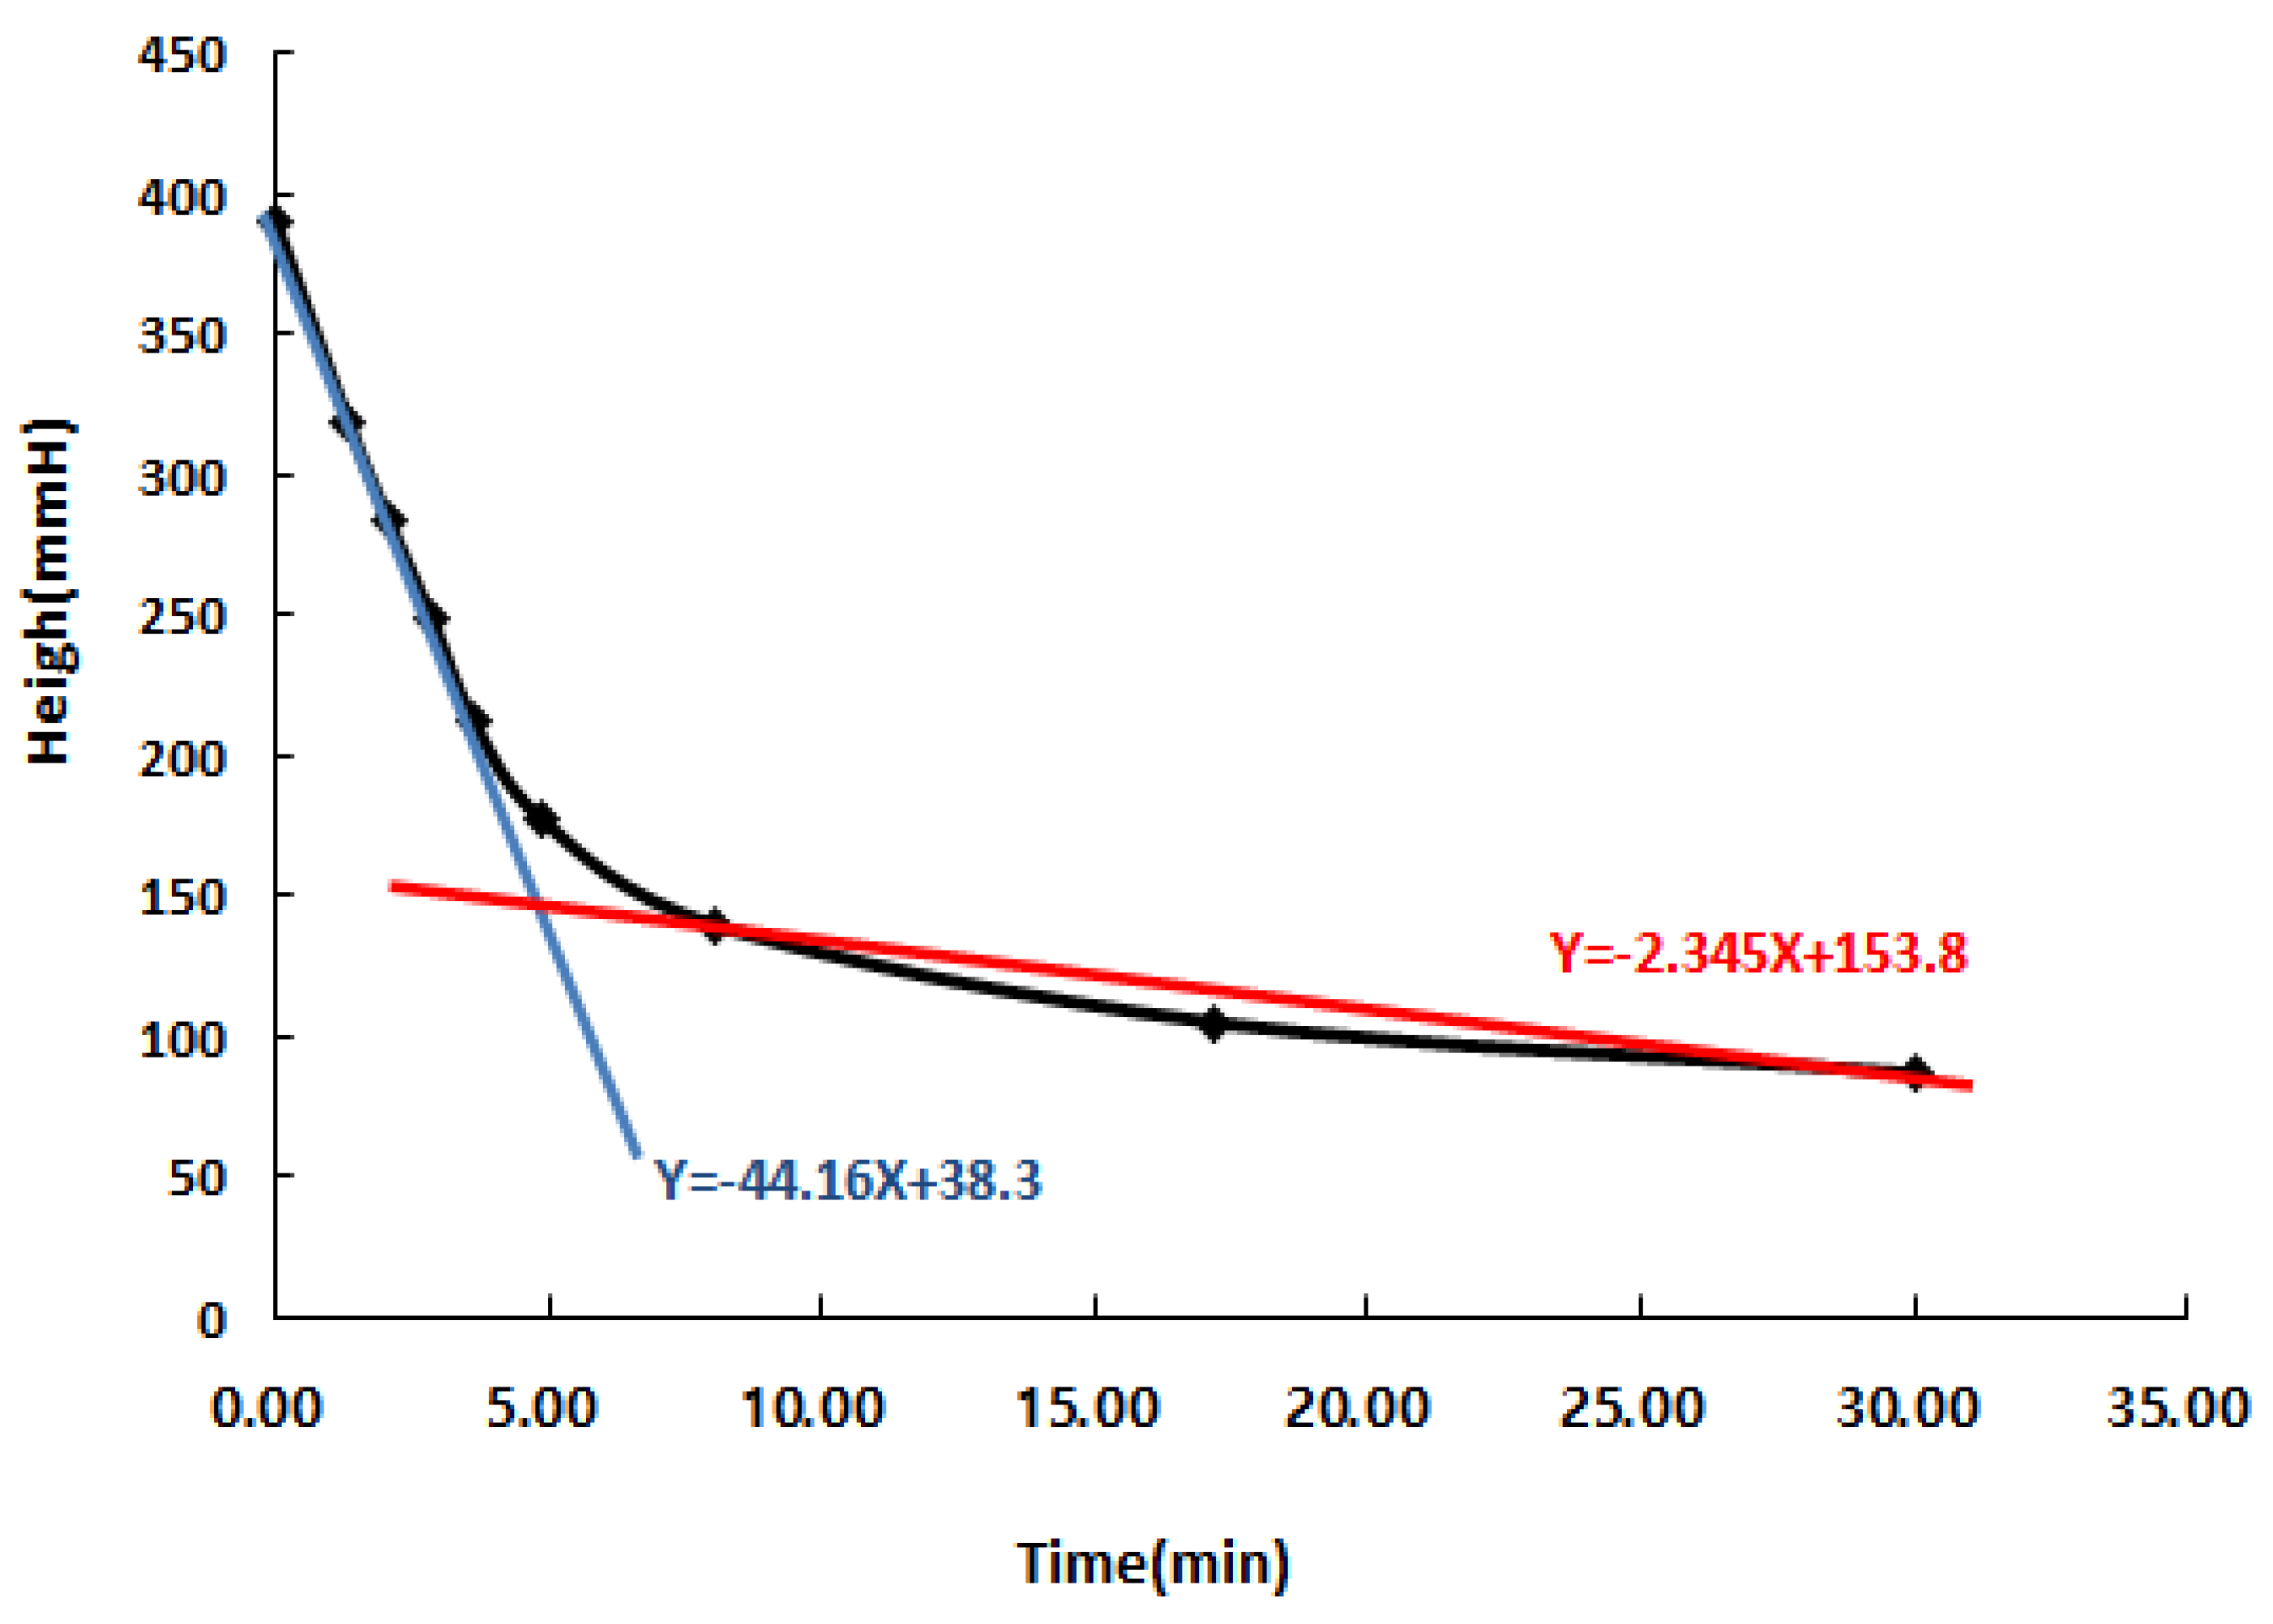
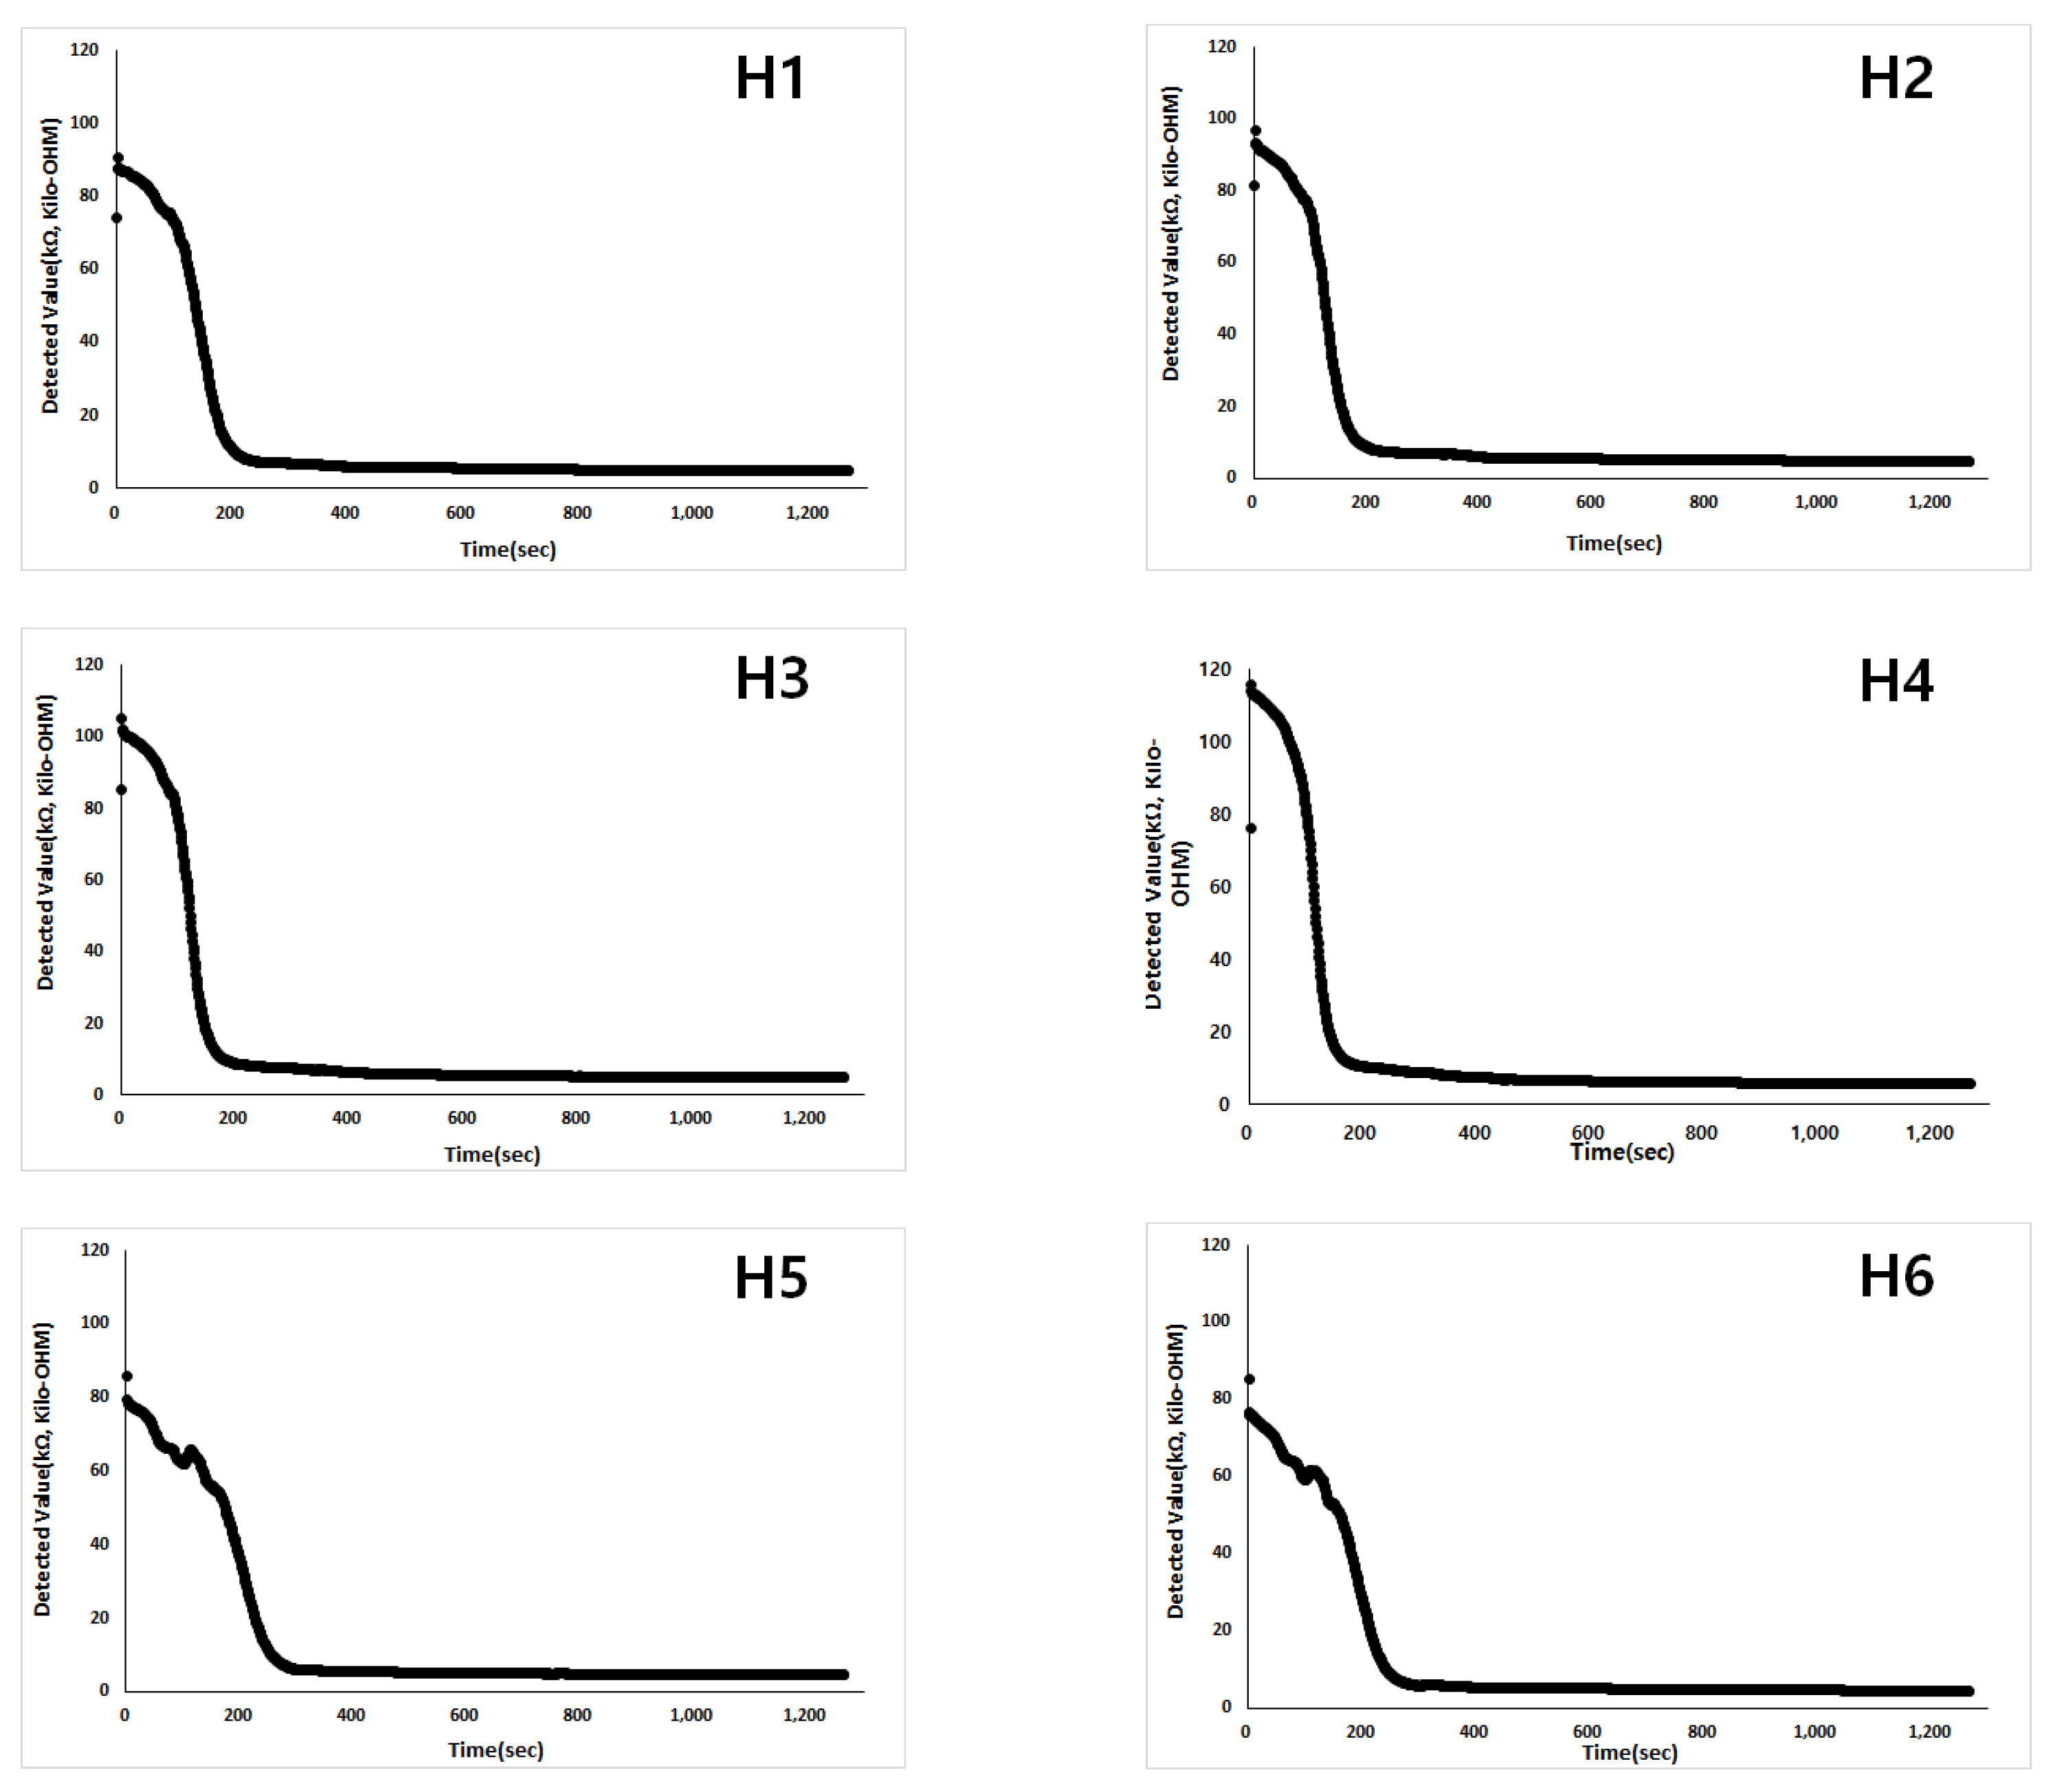
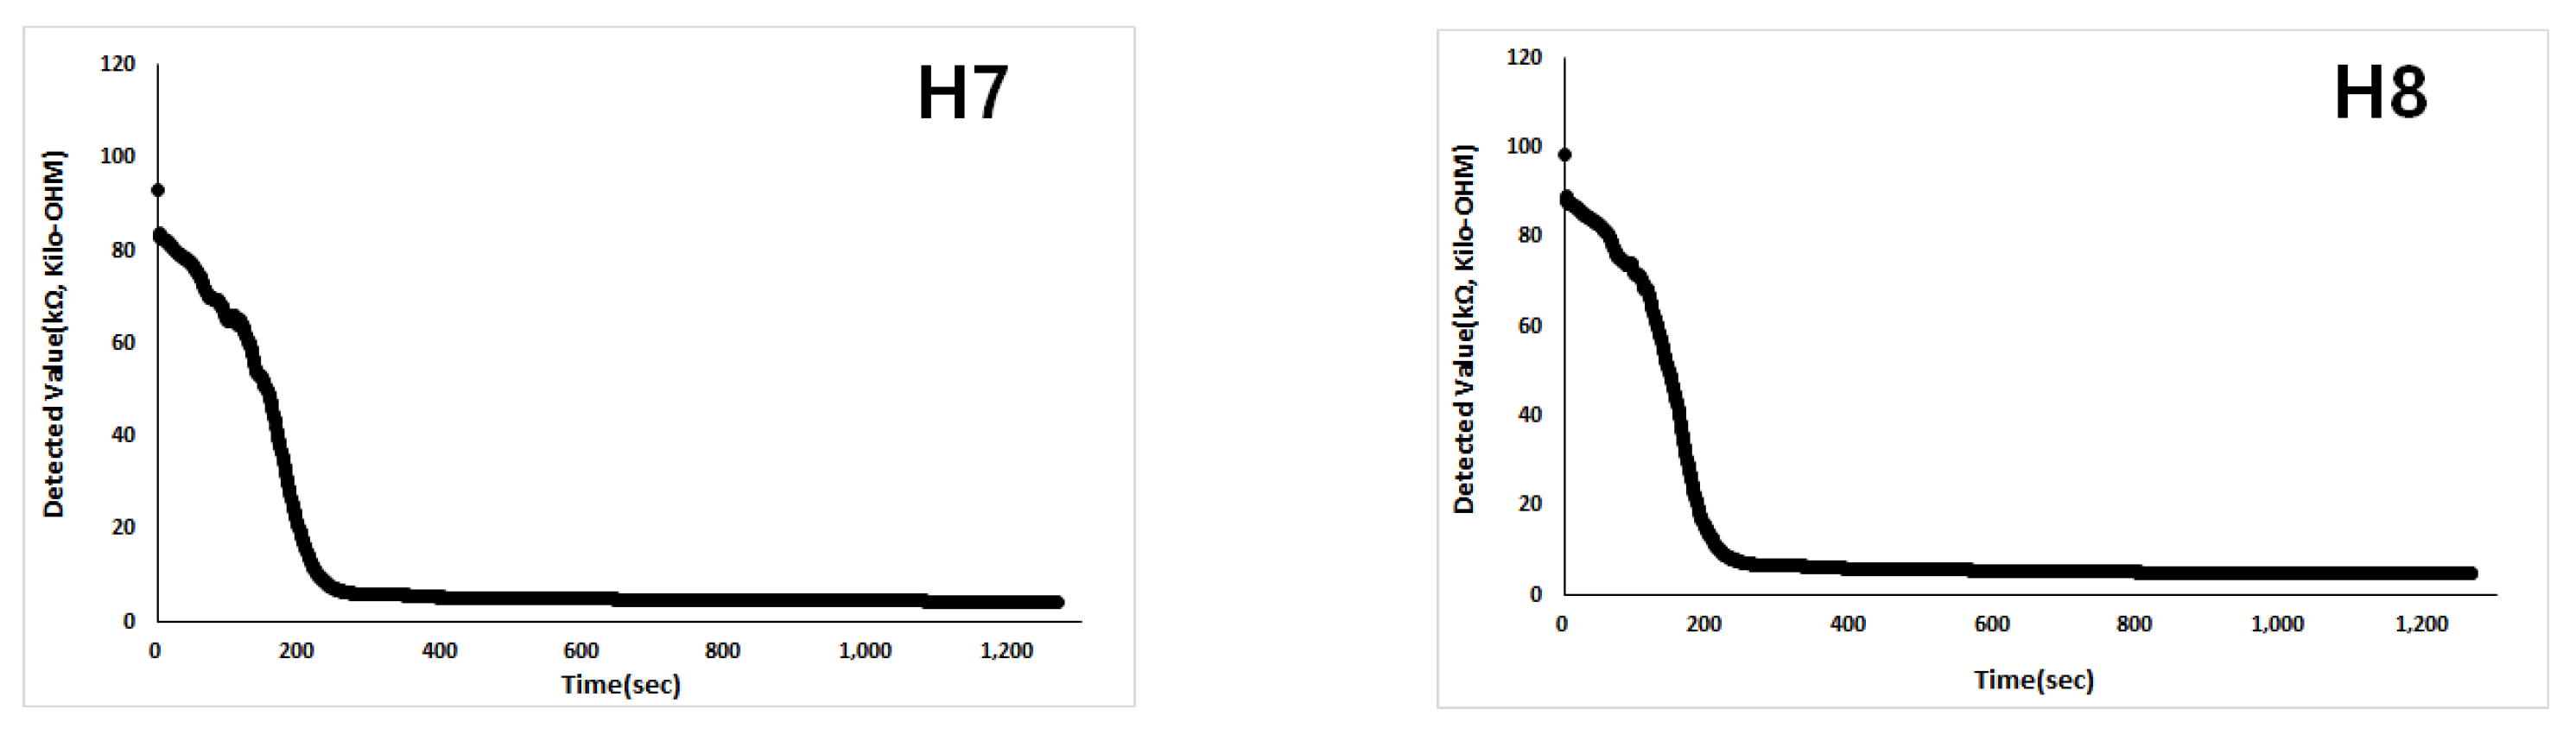
  • In the CdS photoresistor installation height range of H1–H8, the sludge sedimentation velocity was calculated to be 0.594 mm/s in the section where the discrete particle settling occurred for 200 s. In the classical test, the sludge interface height changed from 390 mm to 140 mm in 480 s and, hence, the sludge sedimentation velocity was calculated to be 0.521 mm/s, indicating a similar trend to the sludge sedimentation velocity of the Class Ⅰ type obtained using the CdS photoresistors measuring values.
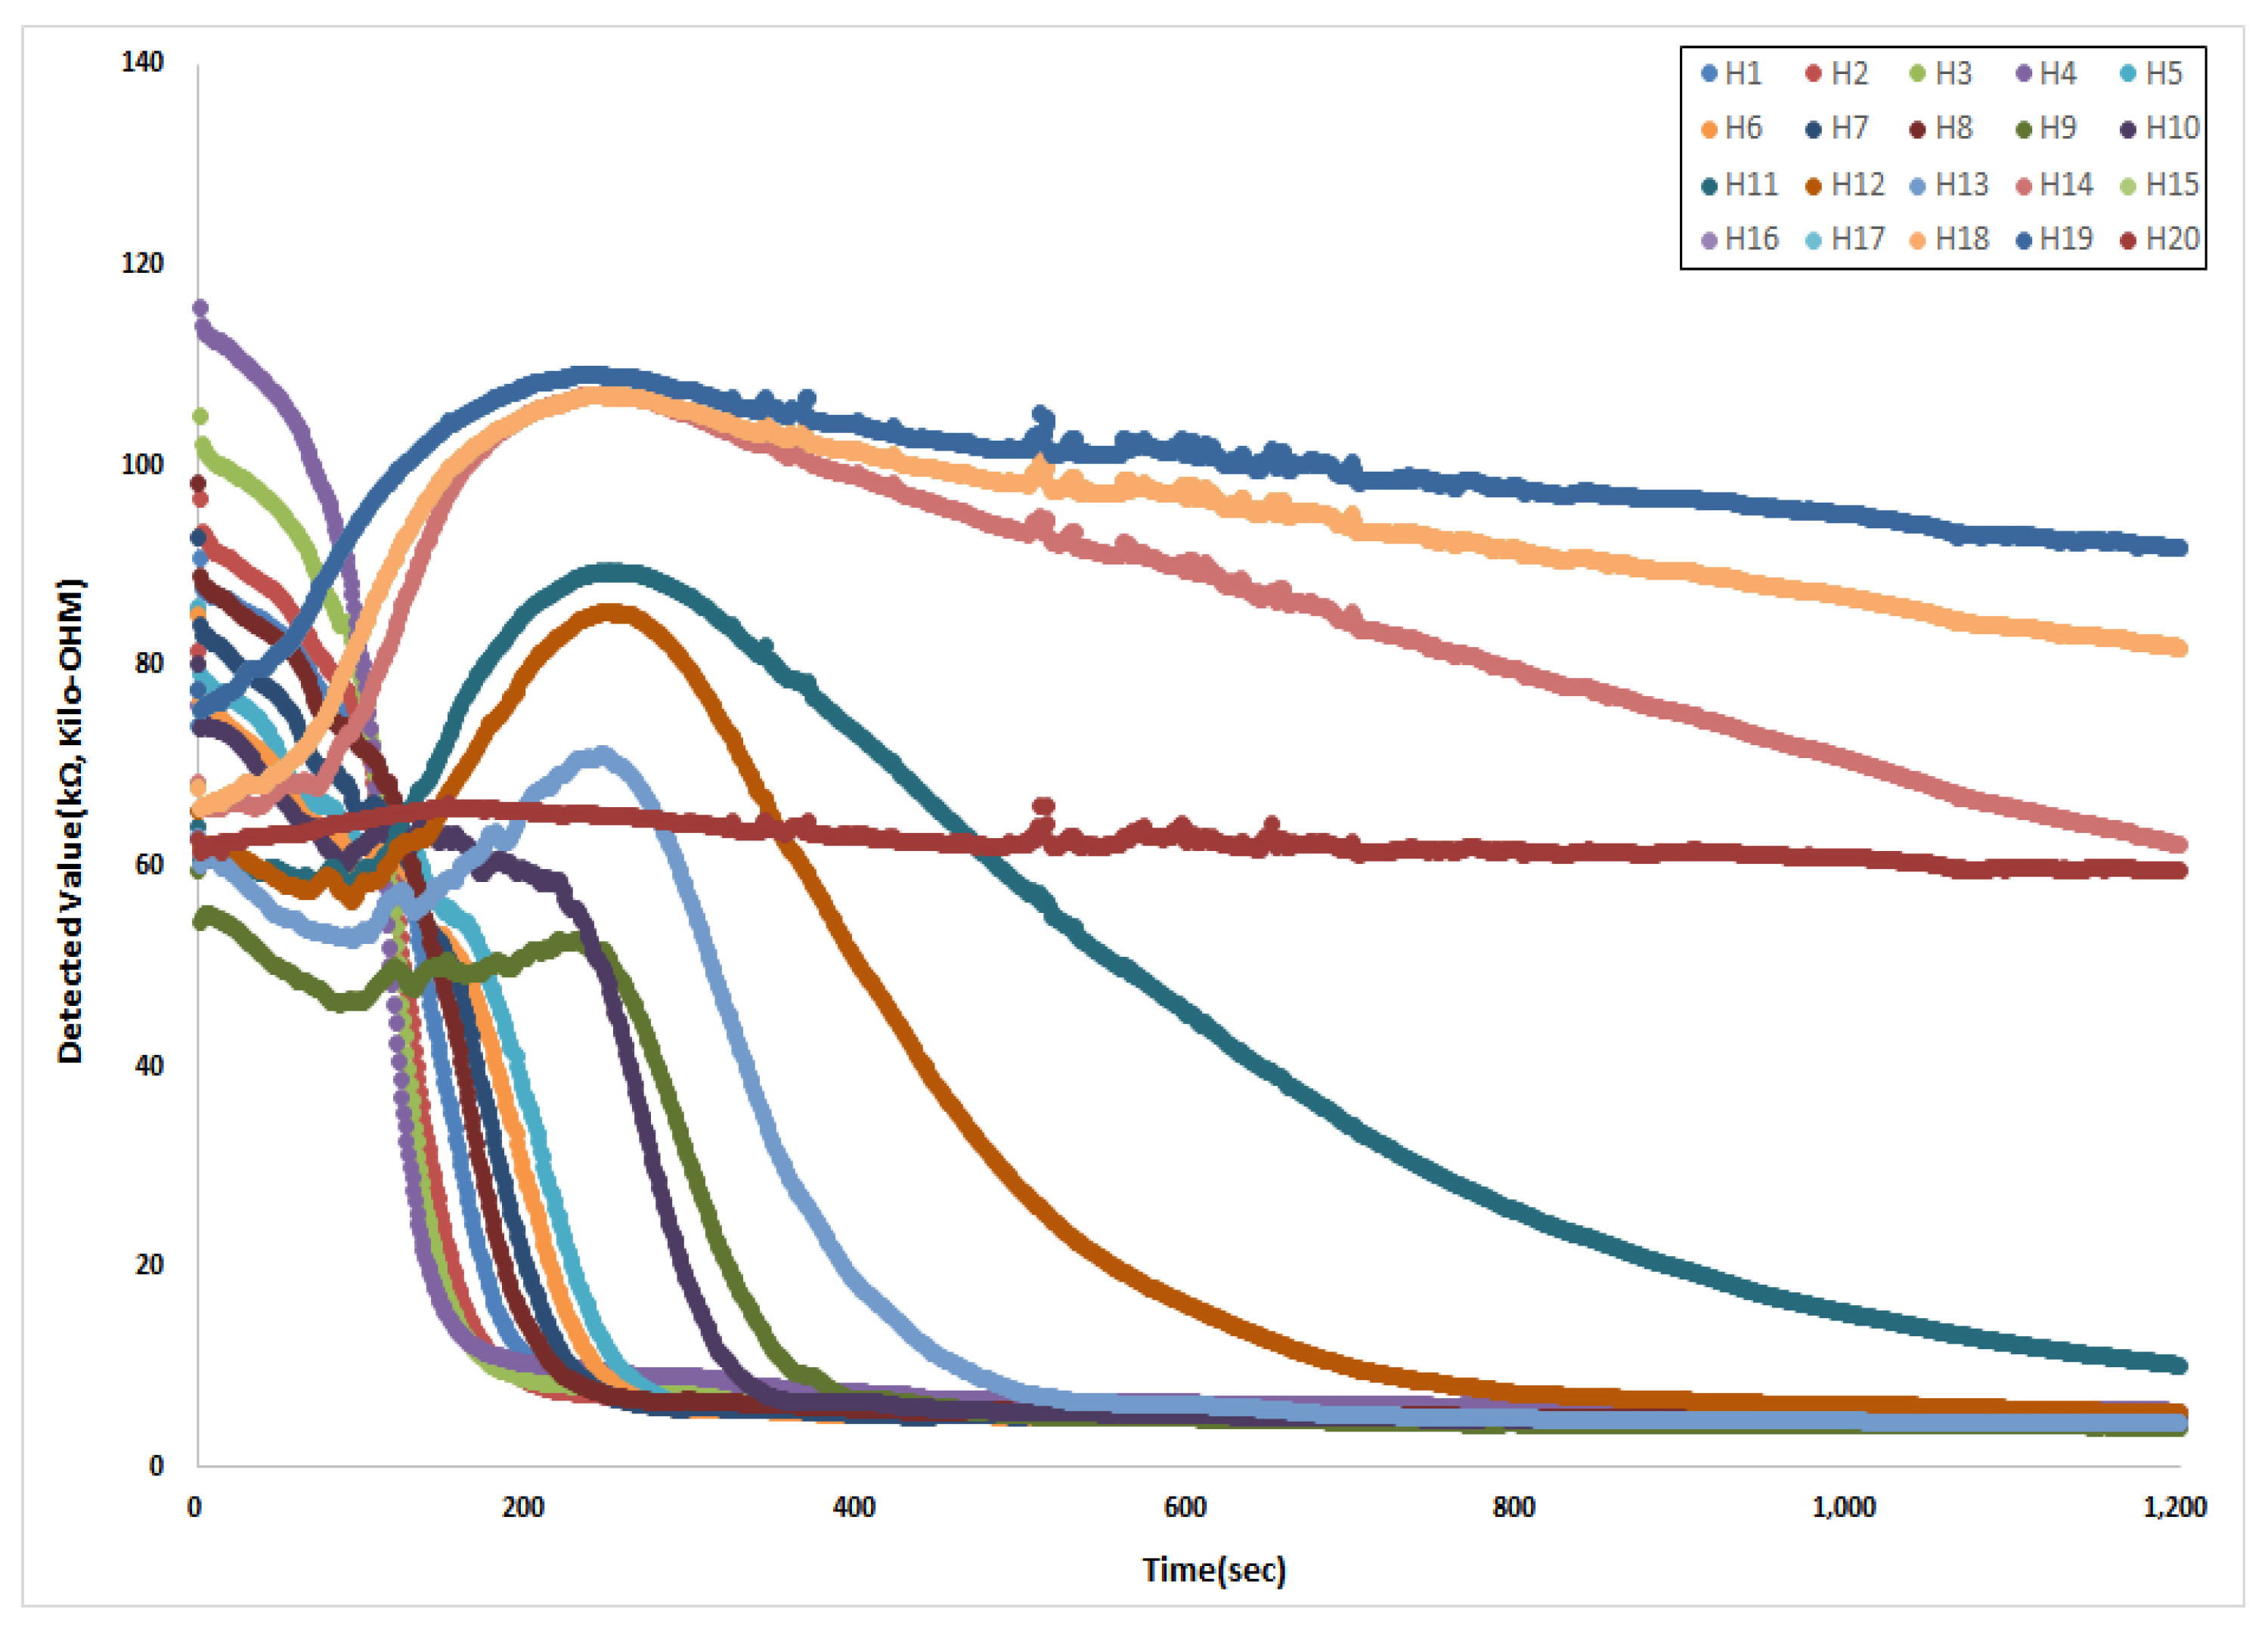
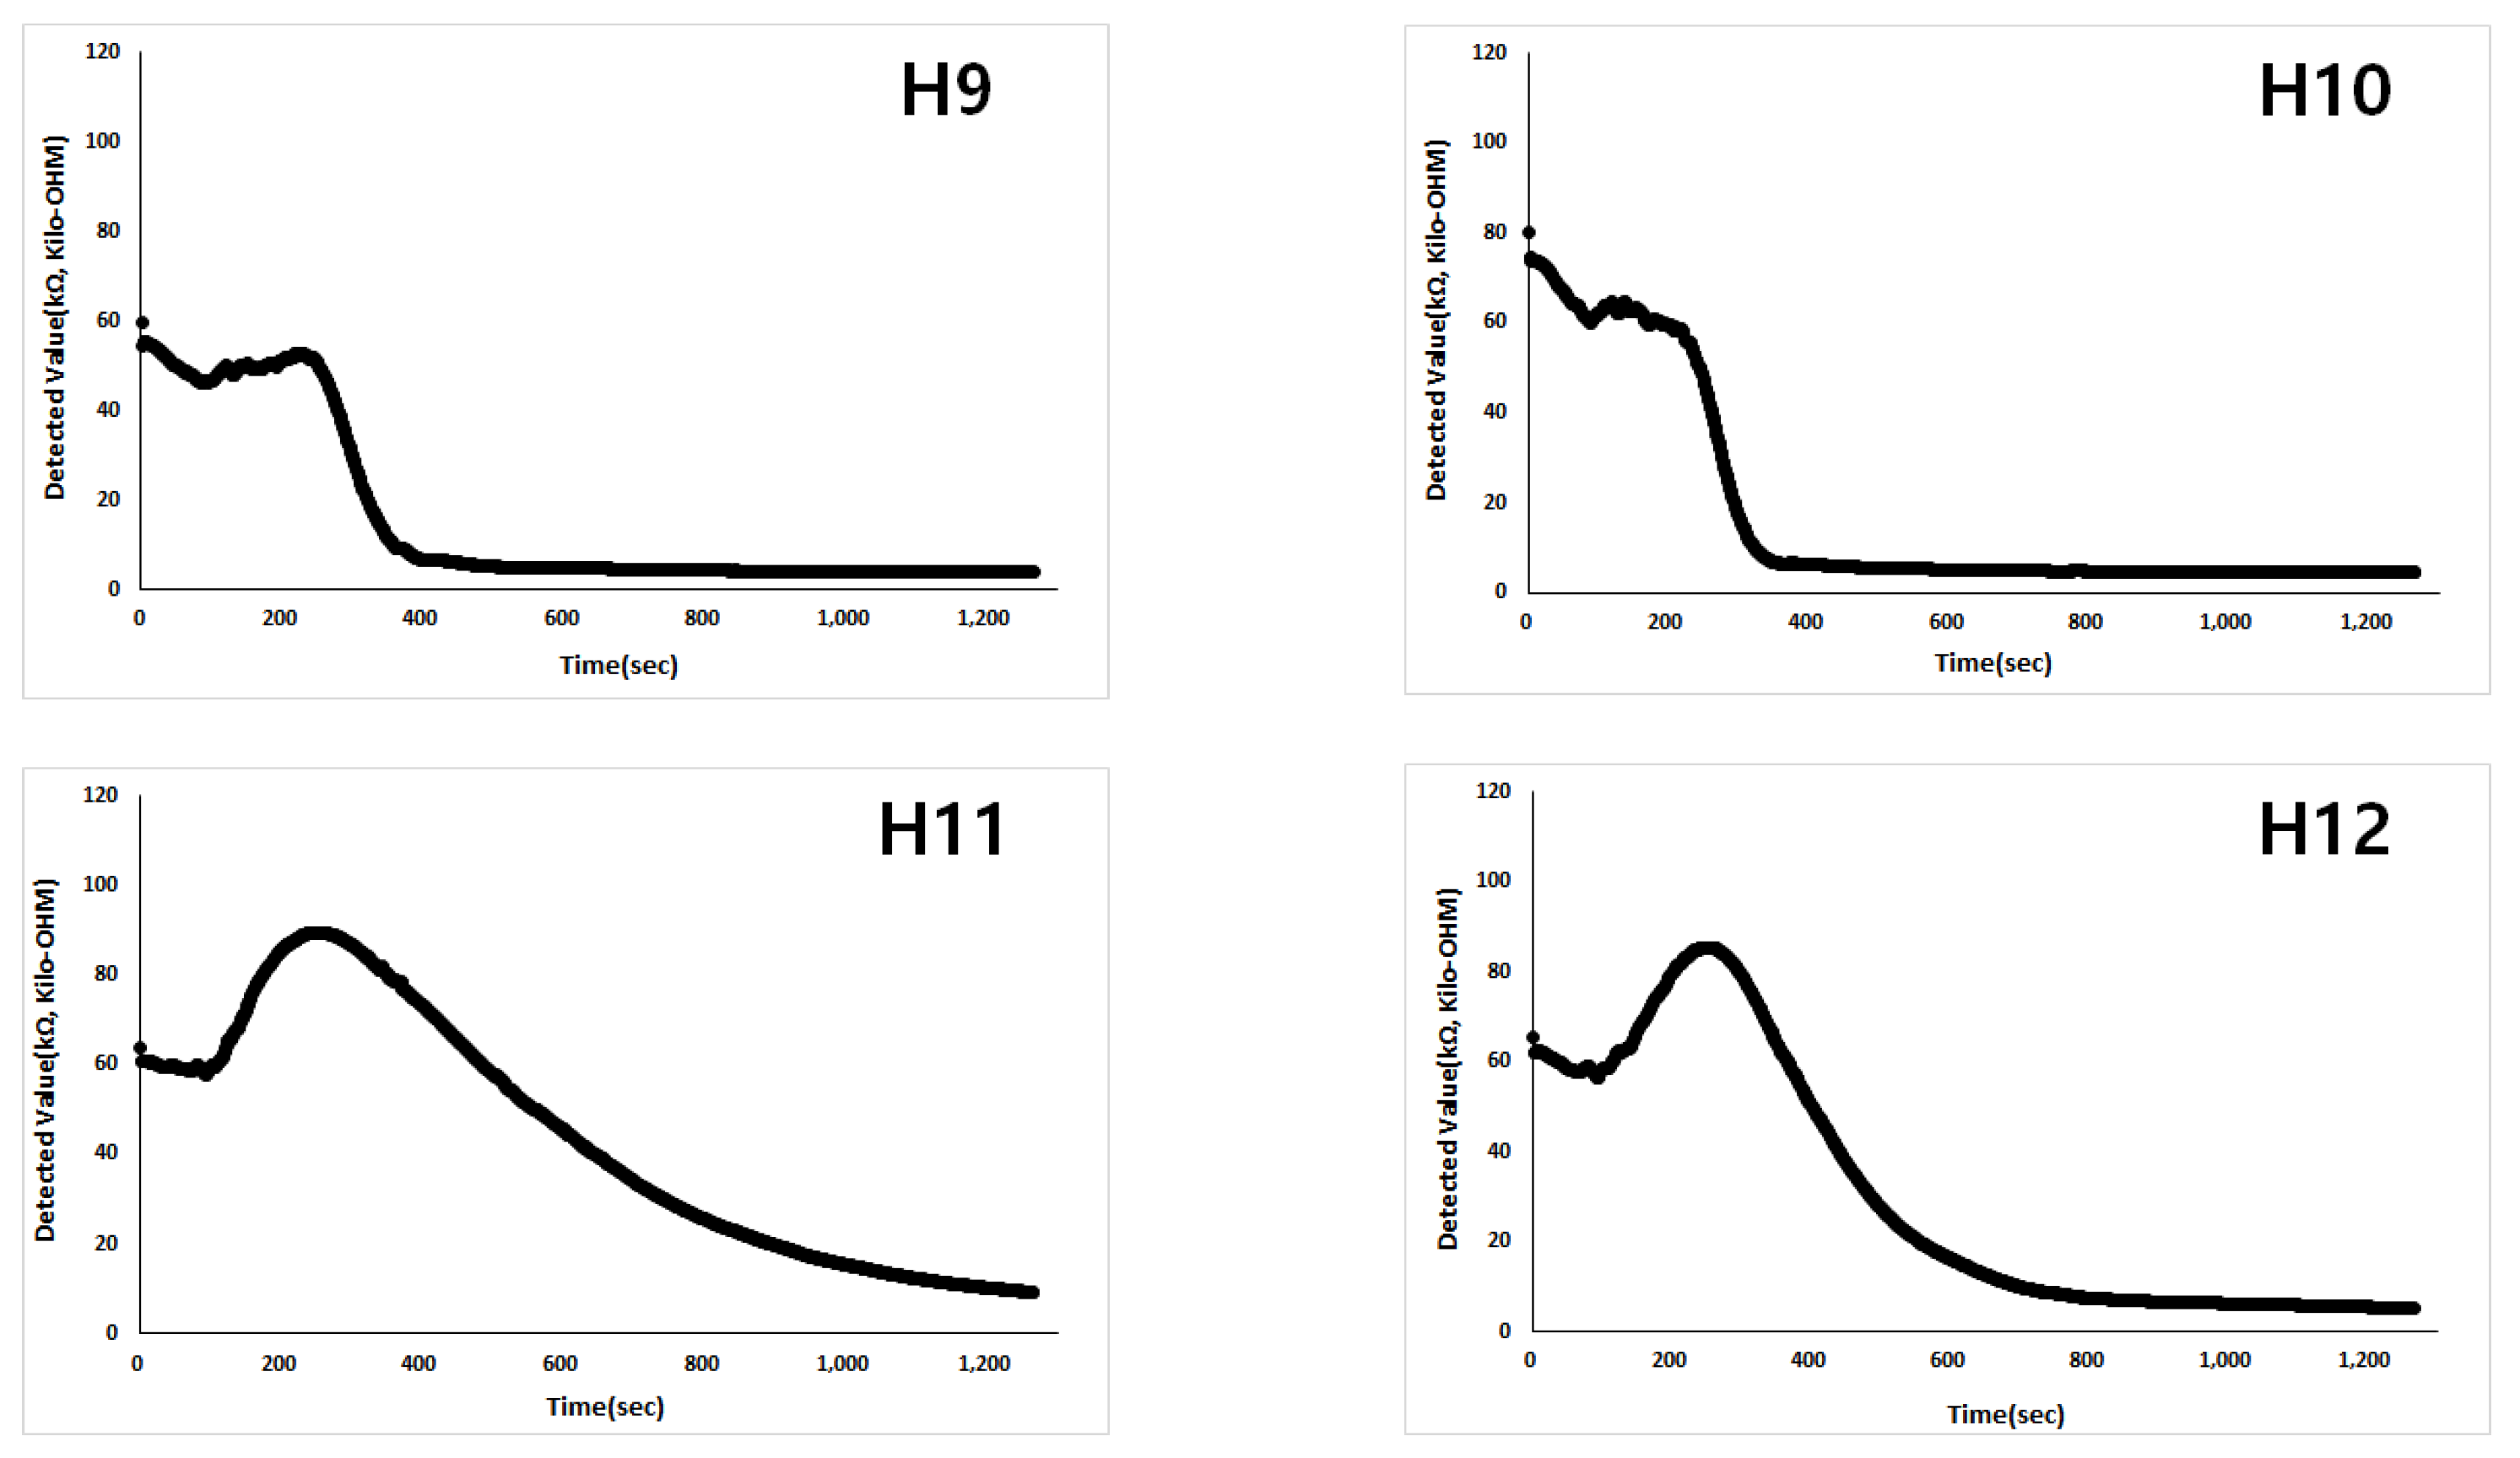
  • The CdS photoresistor installation height of H9 to H12 was 165 mm (H9)–216 mm (H12), and the average value of 67.3 kΩ detected to 60.3 kΩ in 280 s, diminishing by 7.0 kΩ. The average change rate of measured values of CdS photoresistor was low (−0.025 kΩ/s) in the H9 to H12 section, demonstrating the characteristics of flocculent particle settling (Class II) where the particulate solids flocculated into floc as sedimentation velocity 0.183 mm/s.
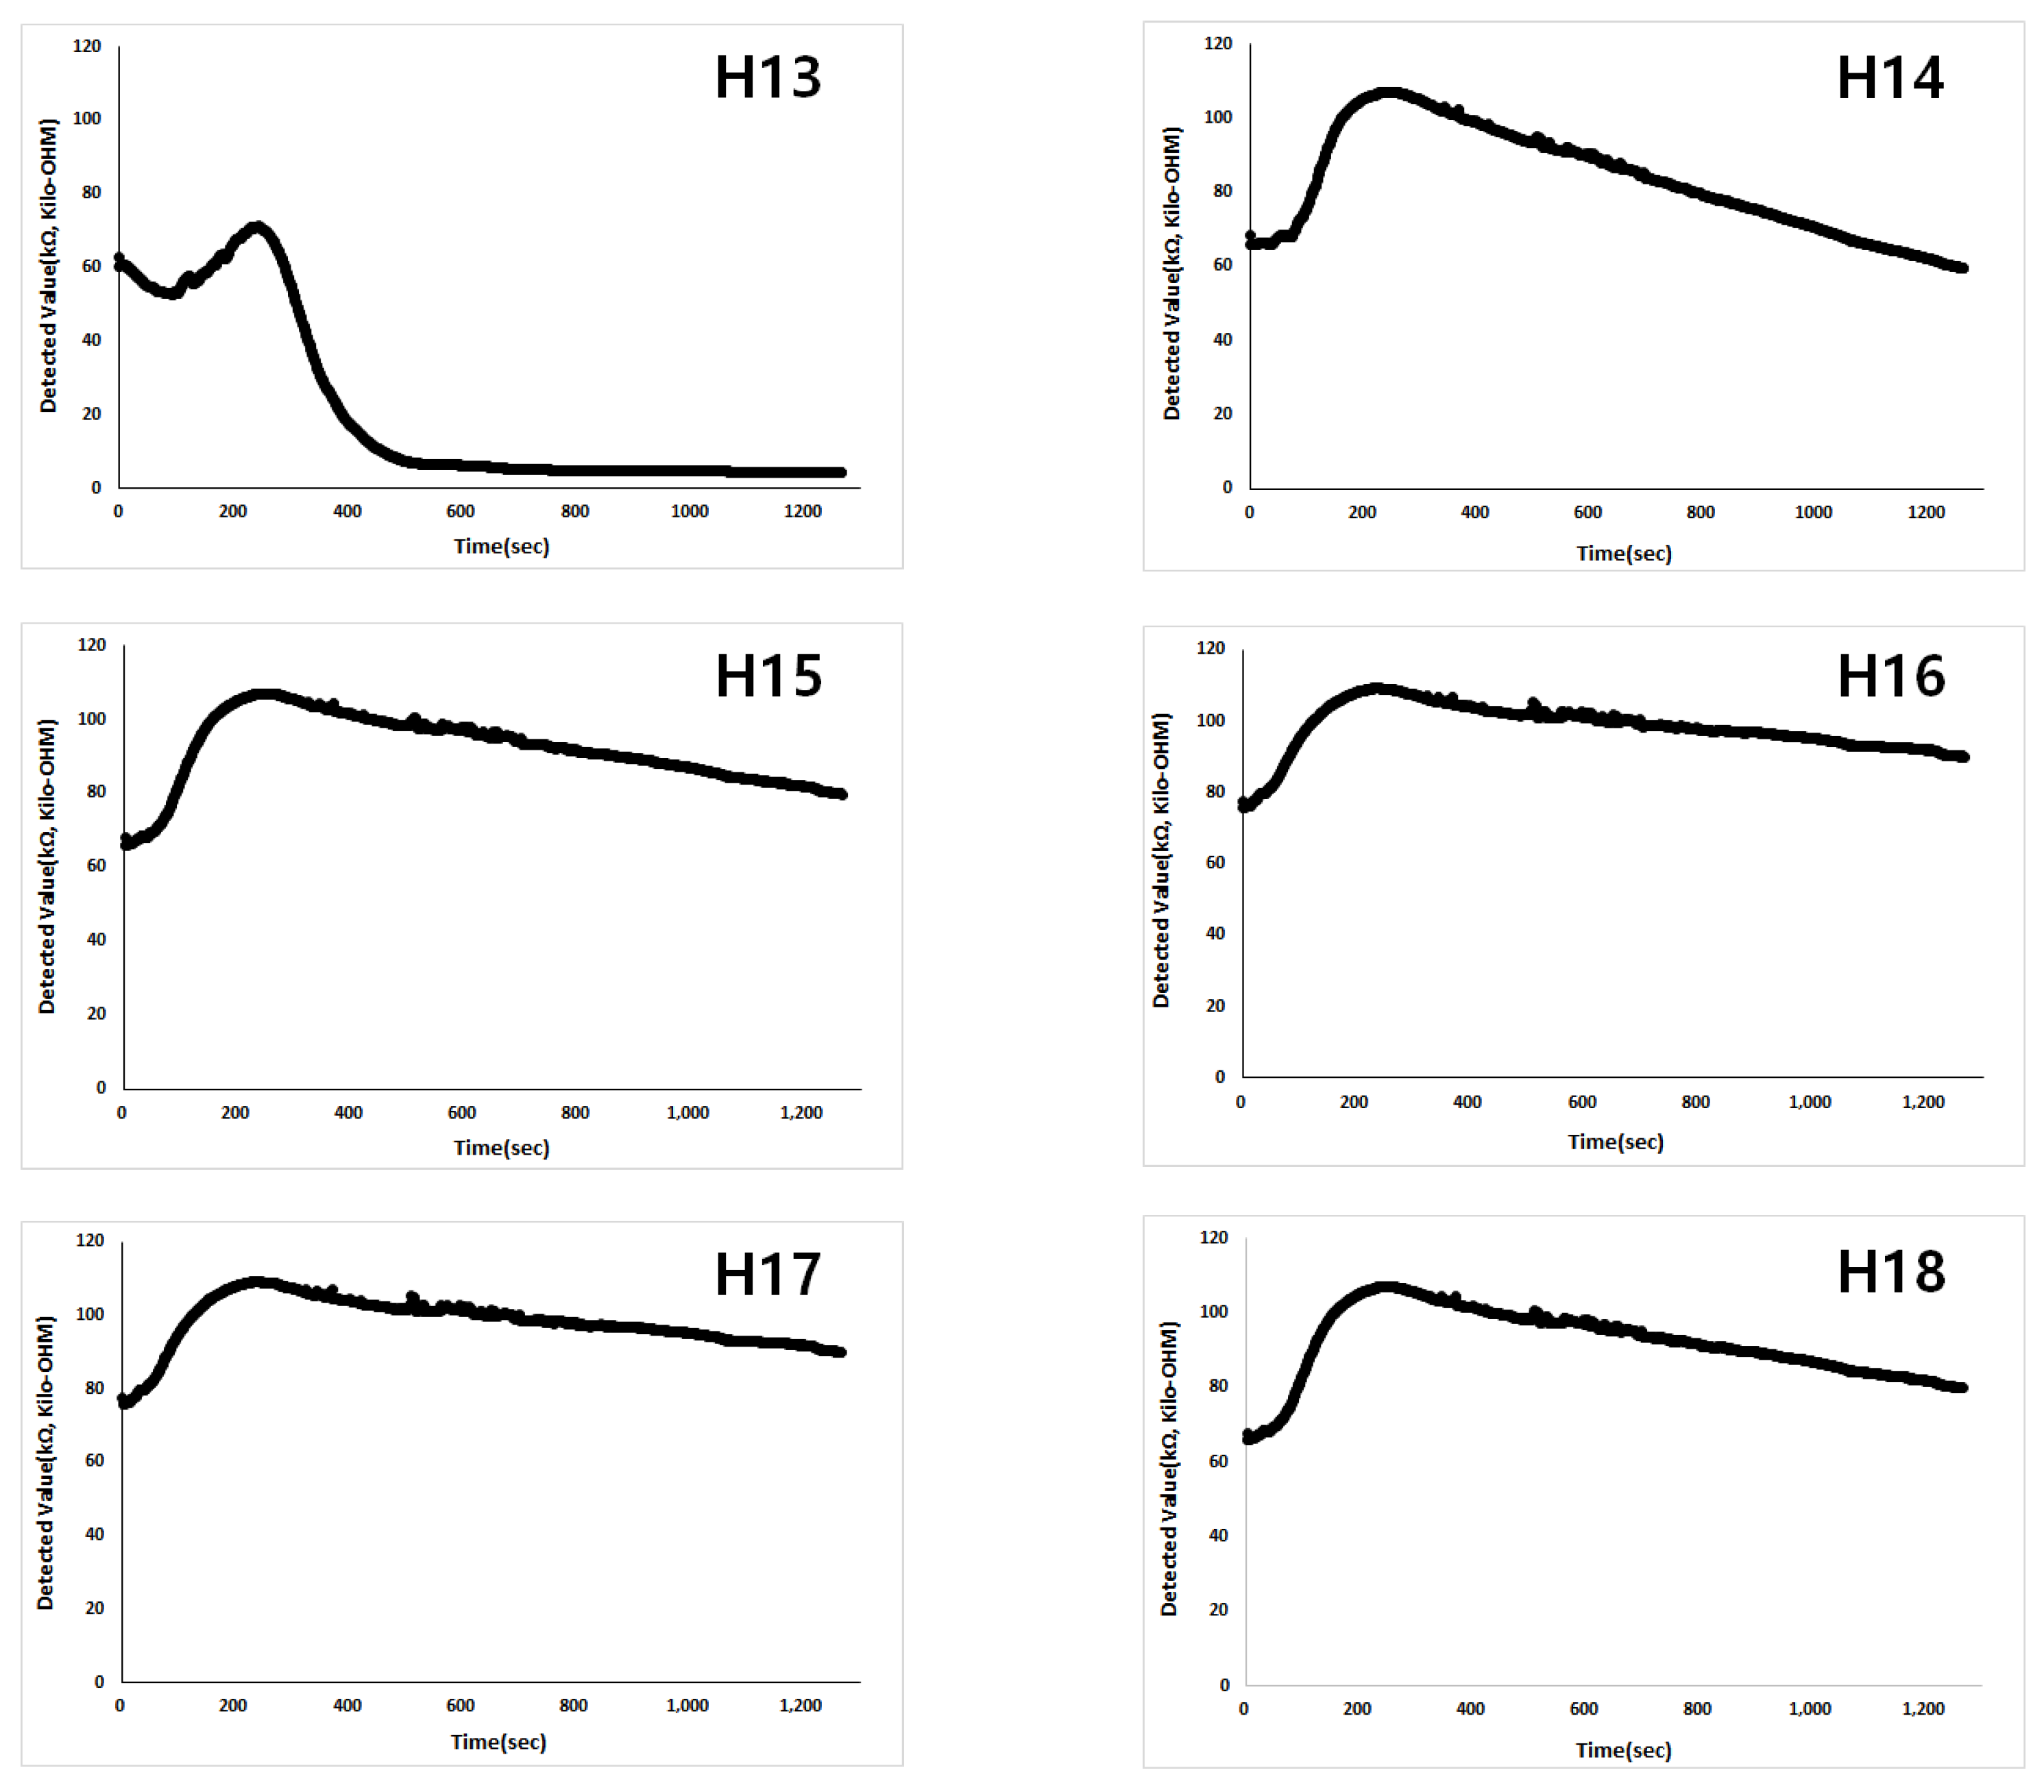
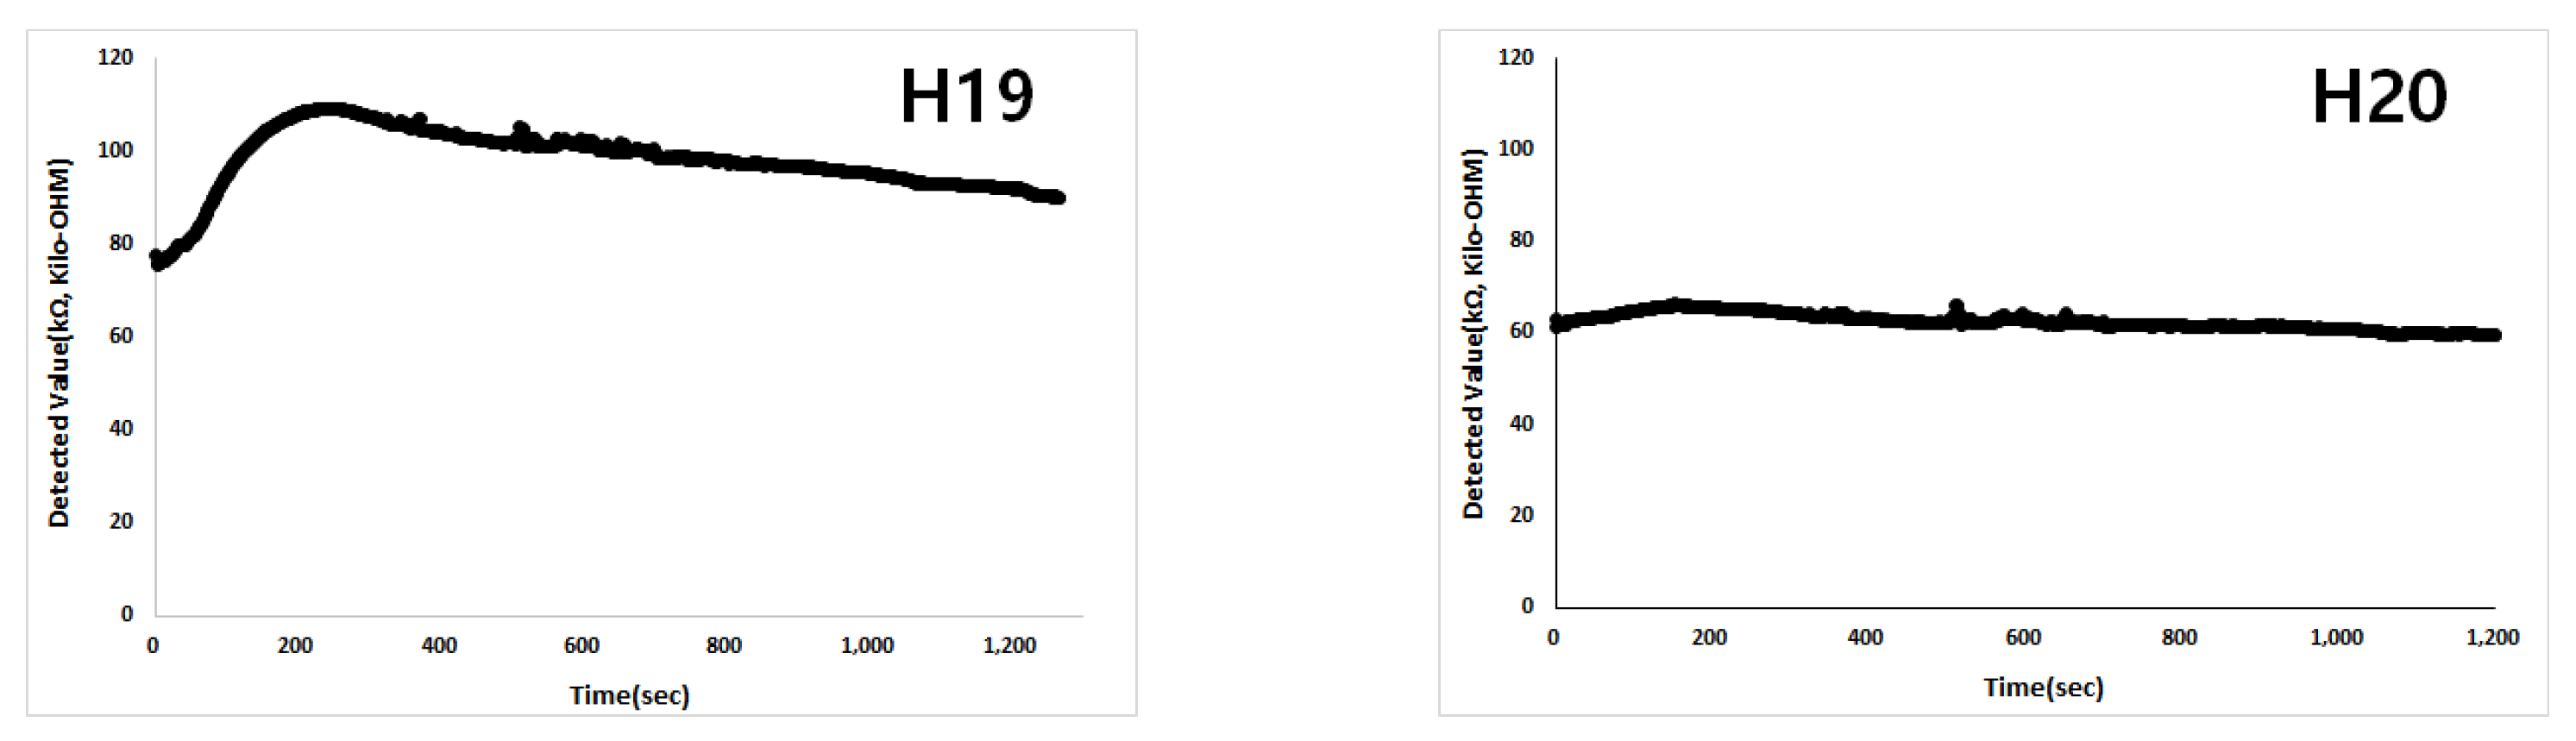
  • Comparing measured values of the CdS photoresistors installed at different heights of H1–H20 with the sludge sedimentation interface changing over time and sedimentation velocities obtained via classical tests, the velocity from flocculent particle settling to compression settling was found to be 0.056 mm/s and 0.068 mm/s, respectively.
  • This study verified that the SVI measurement using CdS photoresistors could measure the change over time more objectively compared to that measured by the subjective tests (classical tests).

Author Contributions

S.-M.H.; Main manuscript wrote; H.-O.K.; Experimental design and data review, manuscript review; C.-G.K.; Manuscript concept planning and review. All authors have read and agreed to the published version of the manuscript.

Funding

This research received no external funding.

Institutional Review Board Statement

Not applicable.

Informed Consent Statement

Not applicable.

Data Availability Statement

Not published in journals, reports, etc.

Acknowledgments

Hyunook Kim was Supported by Korea Environment Industry & Technology Institute Through Plastic, a specialized program of the Graduate School funded by Korea Ministry of Environment (MOE).

Conflicts of Interest

The authors declare no conflict of interest.

References

  1. Zhang, C.M.; Xu, L.M.; Xu, P.C.; Wang, X.C. Elimination of virus from domestic wastewater: Requirements and technologies. World J. Microbio. Biolo. 2016, 32, 69. [Google Scholar]
  2. Tchobanoglous, G.; Burton, F.L.; Stensel, H.D. Wastewater Engineering Treatment and Reuse, 4th ed.; Metcalf & Eddy Inc.: New York, NY, USA, 2003; Volume 1469, pp. 1–2. [Google Scholar]
  3. Activated Sludge Process. Available online: Iwapublishing.com/news/acivited-sludge-pro (accessed on 10 August 2021).
  4. Nabaterega, R.; Kumar, V.; Khoei, S.; Eskicioglu, C. A review on Two-stage anerobic digestion options for optimizing municipal wastewater sludge treatment process. J. Environ. Chem. Eng. 2021, 9, 105502. [Google Scholar] [CrossRef]
  5. Jenkins, D.; Richard, M.G.; Diaigger, G.T. Manual on the Case and Control of Activated Sludge Bulking, Foaming, and Other Solid Separation Problems, 3rd ed.; CRC Press: Boca Raton, FL, USA, 2003; pp. 1–7. [Google Scholar]
  6. Dewil, R.; Baeyensa, J.; Goutrind, R. The use of ultrasonics in the treatment of waste activated sludge. Chin. J. Chem. Eng. 2006, 141, 105–113. [Google Scholar] [CrossRef]
  7. Kotzapetros, A.D.; Paraskevas, P.A.; Stasinakis, A.S. Design of a modern auto matric control system for the activated sludge process in wastewater treatment. Chin. J. Chem. Eng 2015, 23, 1340–1349. [Google Scholar] [CrossRef]
  8. Flores-Alsina, X.; Comas, J.; Rodriguez-Roda, I.; Gernaey, K.V.; Rosen, C. Including the effects of filamentous bulking sludge during the simulation of wastewater treatment plants using a risk assessment model. Water Res. 2009, 43, 4527–4538. [Google Scholar] [CrossRef] [PubMed]
  9. Dick, R.I.; Vesilind, P.A. The sludge volume index: What is it? J. Water Pollut. Control. Fed. 1969, 41, 1285–1291. [Google Scholar]
  10. Banadda, E.N.; Jenne, R.; Smets, I.Y.; Gins, G.; Mys, M.; Van Impe, J.F. Identification and modeling of the sludge volume index by exploiting image analysis information. IFAC Proc. Vol. 2004, 37, 85–90. [Google Scholar] [CrossRef]
  11. Kim, Y.; Yeom, H.S.; Choi, S.J.; Bae, H.Y.; Kim, C.W. Sludge settleability detecting using automated SV30 measurement and comparisons of feature extraction methods. Korean J. Chem. Eng. 2010, 27, 886–892. [Google Scholar] [CrossRef]
  12. Sun, K.; Artan, N.S.; Dong, Z. CALC: Calibration for ambient light correction in screen to camera visible light communication. Results Opt. 2021, 5, 100122. [Google Scholar] [CrossRef]
  13. Xiong, N.N.; Shen, Y.; Yang, K.; Lee, C.; Wu, C. Color sensors and their applications based on real-time color image segmentation for cyber physical systems. EURASIP J. Image Video Process. 2018, 2018, 23. [Google Scholar] [CrossRef]
  14. Sinclair, I. Passive Components for Circuit Design, 1st ed.; Elsevier Inc.: Amsterdam, The Netherlands, 2002. [Google Scholar]
  15. Christenson, J. Sensor and Transducers, Hand Book of Biomechatronics; Academic Press: London, UK, 2019; pp. 61–93. [Google Scholar]
  16. Photoresistor, Chapter 3. Resistor Type. Available online: https://eepower.comresistor-types/photo-resistor/# (accessed on 15 September 2021).
  17. FYL-5014UMIC Data Sheet. Available online: Unisystem-displays.com/en/foryard.html (accessed on 15 September 2021).
  18. Photocells A 9050 Data Sheet. Available online: www.perkinelmer.com/opto (accessed on 15 September 2021).
  19. Fang, F.; Qiao, L.L.; Cao, J.S.; Li, Y.; Xie, W.M.; Sheng, G.P.; Yu, H.Q. Quantitative evaluation of A2O and reversed A2O process for biological municipal wastewater treatment using a projection pursuit method. Sep. Purif. Technol. 2016, 166, 164–170. [Google Scholar] [CrossRef]
  20. Rice, E.W.; Baird, R.B.; Eaton, A.D. Standard Method for the Examination of Water and Wastewater, 23rd ed.; American Public Health Association: Washington, DC, USA, 2017. [Google Scholar]
  21. Choi, J.H.; Kim, J.S.; Jung, G.I.; Lee, T.H.; Kim, A.H.; Oh, H.B.; Park, H.J.; Kim, K.S.; Jun, J.H. Estimation of the light intensity by using bright-chip LED sensor system. Trans. Korean Inst. Electr. Eng. 2013, 62, 290–1296. [Google Scholar]
  22. Liu, J.; Liang, Y.; Wang, L.; Wang, B.; Zhang, T.; Yi, F. Fabrication and photosensitivity of CdS photoresistor on silica nanopillars substrate. Mater. Semicond. Process. 2016, 56, 217–221. [Google Scholar] [CrossRef]
Figure 1. (a) Flow chart of the sludge settling test device. (b) Photo of the sludge settling test device set.
Energies 14 07817 g001aEnergies 14 07817 g001b
Figure 2. LED characteristic. (a): Relative luminous intensity, (b): Spectral distribution.
Energies 14 07817 g002
Figure 3. Initial for installation of CdS photoresistors height.
Energies 14 07817 g003
Figure 4. Blank test for the sludge settling measurement sensor (●: without cylinder, ◊: with cylinder).
Energies 14 07817 g004
Figure 5. Visual test on sludge sedimentation trend.
Energies 14 07817 g005
Figure 6. Measurement of the bioreactor sludge by the sludge sedimentation measuring sensor.
Energies 14 07817 g006
Figure 7. Variation of H1H8 CdS photoresistors in sludge sedimentation detecting.
Energies 14 07817 g007aEnergies 14 07817 g007b
Figure 8. Variation of H9H12 CdS photoresistors in sludge sedimentation detecting.
Energies 14 07817 g008
Figure 9. Variation of H13H20 CdS photoresistors in sludge sedimentation detecting.
Energies 14 07817 g009aEnergies 14 07817 g009b
Table 1. Electrical and optical characteristics (Ta = 25 °C).
ParameterOperating ValueUnit
Luminous Intensity27,000mcd (a)
View angle15Deg. (b)
Chromaticity coordinates (c)X0.29-
Y0.29-
Color temperature (d)9500K
LED operating electronic condition: I = 20 mA, V = 5 V. (a) milli-candela. (b) Degrees. (c) Color that can be recognized by humans is expressed in coordinates. (d) Various spectroscopic expression units classified at the light source (Kelvin temperature (K), Red: low color temperature, Blue: high color temperature).
Table 2. Characteristic of bioreactor condition and bioreactor sludge.
ListOrganic Load Applied to Bioreactor
(kg-COD (a)/kg-MLSS/Day)
MLSS
(mg/L)
DO
(mg/L)
pH
Bioreactor sludge1.03800.01.26.9
(a) CODcr: 3781.0 mg/L.
Table 3. CdS photoresistor specification.
Part No.R10 Range
(kΩ)
R100 Typ.
(kΩ)
R10 min.
(MΩ)
R05 min.
(MΩ)
γ10/100λpeak
(nm)
A90501218–1470.150.450.65530
R10 Resistance at E = 10 lux light intensityTst Storage Temperature
TC Thermal Coefficient
R100 Resistance at E = 100 lux light intensity
R01 Dark Resistance after 1 s (E = 0)ton Rise time to 63% of final I (R10)
R05 Dark Resistance after 5 s (E = 0)toff Decay time to 37% of initial I (R10)
γ10/100 Sensitivity log (R10/R100)/log (100 lux/10 lux)Vmax Maximum operating voltage at E = 0 lux
λpeak Peak spectral sensitivityPmax Power dissipation at 25 °C Ambient Temperature
Top Operating temperature
Publisher’s Note: MDPI stays neutral with regard to jurisdictional claims in published maps and institutional affiliations.

