Article

A Novel Generator Design Utilised for Conventional Ejector Refrigeration Systems

by
Anas F. A. Elbarghthi
,
Mohammad Yousef Hdaib
* and
Václav Dvořák
Department of Applied Mechanics, Faculty of Mechanical Engineering, Technical University of Liberec, Stdentská 1402/2, 46117 Liberec, Czech Republic
*
Author to whom correspondence should be addressed.
Energies 2021, 14(22), 7705; https://doi.org/10.3390/en14227705
Submission received: 29 September 2021 / Revised: 11 November 2021 / Accepted: 13 November 2021 / Published: 17 November 2021
(This article belongs to the Topic Exergy Analysis and Its Applications)

Abstract

:
Ejector refrigeration systems are rapidly evolving and are poised to become one of the most preferred cooling systems in the near future. CO2 transcritical refrigeration systems have inherently high working pressures and discharge temperatures, providing a large volumetric heating capacity. In the current research, the heat ejected from the CO2 gas cooler was proposed as a driving heating source for the compression ejector system, representing the energy supply for the generator in a combined cycle. The local design approach was investigated for the combined plate-type heat exchanger (PHE) via Matlab code integrated with the NIST real gas database. HFO refrigerants (1234ze(E) and 1234yf) were selected to serve as the cold fluid on the generator flowing through three different phases: subcooled liquid, a two-phase mixture, and superheated vapour. The study examines the following: the effectiveness, the heat transfer coefficients, and the pressure drop of the PHE working fluids under variable hot stream pressures, cold stream flow fluxes, and superheated temperatures. The integration revealed that the cold fluid mixture phase dominates the heat transfer coefficients and the pressure drop of the heat exchanger. By increasing the hot stream inlet pressure from 9 MPa to 12 MPa, the cold stream two-phase convection coefficient can be enhanced by 50% and 200% for R1234yf and R1234ze(E), respectively. Conversely, the cold stream two-phase convection coefficient dropped by 17% and 37% for R1234yf and R1234ze(E), respectively. The overall result supports utilising the ejected heat from the CO2 transcritical system, especially at high CO2 inlet pressures and low cold channel flow fluxes. Moreover, R1234ze(E) could be a more suitable working fluid because it possesses a lower pressure drop and bond number.

1. Introduction

An ejector is a flow device that mixes streams of primary and secondary inlet flows then discharges them to an intermediate pressure referred to as backpressure. The refrigeration cycle could be supported with two types of ejectors based on the application and the purpose: the expansion ejector refrigeration cycle, where the ejector replaces the expansion valve as represented in CO2 (denoted R744) transcritical refrigeration systems, and the compression ejector, where it replaces the compressor [1]. For the compression ejector refrigeration cycle (CERC), the generator’s heat source type is essential for improving the cycle coefficient of performance. Several studies considered different low-grade heat sources used to drive the cycle and perform the generation process, such as solar collectors, an absorption cycle, geothermal energy, and waste heat from power plants [2,3,4,5,6,7]. However, multiple eco-friendly solutions have been developed in the refrigeration sector, and the market is witnessing an increase in commercial CO2 refrigeration systems worldwide. Therefore, utilising the gas cooler heat ejected at high discharge temperatures from the transcritical cooling system can represent an energy source for the compression ejector refrigeration system, which has not been identified in the open literature as a solution.
Plate heat exchangers (PHEs) are commonly used for design considerations in refrigeration cycles due to the performance enhancement, ease of installation, low refrigerant charge, and large heat transfer area per volume [8]. A plate heat exchanger is a heat exchanging device that consists of closely packed plates that represent alternative flow channels for the cold and hot streams [9]. Two approaches can be used for PHE design: the first is the lumped analysis, in which the whole heat exchanger is considered to be one control volume. The second one is the local analysis, in which the control volume is divided into artificial portions to consider a multiple-phase flow or a nonlinear change in the flowing fluid properties [10,11]. The heat transfer has three stages for the generator side: forced convection of subcooled liquid, flow boiling of two-phase mixture, and forced convection of superheated vapour. The flow boiling heat transfer has three regimes: a nucleate boiling regime, a two-phase convective boiling regime, and a transition regime. For the evaporation process, the two-phase convective boiling regime is dominant [12].
In previous studies, the frictional pressure drop and the heat transfer coefficient were thoroughly investigated for single and two-phase flows. Plenty of single-phase flow correlations have been theoretically discussed in terms of the Nusselt number and friction coefficient [13,14]. On the other hand, many other authors have proposed similar correlations based on experimental data [15,16,17,18]. In the case of two-phase flow, Lockhart and Martinelli [19], followed by Chisholm [20], presented a correlation for frictional pressure drop based on the flow regime. Recent studies calculated the two-phase frictional pressure drop by the kinetic energy per unit volume or the two-phase fanning friction coefficient [12]. Amalfi et al. [8,21] proposed numerical correlations for the Nusselt number and friction coefficient. The correlations revealed by the authors could predict 90.9% and 92.3% of 1513 and 1903 experimental data points with a mean absolute error of 21.5% and 22.1% for the friction coefficient and the Nusselt number, respectively.
Some of the crucial factors that should be considered in the design procedures of the PHE for refrigeration systems is the environmental regulations of the working fluids. The main regulations are represented by the two common definitions: the ozone-depleting potential (ODP) and the global warming potential (GWP). The former represents the ratio of the global loss of ozone to the discharged unit mass of the ozone-depleting gas with respect to R11 as a reference [22]. The latter means the cumulative radiative force due to discharge of the unit mass of a specific global warming gas with respect to a reference gas; usually, CO2 is used as a reference [23]. At present, the general allowable values of ODP and GWP are less than 0.4 and 2500, respectively [24,25]. The used HFOs and the R744 have values lower than the allowable ones with zero ODP and GWP < 4 [26,27,28]. Therefore, the early studies of evaporation heat transfer in PHEs were performed on refrigerants with high ODP and GWP [29,30,31]. In contrast, the recent studies have focused more on environmentally friendly refrigerants due to the restrictions imposed by the international regulations on the allowable ODP and GWP [25]. Huang et al. [32] presented correlations for two-phase heat transfer coefficients and the pressure drop of R134a and R507 with three different chevron angle combinations (28, 28/60, and 60). The mean absolute errors of the proposed correlations were 7.3% and 6.7% for the heat transfer coefficients and the frictional pressure drop, respectively. Longo and collaborators studied recently released HFOs [25,33,34,35] and investigated the heat transfer coefficients and frictional pressure drop during the evaporation process for different mass and heat fluxes, saturation temperatures, and outlet conditions. Their most essential conclusion was that the heat transfer coefficients are slightly dependent on the saturation temperature. The result indicated that the frictional pressure drop has a linear dependence on the refrigerant’s kinetic energy per unit volume and R1234yf has lower heat transfer coefficients and a lower frictional pressure drop than R134a. Moreover, R1234ze(e) substitutes for R134a and R1234yf as they have similar heat transfer coefficients and a slightly lower frictional pressure drop.
The transcritical CO2 is preferably used for refrigeration systems because of its low critical temperature and pressure, which overcome the inefficiency problems [36]. Heat transfer coefficients and the pressure drop of CO2 have been analysed in many types of research. However, most of the mentioned studies in the literature were applied to channel or tube heat exchangers [37]. In contrast, Zendehboudi et al. [12] experimentally investigated supercritical CO2 as a hot fluid in brazed PHEs of a tri-partite gas cooler. The authors found that the correlations mentioned in the literature for the Nusselt number were not applicable for their case. These correlations are either based on a different supercritical fluid or derived for a channel or tube heat exchanger. Moreover, their results proved that buoyancy forces significantly influenced the heat transfer process and they proposed a new correlation for the Nusselt number with a relative error of 11.61% and 12.82% for a one-pass and a two-pass PHE, respectively. Therefore, a correlation to estimate the fanning friction coefficient and the Nusselt number of CO2 should be chosen carefully since the thermophysical properties of R744 change nonlinearly in the supercritical region [37].
This study provides a novel design for the generator in compression ejector refrigeration technologies using the ejected heat from the CO2 transcritical system as the driving energy source based on a local analysis. The two cycles were emphasised and discussed by Elbarghthi et al. [38,39,40]. Matlab software was used to develop the PHE analytical model and integrated the NIST database for real gas properties [41]. The supercritical CO2 represented the hot stream in the heat exchanger, while two cold streams were studied and compared as the working fluids (R1234yf and R1234ze(E)) flowing from subcooled liquid to superheated vapour. Moreover, the total pressure drop, Nusselt numbers, Reynold numbers, and effectiveness were determined and are discussed at various channel mass fluxes, superheating temperatures, and plate sizes.

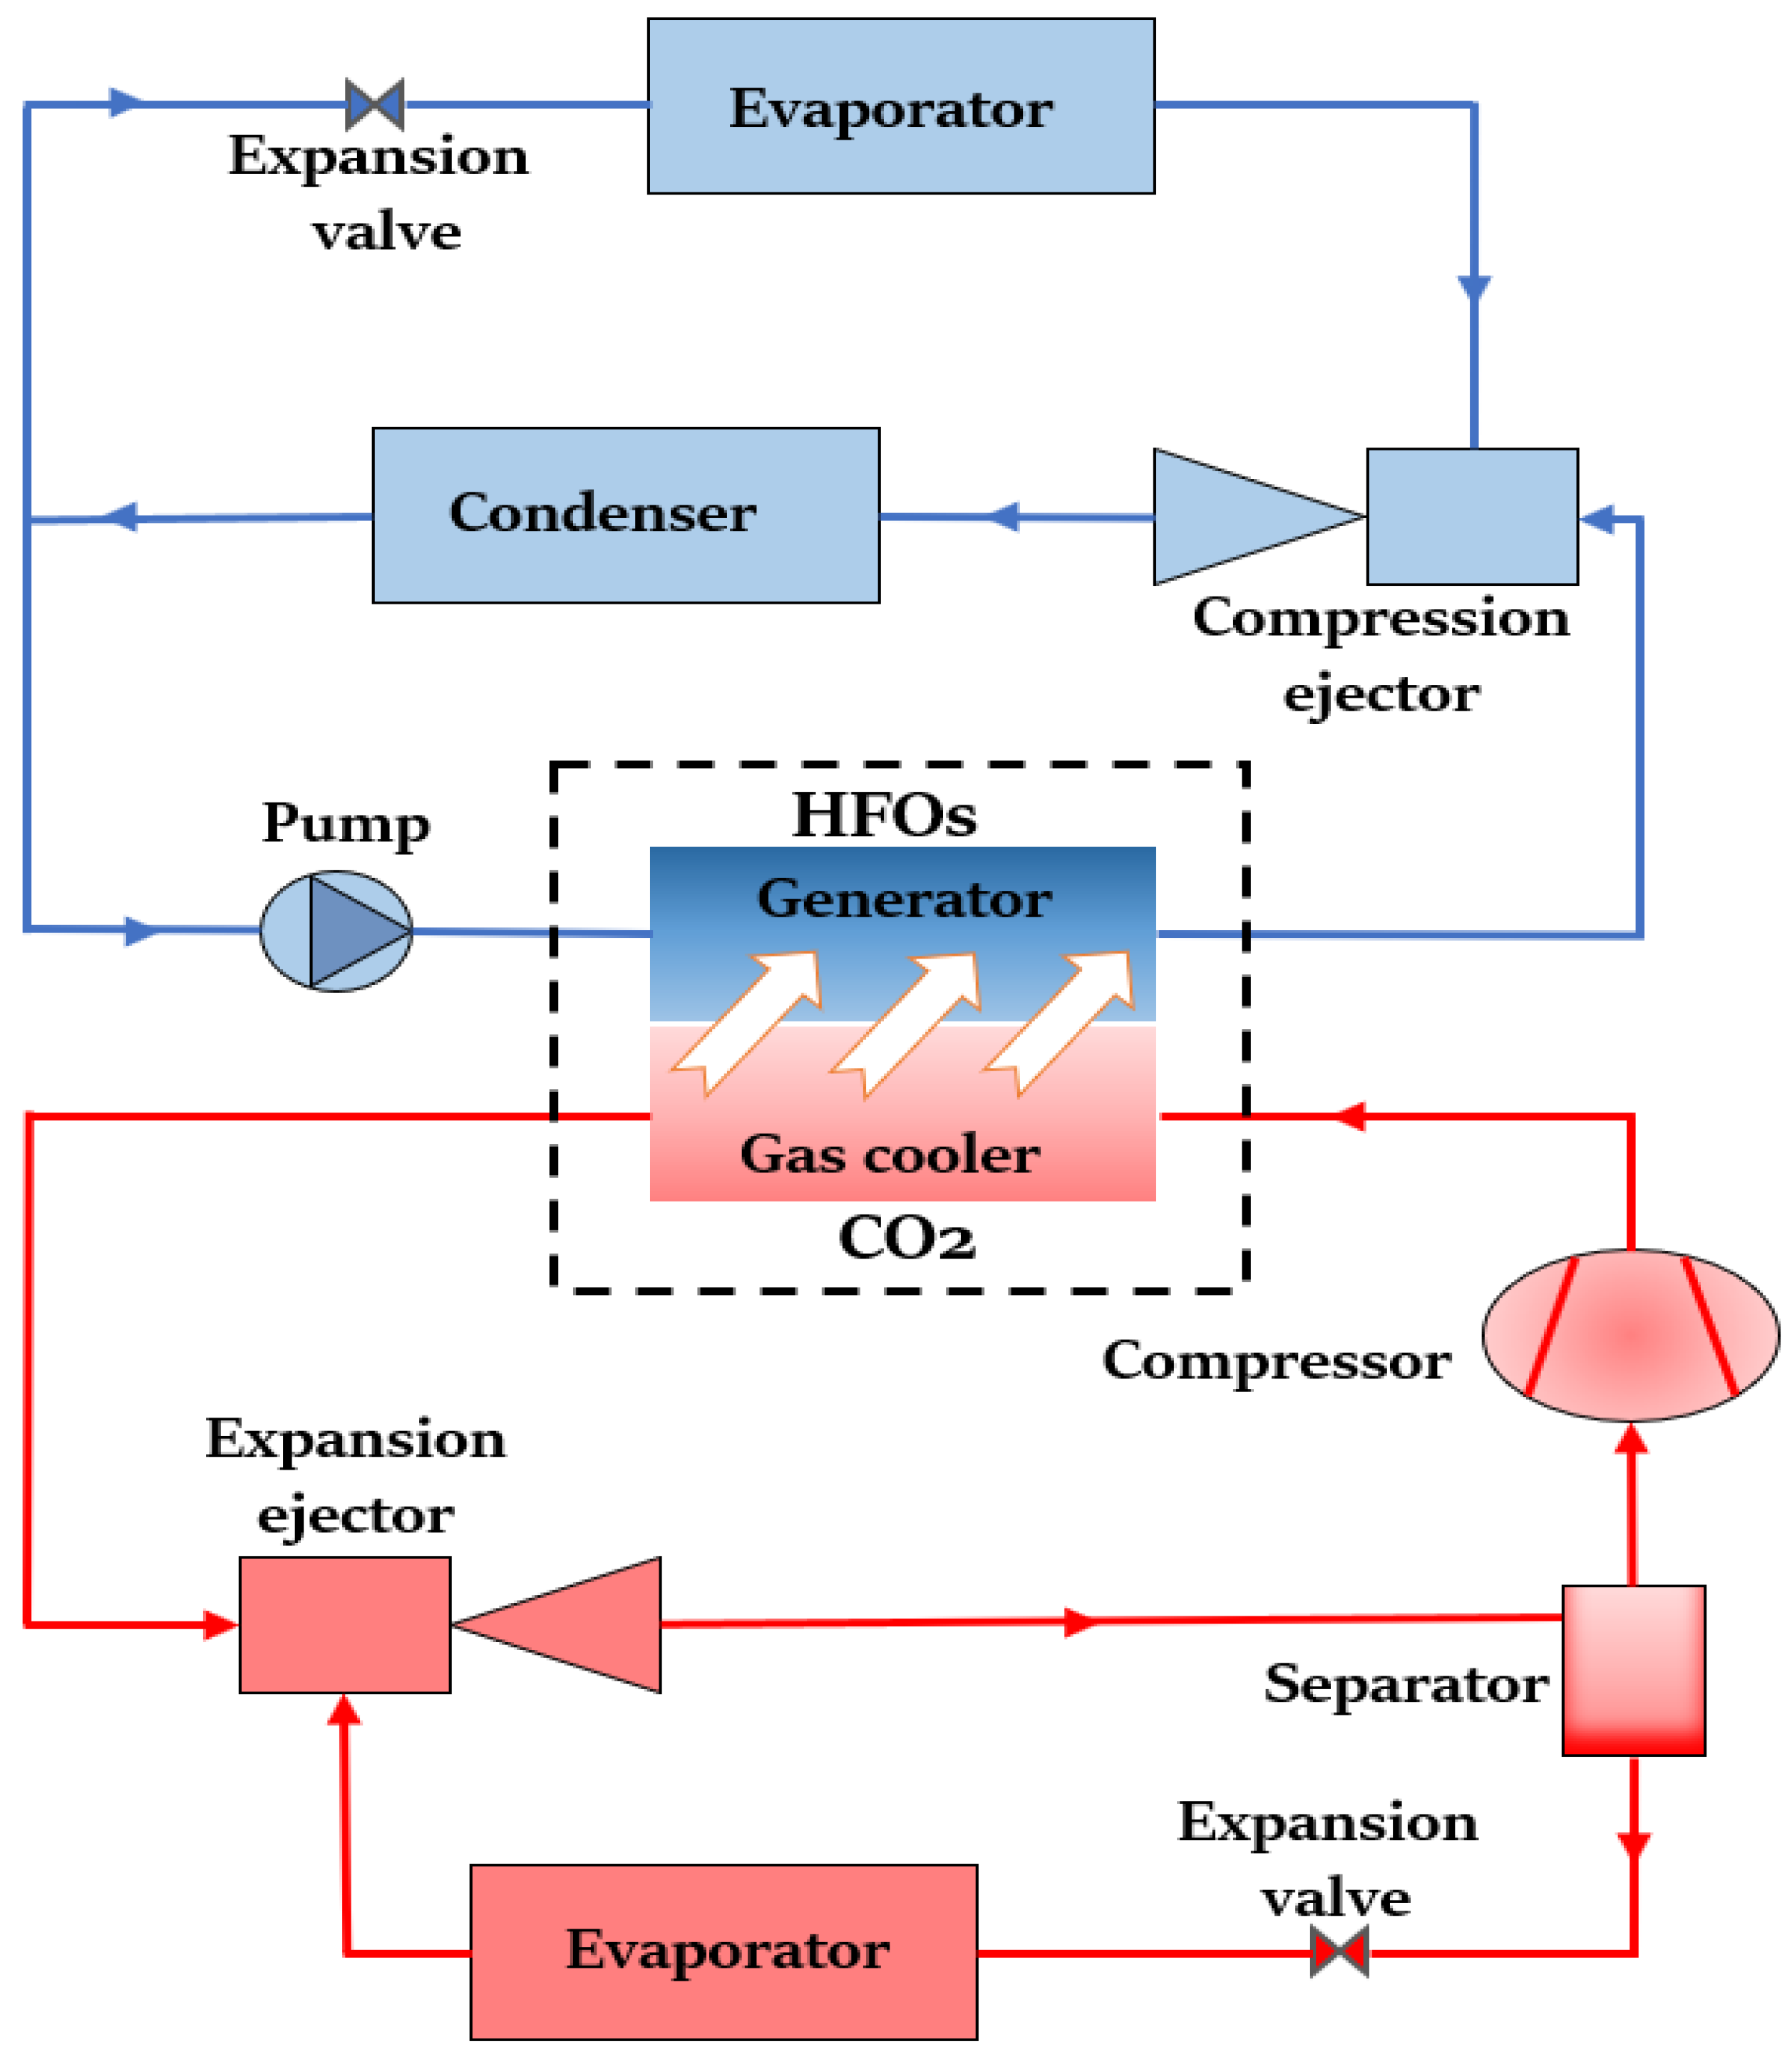
2. System Description

Figure 1 illustrates the proposed system diagram using a compact plate heat exchanger and the principal components. The PHE layout in the dashed line area contains the supercritical CO2 as the hot working fluid that supplies the ejected heat to the generator from the refrigeration cycle as the heat sink. The generator side uses HFO refrigerants (1234ze(E) and 1234yf) for three different phases of flow: subcooled liquid, a two-phase mixture, and superheated vapour.
HFO refrigerants were chosen based on their dry-expansion property, which provides a positive slope of the saturation vapour curve. This function will avoid condensation inside the compression ejector where the expansion process ends in the superheated vapour region [1,39]. Moreover, these refrigerants are classified as having low toxicity and non-flammable to comply with the EU Council regulations on environment-friendly F-gases [42]. In addition, these refrigerants were selected for investigation through the compression ejector cooling cycle experimentally and numerically due to their promising alternatives and their significant impact on the overall system performance [40,43,44,45].
Two different sizes of the compact plate heat exchangers were put up for study. Figure 2 shows the schematic view and an actual photograph of the chevron plate heat exchanger examined in this paper. All geometrical characteristics and the principal dimensions of the PHE are listed in Table 1.
  • the heat exchanger operated under steady-state conditions and was considered as one-pass counterflow;
  • heat losses to the environment are negligible;
  • the maldistribution phenomenon inside the PHE was neglected;
  • for the cold stream with a phase change, the plate was divided into three portions;
  • a linear temperature difference was considered between the two flow streams;
  • the cold stream was modelled at a saturation temperature of 87 °C and an inlet temperature of 25 °C;
  • the effect of the saturation temperature was ignored since it does not significantly affect the heat transfer coefficients or the pressure drop [25,33,34,35];
  • effectiveness was estimated using the ϵ-NTU method; and
  • all the thermophysical properties were estimated based on the NIST fluid database (REFPROP v.10).
The analysis accounted for the cold stream superheat temperature differences ( T SH , c ) that vary from 5 K to 20 K. The hot stream was modelled under different inlet pressures ( P h ), namely from 9 MPa to 12 MPa with a 1 MPa step. In the transcritical CO2 refrigeration cycle, a semi-hermetic reciprocating compressor model, manufactured by the Dorin company (Dorin CD1400H), was employed [46]. The compressor’s electric power supply and the discharge mass flow rate were determined according to polynomial functions provided by the manufacturer at a nominal frequency of 50 Hz.

3. Theoretical Analysis

3.1. Data Reduction

The thermal balances were considered equal for both hot and cold streams as shown in Equation (1):
Q c = Q h = Q = m ˙ c ( H c , o H c ,   i )
The log mean temperature difference (LMTD) cannot be used for the CO2 side of the setup. This is because the R744’s thermophysical properties change nonlinearly with temperature. In comparison, the LMTD considers that both cold side fluids have a constant specific heat. Therefore, the actual temperature difference was estimated as mentioned by Zendehboudi et al. [10] as follows:
T = Q U   A eff   N p
where N p represents the number of plates. The effective area ( A eff ) considers the effect of corrugation on the total heat transfer area by multiplying the plate area ( A p = b · L w ) by the enlargement factor ( ) [11] as shown in Equations (3) and (4).
A eff =   b   L w
= ( 1 + 1 + x 2 + ( 1 + x 2 ) / 2 ) / 6
where
x = π   b λ
The overall heat transfer coefficient ( U ) can be determined by using the summation of thermal conductances between both streams as shown in Equation (6):
U = ( 1 h c + 1 h h + F + t p κ p ) 1
where F and κ p are the fouling factor for both streams and the plate conductivity, respectively, and h c and h h are the thermal convection coefficients for both cold and hot streams, respectively. The convection coefficients can be estimated from the Nusselt number Nu as:
Nu = h   D hy κ
where D hy is the channel’s hydraulic diameter. For single-phase flow of the cold stream, Martin et al.’s model [14] was used for the estimation of the Nusselt number ( Nu c , sp ) and the fanning friction coefficient ( f c , sp ), as shown in Equations (8) and (9):
Nu c , sp = 0.205 Pr 1 3 ( µ m µ w ) 1 6 ( f   Re 2 sin 2 β ) 0.374
1 f = cos β 0.045 tan β + 0.09 sin β + f a / cos β + 1 cos β 3.8 f b
where f a and f b are the constants of the Martin model and mainly depend on the flow type. For Re < 2000 , calculated from Equation (10), the constant value could be found as follows:
Re = G ch D h μ
f a = 16 Re ,     f b = 149 Re + 0.9652
where G ch is the channel mass flux ( G ch = m ˙ c / A ch N ch ). On the other hand, Amalfi et al. correlations [21] were used for estimating the Nusselt number ( Nu c ,   tp ) and the fanning friction coefficient ( f c , tp ) of the cold stream two-phase flow because their correlation was constructed based on experimental data on the PHE as shown in Equations (12) and (13).
Nu c , tp = 18.495 β * 0.248  Re v 0.135  Re lo 0.351   Bd 0.235  Bo 0.198   ρ * 0.223
f tp = ( 33.2583 β * 9.993 + 14.9916 ) We 0.475   Bd 0.255   ρ * 0.571
where
Re v = X   Re vo = X   G ch D h μ v ,   Re l = ( 1 X ) Re lo = ( 1 X )   G ch   D h μ l
β * = β β max ,   ρ * = ρ 1 ρ v
Moreover, Amalfi et al. correlations include the effect of heat flux between the two streams ( q ) and the channel mass flux ( G ch ) on the Nusselt number by adopting the boiling number ( Bo ). In addition, it includes the impact of the buoyancy forces on the fanning friction coefficient ( f ) by adopting the Weber number ( We ). Moreover, their model considers the turbulence effect by using the Bond number ( B d ).
Bo = q G ch i lv = U T G ch i lv
We = G ch 2 D h σ ρ avg
Bd = ( ρ l ρ v )   g   D h 2 σ
where ρ avg is average density according to the two-phase homogeneous model:
ρ avg = (   X m ρ v + 1 X m ρ l ) 1
In the case of the hot stream supercritical flow, as Zendehboudi et al. [5] mentioned, most models in the literature are not applicable for Nusselt number calculation when dealing with a PHE. In this regard, the new correlation stated by the authors was used, in which they consider the buoyancy force effect and performed their experiment on a brazed PHE. Equation (20) illustrates their correlation for the supercritical phase Nusselt number ( Nu h , sc ), while for the fanning friction coefficient ( f h , SC ) the Martin model was used as follows:
Nu h , sc = 0.33 Re m 0.804 · Pr m 0.1 ( ρ w ρ m ) 0.1 ( Cp w Cp m ) 0.093 ( Gr Re m 2.7 ) 0.1
where ( Gr ) is the Grashof number, representing the buoyancy forces to the viscous forces, as shown in Equation (21).
Gr = ( ρ w ρ m ) ρ m g D h 3 μ m 2
The subscript ( m ) represents the mean property calculated from all artificial inlets and outlets of one stream. In comparison, the subscript (w) represents the property value adjacent to the wall. This study approximates properties close to the wall considering a linear change in the temperature between hot and cold streams [16]. For both streams, the estimated total pressure drop includes the frictional pressure drop ( P fr ), and the port pressure drop ( P p ) was determined as shown in Equation (22). All thermophysical properties were obtained from the NIST database.
P = 0.75 N ch ( G p 2 2   ρ i G p 2 2   ρ o ) + 2 f L v G c 2 D h ρ   ( μ m μ w ) 0.17
The evaluation of the heat exchanger’s effectiveness was calculated by the e NTU method, as shown in Equations (23)–(25) [47], where C min is the minimum heat capacity between both flow streams.
NTU = U   A eff C min
C min = min ( m ˙ c   Cp c , m ˙ h   Cp h )
ε = 1 exp ( NTU )

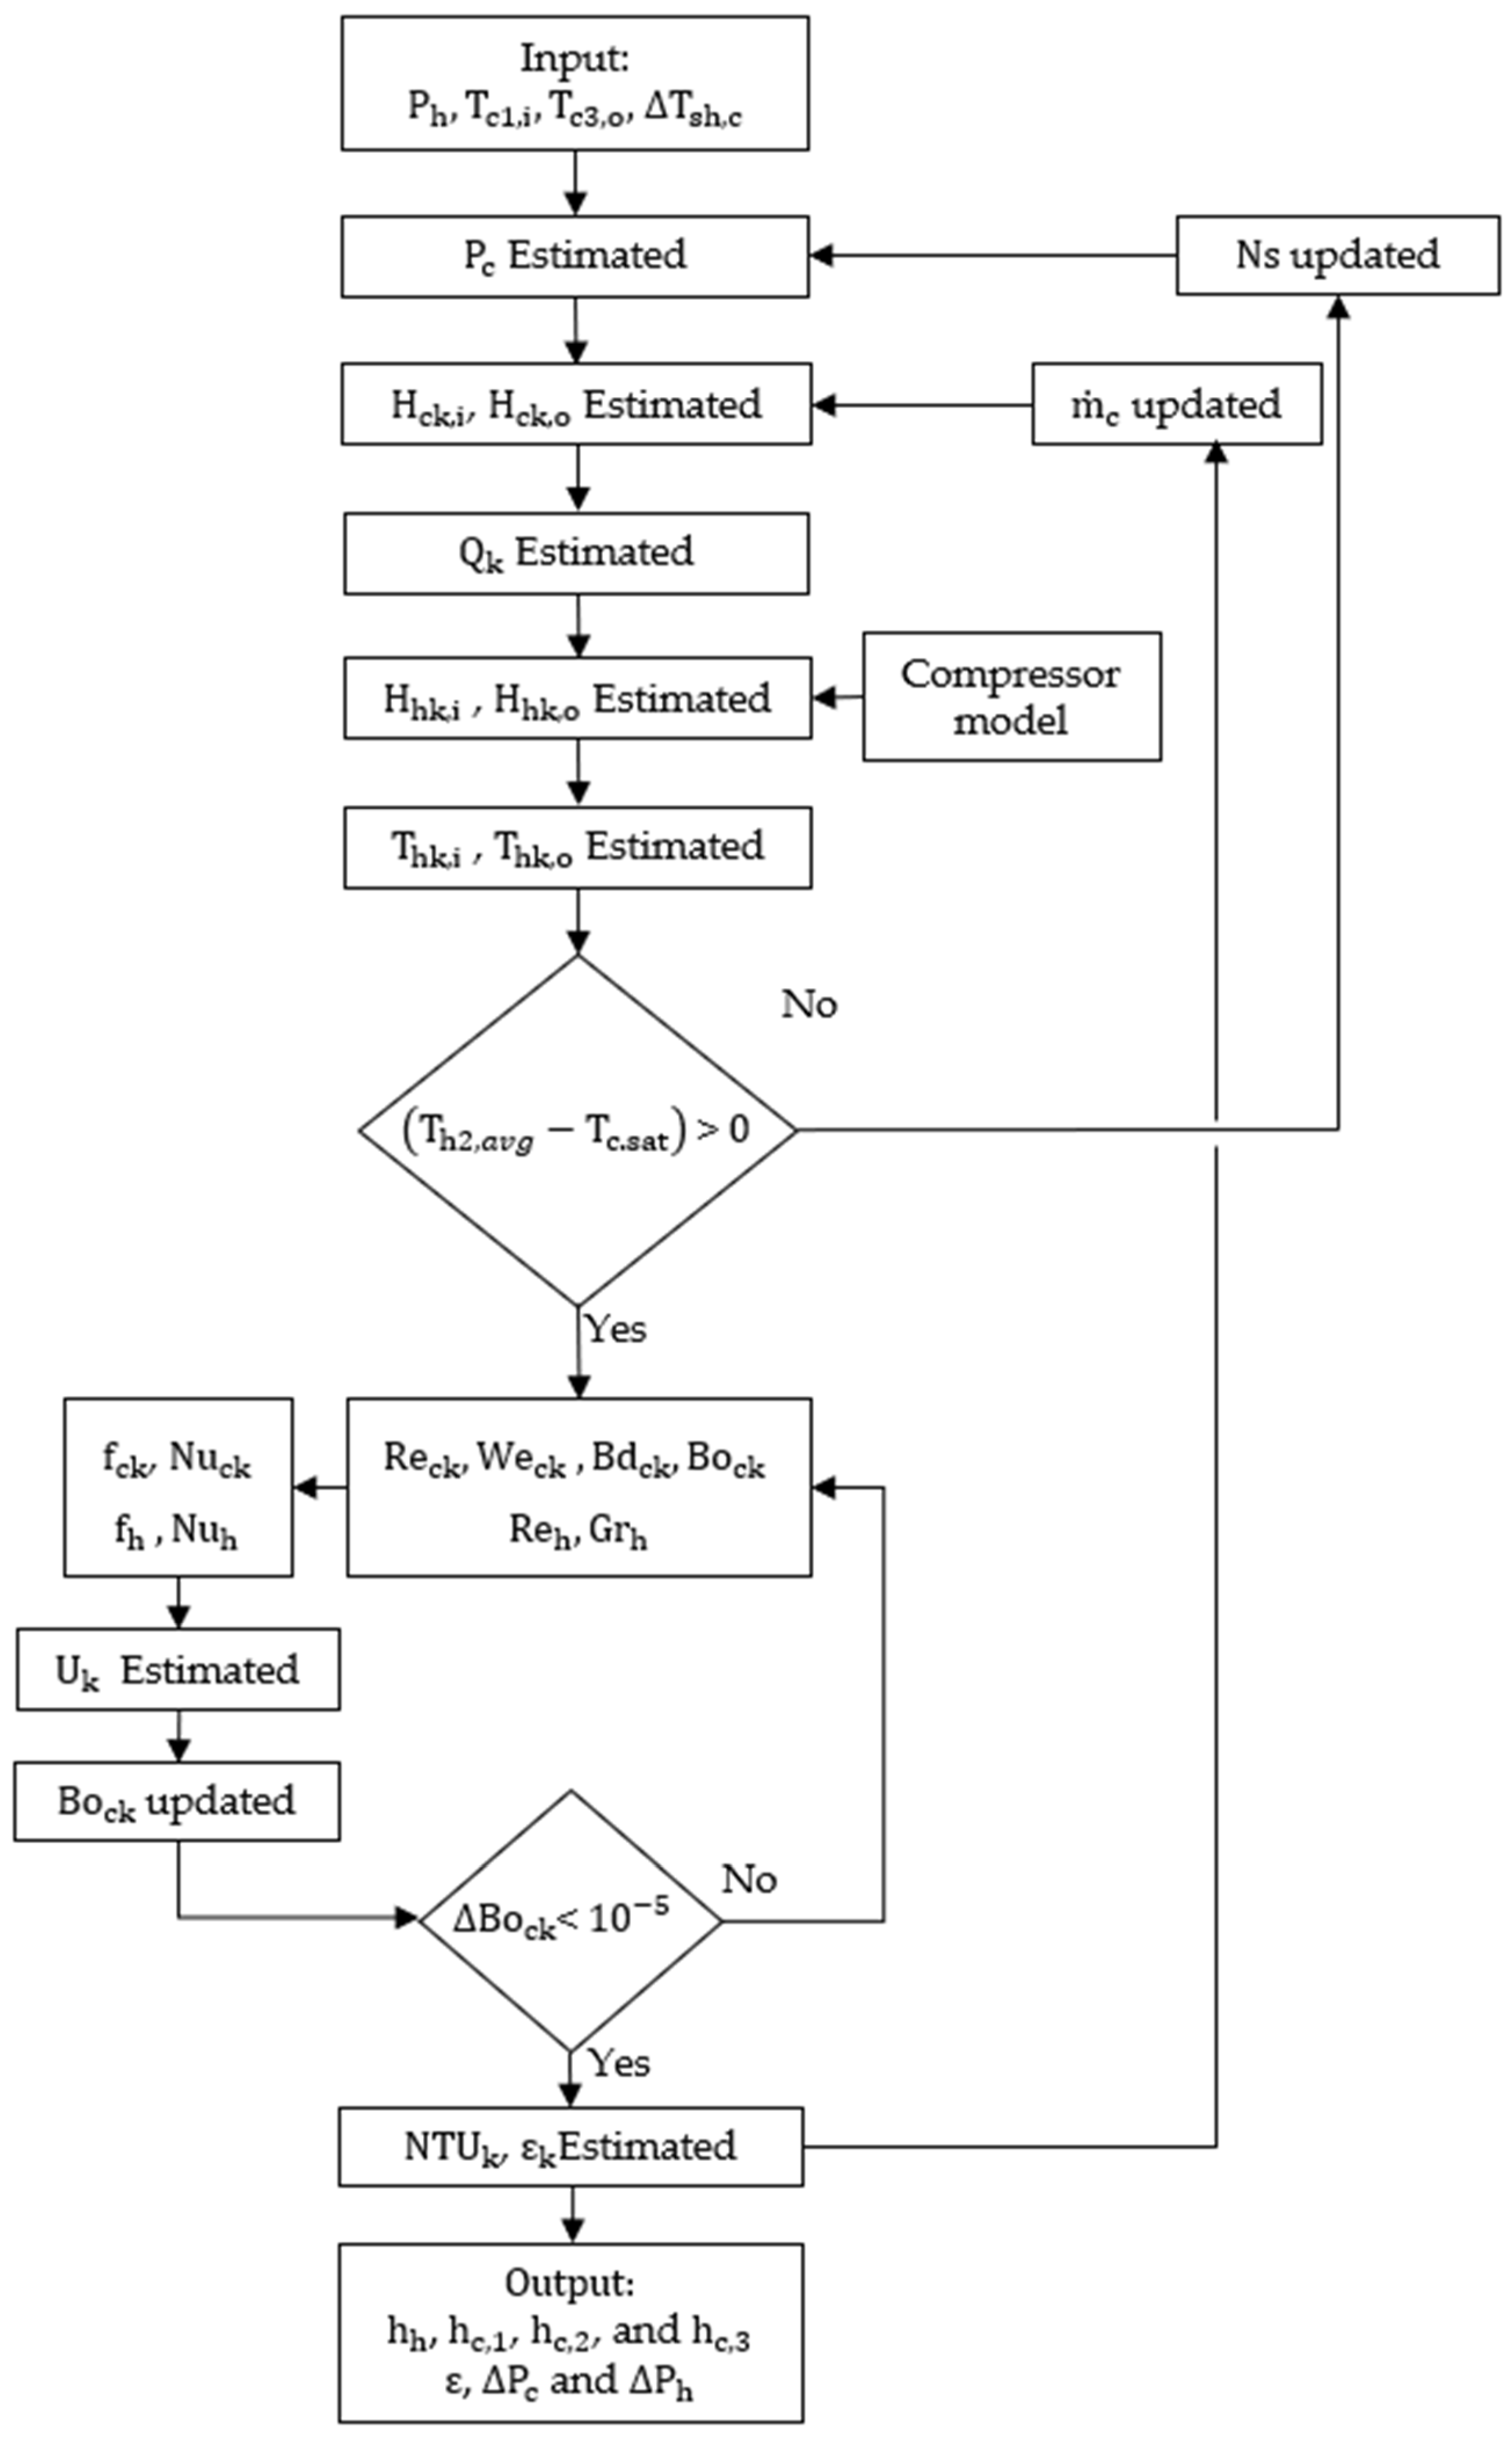
3.2. Calculation Procedures

Since a phase change occurred on the cold stream flow side, both streams in the heat exchanger were divided into k artificial sections, where the k-th component is (1, 2, 3), as shown in Figure 3. The previously mentioned equations were evaluated using Matlab code, and the modelling procedures can be seen in the flow chart in Figure 4. The following steps demonstrate the flow chart calculation procedure.
  • The inputs are the hot stream pressure ( P h ) and the superheat difference ( T sh , c ). Afterwards, the saturation pressure ( P c ) was calculated according to the refrigerant name ( Ns ) at 87 °C.
  • The enthalpies were estimated for all artificial inlets and outlets of the cold stream.
  • The total heat rate ( Q k ) was evaluated for each artificial section according to the enthalpy difference multiplied by the mass flow rate of the cold stream, Equation (1).
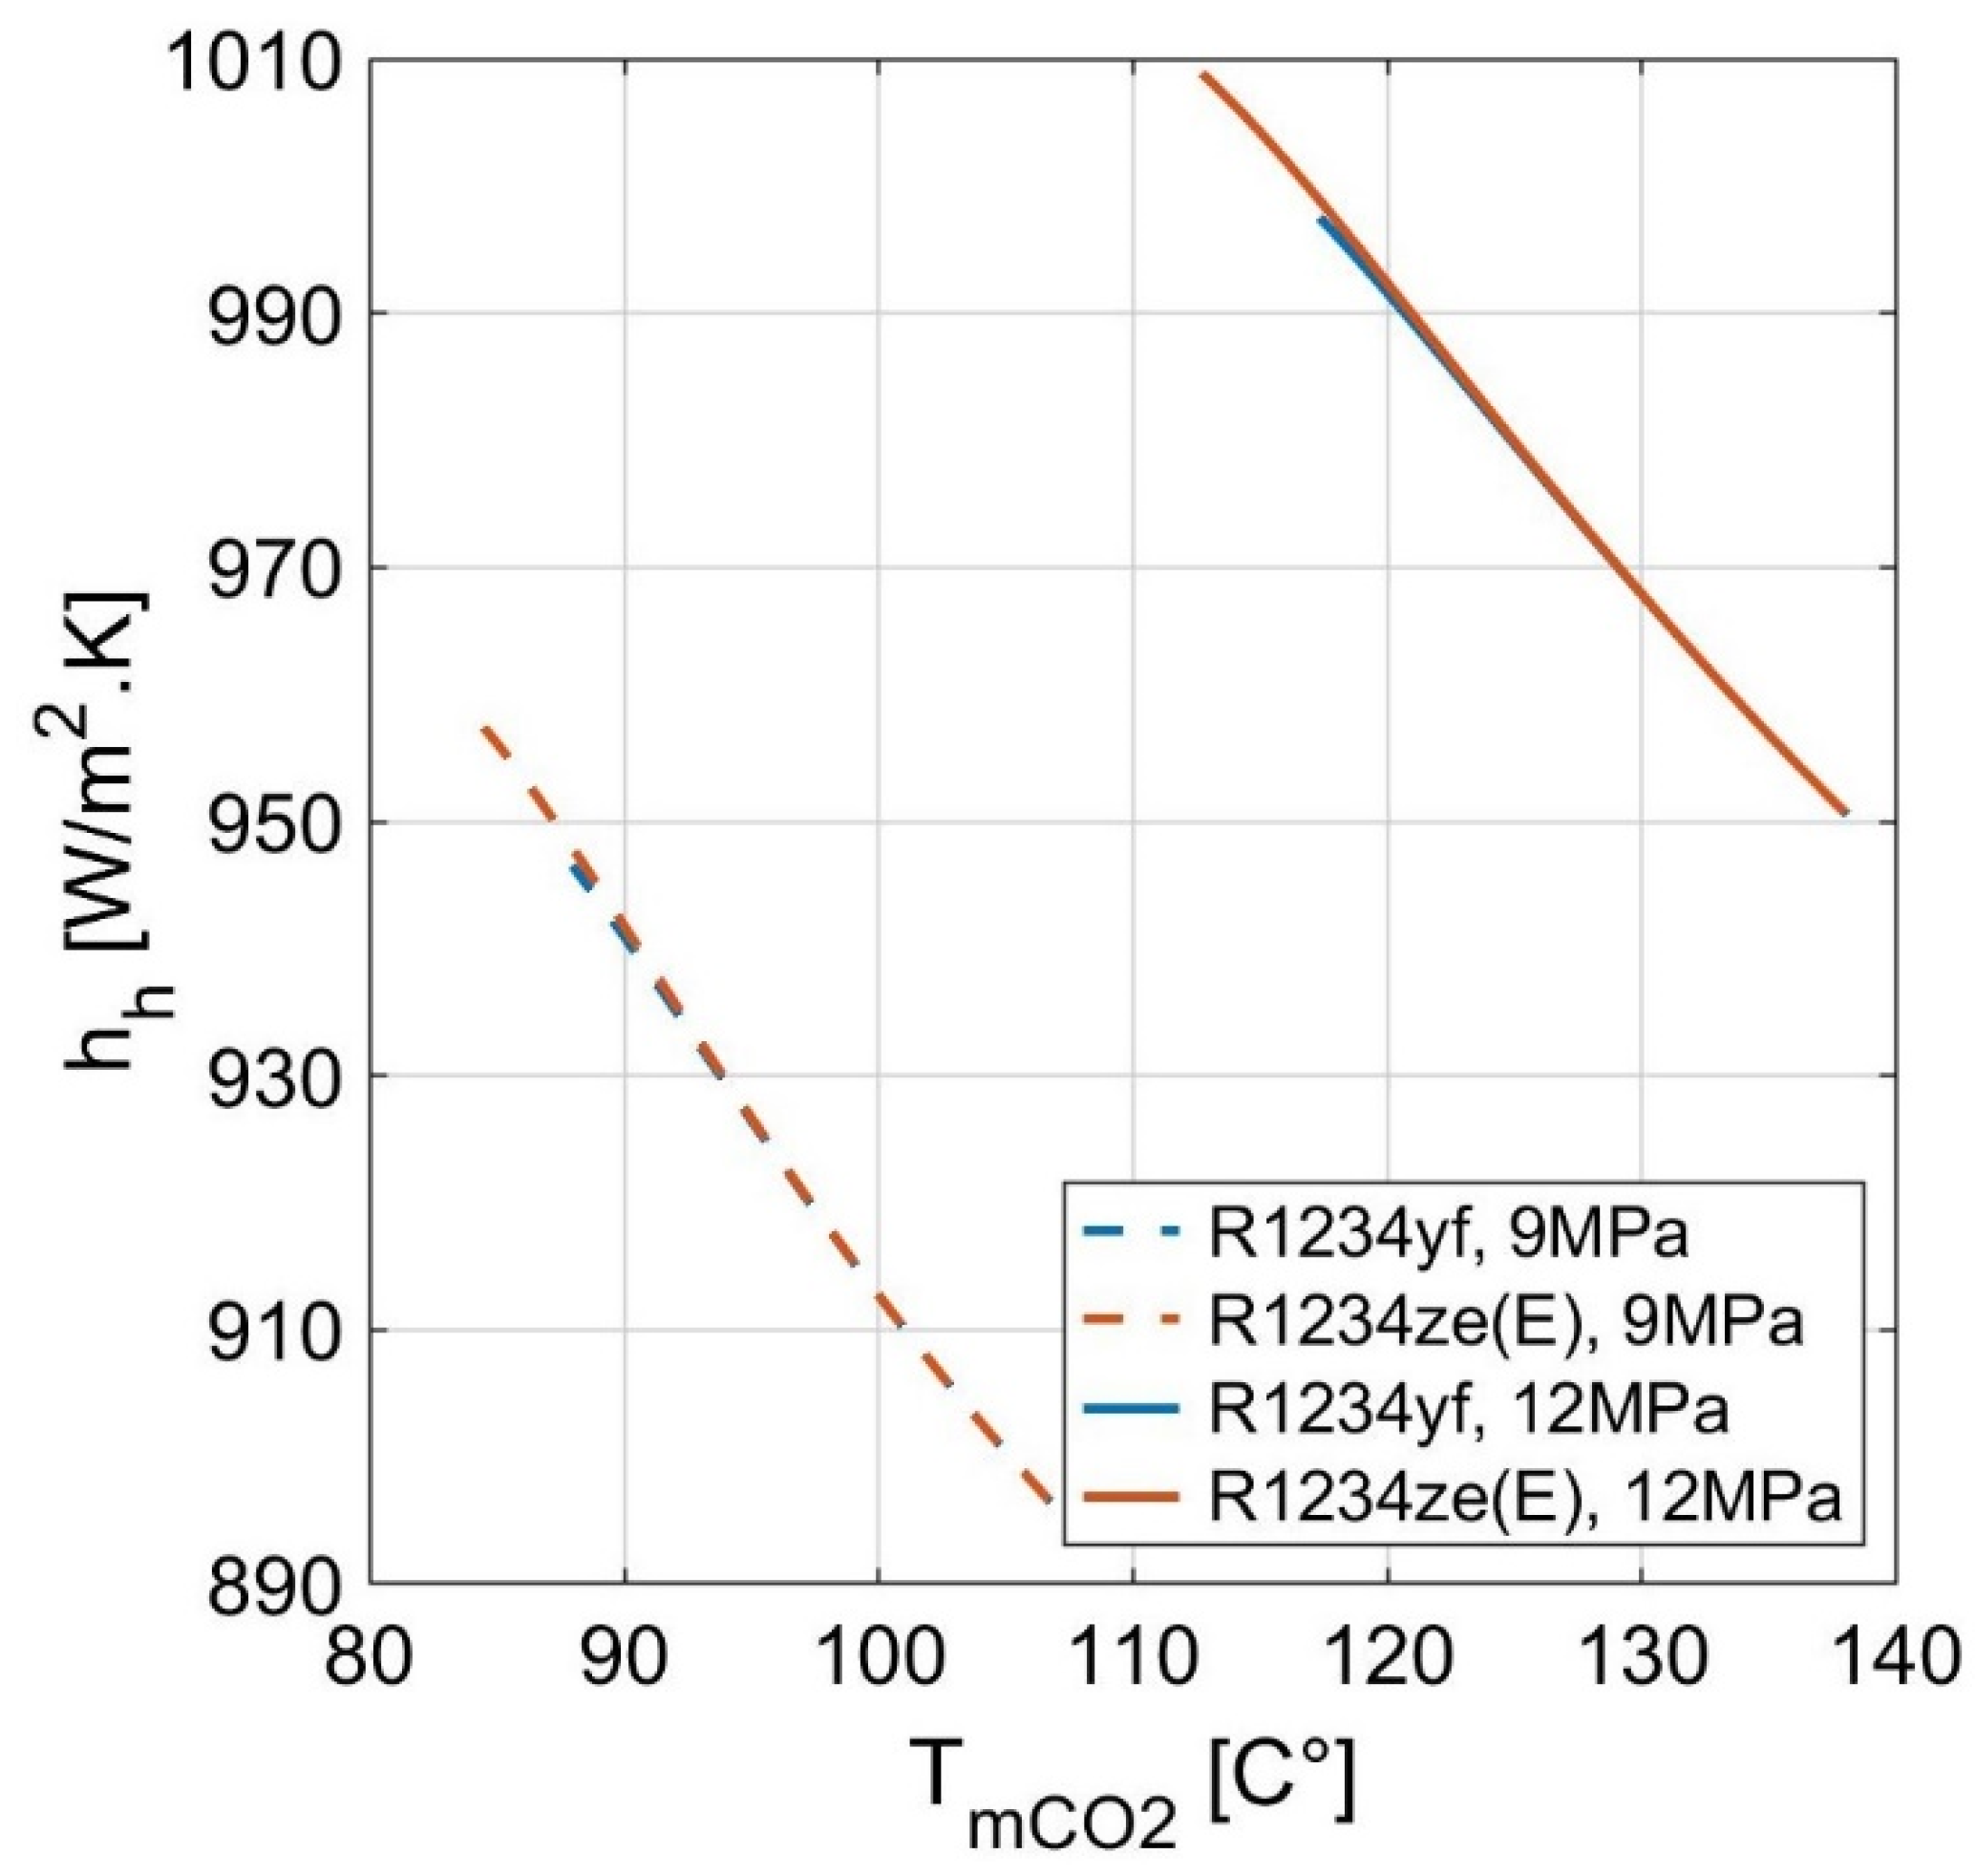
  • The inlet enthalpy and the temperature of the hot stream ( H h 3 i and T h 3 o ,respectively) were estimated using the compressor model and the hot stream pressure ( P h ). Subsequently, the other enthalpies and temperatures were evaluated using the corresponding heat rate ( Q k ) from each artificial section.
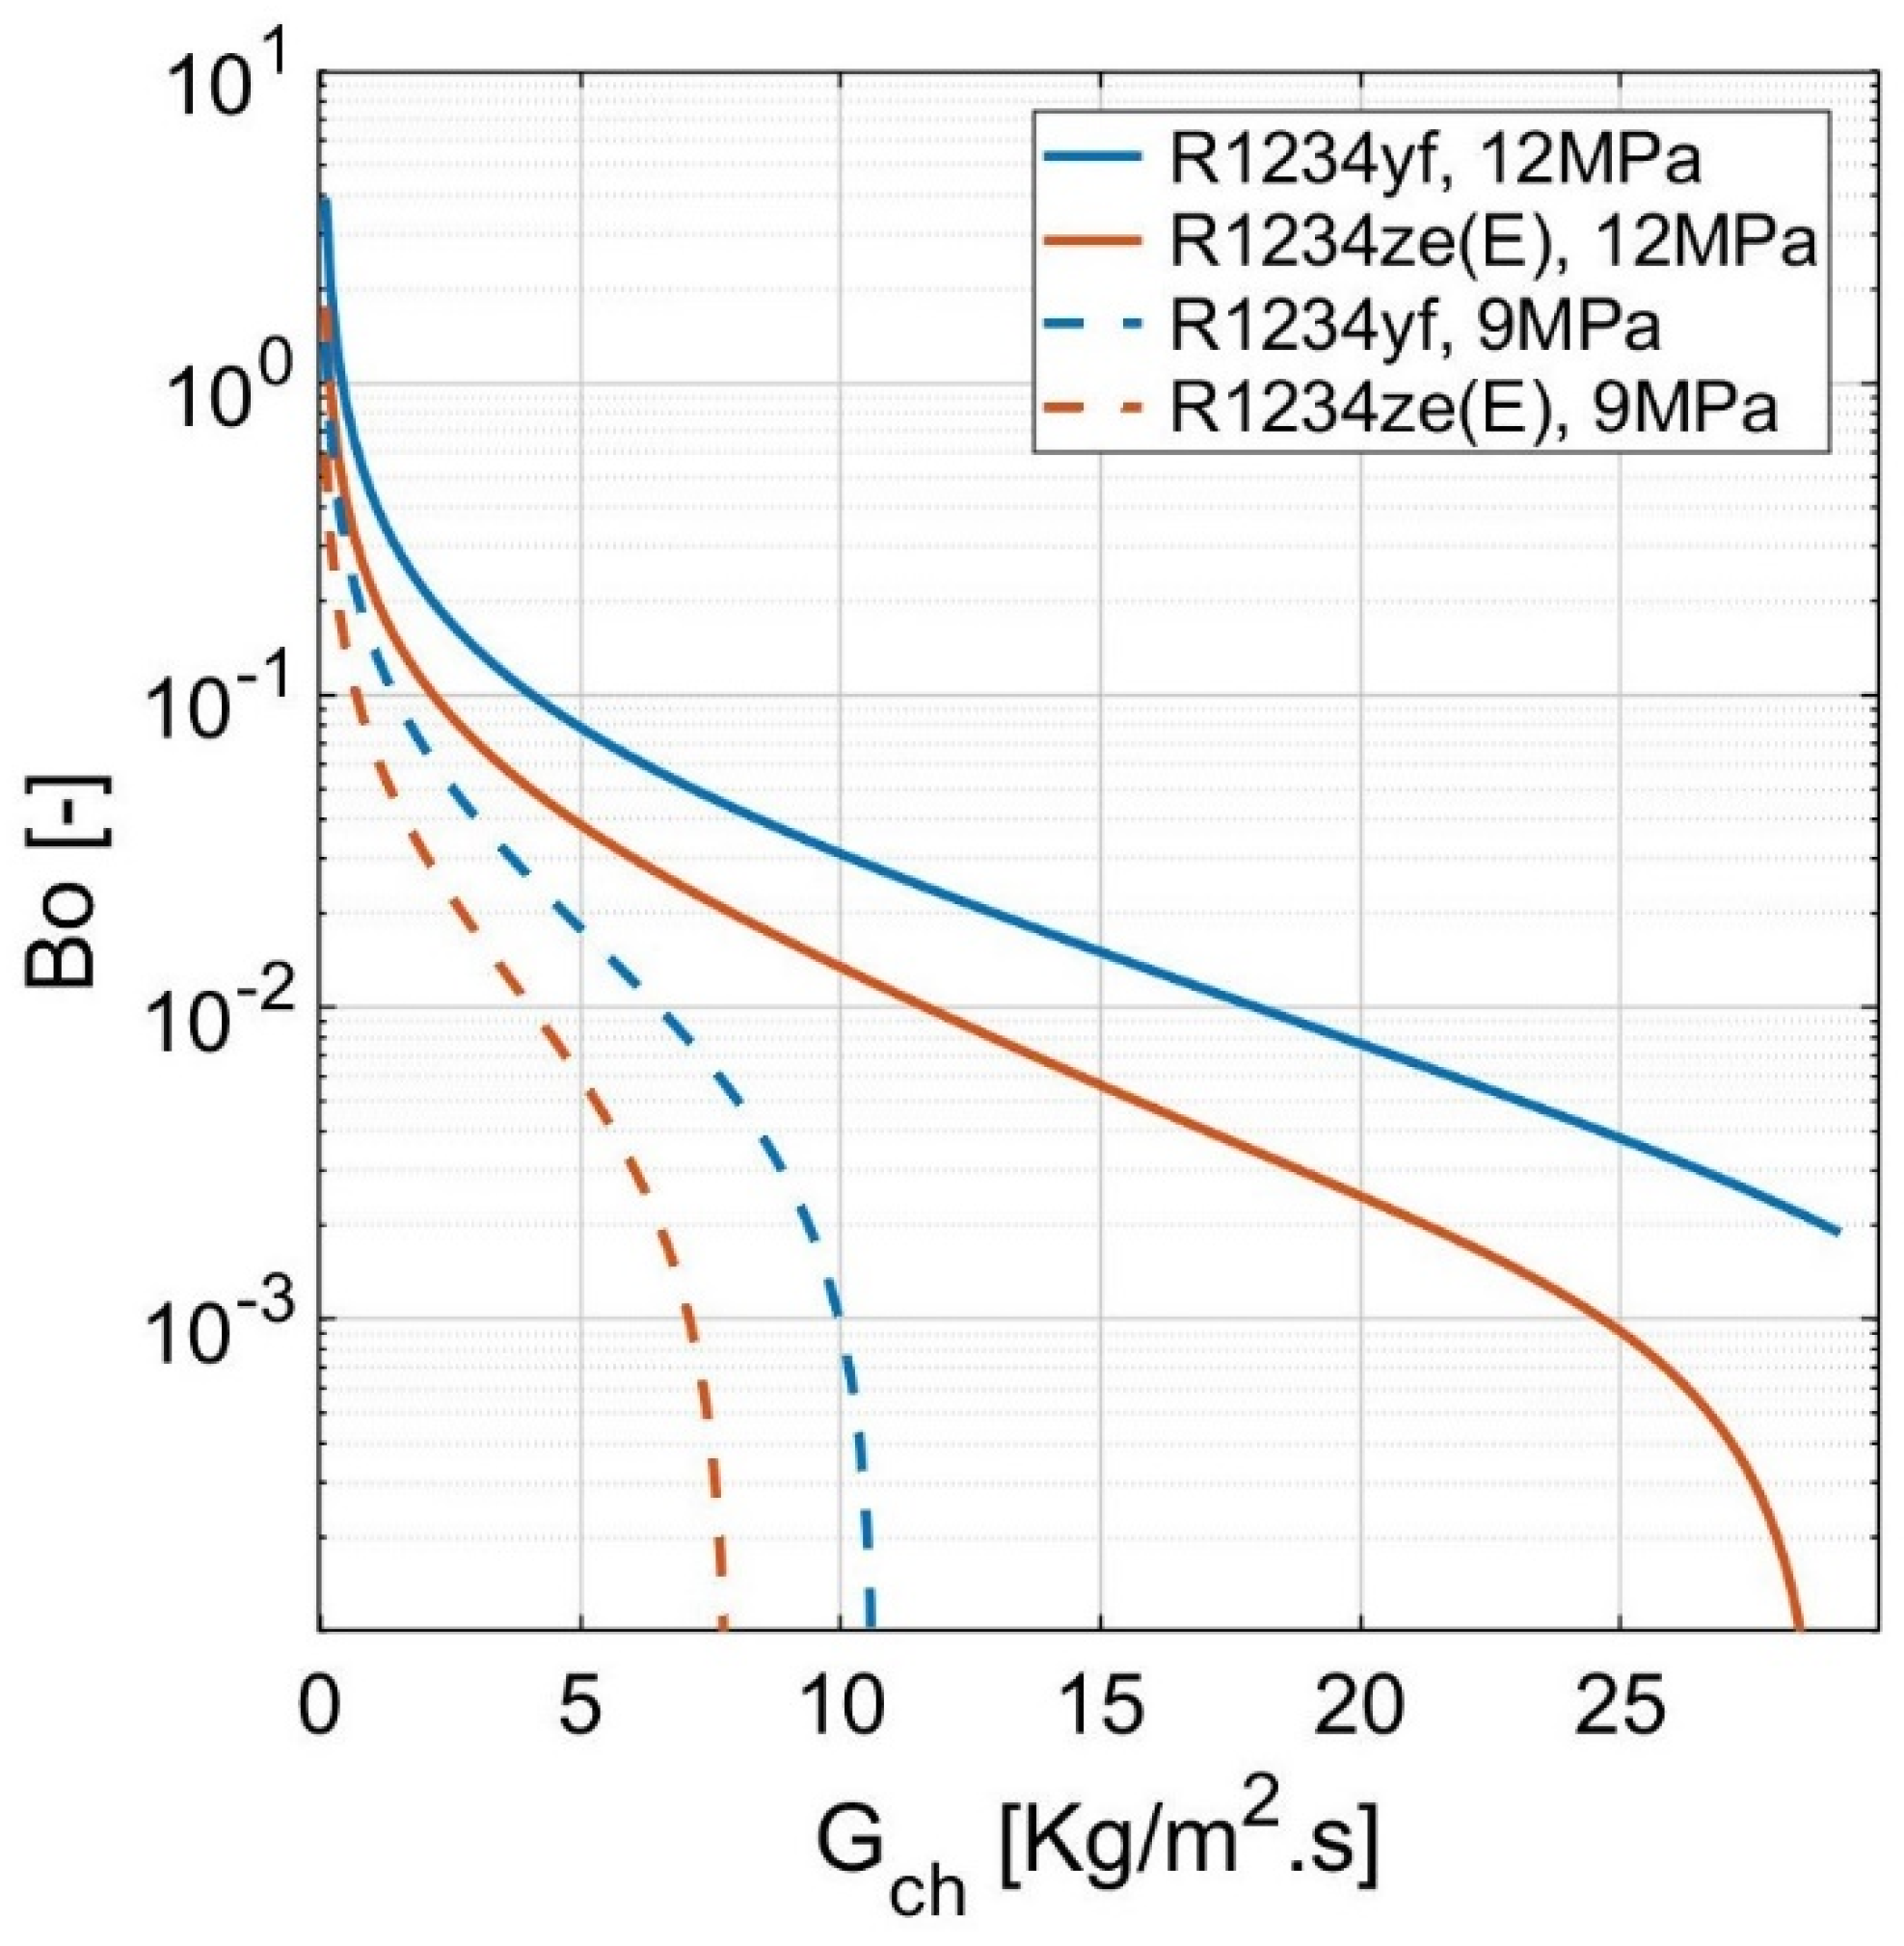
  • If the outlet temperature of the hot stream’s second section ( T h 2 o ) is higher than the cold stream saturation temperature ( T c . sat ), then the required dimensionless numbers of each stream can be evaluated directly except for the boiling number (Bo), as it requires information on the heat flux between the hot and cold streams ( q k ). Based on Amalfi’s review [22], the average between the maximum and the minimum Boiling number was taken as an initial guess with a value of 0.002.
  • In the next step, the overall heat transfer coefficient ( U k ), the heat flux ( q k ), the number of transfer units (NTU), and the effectiveness ( ε k ) will be estimated. When all the data are calculated, the boiling number (Bo) will be updated according to the new heat flux ( q k ) as well as the overall heat transfer coefficient ( U k ), the number of transfer units (NTU), and the effectiveness ( ε k ). Then, the mass flow rate ( m ˙ c ) will be updated.
  • Alternatively, if the outlet temperature of the hot stream’s second section ( T h 2 o ) is lower, then the calculation will be stopped for the current cold stream mass flow rate, and the name (Ns) will be updated to the next step.
  • Finally, the output is stored as the effectiveness, the convection coefficients, and the pressure drop matrices at various channel mass fluxes.
The previously mentioned steps were repeated at different cold stream superheating temperatures, different hot stream pressures, and two different plate sizes.

4. Discussion

The constructed analytical model was repeated at various hot stream pressures ( P h ) with values of 9, 10, 11, and 12 MPa. The cold stream superheat differences ( T sh , c ) were set to vary between 5, 10, 15, and 20 K for two different plate sizes. The results demonstrate the hot stream inlet pressure effect, the superheat difference effect, and the impact of the heat exchanger plate sizes.

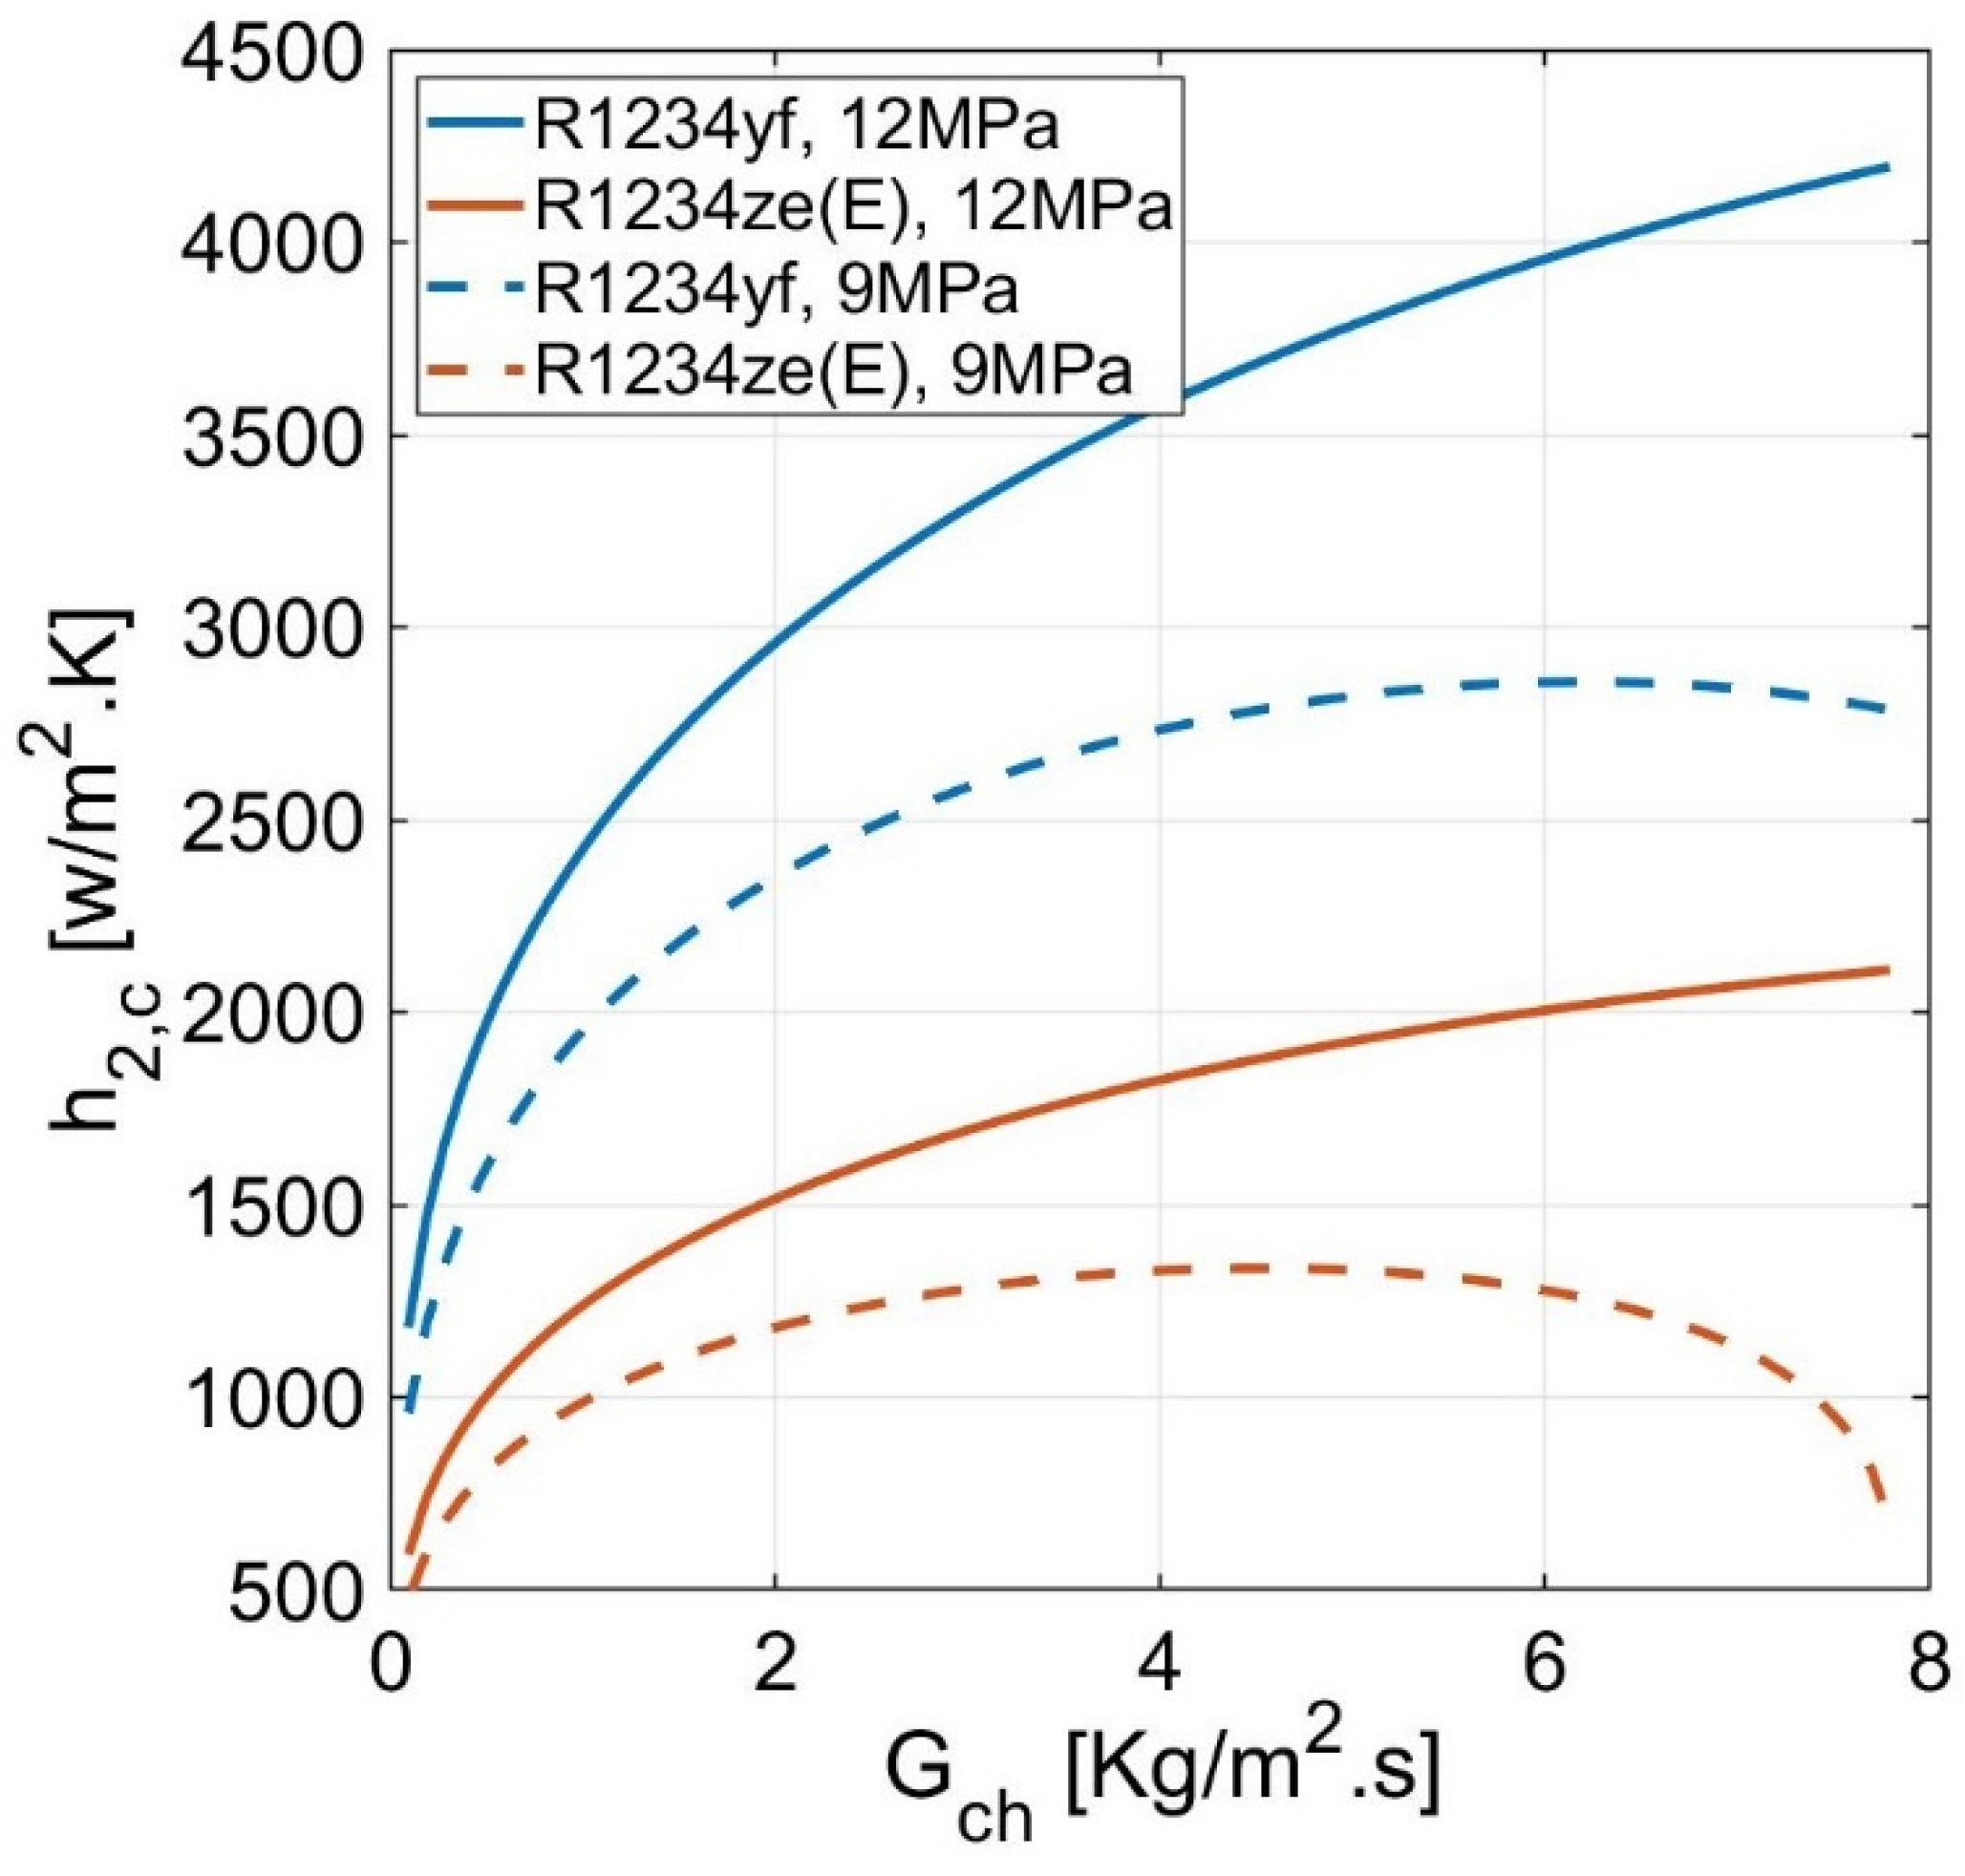
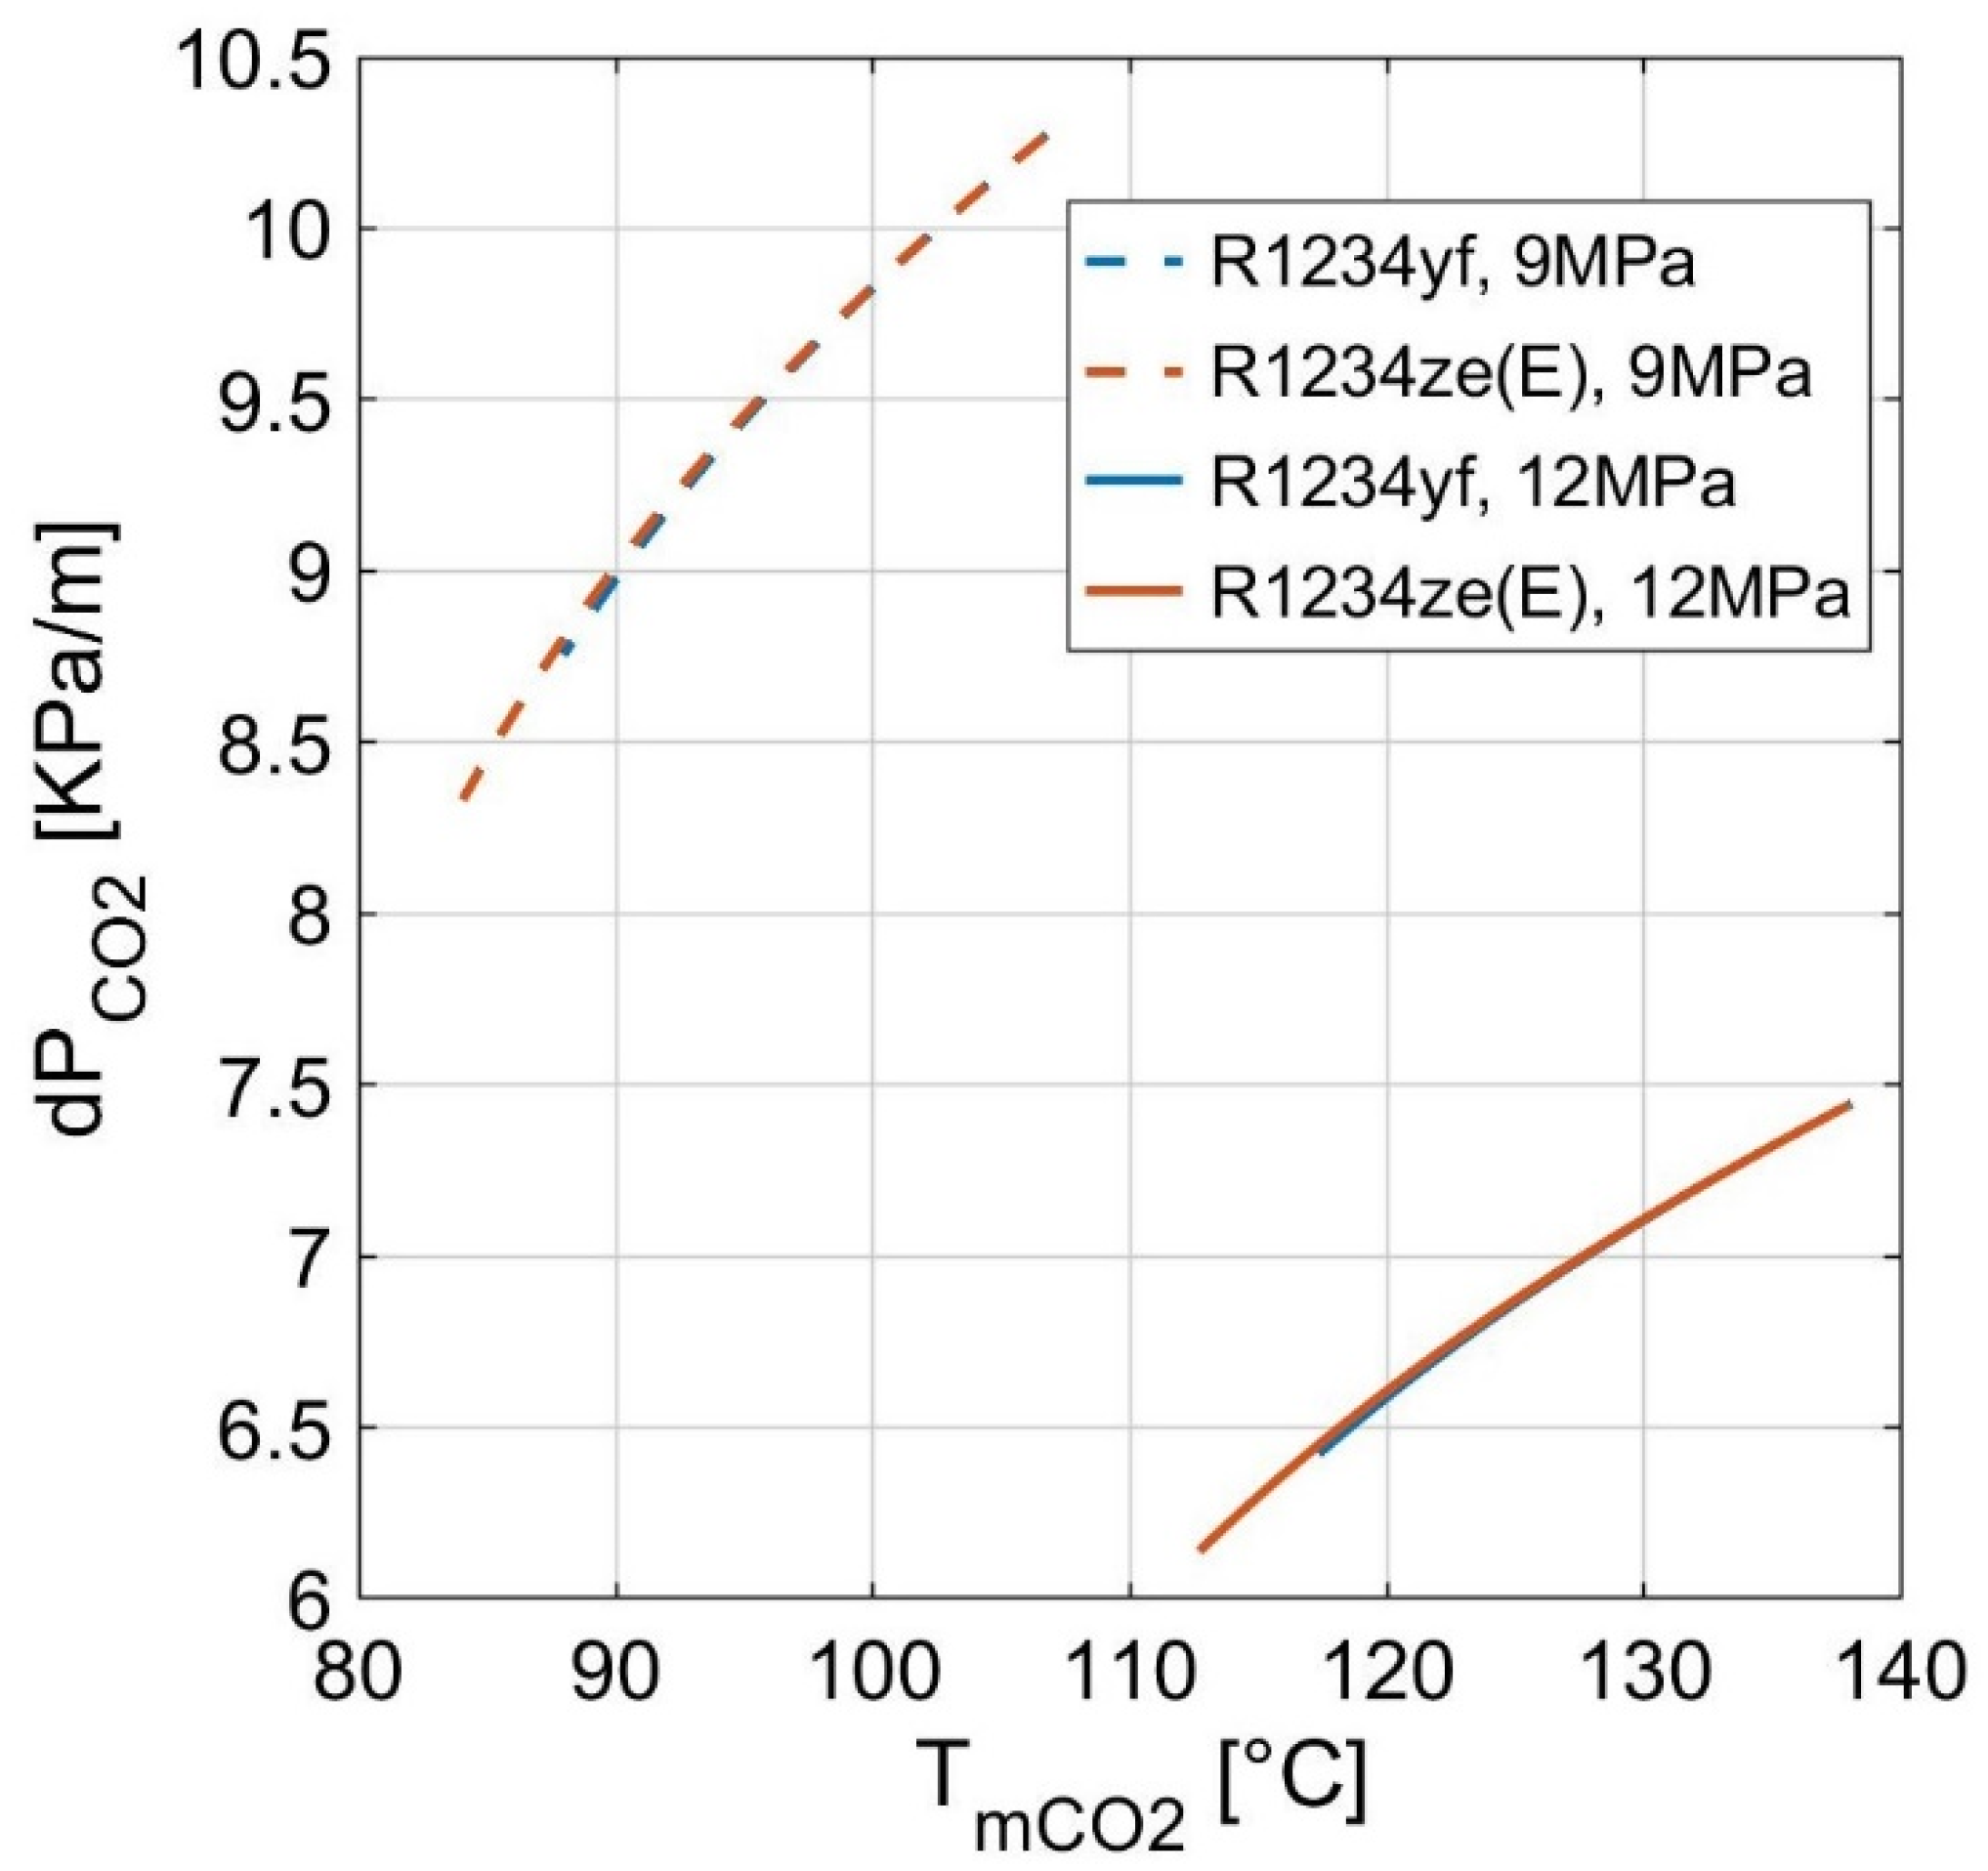
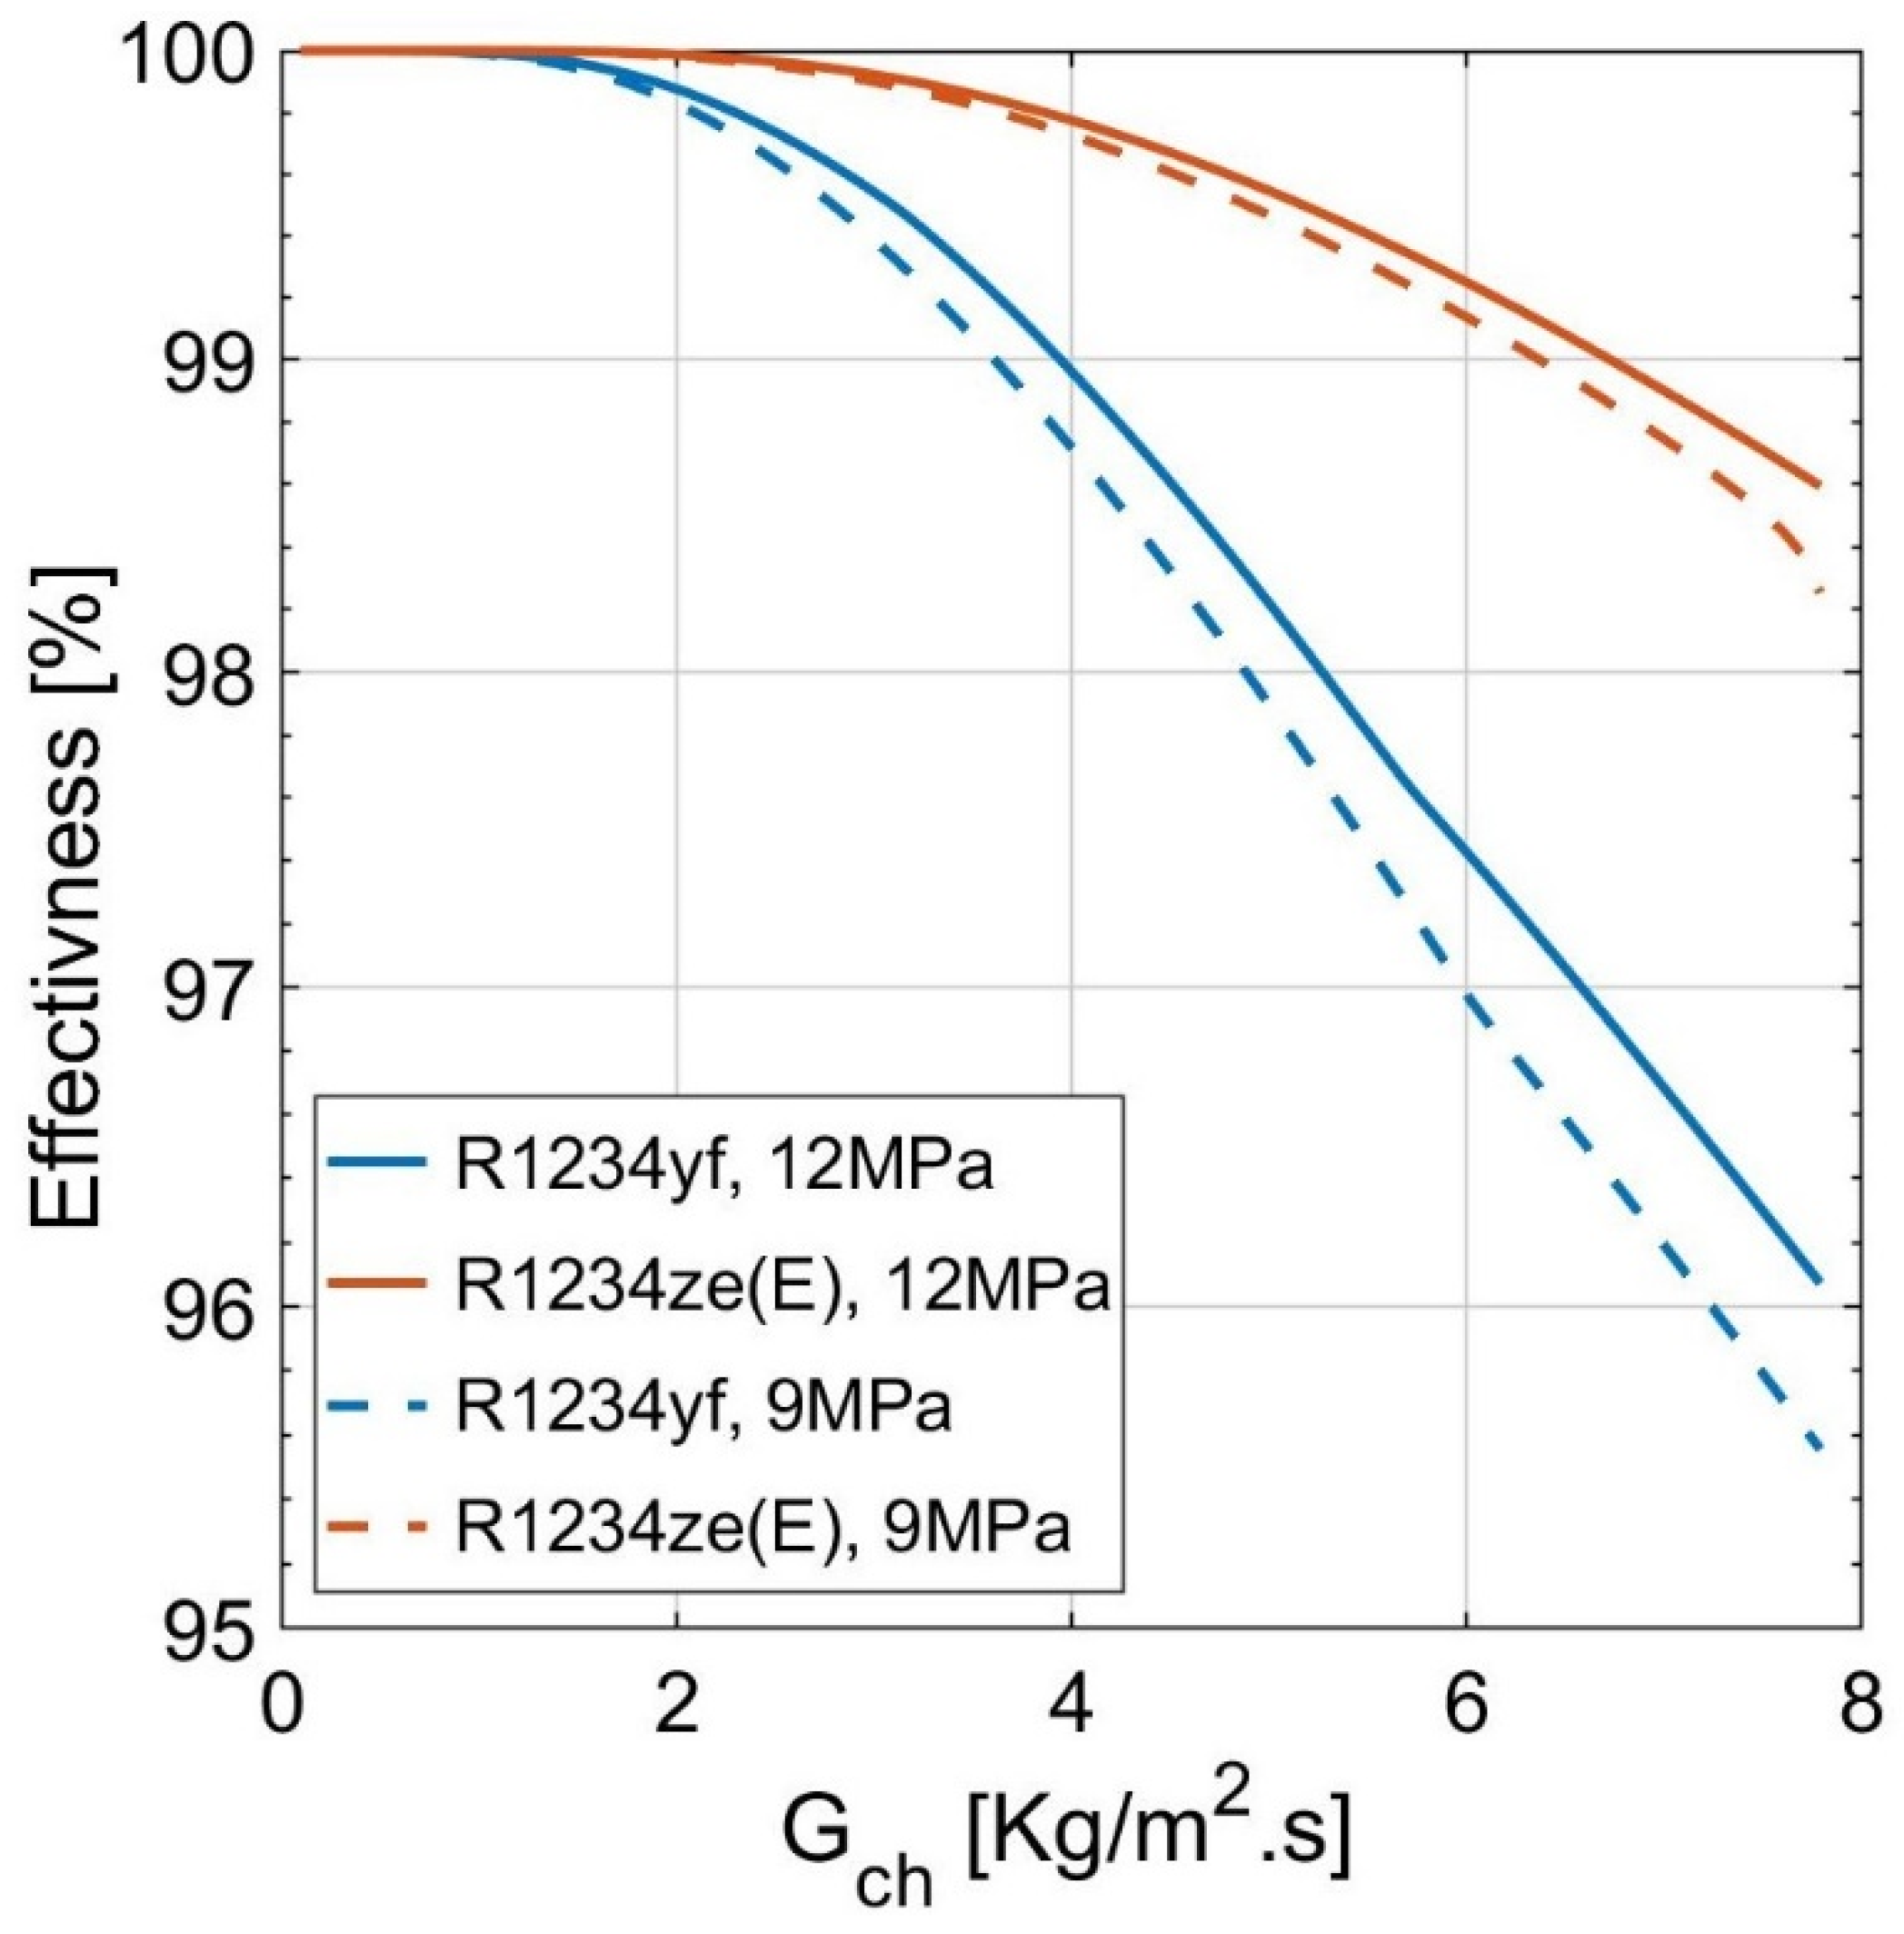
4.1. Effect of Hot Stream Inlet Pressure

Figure 5 illustrates the cold stream liquid-phase and gas-phase convection coefficients against various cold channel mass fluxes from 0.1   kg / m 2 · s to 7.8 kg / m 2 · s at a hot stream inlet pressure of 10 MPa and a cold stream superheat temperature difference of 3 K. For all cases, the convection coefficients increase with the cold channel mass flux because of the increment in the Reynolds number. For the cold stream liquid phase, the convection coefficients increased from 41 to 262 and 270 W / m 2 · K for R1234yf and R1234ze(E), respectively. For the cold stream gas phase, the convection coefficients increased from 36 and 25 to 378 and 269 W / m 2 · K for R1234yf and R1234ze(E), respectively. The difference is more apparent for the gas-phase convection coefficients because the viscosity is ten times lower at the gas phase for both HFOs, resulting in a more apparent difference in the Reynolds number. The slope for the liquid phase is more horizontal because the viscosity ratio decreases from 1.9 to 1.2 for R1234yf and from 1.6 to 1.1 for R1234ze(E), while it is almost constant for the gas phase. Moreover, the convection coefficients of the cold stream gas-phase of R1234ze(E) are less than the liquid ones at a cold channel mass flux less than 6.8 kg / m 2 · s because the conductivity is relatively low in the gas phase in comparison with R1234yf. On the other hand, a less than 4% increase in the liquid phase convection coefficients and a less than 1% decrease in the gas phase convection coefficients were observed as the hot stream inlet pressure was increased from 9 MPa to 12 MPa. This can be explained by the effect of the hot stream inlet temperature on the viscosity at the surface, which decreases in the liquid phase and increases in the gas phase, according to the Martin model.
In contrast, the two-phase convection coefficient was influenced steeply by the hot stream inlet pressure. Figure 6 demonstrates the cold stream two-phase convection coefficients versus various cold channel mass fluxes from 0.1   kg / m 2 · s to 7.8 kg / m 2 · s at hot stream inlet pressures of 9 MPa and 12 MPa and a cold stream superheat temperature difference of 3 K. The result reveals that the cold-stream two-phase convection coefficient at high pressure increases from 592 W / m 2 · K to 2110 W / m 2 · K for the R1234ze(E) and from 1181 W / m 2 · K to 4196   W / m 2 · K for the R1234yf. At a lower pressure, the two-phase convection coefficient showed parabolic tendencies for R1234ze(E) from 477 W / m 2 · K to the peak at 1334 W / m 2 · K and then decreased significantly to 673 W / m 2 · K . The two-phase convection coefficient also showed parabolic tendencies for R1234yf from 959 W / m 2 · K  to the peak at 2857 W / m 2 · K and then decreased slightly to 2785 W / m 2 · K . As shown in Figure 6, the convection coefficient is much higher at higher pressures due to the increased heat flux between the two streams, resulting in higher boiling numbers. For most cases, the R1234ze(E) had higher two-phase convection coefficients due to the higher bond number than for R1234yf. According to Amalfi et al.’s correlation for the macro-scale plate heat exchanger, the flow in the two-phase region is very turbulent even at a low vapour quality [21]. This turbulence is represented by the Bond number ( Bd ) with a critical value of 4. In this study, the bond number was estimated to be 90 for R1234ze(E) and 24 for R1234yf by using Equation (18) [21]. This difference in turbulence leads to higher convection coefficients for the R1234ze(E). The observed two-phase convection coefficients show good agreement with the results of Longo et al. [34].
On the other hand, the parabolic tendency of the two-phase convection coefficients at 9 MPa was due to the significant decrease in the hot stream temperature and the convergence of the overall heat transfer coefficient to a constant value. The peak occurs when the overall heat transfer coefficient converges to a constant value, and the significant reduction after the peak appears when the hot stream temperature drops and gets closer to the cold stream saturation temperature, leading to a considerable decrease in the Boiling number, as shown in Equation (16). This effect of the overall heat transfer coefficient and the temperature drop on the Boiling number is illustrated in Figure 7 for both HFOs.
Figure 7 demonstrates the boiling number with a broader range of cold channel mass fluxes. For all curves, it is clear that the boiling number decreases significantly at a particular flow flux when the temperature difference in Equation (16) approaches zero, which explains along with the overall heat transfer coefficient the parabolic tendency of the two-phase convection coefficient.
The results illustrated in Figure 8 show how the hot stream convection coefficients change with the mean hot stream temperature and the variation in the cold channel mass flux from 0.1   kg / m 2 · s to 7.8   kg / m 2 · s at hot stream inlet pressures of 9 MPa and 12 MPa and a cold stream superheat temperature difference of 3 K. At a high pressure, the hot stream convection coefficients increased from 951 to 1009 and 998 W / m 2 · K for R1234yf and R1234ze(E), respectively. In addition, the temperature drops from 138 °C to 113 °C and 117 °C for R1234yf and R1234ze(E), respectively. At a lower pressure, the hot stream convection coefficients increased from 896 to 958 and 946 W / m 2 · K for R1234yf and R1234ze(E), respectively. In addition, the temperature drops from 107 °C to 88 °C and 84 °C for R1234yf and R1234ze(E), respectively. The results show good agreement with Zendehboudi et al. [5]. The hot stream convection coefficients and mean temperature drops at different pressures were found to have identical differences between the hot stream inlet and outlet, even though the CO2 was operating in the supercritical region. This is explained by the idea that the CO2 temperature is relatively high and far from the critical value at which the thermophysical properties change linearly in this region.
Conversely, as the supercritical phase approaches the critical point, the deviation between the R1234yf and R1234ze(E) curves becomes more pronounced with the temperature drop because of the increase in the nonlinearity of the thermophysical properties. In contrast, hot stream convection coefficients have higher values with R1234ze(E) because it has a lower specific heat, resulting in a higher temperature drop.
Figure 9 illustrates the cold stream liquid-phase, two-phase, and gas-phase pressure drops against various cold channel mass fluxes from 0.1   kg / m 2 · s to 7.8 kg / m 2 · s at a hot stream inlet pressure of 11 MPa and a cold stream superheat temperature difference of 3 K. The liquid-phase pressure drop for both gases has the same tendency, with a maximum value of 0.3 kPa / m . This is because they have similar values of the Reynolds number, which is dominant in the Martin fanning friction model. In contrast, R1234yf has a higher pressure drop in the gas phase than R1234ze(E), with a value of 27 kPa / m , because of the difference in surface tension. This difference affects the Weber number as illustrated in Equation (17). For the gas phase, the maximum pressure drop equals 0.7 kPa / m for R1234yf and 1.1 kPa / m for R1234ze(E). The difference in pressure drop for the gas phase illustrates the deviation between R1234yf and R1234ze(E) more clearly than the liquid phase due to the difference in the Reynolds number as explained above for the convection coefficients. In contrast, the effect of the hot stream pressure on the pressure drop is negligible because the Weber and Bond numbers are functions of the cold stream temperature. According to the used model, these numbers remained constant at different hot stream pressures because an identical temperature increase in the cold fluid was considered. The vapourisation pressure drop showed good agreement with Longo et al.’s experimental study [34] and Amalfi et al. review [21].
On the other hand, Figure 10 shows how the hot stream pressure drop changes with the mean hot stream temperature and a cold channel mass flux that varies from 0.1   kg / m 2 · s to 7.8 kg / m 2 · s at hot stream inlet pressures of 9 MPa and 12 MPa and a cold stream superheat temperature difference of 3 K. At a high pressure, the total hot stream pressure drop decreased from 7.44 KPa / m to 6.46   KPa / m and 6.14 KPa / m for R1234yf and R1234ze(E), respectively, while at a lower pressure, it decreased from 10.27   KPa / m to 8.75   KPa / m and 8.33 KPa / m for R1234yf and R1234ze(E), respectively. The pressure drops decreased with the mean hot stream temperature drop because of the decrease in the Reynolds number with the temperature at the supercritical phase. The viscosity increased with the temperature drop in the supercritical phase, unlike in the gaseous phase. On the other hand, the pressure drop increased at a lower hot stream inlet pressure because of the increase in the mass flow rate, which the used compressor model estimates.
Figure 11 demonstrates the effectiveness versus cold channel mass fluxes from 0.1 to 7.8 kg / m 2 · s at a hot stream inlet pressure of 10 MPa and a cold stream superheat temperature difference of 3 K. The effectiveness is 100% at cold channel mass fluxes less than 1 and 2 kg / m 2 · s for R1234yf and R1234ze(E), respectively. The effectiveness then decreases to 95.5% and 98.5% for R1234yf and R1234ze(E), respectively.
Moreover, the R1234yf showed lower effectiveness than the R1234ze(E) and an earlier deviation from 100% effectiveness because the specific heat of R1234yf is approximately one time higher than R1234ze(E) at each phase, which leads to higher heat capacity values and lower effectiveness [47]. In addition, the effect of the hot stream pressure on the effectiveness is negligible because, for the investigated flow fluxes, the cold stream was dominant at the minimum heat capacity since it has a lower flow rate than the hot stream. Moreover, the hot stream convection coefficients did not change significantly with pressure because the hot stream flow flux slightly decreased with increasing pressure.

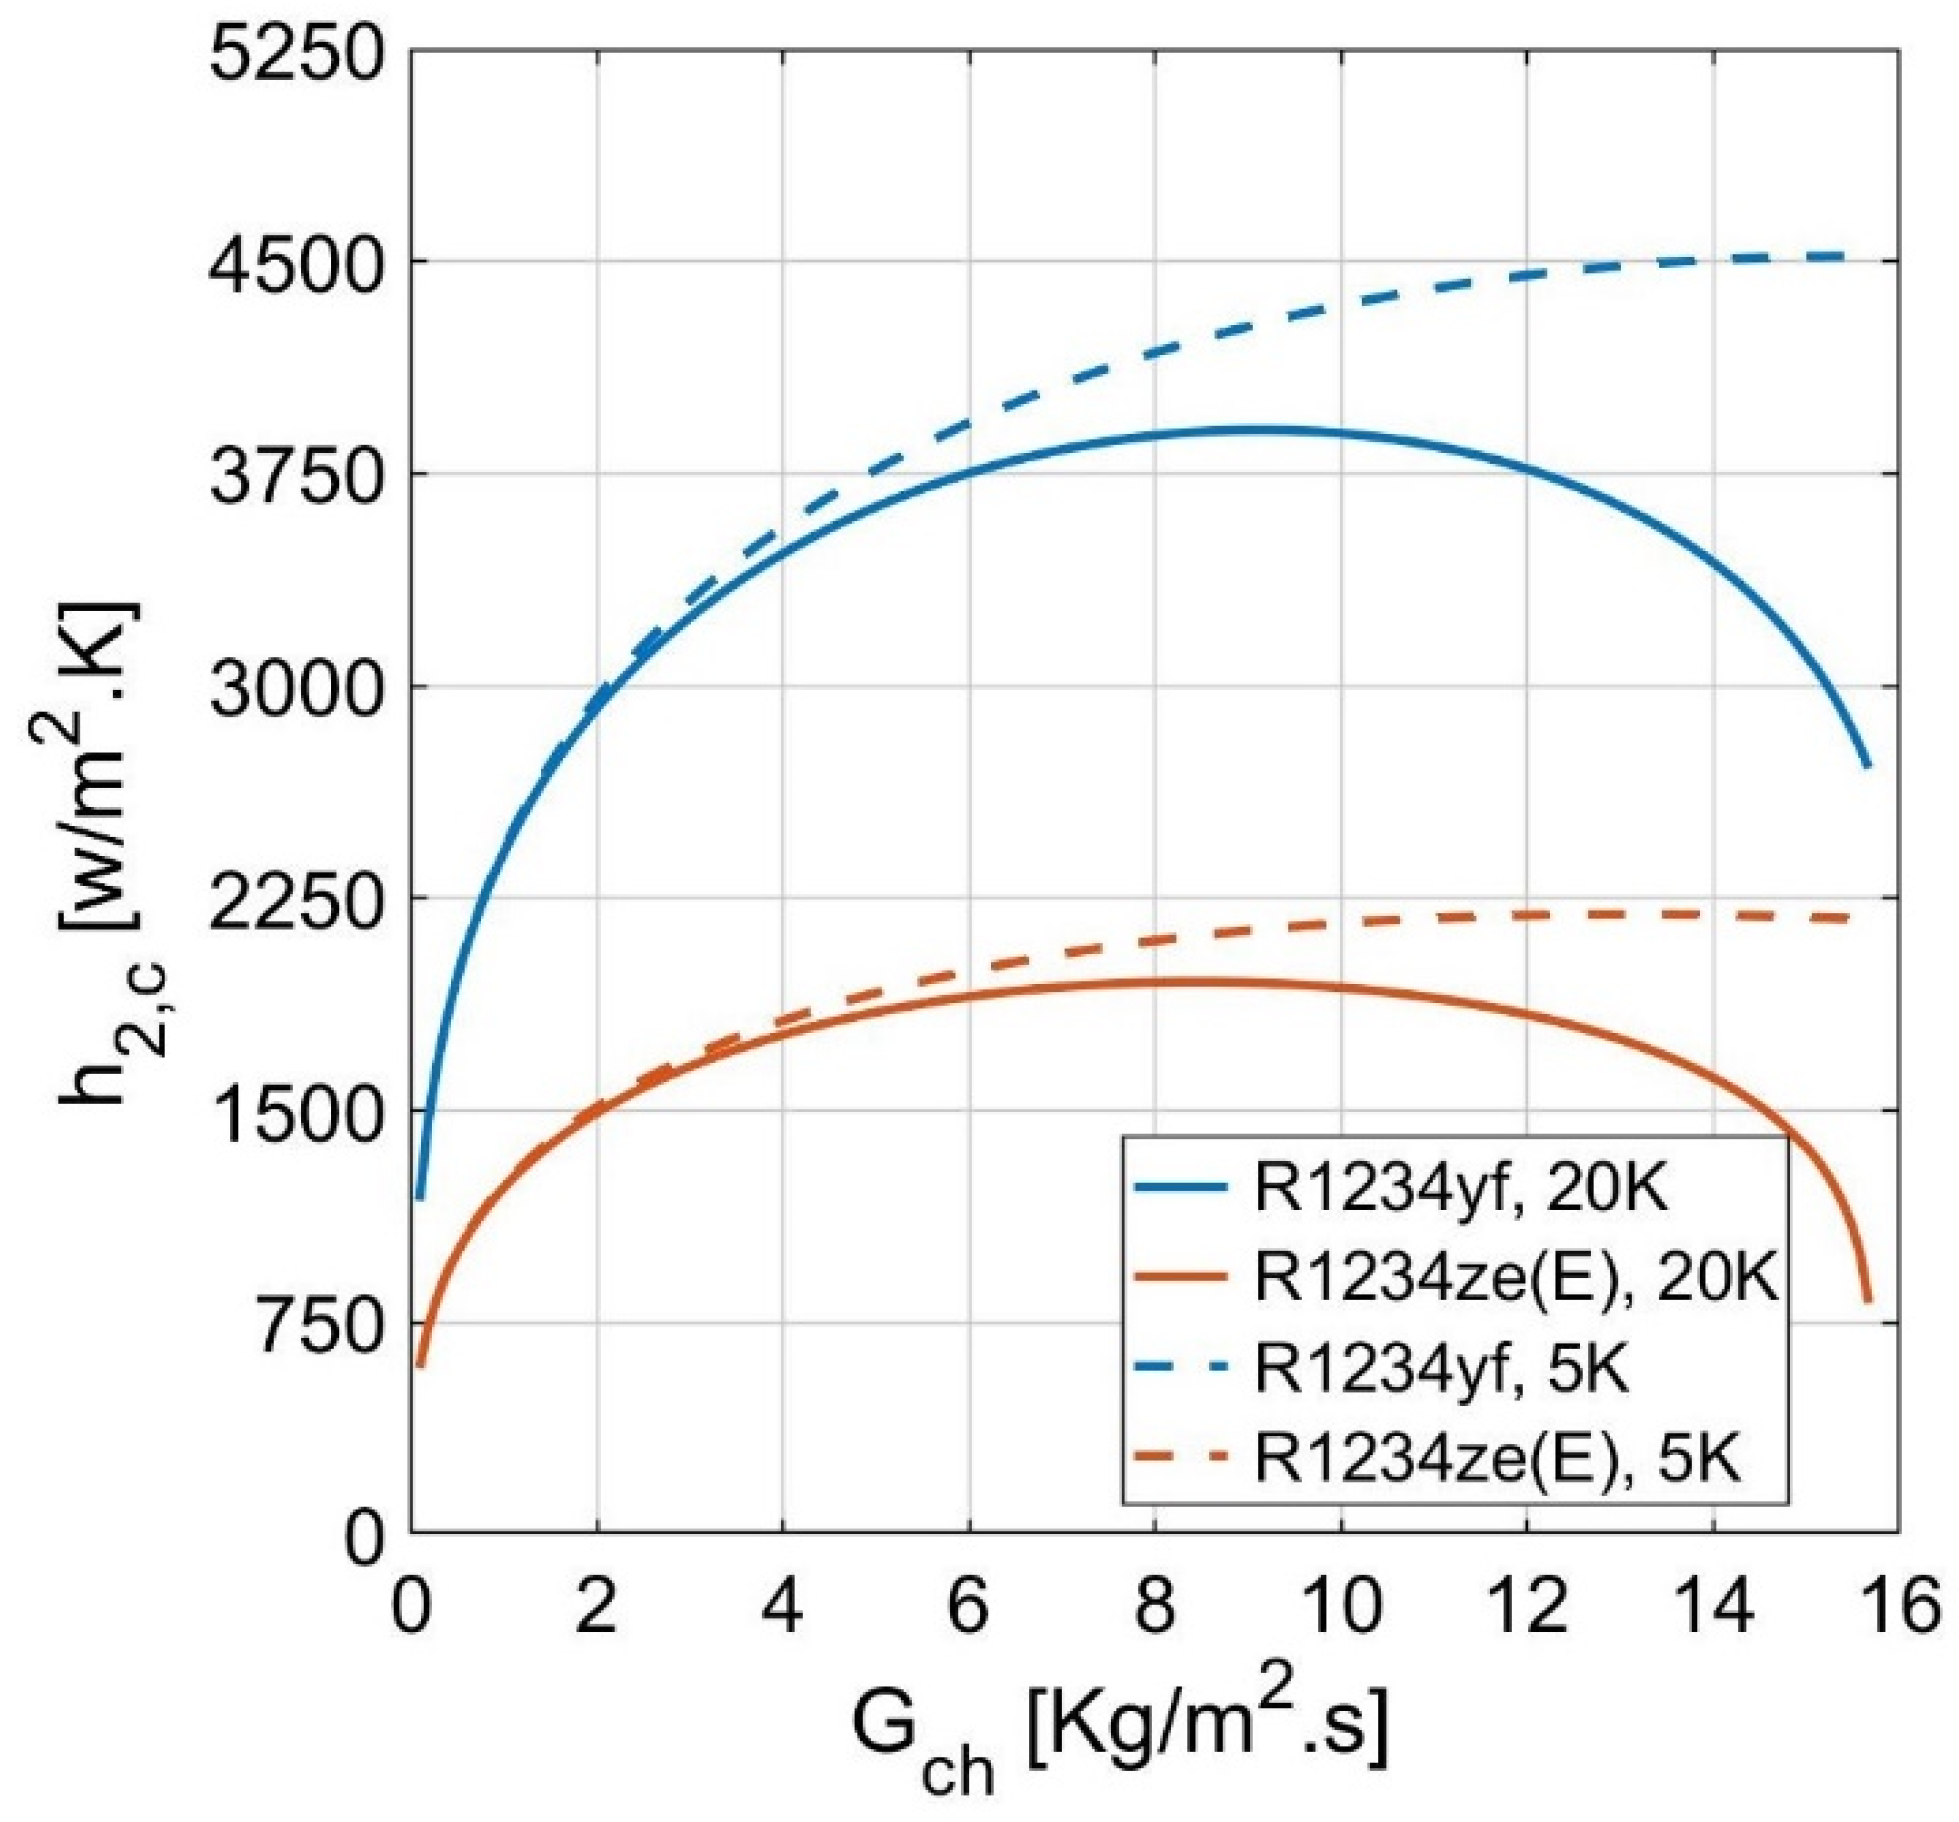
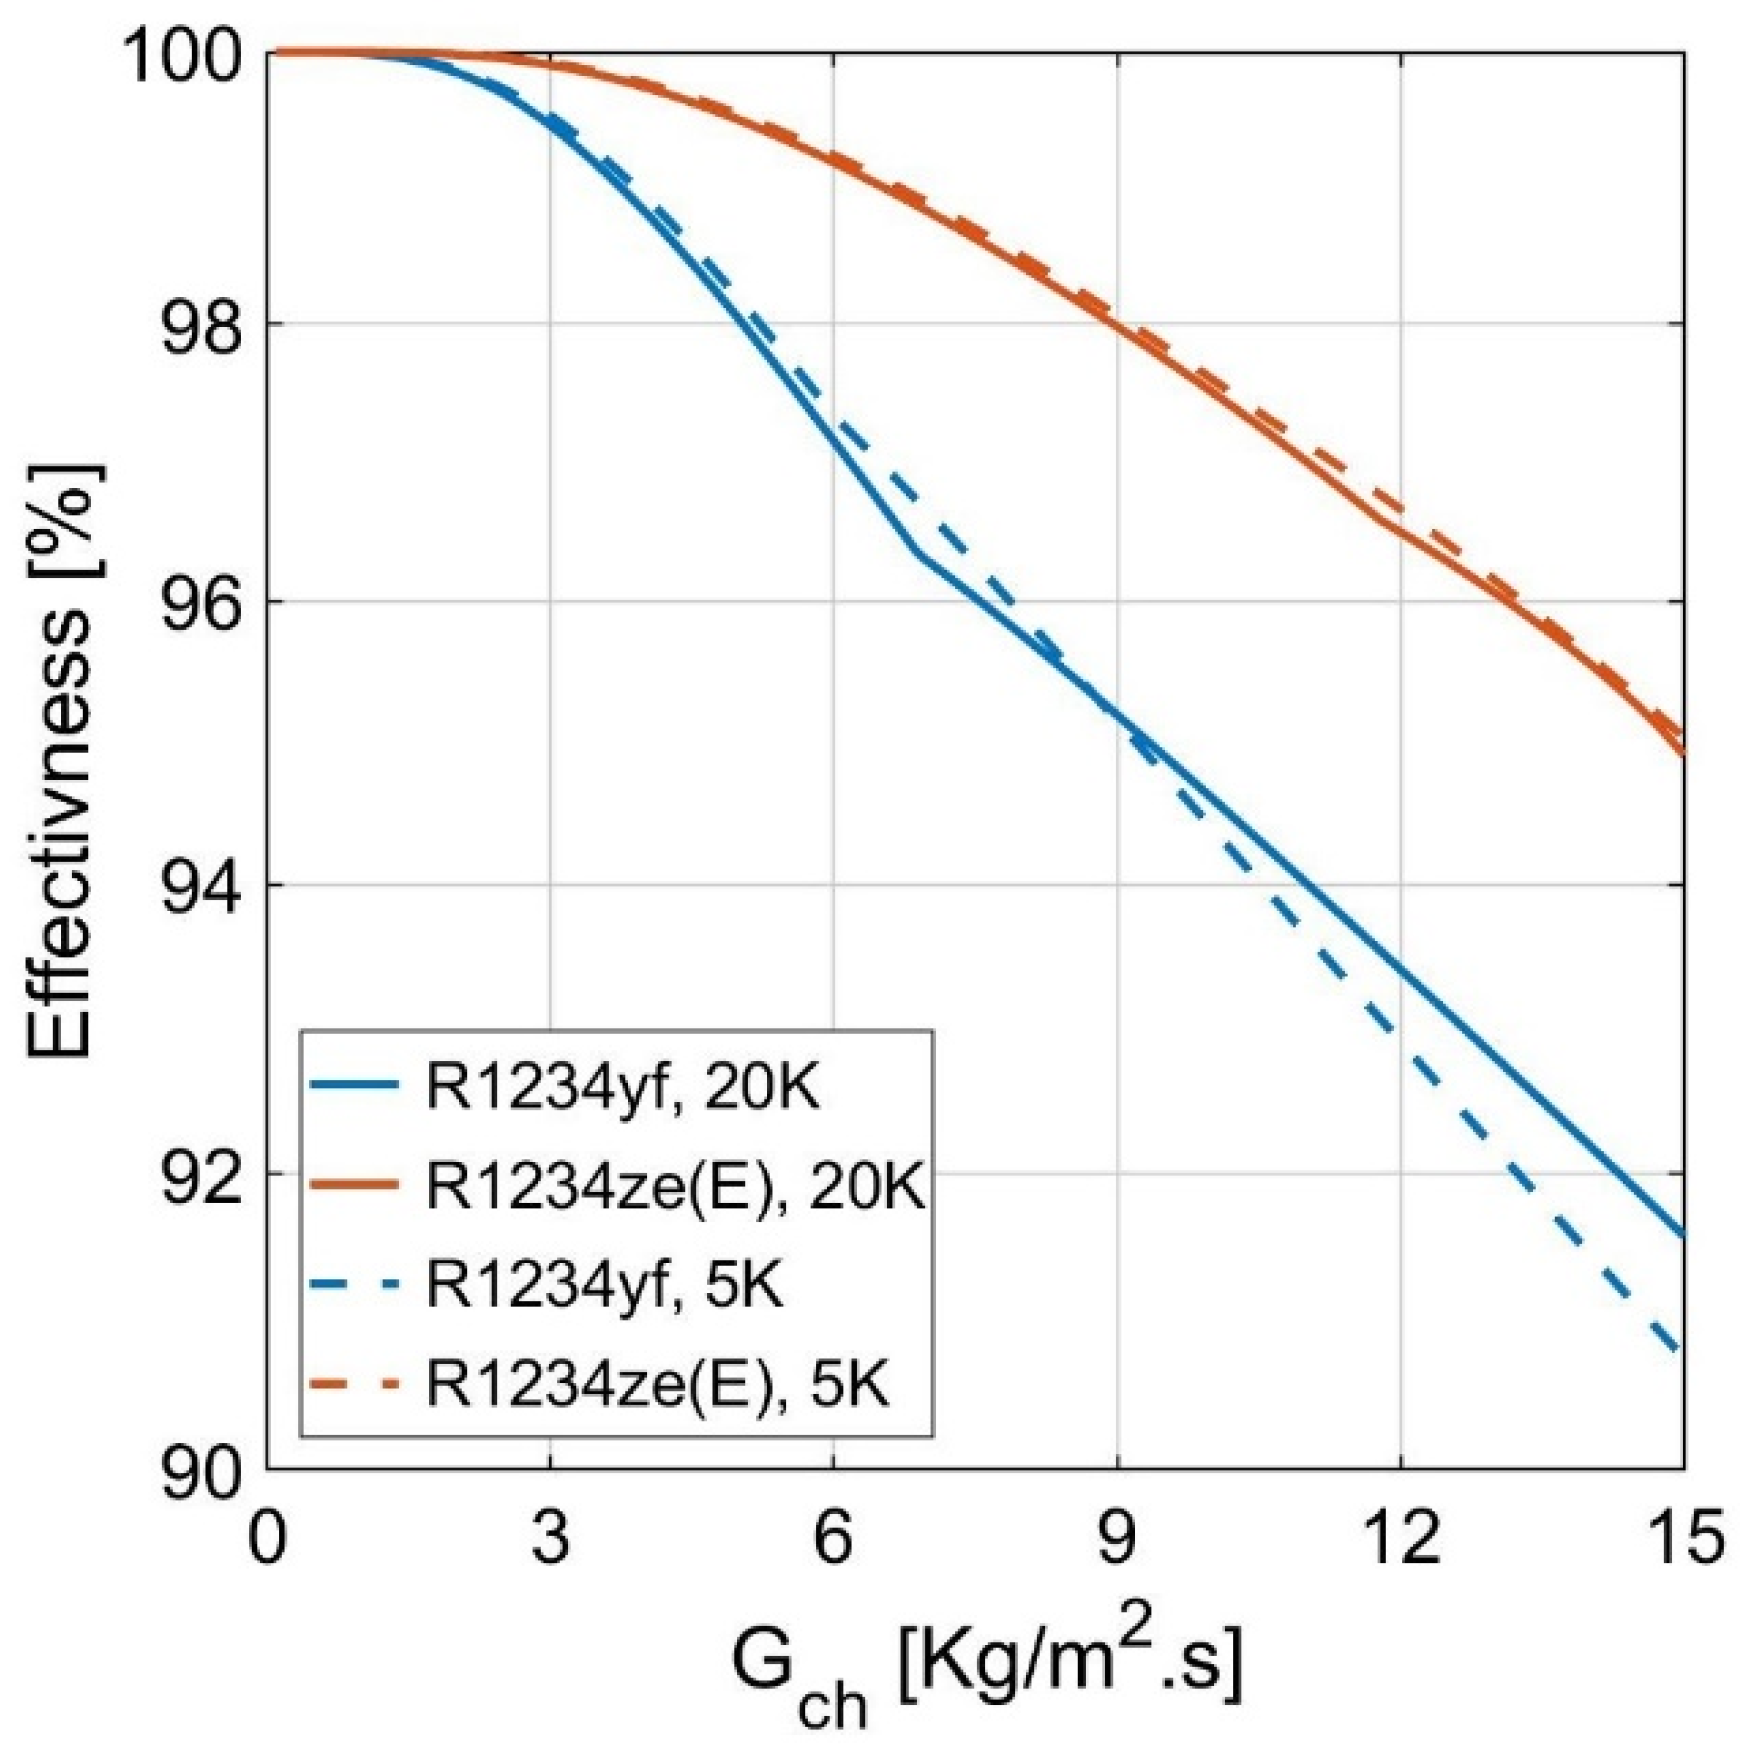
4.2. Effect of Superheat

Generally, the effect of superheat was negligible on the effectiveness, the single-phase convection coefficients, and the pressure drops. In contrast, it was slightly effective on the two-phase convection coefficient. This ensures stable operation of the proposed cycle under different operating conditions.
Figure 12 demonstrates the cold stream two-phase convection coefficients versus various cold channel mass fluxes from 0.1   kg / m 2 · s to 16 kg / m 2 · s at a hot stream inlet pressures of 12 MPa and cold stream superheat temperature differences of 5 K and 20 K. The cold-stream two-phase convection coefficient at a temperature difference of 5 K increases from 591 W / m 2 · K to 2175 W / m 2 · K for the R1234ze(E) and from 1182 W / m 2 · K to 4518   W / m 2 · K for the R1234yf. At a temperature difference of 20 K, the two-phase convection coefficient showed parabolic tendencies for R1234ze(E) from 589 W / m 2 · K to the peak at 1954 W / m 2 · K and then decreased significantly to 820 W / m 2 · K . The two-phase convection coefficient also showed parabolic tendencies for the R1234yf from 1183 W / m 2 · K to the peak at 3904 W / m 2 · K and then decreased to 2710 W / m 2 · K . The convection coefficient decreased to about 12–15% when the superheat temperature difference increased from 5 K to 20 K. This can be explained by Longo et al. observations [33] using IR thermography. The authors reported that the heat transfer area covered with a single-gas flow increases significantly with the superheat difference. According to these observations, lower heat fluxes will occur in the two-phase region, leading to lower Boiling numbers and a lower two-phase convection coefficient.
Figure 13 demonstrates the effectiveness versus cold channel mass fluxes from 0.1 to 15 kg / m 2 · s at a hot stream inlet pressure of 12 MPa and cold stream superheat temperature differences of 5 K and 20 K. The effectiveness is 100% at cold channel mass fluxes less than 1 and 2 kg / m 2 · s for R1234yf and R1234ze(E), respectively. The effectiveness then decreases to 91% and 95% for R1234yf and R1234ze(E), respectively. Additionally, the effectiveness at a 20 K superheating difference was slightly lower for channel mass fluxes less than 9 and 15 kg / m 2 · s for R1234yf and R1234ze(E), respectively. However, the effect of the cold stream superheating difference is negligible, which provides a considerable advantage for a broader range of operations for the CERC.

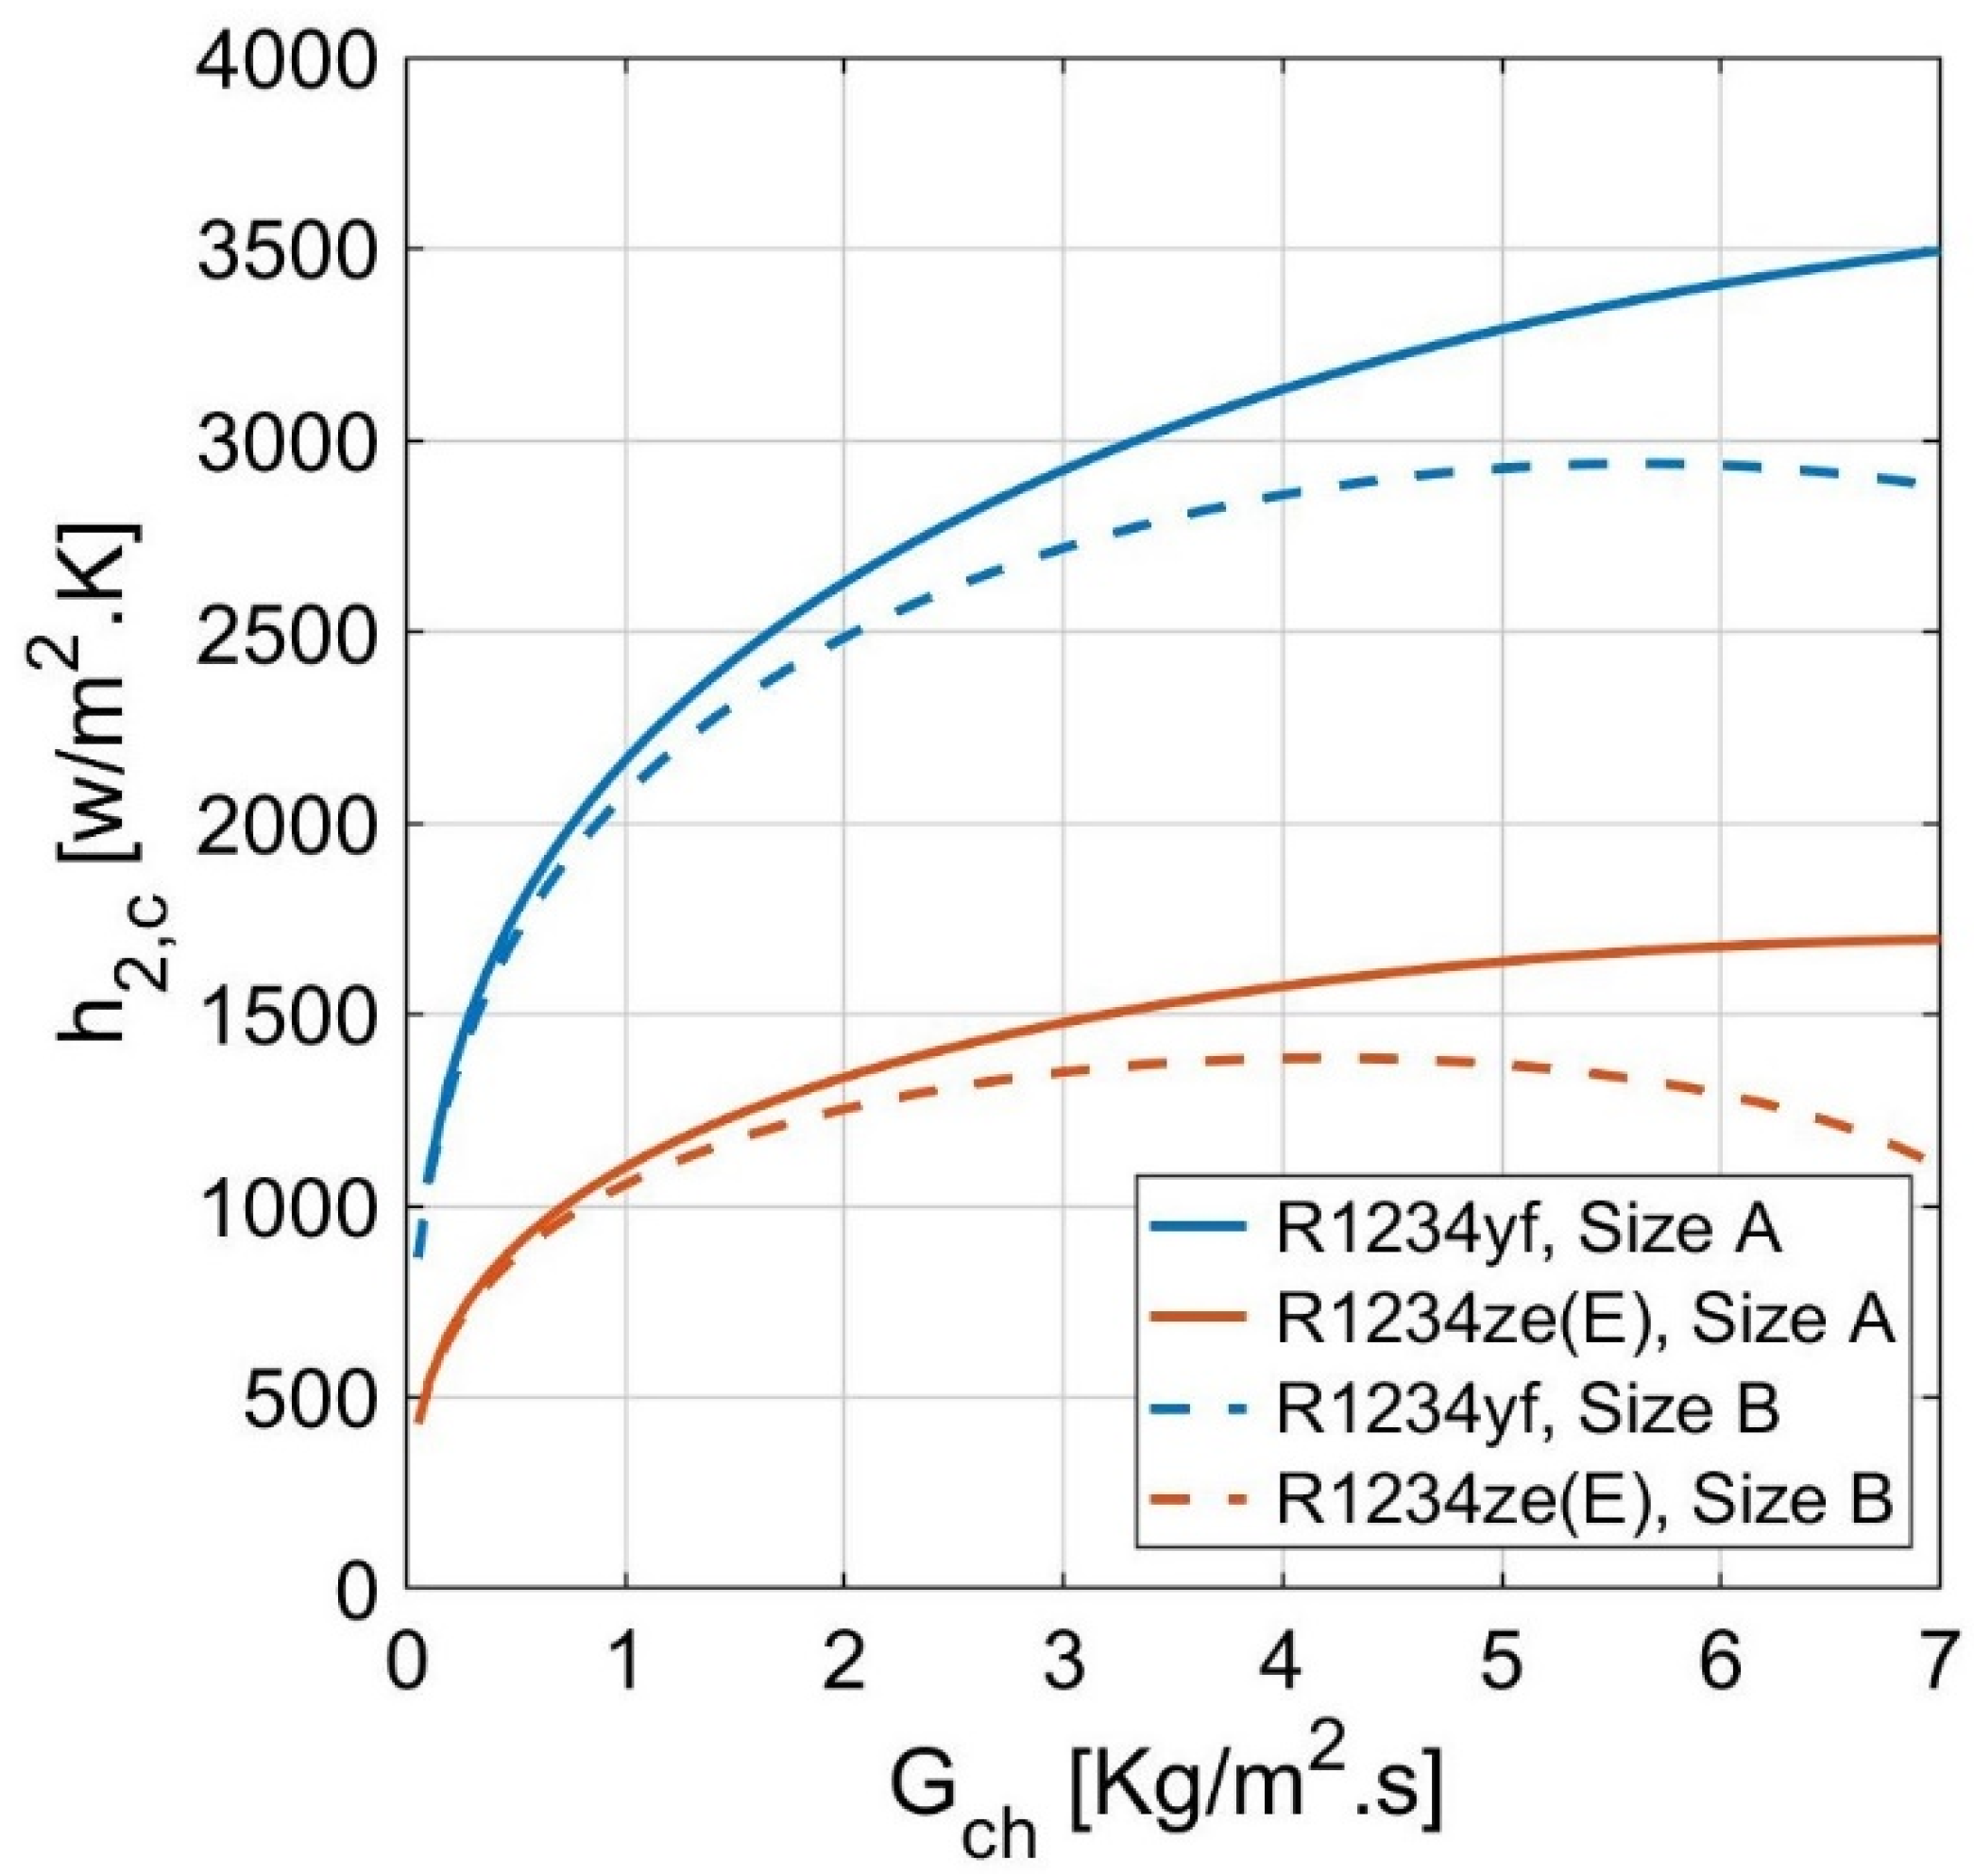
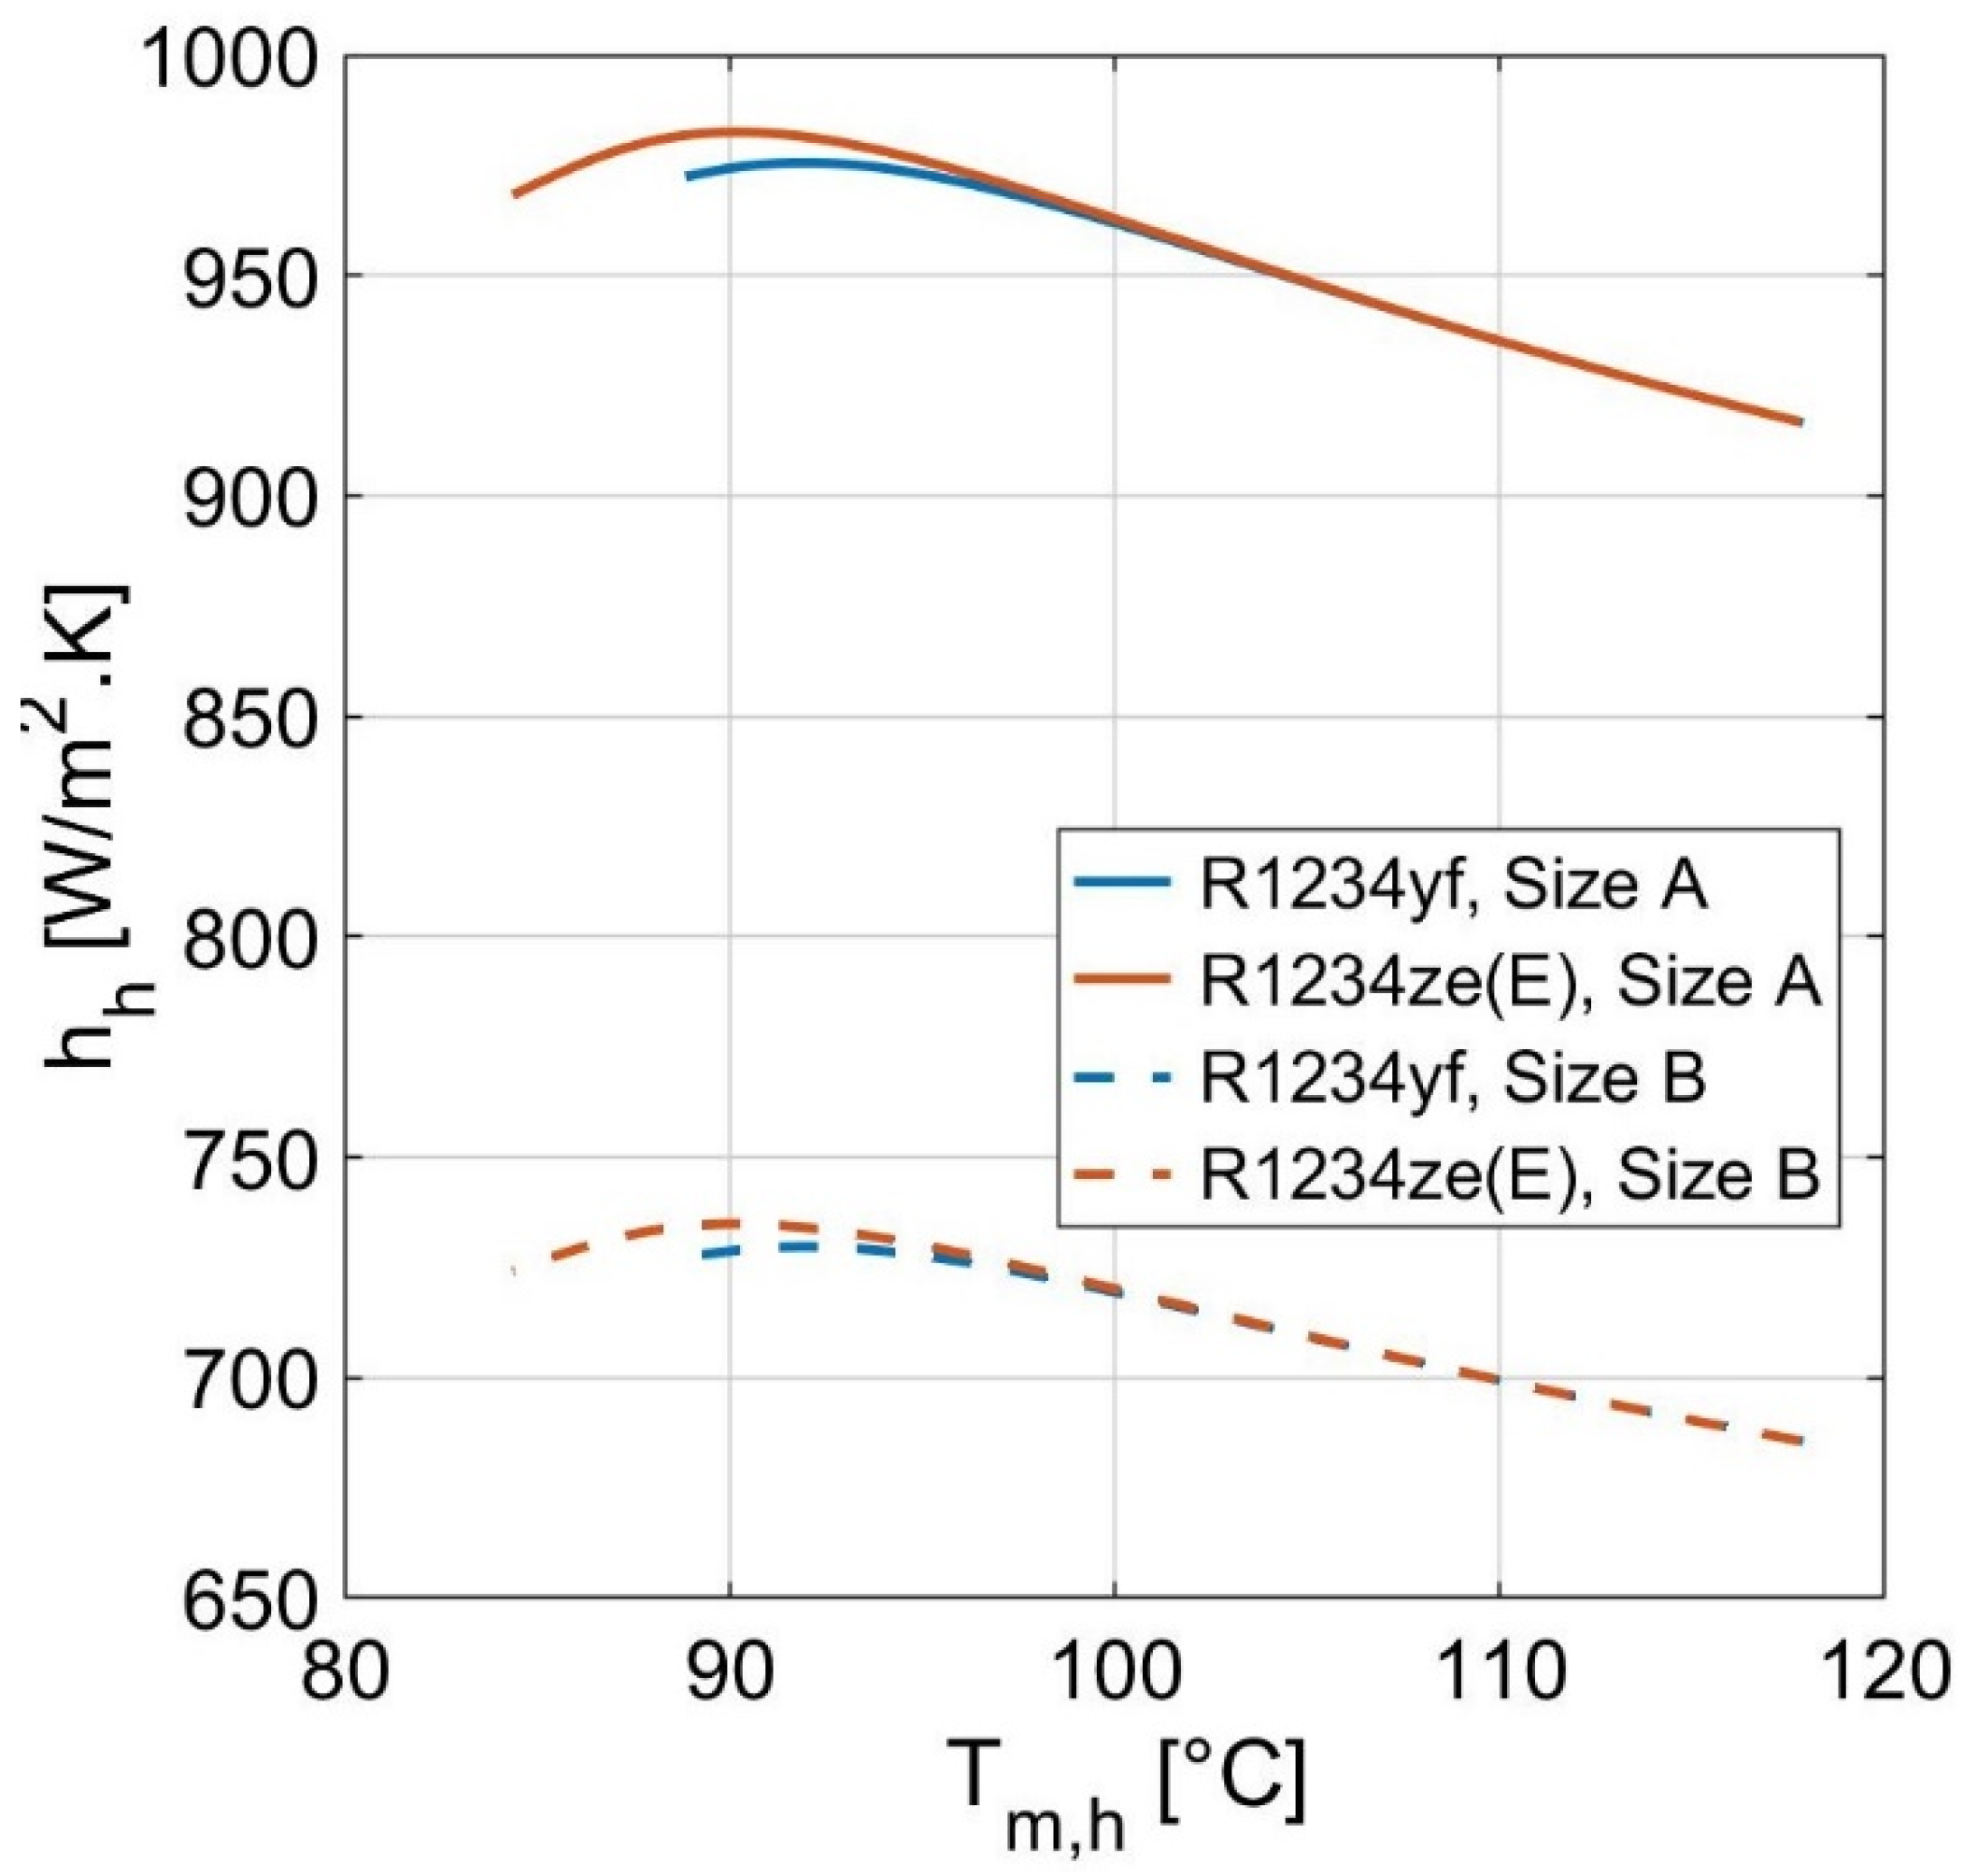
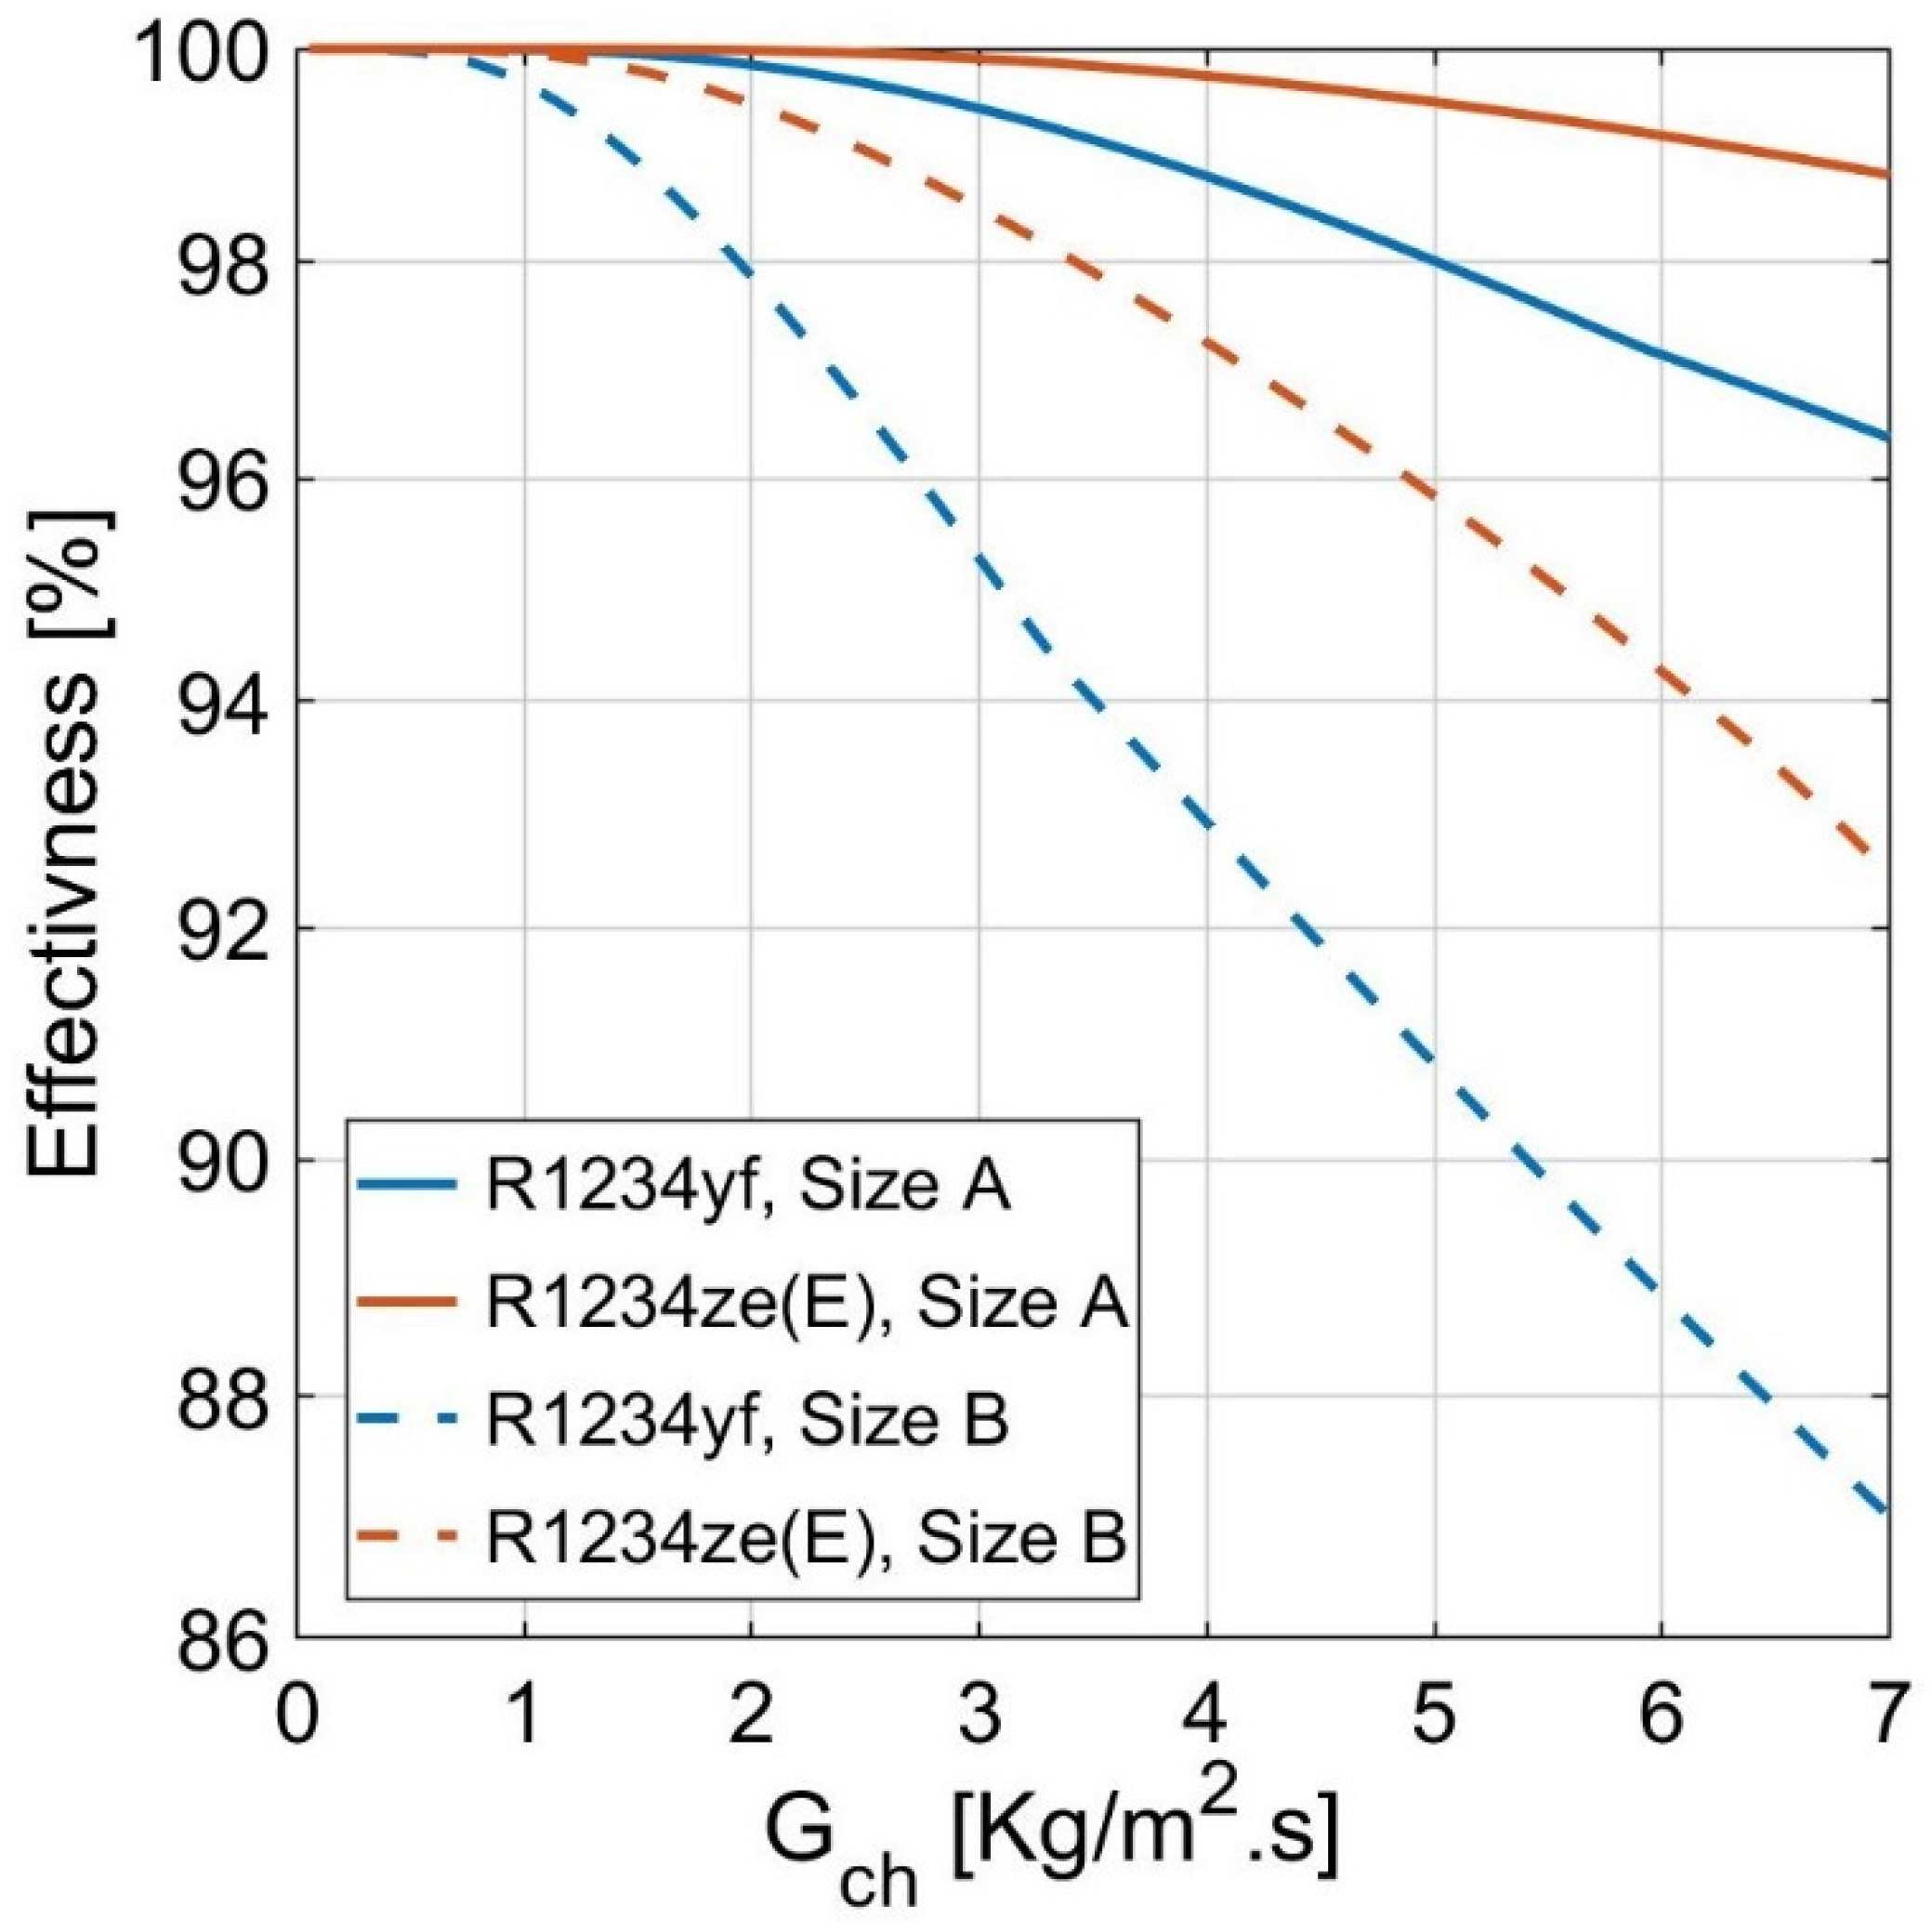
4.3. Effect of Heat Exchanger Size

The effectiveness, convection coefficients, and pressure drops were investigated with two different sizes of plates: A and B. Table 1 describes the geometrical specifications of each plate. The following sections illustrate the difference between using the two different plates. The number of plates for the size B PHE was determined based on an effective area identical to the size A PHE.
Figure 14 shows the cold stream two-phase convection coefficients versus various cold channel mass fluxes from 0.1 kg / m 2 · s to 7 kg / · s at a hot stream inlet pressure of 10 MPa, a cold stream superheat temperature difference of 3 K, and two different plate sizes: size A (marked with solid lines) and size B (marked with dashed lines). For size A, the cold-stream two-phase convection coefficient increases from 538 W / m 2 · K to 1696 W / m 2 · K for the R1234ze(E) and from 1069 W / m 2 · K to 3491   W / m 2 · K for the R1234yf. When using plate B, the two-phase convection coefficient showed parabolic tendencies for R1234ze(E) from 431 W / m 2 · K to the peak at 1386 W / m 2 · K and then decreased to 1099 W / m 2 · K . The two-phase convection coefficient also showed parabolic tendencies for R1234yf from 863 W / m 2 · K to the peak at 2937 W / m 2 · K and then decreased to 2877 W / m 2 · K . The cold stream two-phase convection coefficient for the size A PHE is higher than that for the size B PHE, with a maximum percentage of 50%.
The cold stream two-phase convection coefficients were approximately the same for both sizes at a low channel flow flux, and then the curves deviated when the heat flux approached the peak value. At this peak, the reduction in the temperature in Equation (16) becomes more dominant than the increment in the overall heat transfer coefficient. After that, the convection coefficient increased continuously until it reached a particular peak; then, it started to decrease. This topmost value occurred when the overall heat transfer coefficient converged to a constant value. The decrement occurred because the enthalpy of the vaporisation product by the channel mass flux shown in Equation (16) regularly increased with the flow rate. Generally, the plate B heat exchanger has a lower heat flux between the streams because it has a higher number of channels, resulting in a more distributed total heat rate.
The results illustrated in Figure 15 show how the hot stream convection coefficients change with the mean hot stream temperature and cold channel mass fluxes from 0.1   kg / m 2 · s to 7 kg / m 2 · s at a hot stream inlet pressure of 10 MPa, a cold stream superheat temperature difference of 3 K, and two different plate sizes: size A (marked with solid lines) and size B (marked with dashed lines).
For size A, the hot stream convection coefficients increased from 917   W / m 2 · K to 972   W / m 2 · K and 968 W / m 2 · K for R1234yf and R1234ze(E), respectively. In addition, the temperature drops from 118 °C to 89 °C and 84 °C for R1234yf and R1234ze(E), respectively. At a lower pressure, the hot stream convection coefficients increased from 686   W / m 2 · K to 727 W / m 2 · K and 725 W / m 2 · K for R1234yf and R1234ze(E), respectively, and the temperature dropped from 118 °C to 89 °C and 84 °C for R1234yf and R1234ze(E), respectively. The two investigated sizes have identical differences in the hot stream convection coefficients and temperature drops because the CO2 temperature is relatively high and far from the critical one. In addition, the peak of both HFOs is more apparent than the one illustrated in Figure 8 because of the wider range of the y-axis. This peak represents the point at which the viscosity changes its tendency from a decrease to in increase in the supercritical region. Additionally, it was observed for the Reynolds number at the same temperature. The hot stream convection coefficients were 20% higher for size A due to the difference in the Grashof number and the Reynolds number since size A has a higher hot channel mass flux. We maintained an identical hot channel mass flux for both sizes, which was possible because the hot stream flow rate was estimated using the compressor model. Moreover, the number of plates was chosen to maintain equivalent cold channel mass fluxes for both sizes.
Figure 16 demonstrates the effectiveness versus cold channel mass fluxes from 0.1 to 7 kg / m 2 · s at a hot stream inlet pressure of 10 MPa, a cold stream superheat temperature difference of 3 K, and two different plate sizes: size A (marked with solid lines) and size B (marked with dashed lines). For size A, the effectiveness decreases to 96% and 99% for R1234yf and R1234ze(E), respectively, while for size B, the effectiveness decreases to 87% and 93% for R1234yf and R1234ze(E), respectively. The lower effectiveness for size B is due mainly to the lower effective plate area, leading to a lower NTU. Moreover, as explained before, the size A exchanger had higher overall heat transfer coefficients and heat fluxes.
According to the achieved results, the effectiveness is relatively high, especially at a larger plate size, leading to a higher compression ejector refrigeration cycle COP. In addition, the PHE pressure drop is strongly influenced by the cold-stream two-phase flow. However, the pressure drops are relatively low and seem to converge at a high pressure, which is crucial for estimating the mass flow rate of the compression ejector inlet in the CERC. On the other hand, the applicable flow rate range was limited only by the HFO saturation temperature in the two-phase flow region (k = 2). In this region, the limitation is due to the difference in temperature between the two streams. The flow rate must be modified to a value that guarantees that the CO2 temperature is higher than the HFO saturation temperature. Once a good flow range is specified, a stable and smooth variation in the convection coefficient would be observed for the three different phases, resulting in a smooth operation of the overall combined cycle. For the gas-cooler side, the relatively high temperature of the CO2 negates the nonlinearity in the CO2’s properties, making it a suitable driving heat source for the generator in the combined cycle.

5. Conclusions

CO2 transcritical refrigeration systems have inherently high working pressures and discharge temperatures, providing a large volumetric heating capacity. Therefore, the heat ejected from the CO2 gas cooler was proposed to be utilised as a driving heating source for the compression ejector system, representing the energy supply for the generator in a combined cycle. The study was based on the local theoretical approach to a brazed plate heat exchanger. The theoretical model was constructed by a Matlab code with analysis procedures illustrated through flow chart stages. The main parameters for the assessment of the heat exchanger, including the convection coefficients, the effectiveness, and the pressure drops, were evaluated and discussed at various CO2 inlet pressures, different cold-side refrigerant superheat temperatures, and two different plate sizes.
The results indicate that the two-phase convection coefficient of the refrigerants was the most dominant parameter in the heat transfer process between the two streams. The most relevant findings can be summarised as follows:
  • when increasing the hot stream inlet pressure from 9 to 12 MPa, the two-phase convection coefficients of the HFOs increase significantly with a range of 20–50% and 20–200% for R1234yf and R1234ze(E), respectively;
  • increasing the cold stream superheat temperature difference from 5 K to 20 K allows the two-phase convection coefficients of the HFOs to increase steeply with a value of 1–20% at low cold channel flow fluxes;
  • the two-phase convection coefficient is significantly influenced by the boiling and bond numbers. The working fluid type affects the bond number, while the heat flux dominates the boiling number;
  • increasing the plate size influenced both the two-phase convection coefficient and the effectiveness significantly. The two-phase convection coefficients of the HFOs increased with a range of 1–20% and 1–50% for R1234yf and R1234ze(E), respectively. In contrast, the effectiveness increased by 10% for R1234yf and 5% for R1234ze(E);
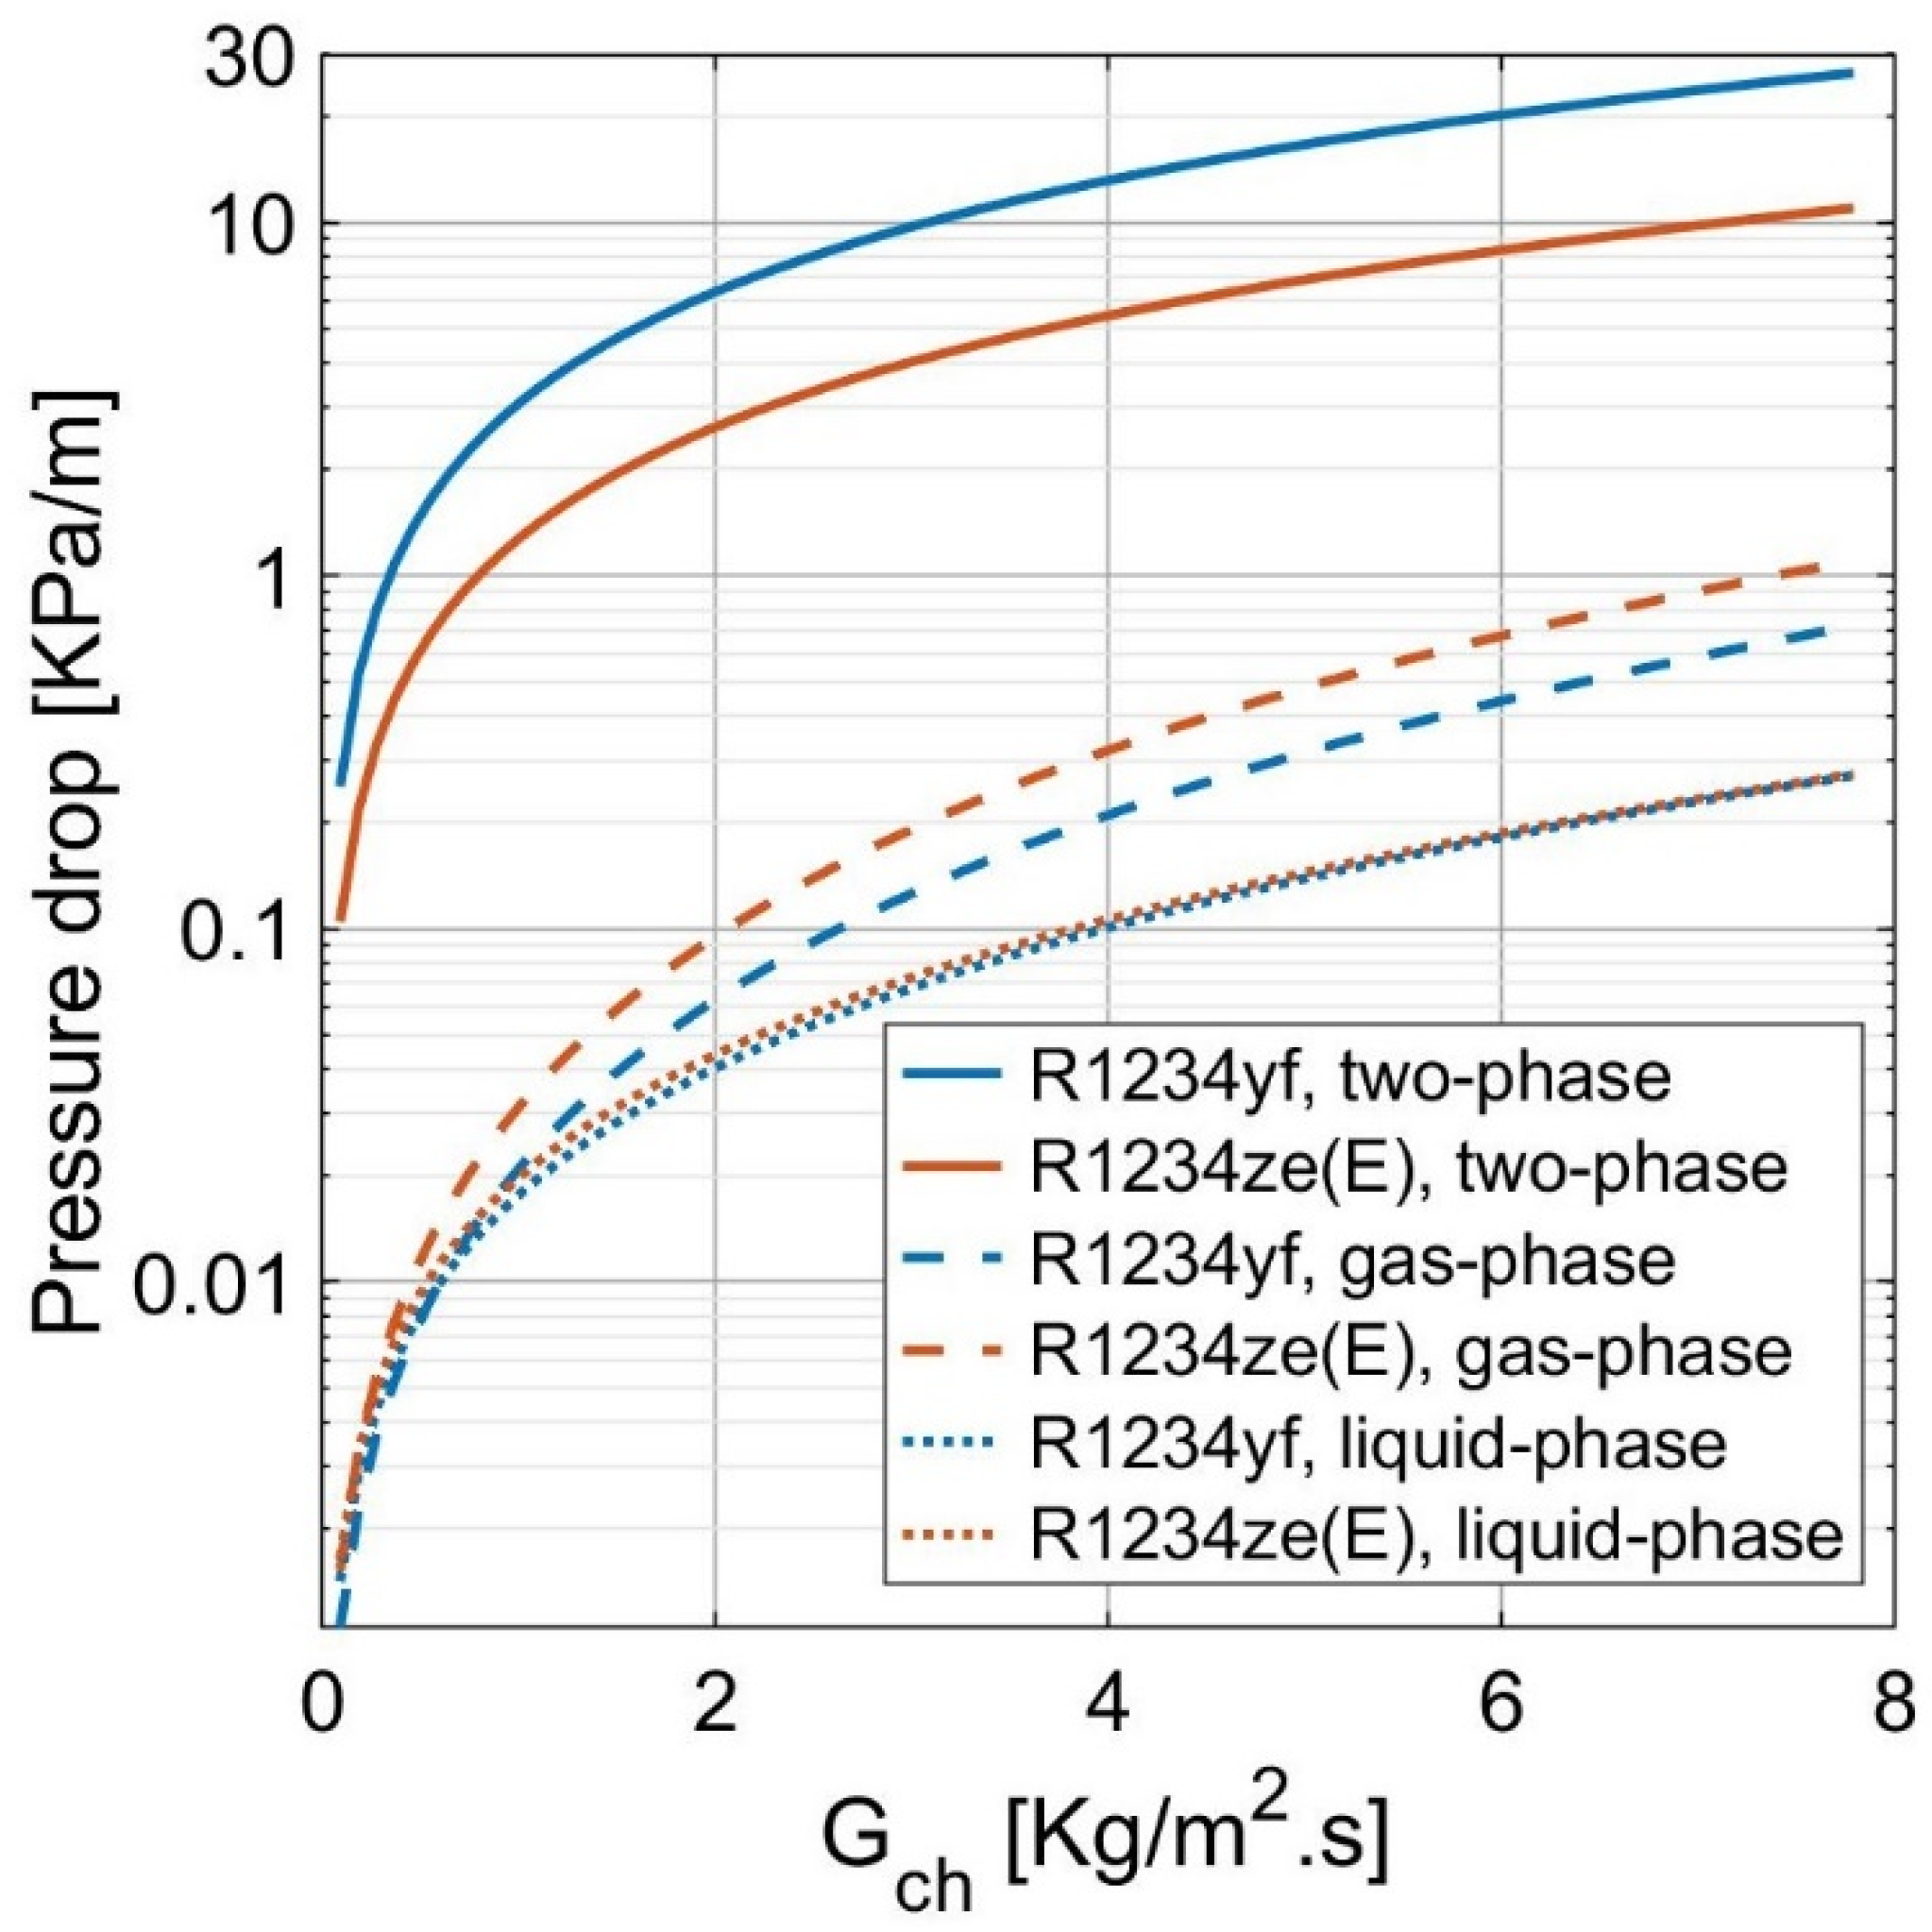
  • the two-phase convection coefficient dominates the frictional pressure drop as the flow is turbulent even at a low vapor quality.
In addition, the gas cooler of the CO2 transcritical cycle operates at a relatively high temperature far from the critical point, causing a smooth variation in the thermophysical properties. This effect provides stable operation and distinguishes the use of supercritical CO2 as a heat source.
According to previously mentioned findings, the CO2 transcritical cycle can be used efficiently as a heat source for the CERC generator since the heat transfer coefficients, the effectiveness, and the pressure drops have smooth variations at different flow fluxes, superheat temperature differences, and plate sizes.

Author Contributions

Conceptualization, A.F.A.E. and M.Y.H.; methodology, A.F.A.E. and M.Y.H.; software, M.Y.H.; formal analysis, A.F.A.E. and M.Y.H.; investigation, A.F.A.E., V.D. and M.Y.H.; writing—original draft preparation, A.F.A.E. and M.Y.H.; writing—review and editing, A.F.A.E. and V.D.; supervision, V.D.; project administration, A.F.A.E. All authors have read and agreed to the published version of the manuscript.

Funding

This research was supported and funded by the Student Grant Competition of the Technical University of Liberec under project No. SGS-2021-5063.

Institutional Review Board Statement

Not applicable.

Informed Consent Statement

Not applicable.

Data Availability Statement

All data are available from the authors on request.

Conflicts of Interest

The authors declare no conflict of interest.

Nomenclature

Units and Symbols
m ˙ Mass flow rate (Kg/m2)
AArea (m2)
bMean channel gap (m)
BdBond number (-)
BoBoiling number (-)
CHeat capacity (KW/K)
CpSpecific heat (Kj/Kg.K)
DDiameter (m)
fFanning friction coefficient (-)
FFouling Factor (m/s2)
gGravity acceleration (m/s2)
GMass flux (Kg/m2·s)
GrGrashof number (-)
HEnthalpy (Kj/Kg)
IEnthalpy of vapourization (Kj/Kg)
hConvection coefficient (-)
LEffective flow length (m)
NTUNumber of transfer units (-)
NuNusselt number (-)
pPlate pitch (m)
PPressure (MPa)
PHEPlate heat exchanger (-)
PrPrandtl number (-)
qHeat flux (KW/ m2)
QHeat rate (KW)
ReReynolds number (-)
tThickness (m)
WPlate width (m)
Greek symbols
Enlargement factor (-)
µDynamic Viscosity (kg/m.s)
βCorrugation Angle (°)
ΔDifference (-)
εEffectiveness (-)
κConductivity (-)
λCorrugation Pitch (kg/m3)
ρDensity (kg/m3)
σ Surface tension. (N/m)
Subscripts
*Reduced
aMartin first constant
1First partition
bMartin second constant
2Second partition
3Third partition
cCold
chChannel
effEffective
hHot
hyHydraulic
iInlet
kArtificial partition index
lLiquid
loLiquid only
lvLiquid vapour difference
mMean
oOutlet
pPlate
sRefrigerant type index
satSaturated
SHSuperheated
spSingle phase
tpTwo phase
vVapour
voVapour only
wWall

References

  1. Tashtoush, B.M.; Al-Nimr, M.A.; Khasawneh, M.A. A comprehensive review of ejector design, performance, and applications. Appl. Energy 2019, 240, 138–172. [Google Scholar] [CrossRef]
  2. Besagni, G.; Inzoli, F. Computational fluid-dynamics modeling of supersonic ejectors: Screening of turbulence modeling approaches. Appl. Therm. Eng. 2017, 117, 122–144. [Google Scholar] [CrossRef]
  3. Chen, X.; Omer, S.; Worall, M.; Riffat, S. Recent developments in ejector refrigeration technologies. Renew. Sustain. Energy Rev. 2013, 19, 629–651. [Google Scholar] [CrossRef]
  4. Charalambous, P.G.; Maidment, G.G.; Kalogirou, S.A.; Yiakoumetti, K. Photovoltaic thermal (PV/T) collectors: A review. Appl. Therm. Eng. 2007, 27, 275–286. [Google Scholar] [CrossRef] [Green Version]
  5. Nehdi, E.; Kairouani, L.; Elakhdar, M. A solar ejector air-conditioning system using environment-friendly working fluids. Int. J. Energy Res. 2008, 32, 1194–1201. [Google Scholar] [CrossRef]
  6. Spallina, V.; Romano, M.C.; Chiesa, P.; Lozza, G. Integration of Coal Gasification and Packed Bed CLC process for High Efficiency and Near-zero Emission Power Generation. Energy Procedia 2013, 37, 662–670. [Google Scholar] [CrossRef]
  7. Li, C.; Wang, R.; Lu, Y. Investigation of a novel combined cycle of solar powered adsorption–ejection refrigeration system. Renew. Energy 2002, 26, 611–622. [Google Scholar] [CrossRef]
  8. Amalfi, R.L.; Vakili-Farahani, F.; Thome, J.R. Flow boiling and frictional pressure gradients in plate heat exchangers. Part 1: Review and experimental database. Int. J. Refrig. Rev. Int. Du Froid. 2016, 61, 166–184. [Google Scholar] [CrossRef]
  9. Zohuri, B. Compact Heat Exchangers; Springer International Publishing: Cham, Switzerland, 2017; Volume 58. [Google Scholar]
  10. Kakaç, S.; Liu, H.; Pramuanjaroenkij, A. Heat Exchangers: Selection, Rating, and Thermal Design, 2nd ed.; Taylor & Francis: Abingdon, UK, 2002. [Google Scholar]
  11. Zendehboudi, A.; Ye, Z.; Hafner, A.; Andresen, T.; Skaugen, G. Heat transfer and pressure drop of supercritical CO2 in brazed plate heat exchangers of the tri-partite gas cooler. Int. J. Heat Mass Transf. 2021, 178, 121641. [Google Scholar] [CrossRef]
  12. Amalfi, R.L. Two-Phase Heat Transfer Mechanisms within Plate Heat Exchangers:Experiments, Modeling and Simulations; EPFL: Lausanne, Switzerland, 2016. [Google Scholar]
  13. Kumar, H. The Plate Heat Exchanger: Construction and Design. In Proceedings of the First U.K. National Conference on Heat Transfer, Leeds, UK, 3–5 July 1984; pp. 1275–1288. [Google Scholar]
  14. Martin, H. A theoretical approach to predict the performance of chevron-type plate heat exchangers. Chem. Eng. Process. Process. Intensif. 1996, 35, 301–310. [Google Scholar] [CrossRef]
  15. Focke, W.; Zachariades, J.; Olivier, I. The effect of the corrugation inclination angle on the thermohydraulic performance of plate heat exchangers. Int. J. Heat Mass Transf. 1985, 28, 1469–1479. [Google Scholar] [CrossRef]
  16. Hayes, N.; Jokar, A.; Ayub, Z.H. Study of carbon dioxide condensation in chevron plate exchangers; heat transfer analysis. Int. J. Heat Mass Transf. 2011, 54, 1121–1131. [Google Scholar] [CrossRef]
  17. Hayes, N.; Jokar, A.; Ayub, Z.H. Study of carbon dioxide condensation in chevron plate exchangers; pressure drop analysis. Int. J. Heat Mass Transf. 2012, 55, 2916–2925. [Google Scholar] [CrossRef]
  18. Jokar, A.; Hosni, H.M.; Eckels, S.J. Dimensional analysis on the evaporation and condensation of refrigerant R-134a in minichannel plate heat exchangers. Appl. Thermal Eng. 2006, 26, 2287–2300. [Google Scholar] [CrossRef]
  19. Lockhart, R.W.; Martinelli, R.C. Proposed Correlation of Data for Isothermal Two-Phase, Two-Component Flow in Pipes. Chem. Eng. Prog. 1949, 45, 9–48. [Google Scholar]
  20. Chisholm, D. A theoretical basis for the Lockhart-Martinelli correlation for two-phase flow. Int. J. Heat Mass Transf. 1967, 10, 1767–1778. [Google Scholar] [CrossRef]
  21. Amalfi, R.L.; Vakili-Farahani, F.; Thome, J.R. Flow boiling and frictional pressure gradients in plate heat exchangers. Part 2: Comparison of literature methods to database and new prediction methods. Int. J. Refrig. Rev. Int. Du Froid. 2016, 61, 185–203. [Google Scholar] [CrossRef] [Green Version]
  22. Finlayson-Pitts, B.J.; Pitts Jr., J.N. Scientific Basis for Control of Halogenated Organics. Chem. Up. Low. Atmos. 2000, 727–761. [Google Scholar] [CrossRef]
  23. Vallero, D.A. Air pollution calculations: Quantifying pollutant formation, transport, transformation, fate and risks; Elsevier: Amsterdam, The Netherlands, 2019; pp. 377–428. [Google Scholar]
  24. Wuebbles, D.J. Ozone Depletion and Related Topics: Ozone Depletion Potentials, Encyclopedia of Atmospheric Sciences, 2nd ed.; Elsevier: Amsterdam, The Netherlands, 2015; Volume 4, pp. 364–369. [Google Scholar] [CrossRef]
  25. Longo, G.A.; Mancin, S.; Righetti, G.; Zilio, C. HFC32 vaporisation inside a Brazed Plate Heat Exchanger (BPHE): Experimental measurements and IR thermography analysis. Int. J. Refrig. 2015, 57, 77–86. [Google Scholar] [CrossRef]
  26. ASHRAE. 2018 ASHRAE Handbook-Refrigeration; ASHRAE: Atlanta, GA, USA, 2018. [Google Scholar]
  27. Nekså, P.; Walnum, H.T.; Hafner, A. Keynote: CO2—A refrigerant from the past with prospects of being one of the main refrigerants in the futurer. In Proceedings of the 9th IIR-Gustav Lorentzen Conference on Natural Working Fluids, Sydney, Australia, 14–15 April 2010. [Google Scholar]
  28. United Nations Development Programme. Montreal Protocol on Substances That Deplete the Ozone Layer. 20 Years of Success; United Nations Development Programme: New York, NY, USA, 2007; p. 50. [Google Scholar]
  29. Karayiannis, T. EHD boiling heat transfer enhancement of R123 and R11 on a tube bundle. Appl. Therm. Eng. 1998, 18, 809–817. [Google Scholar] [CrossRef]
  30. Aprea, C.; Greco, A.; Maiorino, A. An experimental evaluation of the greenhouse effect in the substitution of R134a with CO 2. Energy 2012, 45, 753–761. [Google Scholar] [CrossRef]
  31. Kruse, H. European research concerning CFC and HCFC substitution. Int. J. Refrig. 1994, 17, 149–155. [Google Scholar] [CrossRef]
  32. Huang, J.; Sheer, T.J.; Bailey-McEwan, M. Heat transfer and pressure drop in plate heat exchanger refrigerant evaporators. Int. J. Refrig. 2012, 35, 325–335. [Google Scholar] [CrossRef]
  33. Longo, G. Vaporisation of the low GWP refrigerant HFO1234yf inside a brazed plate heat exchanger. Int. J. Refrig. 2012, 35, 952–961. [Google Scholar] [CrossRef]
  34. Longo, G.A.; Mancin, S.; Righetti, G.; Zilio, C. HFO1234ze(E) vaporisation inside a Brazed Plate Heat Exchanger (BPHE): Comparison with HFC134a and HFO1234yf. Int. J. Refrig. 2016, 67, 125–133. [Google Scholar] [CrossRef]
  35. Longo, G.A.; Mancin, S.; Righetti, G.; Zilio, C. Boiling of the new low-GWP refrigerants R1234ze(Z) and R1233zd(E) inside a small commercial brazed plate heat exchanger. Int. J. Refrig. 2019, 104, 376–385. [Google Scholar] [CrossRef]
  36. Lorentzen, G.; Pettersen, J. A new, efficient and environmentally benign system for car air-conditioning. Int. J. Refrig. 1993, 16, 4–12. [Google Scholar] [CrossRef]
  37. Ehsan, M.M.; Guan, Z.; Klimenko, A. A comprehensive review on heat transfer and pressure drop characteristics and correlations with supercritical CO 2 under heating and cooling applications. Renew. Sustain. Energy Rev. 2018, 92, 658–675. [Google Scholar] [CrossRef]
  38. Elbarghthi, A.F.; Hafner, A.; Banasiak, K.; Dvorak, V. An experimental study of an ejector-boosted transcritical R744 refrigeration system including an exergy analysis. Energy Convers. Manag. 2021, 238, 114102. [Google Scholar] [CrossRef]
  39. Elbarghthi, A.F.; Mohamed, S.; Nguyen, V.V.; Dvorak, V. CFD Based Design for Ejector Cooling System Using HFOS (1234ze(E) and 1234yf). Energies 2020, 13, 1408. [Google Scholar] [CrossRef] [Green Version]
  40. Elbarghthi, A.F.; Dvorak, V.; Hafner, A.; Banasiak, K. The potential impact of the small-scale ejector on the R744 transcritical refrigeration system. Energy Convers Manag. 2021, 249, 114860. [Google Scholar] [CrossRef]
  41. Lemmon, E.; Huber, M.; McLinden, M. NIST Standard Reference Database 23: Reference Fluid Thermodynamic and Transport Properties-REFPROP, Version 9.1.; Natl Std. Ref. Data Series (NIST NSRDS); National Institute of Standards and Technology: Gaithersburg, MD, USA, 2013. [Google Scholar]
  42. The European Parliament and the Council of the European Union. REGULATION (EU) No 517/2014. Off. J. Eur. Union 2014, 57, 195–230. Available online: https://eur-lex.europa.eu/legal-content/EN/TXT/?uri=uriserv:OJ.L_.2014.150.01.0001.01.ENG&toc=OJ:L:2014:150:TOC (accessed on 15 November 2021).
  43. Minor, B.; Spatz, M. HFO-1234yf Low GWP Refrigerant Update. In Proceedings of the Purdue University International Refrigeration and Air Conditioning Conference, West Lafayette, IN, USA, 15–17 July 2008; Pap. No. 937; pp. 1–8. [Google Scholar]
  44. Kracik, J.; Dvorak, V.; Van, V.N.; Śmierciew, K. Experimental and Numerical Study on Supersonic Ejectors Working with R-1234ze(E). EPJ Web Conf. 2018, 180, 02047. [Google Scholar] [CrossRef]
  45. Smierciew, K.; Gagan, J.; Butrymowicz, D.; Łukaszuk, M.; Kubiczek, H. Experimental investigation of the first prototype ejector refrigeration system with HFO-1234ze(E). Appl. Therm. Eng. 2017, 110, 115–125. [Google Scholar] [CrossRef]
  46. Dorin Software Version: 20.12. 2020. Available online: https://www.dorin.com/en/Software/ (accessed on 31 August 2021).
  47. Incropera, F.P. Fundamentals of Heat and Mass Transfer; John Wiley & Sons, Inc.: Hoboken, NJ, USA, 2006. [Google Scholar]
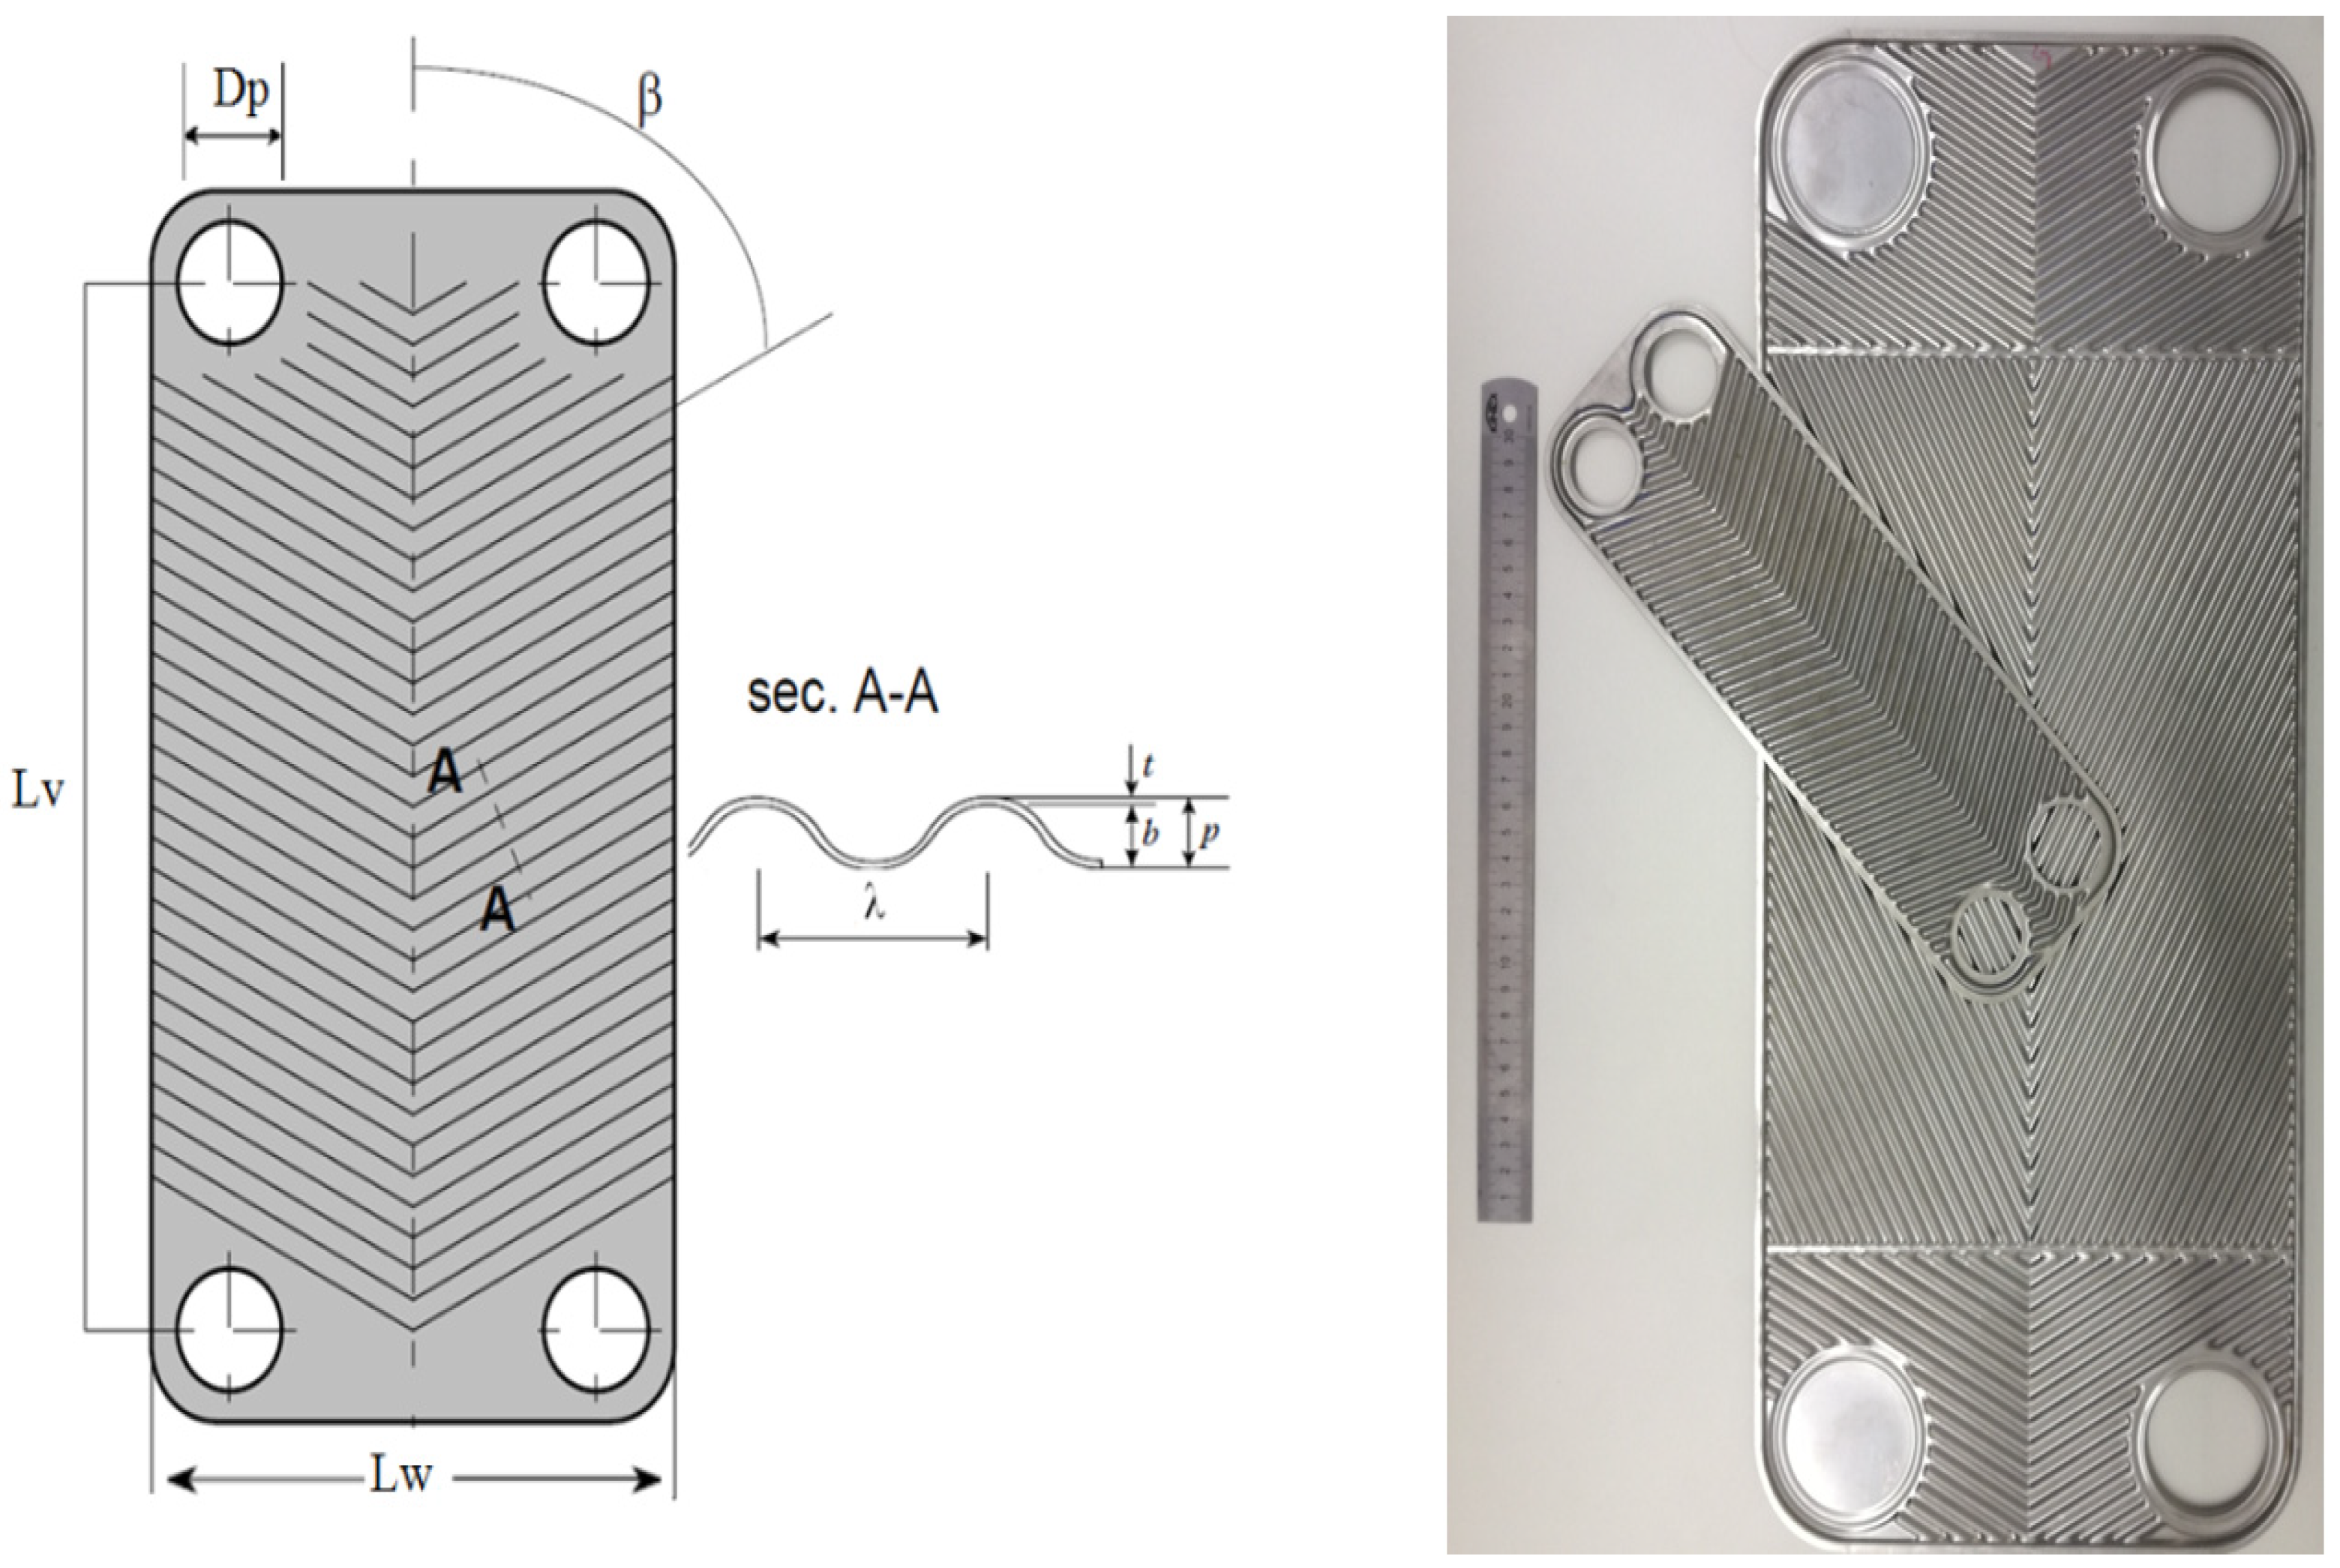
Figure 1. System diagram including the combined plate heat exchanger.
Energies 14 07705 g001
Figure 2. Schematic view of the chevron plate heat exchanger with the basic dimensions on the left side and a photograph of the two sizes on the right side.
Energies 14 07705 g002
Figure 3. Heat transfer section notation.
Energies 14 07705 g003
Figure 4. Modeling flow chart.
Energies 14 07705 g004
Figure 5. Cold stream liquid-phase and gas-phase convection coefficients at various cold channel mass fluxes.
Energies 14 07705 g005
Figure 6. Cold stream liquid-phase and gas-phase convection coefficients at various cold channel mass fluxes.
Energies 14 07705 g006
Figure 7. The boiling number at various cold channel mass fluxes.
Energies 14 07705 g007
Figure 8. Hot stream convection coefficient at various mean hot stream temperatures.
Energies 14 07705 g008
Figure 9. Cold stream pressure drop at various channel mass fluxes.
Energies 14 07705 g009
Figure 10. Total hot stream pressure drop at various mean hot stream temperatures.
Energies 14 07705 g010
Figure 11. Effectiveness at various cold channel mass fluxes and hot stream inlet pressures.
Energies 14 07705 g011
Figure 12. Cold stream two-phase convection coefficient at various cold channel mass fluxes and different superheat temperature differences.
Energies 14 07705 g012
Figure 13. Effectiveness at various cold channel mass fluxes and different superheating temperatures.
Energies 14 07705 g013
Figure 14. Cold stream two-phase convection coefficient at various cold channel mass fluxes and different plate sizes.
Energies 14 07705 g014
Figure 15. Hot stream convection coefficient at different plate sizes: size A (marked with solid lines) and size B (marked with dashed lines) at various mean hot stream temperatures.
Energies 14 07705 g015
Figure 16. Effectiveness at different plate sizes: size A (marked with solid lines) and size B (marked with dashed lines) at various cold channel mass fluxes.
Energies 14 07705 g016
Table 1. Geometrical characteristics of the PHEs.
Geometry ParametersPlate Size
PHE#APHE#B
Effective flow length, L (mm)485250
Plate thickness t_p (mm)0.600.60
Port diameter D_p (mm)5530
Corrugation angle, β (°)6060
Plate Pitch, P (mm)2.82.50
Mean Channel Gap, b (mm)2.21.90
Plate width, W (mm)24595
Corrugation pitch, λ (mm)6.806.80
Publisher’s Note: MDPI stays neutral with regard to jurisdictional claims in published maps and institutional affiliations.

