Article

A New Anelasticity Model for Wave Propagation in Partially Saturated Rocks

1
School of Earth Sciences and Engineering, Hohai University, Nanjing 211100, China
2
Exploration and Development Research Institute of PetroChina Changqing Oilfield Company, Xi’an 710018, China
3
National Institute of Oceanography and Applied Geophysics—OGS, Geophysics, 34010 Trieste, Italy
4
School of Mathematics and Statistics, Zhoukou Normal University, Zhoukou 466001, China
*
Author to whom correspondence should be addressed.
Energies 2021, 14(22), 7619; https://doi.org/10.3390/en14227619
Submission received: 5 October 2021 / Revised: 5 November 2021 / Accepted: 6 November 2021 / Published: 15 November 2021
(This article belongs to the Collection State of the Art Geo-Energy Technology in China)

Abstract

:
Elastic wave propagation in partially saturated reservoir rocks induces fluid flow in multi-scale pore spaces, leading to wave anelasticity (velocity dispersion and attenuation). The propagation characteristics cannot be described by a single-scale flow-induced dissipation mechanism. To overcome this problem, we combine the White patchy-saturation theory and the squirt flow model to obtain a new anelasticity theory for wave propagation. We consider a tight sandstone Qingyang area, Ordos Basin, and perform ultrasonic measurements at partial saturation and different confining pressures, where the rock properties are obtained at full-gas saturation. The comparison between the experimental data and the theoretical results yields a fairly good agreement, indicating the efficacy of the new theory.

1. Introduction

Seismic waves induce fluid flow and anelasticity (the wave-velocity dispersion and dissipation factor) in rocks saturated with immiscible fluids [1,2,3,4,5,6,7,8]. The level of anelasticity depends on the in situ pressure, fluid content and type, and pore structure. This subject is highly relevant to petroleum exploration and production.
WIFF (wave-induced fluid flow) occurs at various spatial scales that can be categorized as macroscopic, mesoscopic, and microscopic [9]. The first is the wavelength-scale equilibration process occurring between the peaks and troughs of a P-wave, while the mesoscopic length is much larger than the typical pore size but smaller than the wavelength. The microscopic scale is of the same order of magnitude as the pore and grain sizes.
The macroscopic mechanism has been discussed by Biot [10,11,12] and is often referred to as the Biot relaxation peak (usually at kHz dominant frequencies). The basic assumptions are that the rock frame is homogeneous and isotropic, and the relative motion between the grains and the pore fluid is governed by Darcy’s law. Local fluid flow on meso- and micro-scales are neglected, and consequently, the Biot peak cannot explain the observed wave anelasticity at all frequencies [13].
Partial saturation leads to fluid heterogeneity at the mesoscopic scale and the pressure difference between fluid phases causes wave dissipation at low frequencies [9,14,15,16,17,18,19]. White [20] proposed the first patchy-saturation model (the White model, spherical pockets). Dutta and Odé [21] reformulated this model by using the Biot theory, while Johnson [22] generalized it to patches of arbitrary geometry by using a branch function. Liu et al. [23] analyzed the effect of the fluid properties.
Moreover, dissimilar pores, with different shapes (micro-fractures and intergranular pores) and/or orientations, also cause mesoscopic pressure gradients and squirt flow, resulting in dissipation. At the pore level, dissipation can be described with squirt flow models [24,25]. Dvorkin and Nur [26] unified the Biot and squirt flows and proposed the BISQ model (Biot/squirt), which describes anelasticity at some frequency ranges. However, the low-frequency P-wave velocity prediction from the BISQ model is smaller than the Gassmann velocity [27], while it is consistent with the Biot one at high frequencies. Dvorkin et al. [28] extended the BISQ model to partially saturated rocks by incorporating the Wood equation [29] and proposed that the squirt flow length can be related to water saturation. Dvorkin et al. [30] reformulated the BISQ model to achieve consistency with the Gassmann velocity at the low-frequency limit. However, the P-wave velocity obtained with this model is higher than the theoretical high limit at high frequencies (when all the cracks are closed, and the P-wave velocity value is determined by the Biot model) [31]. Wu et al. [31] proposed a reformulated modified frame squirt flow model (MFS) to solve the problem.
Mavko and Jizba [32] introduced a modified frame to estimate the high-frequency unrelaxed dry rock shear and bulk moduli (M-J model), where cracks are saturated and the stiff pores are drained. To obtain the wet rock properties from the M-J model, Gurevich et al. [33] used the pressure relaxation method of Murphy et al. [34]. The model can be applied in a broad frequency range. Wu et al. [31] presented a reformulated modified frame squirt flow model, but although the prediction is acceptable at ultrasonic frequencies, Pride et al. [35] showed that the attenuation is significantly underestimated at seismic frequencies because the mesoscopic mechanism is not taken into account.
Wave anelasticity is mainly due to the effect of multi-scale fluid flow [36,37,38,39,40]. Rubino and Holliger [41] studied the problem at the micro and meso scales, analyzing the effects of the pore aspect ratio, while Li et al. [42] studied wave velocity in fractured poroelastic media saturated with immiscible fluids. Recently, Sun [43] proposed a model which considers the three loss mechanisms, i.e., the Biot, squirt flow, and mesoscopic relaxation peaks, in the framework of a double-porosity theory. This low-velocity limit does not honor Gassmann velocity.
We briefly review the propagation models at different scales, and propose a new one, based on the White theory and a reformulated modified frame squirt flow model (see Figure 1). Based on the numerical examples, the wave propagation characteristics of the new model and the effect of permeability and the outer diameter of the patch are analyzed. The P-wave velocity and attenuation with varying saturations are measured at different confining pressures. The crack properties and squirt flow length are obtained from the experimental data. The new model is applied to ultrasonic measurements performed on tight sandstone from the Qingyang area of the Ordos basin. The comparison between the experimental data and the theoretical results are made, so as to verify the capability of the new model in the description of those wave properties.

2. Model

2.1. Patchy-Saturation (White) Model

White [20] proposed a patchy saturation model, by considering flow in a concentric spherical model where the inner sphere is saturated with one fluid type (gas), and the outer shell is saturated with a liquid (water), where the frame is assumed to be homogeneous. Let a and b be the inner and outer diameters, such as ( b > a ) , and the gas saturation is S g = a 3 / b 3 . Dutta and Odé [21] modified the White model based on the Biot model, and obtained the following wet rock bulk and shear moduli:
K * ( ω ) = K 1 W K ,
G * ( ω ) = G d r y ,
respectively, where K is the bulk modulus at the high-frequency limit, G d r y is the dry rock shear modulus, and W is a complex function of porosity, permeability, fluid viscosity, etc. (see Appendix A in Carcione et al. [44], and the Section 2.3).

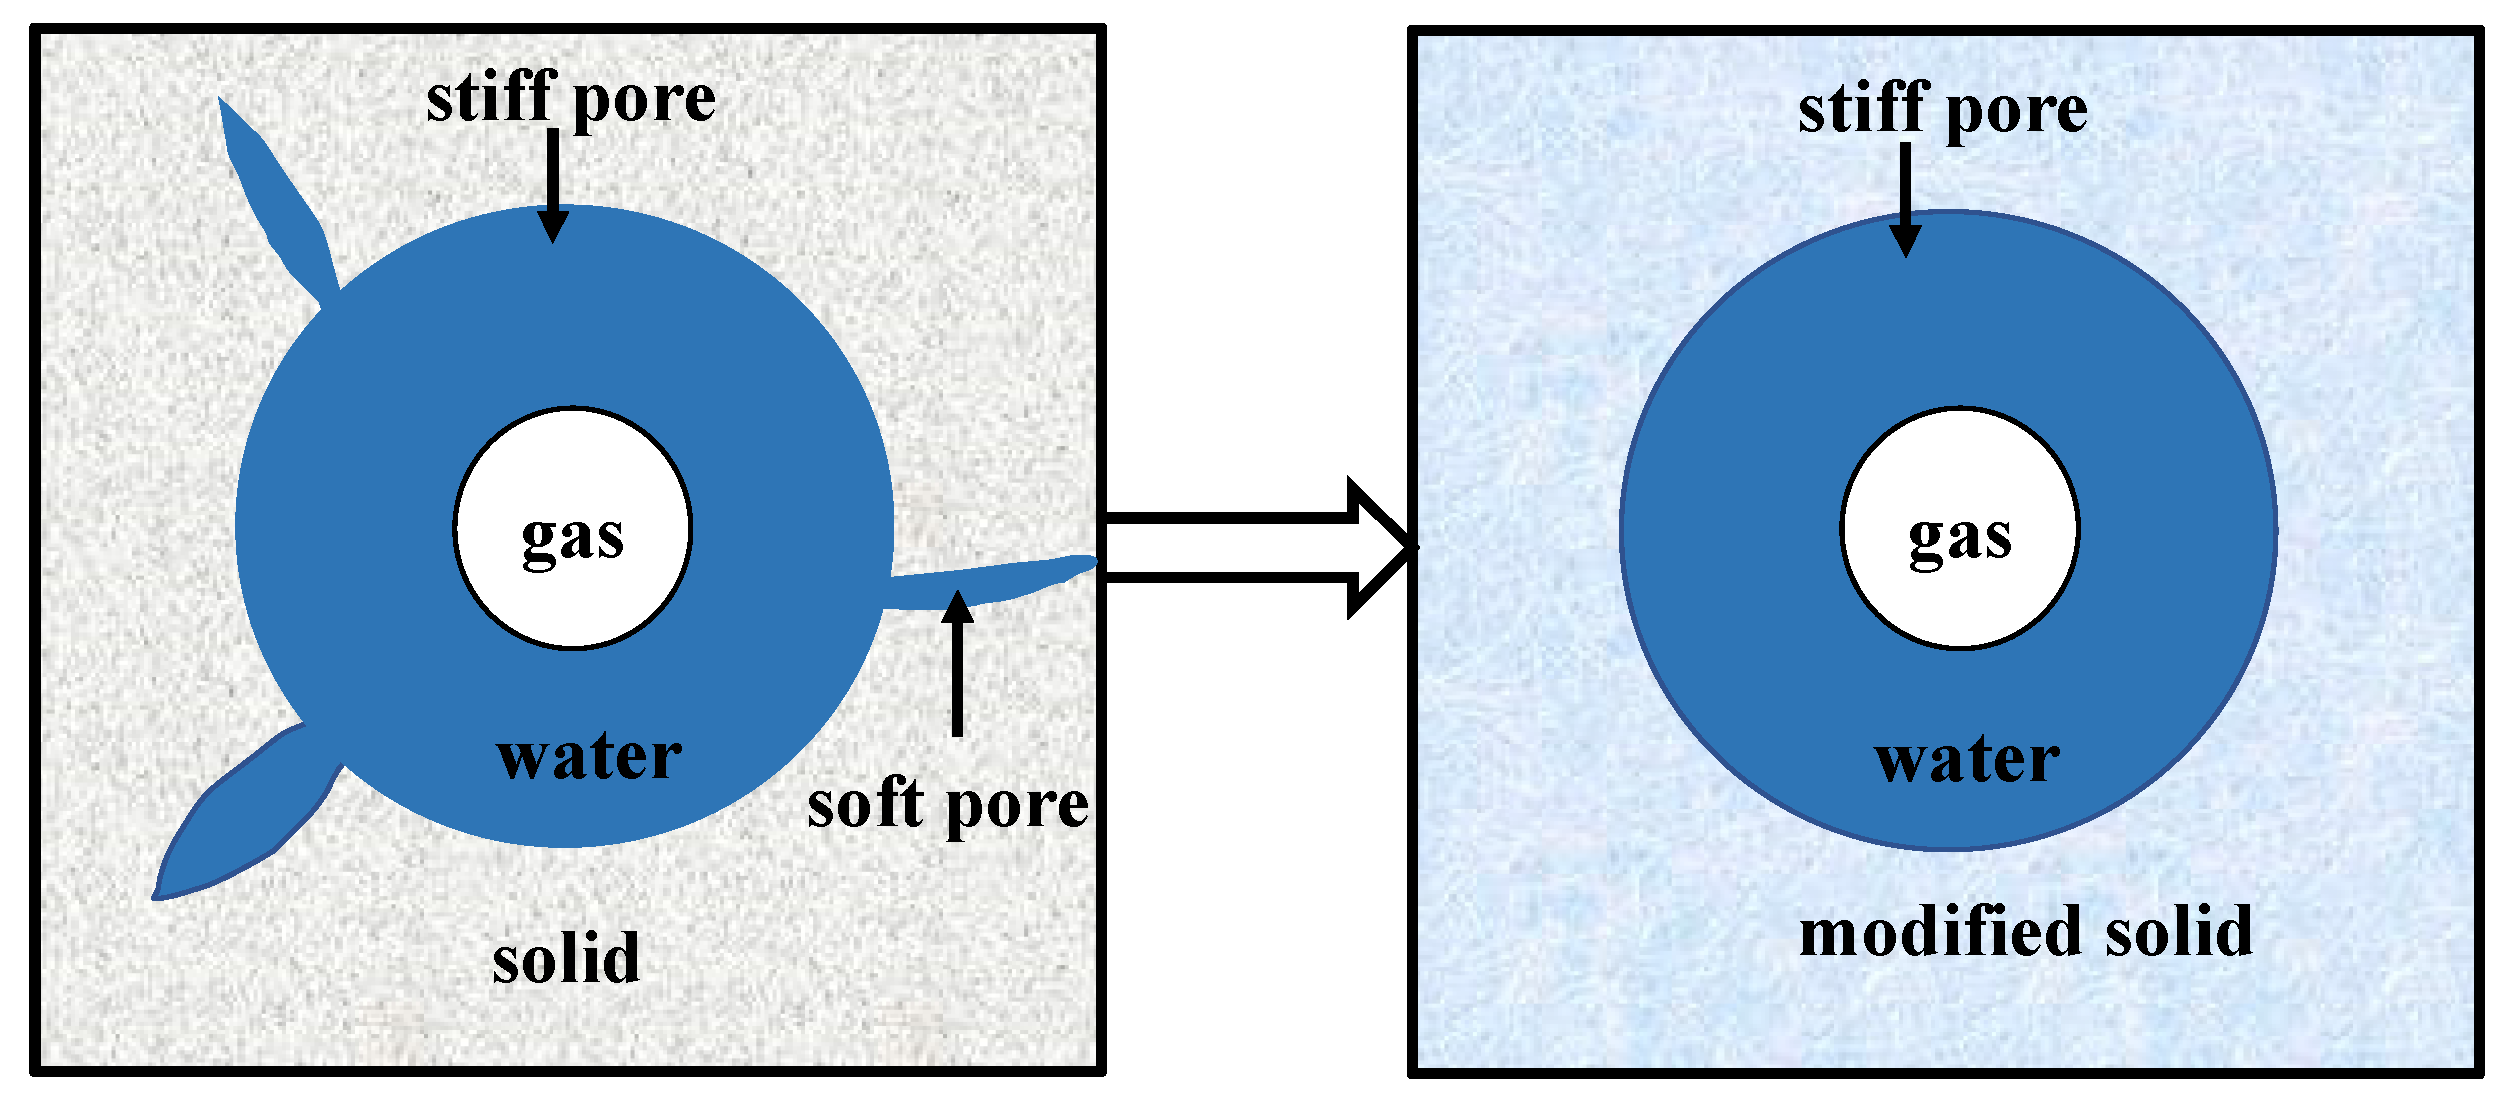
2.2. Squirt Flow Model

Th flow between microcrack and grain contacts back and forth to stiff (equant) pores induces dissipation even for a single saturating fluid. The microcracks are incorporated into an effective rock skeleton, containing only stiff pores.
The reformulated modified frame squirt flow model considers both the squirt and Biot flows. According to Dvorkin et al. [30] and a boundary condition given by Gurevich et al. [33], the modified bulk modulus is (Wu et al. [31]):
K m s = K m s d + α c 2 F c ϕ c [ 1 2 J 1 ( λ R ) λ R J 0 ( λ R ) ] ,
where K m s d = ( 1 / K 0 1 / K h p + 1 / K d r y ) 1 , K 0 is the bulk modulus of the mineral mixture, Kdry is the dry rock bulk modulus, F c = ( 1 / K f l + 1 / ( ϕ c Q c ) ) 1 , ϕ c is the microcrack porosity, α c = 1 K m s d / K 0 , Q c = K 0 / ( α c ϕ c ) , R is characteristic squirt flow length, ω is the angular frequency, λ 2 = i ω η ϕ c / κ ( 1 / K f l + 1 / ( ϕ c Q c ) ) , η is the fluid viscosity, κ is the permeability, K f l is the bulk modulus of fluid, and J 0 and J 1 are the zero- and first-order Bessel functions, respectively.
The modified dry-frame bulk and shear moduli are (Wu et al. [31]):
1 K m d = 1 K m s + 1 K h p 1 K 0 ,
1 G m d = 1 G d r y 4 15 ( 1 K d r y 1 K m d )
respectively, where Khp is the high-pressure modulus [33]. The P-wave phase velocity and attenuation can then be obtained according to Toksöz and Johnston [45] as
V p h P 1 , 2 = 1 Re ( X 1 , 2 ) ,   a 1 , 2 = ω Im ( X 1 , 2 ) ,
where
X 1 , 2 = Y 1 , 2 ,   Y 1 , 2 = B 2 A ± ( B 2 A ) 2 C A ,   A = ϕ F M d r y ρ 22 2 ,
B = F ( 2 α m d ϕ ϕ ρ 11 ρ 22 ) ( M d r y + F α m d 2 ϕ ) ( 1 + ρ a ρ 22 + i ω c ω ) ρ 22 ,
C = ρ 11 ρ 22 + ( 1 + ρ 11 ρ 22 ) ( ρ a ρ 22 + i ω c ω ) ,   ρ 11 = ( 1 ϕ ) ρ s ,   ρ 22 = ϕ ρ f l ,
F = ( 1 / K f l + ( α m d ϕ ) / ( ϕ K 0 ) ) 1 ,
where ρ a is the additional coupling density, ω c = η ϕ / ( κ ρ f l ) is the characteristic frequency, α m d = 1 K m d / K 0 , ϕ is porosity, M d r y is the uniaxial modulus of the rock skeleton under drained conditions, and ρ s and ρ f l are the mineral density and fluid density, respectively.

2.3. Patch-Saturation and Squirt Flow Models Combined
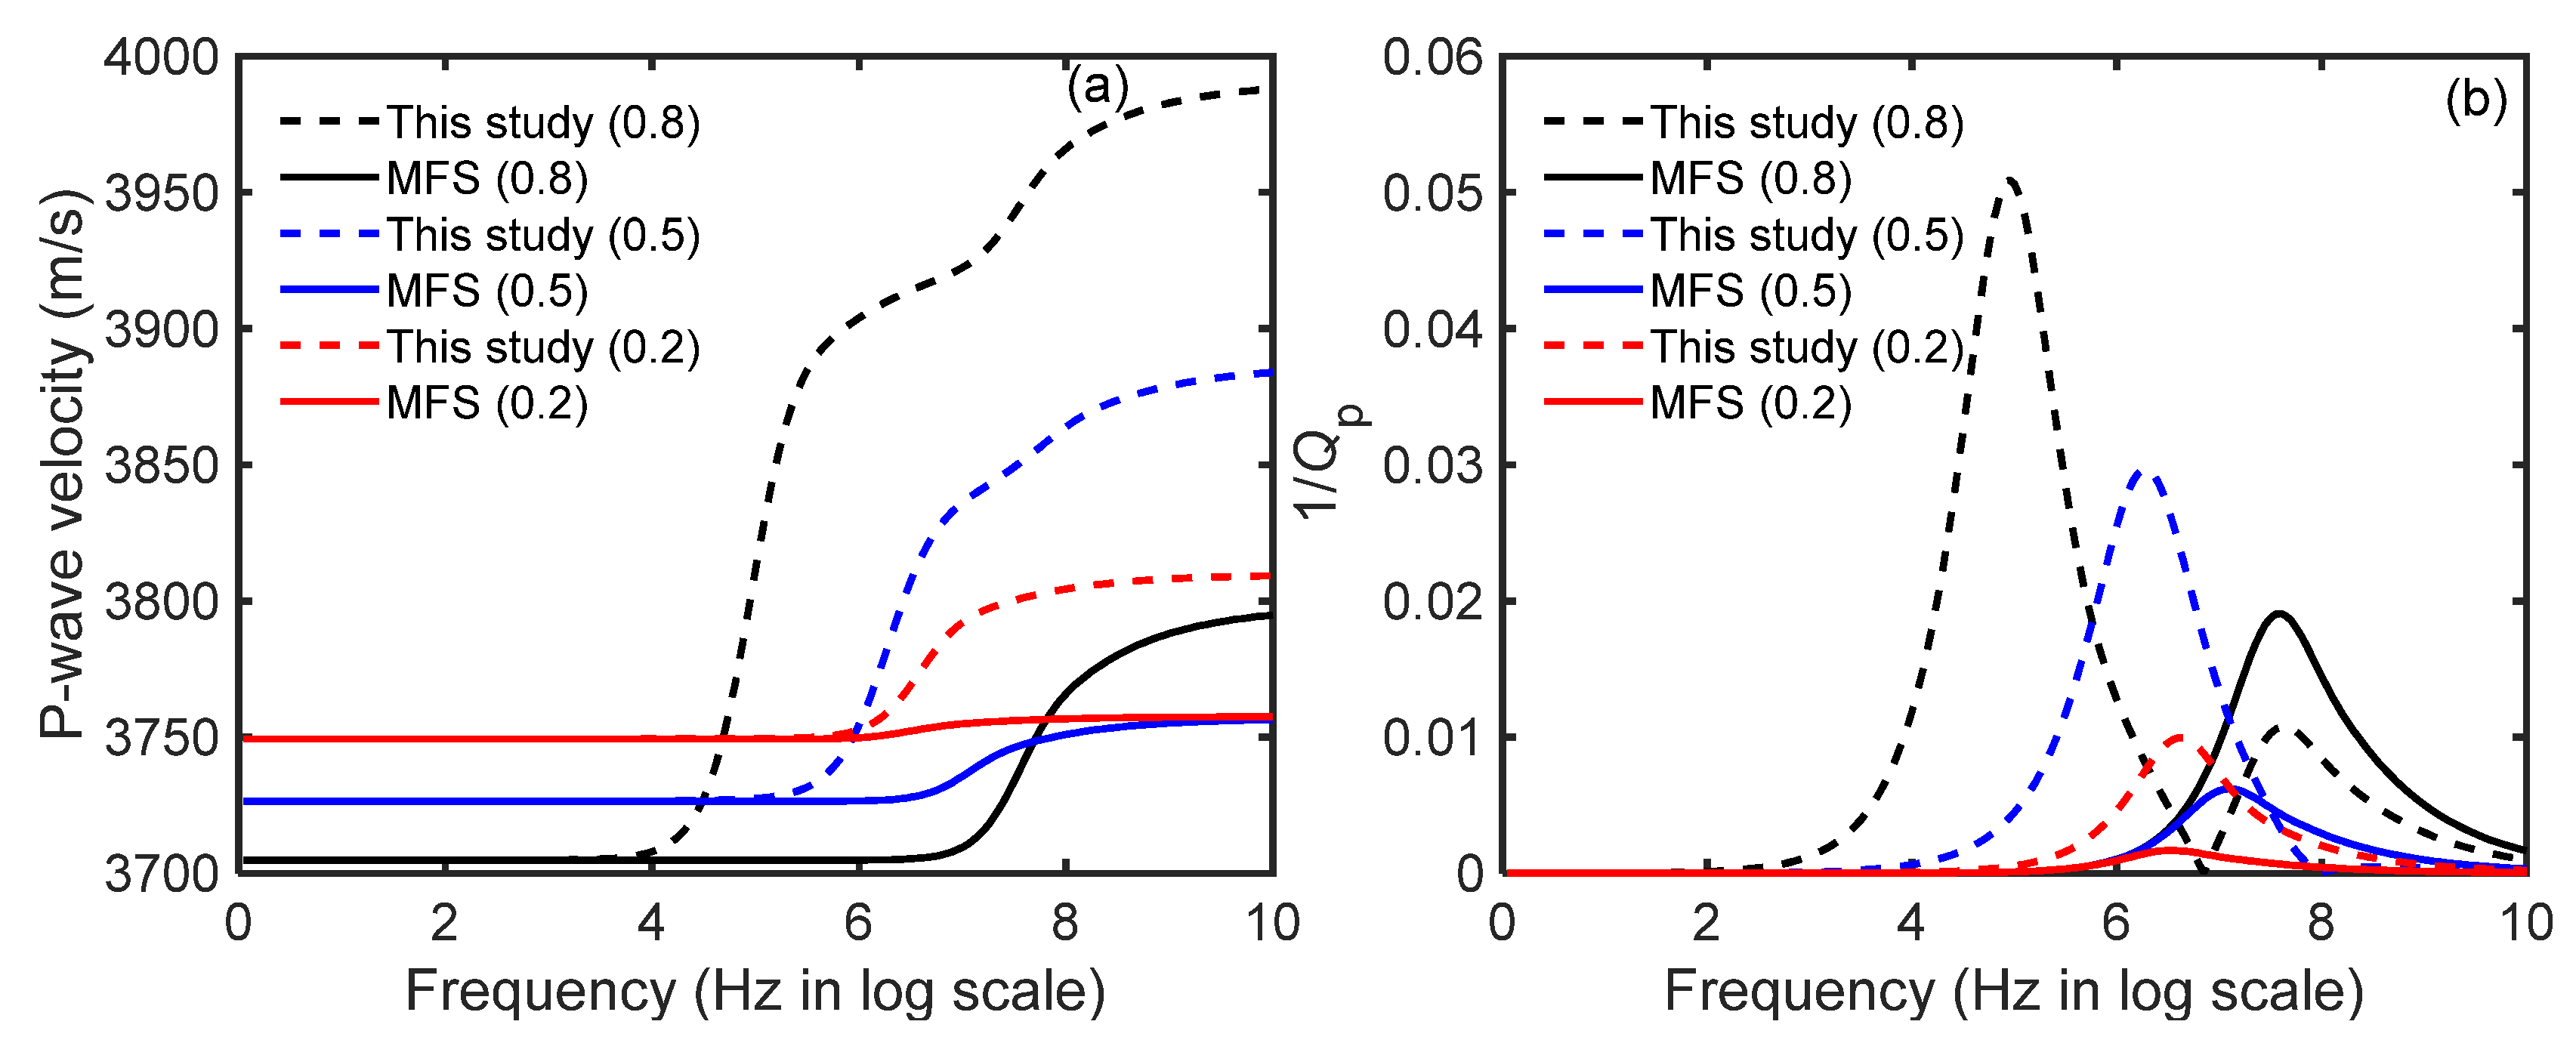
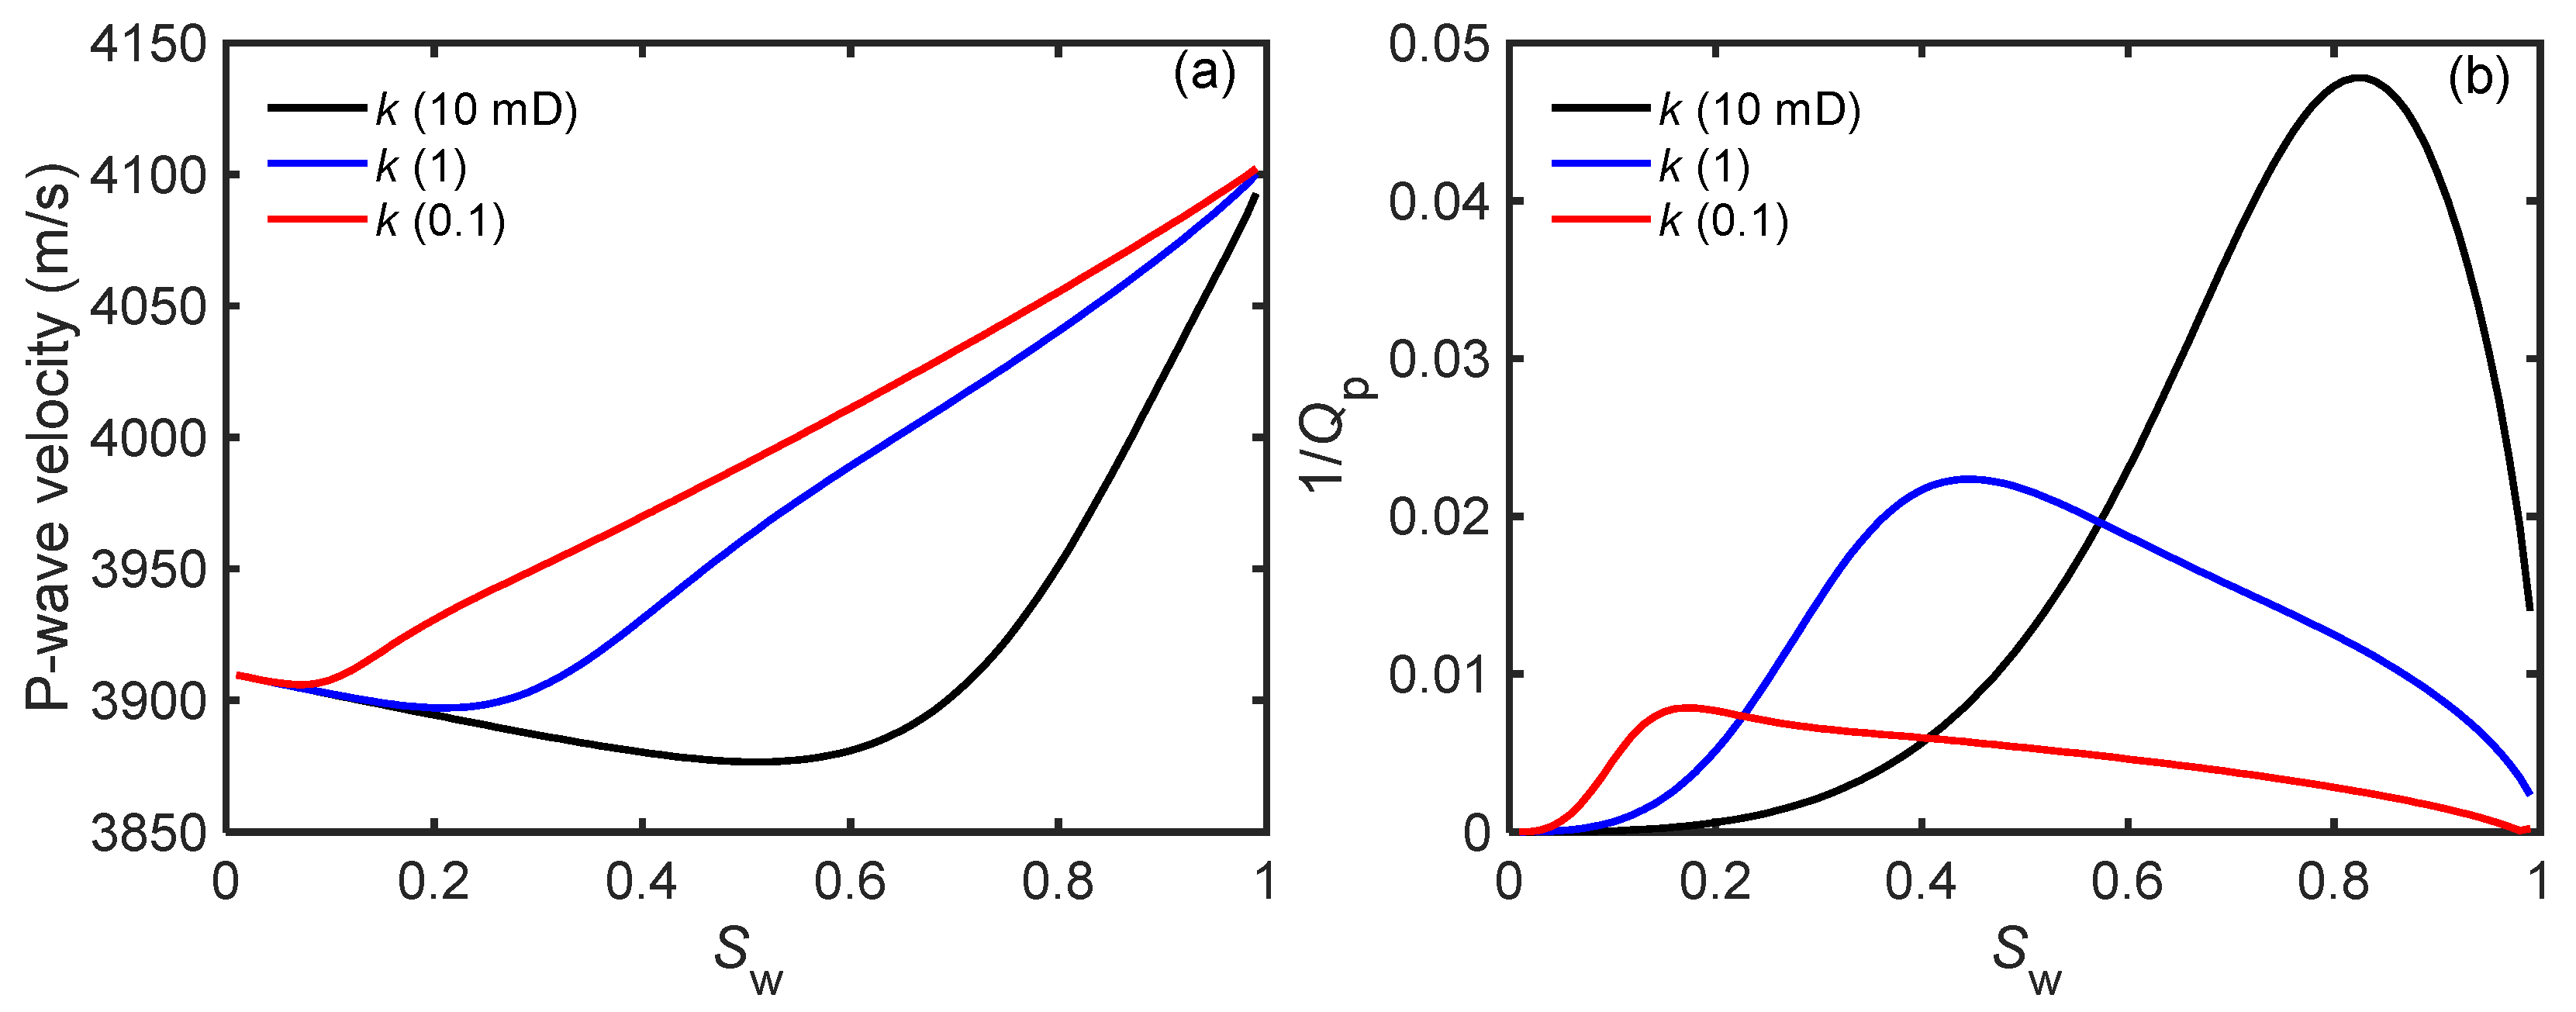
The White model assumes a uniform rock skeleton and that the area outside the inclusion is fully saturated with water. Therefore, the modified dry rock moduli (4) and (5) are used in the White model, thus combining the micro and meso descriptions of anelasticity. If subindices 1 and 2 refer to the gas-inclusion region and host medium (water), respectively, we have the wet rock moduli
K ( ω ) = K 1 W K
G ( ω ) = G m d ,
where
K = K G 2 ( 3 K G 1 + 4 G m d ) + 4 G m d ( K G 1 K G 2 ) S g ( 3 K G 1 + 4 G m d ) 3 ( K G 1 K G 2 ) S g
W = 3 i a κ ( R 1 R 2 ) ( F 1 F 2 ) b 3 ω ( η 1 Z 1 η 2 Z 2 ) .
Moreover,
K G 1 = K 0 K m d + ϕ K m d ( K 0 / K f l 1 1 ) 1 ϕ K m d / K 0 + ϕ K 0 / K f l 1
K G 2 = K 0 K m d + ϕ K m d ( K 0 / K f l 2 1 ) 1 ϕ K m d / K 0 + ϕ K 0 / K f l 2
are Gassmann moduli, where K f l 1 and K f l 2 are fluid moduli,
R 1 = ( K G 1 K m d ) ( 3 K G 2 + 4 G m d ) ( 1 K m d / K 0 ) [ K G 2 ( 3 K G 1 + 4 G m d ) + 4 G m d ( K G 1 K G 2 ) S g ]
R 2 = ( K G 2 K m d ) ( 3 K G 1 + 4 G m d ) ( 1 K m d / K 0 ) [ K G 2 ( 3 K G 1 + 4 G m d ) + 4 G m d ( K G 1 K G 2 ) S g ]
F 1 = ( 1 K m d / K 0 ) K A 1 K G 1
F 2 = ( 1 K m d / K 0 ) K A 2 K G 2
Z 1 = 1 exp ( 2 γ 1 a ) ( γ 1 a 1 ) + ( γ 1 a + 1 ) exp ( 2 γ 1 a )
Z 2 = ( γ 2 b + 1 ) + ( γ 2 b 1 ) exp [ 2 γ 2 ( b a ) ] ( γ 2 b + 1 ) ( γ 2 a 1 ) ( γ 2 b 1 ) ( γ 2 a + 1 ) exp [ 2 γ 2 ( b a ) ]
γ 1 = i ω η 1 / κ K E 1
γ 2 = i ω η 2 / κ K E 2 ,
where η 1 and η 2 are fluid viscosities, and
K E 1 = [ 1 K f l 1 ( 1 K G 1 / K 0 ) ( 1 K m d / K 0 ) ϕ K G 1 ( 1 K f l 1 / K 0 ) ] K A 1
K E 2 = [ 1 K f l 2 ( 1 K G 2 / K 0 ) ( 1 K m d / K 0 ) ϕ K G 2 ( 1 K f l 2 / K 0 ) ] K A 2
1 K A 1 = ( ϕ K f l 1 + 1 ϕ K 0 K m d K 0 2 )
1 K A 2 = ( ϕ K f l 2 + 1 ϕ K 0 K m d K 0 2 ) .
According to Wood [29], the effective bulk modulus of the gas-water mixture can be calculated from
1 K f l = S g K f l 1 + S w K f l 2
where S w is the water saturation.
Finally, the P-wave phase velocity and attenuation are
V p = Re ( K ( ω ) + 4 G ( ω ) / 3 ) ρ ,
Q p 1 = Im ( K ( ω ) + 4 G ( ω ) / 3 ) Re ( K ( ω ) + 4 G ( ω ) / 3 ) ,
respectively, where ρ = ( 1 ϕ ) ρ s + ϕ ( S g ρ 1 + S w ρ 2 ) is bulk density, and ρ 1 and ρ 2 are the fluid densities.

2.4. Results

The MFS model is directly applied in partially saturated reservoir rocks, where the gas–water mixture is obtained with the Wood equation (there are no gas pockets), and the properties are listed in Table 1. The numerical examples of the characteristics of wave prorogation by the proposed model are shown in Figure 2, and the effects of permeability and the outer diameter of the patch on the wave velocity and attenuation are shown in Figure 3 and Figure 4, respectively.
Figure 2 compares the P-wave velocity (a) and attenuation (b) of the present model with those of the MFS model, where the number between parentheses indicates water saturation. The velocities coincide at low frequencies and increase with saturation, with those of the present model higher at high frequencies. Two inflection points are clearly observed, corresponding to the mesoscopic and squirt flow attenuation peaks when the saturation is 80%, the first being the stronger point. The attenuation of the present model is higher than that of the MFS one.
Figure 3 shows the effect of permeability, where we can see that attenuation has a maximum at a given saturation which increases with permeability. Figure 4 displays the same quantities as a function of saturation for different outer diameters (b). The velocity increases with b, and the attenuation decreases.

3. Ultrasonic Data

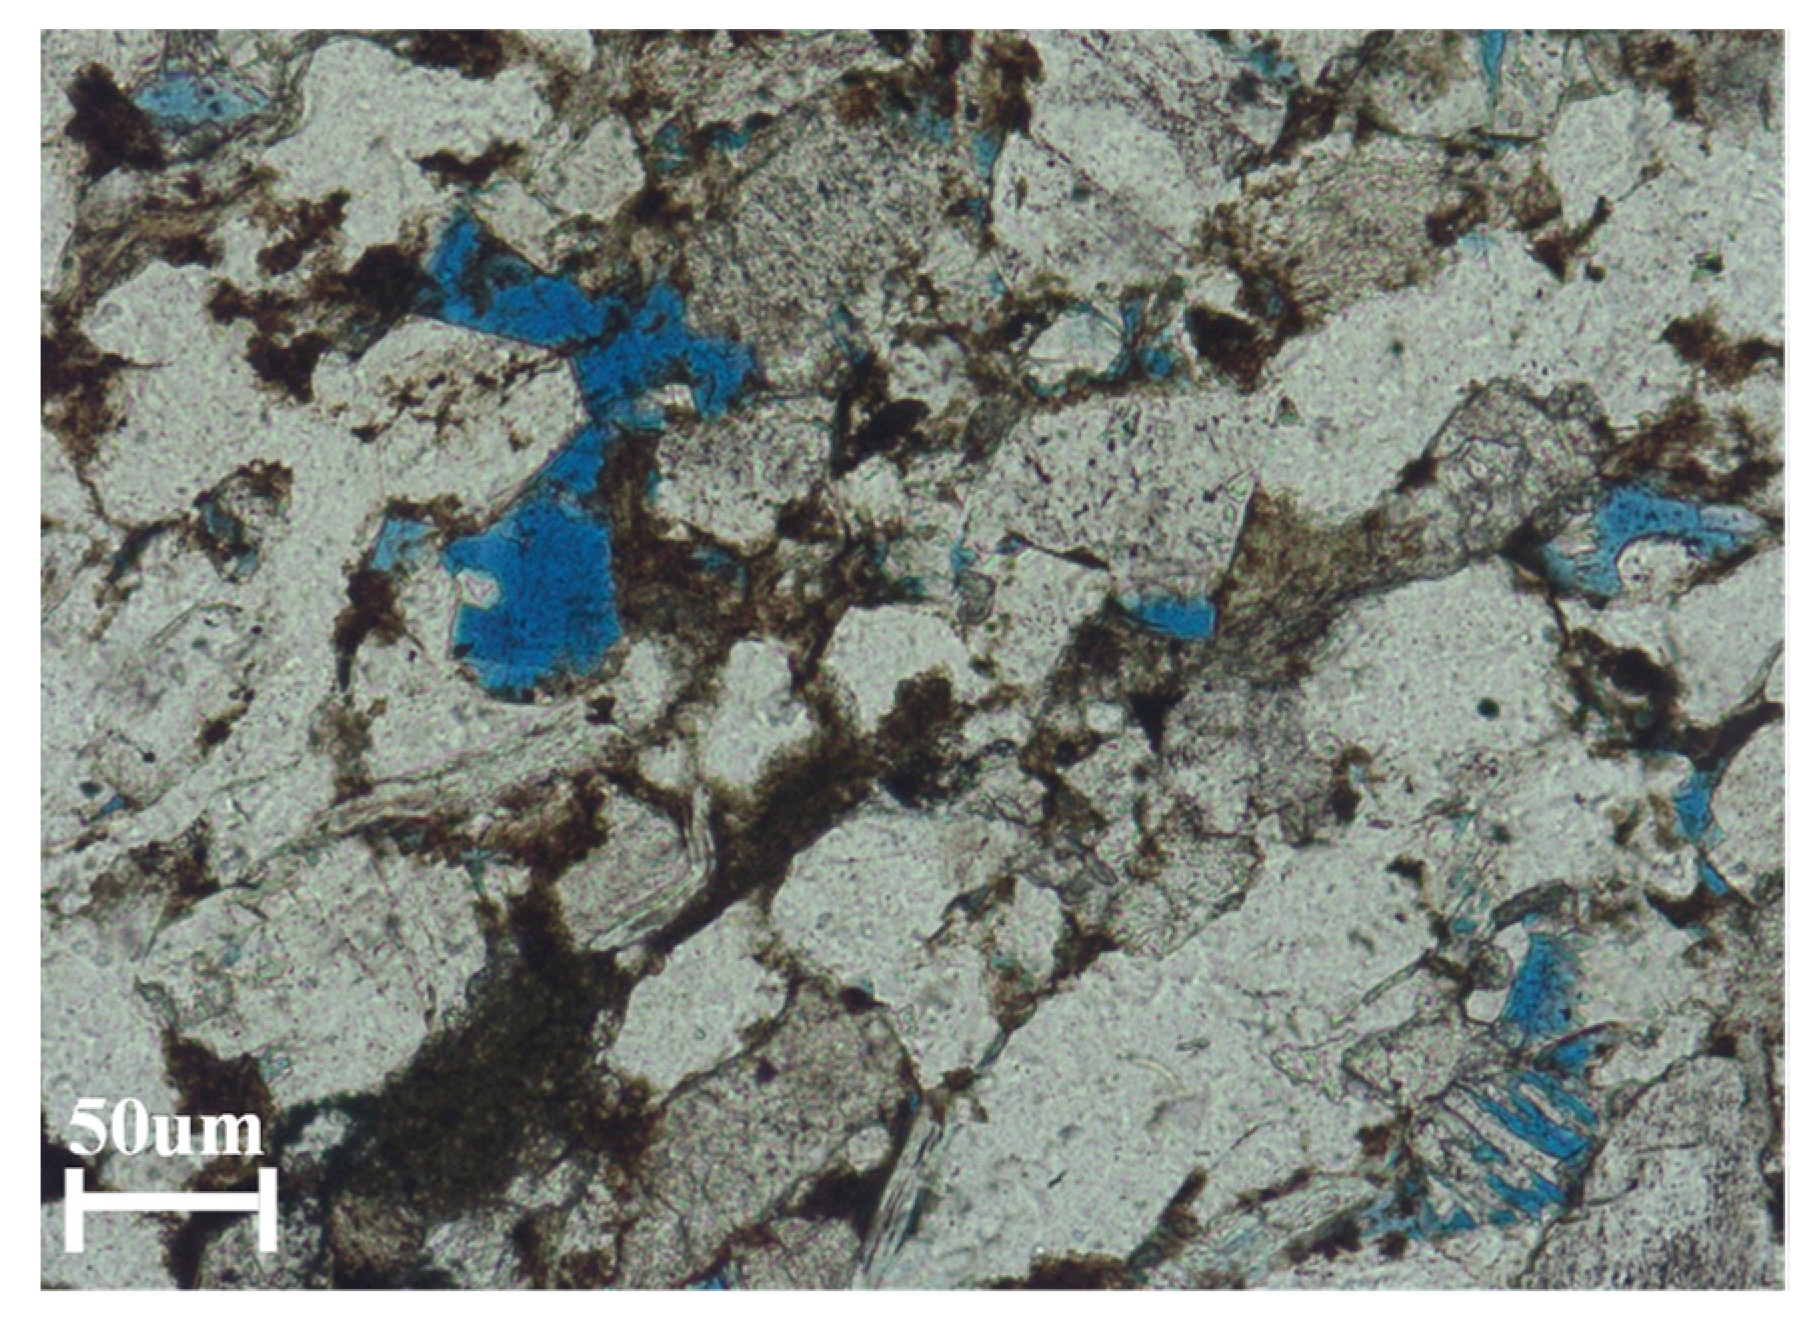
3.1. Rock Specimen and Experiment

A tight sandstone sample (S2-9) from the Qingyang area, Ordos Basin, was tested. The sample was processed into a cylinder with a diameter of 25.2 mm and a length of 50 mm. An aluminum standard with the same shape and size was processed corresponding to the specimen. The sample was composed of quartz, feldspar, and interstitial materials (mainly carbonate minerals and clay), and its porosity was 8.85%. A thin section is shown in Figure 5. The experimental set-up consisted of a pulse generator, a temperature control unit, a confining pressure control unit, a pore pressure control unit, and an ultrasonic wave test unit [46,47].
The piezoelectric ultrasonic wave transducers were glued to the top and bottom of the sample, sealed with a rubber sleeve. An electrical pulse was applied to the source transducer to generate the ultrasonic P-waves. A digital oscilloscope was used to display and record the waveforms from the receiver. The temperature, pore, and confining pressures were controlled by the appropriate units [48]. The pore pressure was 15 MPa, the effective pressures were 5, 15, 25, 35 and 45 MPa, the temperature was 20 °C, and the waveforms were recorded after we maintained the experimental conditions for half an hour. For the partial gas–water saturation tests, the samples were first saturated with water by using the vacuum pressure saturation method and then placed in an oven to vary the saturation. The approach of Ba et al. [19] was adopted to quantify the fluid content. The sample was tested around six different water saturation conditions, 0%, 20%, 40%, 60%, 80%, and 100%. The wave velocities were obtained from the travel times and the spectral-ratio method was used to obtain the dissipation factor.

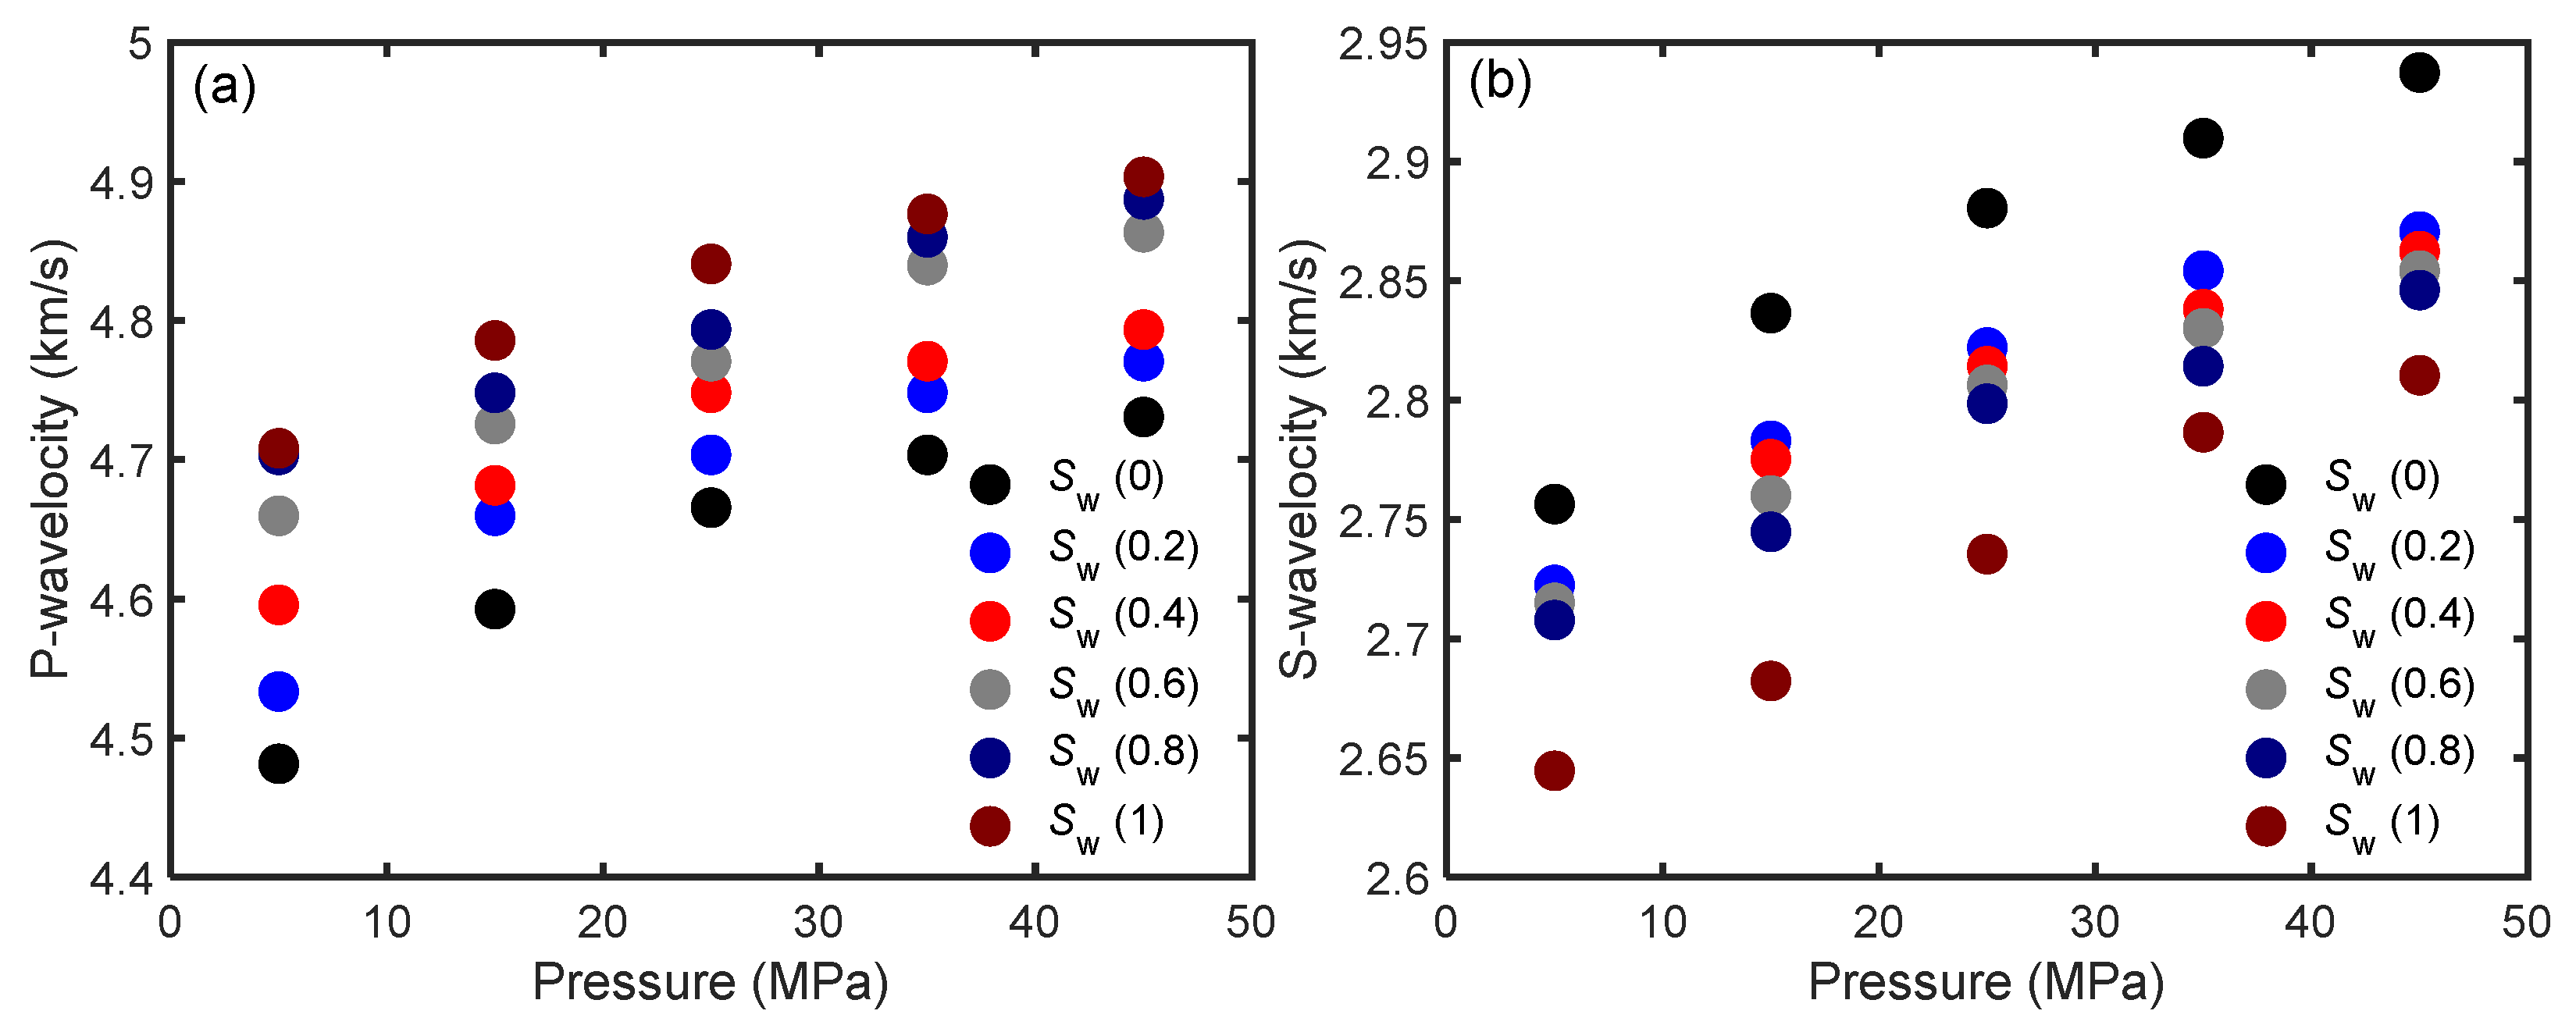
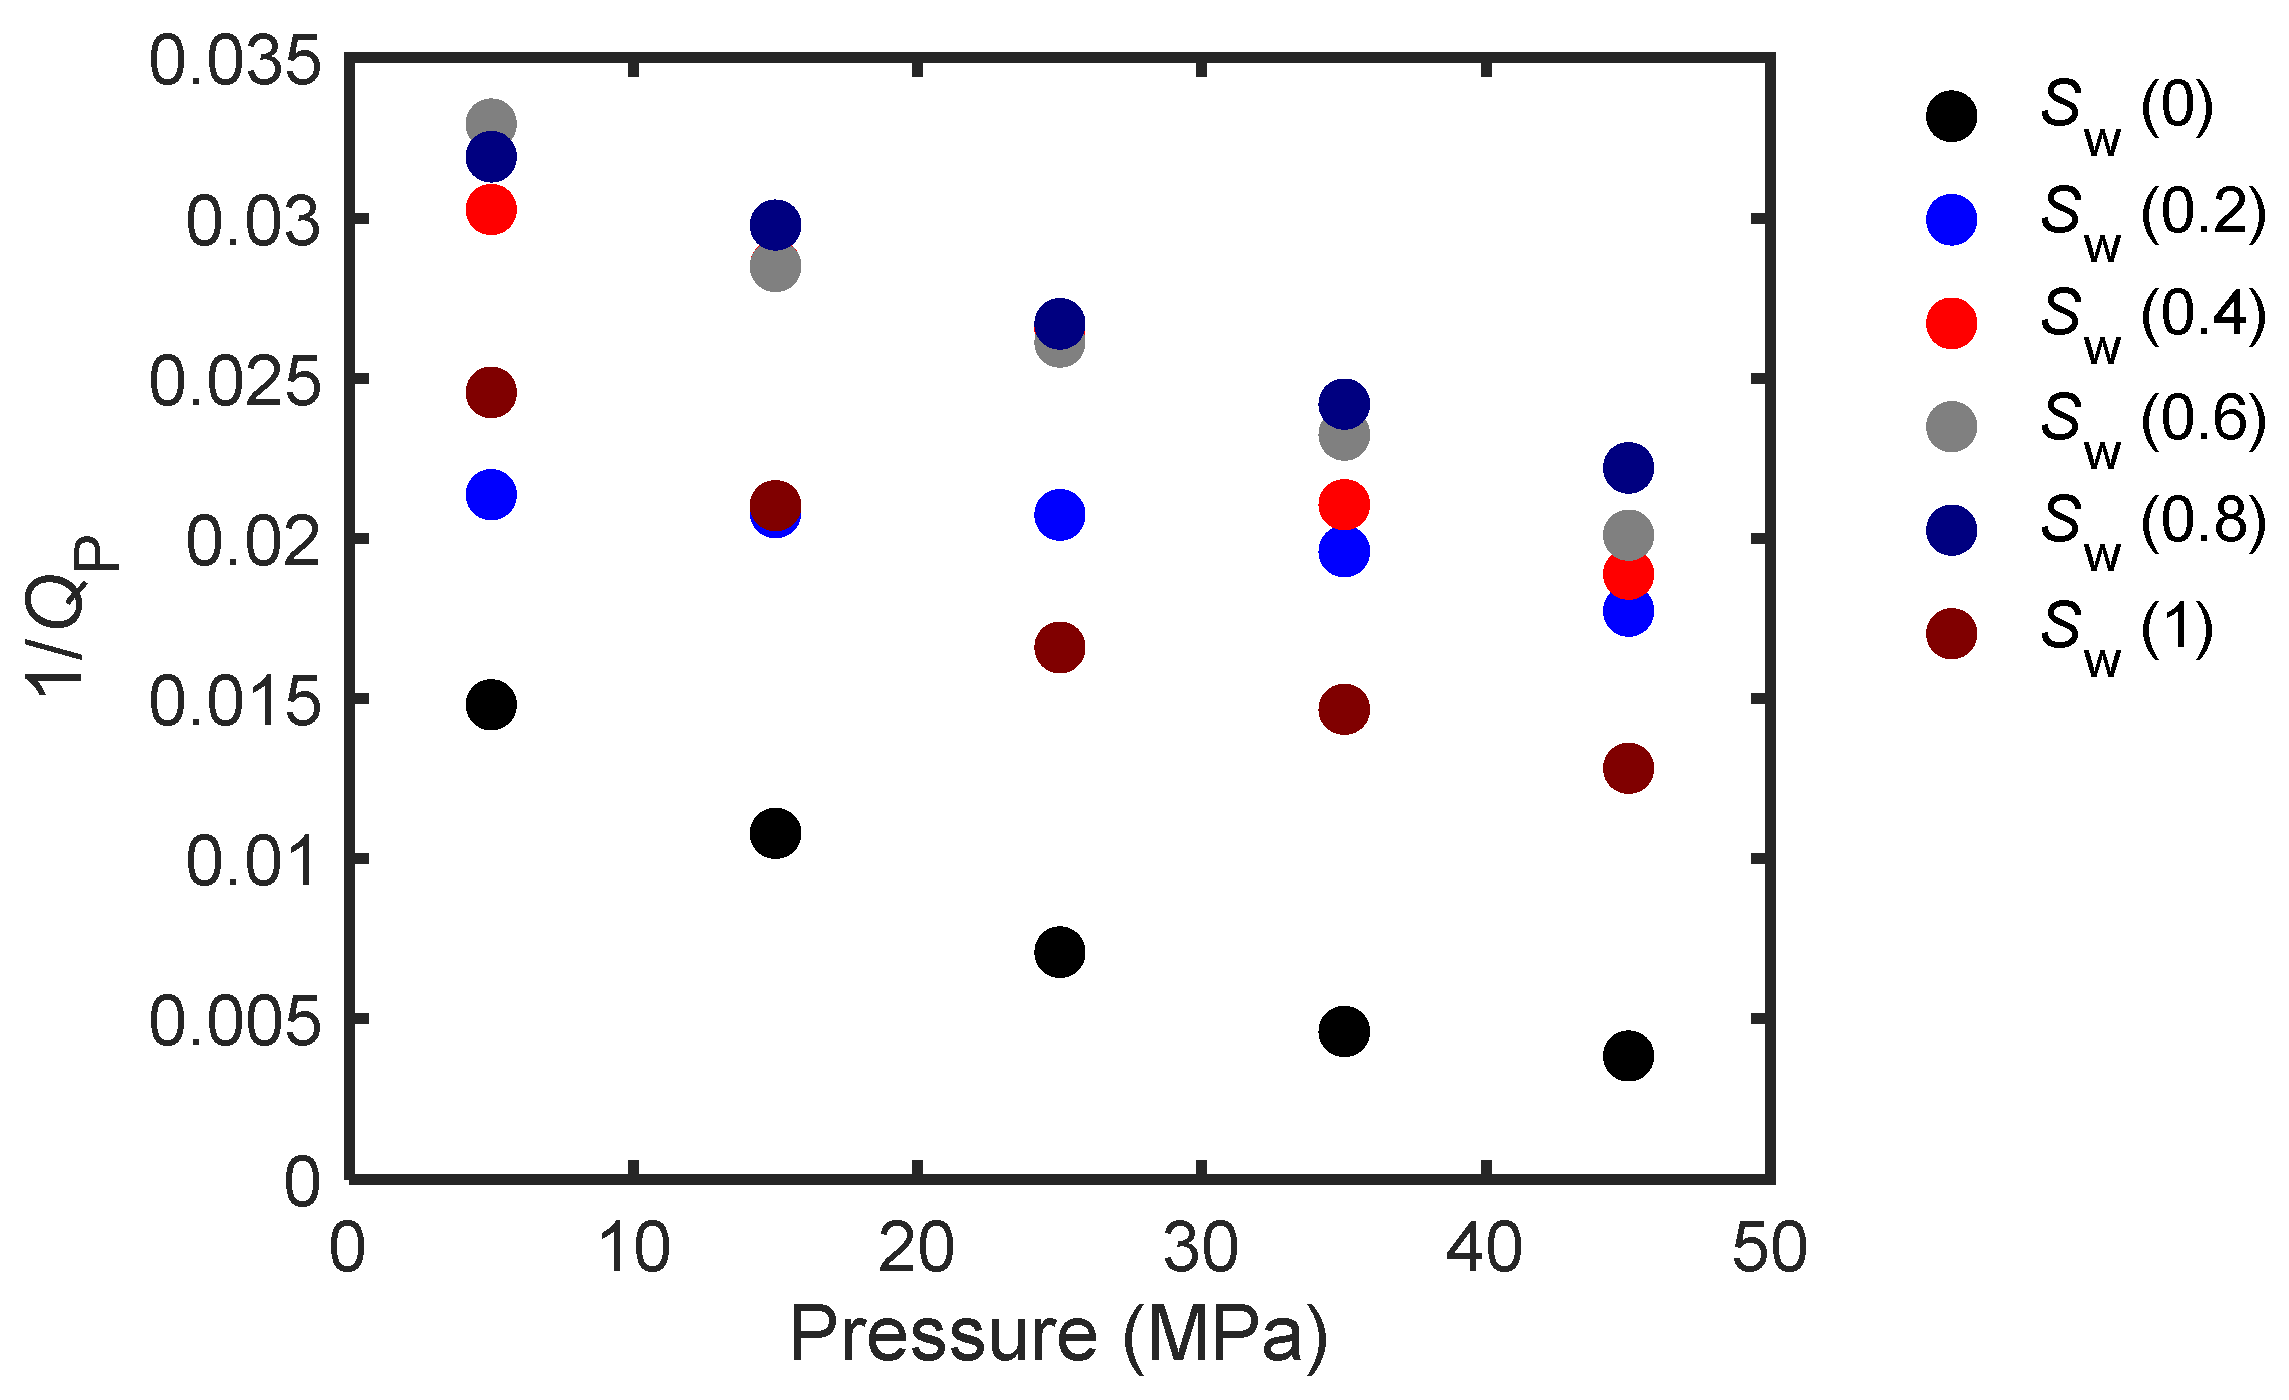
3.2. Experimental Results

Figure 6 shows the velocity as a function of water saturation and effective pressure. As expected, the P-wave velocity increases with water saturation and pressure, approaching a linear trend at high pressures [49,50], since microcracks close. In the partially saturated rock, the rock pore spaces contain air (with a lower bulk modulus and a lower P-wave velocity) and water (with a higher bulk modulus and a higher P-wave velocity). With the increase in water saturation, the volume ratio of water increases and that of air decreases while the rock skeleton stays unchanged. Generally, the P-wave velocity increases with the water saturation. The influence of effective pressure on the stiff pores is small and can be neglected [50,51,52]. The S-wave velocity also increases with effective pressure, but decreases as saturation increases, due to the density effect.
The spectral ratio method is applied to calculate the dissipation factor [53,54]. We have
ln ( A 1 ( f ) A 2 ( f ) ) = π x Q V f + ln G 1 ( x ) G 2 ( x )
where f is the frequency, A 1 ( f ) and A 2 ( f ) are the amplitude spectra of the rock sample and standard, respectively, Q is the quality factor, x is the propagation distance, V is the wave velocity, and G 1 ( x ) and G 2 ( x ) are the sample and standard geometrical factors, respectively. As shown in Figure 7, attenuation decreases with effective pressure. Its behavior versus saturation is similar to that of Figure 4. The attenuation variations with respect to effective pressure and saturation are similar to those of the sandstone samples analyzed by Pang et al. [55] and Amalokwu et al. [56].

3.3. Crack Parameters and Squirt Flow Length

The parameters of the present model can be obtained from the experimental data. They involve the skeleton bulk and shear moduli at different pressures, the dry rock bulk modulus with microcracks closed, the microcrack porosity, the squirt flow length, etc. The following steps are considered.
(1)
The dry rock bulk and shear moduli are calculated from the velocities as
K d r y = ( V p d 2 4 3 V s d 2 ) ρ
G d r y = V s d 2 ρ
where ρ = ρ s ( 1 ϕ ) , V p d and V s d are the P- and S-wave velocities of full gas saturation, respectively.
(2)
The high-pressure dry rock bulk modulus, when the microcracks are closed, can be obtained from the linear trend of the dry rock velocities.
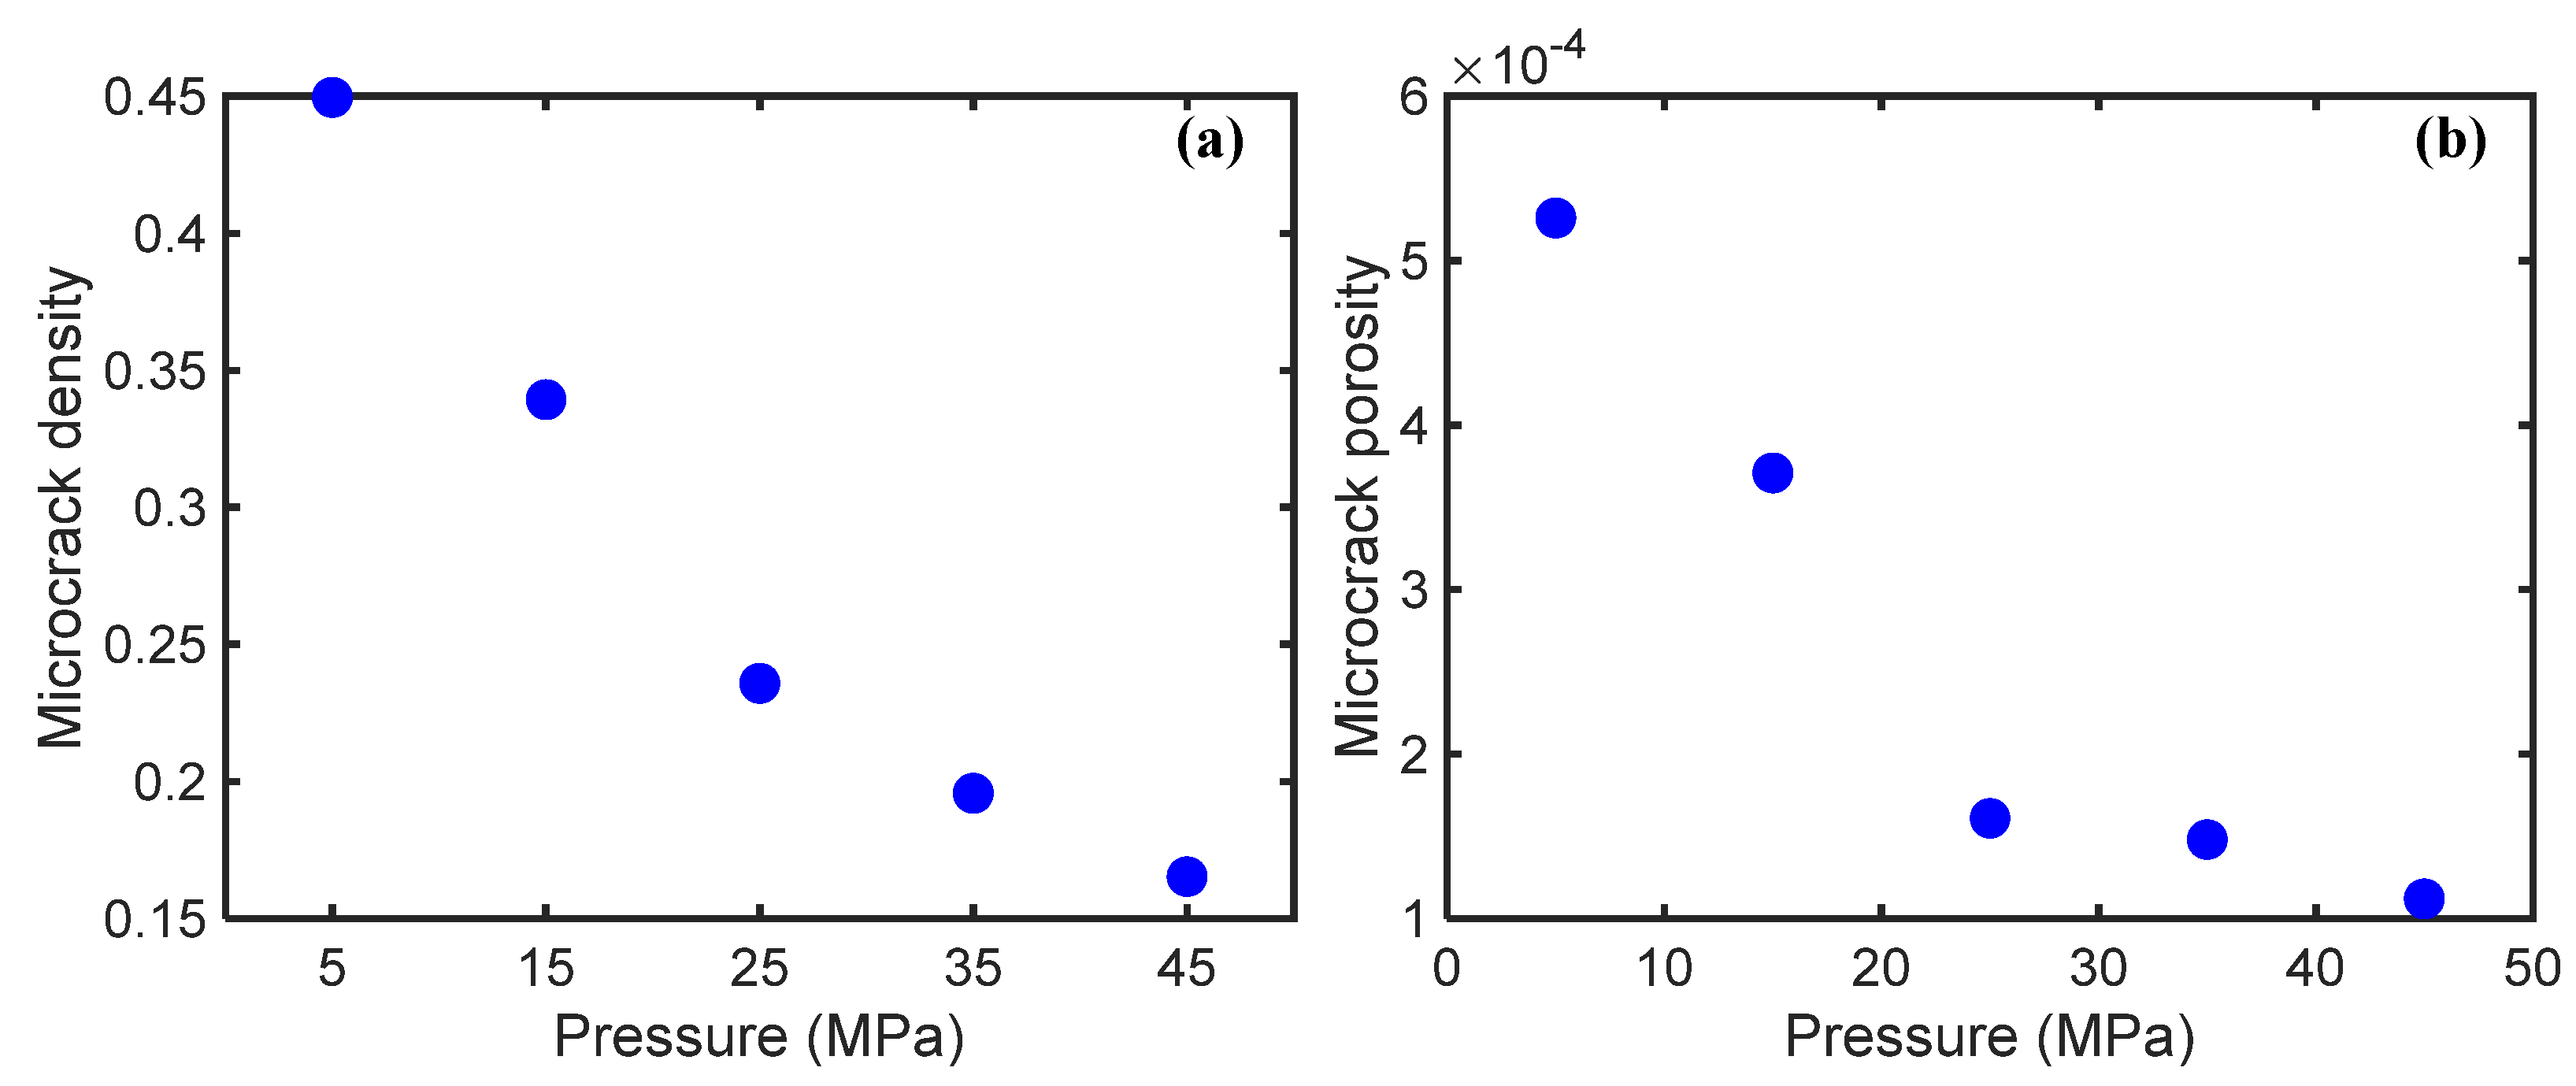
(3)
The microcrack porosity and density is estimated at different pressures by using the DZ model [52], based on the experiment data (see Appendix A).
(4)
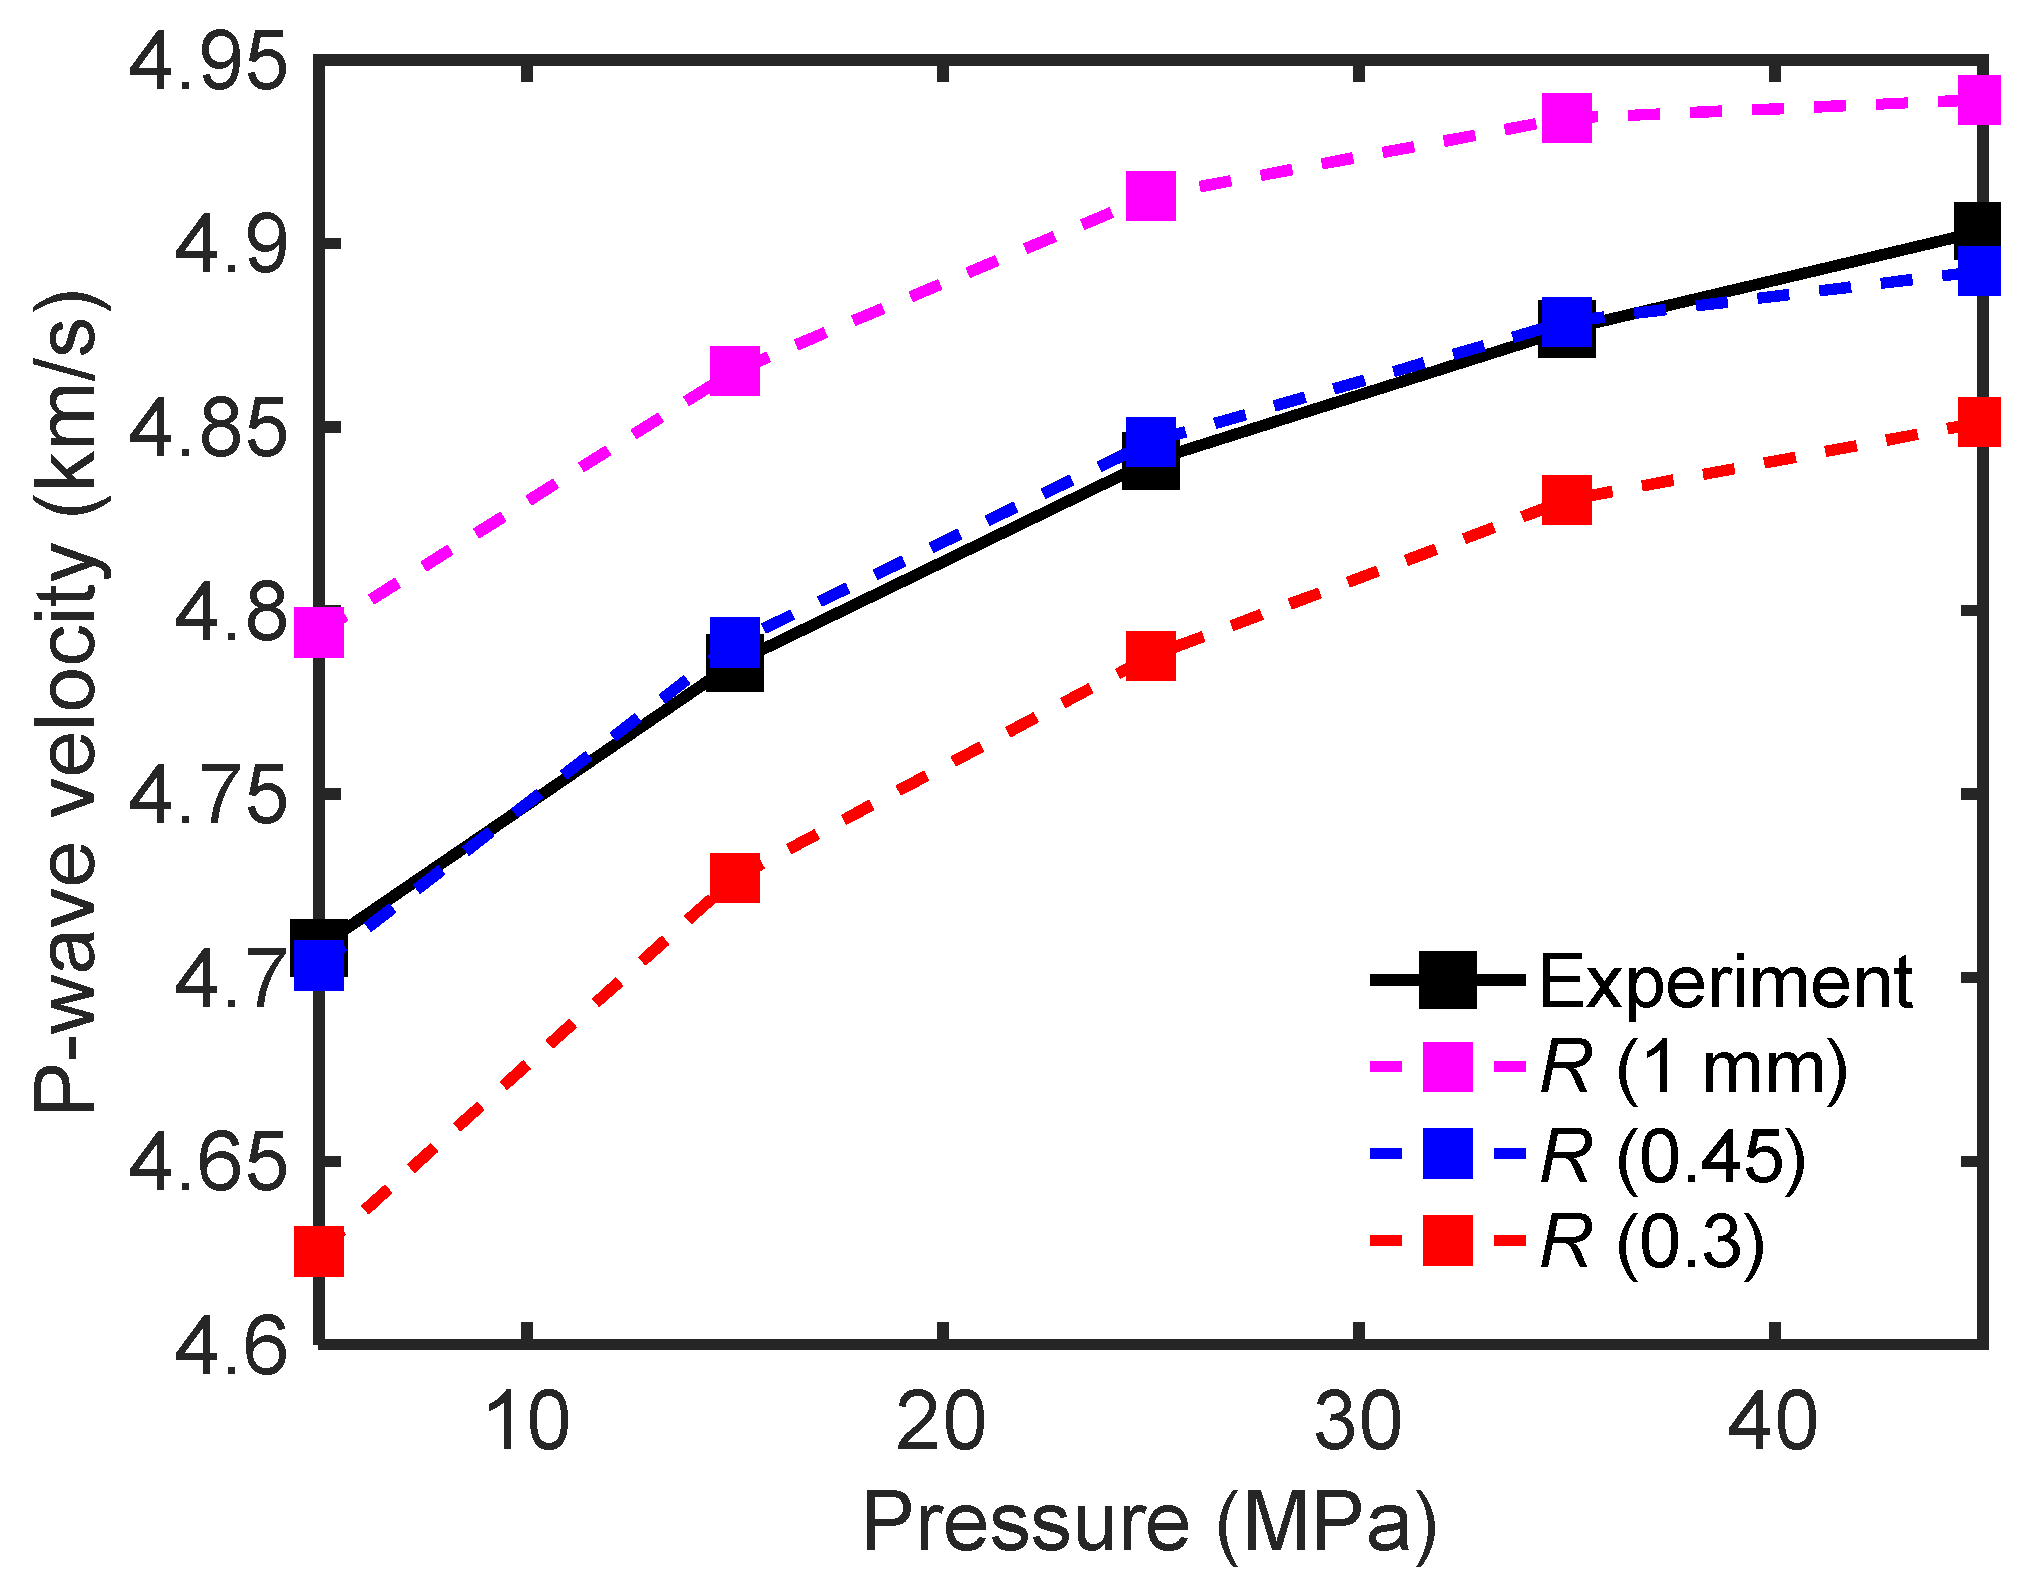
The characteristic squirt flow length is estimated. This is an important parameter of the model and can be obtained with a least square method by matching the reformulated modified frame squirt flow model prediction with the experimental data at full water saturation.
The DZ model is applied to calculate the microcrack density (Figure 8a) and porosity (Figure 8b) based on the experimental data at different effective pressures. Their variations are more significant in the low-pressure range. As pressure increases, both quantities decrease. The microcrack density and porosity decreases, which can be attributed to the closure of microcracks [57,58].
The dry rock density of sample S2-9 is 2410 kg/m3, and the bulk modulus of the mineral mixture is 39 GPa. The fluid properties are determined from the empirical equations of Batzle and Wang [59]. Figure 9 displays the P-wave velocity as a function of the effective pressure, where the squirt flow lengths are obtained by matching the theoretical results to the experimental data. It shows that the sample can be characterized by a constant squirt flow length at different pressures [31]. The characteristic length of sample S2-9 is 0.45 mm. This quantity is not so relevant to the pressure and it can be considered as an intrinsic rock property [26].

4. Comparison between Theory and Experiment

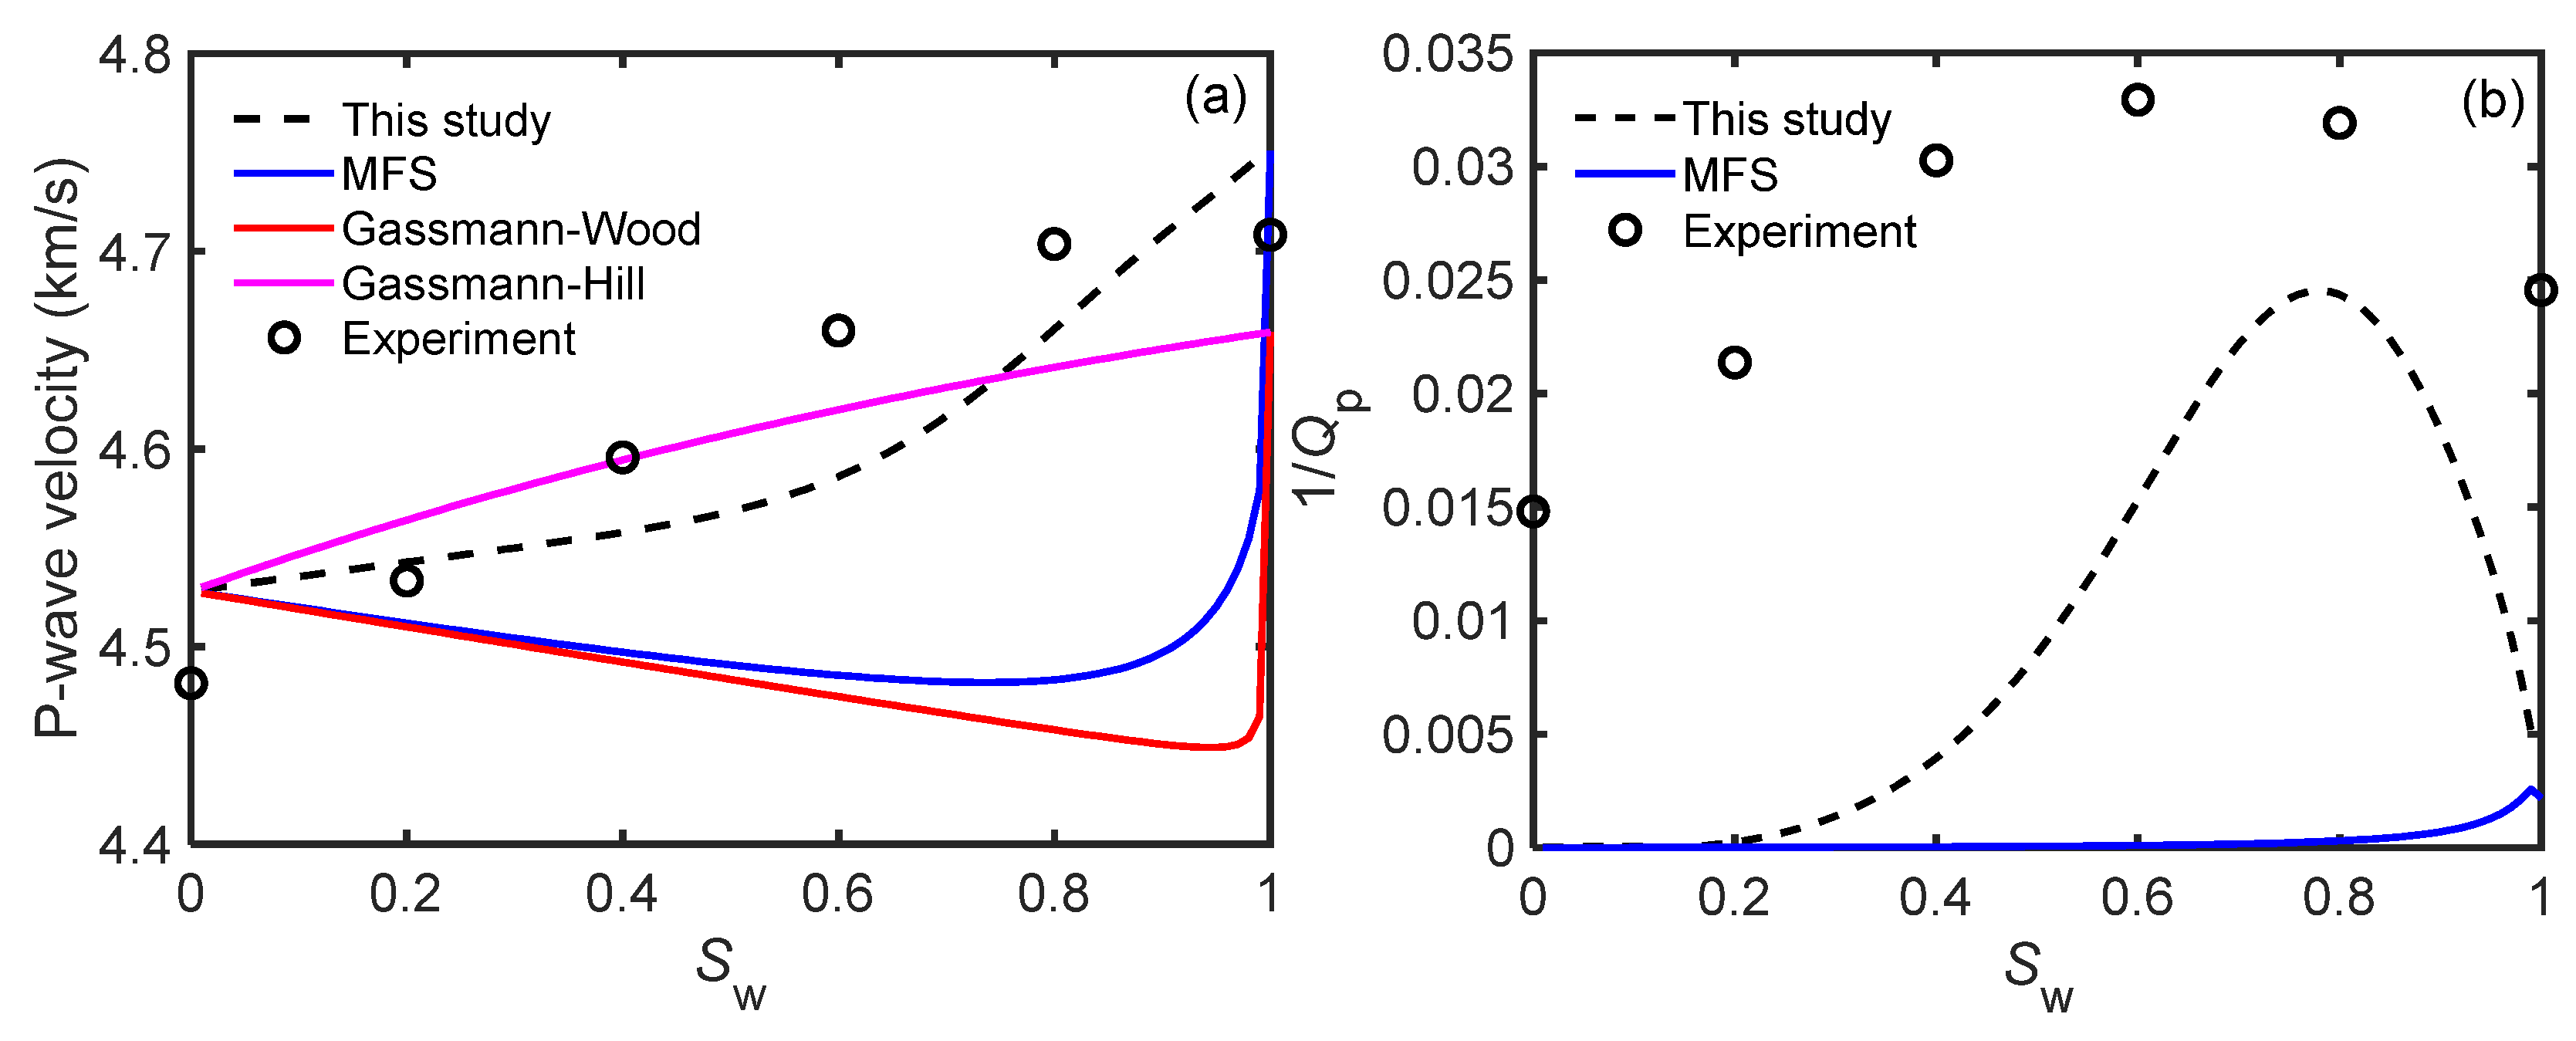
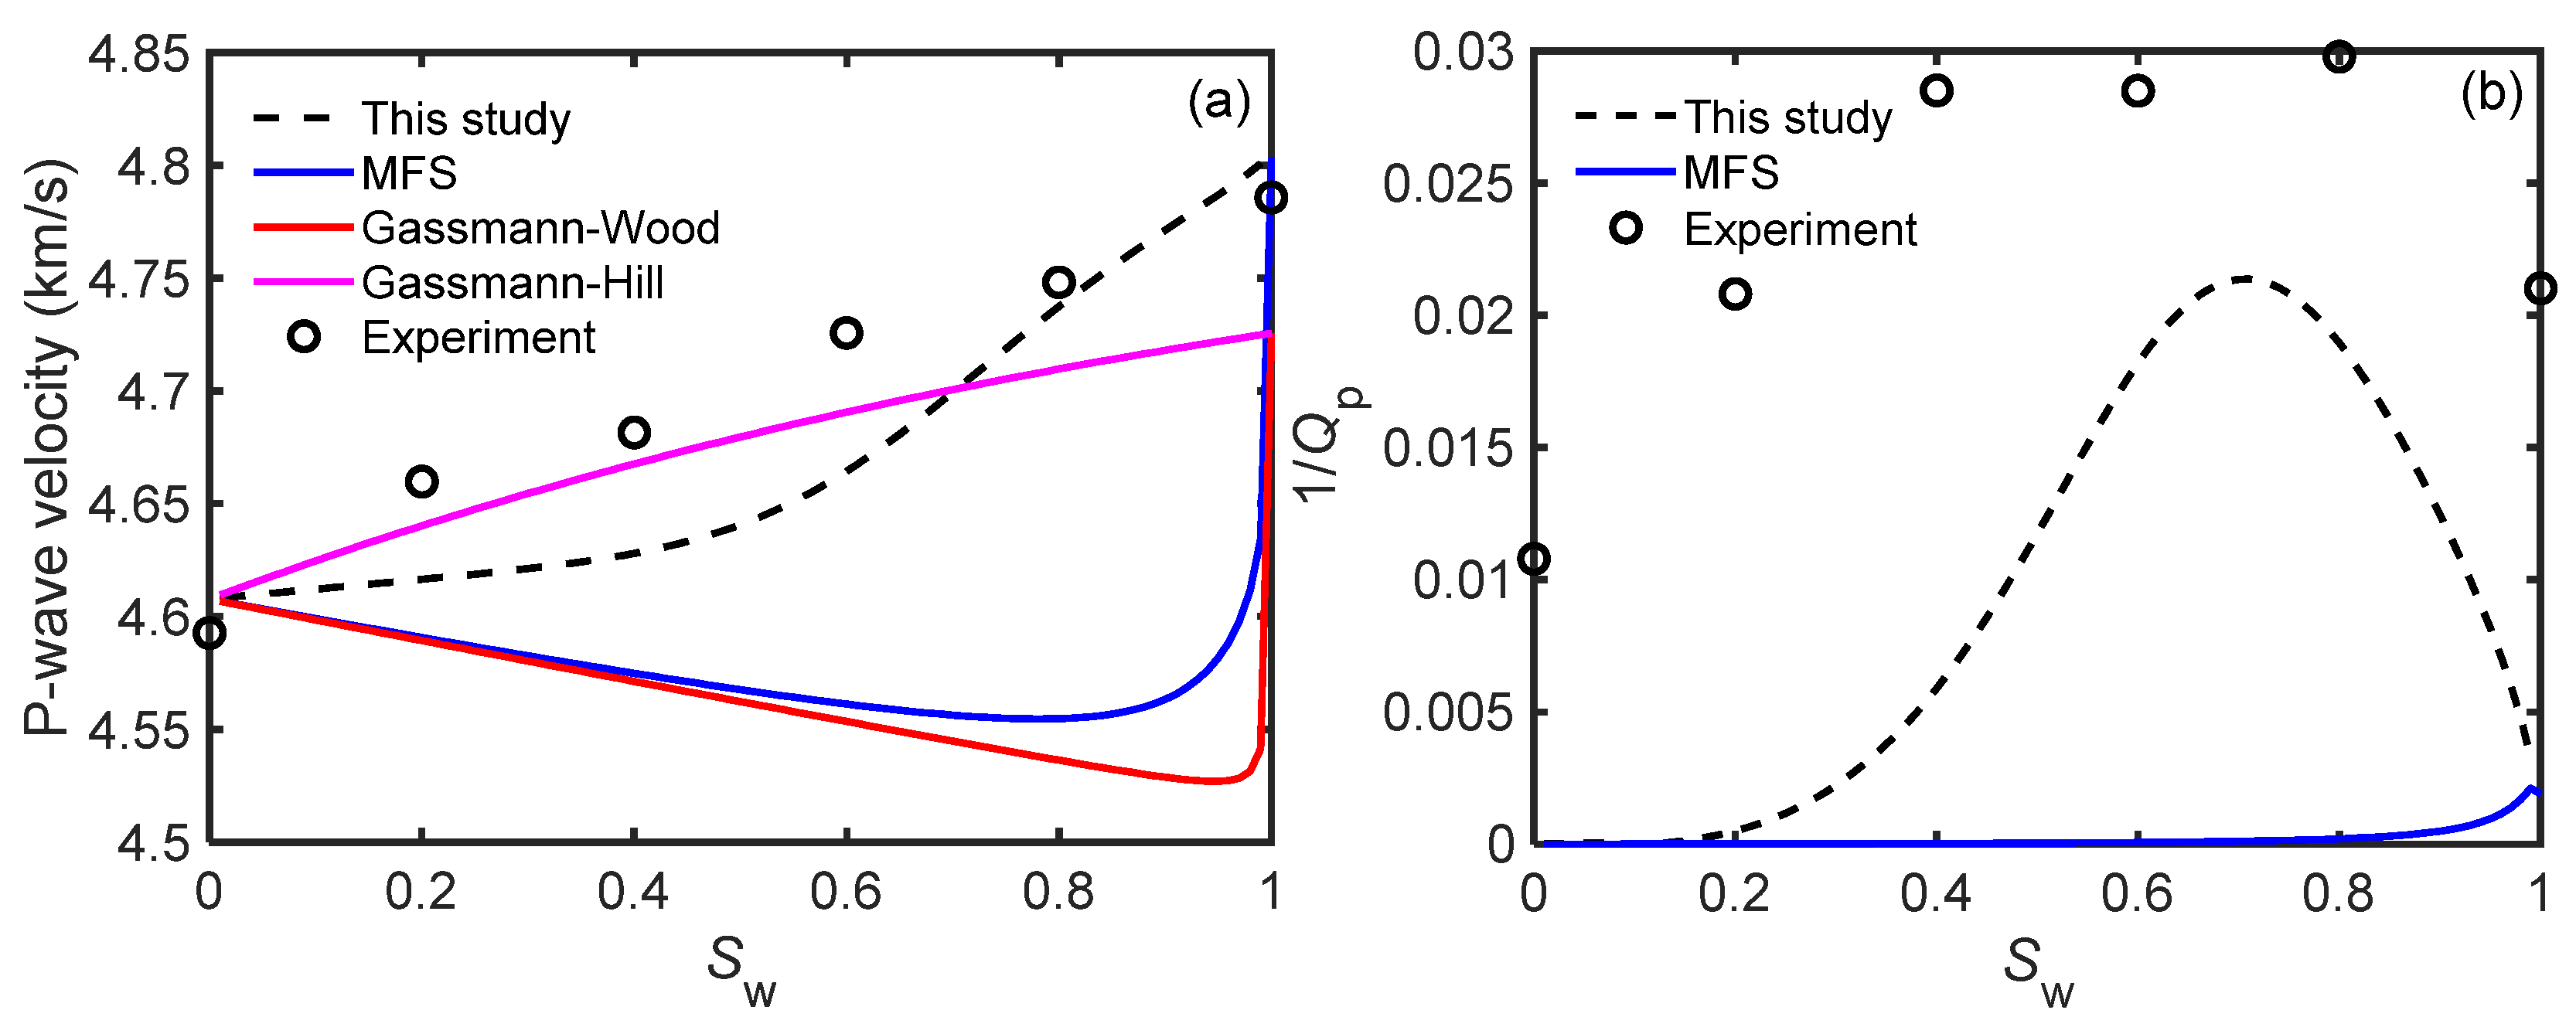
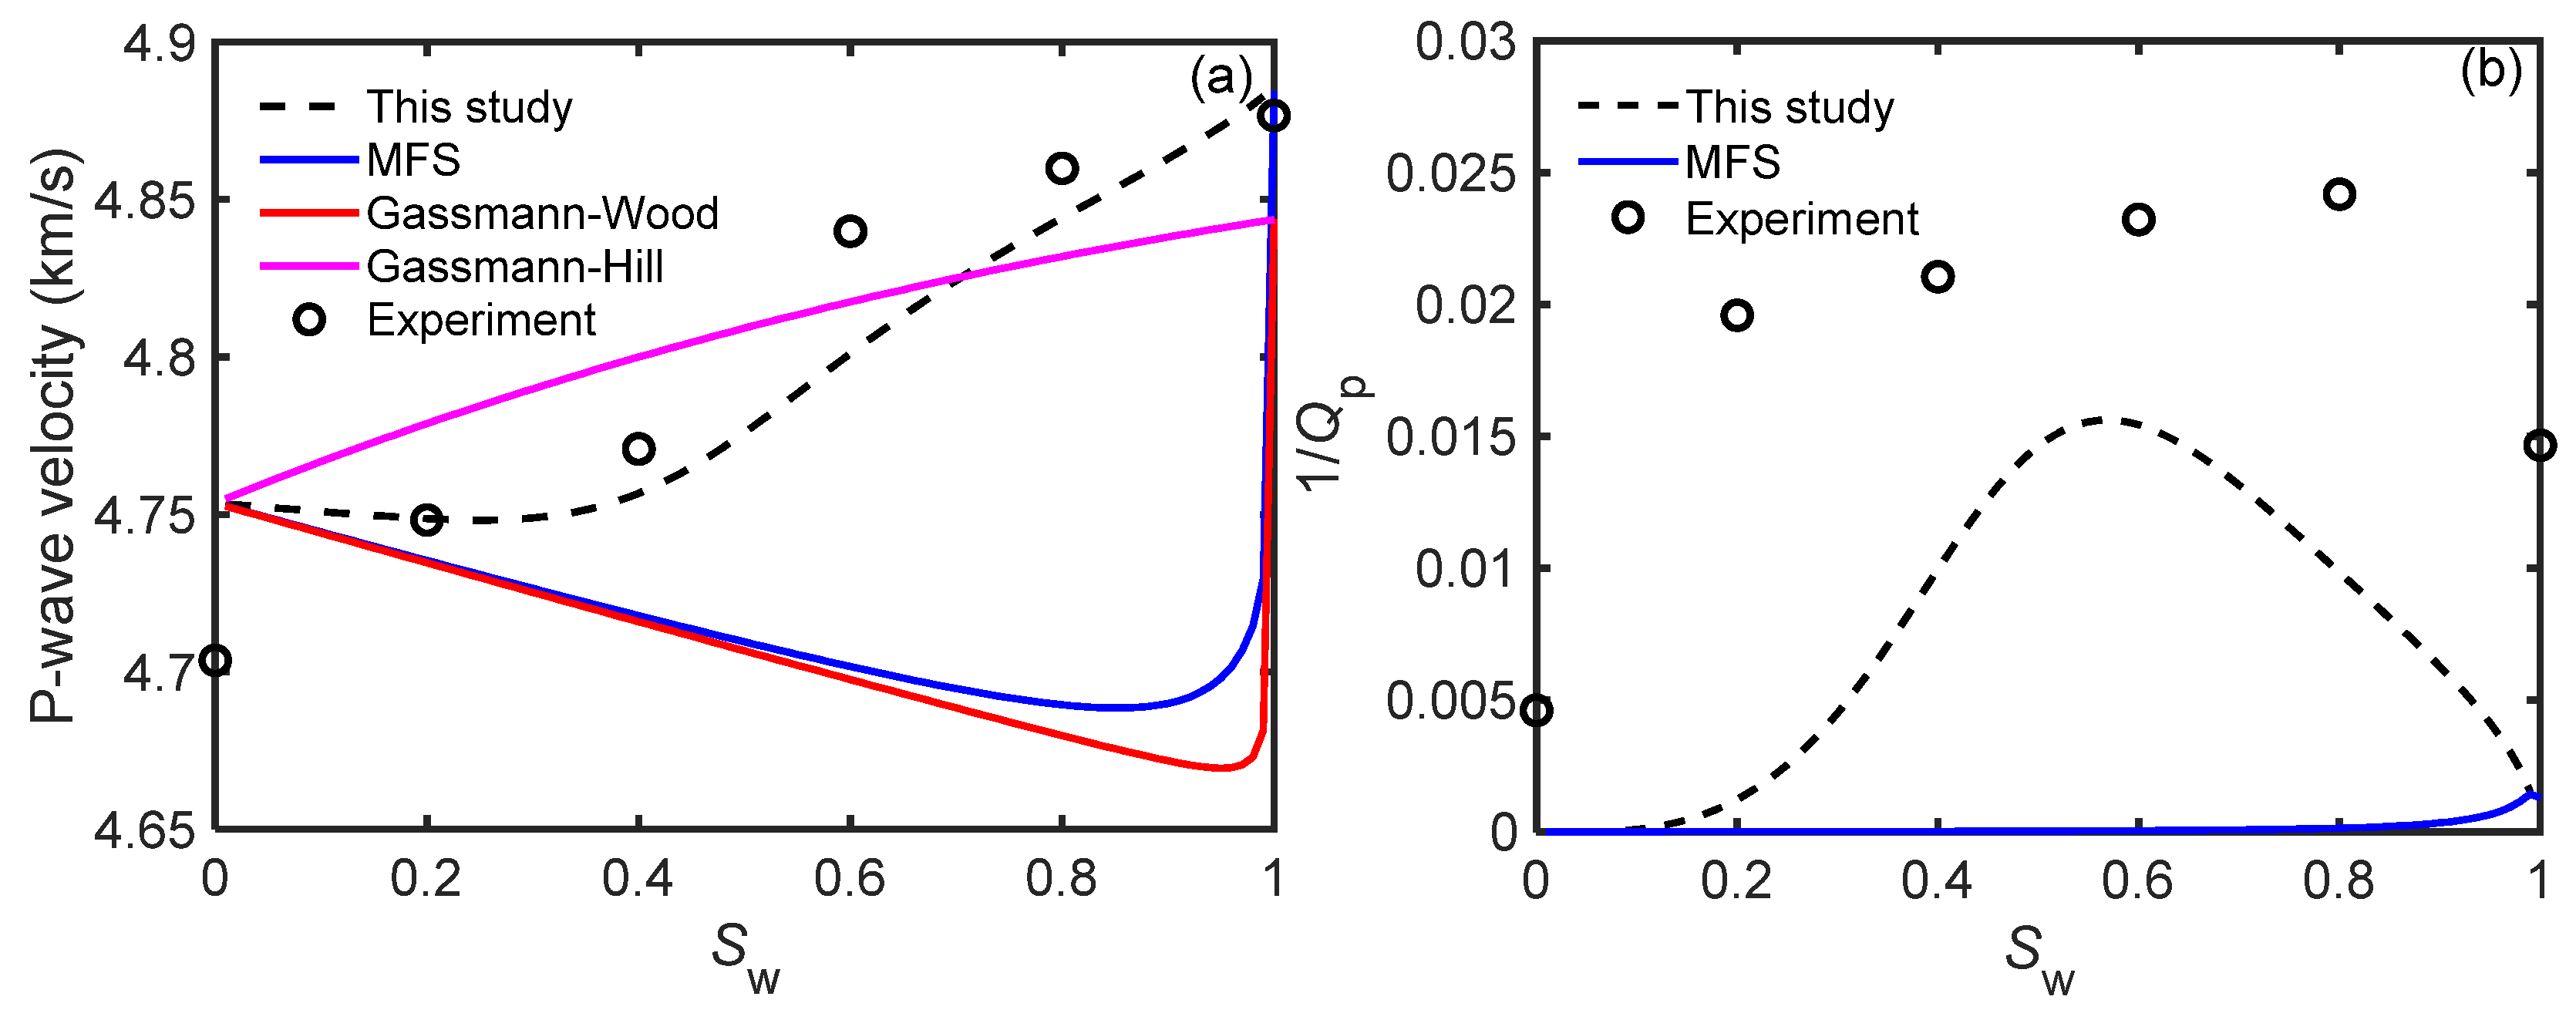
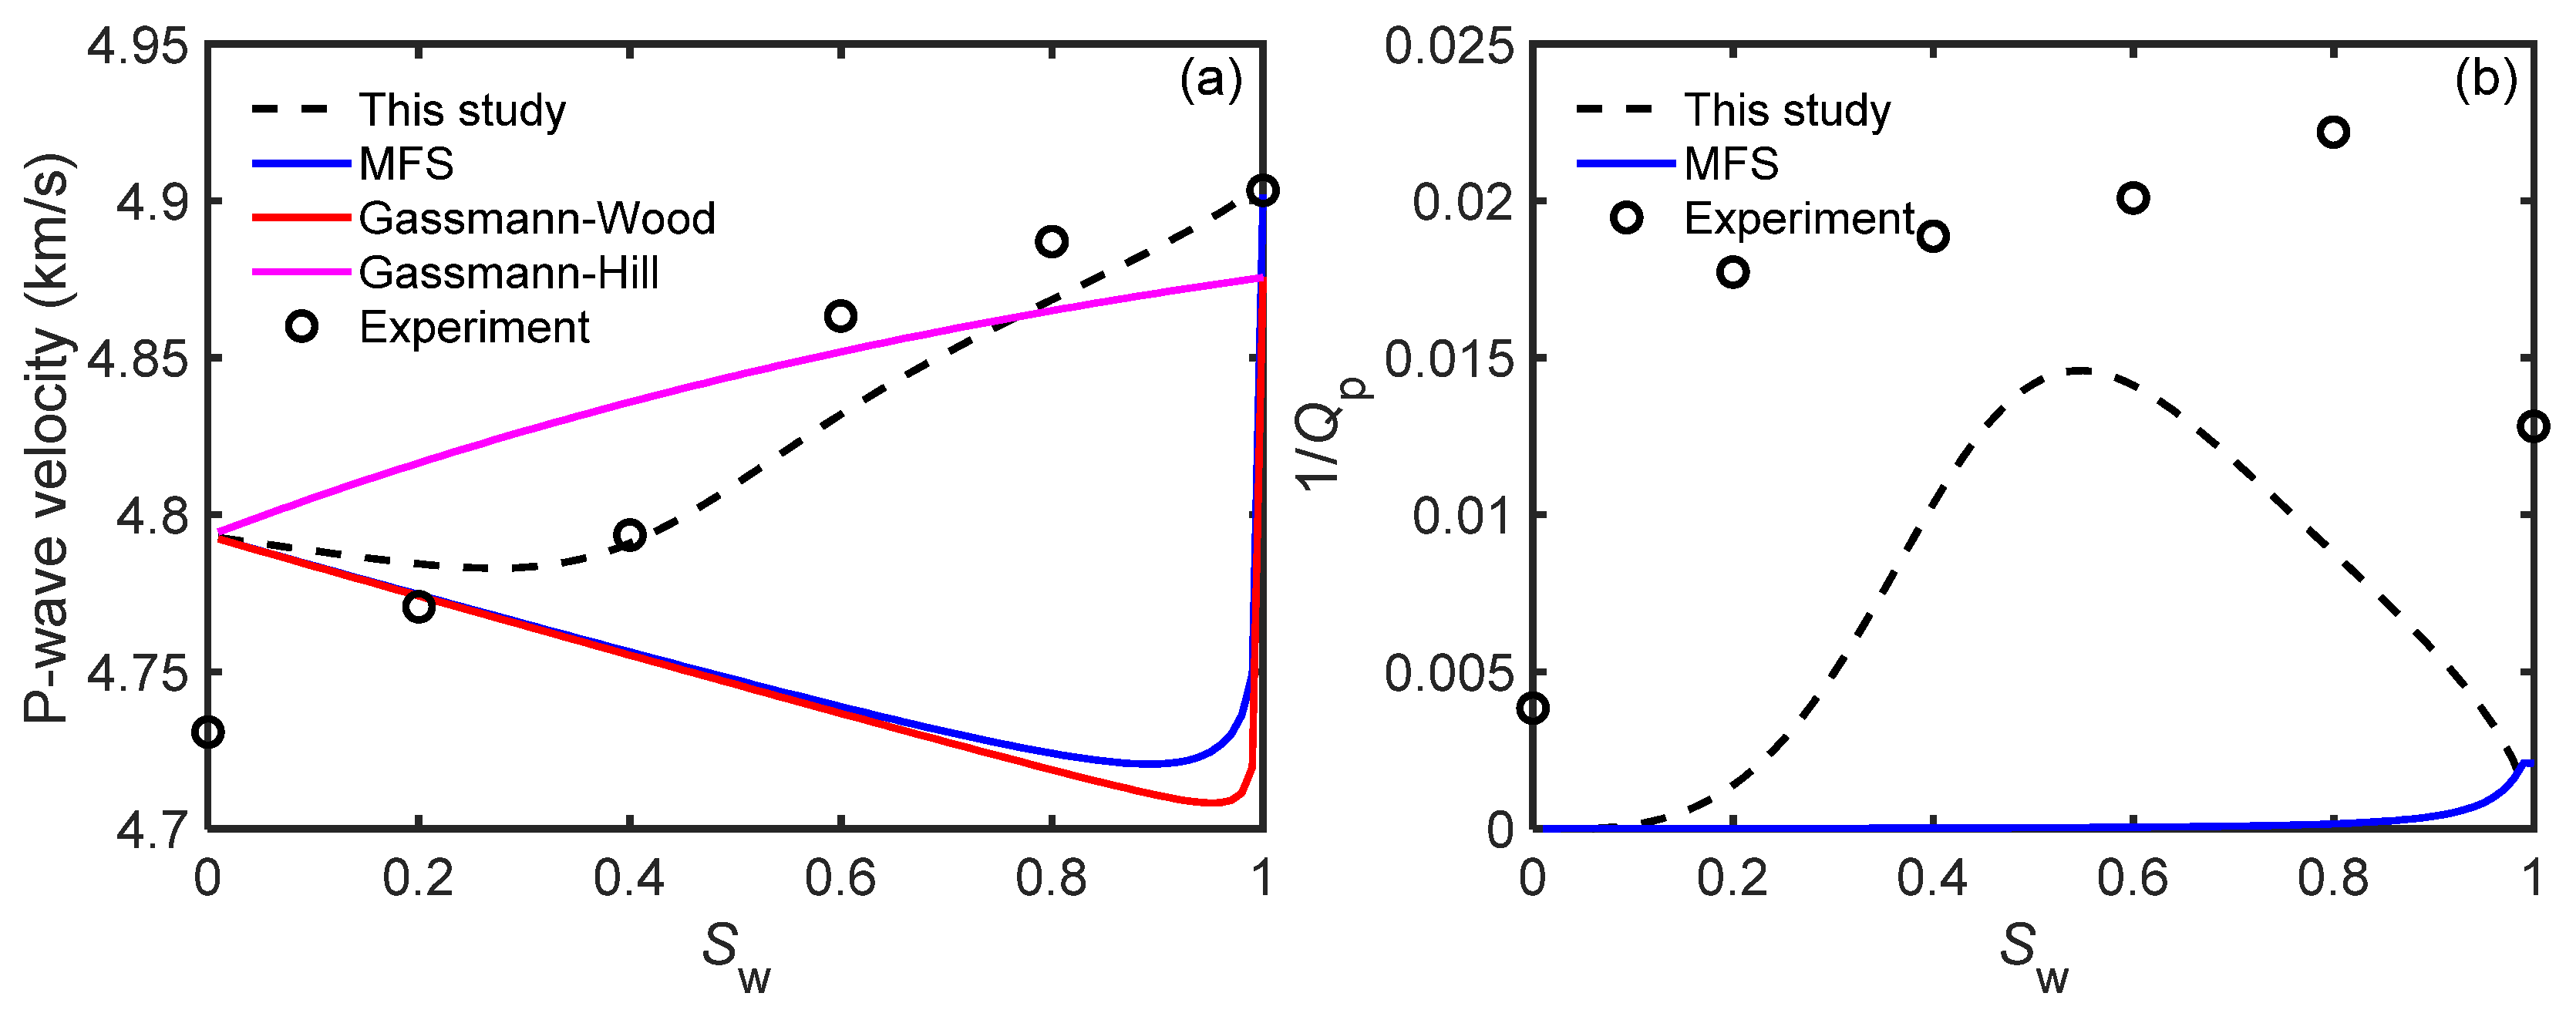
4.1. Effect of Saturation

The present model is used to calculate the P-wave velocity and attenuation of sample S2-9 at 5 MPa effective pressure. The dry rock bulk modulus is 20.5 GPa, the Poisson ratio is 0.15, the permeability is 0.177 mD, the outer diameter is 0.12 mm, the high-pressure modulus is 23 GPa, and the fluid properties are listed in Table 1. Figure 10 displays the results for different models. The Gassmann–Hill curve does not consider the wave-induced fluid flow. The MFS curve coincides with the Gassmann–Wood curve at low saturations (Figure 10a), while the present model has a velocity of the order of the Gassmann–Hill curve. When saturation increases, the rock is stiffened by the microscopic fluid flow, resulting in a velocity increase.
The influence of fluid flow is determined by fluid pressure gradients at the interface between different fluid phases, where the fast P-wave converts to the slow (diffusive) Biot wave (mesoscopic loss) [15,60]. Attenuation has a maximum at a given saturation due to the mesoscopic loss mechanism, absent in the MFS model, whereas at full gas or water saturation, the results are similar. The attenuation curves are similar to those of the sandstone samples analyzed by Amalokwu et al. [56].
Compared with the simplified models, the present model provides a good match between the theory and the ultrasonic data for a tight sandstone, mainly the P-wave velocity as a function of saturation at an effective pressure of 5 MPa, showing the effectiveness of the squirt flow model combined with the White theory. However, attenuation is underestimated by the model due to the fact that the spatial variations in mineral grain and porosity are not considered.

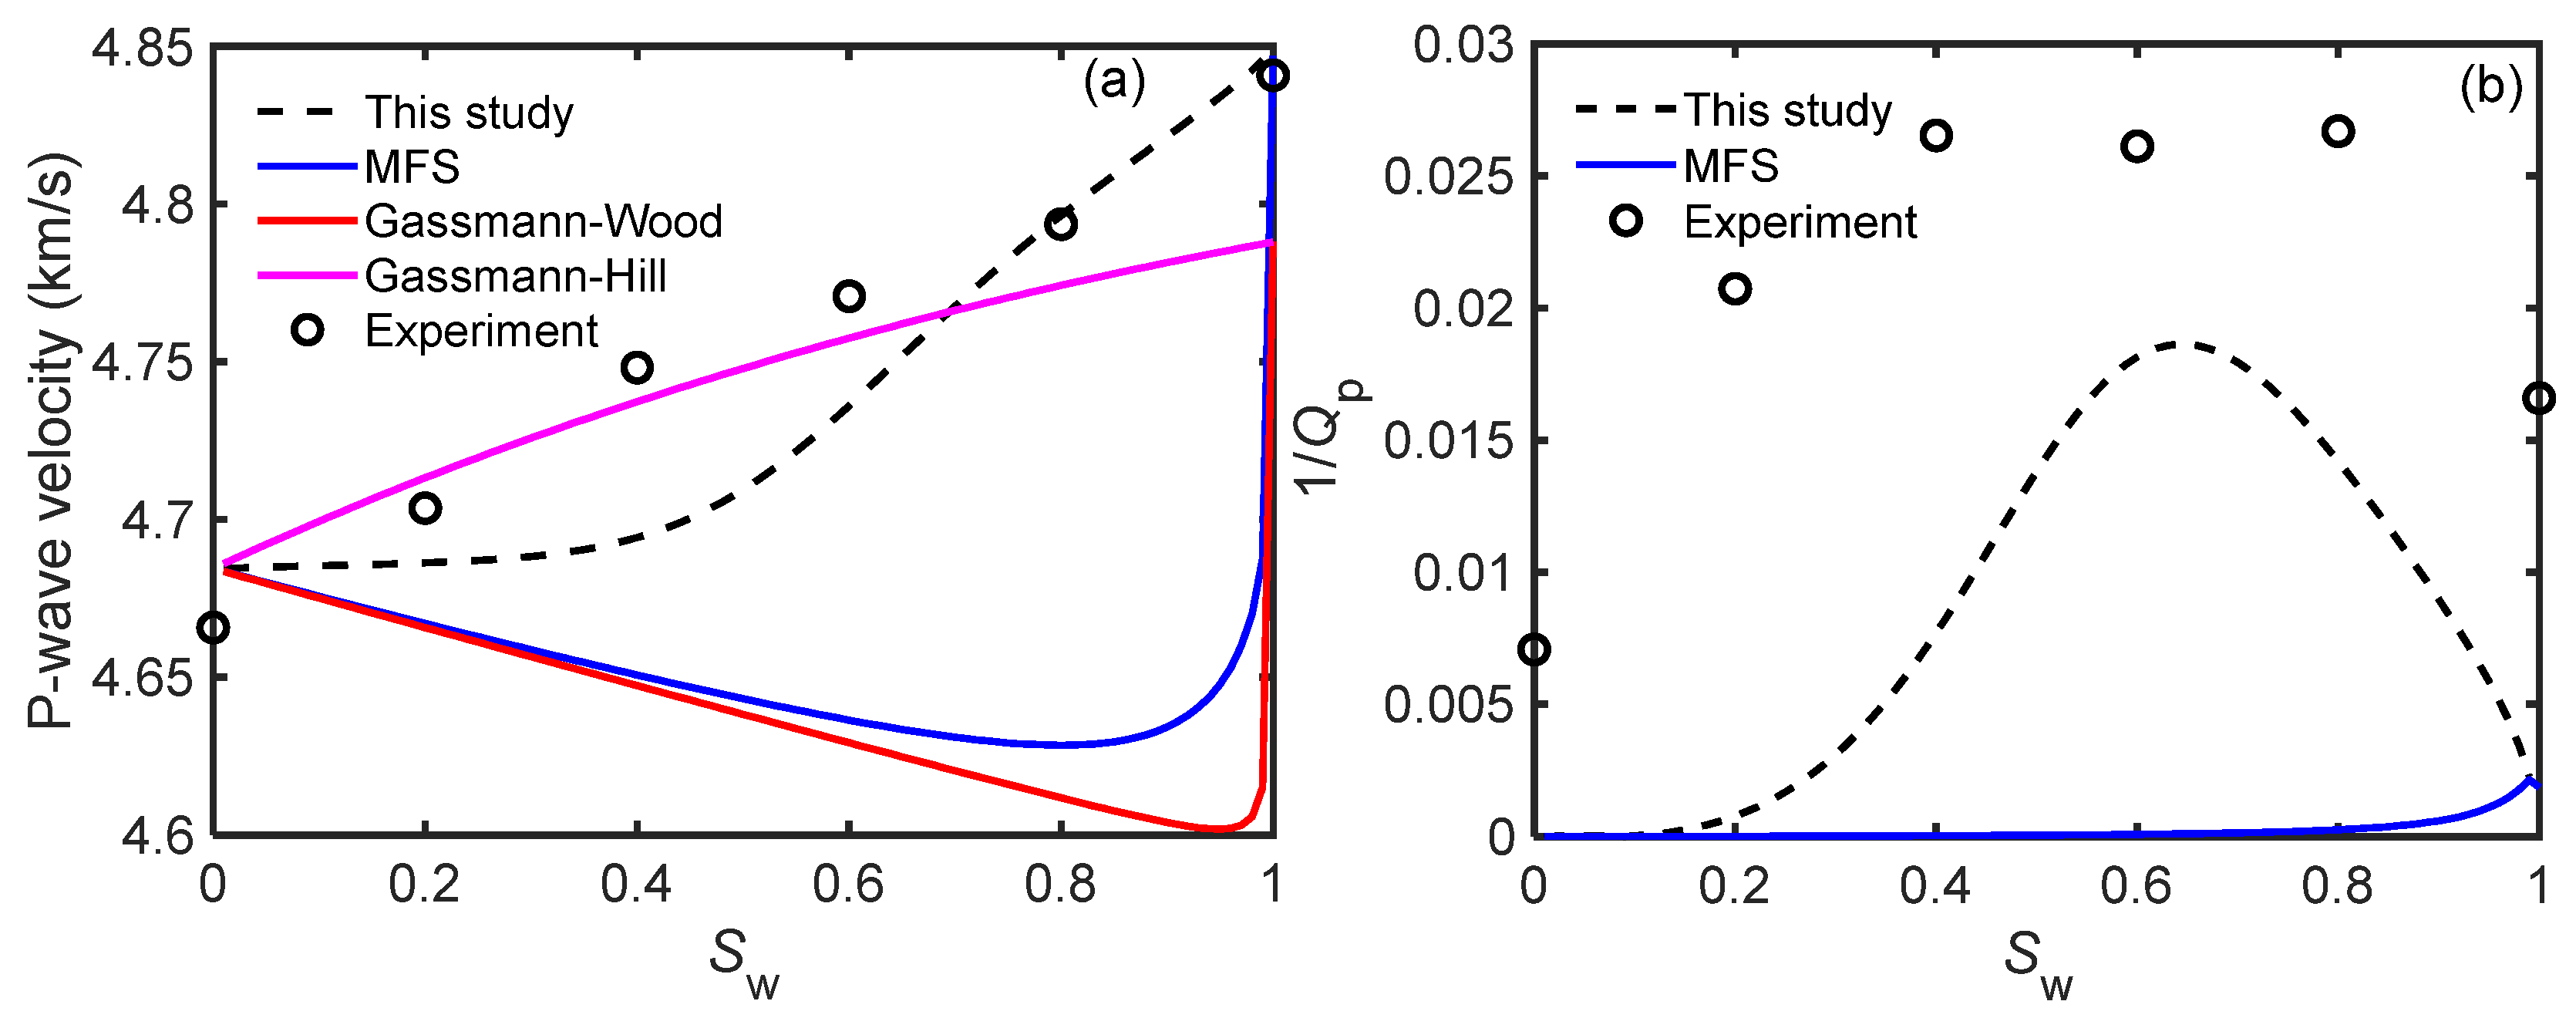
4.2. Effect of Effective Pressure
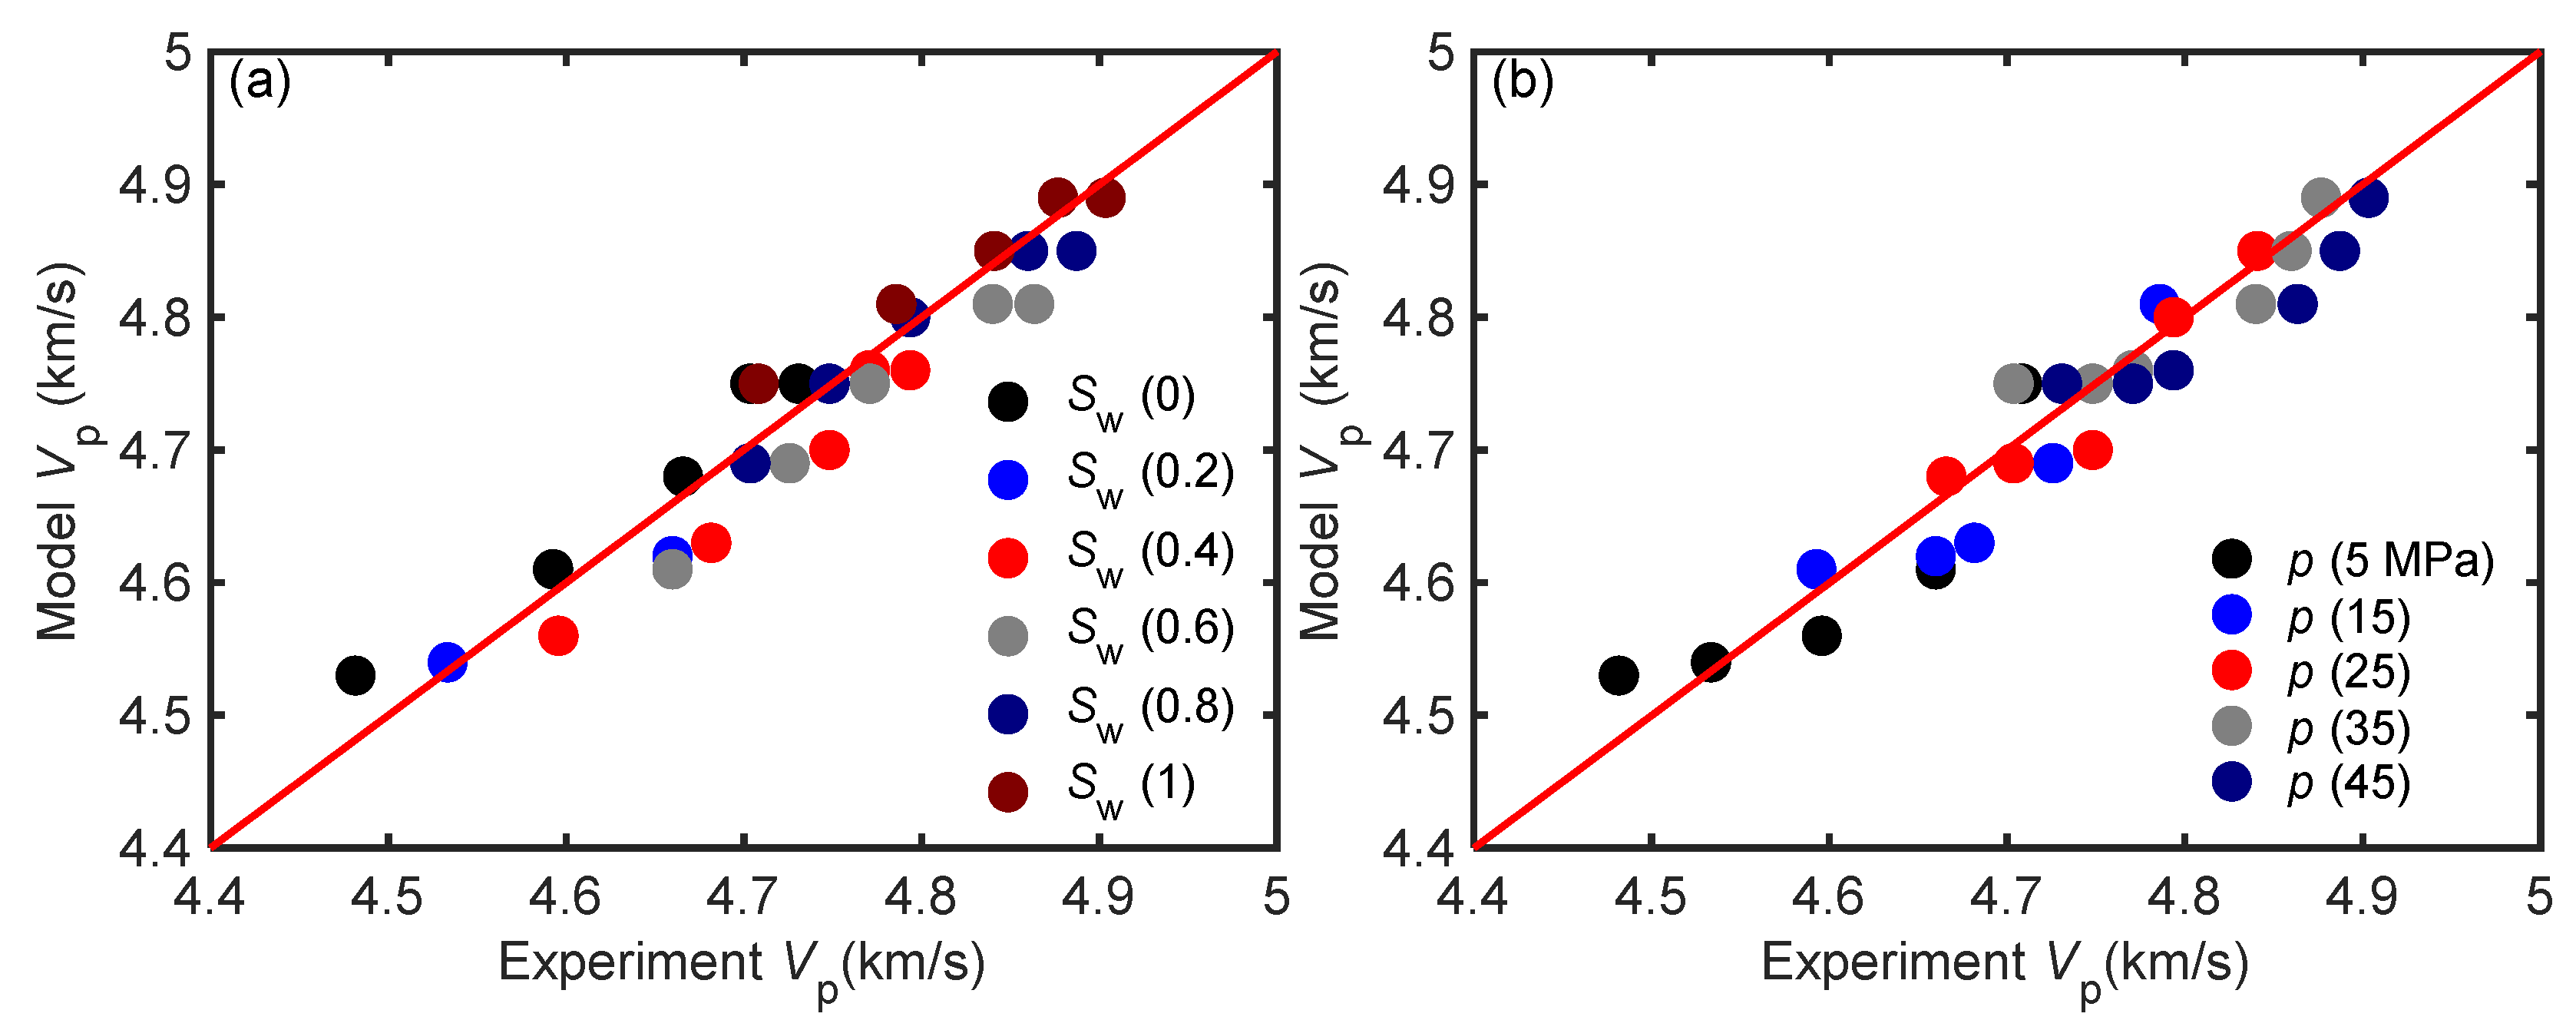
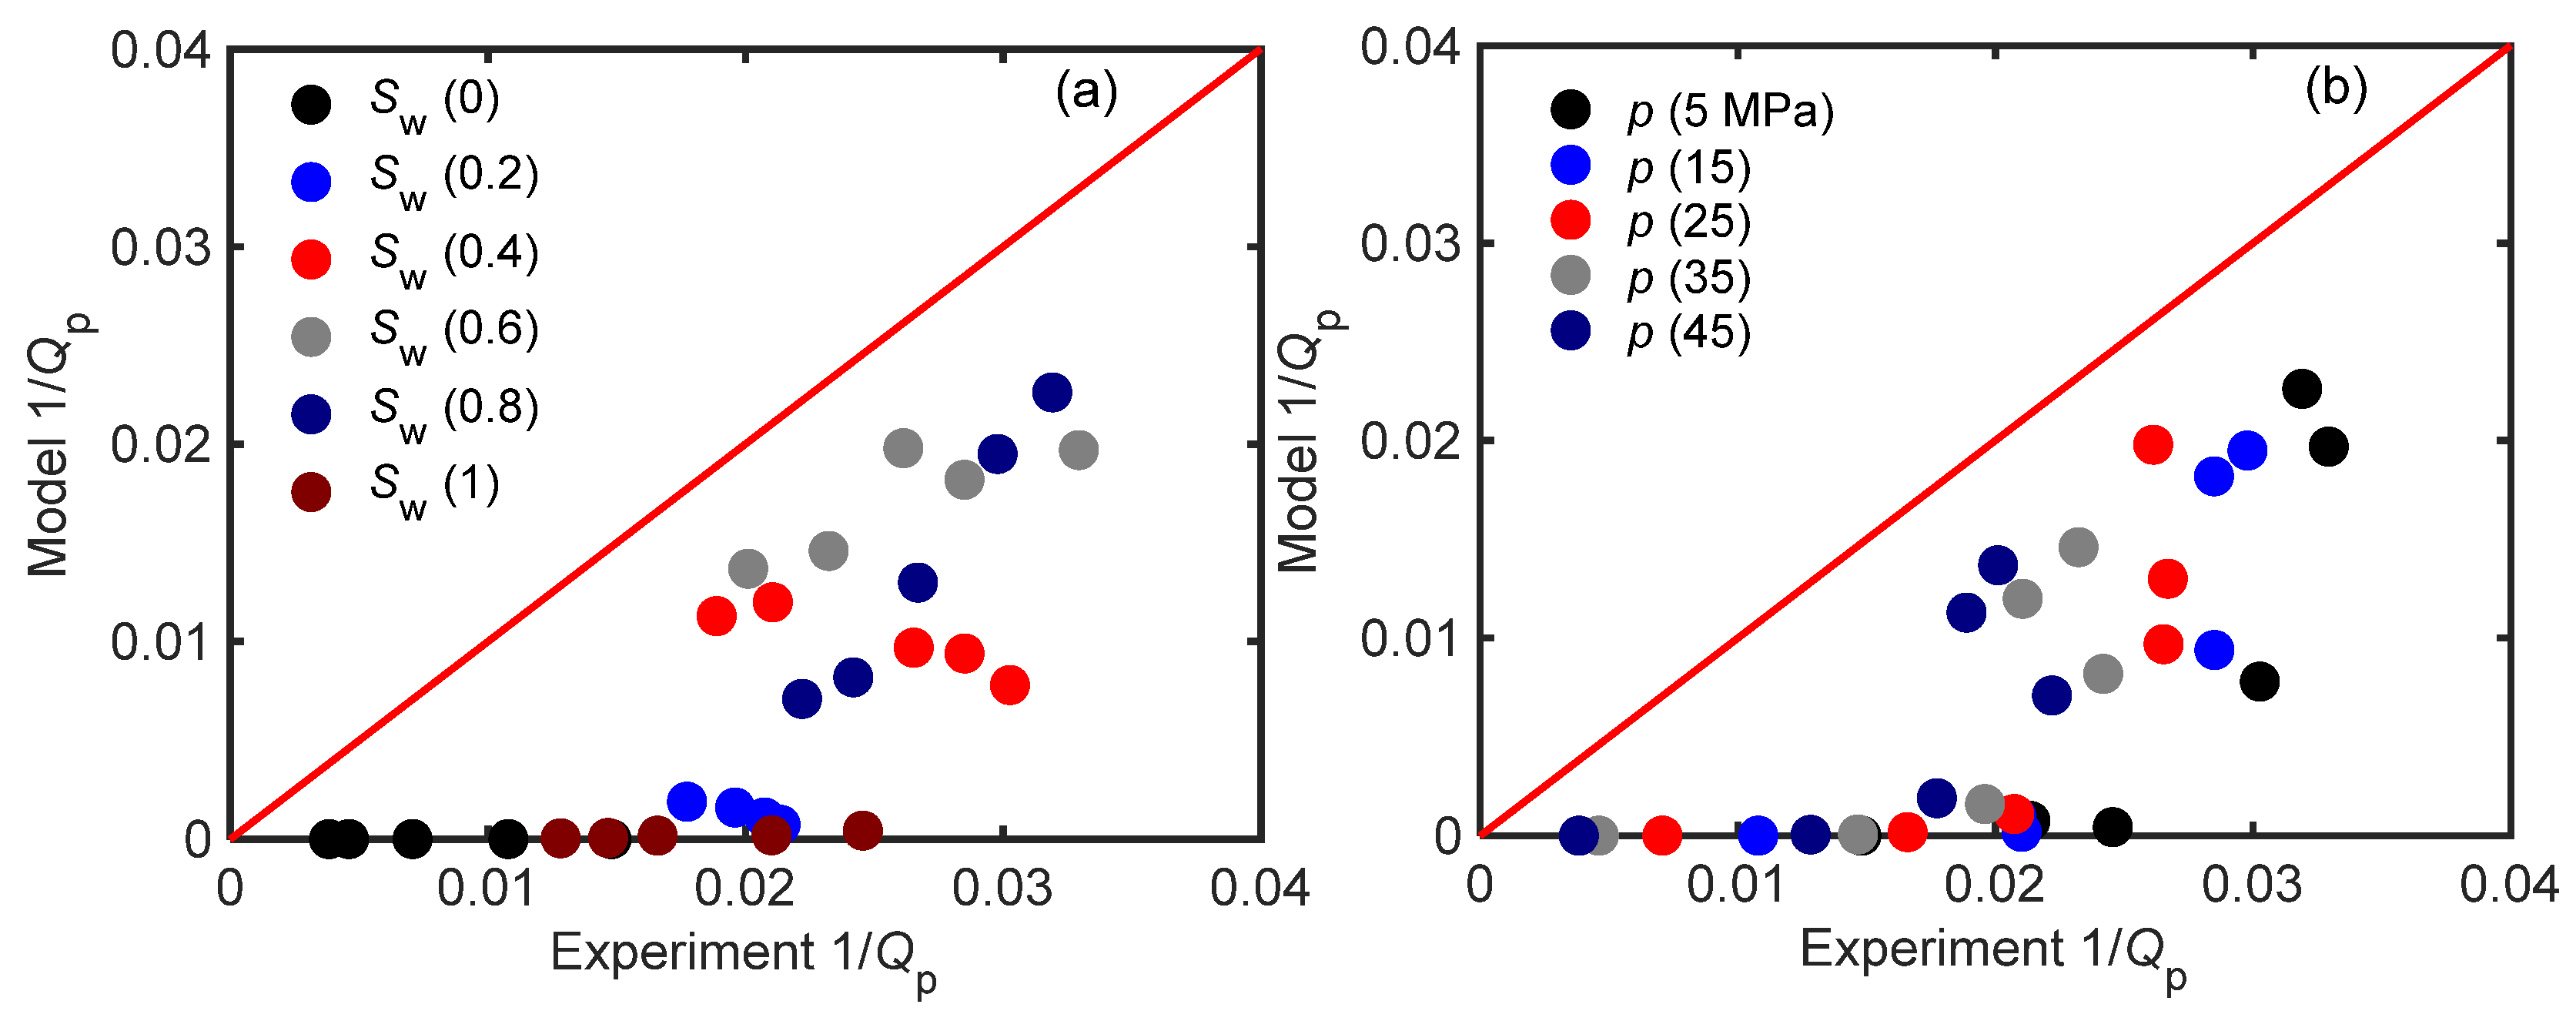
In this example, the outer diameters at effective pressures of 15, 25, 35, and 45 MPa are 0.14, 0.16, 0.18 and 0.2 mm, respectively. Figure 11, Figure 12, Figure 13 and Figure 14 display the P-wave velocity and attenuation as a function of water saturation at these pressures. The overall trend is similar to that at 5 MPa. As pressure increases, the MFS velocities approach the Gassmann–Wood velocities, and the P-wave velocity predictions from the new model increases; however, the attenuation decreases where most microcracks close, and the squirt flow effects are inhibited. Therefore, the characteristics of wave propagation from the new model are similar to those of the experimental data in Figure 11, Figure 12, Figure 13 and Figure 14.

4.3. Crossplots

Figure 15 shows crossplots of the measured and theoretical velocities, showing a good agreement.
Attenuation crossplots are displayed in Figure 16. The attenuation prediction from the present model is less than the experimental one, particularly at low effective pressures. This can be due to the fact that the model considers only the mesoscopic loss caused by partial saturation. Additional attenuation may be due to the presence of many minerals, and the microcrack content, shape, and distribution [15,51,61].

5. Conclusions

We combine the reformulated modified frame squirt flow model and White’s mesoscopic loss theory (spherical gas pockets) to develop a new model for describing wave anelasticity in partially saturated rocks. The microcrack properties and characteristic squirt flow lengths are obtained from experimental data at different effective pressures and water saturations. We compare the results with those of simplified models, showing that the present model provides a good match between the theory and the ultrasonic data for a tight sandstone, mainly the P-wave velocity as a function of saturation and pressure. Attenuation is underestimated by the model due to the fact that mesoscopic loss (fast P- to slow P-wave conversion) due to spatial variations in mineral grain and porosity are not considered. The new model can be used to predict the characteristics of wave propagation in partially saturated tight sandstones, mainly the P-wave velocity. Moreover, a better description at high frequencies (from tens of kHz) should consider the Biot attenuation peak. The generalization of the model will be the task of a future paper.
Due to the complex microstructures and fabric heterogeneity of tight sandstone, the proposed model cannot fully describe the experimental measurement data at low effective pressures. The theories cannot perfectly match real rocks, and there might be errors/defects in the experiment measurements. In the related engineering applications of hydrocarbon reservoir exploration, the methods of big data analytics and machine learning may be applied in combination with the theoretical models, so as to improve the applicability of the model and the accuracy of reservoir property prediction or interpretation.

Author Contributions

Conceptualization, J.B. and C.W.; Data curation, J.B. and X.Z.; Formal analysis, C.W., J.B., X.Z., J.M.C., L.Z. and C.R.; Funding acquisition, J.B.; Investigation, C.W., J.B., J.M.C. and L.Z.; Methodology, C.W., J.B. and J.M.C.; Project administration, J.B. and X.Z.; Resources, J.B. and X.Z.; Supervision, J.B.; Validation, C.W. and J.M.C.; Writing—original draft, C.W. and J.B.; Writing—review & editing, J.B., J.M.C. and L.Z. All authors have read and agreed to the published version of the manuscript.

Funding

This work was funded by the National Natural Science Foundation of China, grant number 41974123 and 42174161, the Jiangsu Province Outstanding Youth Fund Project, grant number BK20200021, the National Science and Technology Major Project of China, grant number 2017ZX05069-002, and Sinopec Key Laboratory of Geophysics.

Institutional Review Board Statement

Not applicable.

Informed Consent Statement

Not applicable.

Data Availability Statement

The data relevant with this study can be accessed by contacting the corresponding author.

Acknowledgments

This work is supported by the National Natural Science Foundation of China (Grant no. 41974123, 42174161), the Jiangsu Province Outstanding Youth Fund Project (Grant no. BK20200021), the National Science and Technology Major Project of China (Grant no. 2017ZX05069-002) and Sinopec Key Laboratory of Geophysics.

Conflicts of Interest

The authors declare no conflict of interest.

Appendix A. Symbols

Table A1. List of symbols.
S g gas saturation
b outer diameter of the patch
K * ( ω ) wet rock bulk modulus with the meso description of anelasticity
K bulk modulus at the high-frequency limit
Gdrydry rock shear modulus
K 0 bulk modulus of the mineral mixture
ϕ c microcrack porosity
ω angular frequency
κ permeability
J 0 zero-order Bessel function
K m d modified dry-frame bulk modulus
K h p high-pressure modulus
ω c characteristic frequency
ρ s mineral density
K ( ω ) wet rock bulk modulus with the micro and meso description of anelasticity
K f l 1 gas fluid modulus
η 1 gas viscosity
Swwater saturation
ρ 2 water density
a inner diameter of the patch
ϕporosity
G * ( ω ) wet rock shear modulus with the meso description of anelasticity
W a complex function of porosity, permeability and fluid viscosity, etc.
K m s modified bulk modulus
K d r y dry rock bulk modulus
Rcharacteristic squirt flow length
η fluid viscosity
Kflbulk modulus of the fluid
J 1 first-order Bessel function
Gmdmodified dry-frame shear modulus
ρ a additional coupling density
M d r y uniaxial modulus of the rock skeleton under drained conditions
ρ f l fluid density
G ( ω ) wet rock shear modulus with the micro and meso description of anelasticity
K f l 2 water fluid modulus
η2water viscosity
ρ 1 gas density
ρ bulk density
Microcrack Porosity Estimation at Different Effective Pressures
-The aspect ratio of the stiff pores is estimated. Based on the MT model (Mori and Tanaka), the quantitative relation between elastic moduli and stiff porosity is established. The effective bulk and shear moduli of the host medium are
1 K s t i f f M T = 1 K 0 ( 1 + ϕ s 1 ϕ s P )
1 G s t i f f M T = 1 G 0 ( 1 + ϕ s 1 ϕ s Q ) ,
respectively; G0 is the shear modulus and ϕ s is the stiff porosity.
P = ( 1 υ ) 6 ( 1 2 υ ) × 4 ( 1 + υ ) + 2 γ 2 ( 7 2 υ ) [ 3 ( 1 + 4 υ ) + 12 γ 2 ( 2 γ ) ] g 2 γ 2 + ( 1 4 γ 2 ) g + ( γ 2 1 ) ( 1 + γ ) g 2
Q = 4 ( γ 2 1 ) ( 1 γ ) 15 { 8 ( γ 1 ) + 2 γ 2 ( 3 4 υ ) + [ ( 7 8 υ ) 4 γ 2 ( 1 2 υ ) ] g } × { 8 ( 1 υ ) + 2 γ 2 ( 3 + 4 υ ) + [ ( 8 υ 1 ) 4 γ 2 ( 5 + 2 υ ) ] g + 6 ( γ 2 1 ) ( 1 + υ ) g 2 2 γ 2 + ( 1 4 γ 2 ) g + ( γ 2 1 ) ( 1 + γ ) g 2 3 [ 8 ( υ 1 ) + 2 γ 2 ( 5 4 υ ) + [ 3 ( 1 2 υ ) + 6 γ 2 ( υ 1 ) ] g 2 γ 2 + [ ( 2 γ ) + γ 2 ( 1 + υ ) ] g ] }
where γ is the spheroidal aspect ratio, and υ is the Poisson ratio of the grains, i.e.,
υ = ( 3 K 0 2 G 0 ) / ( 6 K 0 + 2 G 0 ) ,   g = { γ ( 1 γ 2 ) 3 / 2 ( arccos γ γ 1 γ 2 ) ( γ < 1 ) γ ( 1 γ 2 ) 3 / 2 ( γ 1 γ 2 arccos h γ ) ( γ > 1 )
Microcracks are included into the host material by neglecting the interactions between cracks and pores. The effective moduli (host with cracks) are
1 K e f f M T = 1 K s t i f f M T ( 1 + 16 ( 1 ( υ s t i f f M T ) 2 ) Γ 9 ( 1 2 υ s t i f f M T ) )
1 G e f f M T = 1 G s t i f f M T ( 1 + 32 ( 1 υ s t i f f M T ) ( 5 υ s t i f f M T ) Γ 45 ( 2 υ s t i f f M T ) )
where υ s t i f f M T = ( 3 K s t i f f M T 2 μ s t i f f M T ) / ( 6 K s t i f f M T + 2 μ s t i f f M T ) and Γ is the microcrack density. When all the microcracks close at high pressures, a least square method is used to obtain the optimal aspect ratio of the stiff pores by using Equations (A1) and (A2).
-We obtain the cumulative microcrack density at different pressures by a least square method. Then the moduli can be obtained with Equations (A6) and (A7).
-The relation between effective pressure and microcrack density is established. The microcrack density obeys [62]
Γ = Γ i e p / p ^
where Γ i is the initial value when the effective pressure is zero, p is the effective pressure, and p ^ is a constant.
-The microcrack aspect ratio distribution is computed. When effective pressure increases, microcracks gradually close. The minimum initial aspect ratio of the open microcracks is given by
γ p i = 3 4 π Γ i Γ ( 1 / K ( Γ ) 1 / K e f f h p ) Γ d p d Γ d Γ
where K ( Γ ) is the effective bulk modulus which can be obtained from Equation (A1).
Substituting Equation (A8) into (A9), we obtain
γ p i = 3 4 π Γ Γ i ( 1 / K ( Γ ) 1 / K e f f h p ) p ^ Γ 2 d Γ
and by integrating Equation (A10) from Γ to Γ i ,
γ p i = 4 p ^ [ 1 ( υ e f f h p ) 2 ln ( Γ i Γ ) ] 3 π K e f f h p [ 1 2 υ e f f h p ]
where υ e f f h p is the effective Poisson ratio at high pressures, i.e., υ e f f h p = ( 3 K e f f h p 2 G e f f h p ) / ( 6 K e f f h p + 2 G e f f h p ) .
Combining Equations (A8) and (A11), the relation between the minimum initial aspect ratio and the effective pressure can be obtained as
γ p i = 4 [ 1 ( υ e f f h p ) 2 ] p π E e f f h p
where E e f f h p = 3 K e f f h p [ 1 2 υ e f f h p ] is the effective Young modulus at high pressures. The cumulative microcrack density decreases with pressure. If pressure changes from zero to dp, the corresponding reduction of the cumulative microcrack density is d Γ . When the pressure increment is small enough, it can be considered that the decrease of microcrack density is mainly due to the closure of microcracks with an aspect ratio less than the minimum initial aspect ratio. David and Zimmerman [52] related the microcrack porosity and density as
ϕ c = 4 π γ 3 Γ
Therefore, the microcrack properties can be obtained from the acoustic wave velocities as a function of the effective pressure.

References

  1. Winkler, K.W. Dispersion analysis of velocity and attenuation in Berea sandstone. J. Geophys. Res. Solid Earth 1985, 90, 6793–6800. [Google Scholar] [CrossRef]
  2. Knight, R.; Nolen-Hoeksema, R. A laboratory study of the dependence of elastic wave velocities on pore scale fluid distribution. Geophys. Res. Lett. 1990, 17, 1529–1532. [Google Scholar] [CrossRef]
  3. Gist, G.A. Interpreting laboratory velocity measurements inpartially gas-saturated rocks. Geophysics 1994, 59, 1100–1109. [Google Scholar] [CrossRef]
  4. Mavko, G.; Nolen-Hoeksema, R. Estimating seismic velocities at ultrasonic frequencies in partially saturated rocks. Geophysics 1994, 59, 252–258. [Google Scholar] [CrossRef] [Green Version]
  5. Zhao, H.B.; Wang, X.M.; Chen, S.M.; Li, L.L. Acoustic response characteristics of unsaturated porous media. Sci. China Phys. Mech. Astron. 2010, 53, 1388–1396. [Google Scholar] [CrossRef]
  6. Ba, J.; Yan, X.F.; Chen, Z.Y.; Xu, G.C.; Bian, C.S.; Cao, H.; Yao, F.C.; Sun, W.T. Rock physics model and gas saturation inversion for heterogeneous gas reservoirs. Chin. J. Geophys. 2013, 56, 1696–1706. (In Chinese) [Google Scholar]
  7. Sun, W.T.; Ba, J.; Müller, T.M.; Carcione, J.M.; Cao, H. Comparison of P-wave attenuation models of wave-induced flow. Geophys. Prospect. 2014, 63, 378–390. [Google Scholar] [CrossRef]
  8. Cheng, W.; Ba, J.; Fu, L.Y.; Lebedev, M. Wave-velocity dispersion and rock microstructure. J. Pet. Sci. Eng. 2019, 183, 106466. [Google Scholar] [CrossRef]
  9. Müller, T.M.; Gurevich, B.; Lebedev, M. Seismic wave attenuation and dispersion resulting from wave-induced flow in porous rocks-a review. Geophysics 2010, 75, 75A147–75A164. [Google Scholar] [CrossRef]
  10. Biot, M.A. Theory of propagation of elastic waves in a fluid-saturated porous solid, I: Low frequency range. J. Acoust. Soc. Am. 1956, 28, 168–178. [Google Scholar] [CrossRef]
  11. Biot, M.A. Theory of propagation of elastic waves in a fluid-saturated porous solid, II: Higher frequency range. J. Acoust. Soc. Am. 1956, 28, 179–191. [Google Scholar] [CrossRef]
  12. Biot, M.A. Mechanics of deformation and acoustic propagation in porous media. J. Appl. Phys. 1962, 33, 1482–1498. [Google Scholar] [CrossRef]
  13. Mavko, G.; Mukerji, T.; Dvorkin, J. The Rock Physics Handbook: Tools for Seismic Analysis of Porous Media, 2nd ed.; Cambridge University Press: Cambridge, UK, 2009. [Google Scholar]
  14. Murphy, W.F. Effects of partial water saturation on attenuation in Massilon sandstone and Vycor porous glass. J. Acoust. Soc. Am. 1982, 71, 1458–1468. [Google Scholar] [CrossRef]
  15. Carcione, J.M.; Picotti, S. P-wave seismic attenuation by slow-wave diffusion: Effects of inhomogeneous rock properties. Geophysics 2006, 71, 1–8. [Google Scholar] [CrossRef] [Green Version]
  16. Deng, J.X.; Wang, S.X.; Du, W. A study of the influence of mesoscopic pore fluid flow on the propagation properties of compressional wave-A case of periodic layered porous media. Chin. J. Geophys. 2012, 55, 2716–2727. (In Chinese) [Google Scholar]
  17. Wang, D.X. Study on the rock physics model of gas reservoirs in tight sandstone. Chin. J. Geophys. 2016, 59, 4603–4622. (In Chinese) [Google Scholar]
  18. Ba, J.; Xu, W.H.; Fu, L.Y.; Carcione, J.M.; Zhang, L. Rock anelasticity due to patchy saturation and fabric heterogeneity, A double double-porosity model of wave propagation. J. Geophys. Res. Solid Earth 2017, 122, 1949–1976. [Google Scholar] [CrossRef]
  19. Ba, J.; Ma, R.P.; Carcione, J.M.; Picotti, S. Ultrasonic wave attenuation dependence on saturation in tight oil siltstones. J. Pet. Sci. Eng. 2019, 179, 1114–1122. [Google Scholar] [CrossRef]
  20. White, J.E. Computed seismic speeds and attenuation in rocks with partial gas saturation. Geophysics 1975, 40, 224–232. [Google Scholar] [CrossRef]
  21. Dutta, N.C.; Odé, H. Attenuation and dispersion of compressional waves in fluid-filled porous rocks with partial gas saturation (White model)-Part I: Biot theory. Geophysics 1979, 44, 1777–1788. [Google Scholar] [CrossRef]
  22. Johnson, D.L. Theory of frequency dependent acoustics in patchy-saturated porous media. J. Acoust. Soc. Am. 2001, 110, 682–694. [Google Scholar] [CrossRef] [Green Version]
  23. Liu, J.; Ma, J.W.; Yang, H.Z. Research on P-wave’s propagation in White′s sphere model with patchy saturation. Chin. J. Geophys. 2010, 53, 954–962. (In Chinese) [Google Scholar]
  24. Mavko, G.; Nur, A. Melt squirt in the asthenosphere. J. Geophys. Res. 1975, 80, 1444–1448. [Google Scholar] [CrossRef]
  25. Carcione, J.M.; Gurevich, B. Differential form and numerical implementation of Biot’s poroelasticity equations with squirt dissipation. Geophysics 2011, 76, N55–N64. [Google Scholar] [CrossRef]
  26. Dvorkin, J.; Nur, A. Dynamic poroelasticity: A unified model with the squirt and the Biot mechanics. Geophysics 1993, 58, 524–533. [Google Scholar] [CrossRef]
  27. Gassmann, F. Uber die Elasticität Poröser Medien (On the elasticity of porous media. Vierteljahrsschr. Nat. Ges. Zürich 1951, 96, 1–23. [Google Scholar]
  28. Dvorkin, J.; Nolen-Hoeksema, R.; Nur, A. The squirt-flow mechanism: Macroscopic description. Geophysics 1994, 59, 428–438. [Google Scholar] [CrossRef] [Green Version]
  29. Wood, A.B. A Textbook of Sound; Bell: London, UK, 1941. [Google Scholar]
  30. Dvorkin, J.; Mavkon, G.; Nur, A. Squirt flow in fully saturated rocks. Geophysics 1995, 60, 97–107. [Google Scholar] [CrossRef]
  31. Wu, C.F.; Ba, J.; Carcione, J.M.; Fu, L.Y.; Chesnokov, E.M.; Zhang, L. A squirt-flow theory to model wave anelasticity in rocks. Phys. Earth Planet. Inter. 2020, 301, 106450. [Google Scholar] [CrossRef]
  32. Mavko, G.; Jizba, D. Estimating grain-scale fluid effects on velocity dispersion in rocks. Geophysics 1991, 56, 1940–1949. [Google Scholar] [CrossRef]
  33. Gurevich, B.; Makarynska, D.; de Paula, O.B.; Pervukhina, M. A simple model for squirt-flow dispersion and attenuation in fluid-saturated granular rocks. Geophysics 2010, 75, N109–N120. [Google Scholar] [CrossRef]
  34. Murphy, W.F.; Winkler, K.W.; Kleinberg, R.L. Acoustic relaxation in sedimentary rocks, dependence on grain contacts and fluid saturation. Geophysics 1986, 51, 757–766. [Google Scholar] [CrossRef]
  35. Pride, S.R.; Berryman, J.G.; Harris, J.M. Seismic attenuation due to wave-induced flow. J. Geophys. Res. Solid Earth 2004, 109, B01201. [Google Scholar] [CrossRef]
  36. Le, R.; Guéguen, M.Y.; Chelidze, T. Elastic wave velocities in partially saturated rocks: Saturation hysteresis. J. Geophys. Res. Solid Earth 1996, 101, 837–844. [Google Scholar]
  37. Tang, X.M. A unified theory for elastic wave propagation through porous media containing cracks-An extension of Biot’s poroelastic wave theory. Sci. China Earth Sci. 2011, 41, 784–795. [Google Scholar] [CrossRef]
  38. Jin, Z.Y.; Chapman, M.; Papageorgiou, G. Frequency-dependent anisotropy in a partially saturated fractured rock. Geophys. J. Int. 2018, 215, 1985–1998. [Google Scholar] [CrossRef] [Green Version]
  39. Zhang, L.; Ba, J.; Fu, L.; Carcione, J.M.; Cao, C. Estimation of pore microstructure by using the static and dynamic moduli. Int. J. Rock Mech. Min. Sci. 2019, 113, 24–30. [Google Scholar] [CrossRef]
  40. Zhang, L.; Ba, J.; Carcione, J.M. Wave propagation in infinituple-porosity media. J. Geophys. Res. Solid Earth 2021, 126, e2020JB021266. [Google Scholar] [CrossRef]
  41. Rubino, J.G.; Holliger, K. Research note: Seismic attenuation due to wave-induced fluid flow at microscopic and mesoscopic scales. Geophys. Prospect. 2013, 51, 369–379. [Google Scholar] [CrossRef]
  42. Li, D.Q.; Wei, J.X.; Di, B.R.; Ding, P.B.; Huang, S.Q.; Shuai, D. Experimental study and theoretical interpretation of saturation effect on ultrasonic velocity in tight sandstones under different pressure conditions. Geophys. J. Int. 2018, 212, 2226–2237. [Google Scholar] [CrossRef]
  43. Sun, W.T. On the theory of Biot-patchy-squirt mechanism for wave propagation in partially saturated double-porosity medium. Phys. Fluids 2021, 33, 076603. [Google Scholar] [CrossRef]
  44. Carcione, J.M.; Helle, H.B.; Pham, N.H. White’s model for wave propagation in partially saturated rocks: Comparison with poroelastic numerical experiments. Geophysics 2003, 68, 1389–1398. [Google Scholar] [CrossRef]
  45. Toksöz, M.N.; Johnston, D.H. Seismic Wave Attenuation; Geophysics Reprint Series; Society of Exploration Geophysicists: Tulsa, OK, USA, 1981. [Google Scholar]
  46. Guo, M.Q.; Fu, L.Y.; Ba, J. Comparison of stress-associated coda attenuation and intrinsic attenuation from ultrasonic measurements. Geophys. J. Int. 2009, 178, 447–456. [Google Scholar] [CrossRef] [Green Version]
  47. Yan, X.F.; Yao, F.C.; Cao, H.; Ba, J.; Hu, L.L.; Yang, Z.F. Analyzing the mid-low porosity sandstone dry frame in central Sichuan based on effective medium theory. Appl. Geophys. 2011, 8, 163–170. [Google Scholar] [CrossRef]
  48. Ma, R.P.; Ba, J. Coda and intrinsic attenuations from ultrasonic measurements in tight siltstones. J. Geophys. Res. Solid Earth 2020, 125, e2019JB018825. [Google Scholar] [CrossRef]
  49. Deng, J.X.; Zhou, H.; Wang, H.; Zhao, J.G. The influence of pore structure in reservoir sandstone on dispersion properties of elastic waves. Chin. J. Geophys. 2015, 58, 3389–3400. (In Chinese) [Google Scholar]
  50. Song, L.T.; Wang, Y.; Liu, Z.H.; Wang, Q. Elastic anisotropy characteristics of tight sands under different confining pressures and fluid saturation states. Chin. J. Geophys. 2015, 58, 3401–3411. (In Chinese) [Google Scholar]
  51. Chen, Y.; Huang, T.F.; Liu, E.R. Rock Physics; China University of Science and Technology Press: Hefei, China, 2009. (In Chinese) [Google Scholar]
  52. David, E.C.; Zimmerman, R.W. Pore structure model for elastic wave velocities in fluid-saturated sandstones. J. Geophys. Res. Solid Earth 2012, 117, B07210. [Google Scholar] [CrossRef]
  53. Ba, J.; Zhang, L.; Wang, D.; Yuan, Z.; Cheng, W.; Ma, R.; Wu, C. Experimental analysis on P-wave attenuation in carbonate rocks and reservoir identification. J. Seism. Explor. 2018, 27, 371–402. [Google Scholar]
  54. Lucet, N.; Zinszner, B. Effects of heterogeneities and anisotropy on sonic and ultrasonic attenuation in rocks. Geophysics 1992, 57, 1018–1026. [Google Scholar] [CrossRef]
  55. Pang, M.Q.; Ba, J.; Ma, R.P.; Chen, T.S. Analysis of attenuation rock-physics template of tight sandstones: Reservoir microcrack prediction. Chin. J. Geophys. 2020, 63, 281–295. (In Chinese) [Google Scholar]
  56. Amalokwu, K.; Papageorgiou, G.; Chapman, M.; Best, A.I. Modelling ultrasonic laboratory measurements of the saturation dependence of elastic modulus: New insights and implications for wave propagation mechanisms. Int. J. Greenh. Gas Control 2017, 59, 148–159. [Google Scholar] [CrossRef] [Green Version]
  57. Wei, Y.J.; Ba, J.; Ma, R.P.; Zhang, L.; Carcione, J.M.; Guo, M.Q. Effect of effective pressure change on pore structure and elastic wave responses in tight sandstones. Chin. J. Geophys. 2020, 63, 2810–2822. (In Chinese) [Google Scholar]
  58. Sun, Y.Y.; Carcione, J.M.; Gurevich, B. Squirt-flow seismic dispersion models: A comparison. Geophys. J. Int. 2020, 222, 2068–2082. [Google Scholar] [CrossRef]
  59. Batzle, M.L.; Wang, Z.J. Seismic properties of pore fluids. Geophysics 1992, 57, 1396–1408. [Google Scholar] [CrossRef]
  60. Carcione, J.M. Wave Fields in Real Media. In Theory and Numerical Simulation of Wave Propagation in Anisotropic, Anelastic, Porous and Electromagnetic Media, 3rd ed.; Elsevier: Amsterdam, The Netherlands, 2014. [Google Scholar]
  61. Helle, H.B.; Pham, N.H.; Carcione, J.M. Velocity and attenuation in partially saturated rocks: Poroelastic numerical experiments. Geophys. Prospect. 2003, 55, 551–566. [Google Scholar] [CrossRef] [Green Version]
  62. Shapiro, S.A. Elastic piezosensitivity of porous and crackd rocks. Geophysics 2003, 68, 482–486. [Google Scholar] [CrossRef]
Figure 1. A new model based on a reformulated modified frame squirt flow (MFS) model with the White theory. The effects of squirt flow occurring between soft and stiff pores in the water-saturated host medium are incorporated by using an equivalent host medium of a modified solid (the MFS model). On the other hand, the White theory describes the anelasticity due to the patchy saturation of the immiscible fluid mixture.
Energies 14 07619 g001
Figure 2. P-wave velocity (a) and attenuation (b) of the present and MFS models. The number between parentheses indicates water saturation.
Energies 14 07619 g002
Figure 3. P-wave velocity (a) and attenuation (b) of the present model as a function of water saturation and various permeabilities.
Energies 14 07619 g003
Figure 4. P-wave velocity (a) and attenuation (b) of the present model as a function of water saturation for different values of the outer diameter.
Energies 14 07619 g004
Figure 5. Thin section image of a tight sandstone.
Energies 14 07619 g005
Figure 6. P-(a) and S-(b) wave velocities as a function of effective pressure at different water saturations.
Energies 14 07619 g006
Figure 7. P-wave attenuation as a function of effective pressure and saturation.
Energies 14 07619 g007
Figure 8. Microcrack density (a) and porosity (b) as a function of effective pressure.
Energies 14 07619 g008
Figure 9. P-wave velocity as a function of the effective pressure compared to the experimental data. Results at different squirt flow lengths are shown.
Energies 14 07619 g009
Figure 10. P-wave velocity (a) and attenuation (b) as a function of water saturation at 5 MPa. The open circles correspond to the experimental data.
Energies 14 07619 g010
Figure 11. P-wave velocity (a) and attenuation (b) as a function of water saturation at 15 MPa. The open circles correspond to the experimental data.
Energies 14 07619 g011
Figure 12. P-wave velocity (a) and attenuation (b) as a function of water saturation at 25 MPa. The open circles correspond to the experimental data.
Energies 14 07619 g012
Figure 13. P-wave velocity (a) and attenuation (b) as a function of water saturation at 35 MPa. The open circles correspond to the experimental data.
Energies 14 07619 g013
Figure 14. P-wave velocity (a) and attenuation (b) as a function of water saturation at 45 MPa. The open circles correspond to the experimental data.
Energies 14 07619 g014
Figure 15. Crossplots of the measured and theoretical velocities at different water saturations (a) and effective pressures (b).
Energies 14 07619 g015
Figure 16. Crossplots of the measured and theoretical dissipation factors at different water saturations (a) and effective pressures (b).
Energies 14 07619 g016
Table 1. Rock physical properties.
Mineral density (kg/m3)2650Porosity (%)10
Mineral mixture bulk modulus (GPa)38Water bulk modulus (GPa)2.25
Dry rock bulk modulus (GPa)17Gas bulk modulus (GPa)0.0022
Dry rock shear modulus (GPa)12.6Water density (kg/m3)1000
Permeability (mD)1Gas density (kg/m3)1.2
Squirt flow length (mm)0.01Water viscosity (Pa·s)0.001
High-pressure modulus (GPa)22Gas viscosity (Pa·s)0.00011
Crack porosity (%)0.02External diameter (m)0.0005
Publisher’s Note: MDPI stays neutral with regard to jurisdictional claims in published maps and institutional affiliations.

