Article

Conceptual Design and Hydrodynamic Performance of a Modular Hybrid Floating Foundation

School of Mechanical Engineering and Automation, Harbin Institute of Technology (Shenzhen), Shenzhen 518055, China
*
Author to whom correspondence should be addressed.
Energies 2021, 14(22), 7605; https://doi.org/10.3390/en14227605
Submission received: 23 October 2021 / Revised: 9 November 2021 / Accepted: 10 November 2021 / Published: 14 November 2021

Abstract

:
The comprehensive utilization of offshore renewable energies is an effective way to solve the intermittency and variability of power supply. This paper aims to present a hybrid floating system (HFS) based on a modular buoyancy-distributed floating foundation (BDFF) that can be equipped with a horizontal-axis wind turbine, solar panels, and wave energy converters (WEC). A simplified test model with a Froude scale ratio of 1/10 is employed to perform the experiments in a deep-water basin to validate the numerical results computed from the code program ANSYS AQWA based on the potential flow theory. The Response Amplitude Operators (RAOs) under regular waves are compared to evaluate the hydrodynamic performance. There is a good agreement in the surge, pitch, and heave RAOs for experiments and the numerical simulation, with a maximum of 6.45 degrees per meter for the pitch motion. Furthermore, the mooring tensions in the time domain are analyzed under different wave conditions.The tension RAOs from simulations are slightly higher than those from measurements with a maximum value at the period of 3.416 s. The mooring line on the windward side has a more considerable mooring tension that is far less than the allowable tensile strength, especially under the wave height of 2 m and the wave period of 2.873 s. The influence of loaded weight representing solar panels is weak, and the impact of winds is acceptable, as the platform deviates 1.3 degrees from the equilibrium state under the test wind speed. Eventually, the effect of irregular waves on the HFS is presented with the critical parameters of mooring tension and pitch motion. The results show that the HFS has a good motion performance.

1. Introduction

Offshore renewable energy has great potential for achieving carbon neutrality in the near future. Wind energy is considered to be one of the most promising renewable energy resources and is expected to generate more than 20% of global electricity by 2050 [1]. The power of ocean waves, wind, and the Sun can be utilized to generate electricity without air pollution by virtue of energy converters such as WECs, wind turbines, and solar panels. This marine equipment needs to be installed on offshore foundations, including fixed and floating foundations. In shallow water areas below 50–60 m in water depth, fixed supports such as monopiles, tripiles, and multipods (tripods, jackets) are the main foundation types. With the increase of water depth, the floating kind of foundation is more economical considering construction and installation costs [2]. The percentage of costs required for “substructures and foundations” out of the capital investment costs at different sites, including onshore (3.5%), shallow-water(14.7%), and deep-water (36.2%), was researched by Maienza et al. [3]. The floating foundation is now attracting increasing numbers of scholars and researchers who aim to improve the hydrodynamic performance and decrease these kinds of costs.
Current floating foundation concepts have mainly originated from the traditional oil and gas industry. Based on their static stability, the TLP (tension-leg platform), the SPAR (Single Point Anchor Reservoir), and the semi-submersible floating foundation (SSFF) are three general categories used to construct the floating foundation stability triangle, in which all floating foundations can be classified [4,5]. Taking offshore wind turbines as an example, various floating foundations have been designed, tested, and even put into commercial application. For the TLP type, the Bluewater Floating Wind TLP [6], the Iberdrola TLPWIND [7], and the PelaStar TLP [8] are TLP floating foundations with three to five taut mooring lines, respectively. For the SPAR type, the first commercial full-scale floating wind farm in the world, called “Hywind Scotland Pilot Park”, has been put into operation off Scotland’s northeast coast since 2017 [9,10]. For the semi-submersible type, the Dutch Tri-floater [11,12] and the WindFloat [13] are both floating foundations stabilized by three columns connected with each other with bracing members, while the OC4-DeepCWind [14] and the NAUTILUS [15] are configured with four columns.
Wind energy, solar energy, and wave energy cannot maintain a continuous supply at peak values. The combination of renewable energy is an efficient and promising solution that can achieve synergistic effects, such as increasing energy conversion efficiency and reducing operation and maintenance [16]. Most hybrid floating foundations combine wind turbines with wave energy converters. The Poseidon P37 (37 m width) developed by Floating Power Plant A/S is an SSFF configured with 311 kW two-bladed wind turbines and 103 kW multi-point-absorber wave energy converters [17]. It is the world’s first floating foundation to have achieved the grid-connected power generation of hybrid wind-wave energy. Moreover, with the mature technology of SSFFs, some hybrid floating concepts have been proposed by integrating WECs directly into an existing floating foundation supported for a wind turbine. The floating foundation of the InSPIRE project, led by TechnipFMC and Bombora, is inspired by the WindFloat, which has been applied in the world’s second commercial full-scale floating wind farm, named WindFloat Atlantic. Using the pressure of waves, special WECs with air-inflated rubber membranes are installed between three columns [18]. Similarly, W2Power, designed by Enerocean, carries multiple oscillating buoys parallel with three columns. Continuous tests of the W2Power from TRL 2–6 have been carried out since 2009 [19].
Solar energy has been considered less frequently since solar panels require a large upper deck on a floating foundation. The Offshore Energy Farm Project (OEFP), with a modular design, was proposed by Kyushu University in Japan. Each module is a hexagonal SSFF consisting of six hollow prestressed concrete columns and prefabricated concrete frames. An 18 m prototype platform equipped with 2 kW solar panels and two 3 kW Windlens turbines was installed in Hakata Bay [20]. The Ocean Hybrid Platform (OHP) developed by SINNPOWER combines wind energy, wave energy, and solar energy. The buoys of WECs provide buoyancy for the whole platform and can slide along the wind turbine [21,22]. In addition, the European Union’s Seventh Framework Program (EU-FP7) has funded several projects such as H2Ocean, TROPOS, and MERMAID, with the aim of developing offshore floating foundations to promote the comprehensive utilization of renewable energy and ocean space in a more effective way [23,24]. A synthesis of the floating solutions mentioned above is given in Table 1.
From the above analysis, the authors have found that most of the literature available on the combined utilization of offshore renewable energy is on the utilization of wave and wind energy rather than solar energy. On the one hand, the water cut plane of the TLP and SPAR is too small to carry solar panels; on the other hand, the SSFF does not have enough space to add a large deck (e.g., the Dutch Tri-floater with three columns) and cannot be easily manufactured modularly (e.g., the OEFP with prefabricated concrete parts).
This paper provides and tests a novel floating foundation that can carry solar panels, wind turbines, and WECs. In Section 2, the design of major components of the HFS is followed by the conceptual design of the BDFF. The experiment site and the layout of the tested model are described in Section 3 as well as the wave conditions and the measuring facilities. The hydrodynamic performance of the HFS, including RAOs, mooring tensions, and the influence of platform weights and wind, is discussed in Section 4 for regular waves. The impact of irregular waves on the HFS is also investigated in this section.

2. Model Descriptions

The capital cost of the foundation, assembly, and installation in deep water is the major component that corresponds to most of the overall cost [3]. We conceived a novel BDFF characterized by a modular design and good extensibility to decrease the manufacturing and installation cost. In this section, the conceptual design of the BDFF is first presented; then, the specific parameters of the HFS are described.

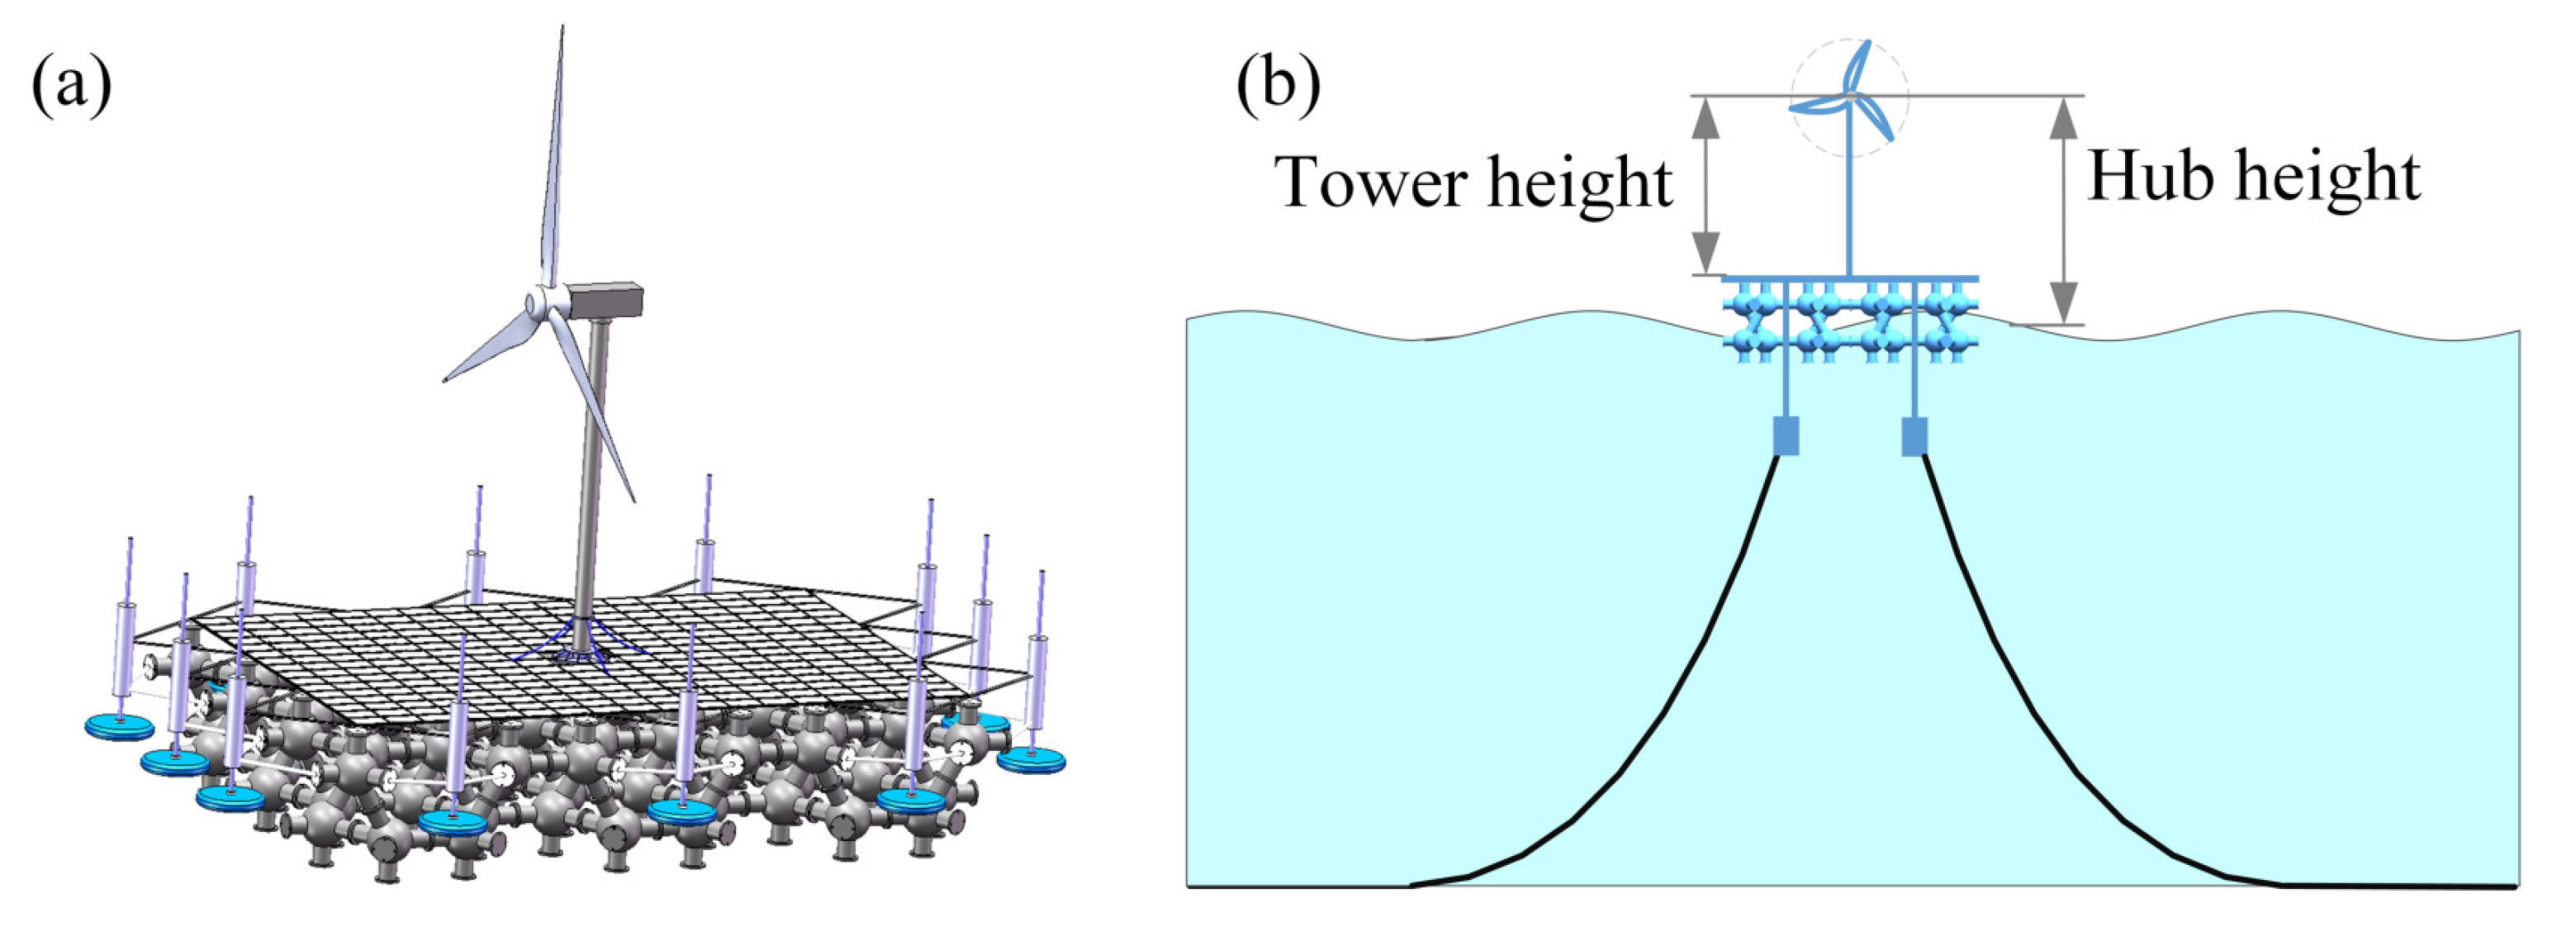
2.1. Modular Conception of Floating Foundation

The BDFF is designed to carry renewable energy equipment such as wind turbines. The BDFF is an application migration of the grid structure from the construction field to offshore structures. In order to provide large buoyancy, poles and nodes of the grid structure are hollow structures fabricated with a larger diameter. A buoyancy module named the five-pole unit with one sphere node and five cylindrical poles was devised as shown in Figure 1a. By matching the five-pole units in certain rules, the BDFF—a bi-layer structure—can be obtained as shown in Figure 1b.
The BDFF comprising identical five-pole units distributes the whole buoyancy evenly over each module. We are of the opinion that the strategy of buoyancy distribution is an easy and low-cost way to build a floating foundation. The size of the BDFF is determined by five parameters: D, d, h, m, n, where D is the diameter of the sphere node, d is the diameter of the cylindrical pole, h is the height of the cylindrical pole, and m and n are the module numbers along the length and width directions, respectively.
L e n g t h = 3 m h , m 2
W i d t h = 2 n sin ( 60 ) + d sin ( 30 ) , n 2
H e i g h t = 2 h + 2 h sin ( 60 )
Moreover, the whole rigidity of the BDFF, as a grid structure, is superfluous without considering the structure deformation caused by gravity and corner constrained force. The honeycomb structure is formed by tightly connecting buoyancy modules through flanges and bolts, as presented in Figure 2. Hexagons with solid and dotted lines are sketched on different layers. In this way, the BDFF can make full use of the advantages of honeycomb structures, such as being lightweight, requiring fewer materials, and having a high strength and stiffness. The size of the BDFF used for experiments is also illustrated in Figure 2. The Froude scaling ratio between the prototype and the test model is chosen as 10:1.
The main characteristics of the proposed BDFF are listed as follows:
  • A minimalist design is mainly used to keep the BDFF as simple as possible;
  • The unique module can be mass-produced in the factory and assembled near the harbor, which could significantly cut the manufacturing and installation cost while shortening the construction time of the platform;
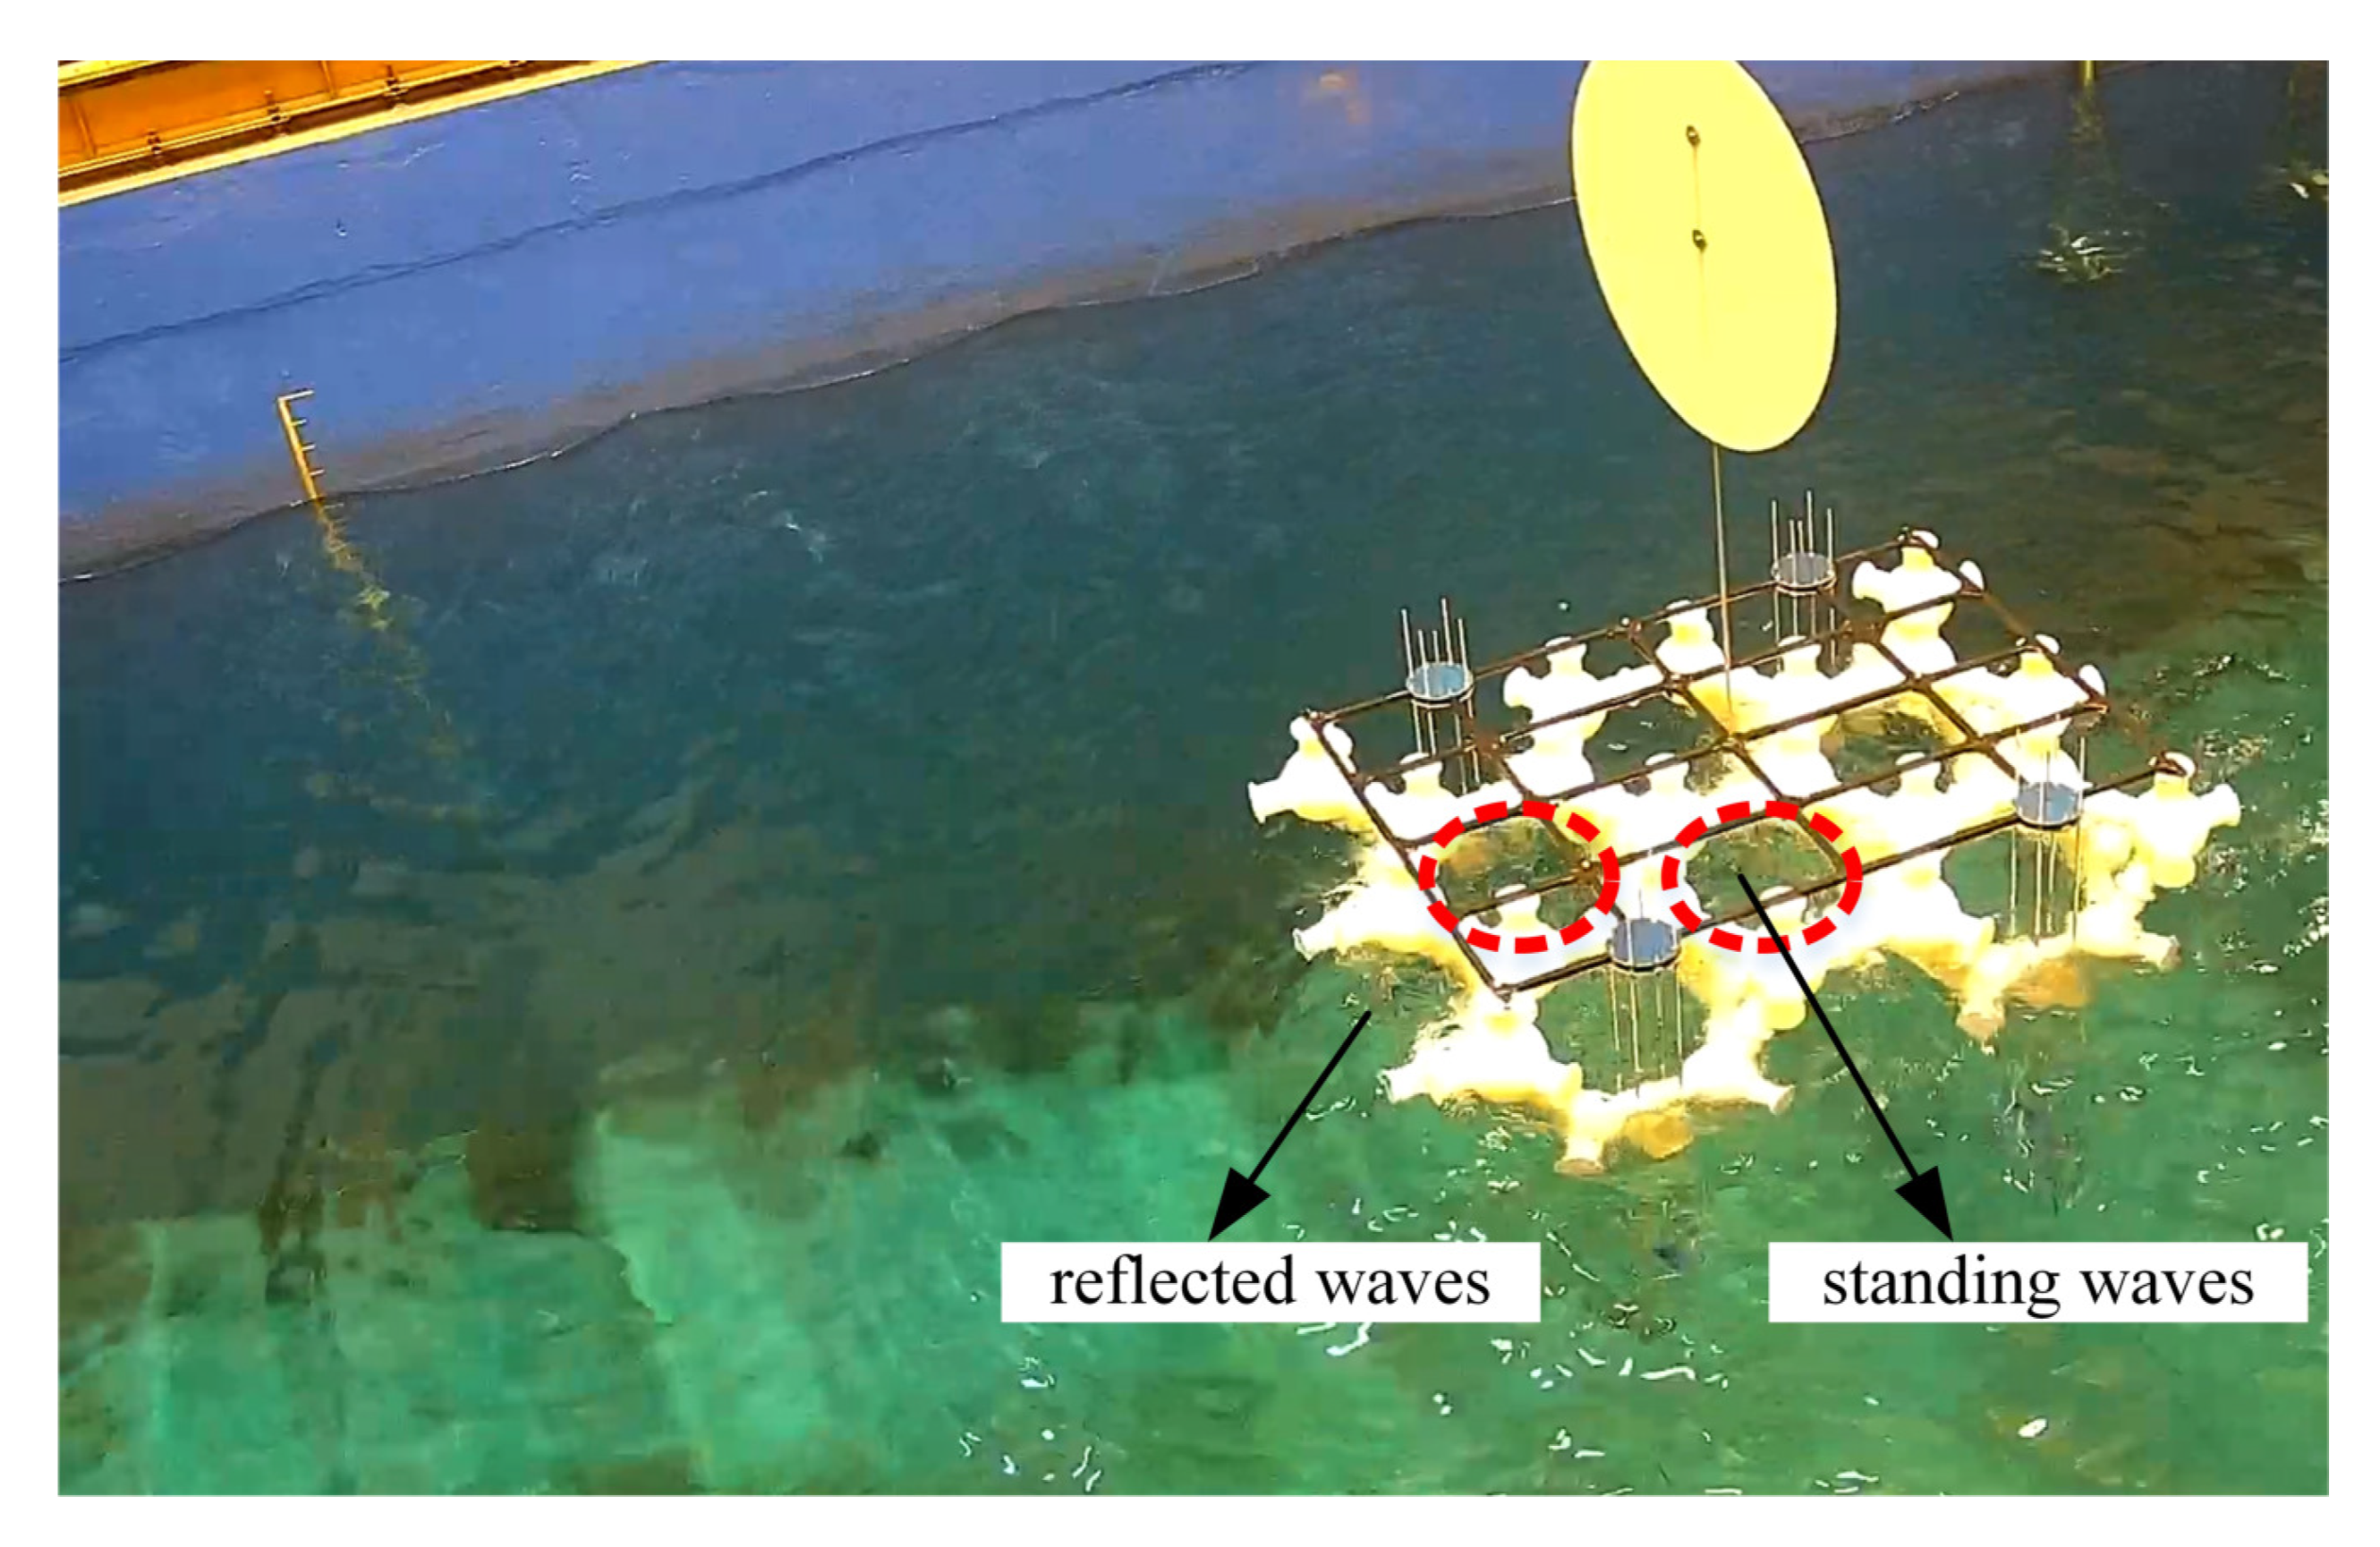
  • The waves with various wavelengths can easily propagate through the BDFF without hogging and sagging as shown in Figure 3.

2.2. Specification of the Superstructures

The superstructures of the developed hybrid floating system consist of different wave converters, such as a wind turbine, solar panels, and WECs, as shown in Figure 4a. Wind and waves do not always exist or merely appear in low energy density, and solar energy can only be collected on sunny days. Therefore, the energy complementarity of winds, waves, and solar radiation is an effective way to provide a continuous energy output. A conventional HAWT with three blades is located at the center of the BDFF. The solar panels are arranged on the upper deck of the BDFF. In our initial design, point absorber WECs like the prototype-based linear generators developed by SINN Power GmbH [25] are adopted and are evenly distributed around the BDFF to make full use of the up-and-down movements of the waves. However, considering the experiment cost, the WECs were neglected, and the solar arrays were replaced by standard weight blocks which were capable of adjusting the draft. Since the wind generator in the lab is limited in space and size, the hub height of the HAWT is set to 2 m (20 m for the prototype) to keep the rotor center aligned with the nozzle center of the wind generator used in the following experiments. Considering that this study mainly focuses on the feasibility verification of the conceptual design of the BDFF, in order to cut costs, the rotors were replaced by a plastic disc of 0.5 m (5 m for the prototype) radius instead of a wind turbine with locked blades whose initial position may influence the gravity center. Moreover, a porous disc mimicking the flow through the blade passage is not considered to guarantee a uniform wind speed on each sector, as it will have a dimension that is much larger than the wind nozzle size. Long-term averaged wind profile in the South China Sea [26] and western nearshore area of Taiwan [27] are used for reference. The wind speed was roughly distributed between 8.07 and 8.89 m/s at height from 10 m to 30 m. The extrapolate wind speed of 8.59 m/s at 20 m is utilized to calculate the output power of a HAWT, which can be expressed as:
P = 1 2 C p ρ π D 2 4 V 3
where C p is the power coefficient, ρ is the air density, D is the rotor diameter, and V is the wind speed. When the maximum power coefficient of 40% is adopted, the output power of the HAWT is 1.4 KW. The final simplified experimental model is presented in Figure 4b.

2.3. Specification of the System

The BDFF using a Froude scale ratio of 1:10 and that is 21.6 m long, 16 m wide, and 6.7 m in depth was designed as shown in Figure 2. Some key features are listed in Table 2. The BDFF is partially submerged in water, and the upper part and superstructures are exposed above the waterline.

2.4. Specification of the Substructures

The floating system is constrained by four identical catenary lines with spread mooring as sketched in Figure 5. The Cartesian coordinate system o-xyz is defined to describe the platform motions and the location relationship between structures and waves. The positions of fairleads and anchors are presented in the o-xyz frame. The open link anchor chains of 75 m in length and 0.3 m in diameter are connected to the fairleads and anchors, respectively. The mooring line mass per unit (in water) is 16.3 kg/m, and the minimum breaking load is 1150 KN. The waves and winds propagate from left to right.

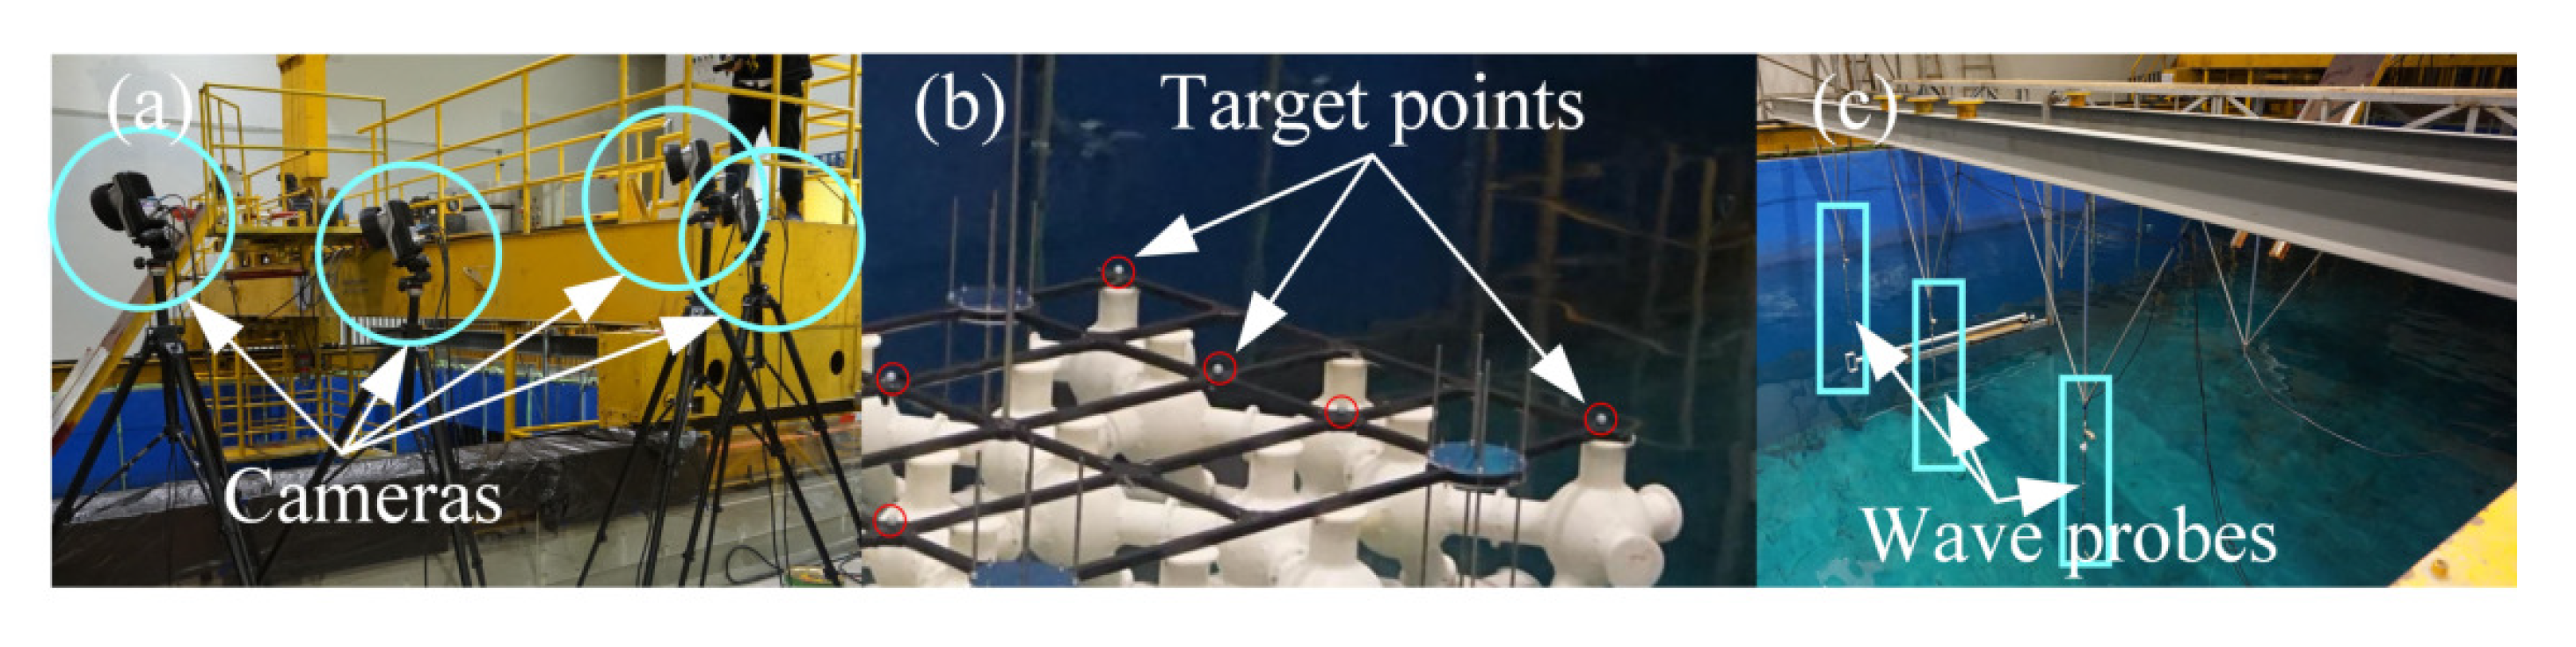
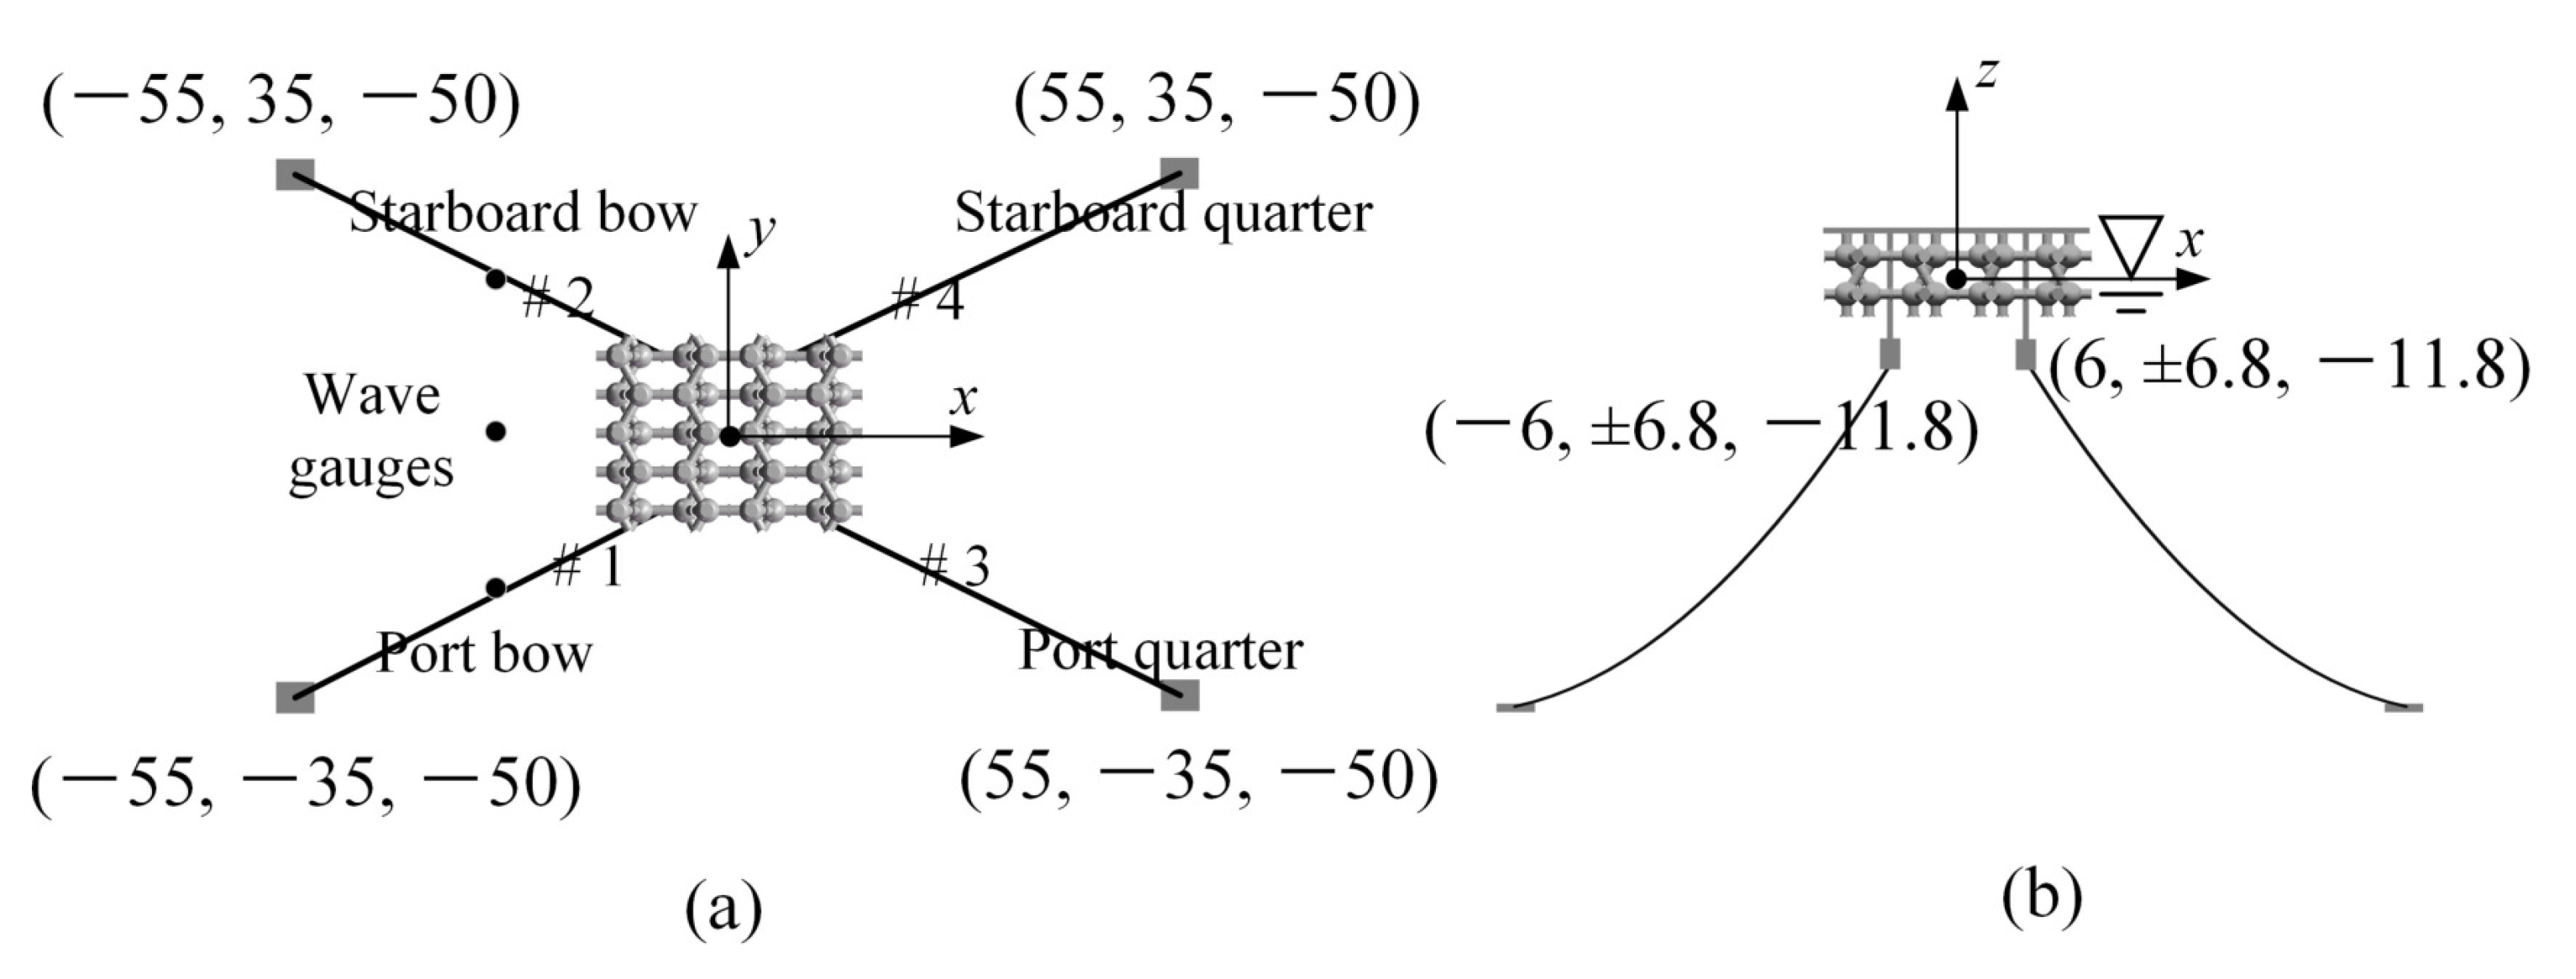
3. Experimental Set-Up

In this section, the water basin for tests is presented in detail, as well as the measuring instruments. The incident regular and irregular waves used are also described.

3.1. Water Basin

The experiment was conducted in a deep wave basin with an effective water depth of 5 m. The wave basin is equipped with a paddle wave maker at the left and a damping zone at the right, as presented in Figure 6. Meanwhile, the wind generator has a large nozzle of 2 m × 1.5 m and is hung two meters above the water plane by a steel jacking truss. Thus, the generated waves below are not affected by the generated winds above.

3.2. Measuring Instruments
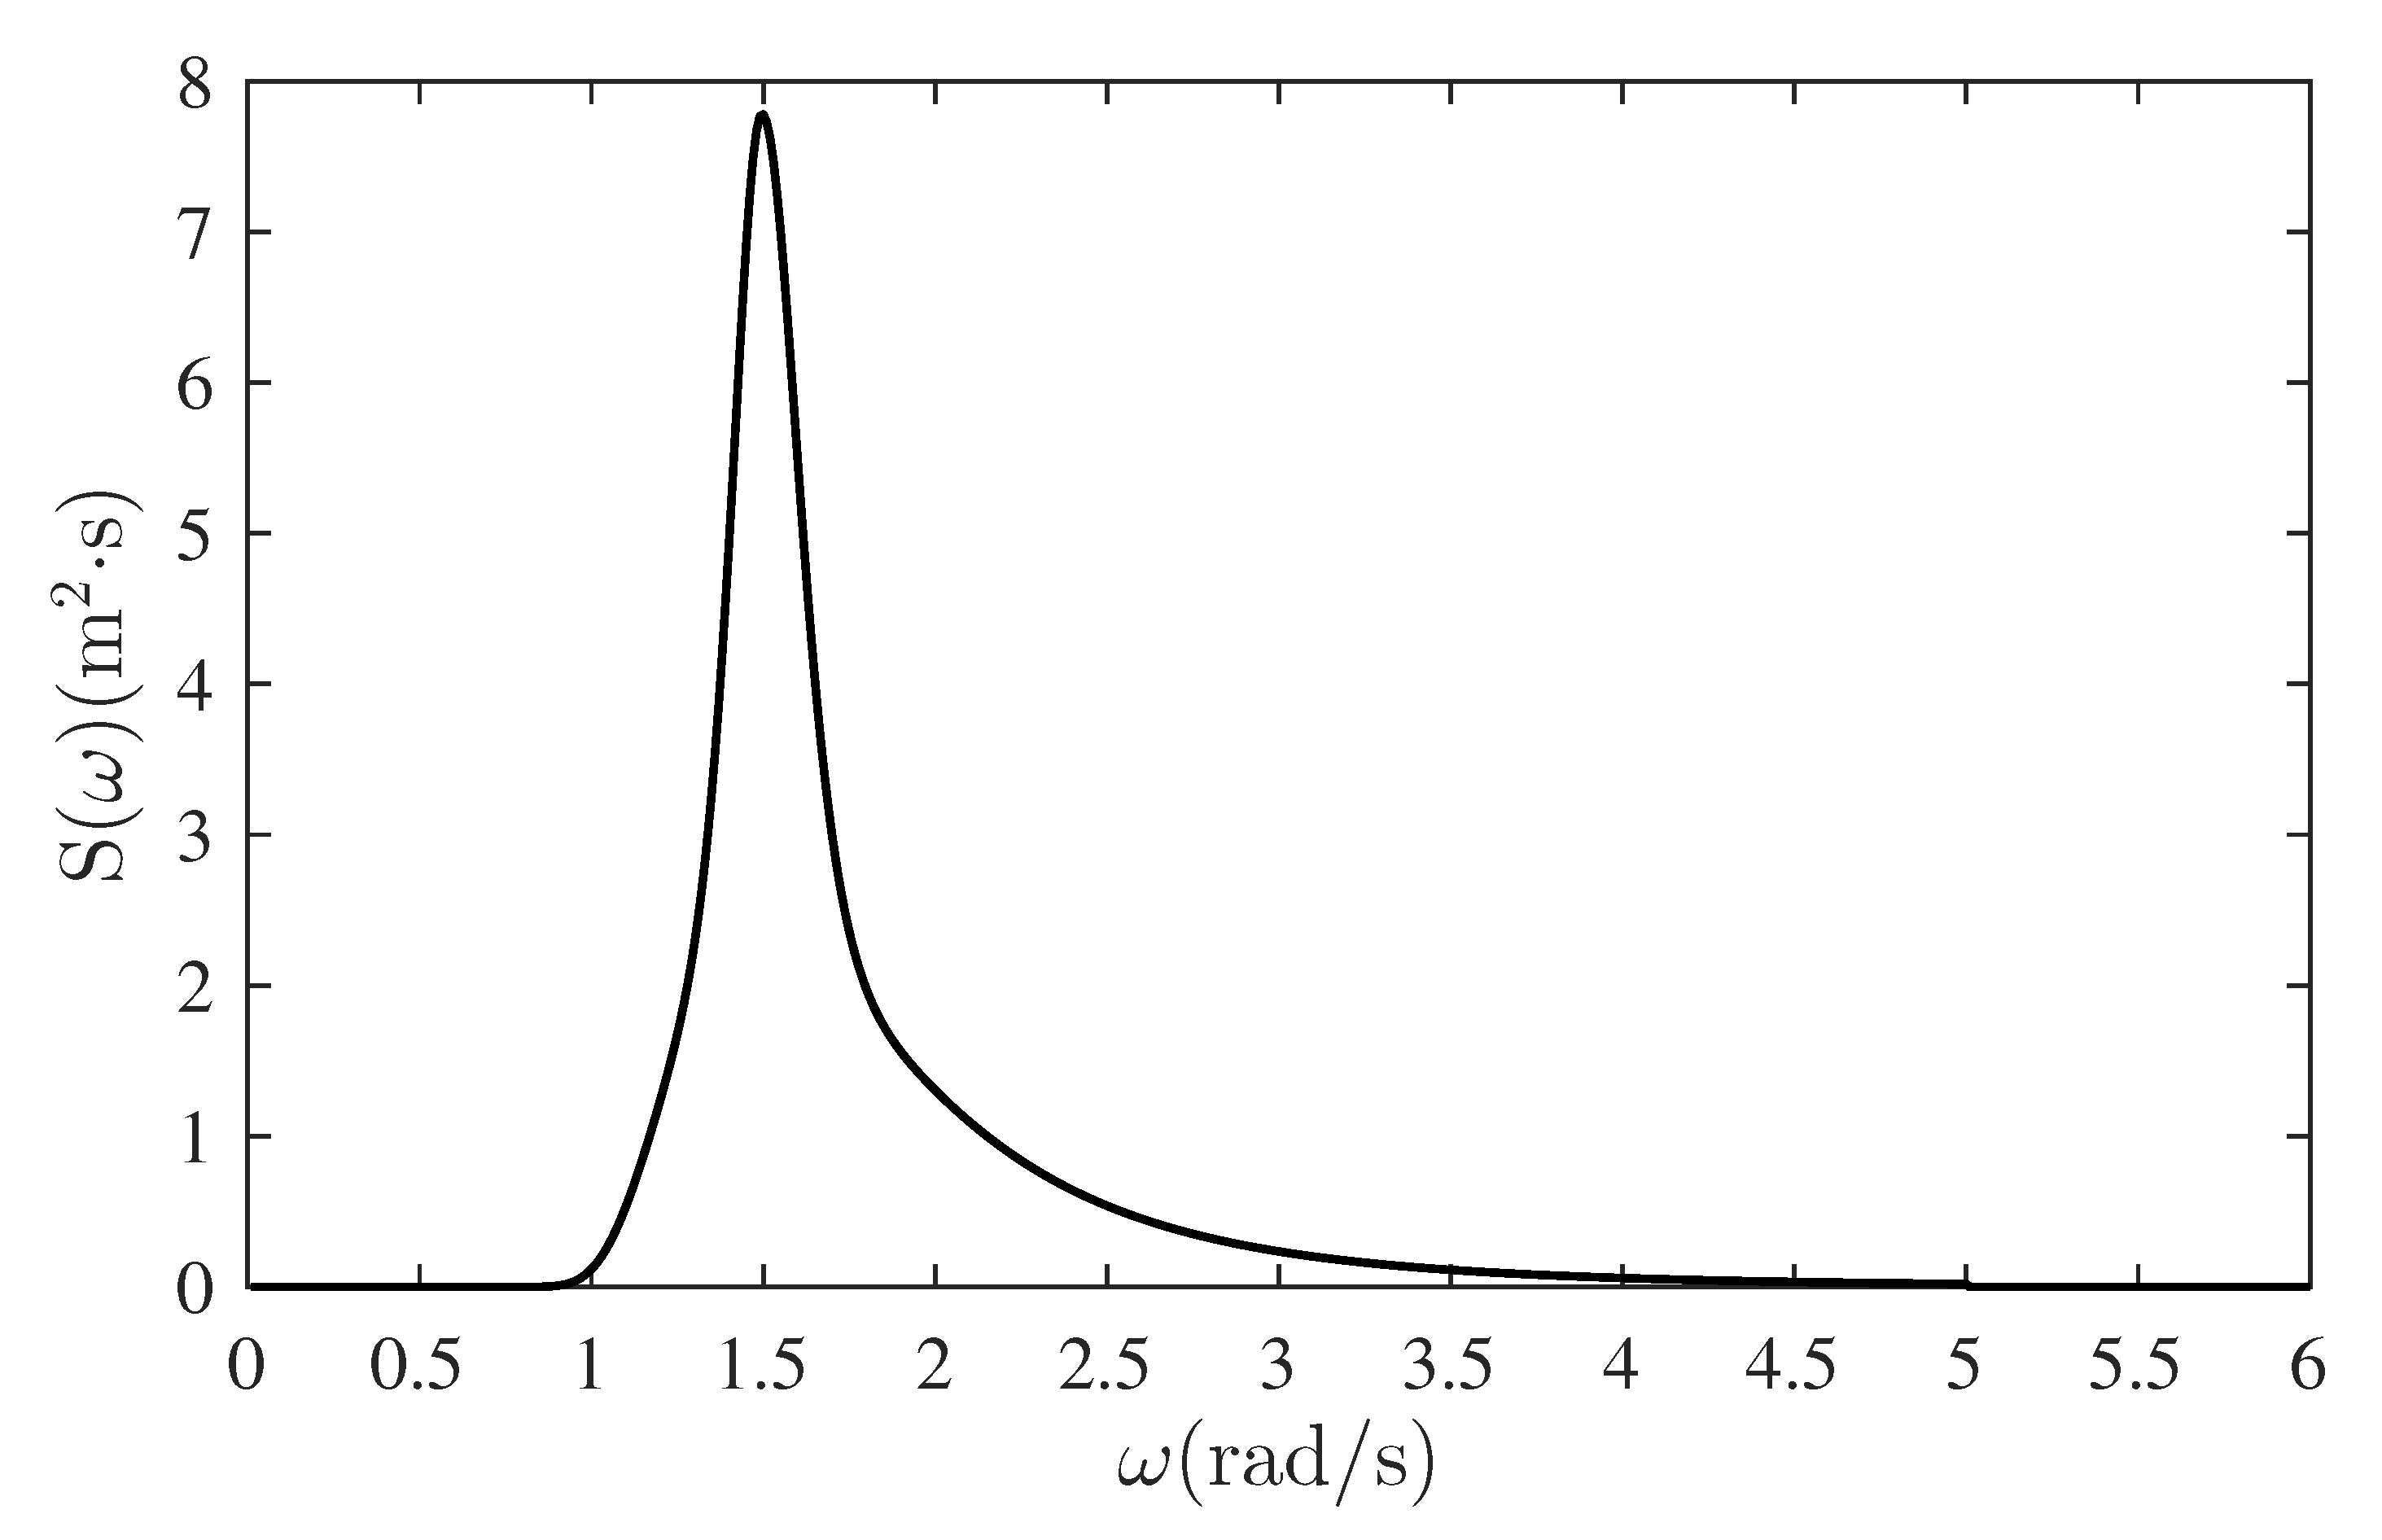
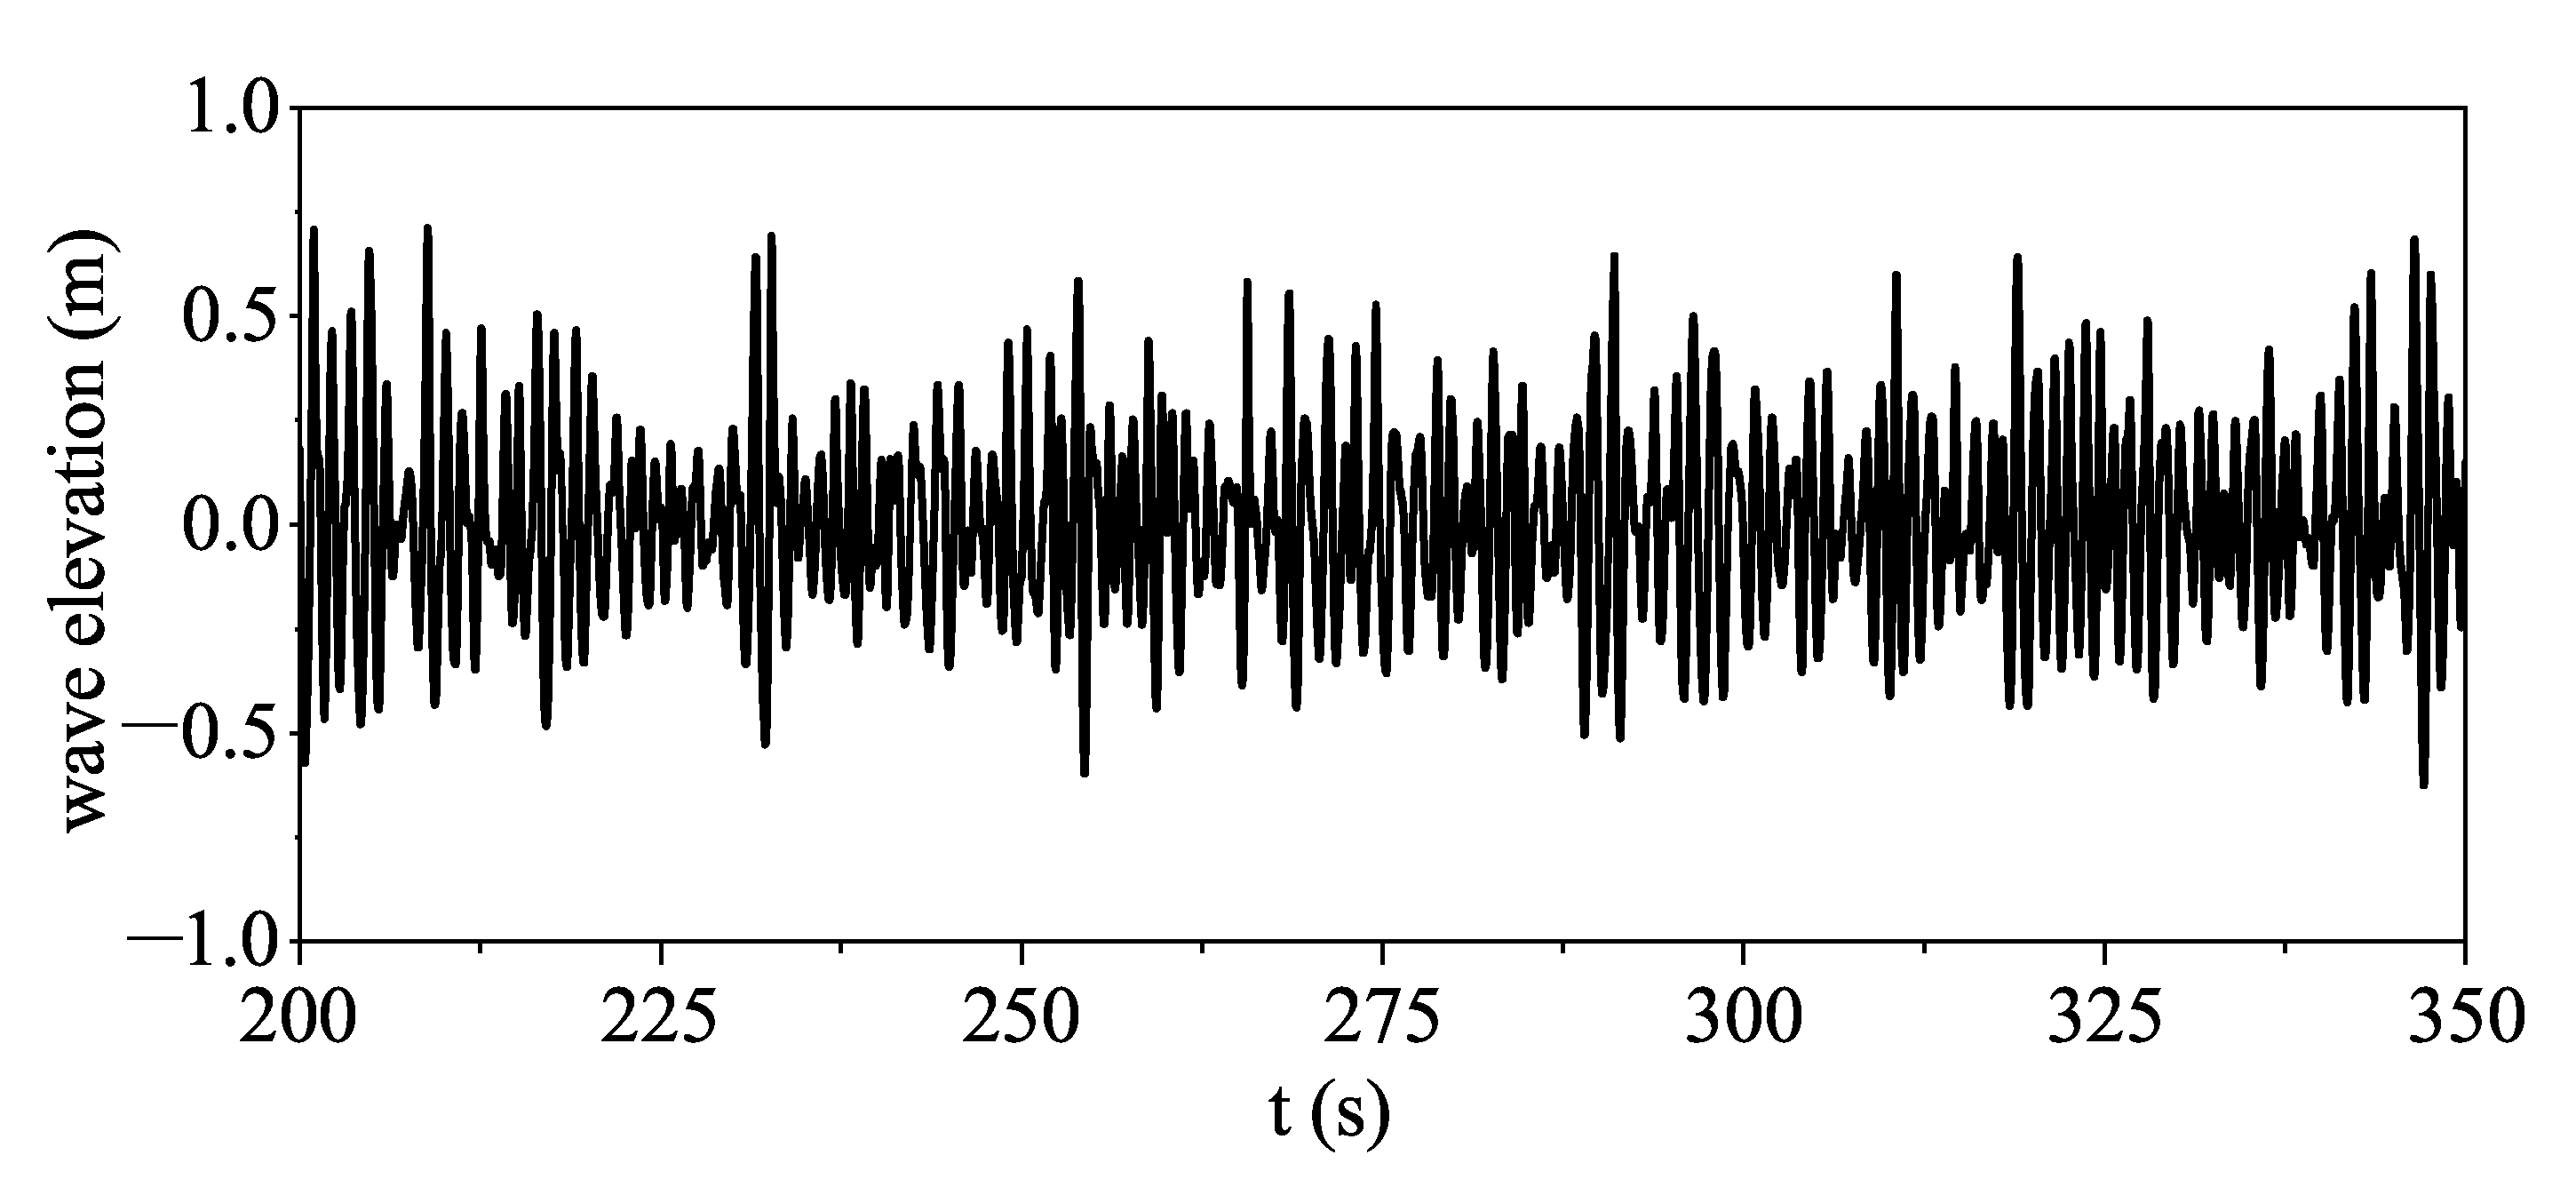
The optical measuring system QUALISYS, consisting of four cameras and nine target points, was utilized to obtain the motion responses in six DOFs. The spherical target points covered with special reflective materials were fixed on the deck as shown in Figure 7. The QUALISYS system was calibrated before tests. Three wave probes on the windward side were placed along the wave propagation direction to record the wave elevation. Load cells with a maximum value of 100 N were attached to the port bow side (mooring line 1) and the port quarter side (mooring line 3) near the fairleader due to the symmetric arrangement.

3.3. Incident Waves

The waves are supposed to propagate in the x-axis direction at all times. In this paper, wave heights of 0.5–2 m were selected along with wave frequencies between 0.127 to 0.348 Hz with an interval of 0.055 Hz, as listed in Table 3.
Furthermore, irregular waves were utilized to obtain the hydrodynamic response and mooring force for the comparison of simulation and experimental results. The JONSWAP (Joint North Sea Wave Project) spectrum represents a fully developed sea, as expressed in the following equation:
S ( ω ) = α g 2 ω 2 e x p 5 4 ω ω p 4 γ b
where S ( ω ) is the wave density spectrum (power spectral density) in [m² s]. The irregular wave defined by a JONSWAP spectrum was selected with a peak spectral period T p of 4.213 s, significant wave height H s of 1 m, and peak enhancement coefficient γ of 3.3. The power spectral density is plotted in Figure 8.
Taking into account the experimental cost, only one irregular wave was selected. The time history of the measured stable wave elevation is plotted in Figure 9.

4. Results

In order to investigate the hydrodynamic performance of the hybrid floating system, scaled model tests were carried out with the system subjected to regular waves combined with steady winds and irregular waves without winds. The following data are given without scaling.

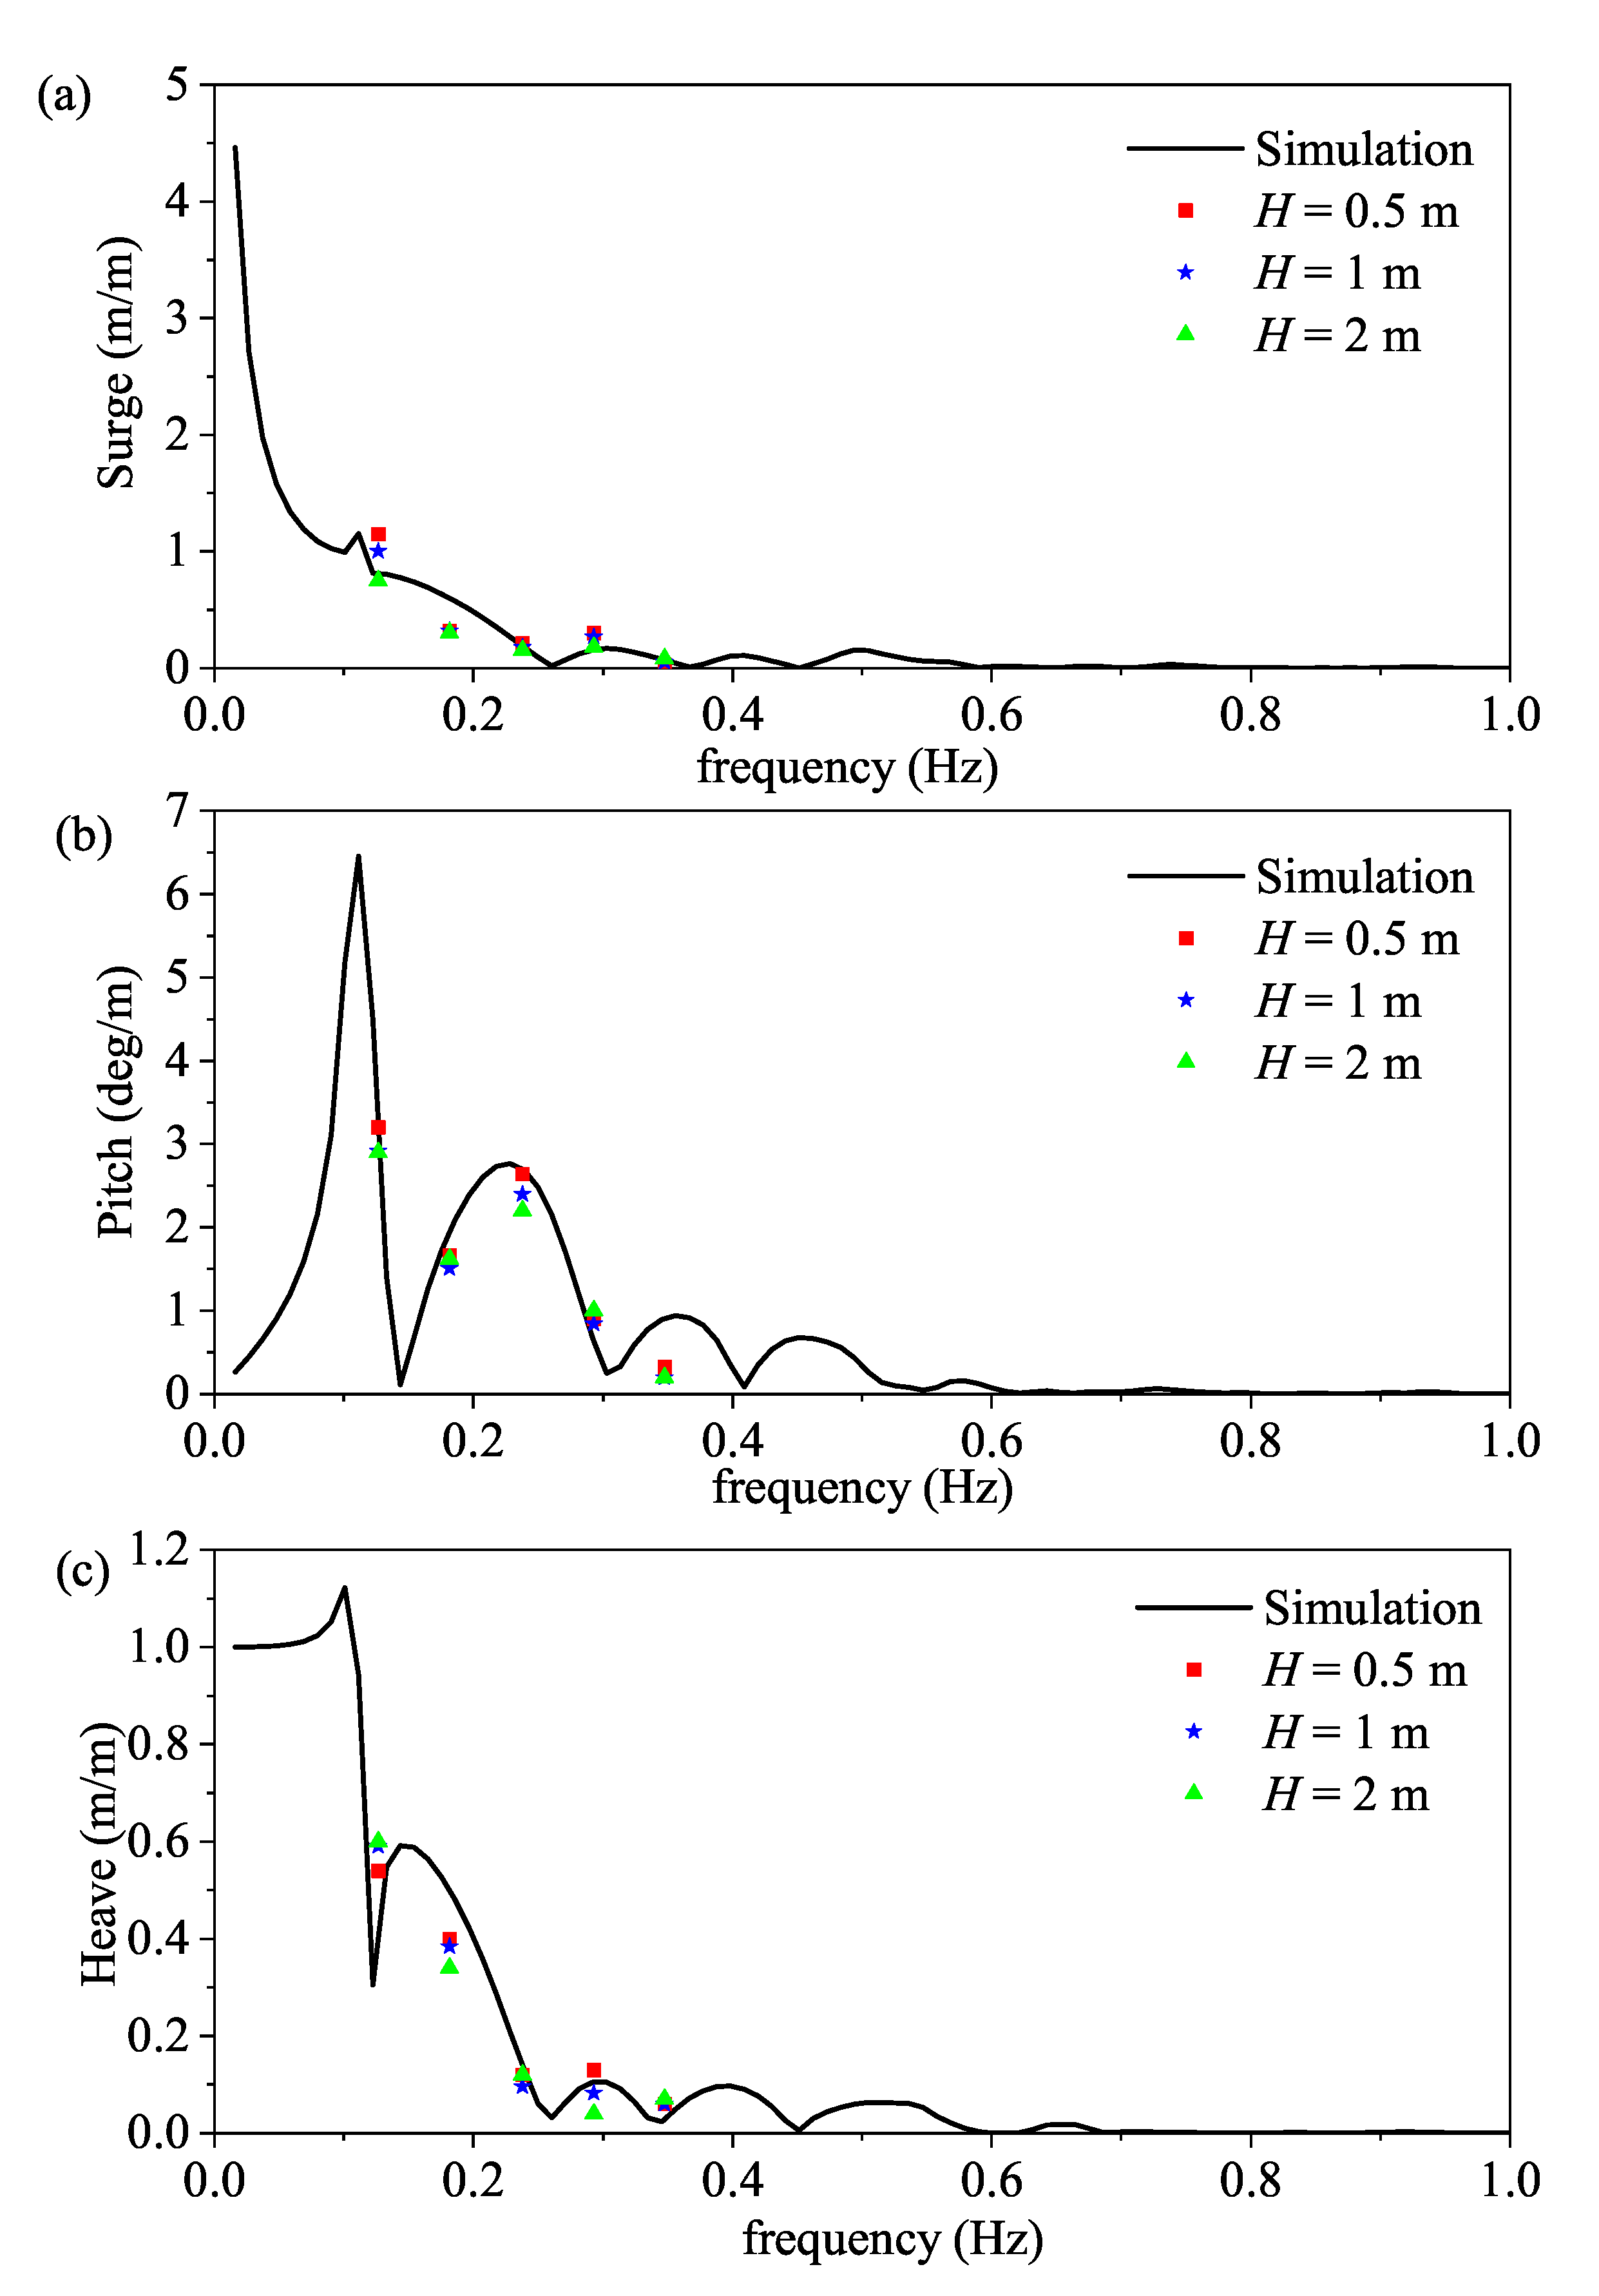
4.1. Response Amplitude Operator

The RAO is a significant parameter reflecting the system response.The motion amplitude in each direction is divided by the incident wave amplitude ζ a to be dimensionless. The indicators are listed in Table 4.
The numerical hydrodynamic responses on the HFS were derived in the diffraction and radiation solver ANSYS AQWA with the potential flow theory. This has been utilized extensively in the offshore engineering domain, integrating both frequency and time-domain analysis. The geometry model of our floating platform was designed in the Solidworks software and then imported to the AQWA as a surface body. In total, 35,769 elements represented the structure surface, which were a series of diffraction panels in the three-dimensional panel methods. Since the potential theory ignores the viscosity, 5% of the critical damping was confirmed from the empirical value and the decay test and then used as viscous damping to calculate the hydrodynamic performance. The motion response was obtained by solving dynamic equations, where the exciting wave force comes from the potential theory, assuming the floating system was restricted. The Froude–Krylov force and hydrostatic force were also added in the motion dynamic equations. The numerical results were cross-validated by the far-field and near-field solutions in the preliminary stage.
The results of the comparison in Figure 10 are plotted as a function of frequency for three wave heights, and a good agreement of the numerical simulation results compared to measured data is gained, revealing that the numerical model can give an accurate prediction of the fierce interaction between the HFS and the wave. For surge motion, the surge response decreases with the increase of wave frequency. For pitch motion, the pitch response reaches its peak value when the incident frequency arrives at 0.112 Hz—slightly higher than the natural frequency of 0.111 Hz. For heave motion, the heave response reaches a peak at 0.101 Hz and then drops, except for a local rebound at 0.143 Hz.
However, the simulation results of pitch motion in the high-frequency range (e.g., 0.182 Hz) are overestimated. The reason for this observation is the wave attenuation that is caused by standing waves, as shown in Figure 11. To distinguish the results more clearly, two dotted circles are drawn to mark the standing waves. The wavelength in the current sea state is greater than the diameter of the sphere node but less than the over-length of the BDFF. Therefore, it can be observed that, in the high-frequency condition, the transmitted waves and the reflected waves meet and collide; then, the standing waves appear between internal cavities formed by the distributed floaters. On the contrary, for long-period waves, the waves can easily propagate through the BDFF, which mitigates the interaction effect between waves and structures.

4.2. Mooring Force

The investigated offshore platform is a semi-submersible floating platform with a spread catenary mooring system. The mooring lines are coupled with the floating platform. In order to ensure the reliability of the mooring system, it is necessary to analyze the mooring tension RAOs of mooring lines under different wave conditions. Each mooring line is discretized into a number of 100 rod elements to compute the mutual interaction force between mooring lines and the floating platform. Each segment of the mooring line can be regarded as uniform and unstretched. The drag loads and added mass effects of mooring lines were included to solve the mooring line dynamics. The numerical simulation lasted 3000 s with a time step of 0.1 s for each case. Load cells of mooring lines 1 and 3 were employed to evaluate the mooring force. The variation in the tension amplitude is normalized with the incident wave height, as can be seen from Figure 12. The tendencies of experimental results are observed to be similar to those of the numerical computations for both fore and rear mooring lines. All the tension RAOs from simulations are slightly higher than those from measurements. The discrepancies between the experimental and numerical data may be due to the non-viscous assumption. Meanwhile, it is seen that tension magnitudes on the seaside are greater than that on the leeside in the low period range, indicating that the seaside movement of the HFS is fiercer. It is also seen that the tension RAO first increases and then decreases with increasing wave periods, showing a local valley value at the period of 4.213 s, which appears both in the fore and rear mooring lines. This can be attributed to the characteristic size of the sphere node and the over-length of the BDFF. Although the buoyancy-distributed design of the floating foundation greatly reduces the cut water-plane area, the wave–structure interaction still exists. The wavelength corresponding to 2.873 s and 3.416 s is greater than the sphere node’s characteristic size but less than the over-length of the BDFF, which causes a fierce wave–structure interaction. The wavelength corresponding to 4.213 s is greater than the over-length of the BDFF, which determines that a complete wave can pass through with a weak interaction effect. However, with the increase of the wave period, the wave energy increases, resulting in a more significant tension RAO. Therefore, the valley value of the tension RAOs appears at 4.213 s, which is a transition period.
When the wave comes from the left in parallel with the basin side, the maximum mooring force appears in the mooring system. The tensions of the most loaded mooring line are picked out to prevent mooring line failure. The peak mobilized tension as a function of the wave period for the kinds of wave conditions of the mooring line in the port bow side is presented in Figure 13. The peak tension of mooring line 1 exhibits large values in the low period range and decreases remarkably when the wave period increases. This is because the long-period waves could easily pass through the BDFF without causing a large response. Instead, a larger wave height brings about a larger peak tension, which is evident in the low period range. The measured peak tension is far less than the allowable tensile strength of the selected mooring chain.

4.3. Influence of Platform Weights

Floating foundations for multiple purposes often can carry new energy equipment, such as wind turbines, solar arrays, WECs, and so on. For the BDFF, a wind turbine and solar arrays are considered. Solar arrays can be mounted on the top of the floating foundation depending on the demand. Here, the influence of solar arrays is studied on the model at the particular wave period of 4.213 s with a wave height of 1 m. In our test, solar arrays are replaced by standard mass blocks. The increasing standard mass on the platform will cause the COG to move up slightly. Figure 14 reveals the motion response as a function of dimensionless time under different weight conditions. The mass blocks considered for this study are 0, 2, 4, and 6 tons. As presented, the motion response periods are not influenced by adding additional loads. Furthermore, the differences in roll and heave response amplitudes observed by loading different mass blocks are fairly small. On the other hand, the effect of varying platform weights on the pitch motion is evident. The pitch stability keeps improving gradually with the increase in platform weights. Around 0.3 degrees of pitch angle is declined when the additional mass added increases to 6 tons; that is, 4.8% of the total displacement as listed in the main parameters of the floating platform in Table 1. At the current wave period, increasing the mass increases the ability to resist wave impact. It is easily concluded that the floating foundation is suitable for carrying solar arrays.

4.4. Influence of Winds

In order to investigate the influence of winds, a simplified wind turbine was installed on the test model. According to the Froude scaling law, a wind velocity of 3.16 m/s was utilized, which corresponds to 10 m/s. The influence of winds is studied on the model at the particular wave period of 4.213 s with a wave height of 1 m. The wave direction is aligned with the wind direction. The test model’s roll, pitch, and heave motions are presented in Figure 15 with and without wind conditions. There are no significant differences in the roll and heave response. Although the roll angle is small, the fluctuation of peak values appears with the wind. Obviously, the influence of wind load on the pitch response is significant. Under the load of the wind, the dynamic balance position does not line up with the initial position, with a position 1.3 degrees away from the equilibrium state. However, the pitch amplitudes are roughly identical for both cases, apart from some exceptions for the wind situation. The exceptions could be explained by the tower and the rotor disc not being rigid enough. The vibration mode of the disc induced by the wind is complicated, as well as that of the tower. In addition, from the graph, it can be seen that the pitch deviation does not affect the heave motion. The reason for this is the weak coupling effect between the pitch and heave motion.

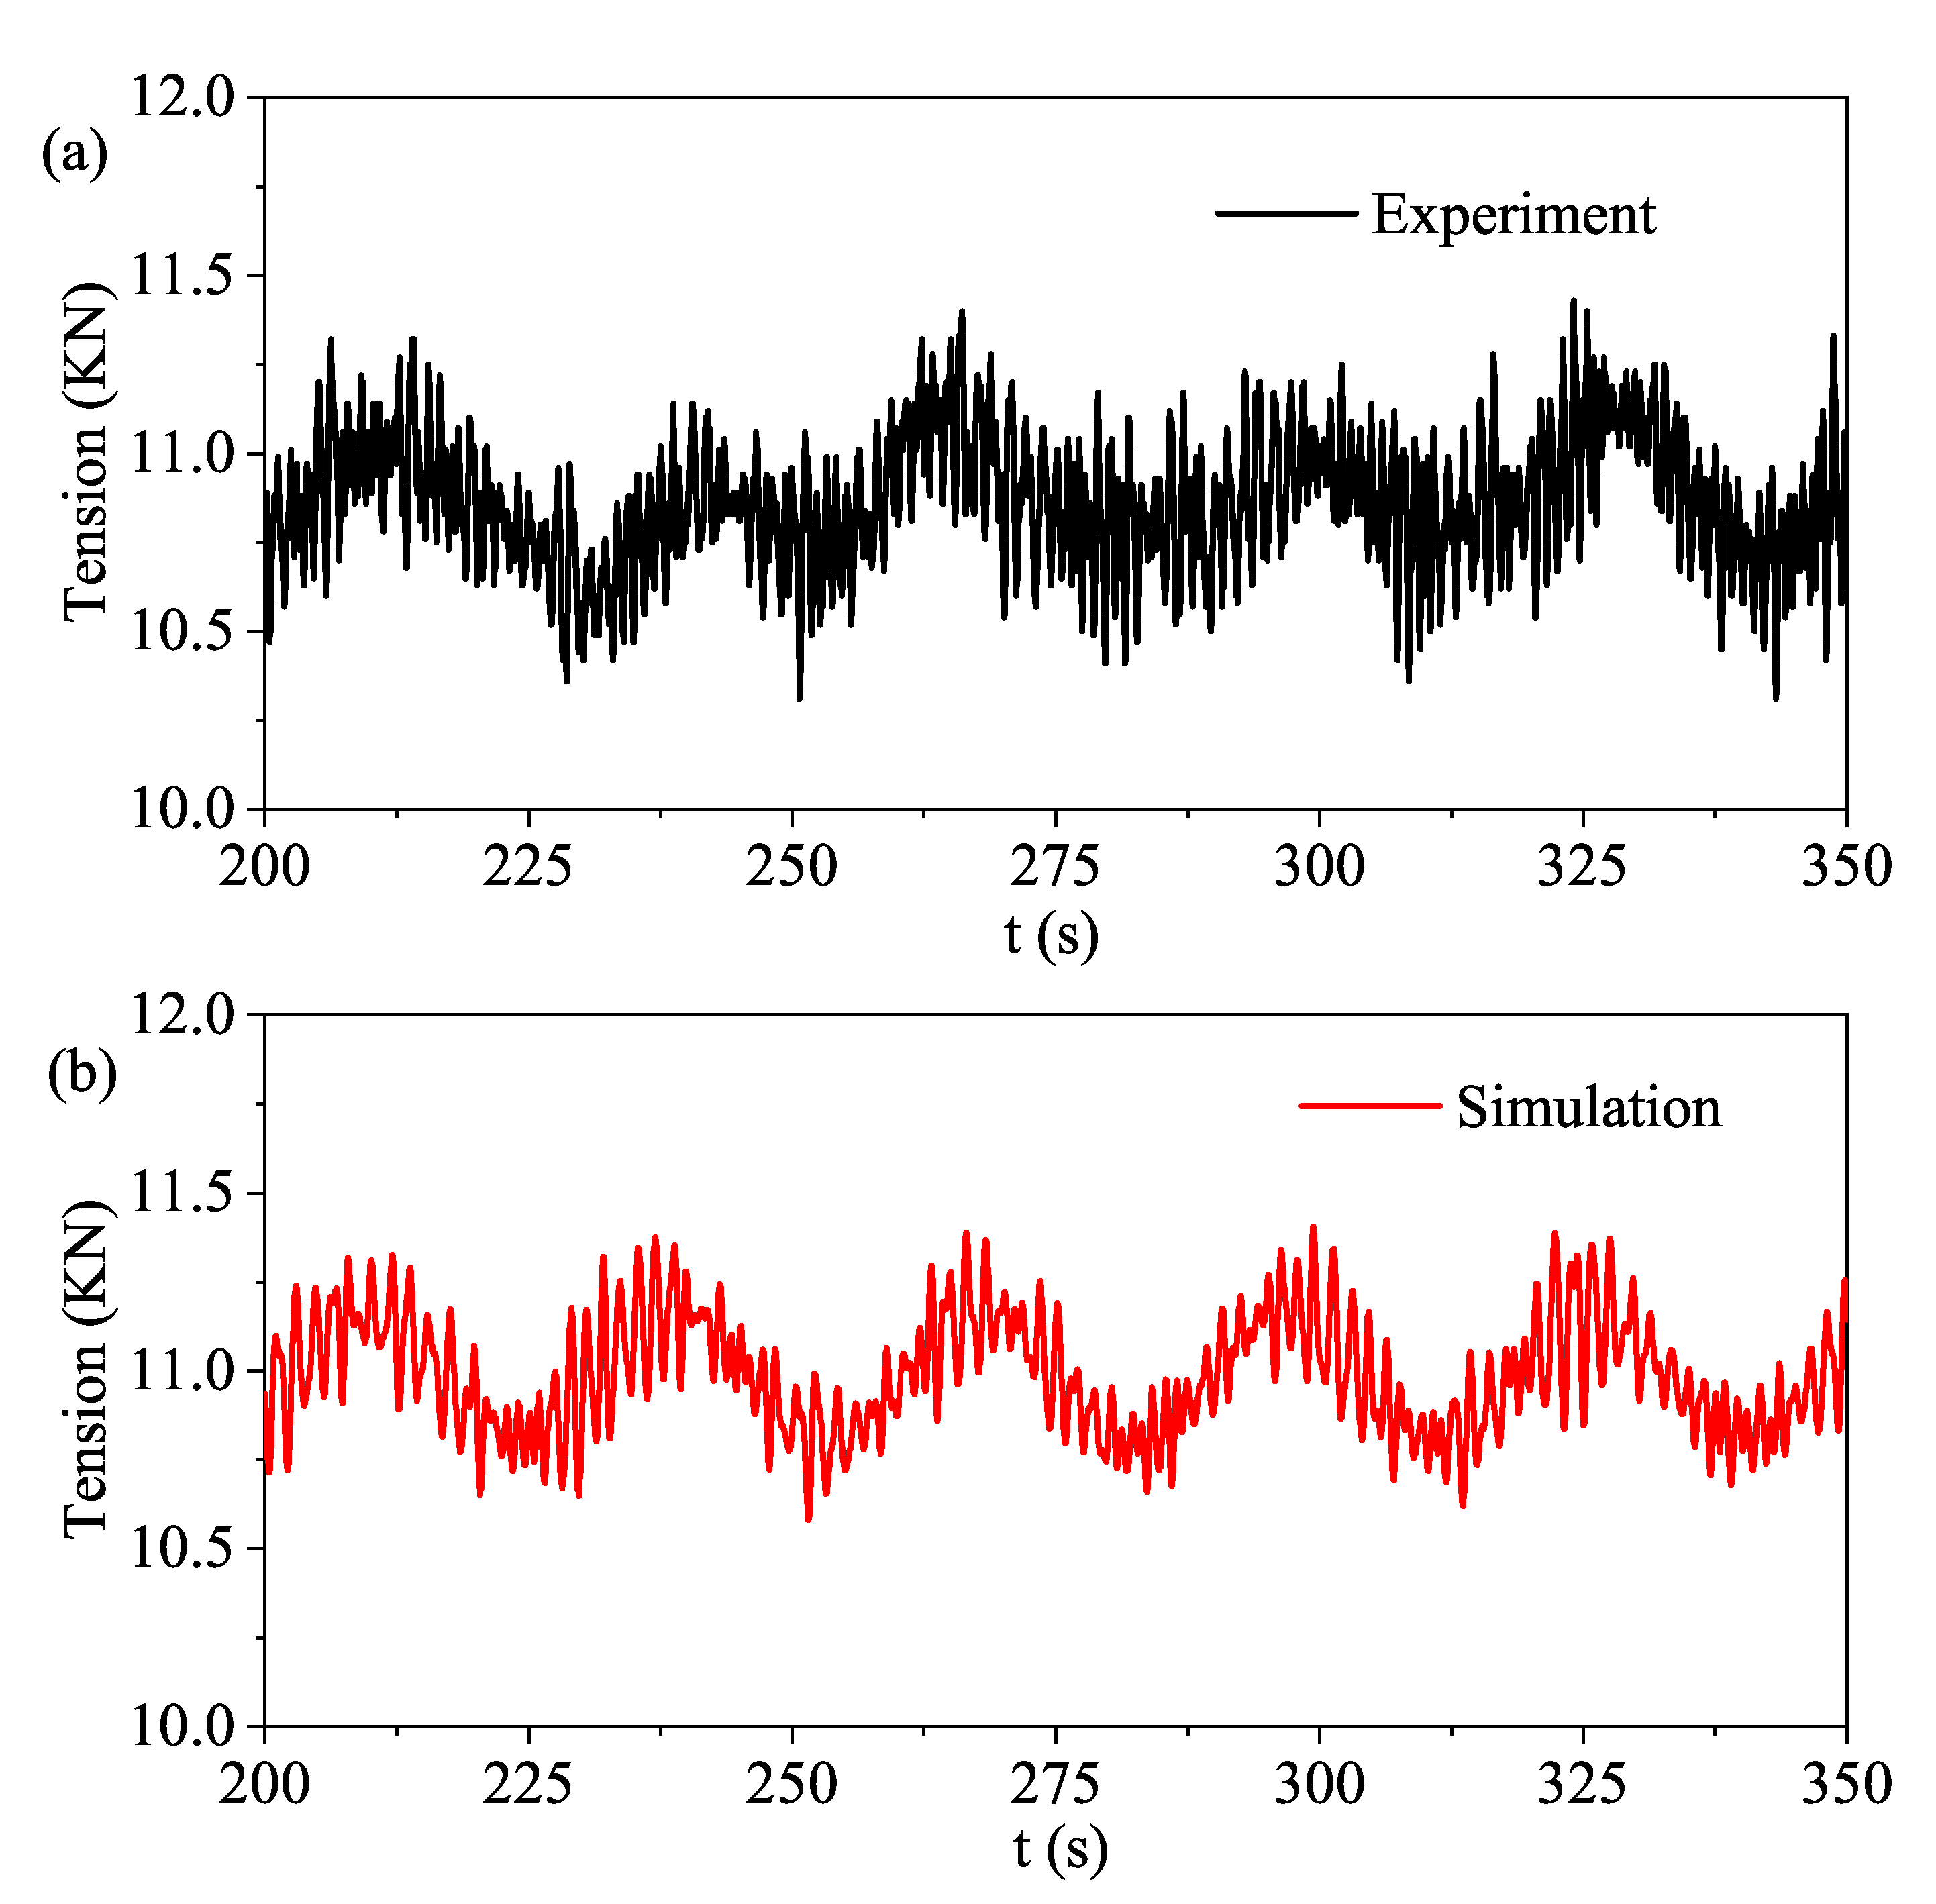
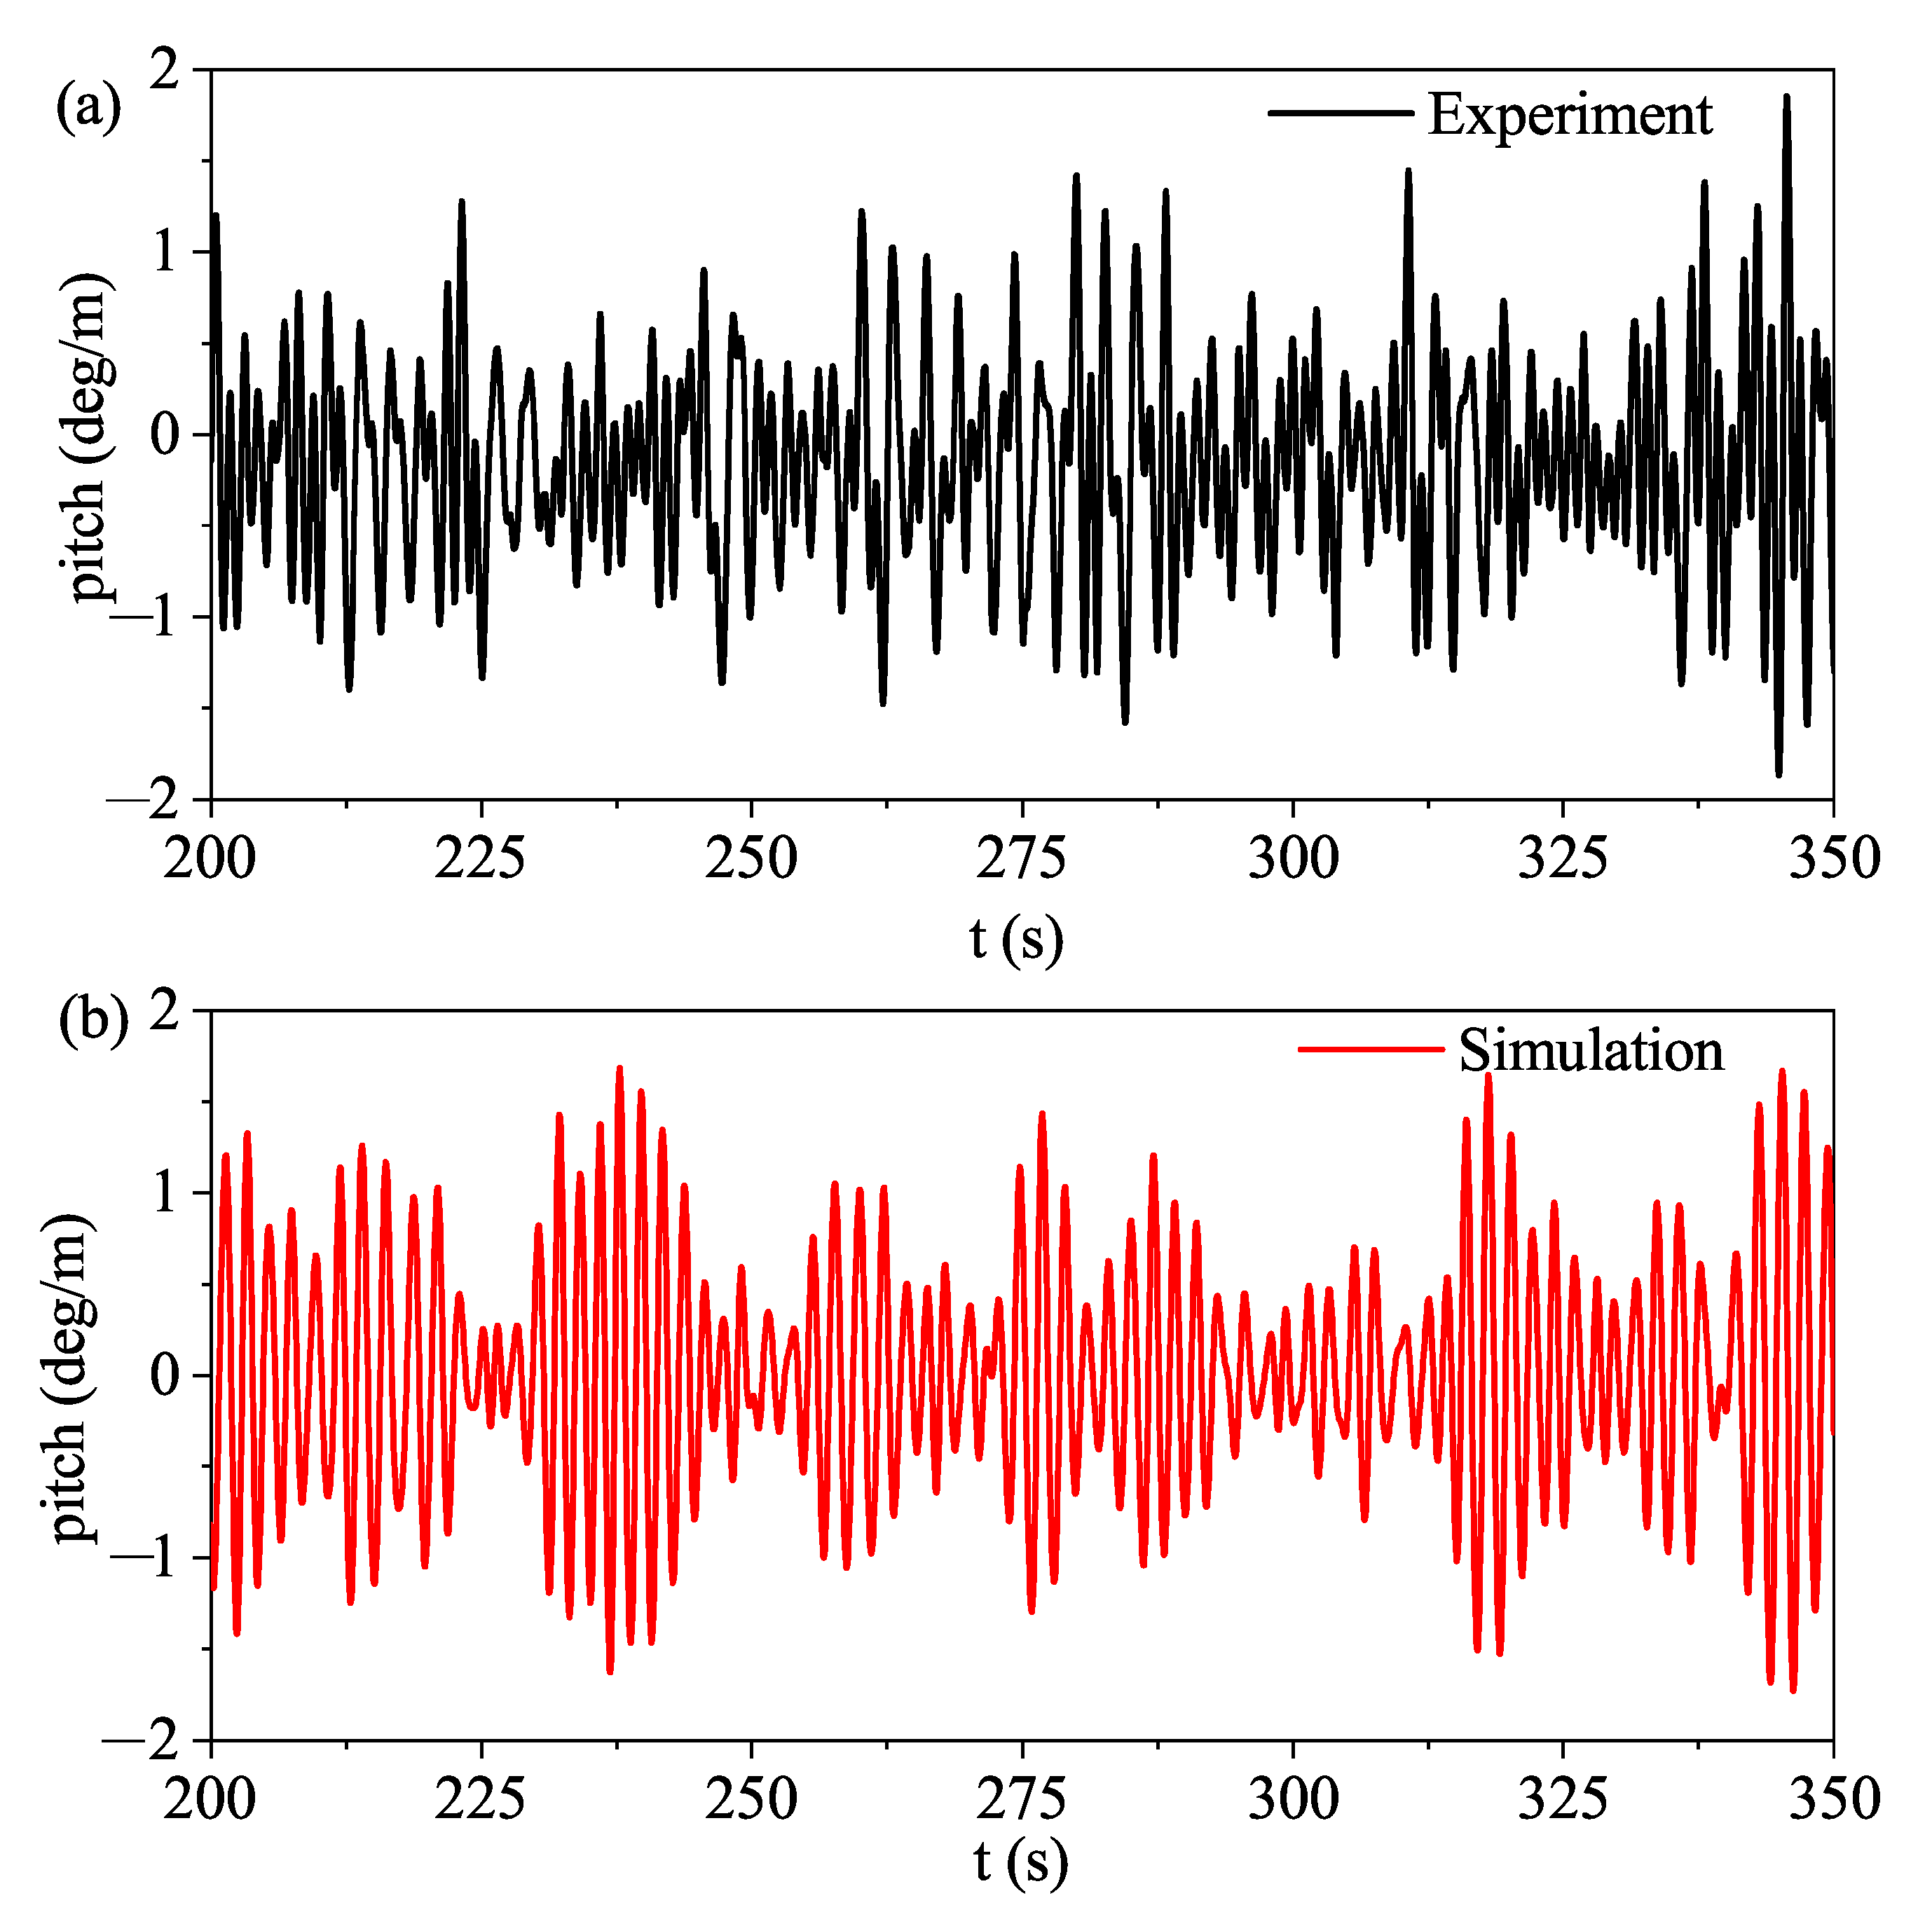
4.5. Irregular Waves

The hydrodynamic response under irregular waves using the JONSWAP spectrum described earlier is obtained. The computation methods of mooring forces in irregular waves are the same as in regular waves. The real-time motion of the floating system takes the sum frequency, the difference frequency, and slow-drift motions into account. All the forces are estimated under each instantaneous time step. Figure 16 presents the time series of the mooring force of the mooring line in the port bow side, showing a good agreement between the measured mooring tension and the simulation results. Five stable periods of mooring tension are selected to present peak and valley tension values. Although there exist local irregularities, the entire tendency of the time history of each cycle is similar. Furthermore, the mooring tension of simulation results is slightly greater than that of experimental results. The initial mooring tension is 10.5 KN on each mooring line without wave–structure interactions. When subjected to irregular waves, the mooring lines on the windward side are lifted with the HFS moving forward. As illustrated in Figure 16, the tension magnitude is small, as in the regular waves, since the dominant wave frequency transits from low to high periods. The time series of the mooring tension reveals that the simulation model can present a relatively accurate prediction of the mooring tension, although the wave–structure interaction is fierce.
The time series of simulation and experimental results concerning the dynamic pitch motions of the HFS are plotted in Figure 17 since the pitch angle is the most crucial parameter. It can be seen that the measured maximum pitch magnitude reaches 1.84 degrees per unit wave height, while the simulated maximum pitch magnitude reaches 1.68 degrees per unit wave height. In the case of irregular waves, the instantaneous pitch angle is strongly influenced by wave frequencies due to the coupling effect between the HFS and waves.

5. Conclusions

This paper first gives a brief review of the hybrid floating system both in the academic and industrial field. Then, an innovative concept design of an HFS that integrates renewable energy converters, a BDFF, and a mooring system for a water depth of 50 m is proposed. The HFS can harness different kinds of energy, including wind, wave, solar energies, etc. The detailed findings in this paper are summarized as follows:
  • Fifteen wave conditions are used to evaluate the hydrodynamic performance. The numerical results based on the potential theory are generally in good agreement with those of experiments. The maximum pitch angle is acceptable under the long-wave excitation.
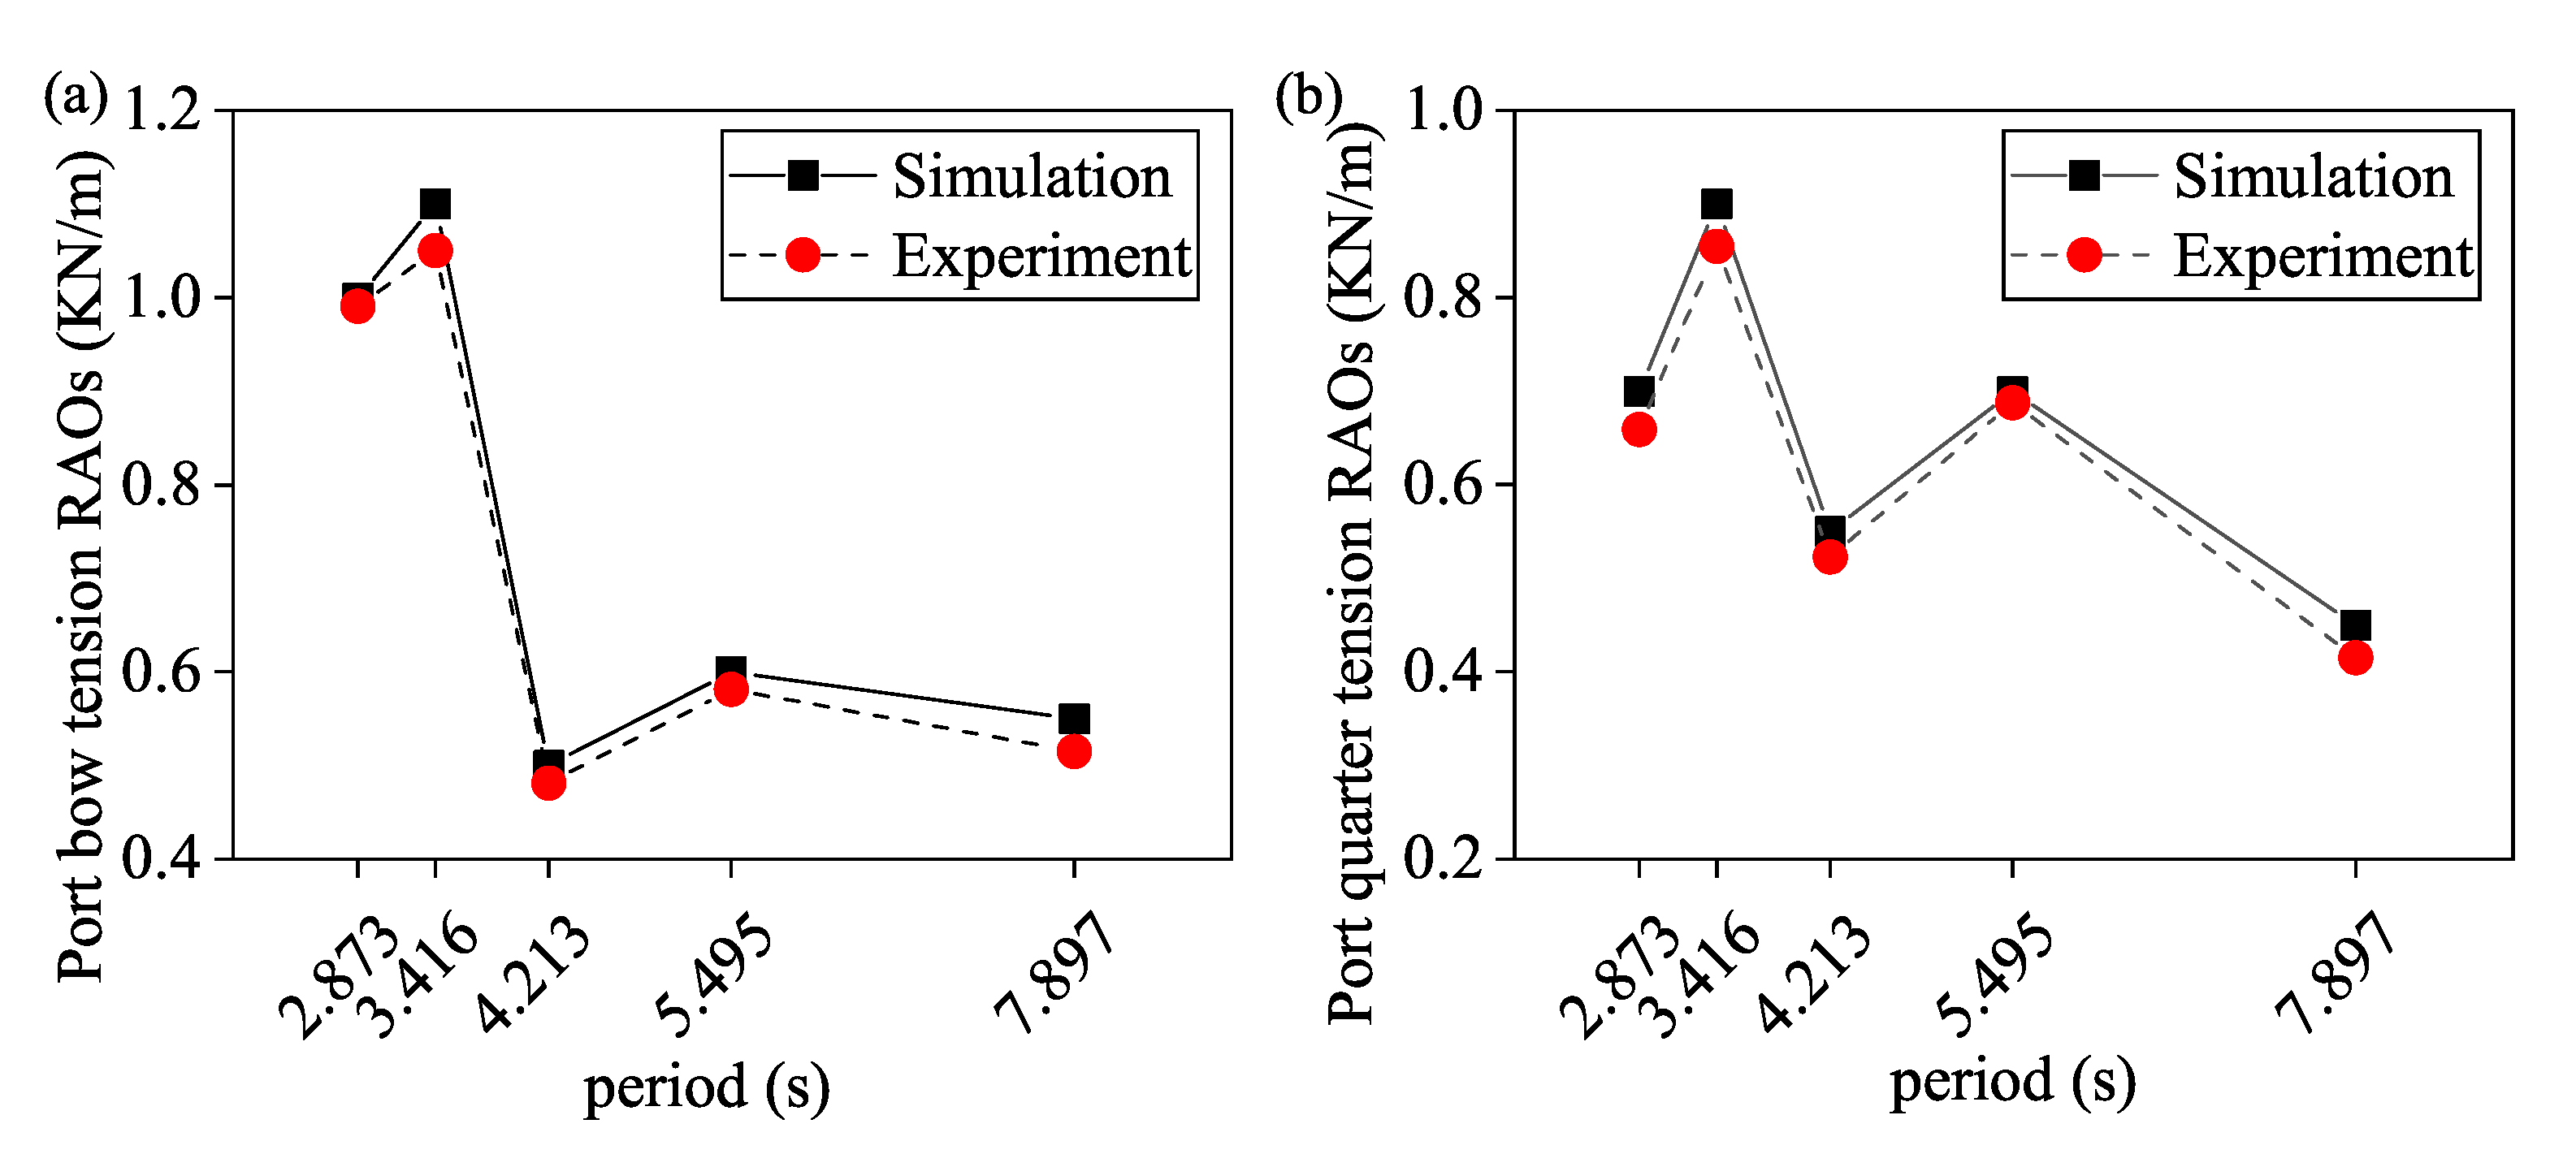
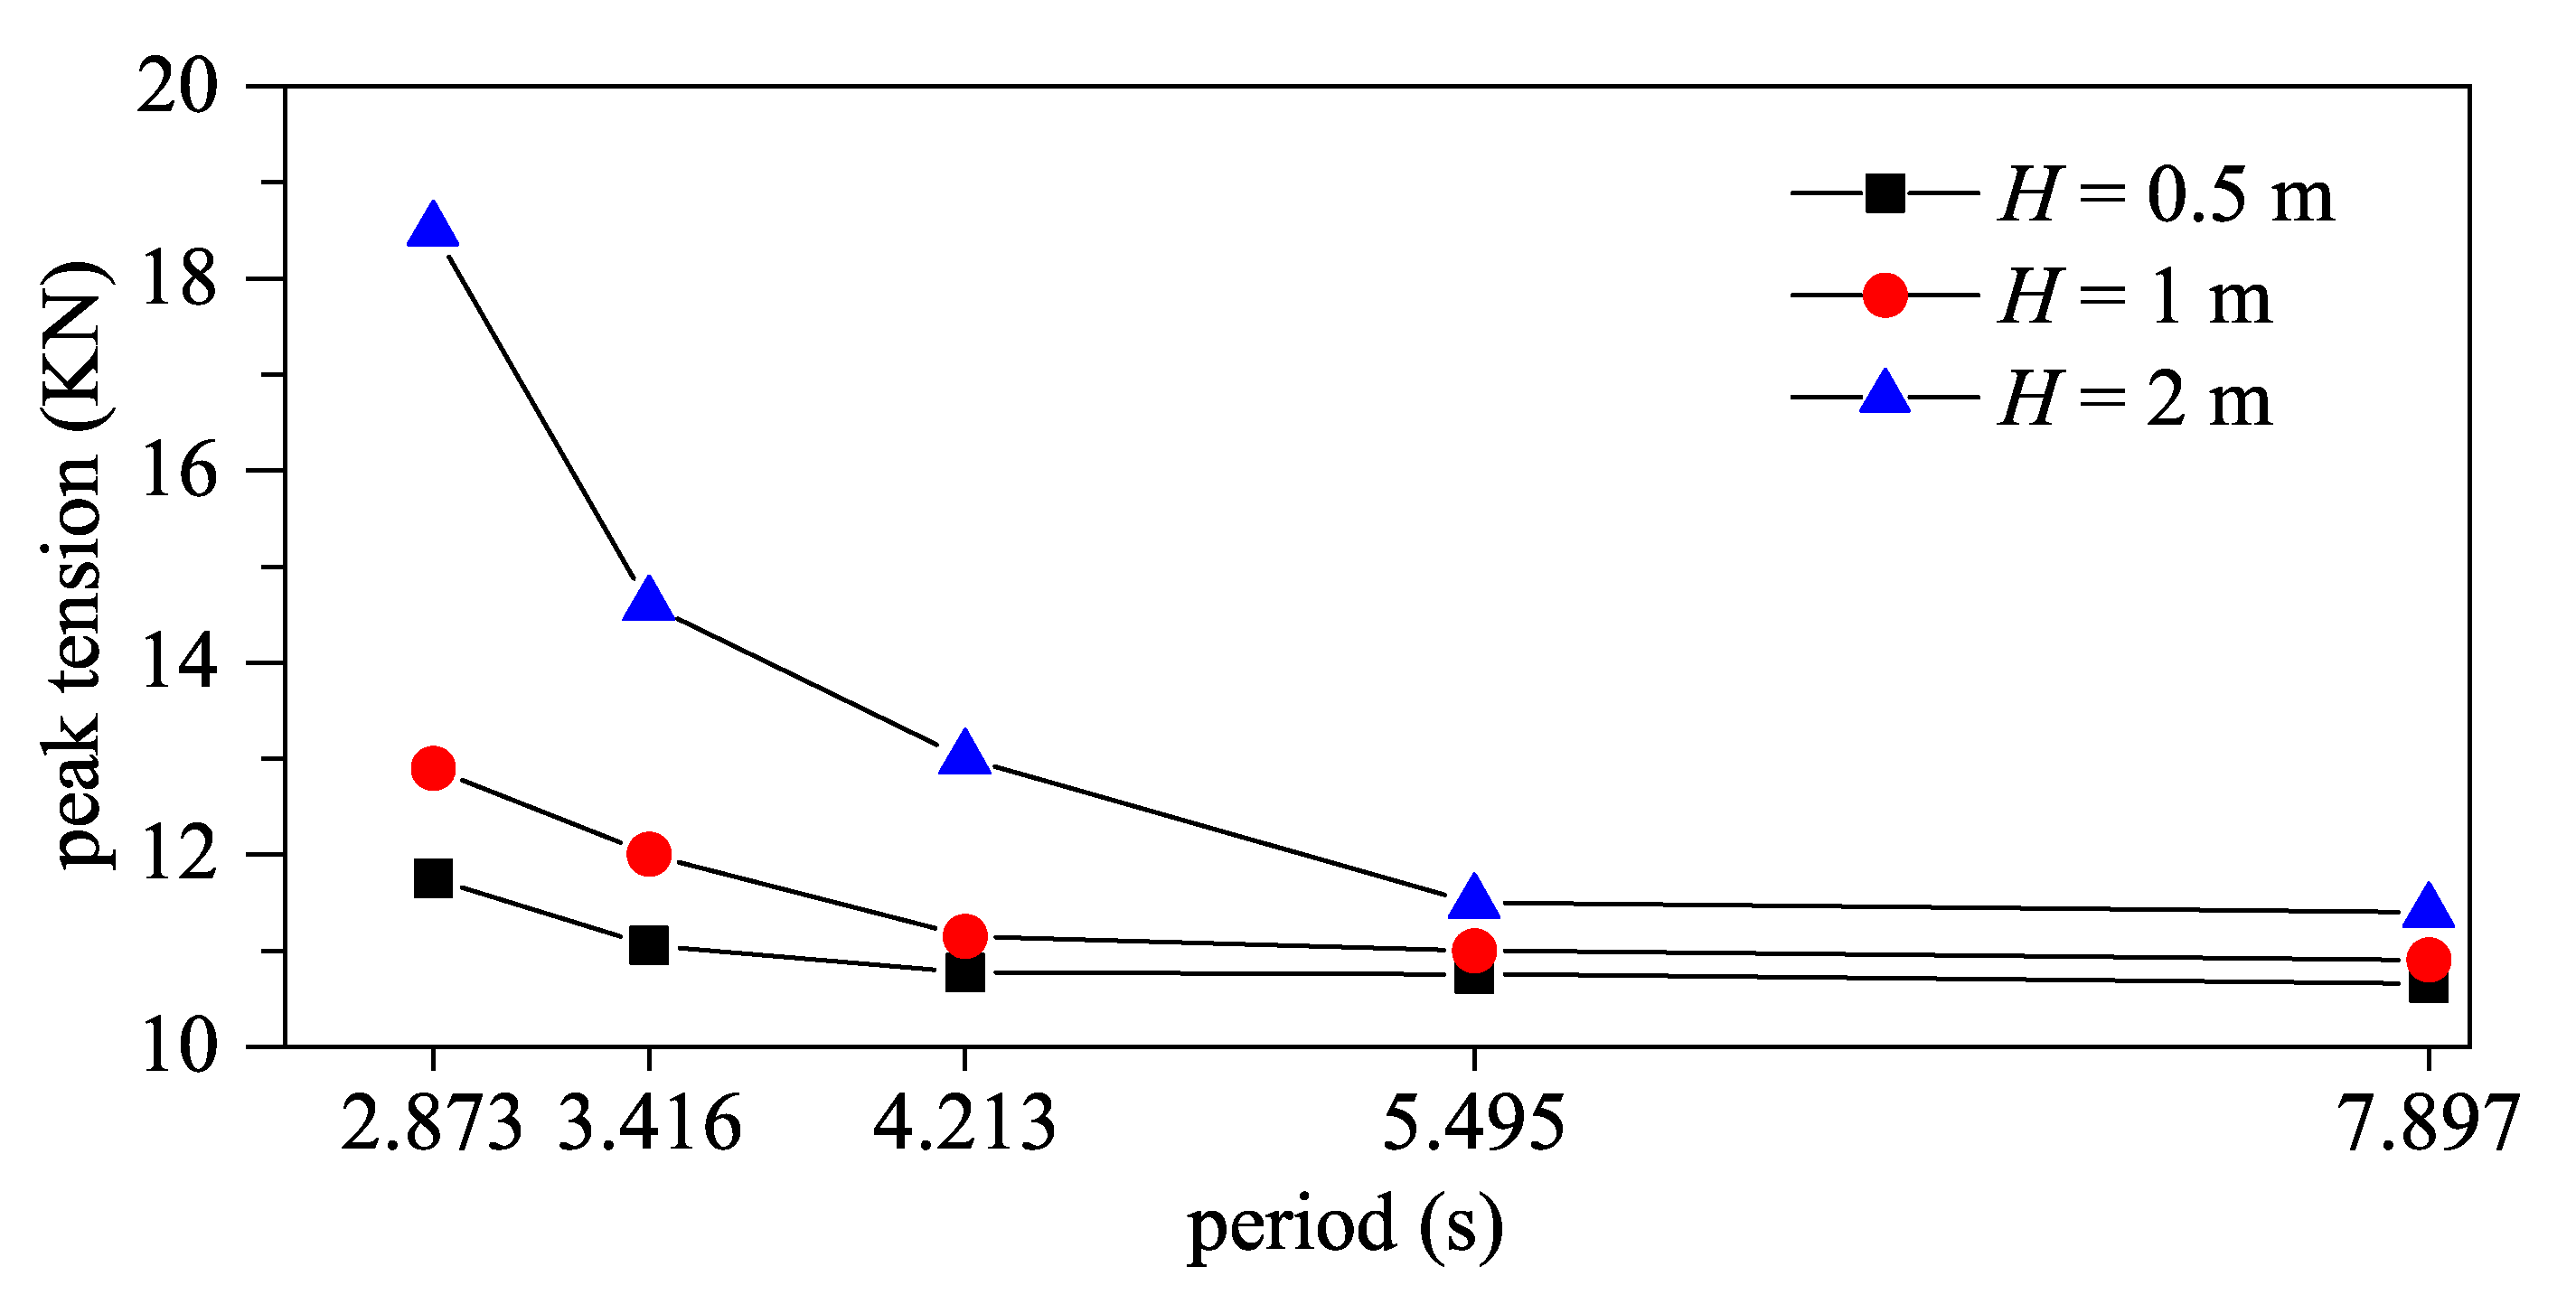
  • The simulation and experimental results of mooring tension RAOs have the same trend. The peak mobilized tensions of fore and rear mooring lines are far less than the breaking load.
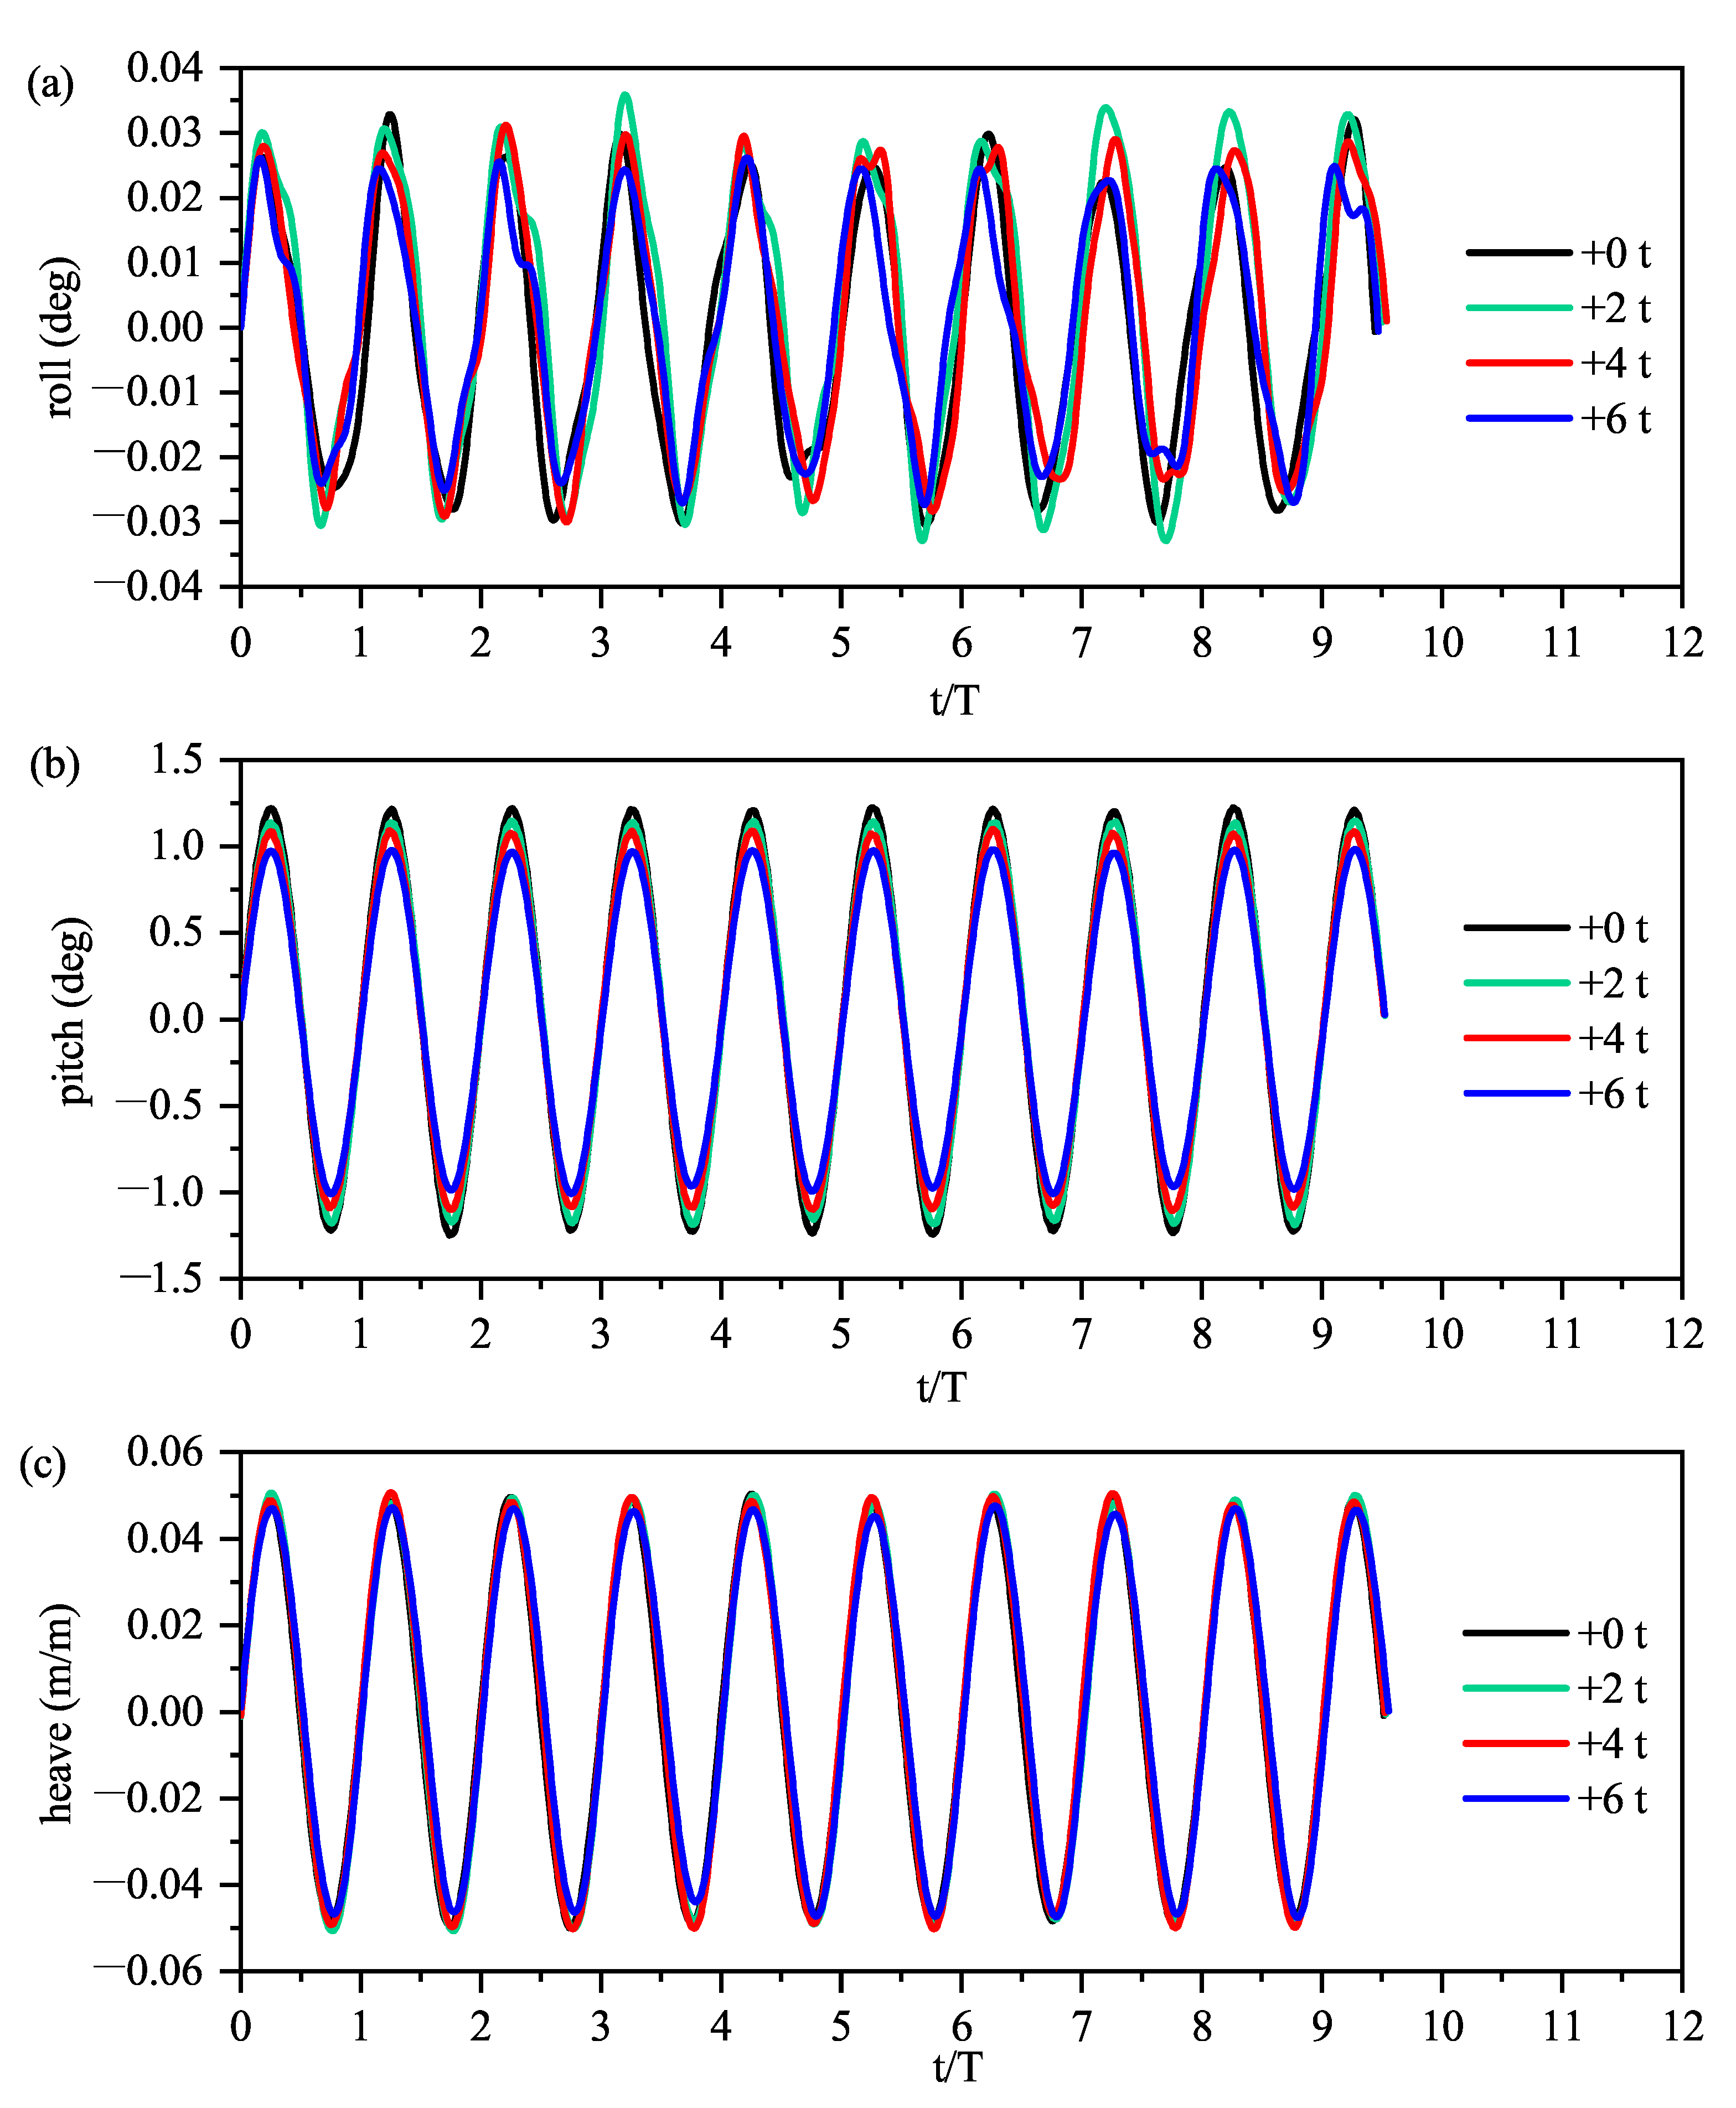
  • As concerns the influence of platform weights, the pitch motion can be reduced effectively by properly adding mass blocks on the deck of the BDFF. Meanwhile, the corresponding heave motion is independent of the additional loads.
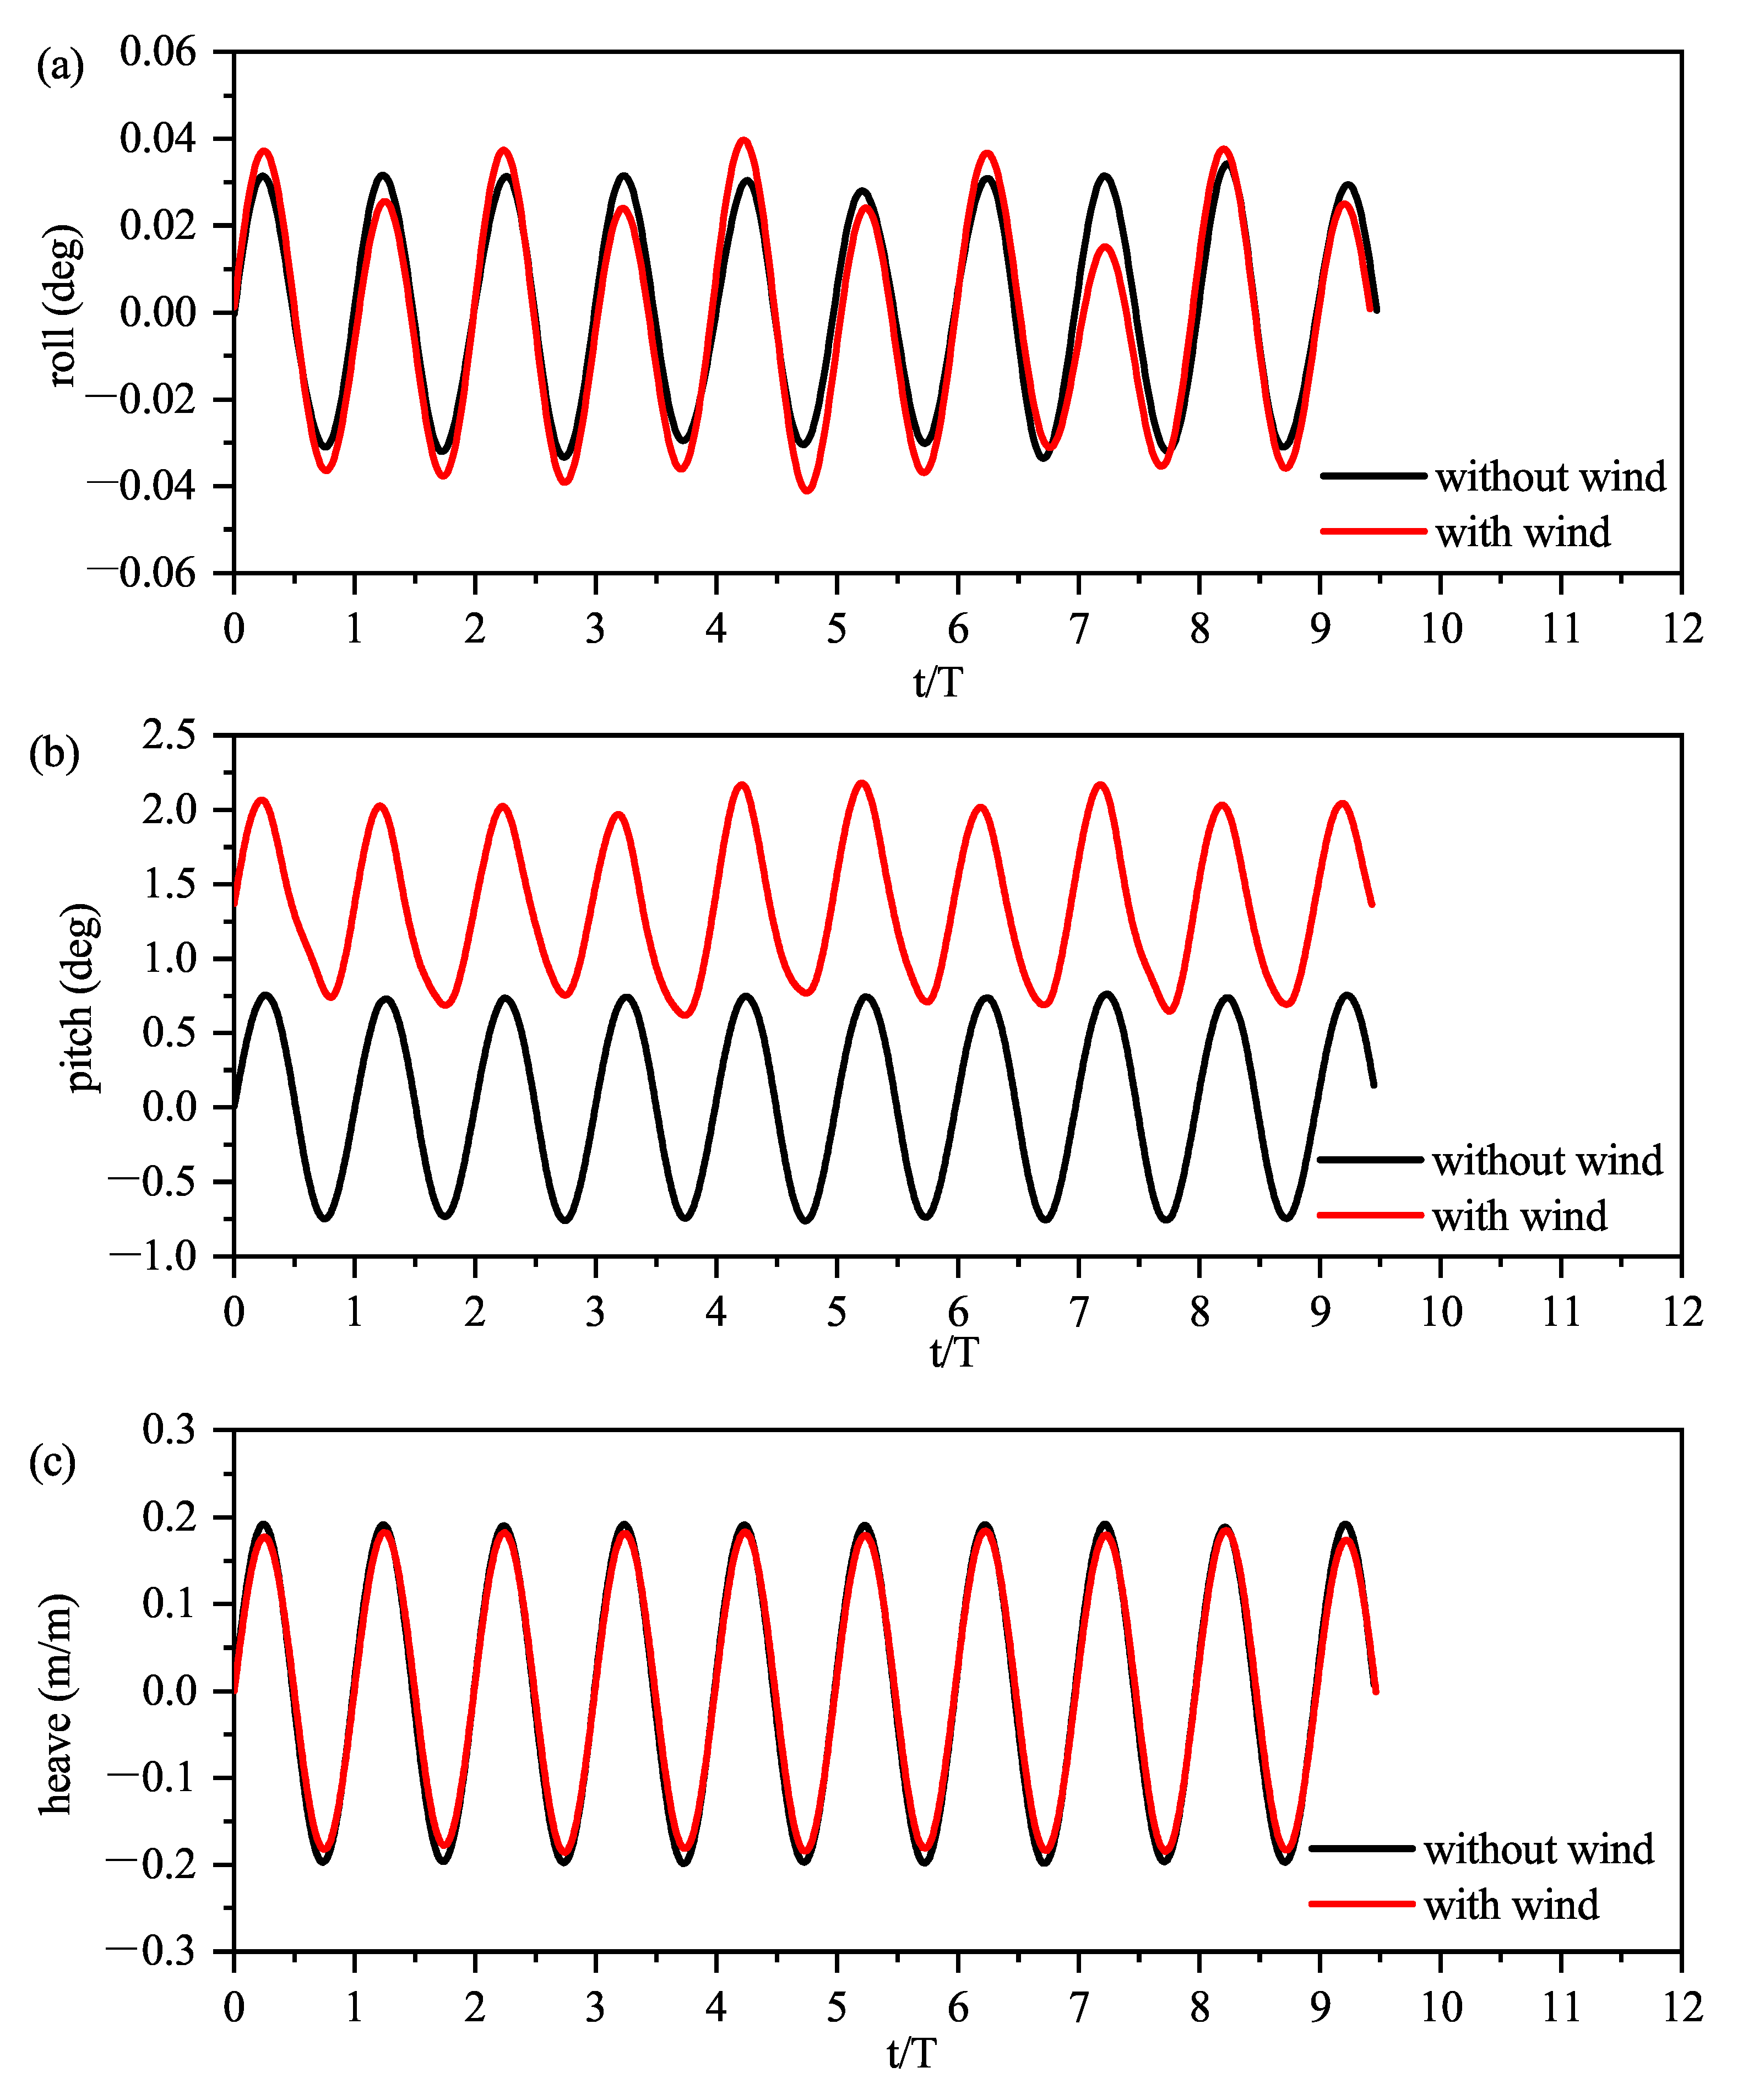
  • The experiment indicates that at a constant wind speed of 10 m/s, the wind substantially influences the pitch motion. The balance position has a tilt angle of 1.4 degrees. However, the influence on the heave motion is limited.
  • It can also be found that the coupling effect of the roll, pitch, and heave motion is weak due to the symmetrical design.
  • Regarding the irregular wave tests, the mooring tensions and instantaneous motion responses are compared with simulation results, showing similar characteristics.
The HFS is considered to be a better solution for a floating platform that requires rapid deployment due to its shorter assembly time and lower manufacturing cost. In the future, we will focus on a large floating platform which is able to carry a larger wind turbine.

Author Contributions

X.Q.: Validation, Data curation, Writing—Original draft preparation. Y.Y.: Conceptualization, Supervision. J.D.: Writing—Review and Editing. All authors have read and agreed to the published version of the manuscript.

Funding

This research was funded by the Science and Technology Planning Project of Shenzhen Municipality (Grant No.:JSGG20200701095002004).

Institutional Review Board Statement

Not applicable.

Informed Consent Statement

Not applicable.

Data Availability Statement

Not applicable.

Conflicts of Interest

The authors declare no conflict of interest.

Abbreviations

The following abbreviations are used in this manuscript:
BDFFBuoyancy-distributed floating foundation
COGCenter of gravity
DOFDegree of freedom
HFSHybrid floating system
MWLMean water line
RAOsResponse amplitude operators
SPARSingle Point Anchor Reservoir
SSFFSemi-submersible floating foundation
TLPTension-leg platform
WECWave energy convertor

References

  1. Wu, X.N.; Hu, Y.; Li, Y.; Yang, J.; Duan, L.; Wang, T.G.; Adcock, T.; Jiang, Z.Y.; Gao, Z.; Lin, Z.L.; et al. Foundations of offshore wind turbines: A review. Renew. Sustain. Energy Rev. 2019, 104, 379–393. [Google Scholar] [CrossRef] [Green Version]
  2. Oh, K.Y.; Nam, W.; Ryu, M.S.; Kim, J.Y.; Epureanu, B.I. A review of foundations of offshore wind energy convertors: Current status and future perspectives. Renew. Sustain. Energy Rev. 2018, 88, 16–36. [Google Scholar] [CrossRef]
  3. Maienza, C.; Avossa, M.A.; Ricciardelli, F.; Scherillo, F.; Georgakis, C.T. A Comparative Analysis of Construction Costs of Onshore and Shallow- and Deep-Water Offshore Wind Farms. In Proceedings of the XV Conference of the Italian Association for Wind Engineering, Naples, Campania, Italy, 9–12 September 2018; Ricciardelli, F., Avossa, M.A., Eds.; Springer: Cham, Switzerland, 2019; pp. 440–453. [Google Scholar] [CrossRef]
  4. Wang, X.F.; Zeng, X.W.; Li, J.L.; Yang, X.; Wang, H.J. A review on recent advancements of substructures for offshore wind turbines. Energy Convers. Manag. 2018, 158, 103–119. [Google Scholar] [CrossRef]
  5. Butterfield, S.; Musial, W.; Jonkman, J.; Sclavounos, P. Engineering Challenges for Floating Offshore Wind Turbines (No. NREL/CP-500-38776); National Renewable Energy Lab. (NREL): Golden, CO, USA, 2007.
  6. Floating Wind Systems. Available online: https://www.bluewater.com/products-technology/floating-wind-systems/ (accessed on 20 October 2021).
  7. Amate, J.; Nchez, G.D.S.A.; Lez, G.G.A. Development of a Semi-submersible Barge for the installation of a TLP floating substructure. TLPWIND® case study. J. Phys. Conf. Ser. 2016, 749, 012016. [Google Scholar] [CrossRef]
  8. Vita, L.; Ramachandran, G.; Krieger, A.; Kvittem, M.I.; Merino, D.; Cross-Whiter, J.; Ackers, B.B. Comparison of numerical models and verification against experimental data, using Pelastar TLP concept. In Proceedings of the International Conference on Offshore Mechanics and Arctic Engineering, Ocean Renewable Energy, St. John’s, NL, Canada, 31 May–5 June 2015; Volume 9. [Google Scholar] [CrossRef]
  9. The Future of Offshore Wind Is Afloat. Available online: https://www.equinor.com/en/what-we-do/floating-wind.html (accessed on 20 October 2021).
  10. Díaz, H.; Soares, C.G. Review of the current status, technology and future trends of offshore wind farms. Ocean Eng. 2020, 209, 107381. [Google Scholar] [CrossRef]
  11. Henderson, A.R.; Zaaijer, M.B.; Bulder, B.; Pierik, J.; Huijsmans, R.; van Hees, M.; Snijders, E.; Wijnants, G.H.; Wolf, M.J. Floating windfarms for shallow offshore sites. In Proceedings of the Fourteenth International Offshore and Polar Engineering Conference, Toulon, France, 23–28 May 2004. [Google Scholar]
  12. Liu, Y.; Li, S.; Yi, Q.; Chen, D. Developments in semi-submersible floating foundations supporting wind turbines: A comprehensive review. Renew. Sustain. Energy Rev. 2016, 60, 433–449. [Google Scholar] [CrossRef]
  13. Roddier, D.; Cermelli, C.; Aubault, A.; Weinstein, A. WindFloat: A floating foundation for offshore wind turbines. J. Renew. Sustain. Energy 2010, 2, 033104. [Google Scholar] [CrossRef]
  14. Robertson, A.; Jonkman, J.; Masciola, M.; Song, H.; Goupee, A.; Coulling, A.; Luan, C. Definition of the Semisubmersible Floating System for Phase II of OC4; Technical Report; National Renewable Energy Lab. (NREL): Golden, CO, USA, 2014.
  15. Mahfouz, M.; Faerron-Guzmán, R.; Müller, K.; Lemmer, F.; Cheng, P. Validation of drift motions for a semi-submersible floating wind turbine and associated challenges. J. Phys. Conf. Ser. 2020, 1669, 012011. [Google Scholar] [CrossRef]
  16. Roy, A.; Auger, F.; Dupriez-Robin, F.; Bourguet, S.; Tran, Q.T. Electrical power supply of remote maritime areas: A review of hybrid systems based on marine renewable energies. Energies 2018, 11, 1904. [Google Scholar] [CrossRef] [Green Version]
  17. Yde, A.; Bellew, S.B.; Clausen, R.S.; Nielsen, A.W. Report: Experimental and Theoretical Analysis of a Combined Floating Wave and Wind Energy Conversion Platform; DTU Wind Energy: Roskilde, Denmark, 2014. [Google Scholar]
  18. Technical Overview. Available online: https://bomborawave.com/mwave/ (accessed on 20 October 2021).
  19. Hanssen, J.E.; Margheritini, L.; O’Sullivan, K.; Mayorga, P.; Martinez, I.; Arriaga, A.; Agos, I.; Steynor, J.; Ingram, D.; Hezari, R.; et al. Design and performance validation of a hybrid offshore renewable energy platform. In Proceedings of the 2015 Tenth International Conference on Ecological Vehicles and Renewable Energies (EVER), Grimaldi Forum, Monaco, 31 March–2 April 2015; pp. 1–8. [Google Scholar] [CrossRef]
  20. Ohya, Y.; Karasudani, T.; Nagai, T.; Watanabe, K. Wind lens technology and its application to wind and water turbine and beyond. Renew. Energy Environ. Sustain. 2017, 2, 2. [Google Scholar] [CrossRef] [Green Version]
  21. Our Unique Approach to Marine Renewable Electricity Production. Available online: https://www.sinnpower.com/ (accessed on 20 October 2021).
  22. Ahamed, R.; McKee, K.; Howard, I. Advancements of wave energy converters based on power take off (PTO) systems: A review. Ocean Eng. 2020, 204, 107248. [Google Scholar] [CrossRef]
  23. Koundouri, P.; Giannouli, A.; Souliotis, I. An integrated approach for sustainable environmental and socio-economic development using offshore infrastructure. In Renewable and Alternative Energy: Concepts, Methodologies, Tools, and Applications; Erdoğdu, M.M., Thankom, A., Imran, H.A., Eds.; IGI Global: Hershey, PA, USA, 2016; pp. 44–64. [Google Scholar]
  24. Papandroulakis, N.; Thomsen, C.; Mintenbeck, K.; Mayorga, P.; Hernández-Brito, J.J. The EU-Project “TROPOS”. In Aquaculture Perspective of Multi-Use Sites in the Open Ocean: The Untapped Potential for Marine Resources in the Anthropocene; Buck, B.H., Langan, R., Eds.; Springer: Cham, Switzerland, 2017; pp. 355–374. [Google Scholar]
  25. Krüner, S.; Hackl, C.M. Experimental Identification of the Optimal Current Vectors for a Permanent-Magnet Synchronous Machine in Wave Energy Converters. Energies 2019, 12, 862. [Google Scholar] [CrossRef] [Green Version]
  26. Yi, F.; Feng, W.b.; Cao, H.J. Wave analysis based on ERA-Interim reanalysis data in the South China Sea. Mar. Forecast. 2018, 35, 44–51. (In Chinese) [Google Scholar]
  27. Zhai, F.; Wu, W.; Gu, Y.; Li, P.; Liu, Z. Dynamics of the seasonal wave height variability in the South China Sea. Int. J. Climatol. 2021, 41, 934–951. [Google Scholar] [CrossRef]
Figure 1. (a) The module named the five-pole unit; (b) a combination of multiple modules.
Energies 14 07605 g001
Figure 2. The BDFF with parameters D = 2.0 m, d = 0.8 m, h = 6.7 m, m = 4, n = 5. Three black dots means the model can be expanded freely in this direction. (a) The front view; (b) the top view.
Energies 14 07605 g002
Figure 3. (a) Hogging; (b) sagging; (c) the BDFF floating in waves.
Energies 14 07605 g003
Figure 4. (a) Concept of the hybrid floating system; (b) simplified floating system.
Energies 14 07605 g004
Figure 5. Mooring line configuration: (a) top view; (b) side view.
Energies 14 07605 g005
Figure 6. The layout diagram of the water basin.
Energies 14 07605 g006
Figure 7. (a) motion capture cameras for non-contact measuring; (b) target points on the deck; (c) wave probes.
Energies 14 07605 g007
Figure 8. The used JONSWAP spectrum.
Energies 14 07605 g008
Figure 9. The time history of the wave elevation for the used JONSWAP spectrum.
Energies 14 07605 g009
Figure 10. RAOs for (a) surge motion; (b) pitch motion; (c) heave motion.
Energies 14 07605 g010
Figure 11. Instantaneous profile of the HFS under regular waves coming from the left (wave frequency: 0.182 Hz, wave height: 1 m).
Energies 14 07605 g011
Figure 12. Comparison of mooring tension RAOs between measurements and simulations in port bow and port quarter lines: (a) the port bow tension RAOs; (b) the port quarter tension RAOs.
Energies 14 07605 g012
Figure 13. The peak tension of mooring line 1 under 0° waves.
Energies 14 07605 g013
Figure 14. Motion response of the HFS in the roll, pitch, and heave direction by loading different mass blocks (H = 1 m, T = 4.213 s): (a) roll response; (b) pitch response; (c) dimensionless heave response.
Energies 14 07605 g014
Figure 15. Motion response of the HFS in the roll, pitch, and heave directions with and without winds (H = 1 m, T = 4.213 s): (a) surge motion; (b) pitch motion; (c) heave motion.
Energies 14 07605 g015
Figure 16. The instantaneous experimental and simulation mooring tension in the port bow mooring line: (a) mooring tension from the experimental results; (b) mooring tension from the simulation results.
Energies 14 07605 g016
Figure 17. The instantaneous experimental and simulation pitch RAOs: (a) pitch motion response from the experimental results; (b) pitch motion response from the simulation results.
Energies 14 07605 g017
Table 1. The synthesis of floating solutions for offshore energy.
Energy TypeApplications
TLP: Bluewater, TLPWIND, PelaStar;
WindSPAR: Hywind;
SSFF: Dutch Tri-floater, WindFloat, OC4-DeepCWind, NAUTILUS
Wind + WavePoseidon P37, InSPIRE, W2Power, H2Ocean
Wind + SolarOEFP
Wind + Wave + SolarOHP
ComprehensiveTROPOS, MERMAID
Table 2. Particulars of the floating system.
ItemValueUnit
Mass of rotors and hub 2 × 10 3 kg
Mass of tower 2 × 10 3 kg
Total mass including wind turbine and ballast 1.245 × 10 5 kg
Depth of Center of gravity (COG) below the MWL3.5m
Roll Inertia relative to COG 8.425 × 10 6 kg·m 2
Pitch Inertia relative to COG 9.036 × 10 6 kg·m 2
Yaw Inertia relative to COG 7.490 × 10 6 kg·m 2
Table 3. The regular wave parameters used for tests.
CaseWave Periods, sWave Height, mWinds
12.873, 3.416, 4.213, 5.495, 7.8970.5, 1, 2Without winds
22.873, 3.416, 4.213, 5.495, 7.8971With winds
Table 4. The RAOs resulting from the analysis.
DirectionExpressionRAO
Surge x ( t ) = x a cos ( t + ϵ 1 ) x a / ζ a
Pitch ψ ( t ) = ψ a cos ( t + ϵ 5 ) ψ a / ζ a
Heave z ( t ) = z a cos ( t + ϵ 3 ) z a / ζ a
Publisher’s Note: MDPI stays neutral with regard to jurisdictional claims in published maps and institutional affiliations.

