Article

Empirical Analysis of the Impact of COVID-19 Social Distancing on Residential Electricity Consumption Based on Demographic Characteristics and Load Shape

The School of Electrical Engineering, Korea University, Seoul 02841, Korea
*
Author to whom correspondence should be addressed.
Energies 2021, 14(22), 7523; https://doi.org/10.3390/en14227523
Submission received: 6 October 2021 / Revised: 8 November 2021 / Accepted: 9 November 2021 / Published: 11 November 2021
(This article belongs to the Special Issue Machine Learning and Data Mining Applications in Power Systems)

Abstract

:
Since January 2020, the COVID-19 pandemic has been impacting various aspects of people’s daily lives and the economy. The first case of COVID-19 in South Korea was identified on 20 January 2020. The Korean government implemented the first social distancing measures in the first week of March 2020. As a result, energy consumption in the industrial, commercial and educational sectors decreased. On the other hand, residential energy consumption increased as telecommuting work and remote online classes were encouraged. However, the impact of social distancing on residential energy consumption in Korea has not been systematically analyzed. This study attempts to analyze the impact of social distancing implemented as a result of COVID-19 on residential energy consumption with time-varying reproduction numbers of COVID-19. A two-way fixed effect model and demographic characteristics are used to account for the heterogeneity. The changes in household energy consumption by load shape group are also analyzed with the household energy consumption model. There some are key results of COVID-19 impact on household energy consumption. Based on the hourly smart meter data, an average increase of 0.3% in the hourly average energy consumption is caused by a unit increase in the time-varying reproduction number of COVID-19. For each income, mid-income groups show less impact on energy consumption compared to both low-income and high-income groups. In each family member, as the number of family members increases, the change in electricity consumption affected by social distancing tends to decrease. For area groups, large area consumers increase household energy consumption more than other area groups. Lastly, The COVID-19 impact on each load shape is influenced by their energy consumption patterns.

1. Introduction

By the end of December 2020, the total number of COVID-19 confirmed cases worldwide was 80 million, with the death toll reaching 1.7 million. The global pandemic caused by the rapid and widespread proliferation of COVID-19 affected national policies, industries, and even the daily lives of people worldwide [1]. In South Korea, the total number of confirmed cases reached 60,000 by the end of December since the first COVID-19 case in Korea was identified on 20 January 2020, with the number of confirmed cases increasing by approximately 1000 cases every day. To cope with this situation, the Korean government began implementing and strengthening a policy based on social distancing. As COVID-19 affected the entire country, authorities across the world had to analyze their current situations and implement policies to respond to the pandemic. The US government imposed a lockdown from March 2020 to prevent the spread of COVID-19 in the US, and energy consumption declined by 20–40% in April and May 2020 [2]. Energy consumption dropped to weekend levels under lockdown, with dramatic reductions in the services and industry sectors only partially offset by higher residential use [3,4]. After shutting down on 22 March 2020 in New York City, weekday energy consumption in apartments increased by 7%, and weekend use increased by 4%. A load shift was observed during the weekday morning hours. A ramp-up started at 6 am, rising throughout the morning and early afternoon after reaching its pre-full morning peak at 9 am, highlighting the impact of this new stay-at-home behavior. This load shift for weekday mornings and afternoons was also seen in overall urban level consumption patterns observed by New York Independent System Operator (NYISO) [5]. India’s energy consumption declined by 9.75% in March–April 2020, decreasing further in May to 14.16%. Unlike the overall Indian energy system, India’s household energy consumption increased during the COVID-19 pandemic [6]. An independent electricity system operator reported that in Canada, Ontario’s residential energy consumption increased during the spring and summer months of 2020 compared to the previous year [7].
In [8], the autoregressive distributed lag (ARDL) model developed by Pesaran et al. [9] was used to analyze the relationship between COVID-19 and regional energy consumption. India was segmented into five regions, and the effect in GWh was estimated using COVID-19 data for each region. However, reference [8] only analyzed the impact of COVID-19 on regional and not residential energy consumption. In [10], the impact of COVID-19 on household energy consumption was analyzed in Bhutan based on the number of household members. In 2020, Bhutan’s household energy consumption increased by 6.8% compared to 2019 and 18% compared to 2018. However, reference [10] has limitations in comparing the total energy consumption used by the household members rather than estimating the coefficient of the COVID-19 impact. Reference [11] showed that in Brazil, the increase in home office arrangements caused by the COVID-19 pandemic resulted in residential energy consumption increasing by 10–13%. Moreover, after dividing Brazil into five regions, which are north, northeast, southeast-midwest, south, and all areas, the total energy consumption before/after COVID-19 by region was only analyzed using the t-test to determine the significance of the reduction in energy consumption using statistical methods. However, reference [11] only demonstrated the increase in residential energy consumption due to COVID-19. Apart from lifestyle changes in people’s lives during the pandemic, other factors affected energy load consumption, such as weekdays, holidays, weather, etc. [12,13].
In [14], energy consumption of HVAC in the housing sector increased by as much as 16% during the lockdown period. In addition, the hourly load of lighting and home appliances at home decreased slightly in the morning and increased significantly from daytime to evening. There is a limitation as this study only compared the average daily energy consumption during 23–31 March 2020 and the average during March 2017–2019. For Australian households, daytime energy use increased by almost 15% compared with February–May 2019 and the same period in 2020 [15]. In [16], based on the measurement data from about 7000 dwellings in Warsaw household, the result shows that the average daily energy consumption has increased during the lockdown of the COVID-19 pandemic compared to the period of the year before the pandemic. However, refs [15,16] also only compared the average daily usage pattern during the period of the year before the pandemic and the lockdown period. This comparison method has the potential problem of not distinguishing between the impact changed by COVID-19 and the impact changed by external effects. In addition, there is a disadvantage in that it is not possible to perform an analysis that reflects the demographic characteristics and energy usage patterns of each household.
This study analyzes the impact of COVID-19 on household energy consumption with demographic information of individual residential customers to capture the different impacts on each group. The model used in this study better analyzes the impact of COVID-19 by using a two-way fixed effect that captures household heterogeneity. In particular, this study performs clustering of households for each load shape. The impact of COVID-19 based on consumers’ pre-social distancing lifestyle patterns is analyzed. The results of this study have implications for the planning and operating of Korea’s electrical utility power systems in response to the COVID-19 pandemic.
Most previous studies have only analyzed the impact of COVID-19 using a dummy variable. This study proposes the use of the time-varying reproduction number of COVID-19 to check the robustness and persistence of the impact of COVID-19 on household energy consumption in Korea.
The remainder of this paper is organized as follows. Section 2 describes data used in this study. Section 3 introduces the method for handling missing data, clustering the load pattern algorithm, and estimating the COVID-19 impact on household energy consumption. Section 4 presents the results of the analysis using the proposed method in this study. Section 5 discuss the results of the study. Finally, Section 6 concludes the study.

2. Data and Description

Household energy consumption data are extracted through smart meters. The reproduction number is used to determine the impact of COVID-19 during the social distancing period. The mean infection rate of a population at a certain point in time is defined as the time-varying reproduction number—i.e., Rj, which can be repeatedly calculated over time. Rj is the time-varying reproduction number of COVID-19 for week j in 2020. The instantaneous reproductive index is defined as the number of secondary infections expected to occur at time divided by the number of infected individuals and infectivity at time and is useful for estimating the number of retrospective or real-time transmission. Korea’s Rj data show that Rj is high during the eight week of social distancing policy implementation in Korea as shown in Table 1, but Rj exhibits a continuously declining trend during the social distancing period [17,18].
For weather data matched with each household, for a total of 1133 houses, the average temperature and humidity in hour units extracted from the data of the Korea Meteorological Agency’s Automated Surface Observing System (ASOS) in January–April 2020, which is closest to the area of the sampled household. The weather data is extracted from nine meteorological observatories. The household energy consumption extracted in 15-min intervals on January–April 2020 from the Korea Electric Power Corporation (KEPCO) smart metering and resampled the average hourly energy consumption. The average electricity price is calculated based on progressive rate design. If 200 kWh or less is used in a month, the electricity rate is 88.3 KRW/kWh. If 400 kWh above is used in a month, the electricity rate is 275.6 KRW/kWh and except for the two preceding conditions, the electricity rate is 182.9 KRW/kWh. A description and statistic of the time varying data is presented in Table 2 and demographic characteristic is shown in Table 3.

3. Methods for Analysis of the Impact of Social Distancing on Household Energy Consumption

In this section, a two-way fixed effect model is presented. In addition, a simple hybrid-imputation method, which combines linear and statistical methods, and a clustering algorithm based on the load shape is introduced.

3.1. The Method for Estimating the Impact of Social Distancing Using Household Energy Consumption Model

The proposed analysis method used to identify COVID-19 factors that affected air pollution [19]. In the previous paper on electricity usage, household energy consumption is modeled using various factors that affect residential energy usage, such as airborne particulate matter (PM) with a diameter of 10 microns or less, called air pollutants such as PM10 and PM2.5, and temperature, [20,21,22]. The proposed method estimates the energy consumed by residential customers with time-varying reproduction number during the COVID-19 pandemic. Furthermore, the proposed model considers demographic characteristics, such as house area, income quantile, and the number of household members.
The household energy consumption method is often used to predict energy consumption or estimate factors that may affect energy consumption. This model is used for two reasons. First, this econometric approach provides flexibility in controlling differences in weather, seasonality, and other factors. Second, using household-specific fixed-effect, panel data analysis can control time-invariant but unobservable characteristics per household, which may cause bias in the impact estimation results.
Subsequently, using the household energy consumption model in Equation (1), a model is created to measure the impact of COVID-19 on household energy consumption:
l n ( U s e i t h ) = α R j , t + β 1 t e m p i t h + β 2 t e m p i t h 2 +   β 3 h u m i d i t h + β 4 p r i c e i t h + β 5 h o l i d a y t + δ i t +   δ t h + ε i t h
where Useith is the energy consumption of household i used in hour h on t day from January to April 2020, and Rj,t is the time-varying reproduction number of COVID-19 that represents the risk of infection at week t for each week (from the 6th week 2020, when the local infection began in Daegu at that time). α is the parameter of most interest, —that is, a value that estimates the effect of the COVID-19 on the average household energy consumption, which multiplied by 100 gives the rate of change. This study uses α to estimate the impact of COVID-19, which enforce people to stay indoors in the prohibition period, on the household energy consumption. The people may use less electricity because they go out to be active. Similarly, a decline in outdoor activity due to social distancing may result in increase of household electricity usage. tempith and humidith are weather variables, which are respectively temperature and humidity, of the closed location of the household i in hour h on t day. In [20,21,22], the temperature has the relationship between electricity consumption and temperature shows a U-shape. Therefore, if Equation (1) also has the U-shape relationship, the robustness of Equation (1) could be checked. In [23], the residential customer is more sensitive to average price rather than marginal or expected marginal price. Therefore, priceith is the average electricity price of each household. holidayt is the dummy variable for holidays. β1–5 are coefficients for each exogenous variable of residential energy consumption for description and summary statistics of the data described in Table 2, respectively. In addition, δit is the individual fixed effects of household, household-month, and household-weekday-month to check the robustness of household energy consumption model. δth is the time fixed effects of hour-weekday, which captures weekday specific change of hourly energy consumption. The standard errors were clustered by each household’s daily level in Equation (1). Equation (1) is used to estimate the impact of social distancing by each demographic characteristic group.
Furthermore, another important topic is an impact on each groups’ energy usage pattern. Therefore, the extended models are used to capture the impact of COVID-19 on each group’s hourly energy consumption. G h j are dummies for capturing impact on residential hourly usage in each group. The same notation in Equation (1) is used in Equation (2). The models are given as follows:
l n ( U s e i t h ) = h = 1 j = 24 j G h j ( α 1 , h + α 2 , h R j , t ) + β 1 t e m p i t h + β 2 t e m p i t h 2 + β 3 h u m i d i t h + β 4 p r i c e i t h + β 5 h o l i d a y t + δ i t + ε i t h
The household cluster level of standard error is used in these models. A parametric bootstrapping algorithm is conducted to make mean and confidence intervals of the model coefficients [21]. The average of hourly consumption in hour h and calculated mean and 95% confidence intervals are used to estimate the hourly impact of the time-varying reproduction number 1.94 from 1 March to 7 March 2020, which is the first social distancing week as shown in Table 1. The model for estimating the hourly impact is given as follows:
I m p a c t h = U s e h ( 1 + e 1.94 × α 2 , h )

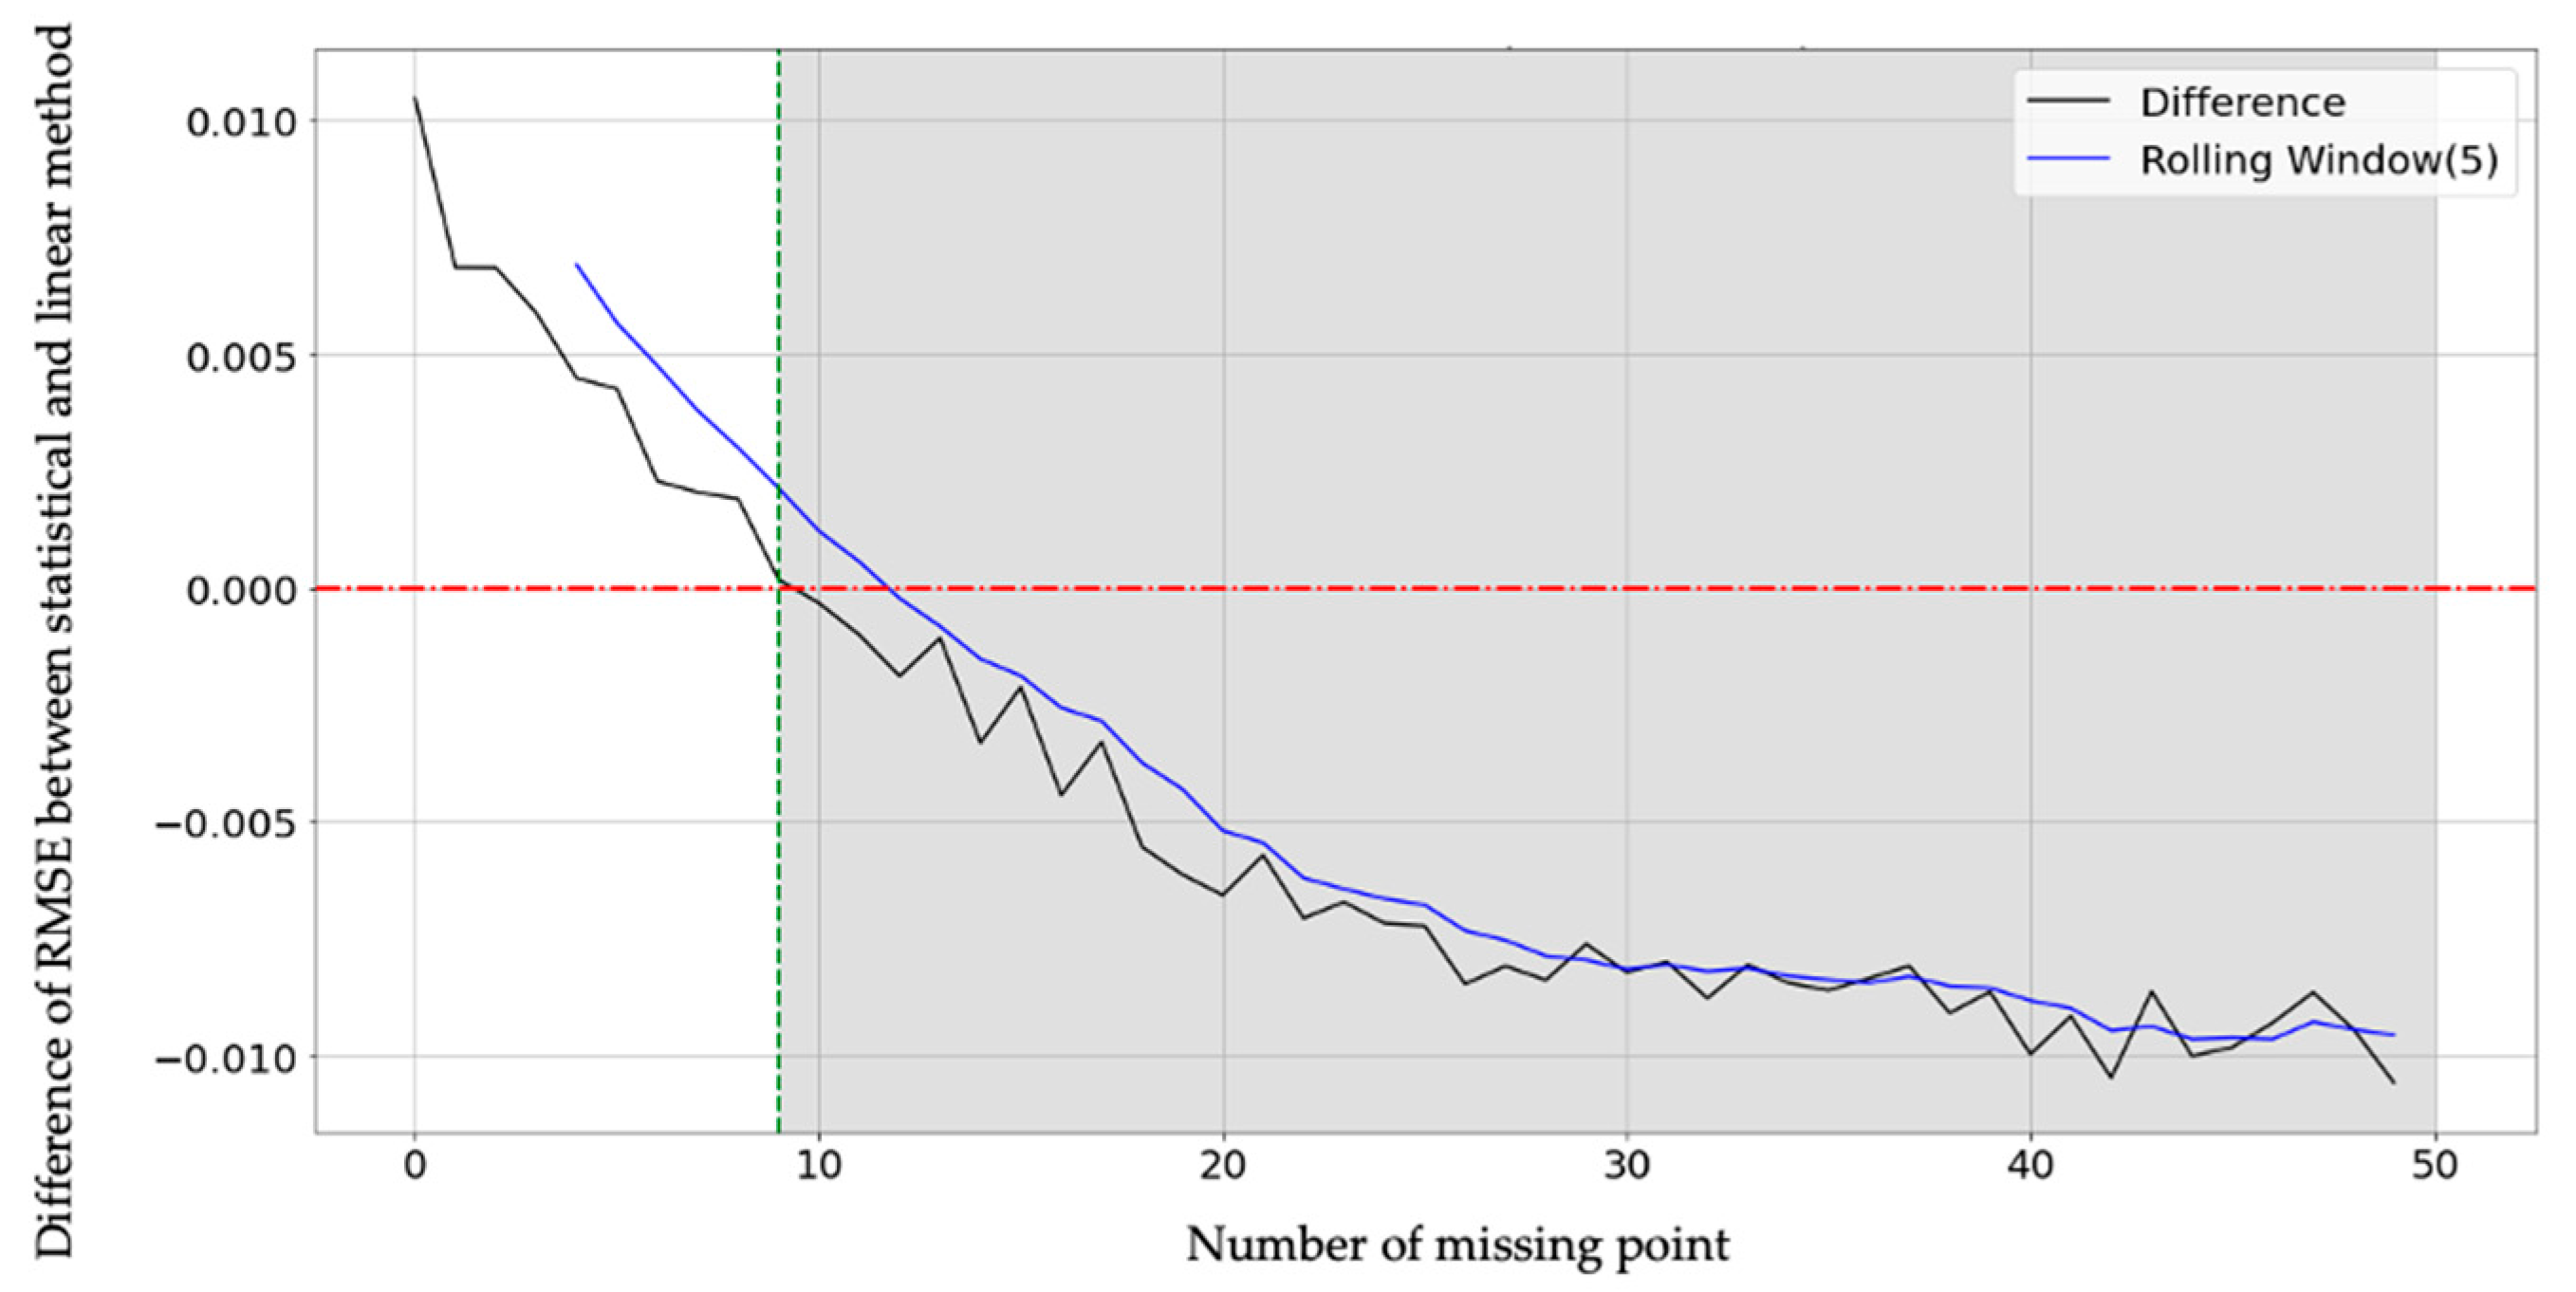
3.2. The Method for Hybrid-Imputation Model for Missing Data

To fill in missing data values, a hybrid method combining statistical and linear method is used. Household energy consumption is driven by human behavior. Therefore, household energy consumption can be divided into two categories: first, because the consumption is consistent over a short period of time, the short missing intervals can be replaced with the available surrounding measurements; second, a person’s behavior can be characterized during specific time intervals such as commute/work. Various methods exist to replace the missing variables. The linear interpolation is a commonly used method and is often used in short missing intervals that characterize continuous use. yL is the energy consumption of the time c to be replaced, and y h a and y h b are the energy consumptions at the time when there is no missing value adjacent to hc, and if the trailing time of ha, hb, and hc are the preceding times. The linear interpolation method is as follows:
y c L = y h b + y h a y h b h a h b ( h c h b ) ,       h b < h c < h a
The linear imputation is fast and simple. However, the linear interpolation method has a disadvantage in that the performance decreases when the missing interval becomes longer [24]. To compensate for this shortcoming, the missing values in long intervals are replaced by utilizing statistical values in an hour, day of the week, or month. Therefore, a statistical imputation method is required. Statistical imputation is a method by which the distribution of the time at which the month and day of the time to be replaced is the same, and the missing value can be replaced by the median value of the corresponding time [25]. For example, in the case of a person living alone, because they go to work around 8 a.m. on weekdays, there is no special energy consumption. Consequently, the user’s behavior pattern of consumption data is contained, and the accuracy of the model can be improved by performing substitution using the median value. Here, the median value is used because it is less affected by anomalous data than the average value. The statistical method is as follows:
y h S = m e d i a n ( z ) ,   w h e r e   z y j , j θ h
where θh represents the set of previous h hours that have the same month and day, and z is the energy consumed during θh time. Hybrid imputation adopts a method that introduces the Monte Carlo scenario [26] to find optimal point of the above two methods. After selecting a household with no missing values for a specific month, the missing scenario is generated randomly, and the RMSE of the two imputations algorithms is calculated to determine the optimal replacement method.

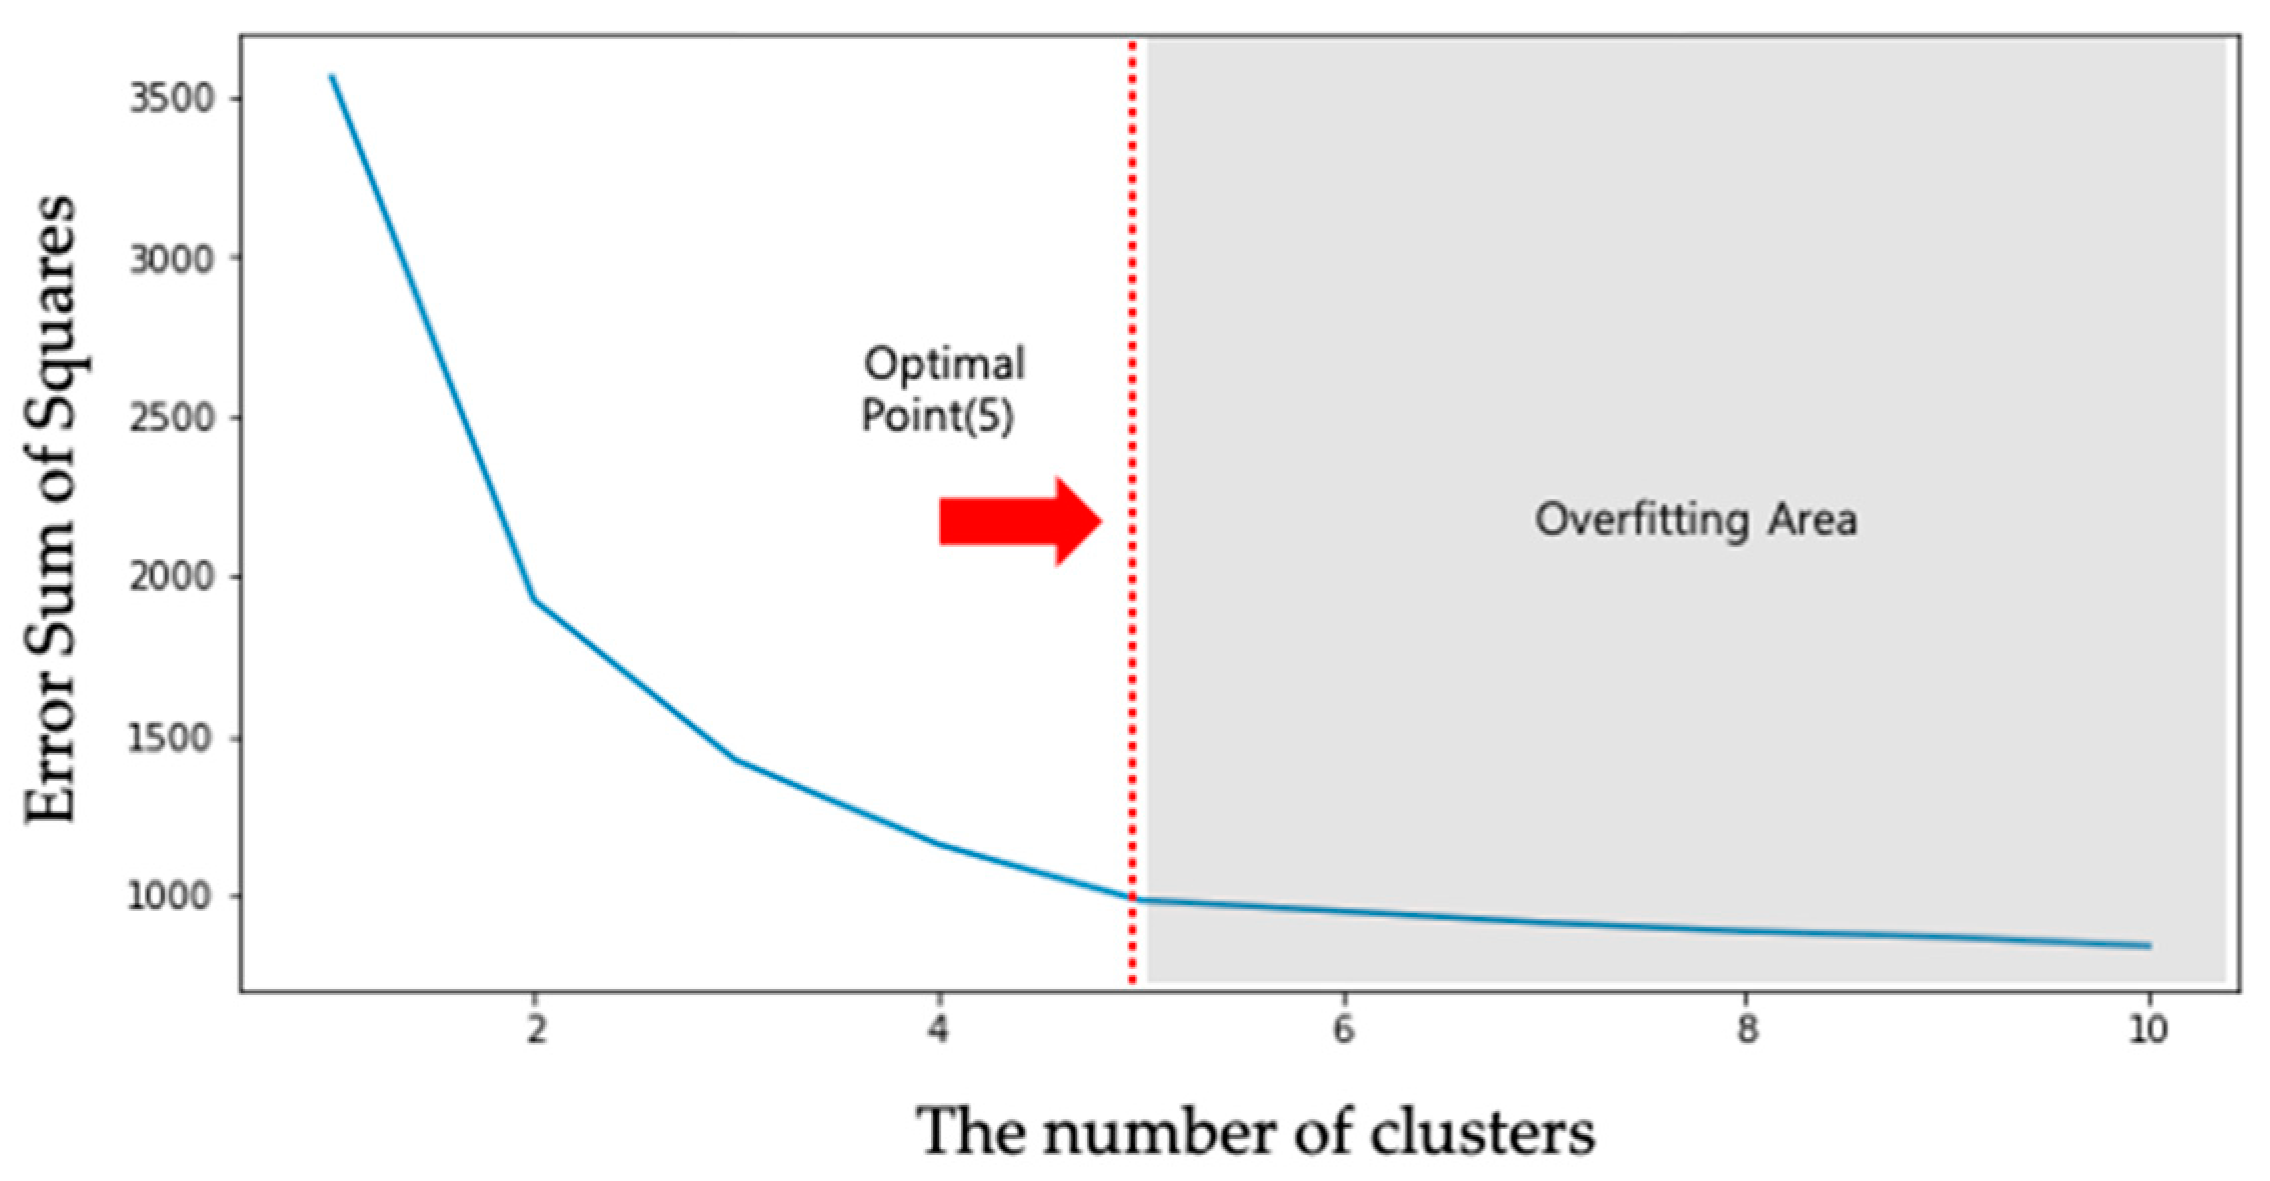
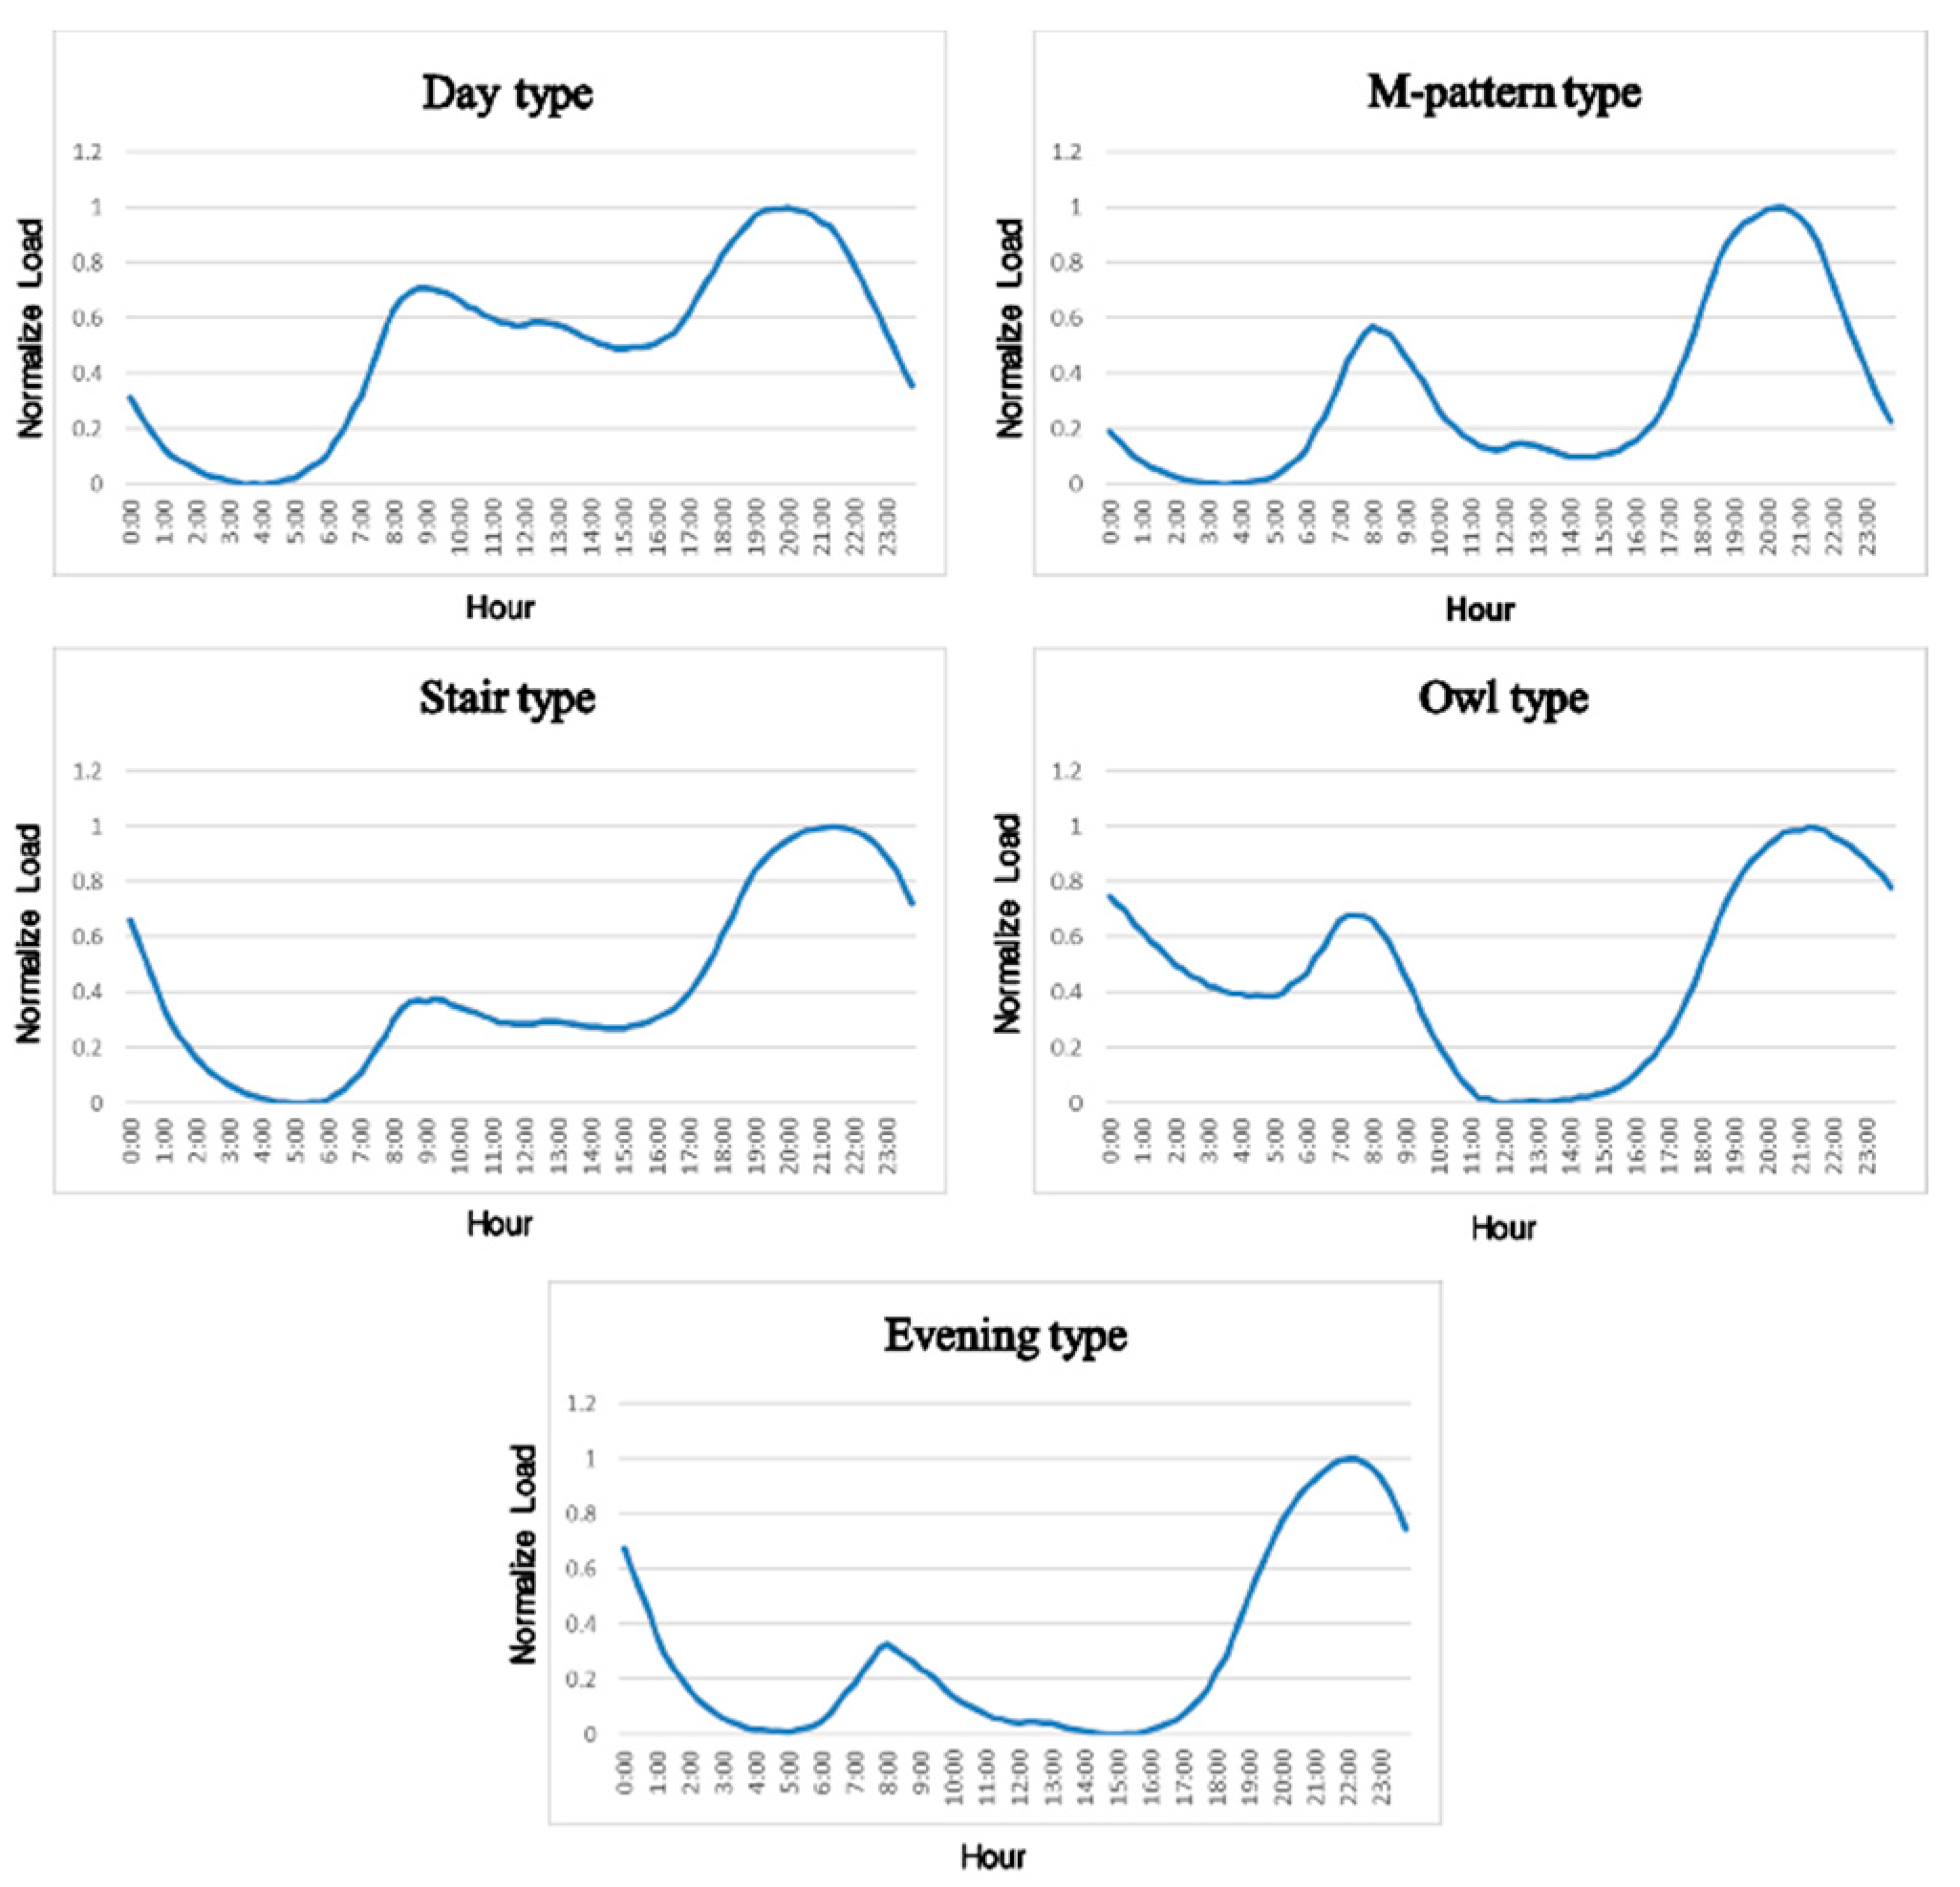
3.3. The Method for Clustering of Household Load Shape

As an initial stage for grouping, the representative load pattern of each household energy consumption was derived from median value of hourly energy consumption [27]. Normalization is performed using the maximum and minimum normalization of the representative load pattern for each household [28]:
N o r m a l i z e d _ L i , h = L i , h m i n ( L i ) m a x ( L i ) m i n ( L i )  
where Normalized_Li,h is the normalized energy consumption of customer i at time h, Li,h is the average energy consumption of customer i at time h, and Li is the load profile of customer i. To use the clustering method for the household load profile, there are various clustering methods such as Kohonen self-organizing map (SOM), hierarchical clustering, K-medoids, and Fuzzy C-means. However, there are no statistically significant improvements compared to K-means in clustering of load shape of household energy consumption data. Therefore, in this study, the K-means algorithm is chosen for the sake of simplification [29,30]. The K-means algorithm is used to determine the optimal number of groups. Moreover, there is no significant difference between the elbow method and the silhouette score in finding the optimal number K [31]. Therefore, the elbow method is adopted in this study. The number of groups K is optimized using the elbow method—the elbow method optimizes the number of groups by using the difference in distance between the household in the center of each group and the households in the group. It can determine the optimal point using the sum of squared error (SSE), which is calculated as follows [32,33]:
S S E = k = 1 n h = 0 23 ( a i , h c k , h ) 2   w h e r e   a i c k  
where n is the number of clusters, ck,h is the normalized energy consumption of the kth cluster center point at time h, ai is the household in ck and ai,h is the normalized energy consumption of customer i at time h. If the value of K increases, the SSE decreases.

3.4. Procedure of Proposed Method

The generic procedure for analyzing the impact of social distancing enforced by COVID-19 on household energy consumption, shown in Figure 1, can be described as follows:
Step (1) Find optimal point of each imputation method.
Step (2) Impute the missing data by using the proposed hybrid method.
Step (3) Cluster household usage pattern by using k-means.
Step (4) Estimate the impact of the time-varying reproduction number of COVID-19 on household energy consumption by using a two-way fixed effect.
Step (5) Check the robustness of the impact of the time-varying reproduction number on household energy consumption.
Step (6) Estimate the impact of COVID-19 on household energy consumption by each demographic characteristic groups.
Step (7) Estimate the impact of COVID-19 on the hourly household energy consumption by load shape.

4. Empirical Results

4.1. Results of Hybrid Imputation and Clustering of Household Load Shape

The Monte Carlo scenario is performed by extracting 200 households with no missing data and COVID-19 from the energy consumption data for January–February 2020. Figure 2 shows the results indicating the algorithm is more advantageous when it comes to handling missing values. In intervals that are not grayed out, which means the number of missing values is less than nine per day, the linear imputation method performs better than the statistical imputation method. However, the longer the missing interval, the more accurate the statistical imputation method.
In Figure 2, the difference between the linear and statistical interpolation RMSE is negative during the grayed-out intervals, indicating that statistical imputation method to be advantageous in periods with missing intervals of 10 points or more. Therefore, in this study, for missing intervals with a length equal to or less than 9 points, the analysis is performed by interpolating linearly and for missing intervals with a length greater than 9 points, the statistical imputation method is used.
Based on the grouping results, the energy consumption of home customers is divided into five patterns. Figure 3 shows the optimal number of groups using the elbow method. In Figure 3, the slope is reduced at point which the sum of the total SSE of five cluster. In Figure 4, 1133 customers are classified into Day (133 households), M-pattern (326 households), Stair (278 households), Owl (108 households), and Evening types (288 households) based on their energy consumption patterns.
The day type shows energy use during the day which means that someone uses appliances in the house at lunchtime. The M-pattern type shows that there is a temporary increase in energy consumption during the morning period for going to work and no electricity usage until the evening before energy usage increased during the evening hours after work. It is assumed in households in this pattern that all family members have a job. The stair type shows a usage pattern where electricity consumption increases in the morning, is constant in the afternoon, and increases in the evening. The owl type shows high energy consumption during the night and maybe the typical energy use pattern of the single-person residential customer. The evening type shows a group whose consumption increases briefly in morning hours, then is rarely used during the day, before increasing again in the evening. The evening type is the typical energy use pattern of customers not being home in the afternoon and beginning their evening routine after leaving the office.

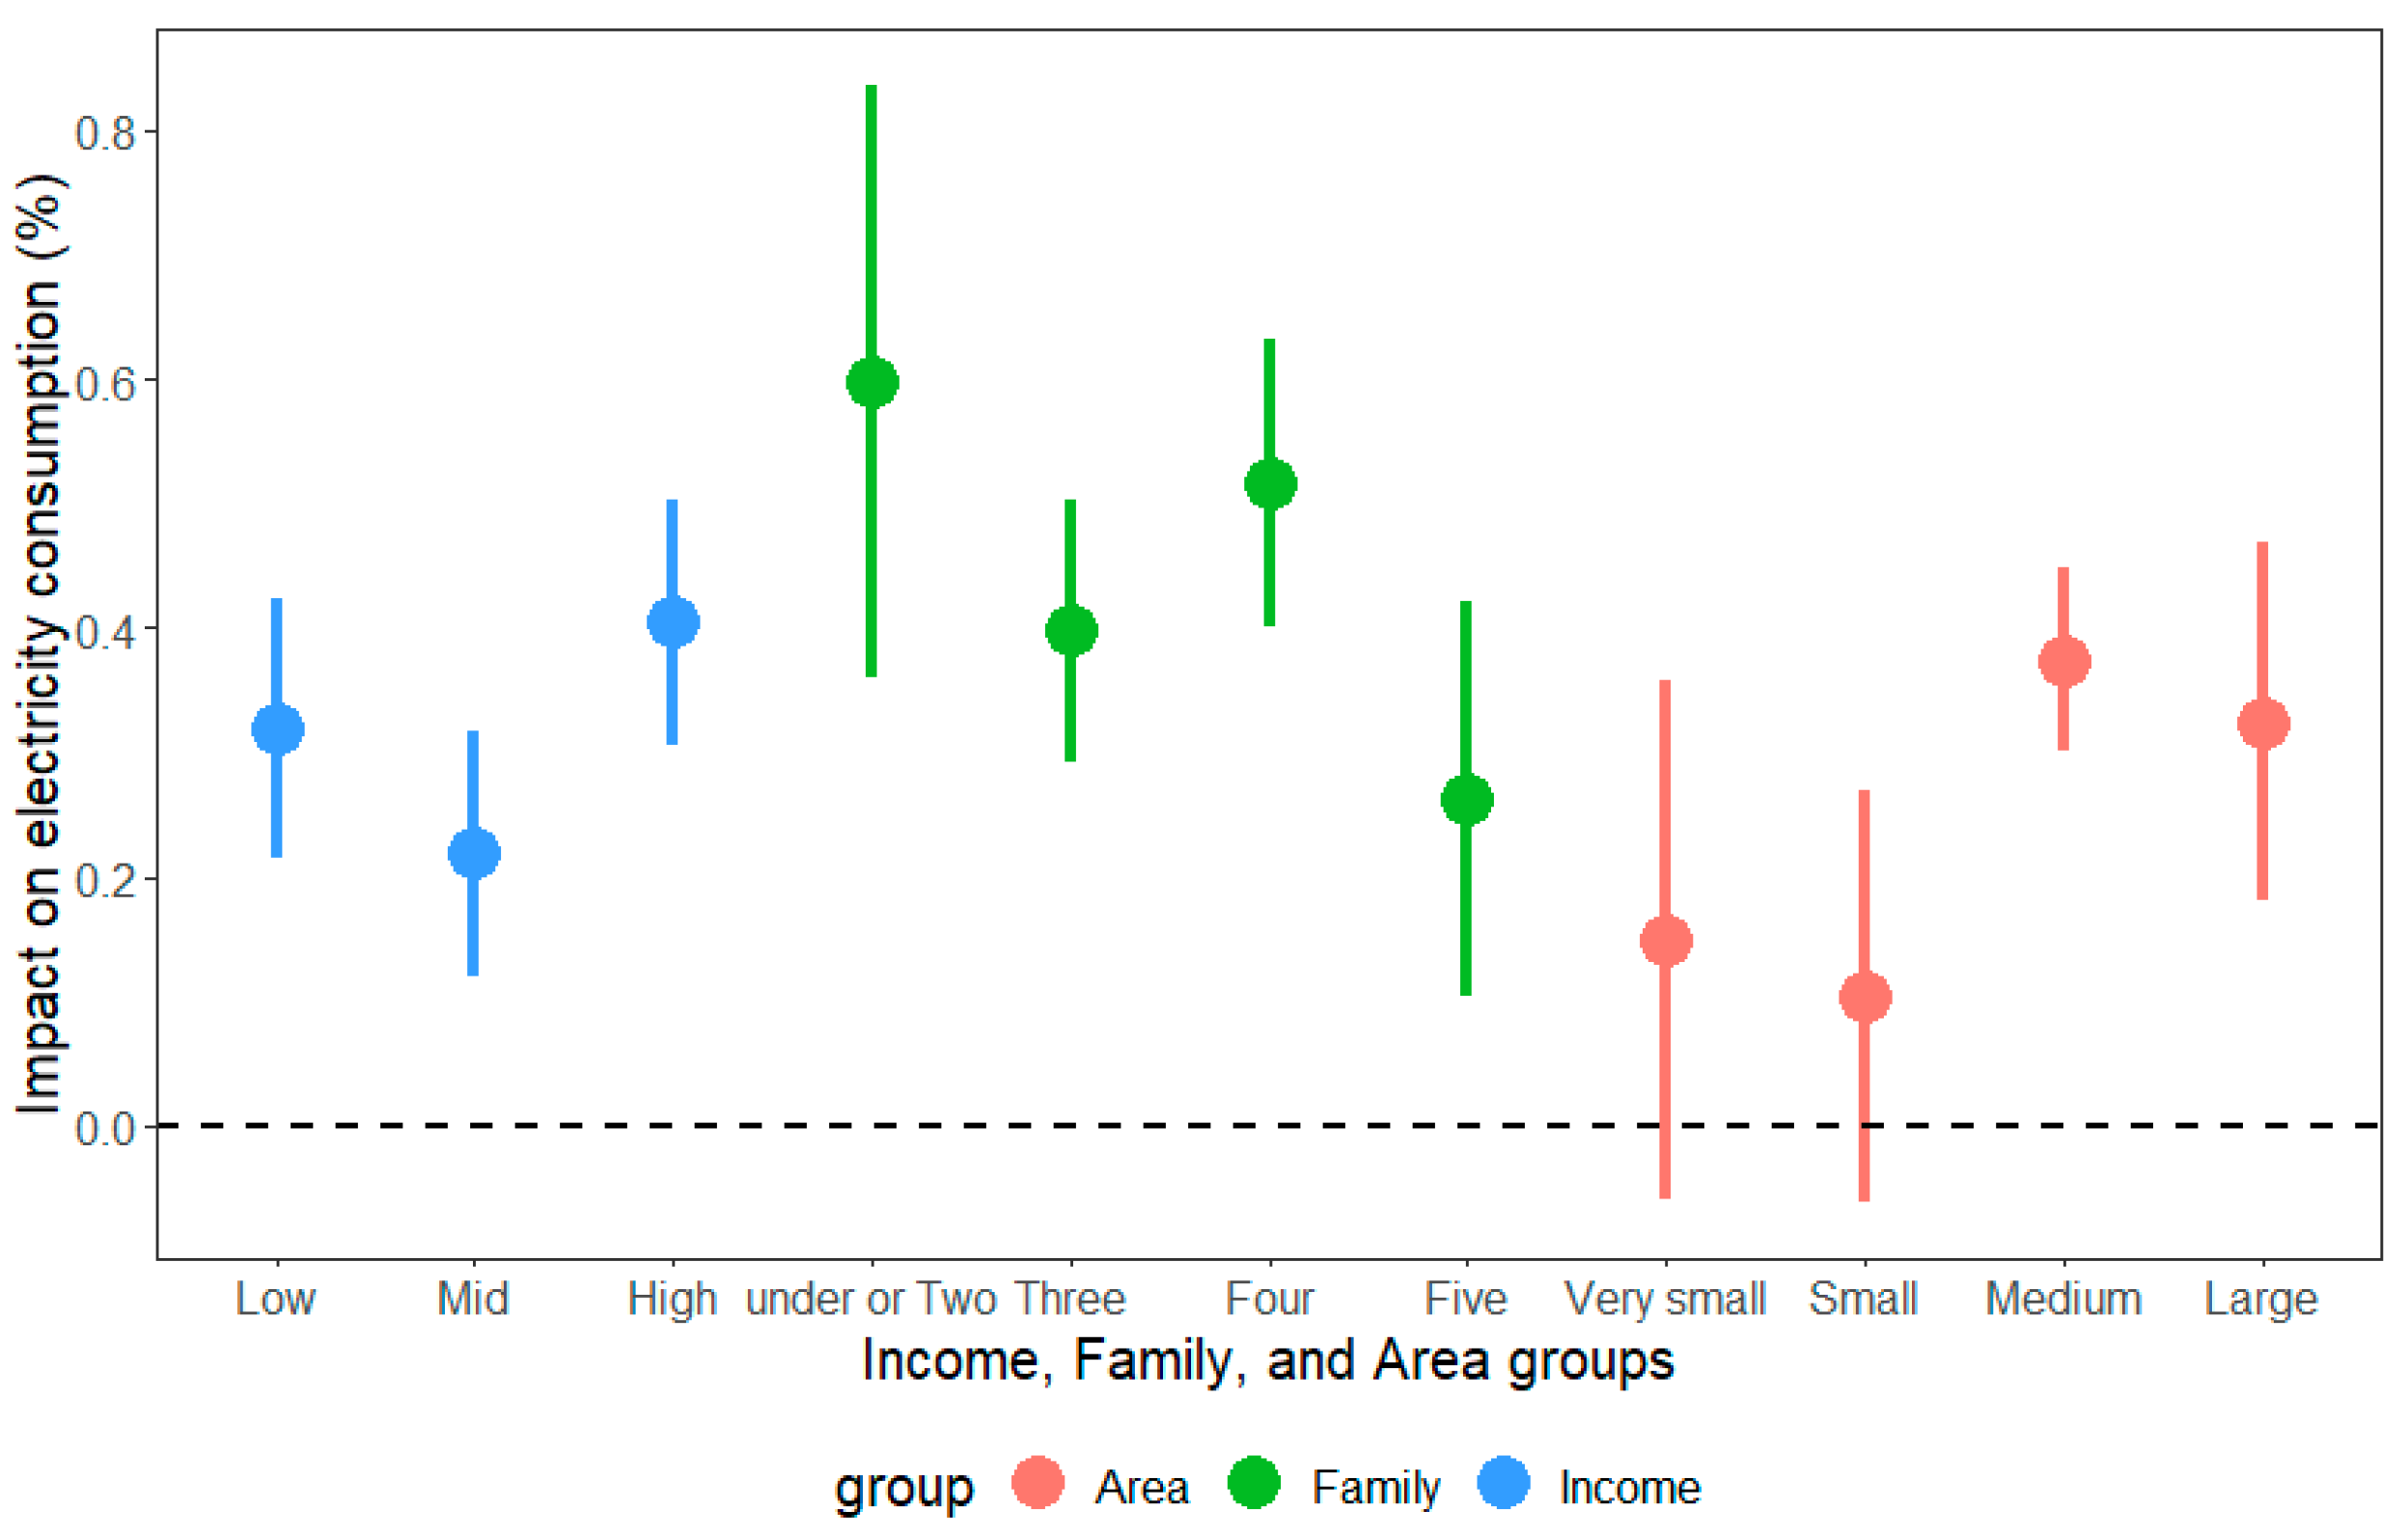
4.2. Empirical Results for Impact of Social Distancing in Korea

First, the impact of COVID-19 on household energy consumption is analyzed by using Equation (1) during January–April 2020, which is the period included in social distancing enforced by COVID-19. To check the robustness of estimating the significance of the parameter at different sets of household and time dummies, the individual fixed effect is introduced with three sets of dummies. The household level means estimating each coefficient for the entire date period for each household. For the household month level, each coefficient is estimated by clustering by month for each household. Finally, at the household-month-weekday level, each coefficient is estimated by clustering the weekdays and weekends of the month for each household. Therefore, the robustness check of the proposed household energy consumption model was performed by different individual fixed effects, as shown in Table 4.
The inspection of robustness for the interested coefficient of reproduction number of COVID-19 shows statistical significance in each model although the individual effect is changed. The time-fixed effect has not changed because it is obvious that household energy consumption has different patterns on weekends and weekdays. Therefore, the significant positive impact of the time-varying reproduction number on household energy consumption is shown. Given all the models presented, the estimated impact is robust and statistically significant at the level of 0.01. The house energy consumption models presented in Table 4 show that an average increase of 0.3% in the hourly average energy usage is caused by a unit increase in the time-varying reproduction number of COVID-19. Other statistical control variables such as temperature, humidity, hourly electricity price, and holiday dummy are also statistically significant. The result of the temperature factor presents that the relationship between electricity consumption and temperature shows a U-shape. This shape means that if the temperature rises to a mild level, electricity use decreases. If the temperature rises to a level beyond mild, the electricity use increases. A similar result has also been presented in previous impact of climate studies [21,34].
Second, since the M3 model has the highest adjusted R-squared among the models in Table 4, the M3 model is performed to analyze each target group such as income status, family member, and housing area. Figure 5 shows whether the impact of the time-varying reproduction number of COVID-19 on household energy consumption in response to demographic characteristics for each group. The income group is divided into three groups: low-income, middle-income, and high-income. The family group is divided into four groups including under or two, three, four, and five group. Moreover, the area group consists of four groups, which are very small, small, medium, and large. Detailed statistical information for each group is given in Table 3.
Because The M3 model has most high Adjusted R-squared between Models in Table 4, the M3 model is performed to conduct regression analysis for each target groups, which are income status, family member, and house area. In Figure 5, the solid dots represent the coefficient converted into an impact percentage that measures the impact on household energy consumption when the time-varying reproduction number of COVID-19 increases by one unit, and the vertical lines represent 95% confidence levels. Looking at income group, low income tends to live in house that are not energy efficient and to have appliances with low energy efficiency, as shown in existing studies, which can cause a high increase in electricity consumption of low-income households compared to mid-income households. Furthermore, mid-income groups show less impact on energy consumption compared to both low-income and high-income group, which means mid-income groups have energy-efficient homes and appliances, compared to low-income and high-income groups who might need more energy due to large areas occupied and the number of family members [20,35,36]. According to the results of the number of family members, groups of two household members or less shows the largest increase in household electricity consumption in response to a unit increase in the time-varying reproduction number. Because single-member and two-group consumers have little activity at home during the pre-social distancing period, working from home during the social distancing period may increase in electricity consumption. As the number of family members increases, the change in electricity consumption affected by social distancing tends to decrease, the large number groups might use more electricity before social distancing. For area groups, large area consumers increase household energy consumption more than other area groups. The empirical results imply that if the area of the house is large, there might be many family members and the income might be high, so the household energy consumption increases the most during the social distancing period.
Finally, in Figure 6, using Equation (3) with the load shape group for household consumers, the results show the impact of the time-varying reproduction number of COVID-19 on the hourly household energy consumption during the first week of social distancing. The shaded areas, which represent 95% confidence intervals, and solid lines are generated by the bootstrapping procedure using Equations (2) and (3) [21]. In daytime hours, all groups’ changes in energy consumption have a positive impact on the household energy usage. This reflects that people tend to have curtailed outdoor activities during daytime hours because of social distancing. During night-time hours, the M-pattern type group was most affected by social distancing, because it usually had the least usage at night-time compared to other groups as shown in Figure 4. For the opposite reason, the groups that used electricity at night-time during pre-social distancing period was less affected than the M-pattern. This means that there is less opportunity to increase indoor activities at home in the night-time. In morning hours, all groups except for owl and M type group show the small negative change in energy consumption due to work from home and remote classes. The reason is that people slept more during morning hours because there was no need to prepare to go out.

5. Discussion

In this study, statistical and linear interpolation methods are applied by creating a scenario in which missing data occurred using the Monte Carlo technique. If the missing data are short, the linear interpolation method performs better. The statistical interpolation method has better results if the missing data is longer. K-means clustering is performed using the representative load pattern. The elbow method is used to optimize the grouping of K-means clustering. As a result, 1133 households are classified into five groups, which are Day type, M-pattern type, Stair type, Owl type, and Evening type.
In the results of household energy consumption model, this study shows three key implications. First, a numerical time-varying reproduction number of COVID-19 is a useful factor for reflecting the impact of the COVID-19 pandemic on household energy consumption. In order to reflect the intensity of the COVID-19 spread situation, a numerical time-varying reproduction number is used instead of a dummy variable. As a result, an average increase of 0.3% in the hourly average energy consumption is influenced by a unit increase in the time-varying reproduction number of COVID-19. This result might seem rather low compared to the increase rate presented in previous studies [8,14,15,16]. However, unlike other countries, Korea has responded to the spread of COVID-19 through social distancing rather than lock-down [37]. Therefore, the increase in household electricity consumption would be relatively small as Koreans could move more freely during the COVID-19 pandemic than people from other countries. Furthermore, whereas previous studies showed a large percentage of change by estimated in specific industries, regions, and national sectors [8,14,15,16,37,38,39], this study estimated the COVID-19 impact on the hourly electricity usage of each household during the social distancing period.
Second, the results of this study remind policymakers of the problem that COVID-19 is more impact on low-income families than others. Many countries imposed mandatory stay-at-home orders and take various actions to discount electricity bills. Therefore, the low-income families should be more supported by the government if a pandemic is repeated like in Indonesia. In Indonesia, poor people could use free electricity from 24 April 2020 [40].
Last, The COVID-19 impact on each load shape is related to their energy consumption patterns. In addition, there are the same patterns as previous studies. As like [16,39], In morning hours, patterns are shown the negative change in energy consumption due to work from home and remote classes. However, previous studies showed the greatest impact in the daytime, otherwise in this paper, when subdivided by pattern and analyzed, some groups were more affected by social distancing during the night-time hours. This result indicates that if some households did not used electricity in night-time hours before the pandemic, their electricity usage could increase significantly in the daytime as well as night-time.

6. Conclusions

The household energy consumption model is used to analyze the impact of COVID-19 reproduction number on household energy consumption. The impact of COVID-19 reproduction numbers is significantly positive; they increase household energy consumption by 0.3%. As a result, if the COVID-19 reproduction number increases due to increasing local infection, most households’ energy consumption will increase. Most people do not have to physically go to work and school because they can opt for work from home and remote classes. This could be seen as a decrease in energy consumption in the early morning. In addition, the energy consumption from daytime to night-time hours increases. An analysis of the impact on each demographic characteristic group by using a robust model is conducted. For income groups, the impact of social distancing on household energy consumption is small to mid-income groups’ energy consumption. However, low-income groups’ energy consumption is more affected by social distancing than the mid-income group. For family member groups, the smaller the number of family members, the greater the impact of COVID-19 on household electricity consumption. For house area groups, the change enforced by social distancing in electricity consumption increases as the house area increases. The extended household energy consumption model is used to investigate how the different impacts of COVID-19 reproduction numbers are analyzed by hours depending on each load shape. According to each load shape, the effect of electricity consumption is different in the morning, daytime, and night-time hours.
However, there is the limitation of the availability of the time-varying reproduction number of COVID-19. Because it is not possible to count the number of COVID-19 infected people in real-time, calculating and adopting the time-varying reproduction number of COVID-19 in an hour could be physically difficult.
The empirical results show that the method presented with time-varying reproduction numbers has been able to reach the best estimator of the impact of social distancing. Thus, the results of this study have implications for electrical utility power systems in response to the COVID-19 pandemic.

Author Contributions

M.J. performed the research and wrote the manuscript. H.C.J. helped with the clustering algorithm and analysis. T.K. helped with the original draft and revised the manuscript. D.H.S. helped design the model and performed the numerical simulations. S.-K.J. provided guidance for the research and revised the manuscript. All authors have read and agreed to the published version of the manuscript.

Funding

This work was supported by the Korea Institute of Energy Technology Evaluation and Planning (KETEP) and the Ministry of Trade, Industry & Energy (MOTIE) of the Republic of Korea (No. 20181210301430). This research was supported by the Basic Research Program through the National Research Foundation of Korea (NRF) funded by the MSIT (No. 2020R1A4A1019405).

Institutional Review Board Statement

Not applicable.

Informed Consent Statement

Not applicable.

Data Availability Statement

Not applicable.

Acknowledgments

This work was supported by the Korea Institute of Energy Technology Evaluation and Planning (KETEP) and the Ministry of Trade, Industry & Energy (MOTIE) of the Republic of Korea (No. 20181210301430). This research was supported by the Basic Research Program through the National Research Foundation of Korea (NRF) funded by the MSIT (No. 2020R1A4A1019405).

Conflicts of Interest

The authors declare no conflict of interest.

References

  1. WHO Website. 2021. Available online: https://covid19.who.int/ (accessed on 1 January 2021).
  2. Pillay, A. COVID-19 Crisis: Lockdown Knocks Power Use down 20–40% in Some Cities. The Business Standard. 19 June 2020. Available online: https://www.business-standard.com/article/economy-policy/lockdown-knocked-power-consumption-down-by-up-to-40-in-large-cities-120061800951_1.html (accessed on 21 January 2021).
  3. IEA. International Energy Agency, COVID-19 Impact on Electricity. 2021. Available online: https://www.iea.org/reports/covid-19-impact-on-electricity (accessed on 21 January 2021).
  4. ETEnergyWorld. Worldwide Lockdowns to Reduce Nuclear Power Output by 3 Per Cent in 2020. 1 May 2020. Available online: https://energy.economictimes.indiatimes.com/news/power/worldwide-lockdowns-to-reduce-nuclear-power-output-by-3-per-cent-in-2020/75493688 (accessed on 9 January 2021).
  5. Meinrenken, C.J.; Modi, V.; Mckeown, K.R.; Culligan, P.J. New Data Suggest COVID-19 Is Shifting the Burden of Energy Costs to Households. 21 April 2020. Available online: https://news.climate.columbia.edu/2020/04/21/covid-19-energy-costs-households/ (accessed on 1 February 2021).
  6. Times, T.E. India’s Power Consumption Shrinks 9.24% at 100.13 BU in March 2020. 2020. Available online: https://economictimes.indiatimes.com/industry/energy/power/indias-power-consumption-shrinks-9-24-at-100-13-bu-in-march/re_show/74933363.cms (accessed on 1 February 2021).
  7. IESO. Reliability Outlook: An Adequacy Assessment of Ontario’s Electricity System from October 2020 to March 2022. September 2020. Available online: https://www.ieso.ca/en/Sector-Participants/Planning-and-Forecasting/Reliability-Outlook (accessed on 17 February 2021).
  8. Aruga, K.; Islam, M.; Jannat, A. Effects of COVID-19 on Indian energy consumption. Sustainability 2020, 12, 5616. [Google Scholar] [CrossRef]
  9. Pesaran, M.H.; Shin, Y.; Smith, R.J. Bounds testing approaches to the analysis of level relationships. J. Appl. Econom. 2001, 16, 289–326. [Google Scholar] [CrossRef]
  10. Chhetri, R. Effects of COVID-19 pandemic on household energy consumption at College of Science and Technology. Energies 2020, 3, 1383–1387. [Google Scholar]
  11. Carvalho, M.; Bandeira de Mello Delgado, D.; de Lima, K.M.; de Camargo Cancela, M.; dos Siqueira, C.A.; de Souza, D.L.B. Effects of the COVID-19 pandemic on the Brazilian electricity consumption patterns. Int. J. Energy Res. 2021, 45, 3358–3364. [Google Scholar] [CrossRef]
  12. Lusis, P.; Khalilpour, K.R.; Andrew, L.; Liebman, A. Short-term residential load forecasting: Impact of calendar effects and forecast granularity. Appl. Energy 2017, 205, 654–669. [Google Scholar] [CrossRef]
  13. Fan, S.; Methaprayoon, K.; Lee, W.-J. Multiregion load forecasting for system with large geographical area. IEEE Trans. Ind. Appl. 2009, 45, 1452–1459. [Google Scholar] [CrossRef]
  14. Krarti, M.; Aldubyan, M. Review analysis of COVID-19 impact on electricity demand for residential buildings. Renew. Sustain. Energy Rev. 2021, 143, 110888. [Google Scholar] [CrossRef]
  15. Snow, S.; Bean, R.; Glencross, M.; Horrocks, N. Drivers behind residential electricity demand fluctuations due to COVID-19 restrictions. Energies 2020, 13, 5738. [Google Scholar] [CrossRef]
  16. Bielecki, S.; Skoczkowski, T.; Sobczak, L.; Buchoski, J.; Maciąg, Ł.; Dukat, P. Impact of the Lockdown during the COVID-19 Pandemic on Electricity Use by Residential Users. Energies 2021, 14, 980. [Google Scholar] [CrossRef]
  17. Gostic, K.M.; McGough, L.; Baskerville, E.B.; Abbott, S.; Joshi, K.; Tedijanto, C.; Kahn, R.; Niehus, R.; Hay, J.A.; De Salazar, P.M.; et al. Practical considerations for measuring the effective reproductive number, Rt. PLoS Comput. Biol. 2020, 16, e1008409. [Google Scholar] [CrossRef]
  18. Yoo, M.S.; Kim, Y.J.; Baek, S.J.; Kwon, D.H. The concept of reproduction number and changes according to government response policies. Wkly Health Dis. 2020, 14, 282–289. [Google Scholar]
  19. Liu, S.; Kong, G.; Kong, D. Effects of the COVID-19 on air quality: Human mobility, spillover effects, and city connections. Environ. Resour. Econ. 2020, 76, 635–653. [Google Scholar] [CrossRef] [PubMed]
  20. He, P.; Liang, J.; Qiu, Y.L.; Li, Q.; Xing, B. Increase in domestic electricity consumption from particulate air pollution. Nat. Energy 2020, 5, 985–995. [Google Scholar] [CrossRef]
  21. Eom, J.; Hyun, M.; Lee, J.; Lee, H. Increase in household energy consumption due to ambient air pollution. Nat. Energy 2020, 5, 976–984. [Google Scholar] [CrossRef]
  22. Li, Y.; Pizer, W.A.; Wu, L. Climate change and residential electricity consumption in the Yangtze River Delta, China. Proc. Natl. Acad. Sci. USA 2019, 116, 472–477. [Google Scholar] [CrossRef] [PubMed] [Green Version]
  23. Ito, K. Do consumers respond to marginal or average price? Evidence from nonlinear electricity pricing. Am. Econ. Rev. 2014, 104, 537–563. [Google Scholar] [CrossRef] [Green Version]
  24. Peppanen, J.; Zhang, X.; Grijalva, S.; Reno, M.J. Handling bad or missing smart meter data through advanced data imputation. In Proceedings of the 2016 IEEE Power & Energy Society Innovative Smart Grid Technologies Conference (ISGT), Minneapolis, MN, USA, 6–9 September 2016. [Google Scholar]
  25. Borges, C.E.; Kamara-Esteban, O.; Castillo-Calzadilla, T.; Andonegui, C.M.; Alonso-Vicario, A. Enhancing the missing data imputation of primary substation load demand records. Sustain. Energy Grids Netw. 2020, 23, 100369. [Google Scholar] [CrossRef]
  26. Ferrenberg, A.M.; Swendsen, R.H. Optimized Monte Carlo data analysis. Comput. Phys. 1989, 3, 101–104. [Google Scholar] [CrossRef] [Green Version]
  27. Jang, M.; Jeong, H.C.; Kim, T.; Joo, S. Load Profile-Based Residential Customer Segmentation for Analyzing Customer Preferred Time-of-Use (TOU) Tariffs. Energies 2021, 14, 6130. [Google Scholar] [CrossRef]
  28. Tran, D.H.; Luong, D.-L.; Chou, J.-S. Nature-inspired metaheuristic ensemble model for forecasting energy consumption in residential buildings. Energy 2020, 191, 116552. [Google Scholar] [CrossRef]
  29. Chicco, G.; Napoli, R.; Piglione, F. Comparisons among clustering techniques for electricity customer classification. IEEE Trans. Power Syst. 2006, 21, 933–940. [Google Scholar] [CrossRef]
  30. Zhang, Y.; Chen, W.; Xu, R.; Black, J. A cluster-based method for calculating baselines for residential loads. IEEE Trans. Smart Grid 2015, 7, 2368–2377. [Google Scholar] [CrossRef]
  31. Saputra, D.M.; Saputra, D.; Oswari, L.D. Effect of distance metrics in determining k-value in k-means clustering using elbow and silhouette method. In Sriwijaya International Conference on Information Technology and Its Applications; SICONIAN.; Atlantis Press: Padang, Indonesia, 2020; pp. 341–346. Available online: https://www.atlantis-press.com/proceedings/siconian-19/125939938 (accessed on 1 November 2021).
  32. Zeng, J.; Wang, J.; Guo, L.; Fan, G.; Zhang, K.; Gui, G. Cell scene division and visualization based on autoencoder and k-means algorithm. IEEE Access 2019, 7, 165217–165225. [Google Scholar] [CrossRef]
  33. Jeong, H.C.; Jang, M.; Kim, T.; Joo, S.-K. Clustering of load profiles of residential customers using extreme points and demographic characteristics. Electronics 2021, 10, 290. [Google Scholar] [CrossRef]
  34. Davis, L.W.; Gertler, P.J. Contribution of air conditioning adoption to future energy use under global warming. Proc. Natl. Acad. Sci. USA 2015, 112, 5962–5967. [Google Scholar] [CrossRef] [PubMed] [Green Version]
  35. Nair, G.; Gustavsson, L.; Mahapatra, K. Factors influencing energy efficiency investments in existing Swedish residential buildings. Energy Policy 2010, 38, 2956–2963. [Google Scholar] [CrossRef]
  36. Liang, J.; Liu, P.; Qiu, Y.; Wang, Y.D.; Xing, B. Time-of-use electricity pricing and residential low-carbon energy technology adoption. Energy J. 2020, 41. Available online: https://www.iaee.org/energyjournal/article/3500 (accessed on 21 February 2021). [CrossRef]
  37. Kang, H.; An, J.; Kim, H.; Ji, C.; Hong, T.; Lee, S. Changes in energy consumption according to building use type under COVID-19 pandemic in South Korea. Renew. Sustain. Energy 2021, 148, 111294. [Google Scholar] [CrossRef]
  38. Cvetković, D.; Nešović, A.; Terzić, I. Impact of people’s behavior on the energy sustainability of the residential sector in emergency situations caused by COVID-19. Energy Build. 2021, 230, 110532. [Google Scholar] [CrossRef] [PubMed]
  39. Rouleau, J.; Gosselin, L. Impacts of the COVID-19 lockdown on energy consumption in a Canadian social housing building. Appl. Energy 2021, 287, 116565. [Google Scholar] [CrossRef] [PubMed]
  40. Qarnain, S.S.; Muthuvel, S.; Bathrinath, S. Review on government action plans to reduce energy consumption in buildings amid COVID-19 pandemic outbreak. Mater. Today Proc. 2021, 45, 1264–1268. [Google Scholar] [CrossRef] [PubMed]
Figure 1. Flowchart of the proposed procedure for analyzing the impact of social distancing on household energy consumption.
Energies 14 07523 g001
Figure 2. Difference of RMSE between statistical and linear imputation as the number of missing values increases.
Energies 14 07523 g002
Figure 3. Sum of squares error (SSE) of residential customers clustered using K-means and elbow method.
Energies 14 07523 g003
Figure 4. Results of five residential customer clustering utilizing K-means.
Energies 14 07523 g004
Figure 5. Change in each groups’ household energy consumption due to increase in the time-varying reproduction number of COVID-19.
Energies 14 07523 g005
Figure 6. Change in load shape groups’ household hourly energy consumption due to increase in the time-varying reproduction number of COVID-19.
Energies 14 07523 g006
Table 1. Estimated Reproduction Number During the Period March to April 2020 in Korea [18].
Week Index on 2020RjIssue
6 (2.2–2.8)1.5
7 (2.9–2.15)0.81
8 (2.16–2.22)9.351st regional infection in Daegu, Gyeongbuk (2.20–2.29)
9 (2.23–2.29)5.66
10 (3.1–3.7)1.94First social distancing (2.29–3.21)
11 (3.8–3.14)0.67
12 (3.15–3.21)0.45
13 (3.22–3.28)0.76Strengthened national social distancing (3.22–4.19)
14 (3.29–4.4)0.85
15 (4.5–4.11)0.67
16 (4.12–4.18)0.53
17 (4.19–4.25)0.58
18 (4.26–5.2.)0.59
Table 2. Summary of time variant variable statistics.
VariableUnitMeanStandard
Deviation
MinMaxObservation 1
UsekWh0.0390.670.0036.813,290,232
Temp°C6.096.13−1326.83,290,232
Humid%59.722.441003,290,232
PriceKRW/kWh99.513.693.3234.53,290,232
Note: 1 Use is extracted from smart meters, Temp and Humid are extracted from ASOS, and Price is calculated using Use for each household in January–April 2020.
Table 3. Summary of demographic characteristic.
CharacteristicUnitDescriptionPercentage
IncomeKRW≤2.4 million24%
2.41–5.50 million48%
≥5.51 million28%
Family memberperson≤Two38%
Three24%
Four28%
≥Five10%
House aream233.1–62.8 (i.e., very small)7%
66.1–95.6 (i.e., small)21%
99.2–128.9 (i.e., medium)54%
≥132.2 (i.e., large)18%
Table 4. Models to estimate the impact of COVID-19 on household energy consumption.
Dependent Variable: ln (Use)
M1M2M3
Rj0.004 ***0.003 ***0.003 ***
(0.0003)(0.0003)(0.0003)
temp−0.002 ***−0.0004 **−0.001 ***
(0.0002)(0.0002)(0.0002)
temp20.000010.000020.00002 **
(0.00001)(0.00001)(0.00001)
humid0.001 ***0.001 ***0.001 ***
(0.00003)(0.00003)(0.00003)
holiday0.008 **0.022 ***0.023 ***
(0.004)(0.003)(0.003)
price0.0005 ***−0.001 ***−0.001 ***
(0.0001)(0.00005)(0.00004)
Individual fixed effecthousehold-levelhousehold-month levelhousehold-month-weekday level
Time fixed effectweekday-hourweekday-hourweekday-hour
Observations3,289,9073,289,9073,289,907
R-squared0.4530.4950.503
Adjusted R-squared0.4530.4950.501
*,**,***, significance at 10%, 5%, and 1%.
Publisher’s Note: MDPI stays neutral with regard to jurisdictional claims in published maps and institutional affiliations.

