Article

Room HVAC Influences on the Removal of Airborne Particulate Matter: Implications for School Reopening during the COVID-19 Pandemic

1
Nieri Family Department of Construction Science and Management, Clemson University, Clemson, SC 29634, USA
2
Department of Materials Sciences and Engineering, School of Architecture, Clemson University, Clemson, SC 29634, USA
3
Glenn Department of Civil Engineering, Clemson University, Clemson, SC 29634, USA
4
Environmental Engineering and Earth Sciences, Clemson University, Clemson, SC 29634, USA
*
Author to whom correspondence should be addressed.
Energies 2021, 14(22), 7463; https://doi.org/10.3390/en14227463
Submission received: 12 October 2021 / Revised: 29 October 2021 / Accepted: 3 November 2021 / Published: 9 November 2021

Abstract

:
(1) Background: Many schools and higher education settings have confronted the issue of reopening their facilities after the COVID-19 pandemic. In response, several airflow strategies spanning from adding portable air purifiers to major mechanical overhauls have been suggested to equip classrooms with what is necessary to provide a safe and reliable environment. Yet, there are many unknowns about specific contributions of the building system and its design and performance on indoor air quality (IAQ) improvements. (2) Methods: this study examined the combined effect of ventilation type, airflow rates, and filtration on IAQ in five different classrooms. Experiments were conducted by releasing inert surrogate particles into the classrooms and measuring the concentrations in various locations of the room. (3) Results: we showed that while the distribution of particles in the space is a complex function of space geometry and air distribution configurations, the average decay rate of contaminants is proportional to the number of air changes per hour in the room. (4) Conclusions: rooms with a central HVAC system responded quicker to an internal source of contamination than rooms with only fan coil units. Furthermore, increasing the ventilation rate without improved filtration is an inefficient use of energy.

1. Introduction

Heating, ventilation, and air conditioning (HVAC) systems are essential elements of modern buildings. While the primary function of HVAC systems is to provide a more comfortable thermal environment, the design and efficiency of ventilation systems also play a significant role in the indoor air quality of buildings through reductions in aerosol and CO2 concentrations. Ventilation systems exchange potentially contaminated indoor air with clean air. This dilutes or removes pathogen-containing aerosols, thus reducing the inhaled dose to occupants [1]. Therefore, ventilation system design can be used as an engineering control method to decrease indoor particle concentration and decrease disease transmission risk [2]. However, buildings with a low air exchange rate, inefficient ventilation design, or a high occupant density have a much higher possibility for airborne infection. The HVAC system can also be the host of contamination. For example, indoor contamination has been reported to reside in ducts [3,4], diffusers [5], and filter media [6,7]. During the COVID-19 pandemic, some studies showed that the virus was found in the HVAC system [8,9].
Aerosol particles, also known as particulate matter (PM), are generated from various sources and are considered a major atmospheric pollutant that has been shown to have adverse effects on air quality, human health, and the global environment [10,11,12,13]. Many studies concerning the health effects of particulate matter have primarily focused on outdoor sources of pollution. However, the threat of long-term exposure to poor indoor air quality has become more significant in recent years. New buildings have become increasingly sealed against the outside environment to reduce heating and cooling energy costs. Furthermore, most people in developed countries spend, on average, up to 90 percent of their time indoors [14,15]. Thus, indoor air pollution, such as an airborne disease outbreak, can significantly impact health concerns, such as infection transmission, respiratory illness, allergies, and asthma [16].
Ventilation system design and operation are major factors in aerosol transport within buildings [17]. Indoors aerosol particles undergo a cycle of deposition and resuspension. Within indoor environments, surface material plays a factor in aerosol movement. Aerosol particles can deposit on furniture, carpet, or other upholstered items. However, even before reaching the indoor space, the aerosol particles in ducts will likely undergo several rounds of suspension and deposition within the ducts of the ventilation system themselves [18]. Many factors affect aerosols’ deposition in ventilation ducts, including particle size, airflow velocity, duct surface, and duct bends [18].
The recognition of aerosol transmission as a method for transmission of COVID-19 has increased interest in the quality of ventilation in high occupancy indoor environments, such as educational buildings and offices [19]. Early responses to the COVID-19 pandemic included closing schools and moving to remote learning. The reopening of education settings has been studied from the pedagogical and education perspectives. Especially for the younger generation, the experience gained in the physical environment is critical [20]. The COVID transmission rate was particularly low in elementary schools, perhaps due to lower infectivity and susceptibility among younger children. However, outbreaks have been reported in high schools and universities [21]. Though the evidence to support the role of school closure in preventing the transmission of COVID-19 is still sparse [22], there has been a significant body of literature supporting the importance of in-person interactions on students’ learning and performance [23]. There is, therefore, a balance between the educational benefits of reopening schools and the risks associated with COVID-19 transmission.
As schools consider resuming in-person learning, one significant concern is how to utilize engineering controls to reduce the spread of COVID-19 in educational spaces. The Centers for Disease Control and Prevention (C.D.C.) and the European Center for Disease Prevention and Control (ECDC) recommend consistent use of face masks, classroom layout modifications, and ventilation system upgrades or improvements, including increased total airflow supply [24,25]. For example, related to air quality and distribution indoors, ASHRAE recommends (a) daily air flush every day prior to occupancy, (b) disabling the demand control ventilation to allow maximum outside airflow 24/7, and (c) improving existing filtration to at least MERV 13. Theoretically, these recommendations make sense as previous studies have indicated that increasing the ventilation rate [26,27], outside air ratio [28,29], and stringent filtration [30,31,32] provide higher protection against airborne particles in indoor environments. However, an investigation that focuses on the practical implications of these engineering parameters in classroom environments seems necessary to provide evidence for any such recommendations.
In this work, we conduct a series of experiments on the ventilation performance of several classrooms across a university campus. Measurements of aerosol particle removal rates were made in classrooms in five buildings with a range of ages, sizes, and HVAC systems. We quantify aerosol particle removal in these classroom settings to help decision-makers assess the risk of virus transmission in existing classrooms. We hypothesize that the rate of ventilation air, filtration, and room size can impact the temporal and spatial distribution of aerosols synthetically generated in the room to embody pathogenic agents. We also hypothesize that depending on the HVAC type and configuration, the mixing efficiency of the classrooms can vary. These experimental measurements of ventilation efficiency and mixing efficiency in educational settings are this work’s primary novelty.

2. Materials and Methods

2.1. Theoretical Background

Prediction of particles’ spatial and temporal distribution in indoor environments requires solving the governing equation for particle transport in the Lagrangian (or Eulerian) frame of reference. Such a problem is formulated by a series of partial differential equations that can only be solved numerically and are very expensive. To simplify the problem, one can bring in the well-mixed assumption, which presumes that the spatial distribution of the contaminants is uniform (i.e., C ( t , x ) = C ( t ) ). Hence, the spatial term can be dropped, and the following differential equation for a room as a large control volume can be derived [33]:
V d c d t = Q s C s + S Q r C β * C
In Equation (1), V is the volume of the room, C is the particle concentration at time t, Cs is the particle concentration in the supply air, S is the particle generation rate, β* is the particle loss rate due to deposition, and Qs and Qr are the supply and return airflow rates, respectively. The particle concentration in the supply air can also be written as:
C s = α C o u t + ( 1 α ) ( 1 η )   C
where α is the percentage of outside air in the supply air, Cout is the particle concentration outside the room, and η is the filtration efficiency. In the context of this work, Cout can be assumed zero as the room-induced contamination (i.e., synthetically generated aerosols) is not found outdoors. In general, the generation term in Equation (1) can take any form (i.e., S = S(t)). However, one particular case is a sudden burst of particles into space, in which case the source manifests itself in the initial conditions ( S ( t = 0 ) = C 0   a n d   S ( t ) = 0   t [ 0 , T ] ). By combining Equations (1) and (2), setting β = β * V , and applying the mentioned assumptions, one can derive Equation (3) as follows:
d c d t = [ ( 1 α )   ( 1 η )   Q s V Q r V β ] C
The solution to Equation (3) can be written in exponential form as:
C ( t ) = C 0 e λ t
where C0 is the initial particle concentration, and λ is the decay rate and defined as:
λ = ( 1 α ) ( 1 η ) Q s V + Q r V + β
This equation can further be simplified by assuming equal supply and return flow rates ( Q s = Q r = Q ) in the form of Equation (6):
λ = Q V [ ( 1 α ) ( 1 η ) 1 ] + β
The first term on the right-hand side of Equation (6) ( Q V ) is known as the air change per hour (A.C.H.). It can be seen in Equation (6) that three distinct yet correlated mechanisms that contribute to the value of the decay rate (λ) are (a) the outside air ratio, (b) filtration, and (c) surface deposition. Though A.C.H. shows up in the equation, its effect vanishes entirely in the absence of outside air ( α = 0 ) and filtration ( η = 0 ). The decay mechanism also affects the relationship between the decay rate and particle size, albeit differently. Assuming a well-mixed condition, the rate of contamination removal from the room is independent of the size of particles. Filtration, however, offers different removal efficiencies with respect to size. Specifically, filter efficiency is lower for fine particles (0.3–1.0 µm), and it increases for larger particles (5.0–10.0 µm). Assuming a constant filtration efficiency, outside air ratio, and surface deposition, Equation (6) depicts a linear correlation between the decay rate and A.C.H., whose slope is always smaller than one unless 100% outside air or 100% filter efficiency is provided. Furthermore, the mathematical correlation between the filter efficiency, A.C.H., and decay rate suggests that high-efficiency filters must be installed for A.C.H. to have an optimum effect on the decay rate. In other words, with low filter efficiency, increasing A.C.H. seems to result in energy consumption without offering (even nearly) proportional outcomes. As shown in Figure 1, with increasing the A.C.H., the decay rate (λ) becomes more sensitive to filtration (i.e., higher line slopes).

2.2. Room Geometries and Ventilation Systems

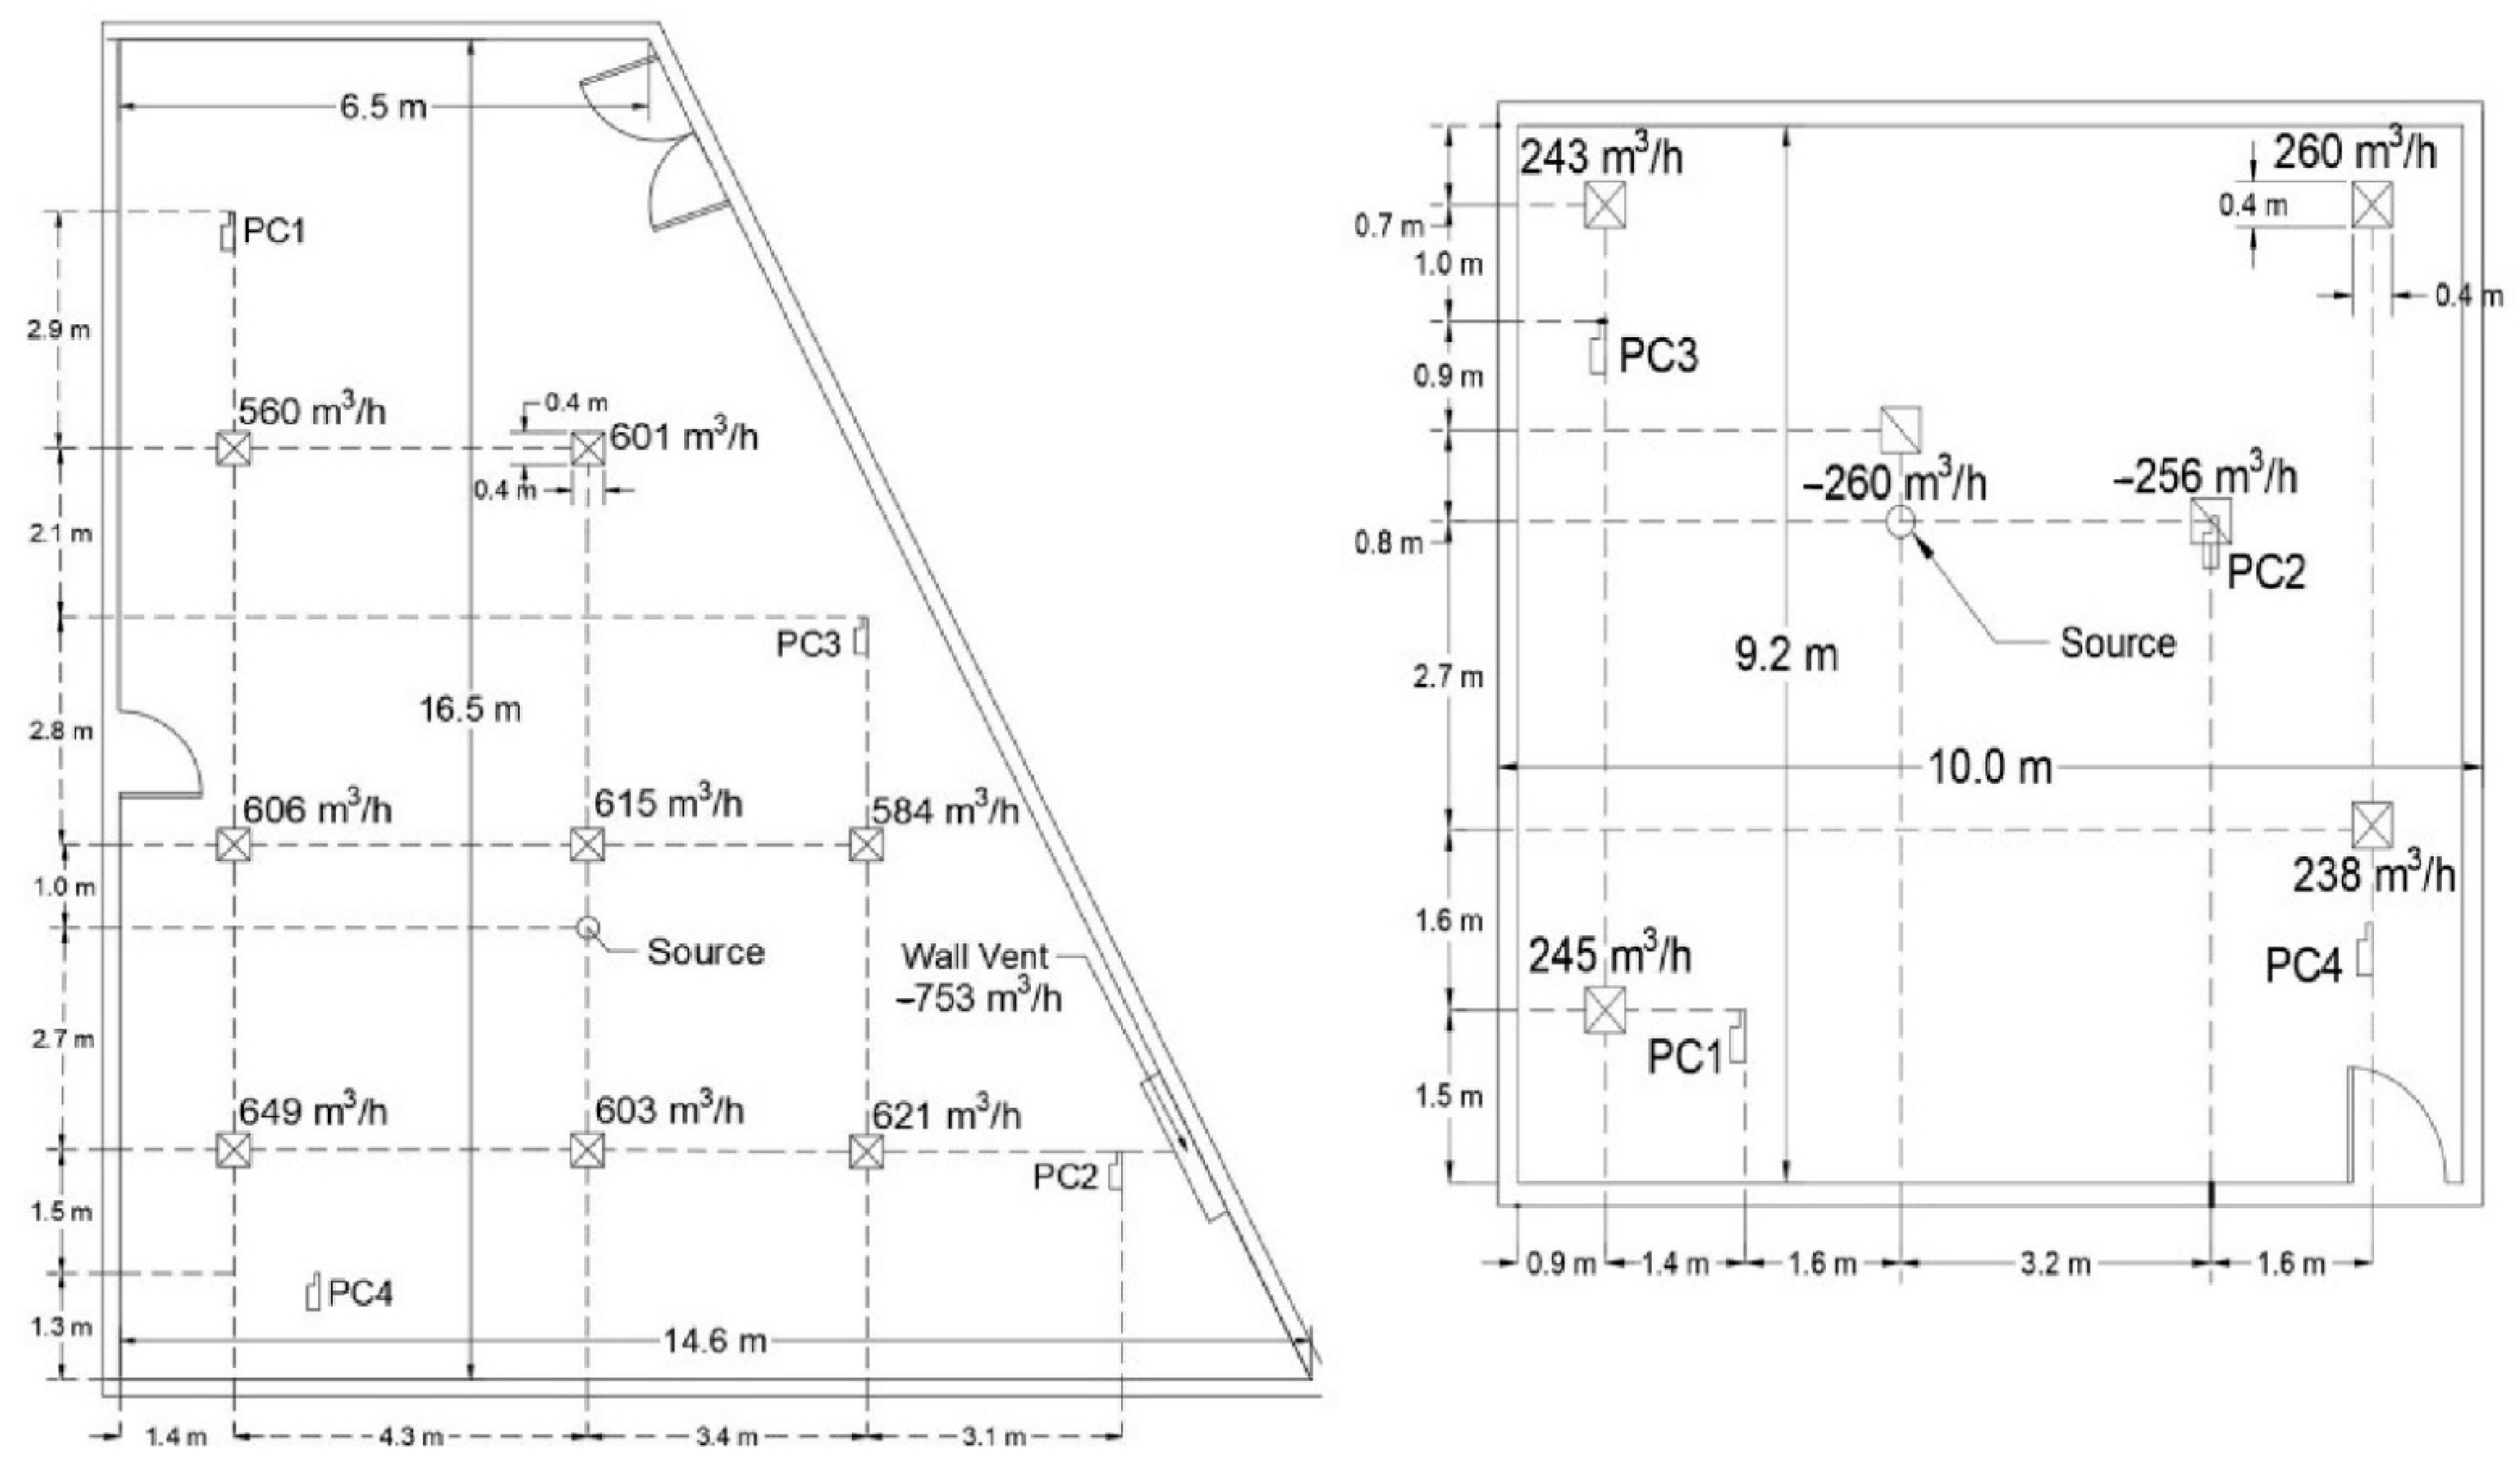
We conducted a series of air quality experiments in five classrooms located in five different buildings. The goal was to have a selection of classrooms that represented a variety of ventilation types and layouts. The initial goal was to assess the performance of these buildings and identify the types of rooms on campus that required additional layers of ventilation and/or filtration to improve indoor air quality conditions. The majority of the buildings were built between 1950 and 1969, and thus, many of them were not designed by the current standard recommendations. To offer some perspective, Table 1 shows the amount of outside (fresh) air recommended by ASHRAE Standard 62.1-2019 for each classroom. This number is calculated based on the classroom’s occupancy and size. It is worthy to note that we did not change the HVAC settings of the classroom for experiments, and they were all running at their typical rates. Table 1 shows the classroom list, type of ventilation system, and the room names we refer to throughout this manuscript. The release source at each classroom was selected based on the team’s judgment on what can create the worst-case scenario. For example, in rooms A and B, the source was placed immediately on the air fan-coil unit air outlet to spread particles within the room effectively. While in rooms C, D, and E, the source was placed roughly in the middle of the room or right underneath an air supply diffuser to help maximize the spatial spread of the contaminants. The source location is labeled in all classroom schematics.
Additionally worthy of note, there has been a lack of consensus on how the HVAC community defines A.C.H.; some may refer to it as the total of ‘fresh air’ change, whereas others may interpret A.C.H. as the total air change rate. In this paper, we define A.C.H. as the total (i.e., fresh + recirculation) amount of air supplied into the room normalized by the volume of the space. This definition is commensurate with the theoretical background offered earlier.

2.2.1. Room A

The layout and experimental setup of room A are detailed in Figure 2. The room was located on the second floor of a three-story building, and it had two doors that opened into a hallway. The building floor was made of mosaic tiles, and it was furnished with metal chairs at the time of the experiments. Room A was equipped with two fan coil units that recirculated the air through a MERV8 filter at a total flow rate of 840 m3/h. Air can only be exchanged between the room and the outside corridor through door cracks or the area above the ceiling through two ducts, and the team did not observe any apparent source of outside (fresh) air. Since the two fan coil units were identical in size and flow rate, the air distribution configuration may have created a stagnation plane in between these two units (the X = 7.5 m plane).

2.2.2. Room B

Room B was located on the third floor of a two-story building that included educational and office spaces (Figure 3). The room floor was made of mosaic tiles, furnished with standard classroom seats and tables. Mechanical ventilation provided the room with conditioned air at a total supply and return airflow rates of 2047 and 2067 m3/h, respectively. The difference is presumed to be made up from the hallway adjacent to the room. The combination of central HVAC and fan coil recirculation created a very complex air distribution configuration in this room.

2.2.3. Room C

Figure 4 shows the layout and experimental setup of room C. The room was carpeted and furnished with fabric-covered chairs, and it was equipped with a central ventilation system that supplies the space with 1292 m3/h of conditioned air and removes 1050 m3/h of air from the space, creating a positive pressure at the door. The research team did not measure the magnitude of the positive pressure at the entrance. The air outlets in this room were located at the back of the room (i.e., left side of the schematic). This skewed the spatial distribution of particles towards PC1 and PC2 and potentially created more variation in the spatial decay rates, especially for larger particle sizes (5.0–10.0 µm) that are not greatly mobile on their own.

2.2.4. Rooms D and E

The layouts of rooms D and E are detailed in Figure 5. For room D, the floor was carpeted, and it was furnished with fabric-covered auditorium chairs. The central HVAC system provided supply and return airflow rates of 4839 and 750 m3/h, respectively. Room E also had a central HVAC system with a total airflow rate of 986 m3/h; this room was also positively pressurized due to a significantly lower rate of air return (516 m3/h). The reason behind these significant imbalances is unknown to the research team.

2.3. Experiment Setup and Instrumentation

The specifications of the particle measurement instruments used in this study are detailed in Table 2. The team also used an ALNOR EB-731 (T.S.I. Incorporated, Shoreview, MN, USA) passive capture hood to measure each room’s supply/return flow rates (https://bit.ly/3BsU1cG, accessed on 1 October 2021). The capture hood was connected to a digital micro-anemometer that recorded airflow data in one-second intervals at every opening. This device has been previously used in the literature for the same purposes [34,35].
A medical nebulizer (Allied Healthcare Aero Mist Nebulizer, model #ALH-61400) was used to aerosolize an oil-based substance (Bis-2-Ethylhexyl sebacate, C.A.S.: 122-62-3, density at 25 °C = 0.914 g/mL) in each room. The release location was selected strategically above the fan coil units (for rooms A and B) or close to a supply vent (for rooms C, D, and E) to resemble the worst-case scenario of particle spread in the room. Before the release, concentrations of particles were measured for nearly 10 min to obtain a background of the particle concentrations. Then, aerosolization began for 2 min; though the exact rate of aerosolization was not measured, it was held constant (i.e., the same devices, pump rate, and substance). Given the existing A.C.H. in the classrooms (~2–9 A.C.H.), it would take approximately 1–3 h for the release concentrations to fall below 1% of the initial value. In the interest of time, the particle concentrations in each room were measured continuously for about 40 min +/− 5 min after each release; this duration was deemed sufficient for calculating the decay rate.

2.4. Statistical Analysis

The background particle concentration (C.B.G.) at each measurement location was calculated separately for each particle size using the following equation:
C B G = t = 0 t = t B G C ( t ) n t
where C ( t ) is the particle concentration at the time t, tBG is the duration of background measurement and n t is the total number of measurements. To avoid the effects of fferent background concentrations, C B G was then deducted from C ( t ) before fitting the data with exponential trendlines to determine the decay rates. The exposure (E) was then calculated separately for each particle size using Equation (8):
E ( t ) = t R e l e a s e t C ( t ) dt C B G · t B G
By defining a time-dependent spatial average particle concentration ( μ ( t ) ) and standard deviation ( σ ( t ) ), we can gain some insight into how accurate the well-mixed assumption was for each room using Equation (9). Therefore, the mixing efficiency was defined as:
m ( t ) = μ ( t ) σ ( t ) μ ( t ) × 100
where μ ( t ) and σ ( t ) are defined as follows:
μ ( t ) = i = 1 i = n C i ( t ) n
σ ( t ) = i = 1 i = n [ μ ( t ) C i ( t ) ] 2
where i denotes the location of the measurement, and n is the number of sampling locations. A regression analysis was performed to calculate the decay rates from the concentration data. In order to eliminate the effect of background concentrations, an exponential regression model in the form of C = C 0   e λ t + ξ was proposed. This model provided another degree of freedom ( ξ ) that would allow the exponential trend to converge to a non-zero value (i.e., background concentrations).

3. Results and Discussions

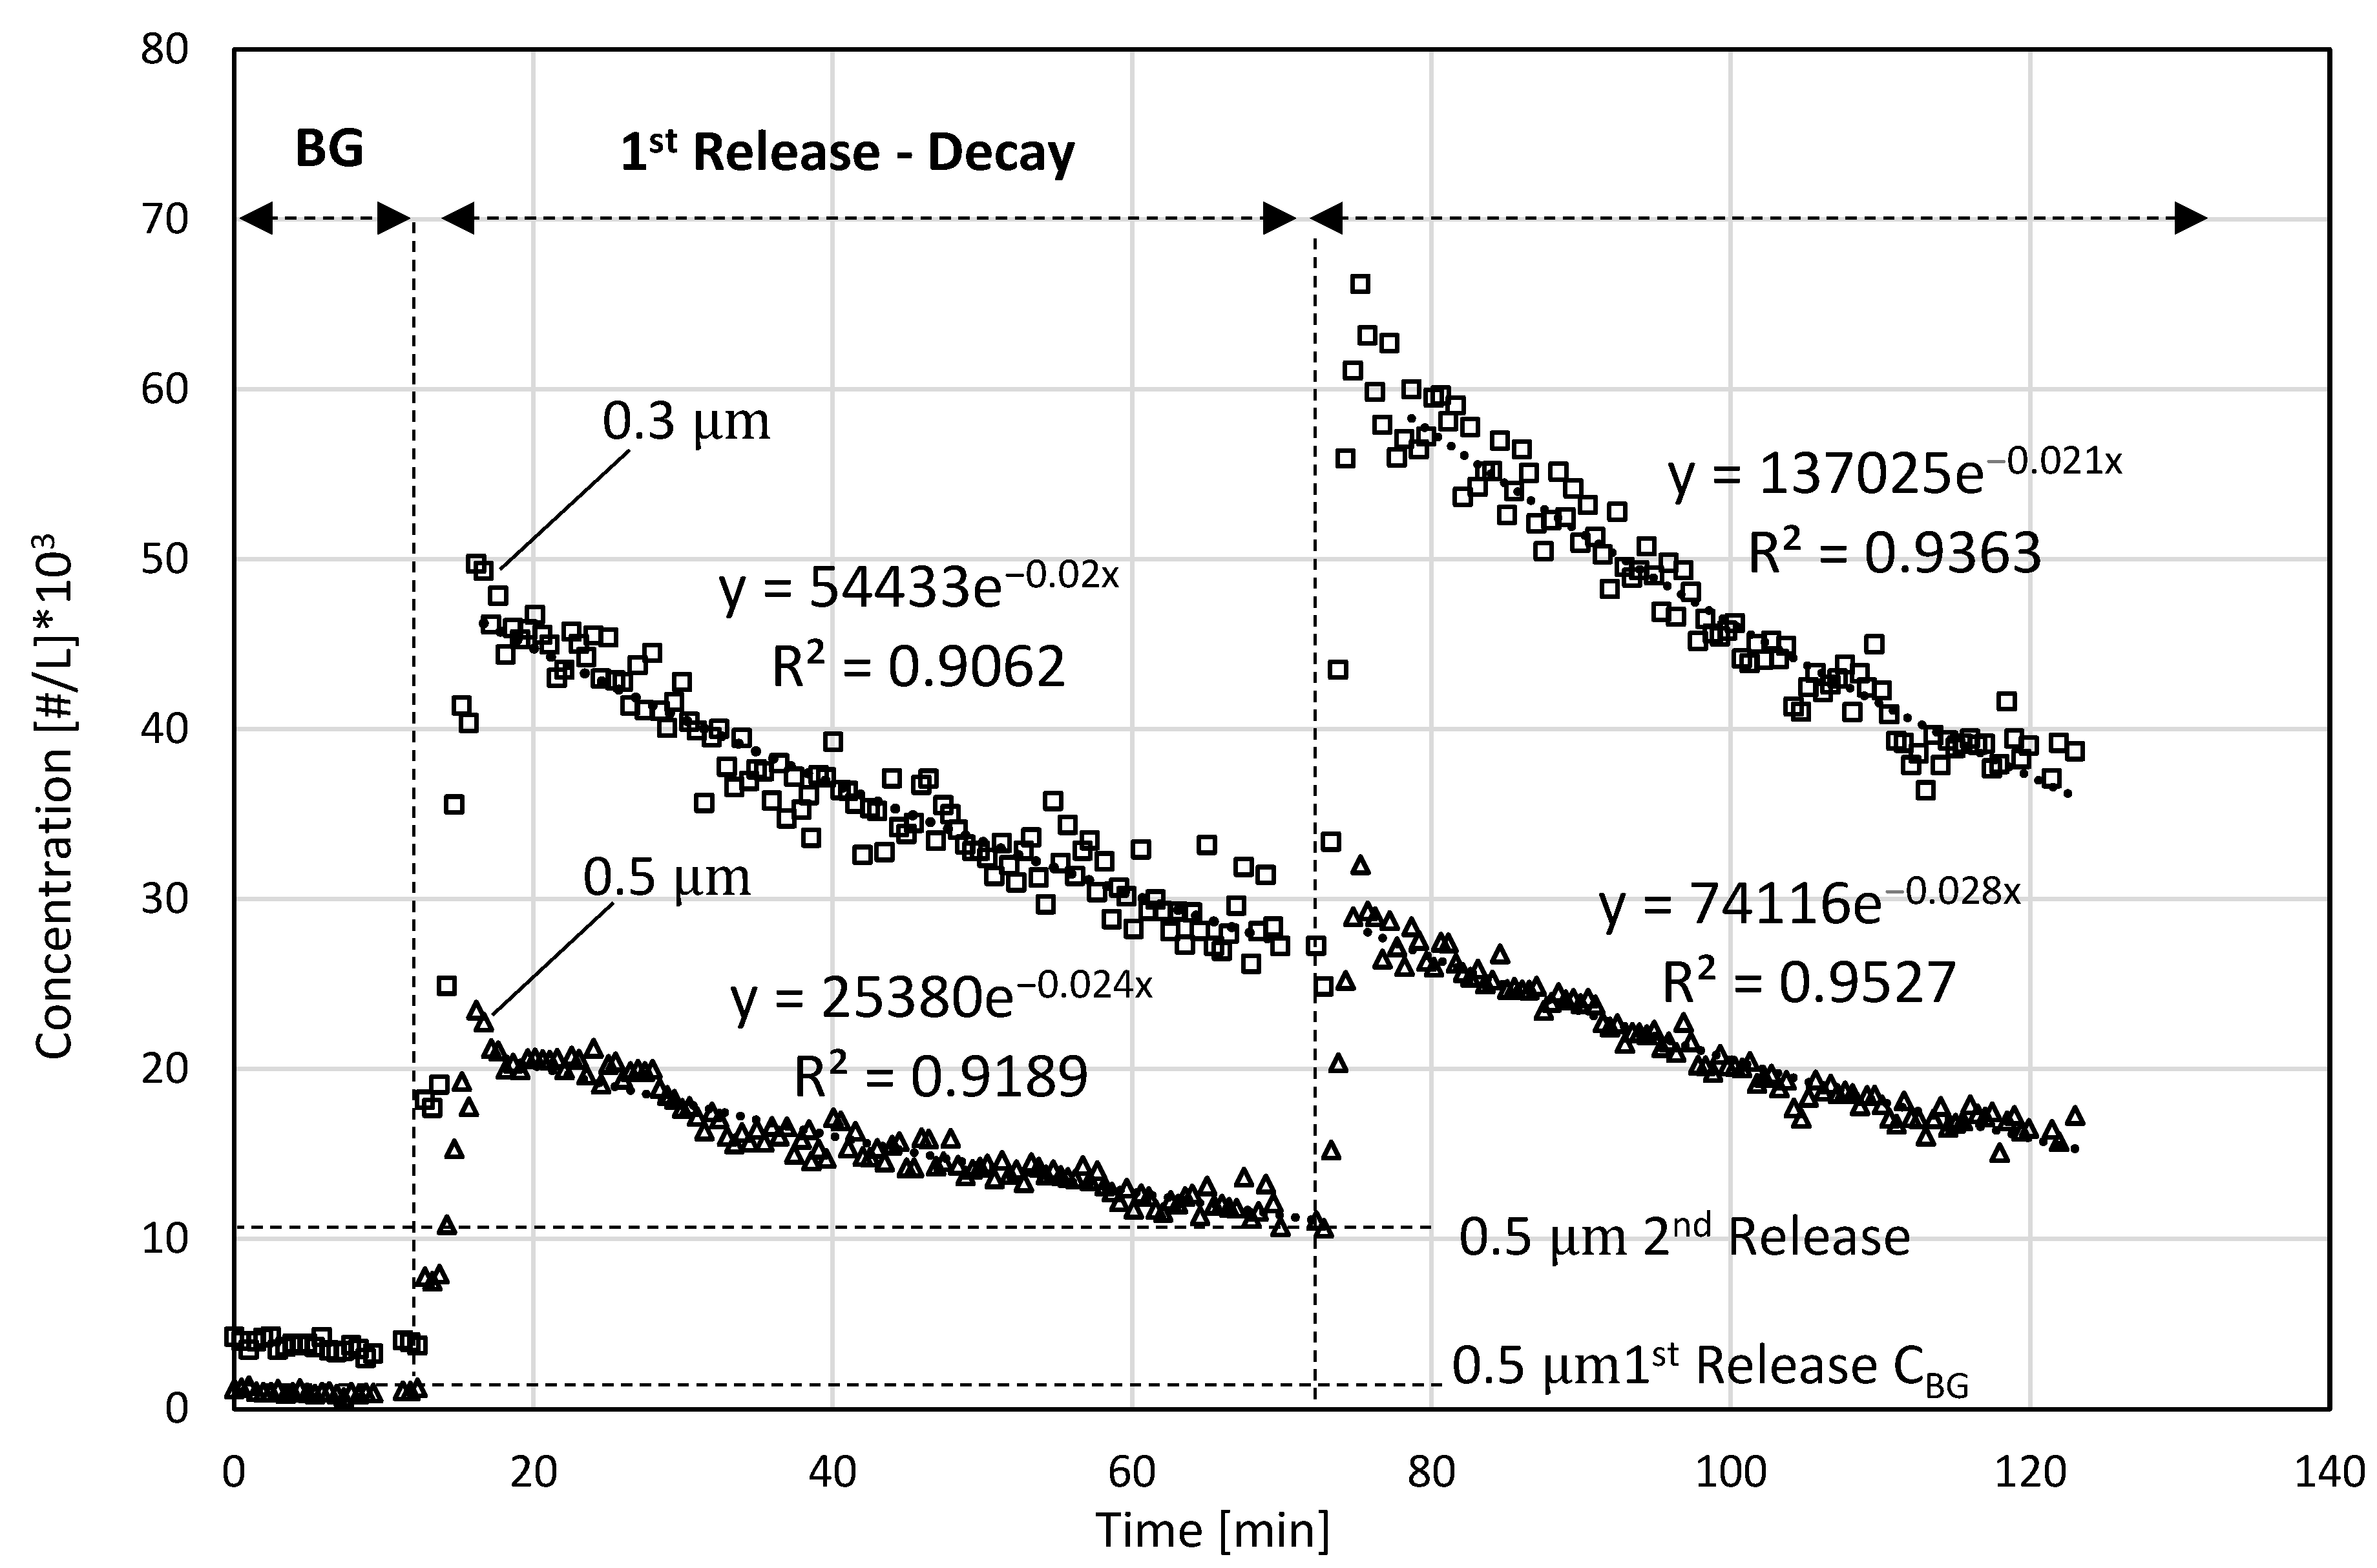
Figure 6 shows the concentration of the 0.3 and 0.5 µm size particles during two consecutive release-decay tests recorded by PC1 in room A. Background measurements were taken for approximately 12 min before the first release, and the decay rates were measured from a regression analysis explained in the method section.
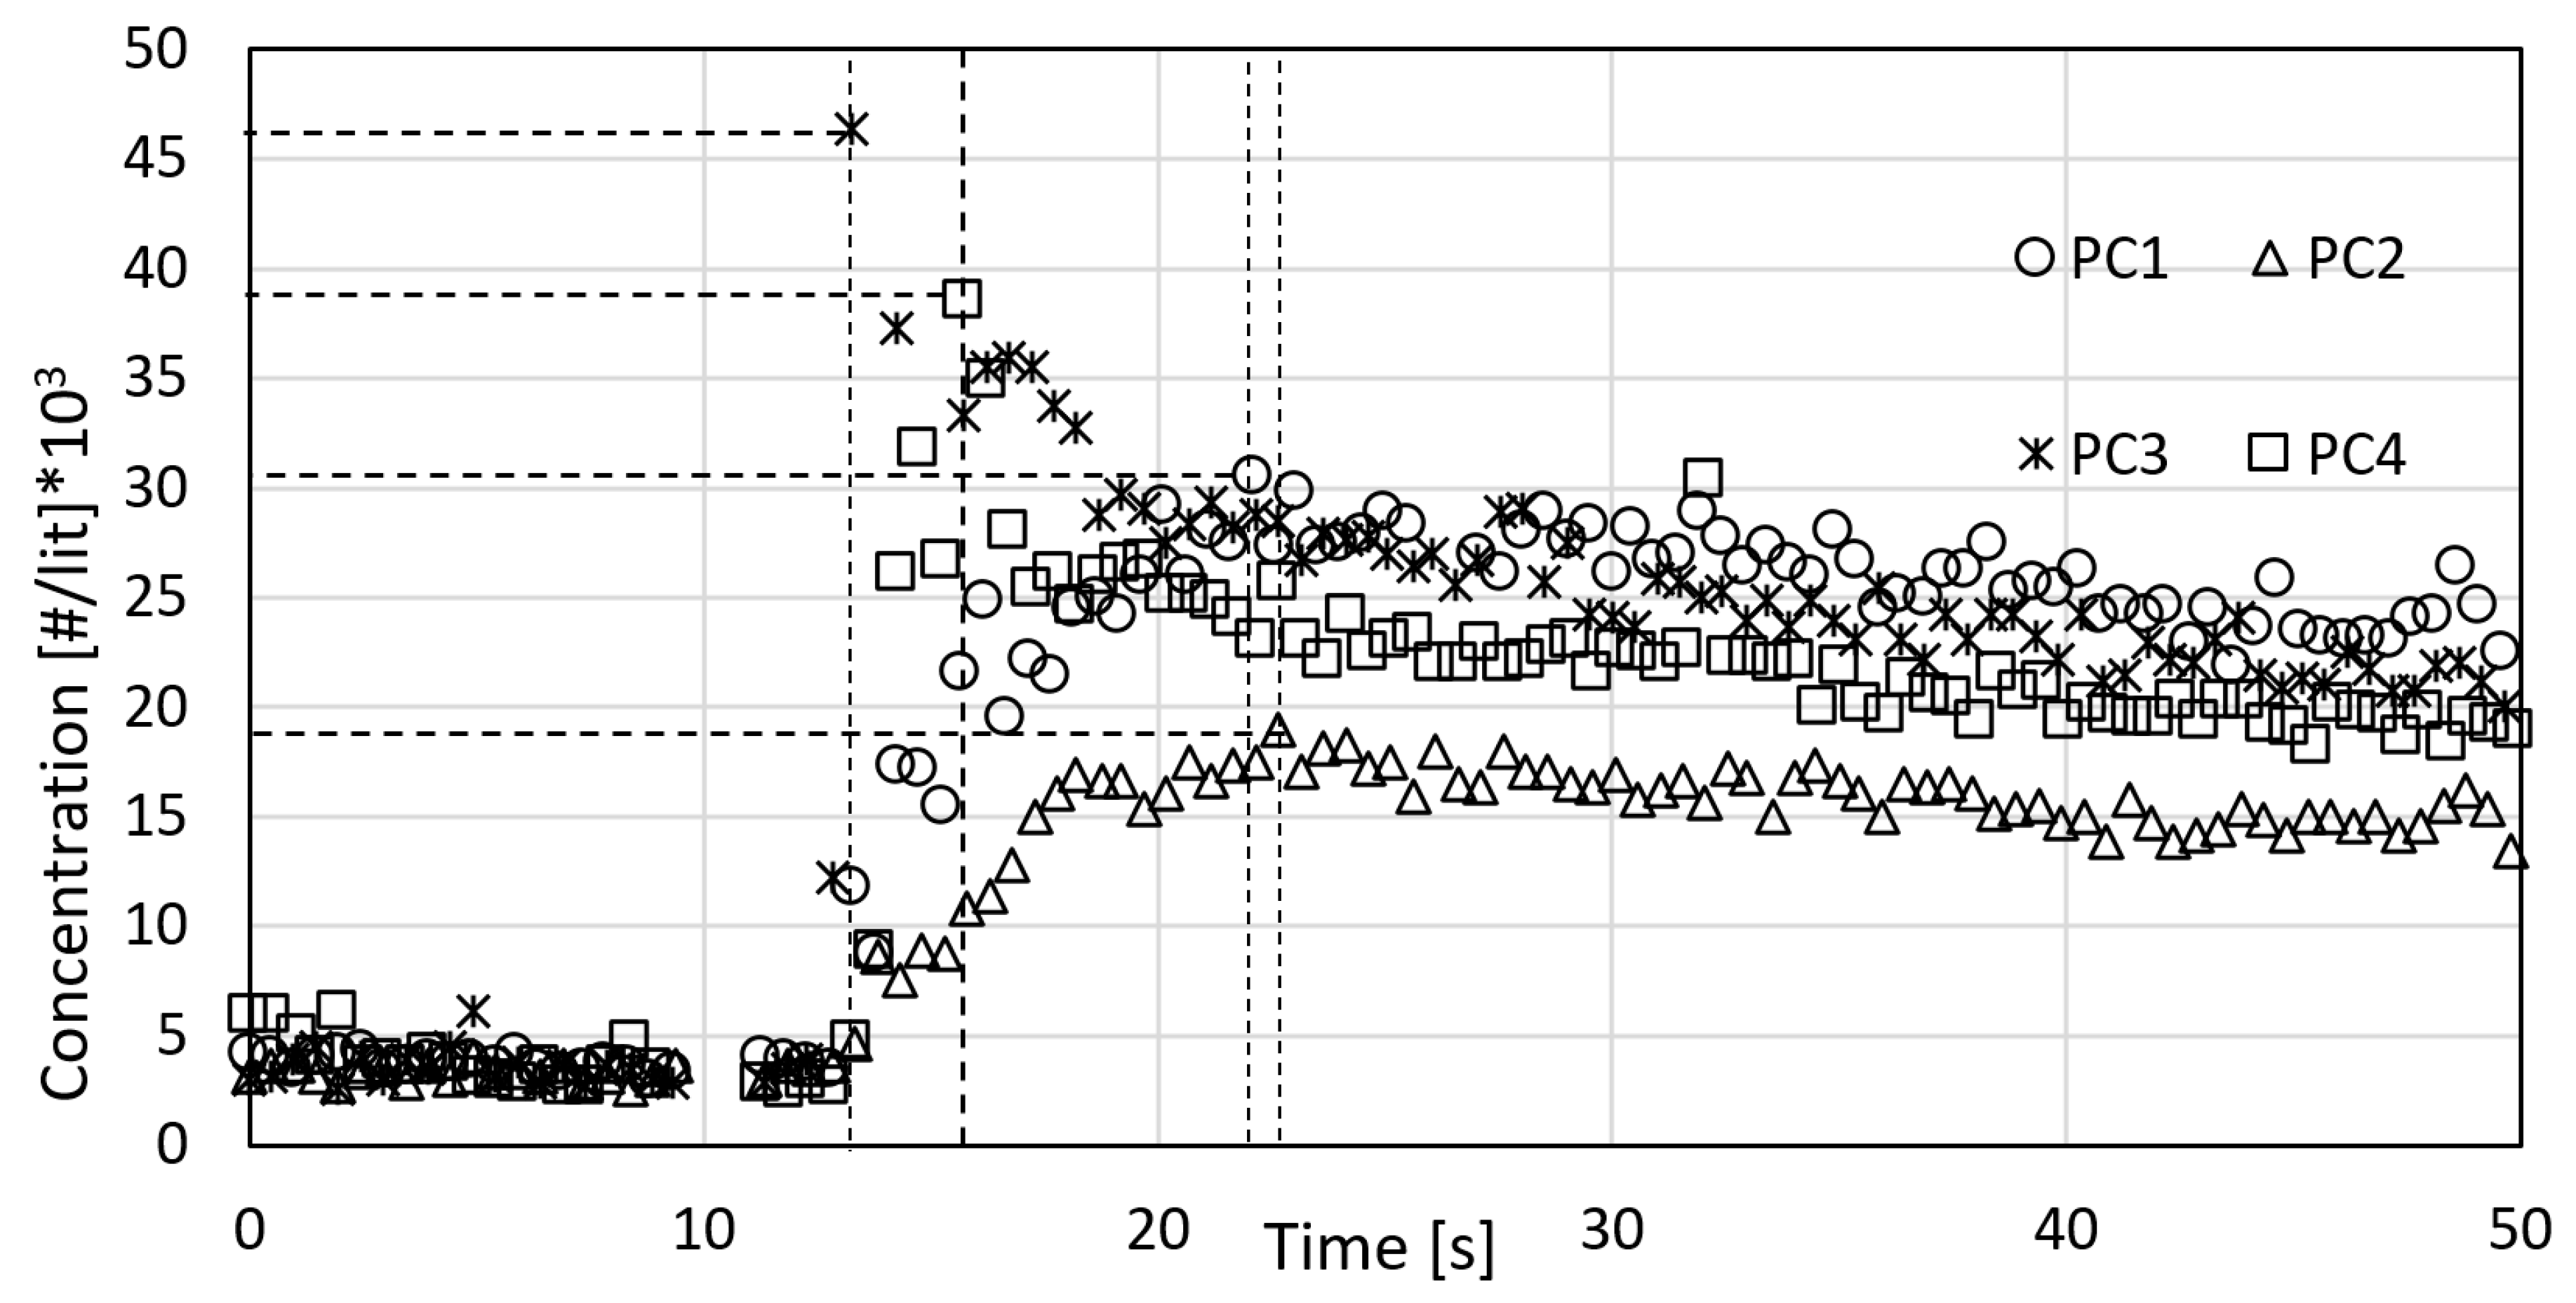
While exponential decay was observed for all sampling locations, the spatial distributions of particles within the space were not similar. Figure 7 shows the concentration of 0.3 µm particles measured by PC1–PC4 during the first test in room A. One can notice in Figure 7 that the time of the maximum concentration (i.e., t C m a x ) is different at each location, and it is not necessarily a linear (or inversely linear) function of the distance between the source and the measurement location. Indoor particle transport seemed to have complex behavior that is affected by the room’s airflow patterns. For example, if there were no supply air in room A, one would expect the total exposure (Equation (8)) at the PC1, PC2, and PC4 locations to be approximately the same since these three sensors were located at the same distance from the source. This was not observed since, as shown in Figure 7, PC4 detected the surge of particles much earlier than PC1 and PC2. This phenomenon can be explained by considering that the two identical fan coil units in room A blew air at approximately the same velocity and direction (toward the ceiling), creating two separate air recirculation zones in the room, with a stagnation region in the middle that acts as a barrier and reduces the particle transport between the two regions. As a confirmation of this observation, Figure 8 shows the steady-state airflow estimated by computational fluid dynamics (C.F.D.) based on the measured supply air velocities of the two fan coil units. Although PC1 and PC2 are at the same distance from the source as PC4, they are not in the same recirculation region, and therefore are less exposed to particles. This simulation provides insight into the relatively low mixing efficiency of the HVAC system of classroom A.
As a result, exposure to particles is not necessarily a function of the distance from the source of particle generation. Instead, it is a complicated function of airflow patterns in the room, and thus farther locations can be exposed to particles at a higher level than closer locations. We observed similar behavior for the other rooms; however, due to the complicated airflow patterns caused by various supply and return vent configurations, the results from these rooms could not be explained without consulting computational fluid dynamics techniques.
Figure 9 illustrates the accuracy of the well-mixed assumption for 0.3 µm particles while conducting the tests in each room. During the background measurements (first 12 min), the mixing efficiency (Equation (9)) fluctuated dramatically in all rooms, perhaps because of traffic movement before conducting the experiments. Shortly after beginning the particle aerosolization, mixing efficiencies dropped sharply to their minimum value, followed by a fast recovery to around 70% in approximately less than 6 min. These findings show that the 100% well-mixed assumption is not met. However, a typical classroom still offers 70 to 80%, which is a decent degree of air mixing. Additionally worthy of noting is that while the mixing efficiency converged to a value (i.e., 70%) for the 0.3 µm particles, this may not necessarily be the case for larger particles that are primarily affected by gravitational settling.
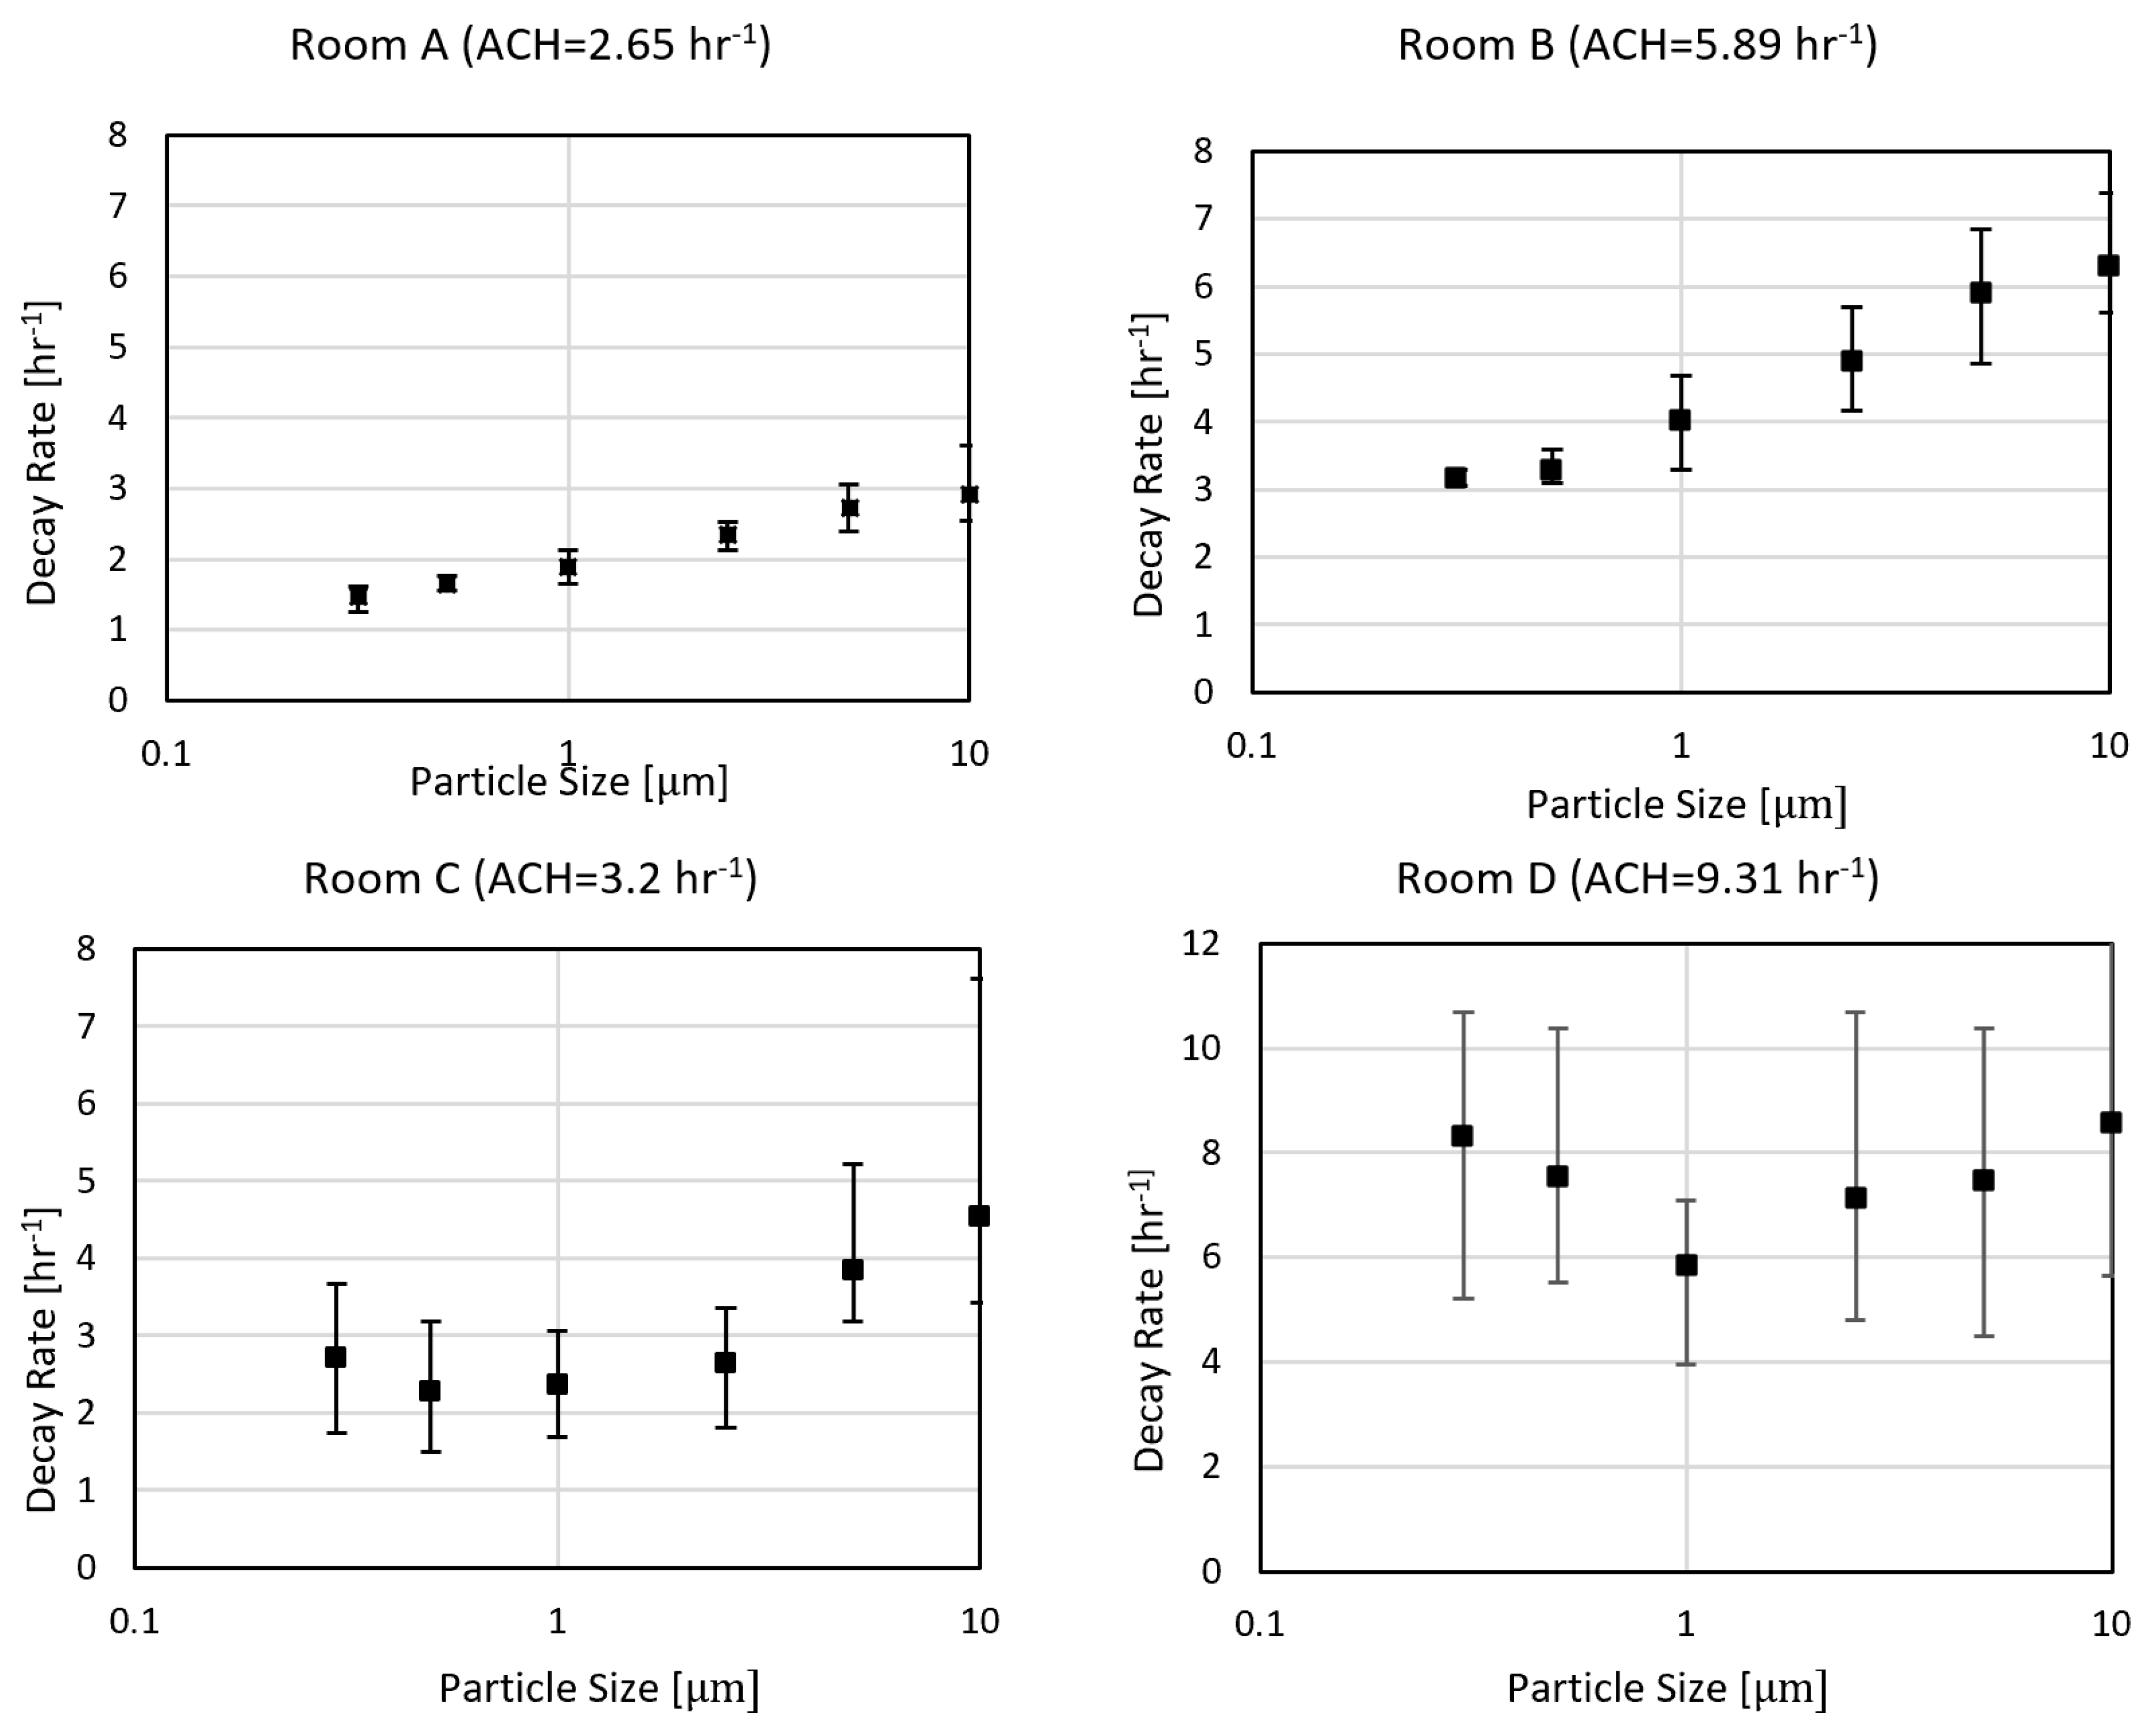
Figure 10 shows the relationship between the decay rate and particle size in rooms A through D. Except for room D (highest A.C.H.), the decay rate increased for larger particle sizes. This is, perhaps, due to a more significant effect of gravitational settling and filtration for larger particles. It must be further noted that this trend was much and more evident for rooms A and B because, in these cases, particles were released onto the fan coil air streams and effectively dispersed into the space. As a result, the decay rates seemed to be less variant at different sampling locations. In other words, larger particles that do not have sufficient mobility were pushed farther into the space and sensed more effectively by the farther particle counters. However, one can notice longer error bars (variation) for rooms C and D. The data also suggested that the particles with different sizes decayed at approximately the same rate. This could be due to the high A.C.H. in the room and the room geometry that potentially superseded the effect of the gravitational settling.
Figure 11 depicts the relation between the average decay rate and the A.C.H. directly measured from the room supply flow rates. Each point on the figure represents a room. The results show that regardless of the room geometry, surface properties of the walls, floor, ceiling, and furniture, the decay rate increases approximately linearly (R2 = 0.94) with A.C.H. Theoretically, λ should approach A.C.H. I other removal mechanisms (particle deposition rate and filtration) are negligible; they should maintain a linear correlation in the presence of such mechanisms as depicted by Equation (6).
When introducing particles to the rooms, the mixing efficiency drops to less than 10% and subsequently recovers to its original level (around 70%) in less than 6 min. This value seemed to be independent of the room layout and ventilation strategy. To put this in some context, 6 min is about the time it takes for the room air to turn (through the HVAC system) once at ACH = 10. In this study, the ventilation rate in all the classrooms was less than 10 A.C.H., suggesting that the room air does not need to turn around once to reach the steady-state condition. Although the steady-state is achieved relatively quickly, we did not observe a complete well-mixed condition under any studied air distribution systems. This information is also helpful when engineers use the well-mixed assumption in predicting particle concentration.
Another interesting observation was that the surface deposition (β), defined by the intercept value of the fitted lines presented in Figure 11, is appreciably higher for larger particle sizes. Although the curve fit equation of the 0.3 µm particles has a negative intercept value, which is not physically possible; it should be noted that this value is highly sensitive to the slope of the line and a few additional points (i.e., additional experimental measurements) may be sufficient to obtain a more accurate trend and meaningful surface deposition value (β).
The observation that the decay rate increases with A.C.H. linearly is consistent with the theoretical formulation presented in the paper (Equation (6)). The decay rate is a function of the outside air ratio (α), which is usually constant for a particular room, filter efficiency ( η ), and surface deposition ( β ). Reconciling Equation (6) with the empirical correlation presented in Figure 11 for 10.0 µm particles, we have:
λ = 0.81     A C H + 1.19
( 1 ( 1 α ) ( 1 η ) ) = 0.81
β = 1.19
According to Equations (12)–(14), β is homogeneous and therefore equivalent to a rate of air change (A.C.H.). This provides meaningful insight into the relative importance of surface deposition ( β ) compared to A.C.H. For instance, in the case of 10.0 µm particles, according to Equation (12), β is responsible for 60% of the decay rate with 1 A.C.H. and only 13% of the decay rate with 10 A.C.H. This information could be used to make informed decisions on the operating conditions of HVAC systems in classrooms. For example, for spaces with lower A.C.H., higher surface deposition is expected, and hence, extra care should be taken for surface cleaning.

4. Conclusions

Aerosol particle transport in indoor environments, especially educational spaces, has become a significant concern due to the COVID-19 pandemic. This paper reported on the theoretical and experimental investigation of particle decay rates in five different classrooms specifically selected for their different layouts and ventilation systems. Several particle sensors distributed within the rooms were used to measure the spatial and temporal variations of the decay rates of PM as functions of the particle size.
In its general form, three distinct yet correlated mechanisms contribute to the particle removal process: rate of air changes, also referred to as air changes per hour (A.C.H.), filtration, and surface deposition. Even though the interaction between these phenomena is complex, a satisfactory agreement between the theoretical predictions and the experimental data was found. The analytical calculations presented in this paper allowed an understanding of the relative importance of each of the three phenomena and their interactions. The mixing efficiency was also calculated to confirm the extent to which these analytical calculations were valid. Discrepancies between theory and experimental data were discussed.
The results presented herein support the current recommendations pertaining to increasing the ventilation rate, filtration efficiency, and fraction of external air in central HVAC systems. Beyond this, the data presented herein show that the classroom with standalone wall fan coil units had substantially lower performance than those with a centralized HVAC system. Therefore, we recommended that, when limited resources are available for mitigation measures, they should be focused on rooms or buildings that lack centralized HVAC systems. However, increasing filtration efficiency in such standalone units can be challenging as they are designed with a particular MERV filter in mind. Increasing the filter MERV number will increase the pressure drop across the filter and either strain the fan or reduce the airflow rate. Therefore, it is recommended that mitigation efforts in these rooms focus on separate filtration systems that operate in parallel with the fan coil units. Finally, the data presented shows that in the room with only fan coil units (room 1), there was substantial spatial variation in both the peak particle concentration measured and the time at which that peak occurred. Therefore, it is recommended that future studies should quantify this spatial variability to understand better and quantify the distribution of exposure risk within a given room.
The study presented herein was designed to identify where air quality mitigation resources should be applied on university campuses. While the results are clear and support the recommendations in the previous paragraph, the study does have some limitations. First, the study only looked at particle decay rates. Ideally, such a study would include parallel measurements of CO2 concentration decay from a finite release within the room. This would have allowed the research team to understand better what portion of the particle decay rate was due to filtration and what portion was due to air replacement. While this would have added an additional layer of information, it would not have altered the final recommendations as to where resources should be focused. Second, the study only focused on individual rooms within a given building. No measurements were made of the transmission of the released particles to other rooms via the building ventilation system. Again, while this would be interesting, it would not have altered the final set of recommendations. Third, measurements were only made at four locations within each room, and particles were only released from one location. The measurements for this one release location showed that there was clear spatial variability in both the peak concentration and the time of that peak despite the ventilation system being categorized as well mixed based on ASHRAE’s Zone air distribution effectiveness [36]. There is, therefore, spatial variability in the risk of exposure to high concentrations of particles in these rooms. Future studies should aim to quantify this spatial variability with a larger number of sensors distributed around the room. Future investigations should also be done for a range of particle release locations to better quantify the range of exposure risk in a given room.

Author Contributions

Conceptualization, E.M., N.K., V.B. and A.M.; methodology, E.M., N.K., V.B., K.V.V. and A.M.; validation, N.K., A.M. and K.V.V.; formal analysis, A.M.N., E.M., N.K., V.B. and A.M.; investigation, A.M.N., E.M., N.K., V.B., K.V.V. and A.M.; writing—original draft preparation, A.M.N. and E.M.; writing—review and editing E.M., N.K., V.B., K.V.V. and A.M. All authors have read and agreed to the published version of the manuscript.

Funding

This research received no external funding.

Institutional Review Board Statement

Not applicable.

Informed Consent Statement

Not applicable.

Data Availability Statement

The data presented in this study are available on request from the corresponding author.

Conflicts of Interest

The authors declare no conflict of interest.

References

  1. Zhang, S.; Ai, Z.; Lin, Z. Occupancy-aided ventilation for both airborne infection risk control and work productivity. Build. Environ. 2021, 188, 107506. [Google Scholar] [CrossRef] [PubMed]
  2. Kabrein, H.; Hariri, A.; Leman, A.M.; Noraini, N.M.R.; Yusof, M.Z.M.; Afandi, A. Impact of the air filtration on indoor particle concentration by using combination filters in offices building. I.O.P. Conf. Ser. Mater. Sci. Eng. 2017, 243, 012051. [Google Scholar] [CrossRef] [Green Version]
  3. Li, A.; Liu, Z.; Zhu, X.; Liu, Y.; Wang, Q. The effect of air-conditioning parameters and deposition dust on microbial growth in supply air ducts. Energy Build. 2010, 42, 449–454. [Google Scholar] [CrossRef]
  4. Liu, Z.; Deng, Y.; Ma, S.; He, B.J.; Cao, G. Dust accumulated fungi in air-conditioning system: Findings based on field and laboratory experiments. Build. Simul. 2021, 14, 793–811. [Google Scholar] [CrossRef] [PubMed]
  5. Cherrie, J.; Cherrie, M.; Davis, A.; Holmes, D.; Semple, S.; Steinle, S.; MacDonald, E.; Moore, G.; Loh, M. Contamination of air and surfaces in workplaces with SARS-CoV-2 virus: A systematic review. Ann. Work Expo. Health 2021, 65, 879–892. [Google Scholar] [CrossRef]
  6. Anderson, K.; Morris, G.; Kennedy, H.; Croall, J.; Michie, J.; Richradson, M.D.; Gibson, B. Aspergillosis in immunocompromised paediatric patients: Associations with building hygiene, design, and indoor air. Thorax 1996, 51, 256–261. [Google Scholar] [CrossRef] [PubMed] [Green Version]
  7. Al-Harbi, M.; Alhajri, I.; Whalen, J.K. Characteristics and health risk assessment of heavy metal contamination from dust collected on household HVAC air filters. Chemosphere 2021, 277, 130276. [Google Scholar] [CrossRef]
  8. Santarpia, J.L.; Rivera, D.N.; Herrera, V.L.; Morwitzer, M.J.; Creager, H.M.; Santarpia, G.W.; Crown, K.K.; Brett-Major, D.M.; Schnaubelt, E.R.; Broadhurst, M.J.; et al. Aerosol and surface contamination of SARS-CoV-2 observed in quarantine and isolation care. Sci. Rep. 2020, 10, 12732. [Google Scholar] [CrossRef] [PubMed]
  9. Kenarkoohi, A.; Noorimotlagh, Z.; Falahi, S.; Amarloei, A.; Mirzaee, S.A.; Pakzad, I.; Bastani, E. Hospital indoor air quality monitoring for the detection of SARS-CoV-2 (COVID-19) virus. Sci. Total Environ. 2020, 748, 141324. [Google Scholar] [CrossRef]
  10. Astudillo, G.D.; Garza-Castanon, L.E.; Minchala Avila, L.I. Design and Evaluation of a Reliable Low-Cost Atmospheric Pollution Station in Urban Environment. IEEE Access 2020, 8, 51129–51144. [Google Scholar] [CrossRef]
  11. Jiang, H.; Xiao, H.; Song, H.; Liu, J.; Wang, T.; Cheng, H.; Wang, Z. A long-lasting winter haze episode in xiangyang, central china: Pollution characteristics, chemical composition, and health risk assessment. Aerosol Air Qual. Res. 2020, 20, 2859–2873. [Google Scholar] [CrossRef]
  12. Levy Zamora, M.; Xiong, F.; Gentner, D.; Kerkez, B.; Kohrman-Glaser, J.; Koehler, K. Field and Laboratory Evaluations of the Low-Cost Plantower Particulate Matter Sensor. Environ. Sci. Technol. 2019, 53, 838–849. [Google Scholar] [CrossRef]
  13. Qin, X.; Hou, L.; Gao, J.; Si, S. The evaluation and optimization of calibration methods for low-cost particulate matter sensors: Inter-comparison between fixed and mobile methods. Sci. Total Environ. 2020, 715, 136791. [Google Scholar] [CrossRef] [PubMed]
  14. Gao, J.; Zeng, L.; Wu, L.; Ding, X.; Zhang, X. Solution for sudden contamination transport through air duct system: Under a puff release. Build. Environ. 2016, 100, 19–27. [Google Scholar] [CrossRef]
  15. Scibor, M. Are we safe inside? Indoor air quality in relation to outdoor concentration of PM10 and PM2.5 and to characteristics of homes. Sustain. Cities Soc. 2019, 48, 101537. [Google Scholar] [CrossRef]
  16. Gonzalez-Brown, V.M.; Reno, J.; Lortz, H.; Fiorini, K.; Costantine, M.M. Operating Room Guide for Confirmed or Suspected COVID-19 Pregnant Patients Requiring Cesarean Delivery. Am. J. Perinatol. 2020, 37, 825–828. [Google Scholar] [CrossRef] [Green Version]
  17. Mousavi, E.S.; Grosskopf, K.R. Secondary exposure risks to patients in an airborne isolation room: Implications for anteroom design. Build. Environ. 2016, 104, 131–137. [Google Scholar] [CrossRef]
  18. Liu, Z.; Ma, S.; Cao, G.; Meng, C.; He, B.J. Distribution characteristics, growth, reproduction and transmission modes and control strategies for microbial contamination in HVAC systems: A literature review. Energy Build. 2018, 177, 77–95. [Google Scholar] [CrossRef]
  19. Ge, Z.Y.; Yang, L.M.; Xia, J.J.; Fu, X.H.; Zhang, Y.Z. Possible aerosol transmission of COVID-19 and special precautions in dentistry. J. Zhejiang Univ. Sci. B 2020, 21, 361–368. [Google Scholar] [CrossRef] [Green Version]
  20. McDonald, C.C. Reopening Schools in the Time of Pandemic: Look to the School Nurses. J. Sch. Nurs. 2020, 36, 239–240. [Google Scholar] [CrossRef]
  21. Levinson, M.; Cevik, M.; Lipsitch, M. Reopening Primary Schools during the Pandemic. N. Engl. J. Med. 2020, 383, 981–985. [Google Scholar] [CrossRef] [PubMed]
  22. Vermund, S.H.; Pitzer, V.E. Asymptomatic Transmission and the Infection Fatality Risk for COVID-19: Implications for School Reopening. Clin. Infect. Dis. 2020, 72, 1493–1496. [Google Scholar] [CrossRef] [PubMed]
  23. Viner, R.M.; Bonell, C.; Drake, L.; Jourdan, D.; Davies, N.; Baltag, V.; Jerrim, J.; Proimos, J.; Darzi, A. Reopening schools during the COVID-19 pandemic: Governments must balance the uncertainty and risks of reopening schools against the clear harms associated with prolonged closure. Arch. Dis. Child. 2021, 106, 111–113. [Google Scholar] [CrossRef]
  24. Center for Disease Control and Prevention Considerations for Schools Operating Schools during COVID-19; C.D.C.: Atlanta, GA, USA, 2020.
  25. Heating, Ventilation and Air-Conditioning Systems in the Context of COVID-19; European Centre for Disease Prevention and Control: Stockholm, Sweden, 2020.
  26. Faulkner, W.B.; Memarzadeh, F.; Riskowski, G.; Hamilton, K.; Chang, C.Z.; Chang, J.R. Particulate concentrations within a reduced-scale room operated atvarious air exchange rates. Build. Environ. 2013, 65, 71–80. [Google Scholar] [CrossRef]
  27. Noh, K.C.; Hwang, J. The effect of ventilation rate and filter performance on indoor particle concentration and fan power consumption in a residential housing unit. Indoor Built Environ. 2010, 19, 444–452. [Google Scholar] [CrossRef]
  28. Mousavi, E.S.; Kananizadeh, N.; Martinello, R.A.; Sherman, J.D. COVID-19 Outbreak and Hospital Air Quality: A Systematic Review of Evidence on Air Filtration and Recirculation. Environ. Sci. Technol. 2020, 55, 4134–4147. [Google Scholar] [CrossRef]
  29. Memarzadeh, F. The Environment of Care and Health Care Associated Infections–An Engineering Perspective; American Society for Health Care Engineering: Chicago, IL, USA, 2011. [Google Scholar]
  30. Mousavi, E.S.; Godri Pollitt, K.J.; Sherman, J.; Martinello, R.A. Performance analysis of portable HEPA filters and temporary plastic anterooms on the spread of surrogate coronavirus. Build. Environ. 2020, 183, 107186. [Google Scholar] [CrossRef] [PubMed]
  31. Azimi, P.; Stephens, B. HVAC filtration for controlling infectious airborne disease transmission in indoor environments: Predicting risk reductions and operational costs. Build. Environ. 2013, 70, 150–160. [Google Scholar] [CrossRef]
  32. Nazaroff, W.W. Indoor bioaerosol dynamics. Indoor Air 2016, 26, 61–78. [Google Scholar] [CrossRef]
  33. Nazaroff, W.W. Indoor Particle Dynamics. Indoor Air 2004, 14, 175–183. [Google Scholar] [CrossRef] [PubMed]
  34. Bhattacharya, A.; Metcalf, A.R.; Nafchi, A.M.; Mousavi, E.S. Particle dispersion in a cleanroom—Effects of pressurization, door opening and traffic flow. Build. Res. Inf. 2020, 49, 294–307. [Google Scholar] [CrossRef]
  35. Mousavi, E.; Mohammadi Nafchi, A.; DesJardins, J.; LeMatty, A.; Falconer, R.; Ashley, N.; Roth, B.; Moschella, P. Design and in-vitro testing of a portable patient isolation chamber for bedside aerosol containment and filtration. Build. Environ. 2021, 207, 108467. [Google Scholar] [CrossRef] [PubMed]
  36. Sun, C.; Zhai, Z. The efficacy of social distance and ventilation effectiveness in preventing COVID-19 transmission. Sustain. Cities Soc. 2020, 62, 102390. [Google Scholar] [CrossRef] [PubMed]
Figure 1. Theoretical correlation between filer efficiency, ACH, and decay rate for α = 25% and β = 0.
Energies 14 07463 g001
Figure 2. Layout and experimental setup of room A.
Energies 14 07463 g002
Figure 3. Layout and experimental setup of room B.
Energies 14 07463 g003
Figure 4. Layout and experimental setup of room C.
Energies 14 07463 g004
Figure 5. Layout and experimental setup of rooms D (left) and E (right).
Energies 14 07463 g005
Figure 6. The 0.3 µm particle concentration during two consecutive experiments in room A at the PC1 sampling location.
Energies 14 07463 g006
Figure 7. Particle concentration of 0.3 µm particles during the 1st test in room A measured at the locations of PC1–PC4. Dash lines show C m a x and t C m a x .
Energies 14 07463 g007
Figure 8. The elevation view of classroom A shows two distinct airflow recirculation regions as estimated by computational fluid dynamics. Steady-state pathlines are shown in color scaled by the air velocity magnitude.
Energies 14 07463 g008
Figure 9. Mixing efficiency while conducting the first tests in rooms A, B, C, D, and E for 0.3 µm particles.
Energies 14 07463 g009
Figure 10. Particle decay rate vs. particle size in four different rooms. The decay rate was averaged from four different sampling locations. Error bars represent the minimum and the maximum value in each data set.
Energies 14 07463 g010
Figure 11. A.C.H. vs. decay rate for various particle sizes. The dashed line shows the theoretical relation between A.C.H. and decay rate. Decay rates are averaged over sampling point data.
Energies 14 07463 g011
Table 1. List of classrooms and ventilation types.
Room NameRoom Ventilation TypeRoom Size [m3]Total Supply Recommended by ASHRAE 62.1 [m3/h]Supply Flowrate [m3/h]ACH [1/h]
ATwo fan coil units31746008402.65
BCentral HVAC and three fan coil347255520475.89
CCentral HVAC402250012923.22
DCentral HVAC520850048399.31
ECentral HVAC26810,1009863.68
Table 2. Particle counters’ specifications.
MakeModelMeasurement TypeMeasurement RateParticle Size Range
EXTECHVPC300Particles per intake (intake rate of 2.83 L/min)30 s0.3, 0.5, 1.0, 2.5, 5.0, 10 µm
Publisher’s Note: MDPI stays neutral with regard to jurisdictional claims in published maps and institutional affiliations.