Article

Experimental Evaluation of 3D Tortuosity of Long Laboratory Spark Trajectory for Sphere-Sphere and Sphere-Plane Discharges under Lightning and Switching Impulse Voltages

1
Institute of Power Engineering, Mory 8 St., 01-330 Warsaw, Poland
2
Electrical Power Engineering Institute, Warsaw University of Technology, Koszykowa 75 St., 00-662 Warsaw, Poland
*
Author to whom correspondence should be addressed.
Energies 2021, 14(21), 7409; https://doi.org/10.3390/en14217409
Submission received: 13 October 2021 / Revised: 29 October 2021 / Accepted: 3 November 2021 / Published: 7 November 2021

Abstract

:
Evaluation of attractive areas of high- and ultra-high voltage power transmission lines to direct lightning strokes is based on modeling of propagating progress of the lightning leader approaching the transmission line. The aim of the modeling is to determine the effectiveness of lightning protection for a given line design. The statistical models are currently being developed to extend the conventional deterministic models by embracing the randomness of the discharge channel in space and hence to reproduce the statistical distribution of the striking points. These models require experimental data for understanding of the lightning leader development process and to validate the model across the measurement data. This paper reports on the measured trajectories of discharge channels of long laboratory sparks in various high voltage laboratory arrangements. The sparks were initiated by switching and lightning impulses with peak values ranging from 1200 kV to 3364 kV of positive and negative polarity for two types of high-voltage electrode systems (sphere-sphere and sphere-plane), arranged at distances of 3.3 m and 5.5 m from each other. Statistical distributions of angles describing trajectory of discharge channels in space are reported for a total number of 540 recorded discharges. The results can serve as reference measurement data to develop and evaluate the accuracy of simulation models incorporating statistical nature of the lightning leader development process.

1. Introduction

1.1. Background and Motivation

Development of power transmission lines has currently reached Ultra High Voltage (UHV) level as high as 1100 kV AC and ±800 kV DC being put into commercial operation in China since 2009 and 2010 respectively, and currently going further towards ±1100 kV UVHDC in China [1]. The UHV transmission requires extremely high towers of overhead lines exceeding 100 m heights, with large spans between live conductors, tower structures and protection wires. Due to the large distancing between live and earthed parts of the lines and equipment, the ratio between rated voltage and the insulation co-ordination withstand-voltage levels has been significantly decreased with the increase of the rated voltage (as per IEC Std. 60071-1 [2]). At the same time, the extensive dimensions of the UHV tower structures make their attractive areas to lightning extremely high, causing a serious threat of shielding failures due to the direct lightning strokes to the lines. According to statistical analyses on lightning performance of transmission lines, the shielding failures are the main cause of the trip-outs of the UHV lines [3].
Evaluation of the attractive areas of the line to the direct lightning strokes is one of the critical factors taken into consideration when designing the transmission line tower structures, the line conductors distancing, the selection of insulators string lengths, and the arrangements of the grounding wires. This evaluation is based on modeling of propagating progress of the lightning leader approaching the transmission line and is aiming to determine the effectiveness of lightning protection for a given line design. The Electro-Geometric Model (EGM) [4] and the Leader Progression Model (LPM) [5,6] are conventional modeling approaches allowing to evaluate the line shielding efficiency. These models are fully deterministic, thus not considering statistical nature of the lightning strokes [1]. With the LPM the lightning leader propagates only to a small area away from the starting point, and for the EGM it propagates straight downwards from the starting point [7]. The statistical analyses on lightning performance of transmission lines performed in several regions, for example, in China [3] show that the estimates of the lightning failure rates evaluated based on deterministic approaches are significantly lower than those recorded. From the field observations [7] and from the laboratory works such as those performed extensively by the Les Renardières group in the 1970s [8,9,10], it is a well-known fact that the lightning strokes are not deterministic, and the leaders propagate to the striking point with significantly statistically distributed trajectory in space. The statistical models are thus being developed to extend the EGM and the LPM capabilities by embracing statistical factors in modeling of the lightning strokes propagation [1]. The models are intended to incorporate the structure of a breakdown path depending upon the electric field space distribution and other statistical factors to reproduce the randomness of the lightning strokes propagation in space and hence to reproduce the statistical distribution of the striking points.
Motivation of the research reported in this paper is to provide experimental data that can be used for development process of simulation models and to validate the models against experimental data to make the models solid.

1.2. Prior-Art Research on Evaluation of Long Spark Trajectory

An electrical discharge is a spatial object with a complex structure requiring a set of parameters to be described in space. Currently, to describe the shape of a discharge channel, the most often used is tortuosity—a parameter that can be specified by a set of angles in space. This parameter can be specified for a set of recorded discharges to embrace random nature of the lightning phenomenon.
There are several works in which the parameters are reported as obtained for the long spark gap discharges recorded in high-voltage laboratory settings. In the early work [11] performed at Uppsala University in Sweden, the tortuosity was used for the first time to describe the long spark gap in a laboratory test set-up. The impulse voltages with a peak value ranging from 22 kV to 75 kV were used to initiate a discharge between blade-plane electrodes arranged at a distance of 50 cm from each other. These voltage values and the spark gap distance suggest switching impulses, as in the case of the lightning impulses, the 75 kV peak voltage would not allow a discharge for more than 15–18 cm. During the tests, the discharges were simultaneously recorded with three cameras, though the outcome pictures were not processed into a three-dimensional object. The tortuosity was not described by a set of angles, but by one angle only between two successive steps of the long spark trajectory. The angle was determined based on the photos showing the discharge channel as a two-dimensional object. A relatively small number of photos were used (27 images taken with 9 sparks), which might limit capturing the variability analysis of parameters resulting from the interaction of random factors in a full extent.
The tortuosity was more extensively described by a set of three angles in [12] by the research groups from the universities in Uppsala, Sweden, and Colombo, Sri Lanca. The switching impulse voltage with a peak value ranging from 2.0 MV to 2.5 MV was used to initiate a discharge between blade-plane electrodes arranged at a distance of 7–8 m from each other. The discharge channel was recorded by two cameras and then converted into a spatial three dimensional object. The results were reported for switching impulses with positive polarity only. The spark gaps were much larger than those reported in the previous work [11]. The tests were carried out in one electrode system only (blade-plane), which did not allow the assessment of the influence of the homogeneity of the electric field on the shape of the trajectory. Moreover, only one type and one polarity of the impulse voltage were used in [12].
More parameters of the long spark tortuosity were reported in [13] by the State Grid Corporation of China (SGCC) and other research groups from Wuhan, China. The switching impulse voltage with a peak value of 1021 kV was used to initiate a discharge between blade-plane electrodes arranged at a distance of 3 m from each other. The angles describing tortuosity were determined both in a two-dimensional system and in a three-dimensional system. The two-dimensional system was based on photos of the discharge channel showing the projection of the channel onto the plane. The three-dimensional system was based on the conversion of the discharge channel and presenting it as a spatial object as in [12]. The tests were performed in the blade-plane system and with positive polarity of switching voltages, as in [12]. One type and one polarity of the strokes were used only. The tests were carried out in one type of the electrode system, which did not allow the assessment of the influence of the homogeneity of the electric field on the shape of the trajectory.
In [14], the tortuosity angles were calculated based on the data reported in [11] for images showing a discharge as a two-dimensional channel. The long spark was initiated by the impulse voltage with a peak value ranging from 22 kV to 75 kV. The electrodes in the blade-plane system allowed a spark ignition for a gap of 50 cm. A relatively small number of photos were used (54 images taken with 18 sparks), limiting the applicability of the results to the analysis of the interaction of random factors. It was indicated in [14] that due to the relatively small number of the data recorded, the follow-up research should be carried out to obtain more measurement data. The distances for the spark ignition were relatively small, one type of the voltage type and the polarity were used, and the calculations were performed in a two-dimensional system and for one arrangement of the electrodes only.
In [15], the tortuosity analysis was reported for 21 sparks using one angle in a two-dimensional system. The discharges were initiated by the switching impulse voltage with a peak value of 3 MV and positive polarity. A sphere-plane electrode system was used. The sphere of 1.3 m diameter was suspended at a height of 8 m above a grounded plate electrode.

1.3. Paper Aim and Structure

The referenced above data describing the tortuosity of a long spark as a three-dimensional object are related to the discharges initiated by switching impulses with positive polarity in one electrode system only (blade-plane). The aim of this paper is to report on tortuosity data for other types of impulses, other polarities, and other electrode systems than those previously published in the above referenced works. As the long spark is a spatial object, the parameters reported in this paper are recorded in three-dimensional system.
This paper gives a report on experimental evaluation of tortuosity for long spark discharges recorded at high-voltage laboratory for switching and lightning impulses (further referred as SI and LI, respectively), both with negative and positive polarities (further referred as + and −, respectively), in a sphere-sphere and sphere-plane electrode system arrangements (further referred as S-S and S-P, respectively) at voltage levels with peak values ranging from 1200 kV to 3364 kV. The measurements were performed for the electrodes arranged at a distance of 3.3 m and 5.5 m from each other. For a distance of 3.3 m, the measurements were performed in 2 × 2 × 2 = 8 configurations (LI and SI impulse voltages, + and − polarities, S-S and S-P electrode arrangements). For a distance of 5.5 m, the measurements were performed in 2 × 1 × 2 = 4 configurations (same as for 3.3 m, but with positive polarity only as the negative polarity did not allow a discharge channel for that long spark gap). For each test configuration (electrode system, impulse type, polarity, distance—summing up to 12 configurations in total) the number of impulse voltages recorded was 45, summing up to 540 recorded discharges in total. To allow full regeneration of the spark gap, the time between the individual discharges was set to 55 s. The evaluation was performed with three-dimensional approach.
The data reported in this paper can serve as an experimental reference for development of simulation models of positive and negative discharges in long air gaps.
The paper is organized as follows: Section 1 gives the background and motivation for the work presented and outlines the contributions of the paper that advances the state-of-the-art works referenced therein. Section 2 introduces tortuosity angles of long laboratory discharges as used in the study reported in this paper. Section 3 presents the measurement test set-up covering voltage generator and recording system, voltage impulses employed in the measurements, and electrode systems in which the discharges were initiated. Technical details of high voltage equipment and its arrangement in the laboratory are given to ensure compliance of the tests reported with relevant standards on high voltage testing. Section 4 reports on the measurement procedure, covering reconstruction of the spark channel in three-dimensional system, determination of the test voltage for each of the electrode system and for each type of impulses used in testing, and uncertainty of the measurements reported. Section 5 reports on the measurement results. Atmospheric conditions and 50% flashover voltage characterizing the electric strength of the measuring system are given for each of the 12 configurations. The angles describing tortuosity are then reported for each of the 12 configurations preceded by example of statistical distributions of tortuosity angles for one of the configurations. Section 6 offers final summary and conclusions.

2. Tortuosity Angles of Long Spark

The angles describing tortuosity were used for the first time to describe the trajectory of a long spark in [11]. Along with the development of digital measurement techniques enabling the recording of the spatial images of the discharge channel, the original method was modified by specifying two additional types of angles, as presented in [12,13]. In this study, the long spark parameters were determined for a wider group of discharges than in the papers [11,12,13], i.e., for discharges initiated by switching and lightning impulses with positive and negative polarity.
Figure 1 shows the computational method adopted in this paper to determine the angles α, θ, and φ of tortuosity of long spark channel. The discharge channel was divided into a series of linear successive segments: si = s1, s2, …, sN, where N is the total number of segments. Each of the segments was represented as a vector in a three-dimensional space with the coordinates X, Y, Z. The initial and the terminal points of each of the vectors are marked by P1, P2, …, PM, where M = N + 1.
The tortuosity of the discharge trajectory is determined based on three angles as in [12]. The angle αi between the consecutive segments si and si+1, is determined from the formula:
α i = a r c c o s ( s i s i + 1 | s i | | s i + 1 | ) .
The α i values are in the range from 0° to 180°. The angle θi defining the projection of the i-th segment onto the axis z ^ of the discharge channel is determined by the formula:
θ i = a r c c o s ( s i z ^ | s i | | z ^ | ) .
It is assumed that θi is within the range from 0° to 90° when the z-component of the vector segment si is negative, and from 90° to 180° when it is positive. The angle φi between the projection siP of the discharge channel segment onto the reference plane (see XY in Figure 1) and the direction vector x ^ of one of the axes of the reference plane (see X in Figure 1) is determined by the formula:
φ i = a r c c o s ( s i P x ^ | s i P | | x ^ | ) .
It is assumed that the angle φi is within the range from 0° to 180° when the y component of the vector si is lower than the y component of the vector si+1, and it ranges from −180° to 0° when the y component of the vector si is greater than the y component the vector si+1.

3. Measurement Test Set-Up

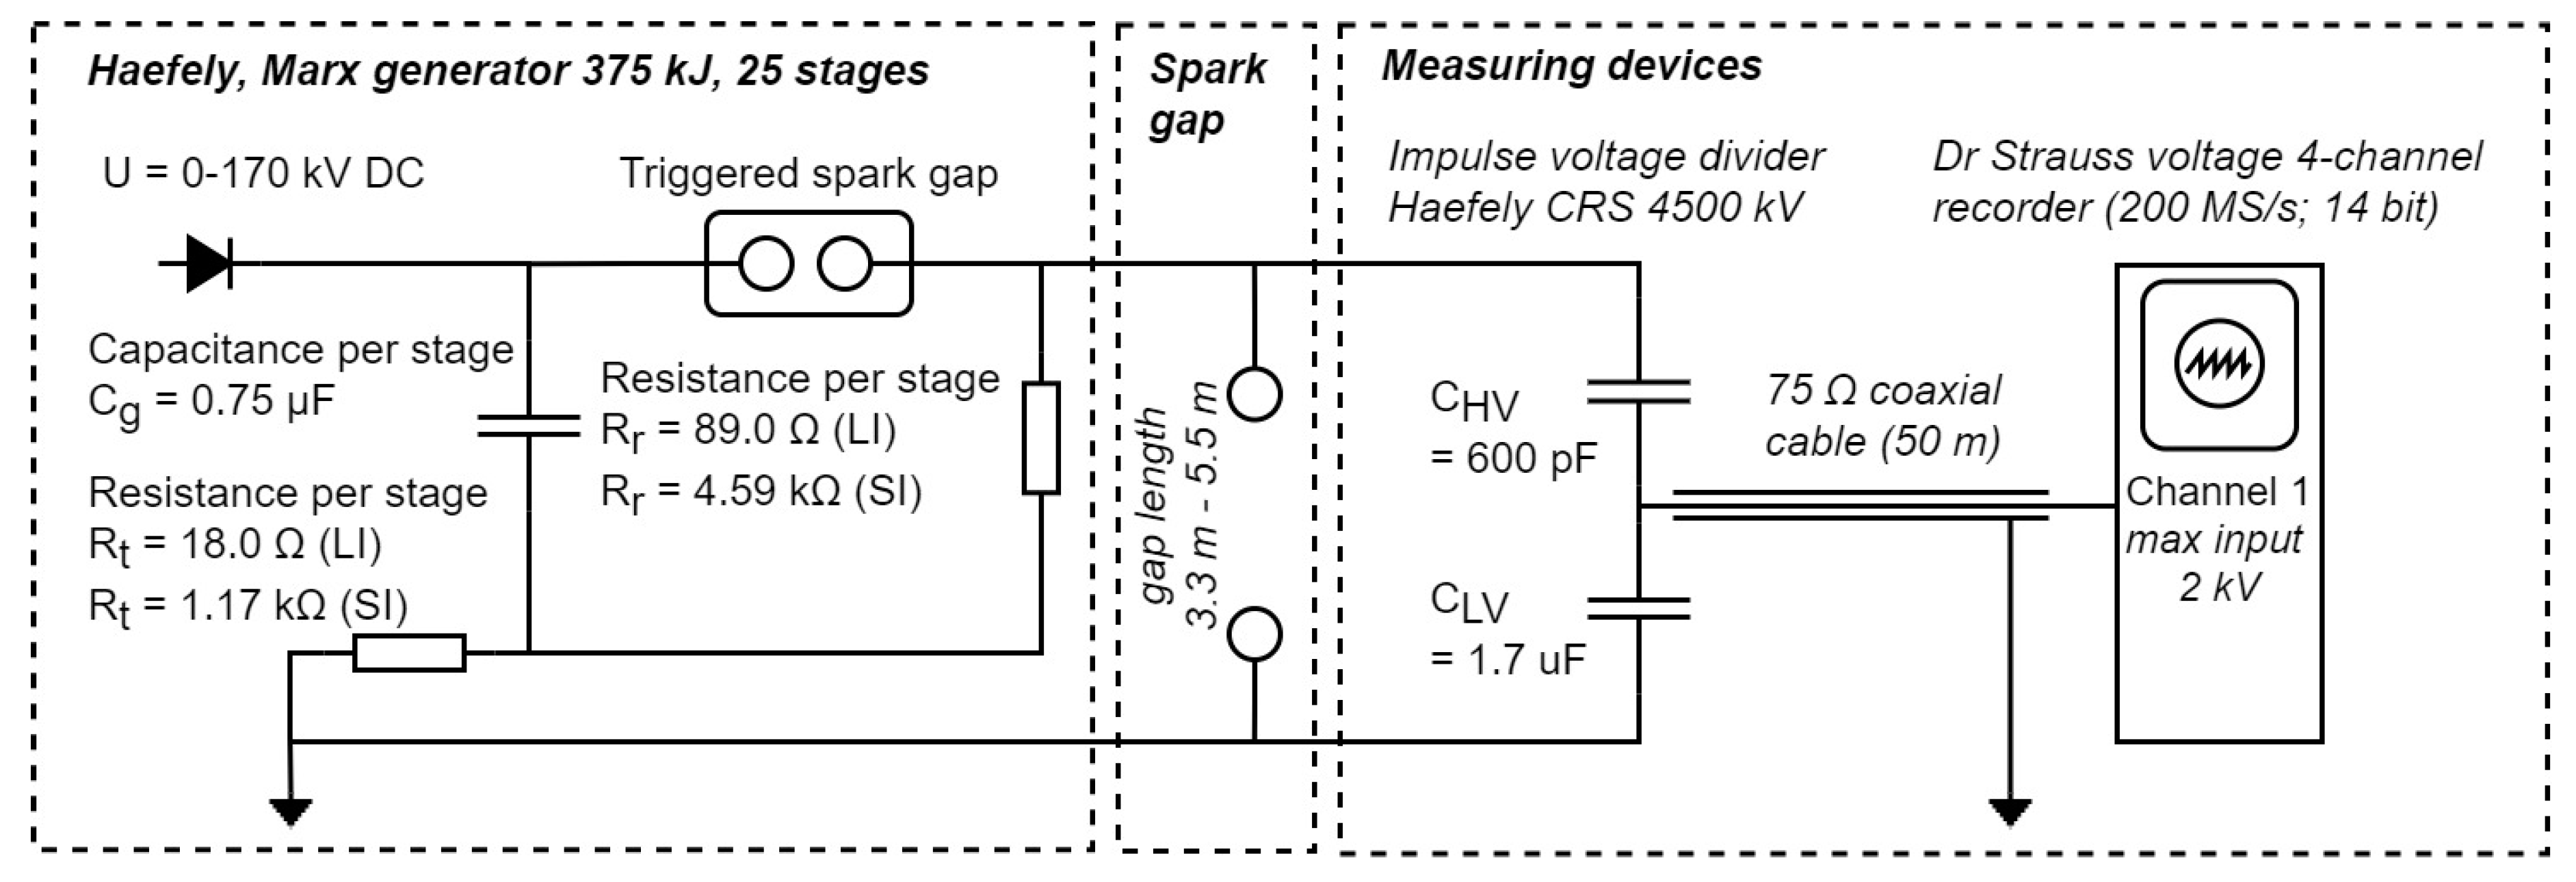
3.1. Voltage Generator and Recording System

The measurements were conducted at High Voltage Laboratory of the Institute of Power Engineering in Warsaw, Poland. Figure 2 shows a diagram of the measurement system. The test voltage was generated with a 25-stage Marx impulse voltage generator (by Haefely) with a total impulse energy of 375 kJ, allowing to produce lightning impulses with peak values up to 4.5 MV, and switching impulses with peak values up to 2.8 MV. Due to the high humidity conditions during testing (80%), the maximum charging voltage of one stage of the generator was limited to 170 kV to avoid risk of internal discharges between the generator steps. The maximum value of the voltage obtained in the system during the measurements was 2.7 MV for switching impulses (250/2500 us/us) and 3.8 MV for lightning impulses (1.2/50 us/us). The voltage was measured with the use of a Capacitive Impulse Voltage Divider CRS 4500 kV with a ratio of υ = 3150. The measuring signal was acquired from the divider via a 50-m long coaxial cable with a surge impedance of 75 Ω. The voltage waveforms were recorded with a Dr Strauss TR-AS 200-14 4-channel digital voltage recorder with a maximum input voltage of 2 kV and 14 bit resolution. Two sampling frequencies of the measuring signal were used: 200 MS/s for the lightning impulse voltage and 50 MS/s for the switching impulse voltage.
The tests were carried out using the lightning- and the switching-impulse voltages of positive and negative polarity. The voltage shapes, as shown in Figure 3, were obtained by selection of a damping resistor Rt and a discharge resistor Rr located inside the generator (see Figure 4). In the case of the switching impulses, the values of the resistors were: Rt = 25 × 1.17 = 29.25 kΩ and Rr = 25 × 4.59 = 114.75 kΩ allowing to obtain the impulse shape parameters defined by the time-to-peak (Tp) and the time-to-half-value (T2), as: Tp/T2 = 246/2400 μs (as per IEC Std. IEC 60060-1 [16]). For the lightning impulses, the shape was defined by the front-time (T1) and the time-to-half-value (T2) parameters, as: T1/T2 = 1.5/49 μs (as per IEC Std. 60060-1 [16]), which was obtained by using the resistors: Rt = 25 ∙ 18 = 450 Ω and Rr = 25 ∙ 89 = 2225 Ω. The general Cg capacitance of the Marx generator and the front capacitance CHV of the generator (equal to the HV capacitance of the voltage divider) were constant during testing and were, respectively: Cg = 0.75/25 = 0.03 μF and CHV = 600 pF.
In the case of the switching impulses, the voltage chopping associated with the long spark initiation was always observed at the impulse front (the time-to-chopping Tc was lower than the time-to-peak Tp, TC < Tp, see Figure 3), while in the case of the lightning impulses, the voltage chopping occurred always at the tail, between the front-time and the time-to-half-value (the front-time T1 was lower than the time-to-chopping Tc, which was lower than the time-to-half-value T2, T1 < TC < T2, see Figure 3). The peak voltage values recorded during the discharges were assumed as the actual values of the flashover voltage.
Figure 4 shows the test field with the measuring system arranged in such a way that the distribution of the electric field in the tested spark gap was not distorted by the measuring equipment and structural elements of the laboratory hall. The measuring system was designed in compliance with IEC Std. 60383-2 [17], according to which the minimum distance between the test object (in our case the air gap) and the elements of the laboratory equipment (in our case the generator, high-voltage cable and walls of the laboratory hall) should not be less than 1.5 length of the tested insulation gap. The maximum length of the insulation gap was 5.5 m, thus the minimum distance to satisfy the requirement was 8.25 m. The impulse generator with the voltage divider was placed in the center of the laboratory, which allowed to minimize the risk of discharges between the generator or the divider and the hall structure. The high-voltage electrode was hung on the transportation crane via a 12 m long insulating string made of composite long rod insulators, which allowed for precise setting of the spark gap length. To increase and control over the electrical strength of the system, toroidal screens made of aluminum were installed at the terminals of the insulator string. The distance of the high-voltage electrode from the nearest conductive structural element of the hall, which was the wall, was 11 m. This satisfied the requirement accepted for testing of insulation systems, that the elements of laboratory equipment should be at a distance not lower than 1.5 times the length of the insulation gap [17].

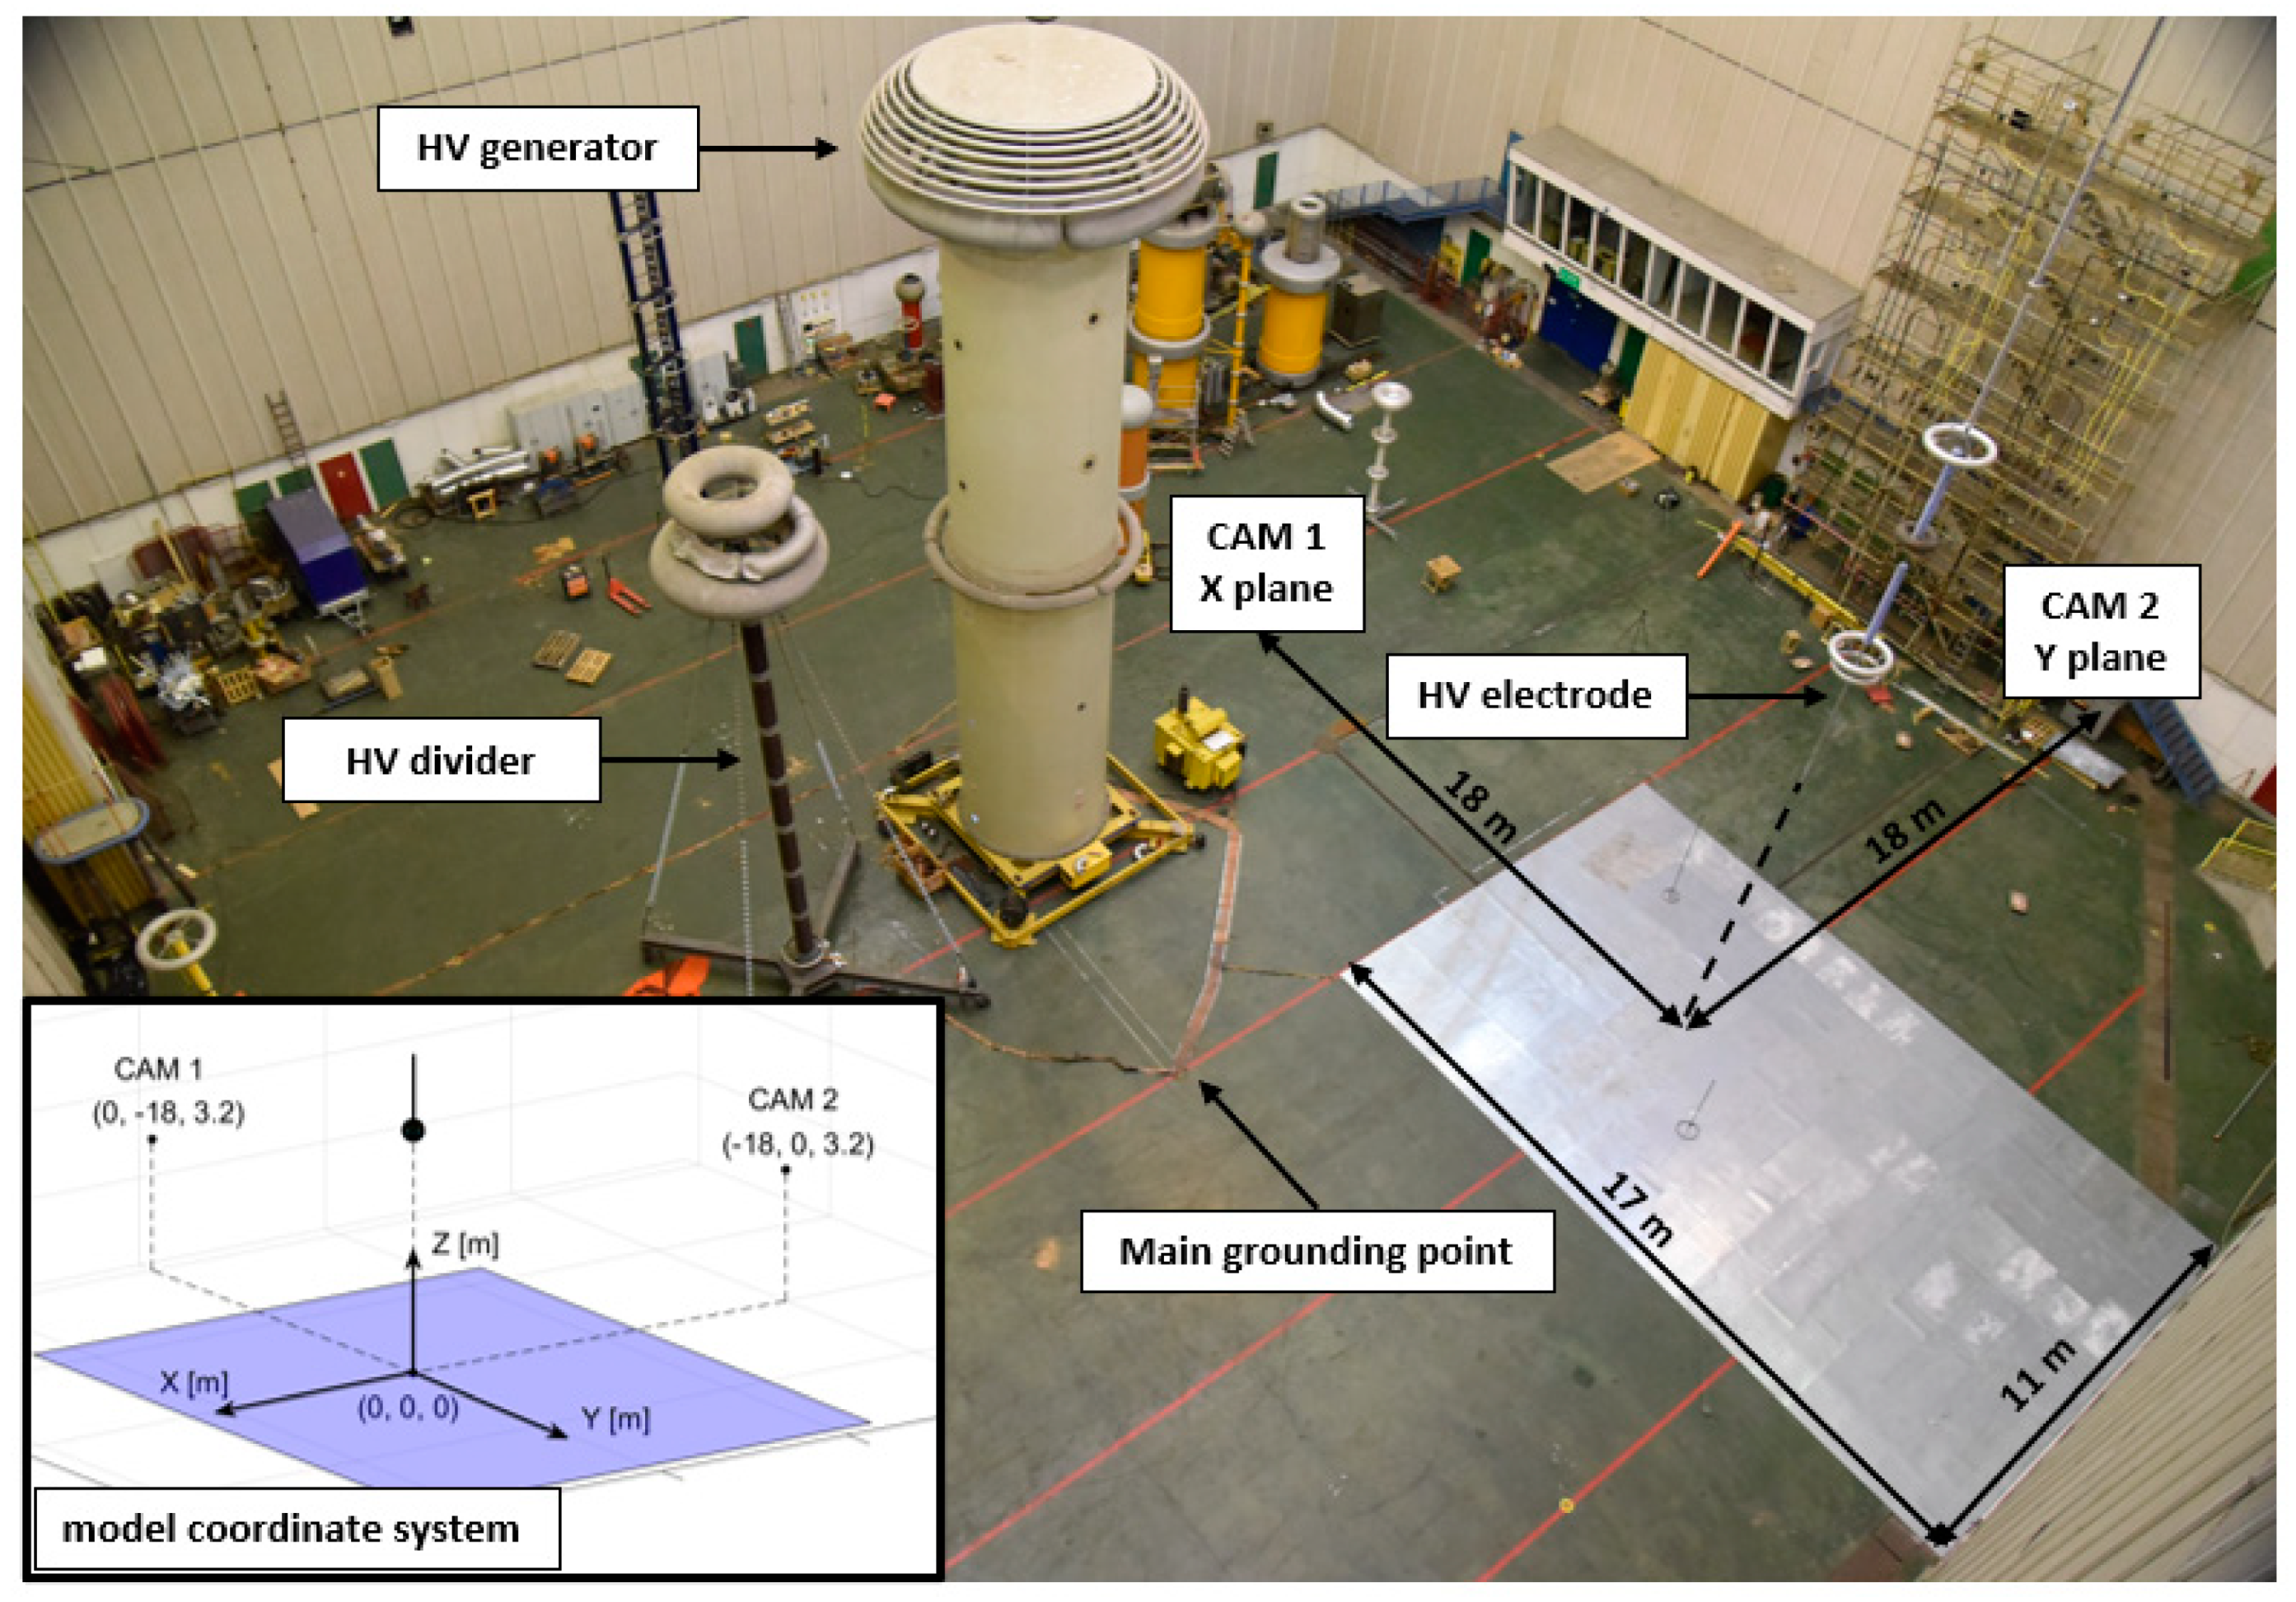
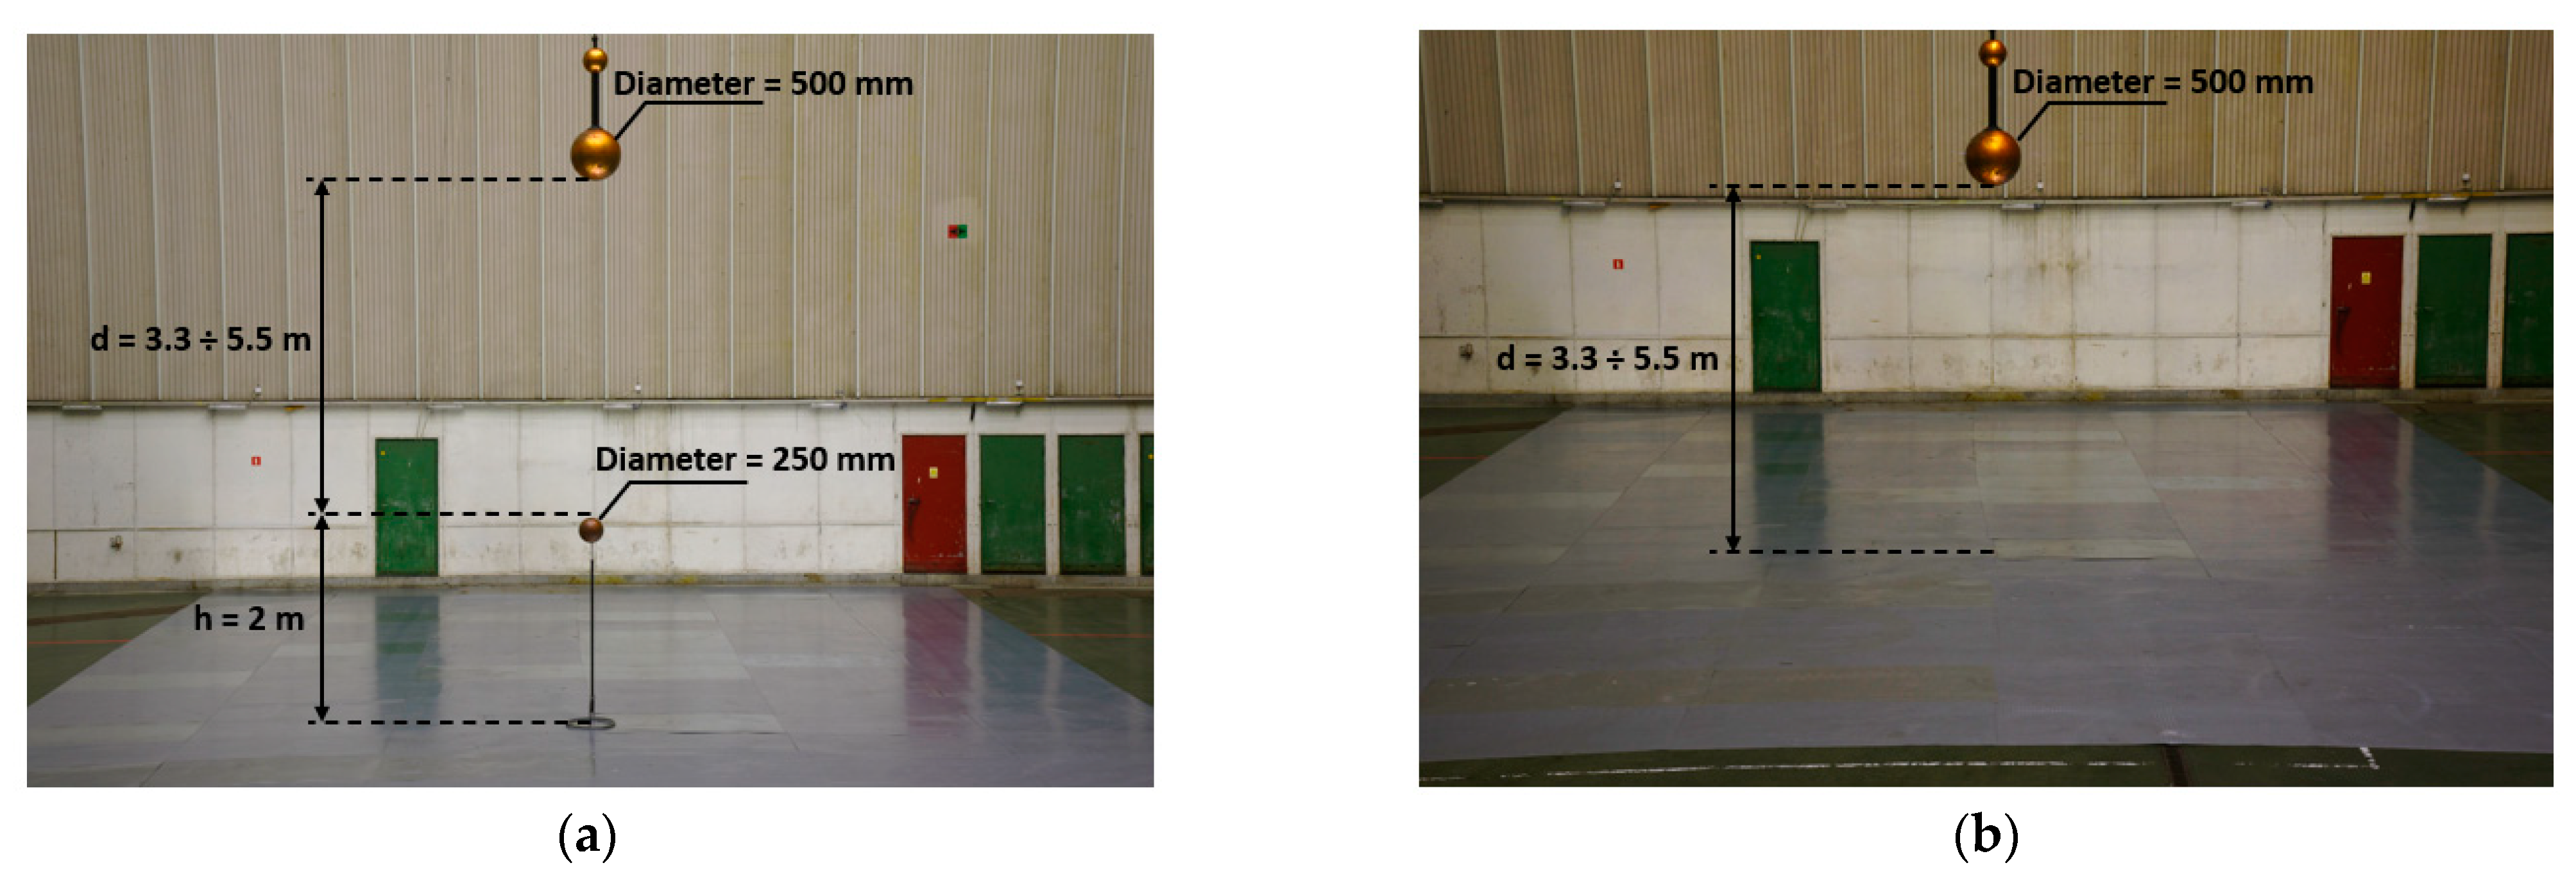
3.2. Electrode System

The measurements were performed with the use of two most common types of high-voltage electrode systems: sphere-sphere and sphere-plane, as shown in Figure 5. In both systems, the high-voltage electrode was made of a copper sphere with a diameter of 500 mm, suspended over a conductive plane measuring 17 m by 11 m, made of steel sheets, constituting plane electrode. The plane electrode was connected to the laboratory grounding system via a copper tape.
In the case of the sphere-sphere system, a metal steel pipe with a diameter of 30 mm was placed directly under the high-voltage electrode, with a spherical electrode installed on its top. The latter electrode was of 250 mm diameter. The grounded electrode created in this way had a height of 2 m that was constant along the tests.
In the preliminary measurements, it was estimated that the maximum length of the spark gap allowing for testing with the use of the lightning- and the switching-impulses with both polarities, was 3.3 m. This value resulted from the electric strength of the sphere-sphere system for the switching impulse with negative polarity, for which 95% of the breakdown voltage, estimated based on the U50 + 2σ dependence (as per IEC Std. IEC 60060-1 [16]), was approximately 2.6 MV. For the impulses with positive polarity, it was feasible to increase the spark gap length to 5.5 m. This value resulted from the strength of the sphere-sphere system, using the lightning impulse of positive polarity, for which 95% of the flashover voltage estimated based on the U50 + 2σ dependence (as per IEC Std. 60060-1 [16]), was approximately 3.3 MV.

4. Measurement Procedure

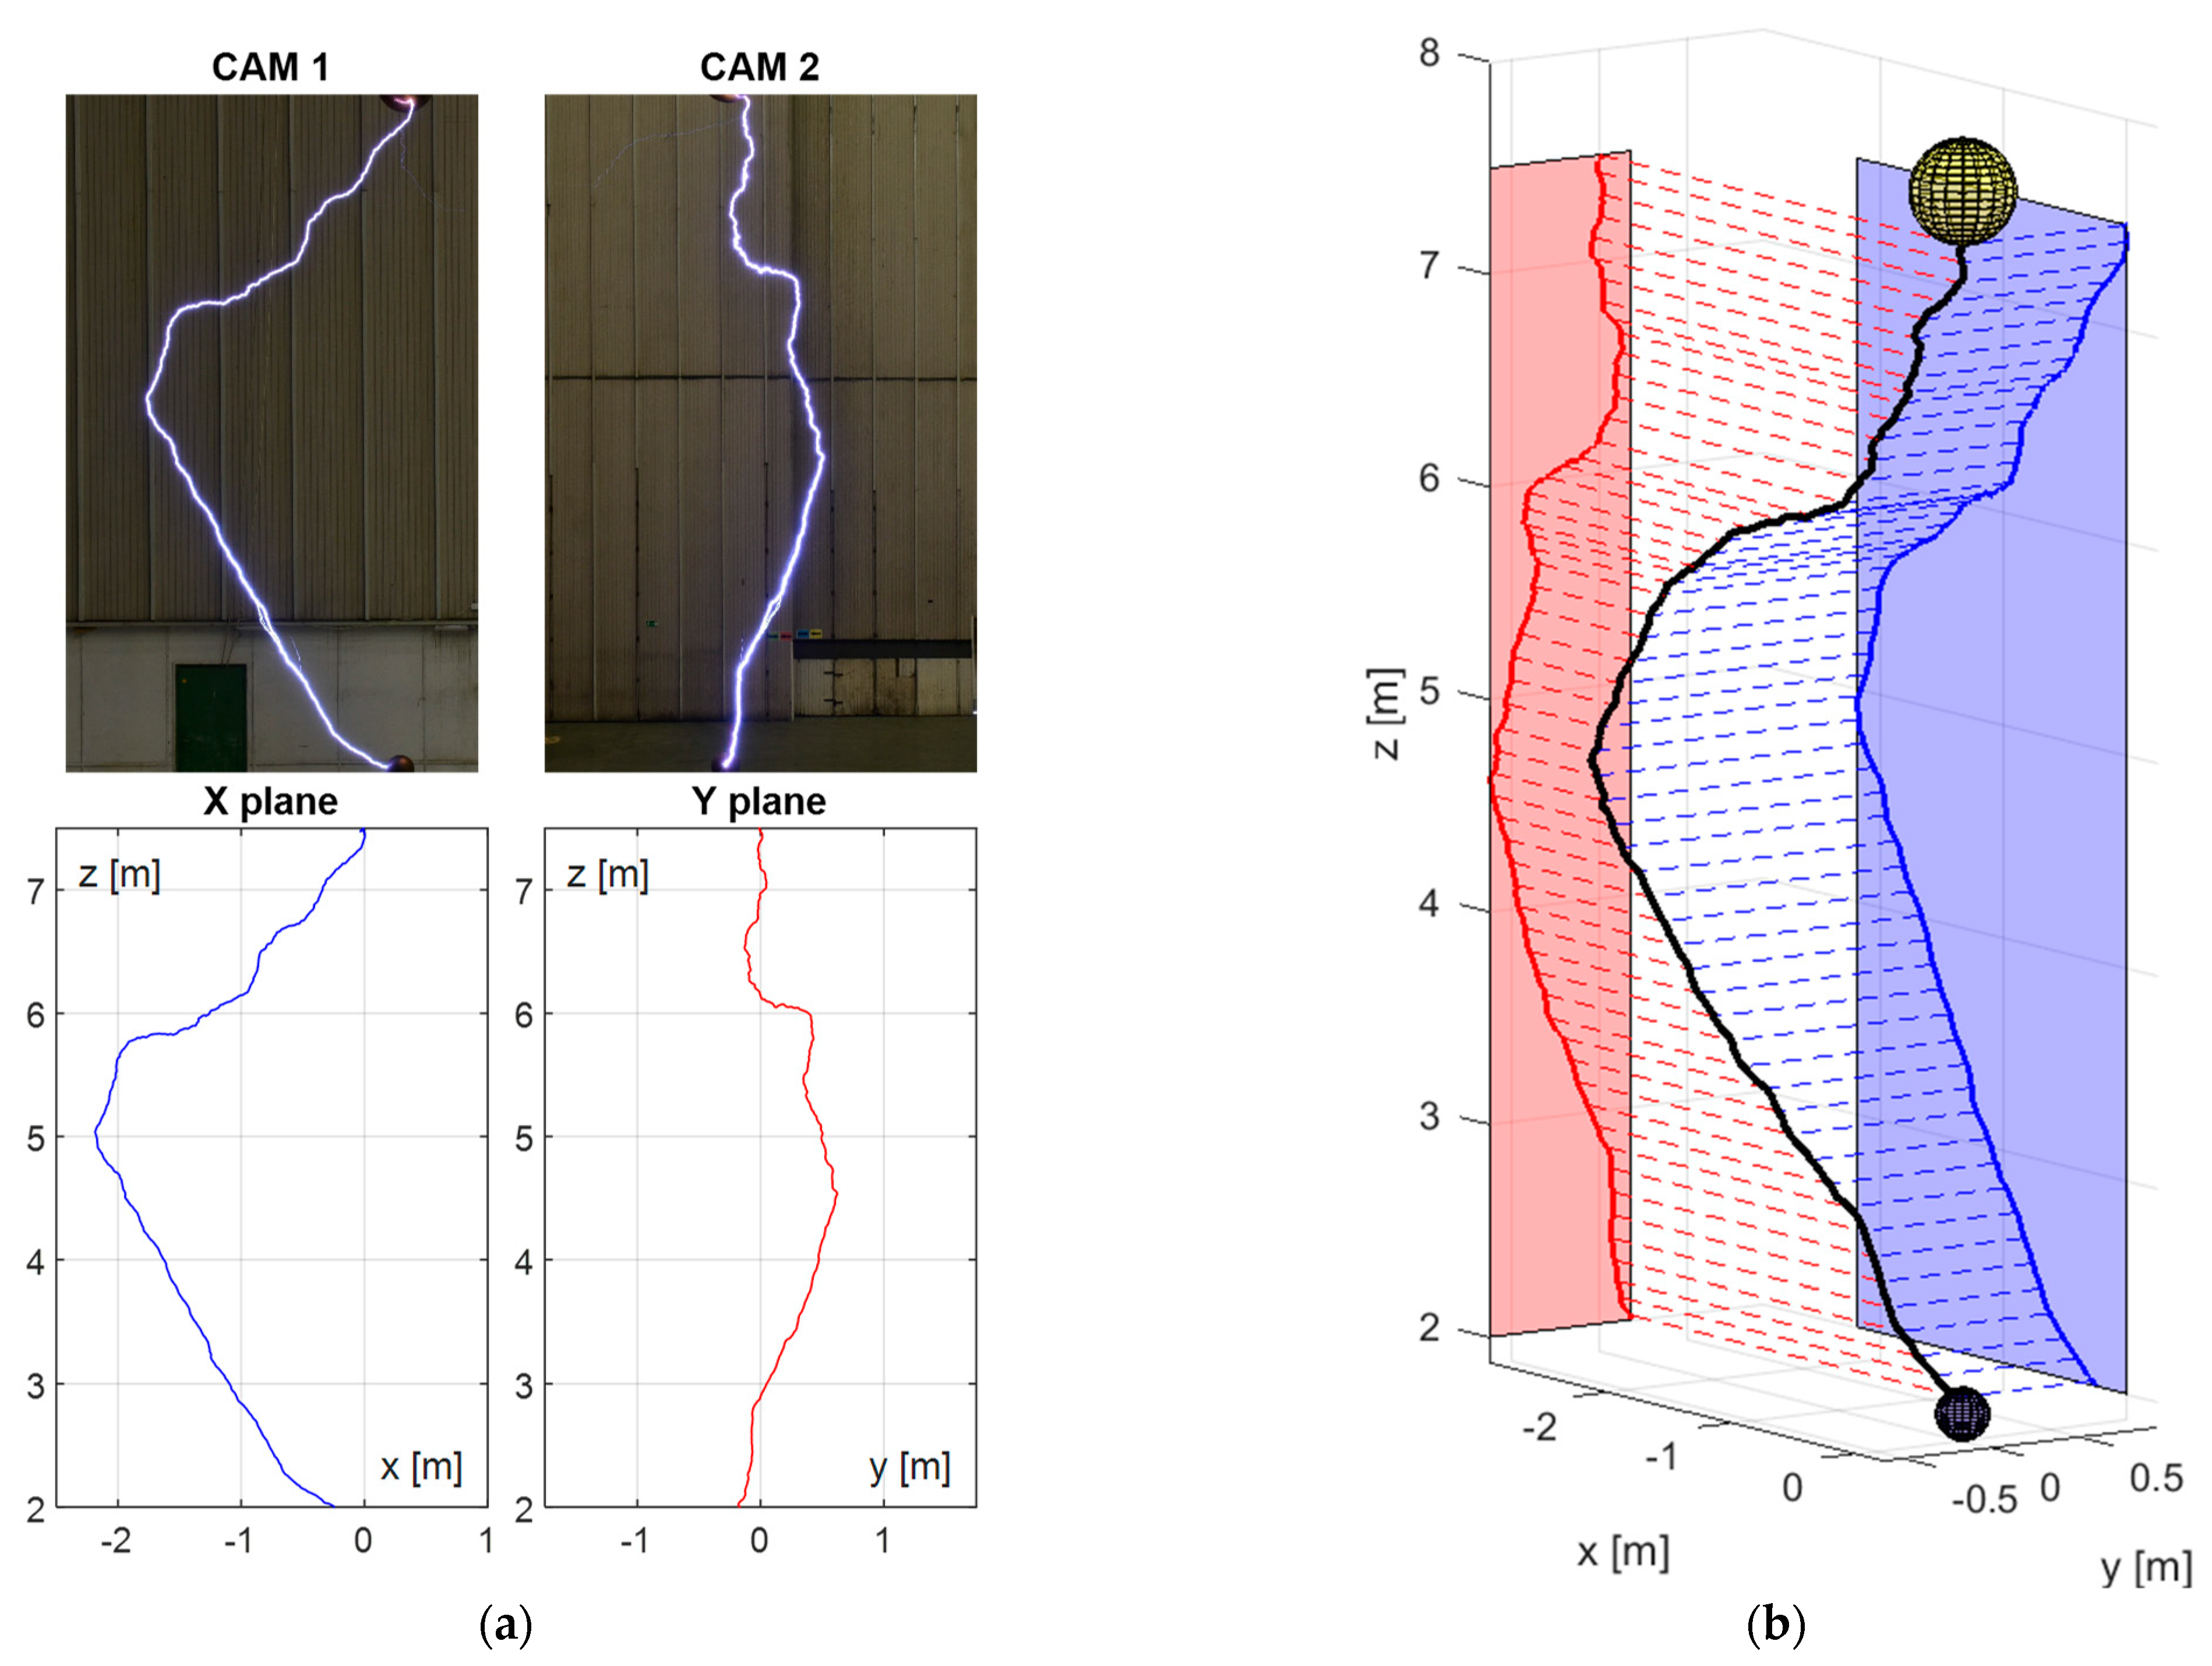
4.1. High Resolution Recordings of Leader Path
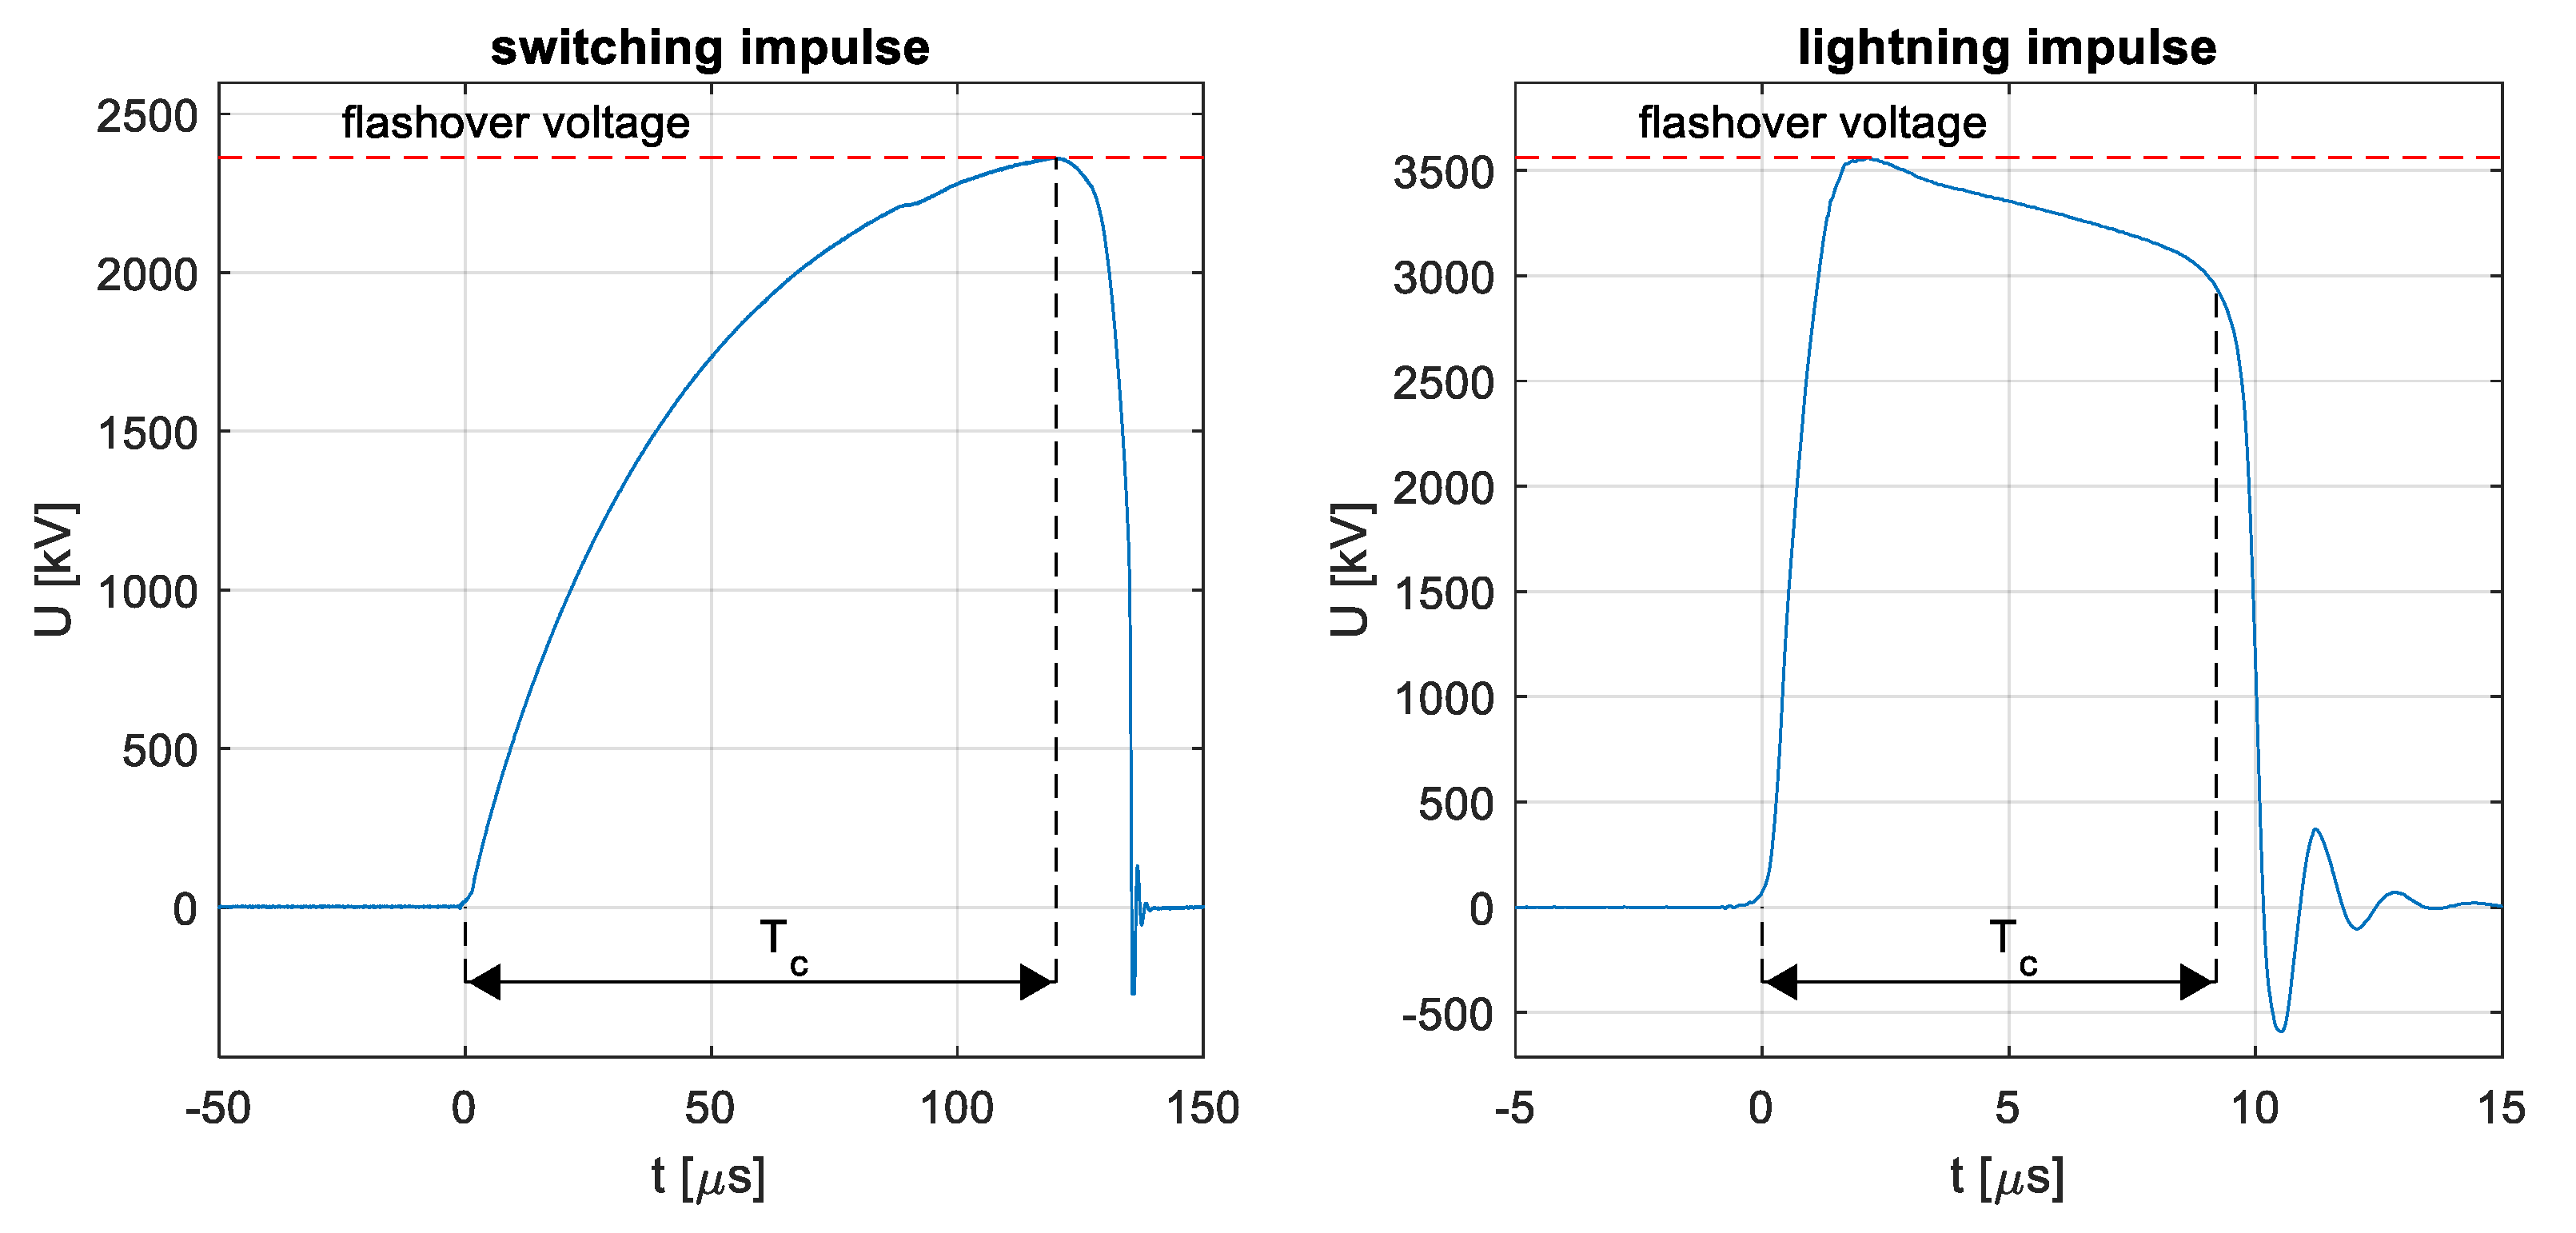
The spatial trajectory was determined based on two photos of the same spark taken simultaneously by two Nikon D750 cameras synchronized with each other. Both cameras were placed in metal housings, to protect them against direct electric discharges and to ensure shielding of the devices against the effects of an electric field. The connection of the cameras with the computer engaged for controlling of the devices and for data acquisition was established using a 40 m long fiber optic link.
The positioning of the cameras, as shown Figure 4, made it feasible to take pictures showing the projection of the discharge channel trajectory onto two planes perpendicular to each other (X plane and Y plane, see Figure 4 and Figure 6). The obtained images were digitally analyzed providing a set of points containing the coordinates of the discharge channel projections on the planes of the rectangular coordinate system (see Figure 6a). Adopting the common Z coordinate for both data sets, the discharge channel was presented in a form of a spatial object (see Figure 6b).

4.2. Test Voltage

Prior to the actual measurements, the test voltage Up was determined for each electrode system (sphere-sphere, sphere-plane), each type of impulse (lightning, switching), and each polarity (positive, negative). The test voltage was determined based on the 50% discharge voltage U50 (measured as per IEC Std. 60060-1 [16]), according to the formula:
U p = U 50 + 2 σ ,
where σ is the standard deviation provided by the up-and-down method according to IEC Std. 60060-1 [16]. The test voltage ensured stable measurement conditions, for which at least 95% of all impulses applied to the high-voltage electrode resulted in a discharge in the electrode system. For each test configuration (electrode system, impulse type, polarity, distance—12 configurations in total) the number of impulse voltages was 45, summing up to 540 recorded discharges in total. To allow full regeneration of the spark gap, the time between the individual discharges was set to 55 s.

4.3. Measurement Uncertainty

The measurement uncertainty was estimated in accordance with the Joint Committee for Guides in Metrology (JCGM) document No. 100:2008 [18], and the IEC Std. 60060-2:2010 [19].
The measurement uncertainty of the peak voltage was estimated as ±0.97% for lightning impulse voltages and ±0.86% for switching impulse voltages. The expanded uncertainty of measurement was defined as the standard uncertainty of measurement multiplied by the coverage factor, k = 2, which for a normal distribution equates to an expansion probability of approximately 95%.
The measurement uncertainty of the tortuosity angles was estimated as ±4.9° based on the method adopted from [18]. The expanded uncertainty of measurement of the tortuosity angles U was calculated using the formula:
U = k ( Δ a 3 ) 2 + s 2 ,
where: k = 2—coverage factor for 95% coverage probability, Δa—mean value of tortuosity angles measured for the reference discharge of known geometry, s—experimental standard deviation of the mean value of the given tortuosity angle for the reference discharge.
The reference discharge was generated using the techniques used to initiate the triggered lightning by applying voltage to a thin copper wire, 0.13 mm in diameter, suspended perpendicularly above the surface of the grounded plane on the laboratory floor. As a result of the current flow, the conductor evaporated, and a straight-lined long spark was formed in its place. According to the definition introduced in Figure 1, the mean values of the tortuosity angles for the discharge generated in this way equal to zero.
Measurement of the reference discharge trajectory was performed for the lightning impulse with negative polarity. Due to the highest values of currents, the channel was characterized by the strongest illumination, which made the reconstruction of the trajectory the most uncertain. When estimating the measurement uncertainty, the influence of camera positioning was ignored as the camera positions were determined using the design points of the laboratory hall, which guaranteed that the 90° angle was maintained with an accuracy that allows the influence of camera positioning to be ignored. Therefore, two components of the measurement uncertainty were adopted in the calculations. The first one was related to the error of the algorithm, Δa, employed to reconstruct the discharge channel based on the photos taken. The second component, s, was related to the imperfect trajectory of the reference discharge and was considered as the inaccuracy of the adopted reference discharge.

5. Measurement Results

5.1. Atmospheric Conditions

According to the high voltage test procedure [16], the flashover voltage values reported in this paper have been converted to normal atmospheric conditions: t0 = 20 °C, p0 = 1013 hPa, h0 = 11 g/m3. Table 1 shows the atmospheric conditions during the measurements for the individual test configurations: switching/lightning impulses (SI/LI), positive/negative polarization (+/−), sphere-sphere/sphere-plane electrode systems (S-S/S-P). The values of the Kt coefficient considering the influence of humidity and air density indicates that despite the relatively high humidity, the atmospheric conditions did not affect the flashover voltage by more than 3%.
Atmospheric conditions have a significant impact on the development of electrical discharges in the air, which is reflected in the test procedures defined by the standards. The aim of this paper is not to assess the impact of atmospheric conditions on the discharge trajectory, but to provide experimental data that can be useful to development and validation of a simulation model. Therefore, the test results presented refer to the conditions that prevailed during the measurements. Table 1 summarizes the atmospheric conditions for all the tested configurations of the measurement system.

5.2. 50% Flashover Volatge
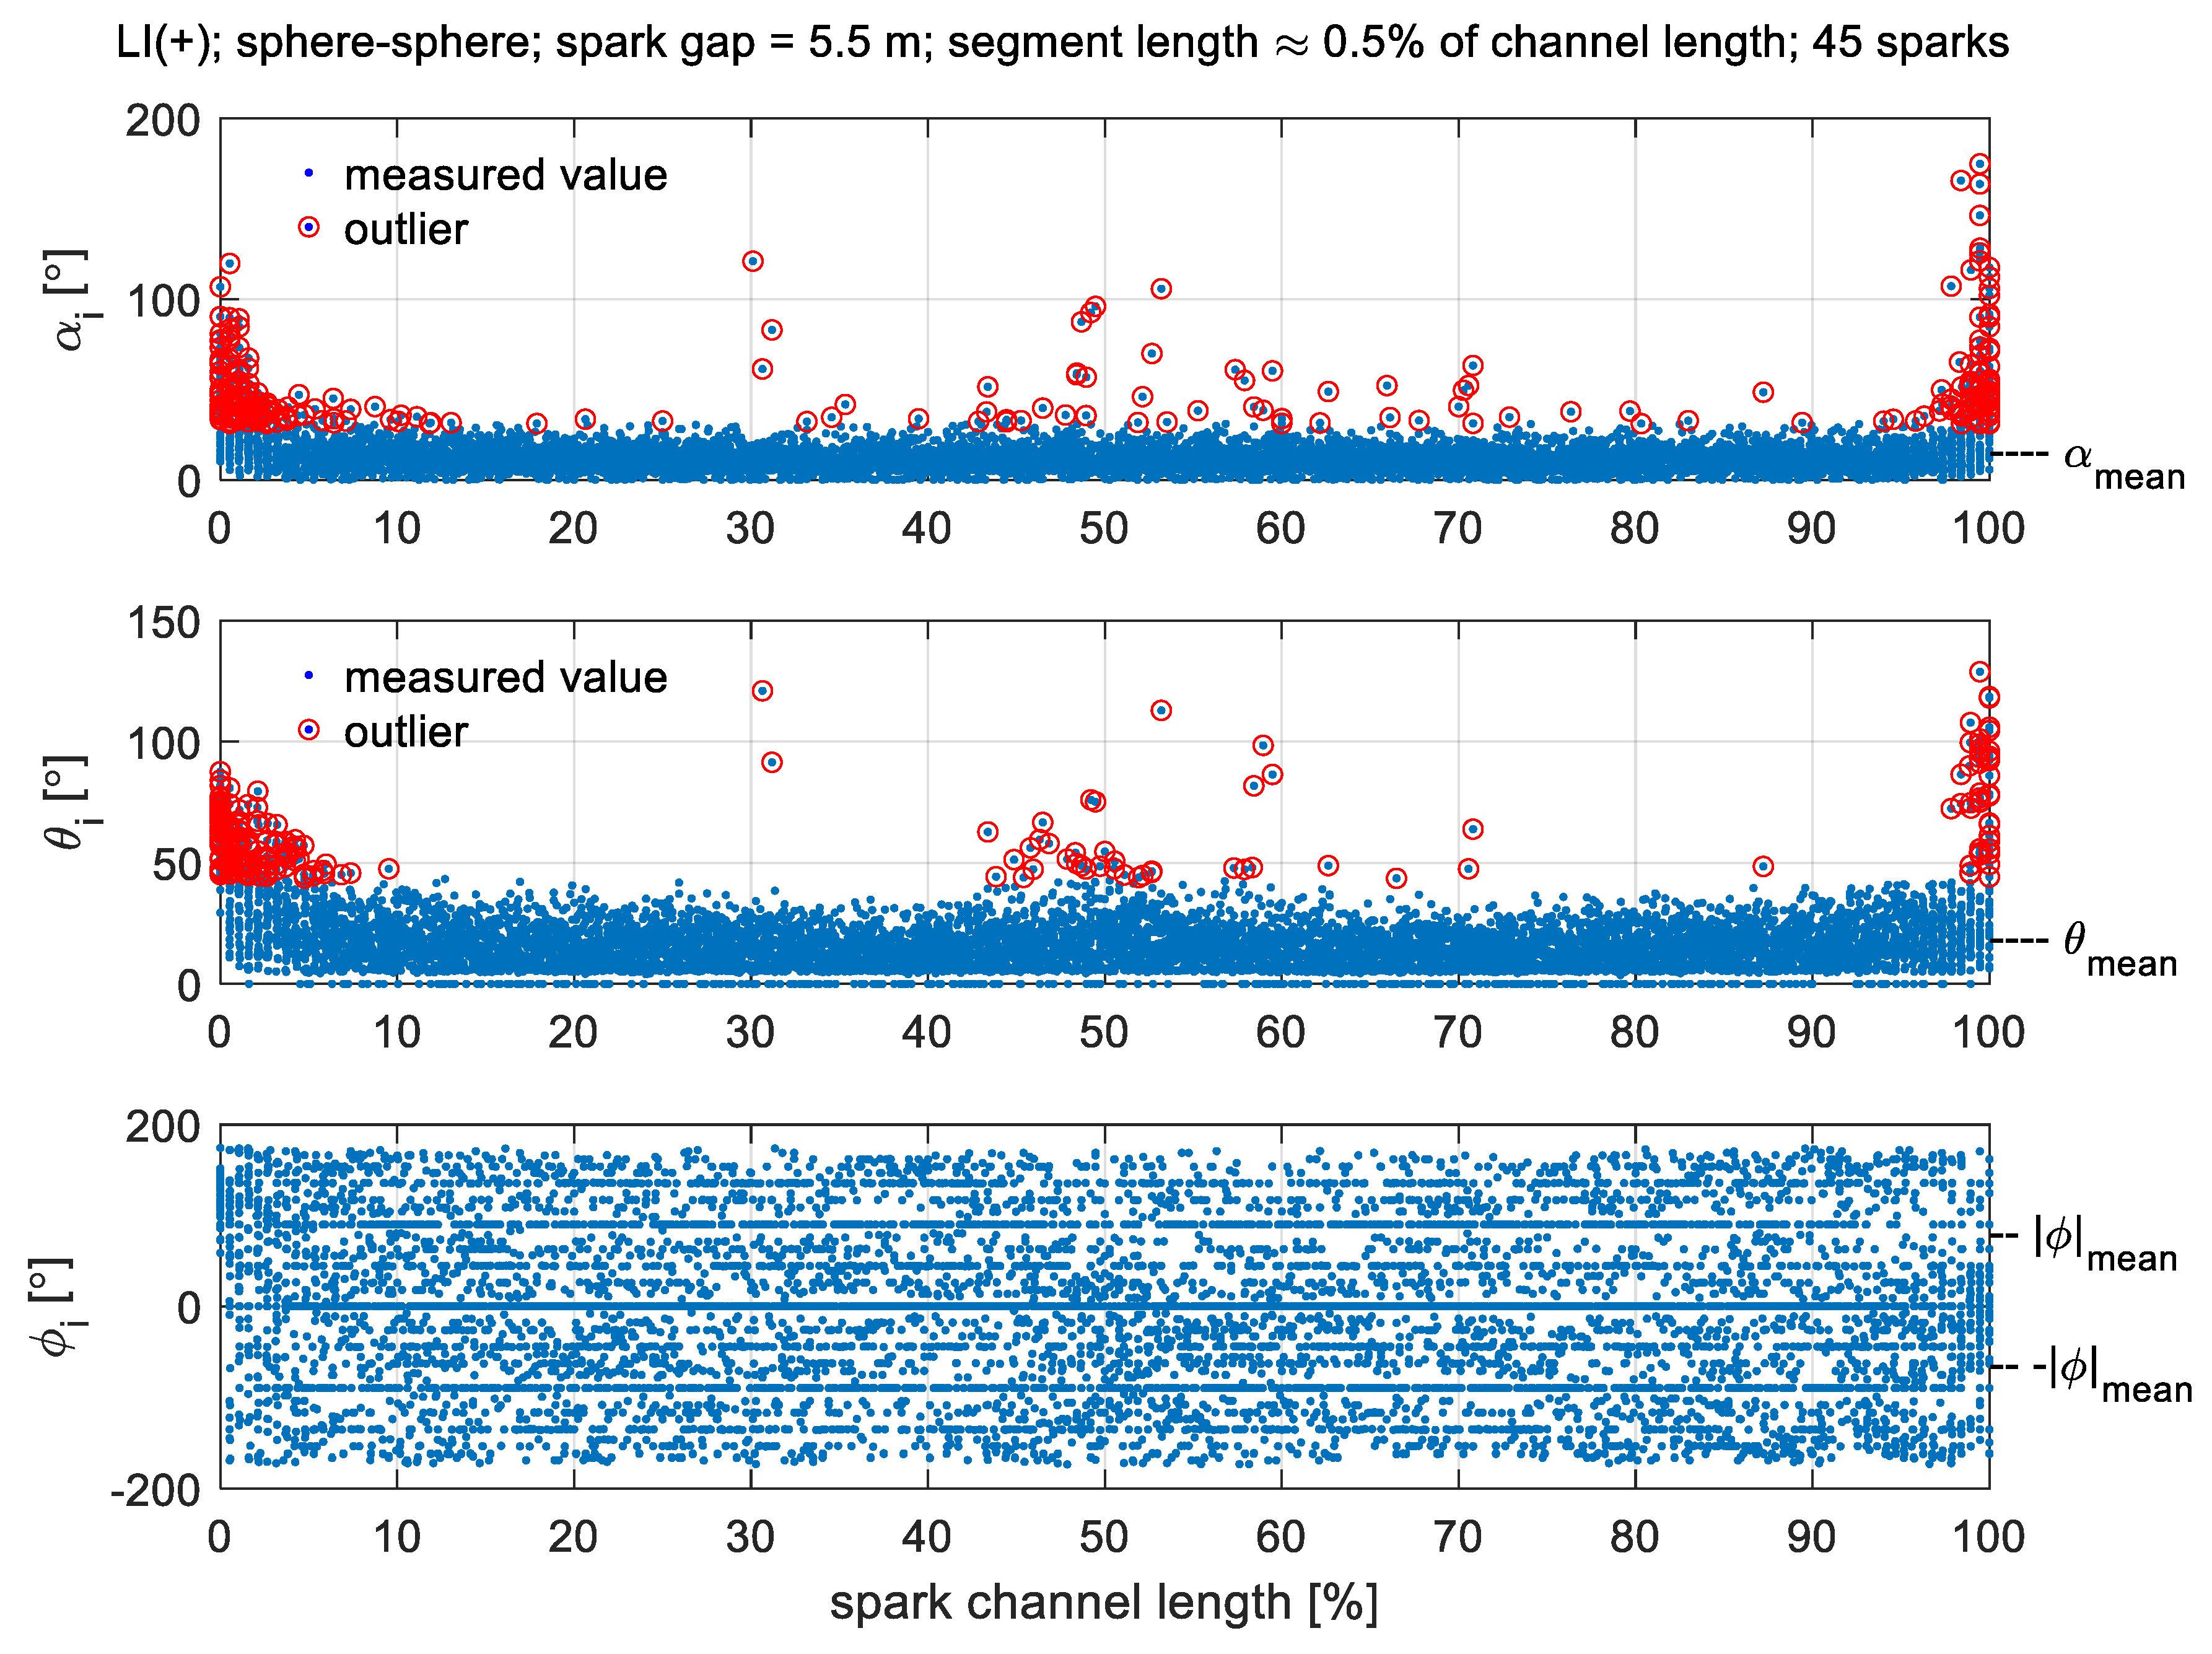
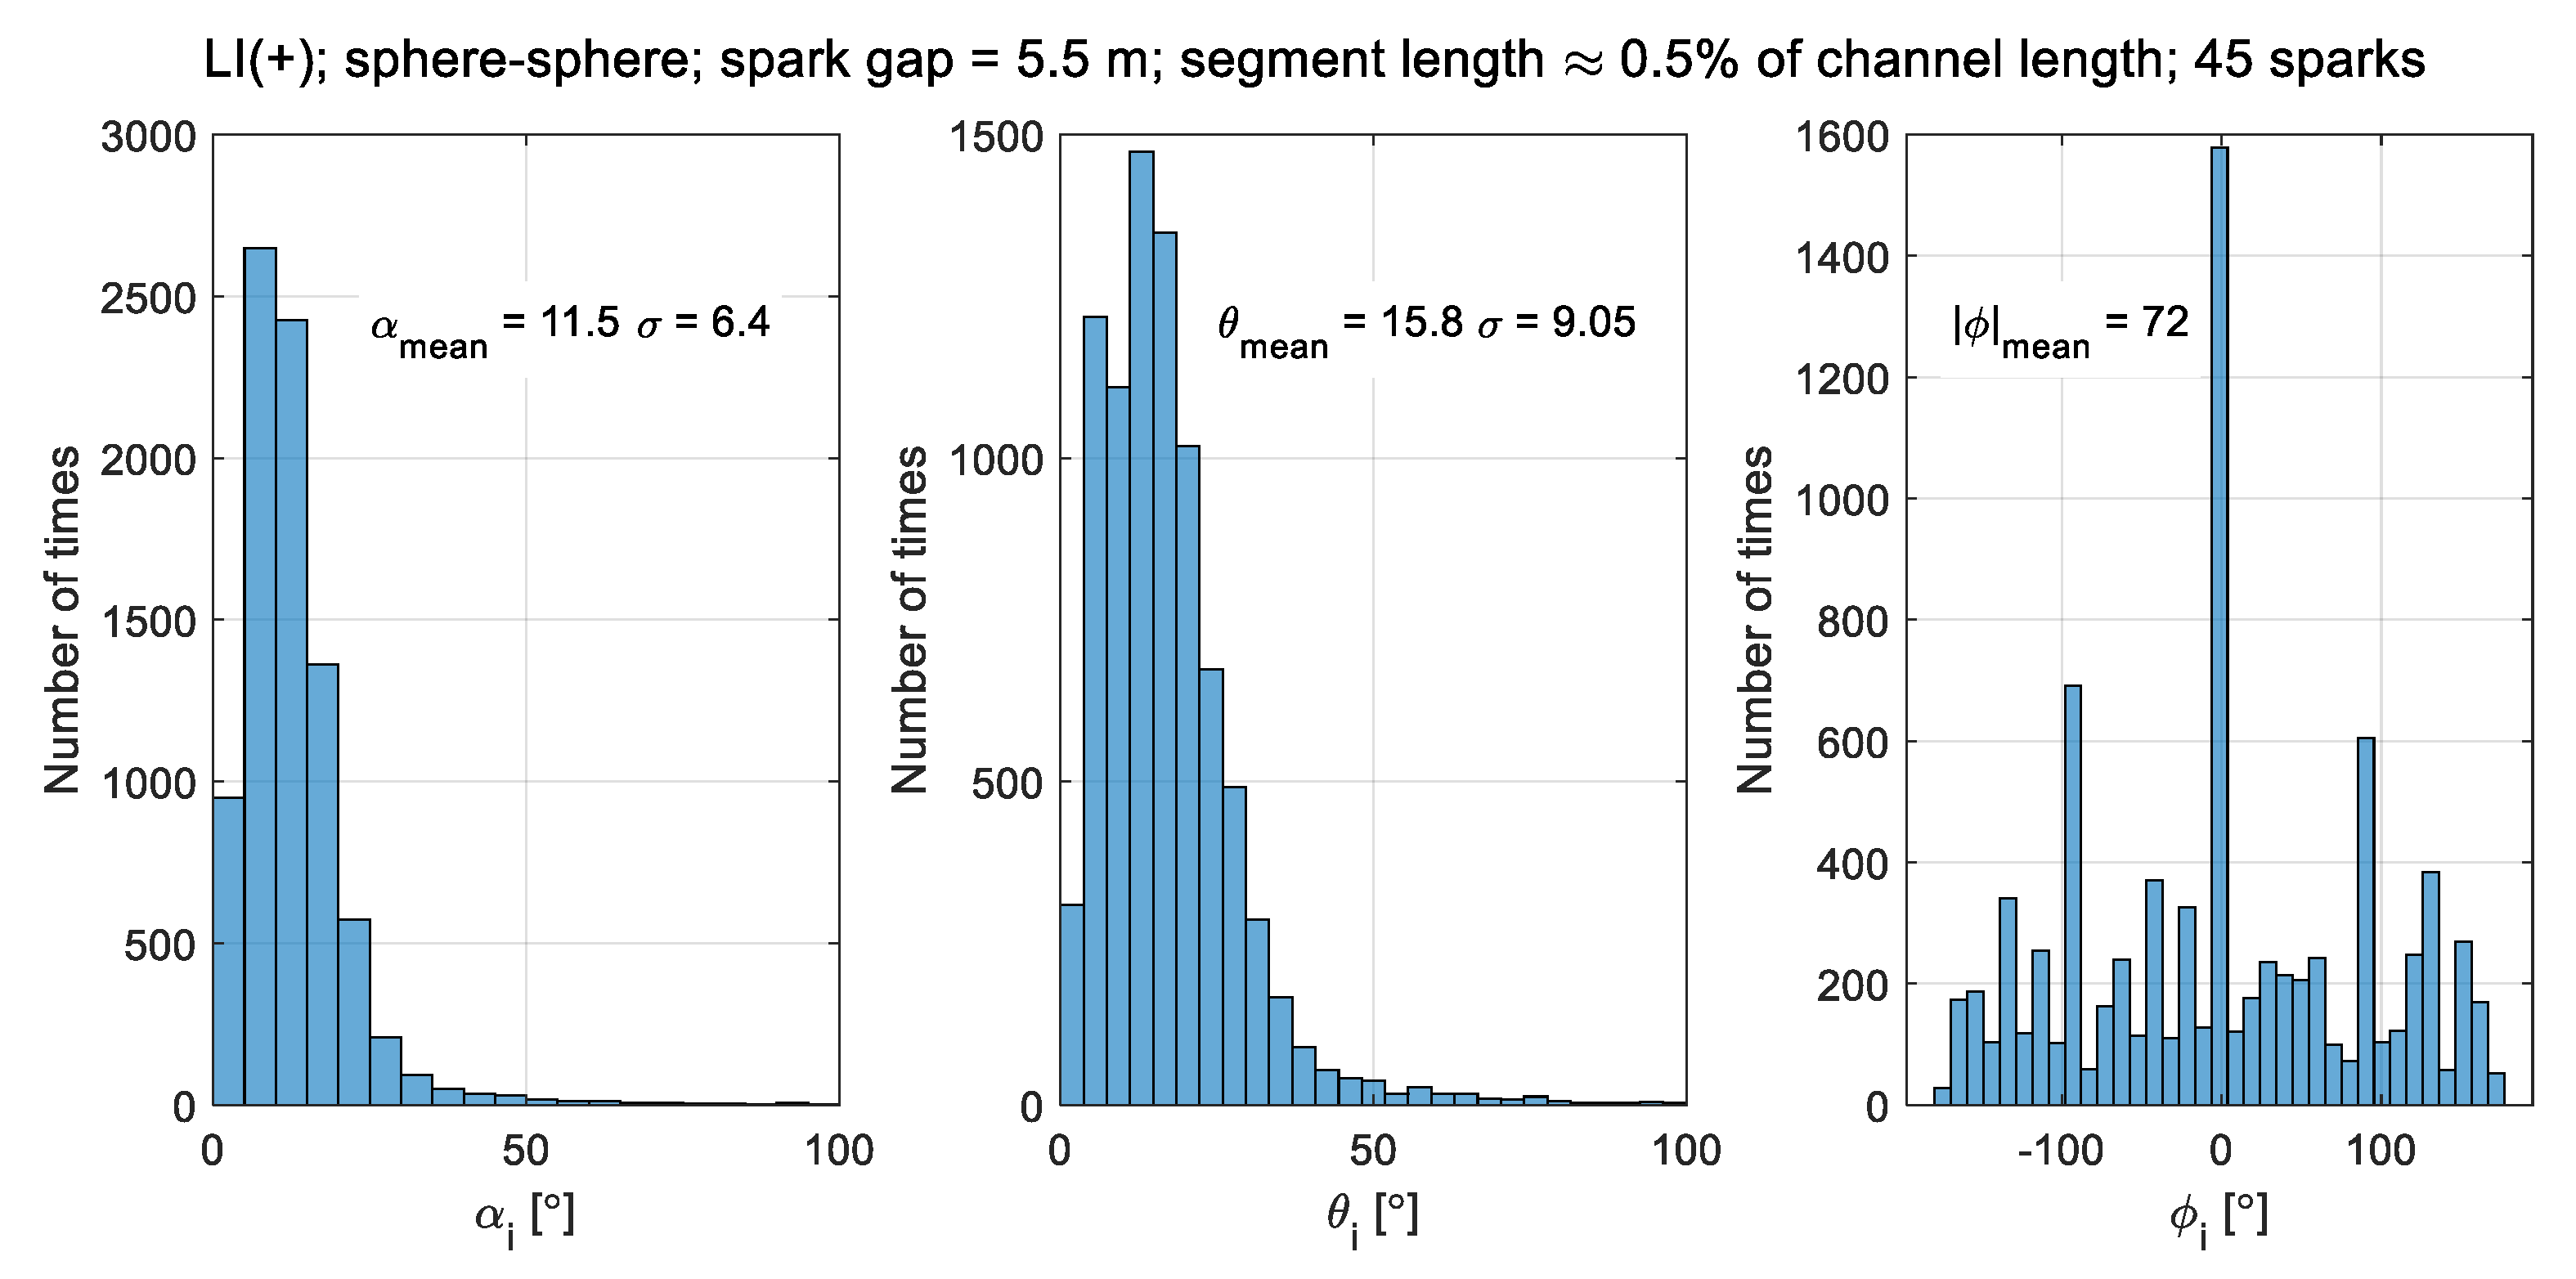
Table 2 shows a 50% flashover voltage characterizing the electric strength of the measuring system for each of the 12 configurations. Moreover, the average value of the flashover voltage Umean is given for each configuration. These data, describing the conditions in which the measurements were performed, may allow the presented tests to be reproduced or to be utilized for conducting numerical simulations for the same conditions. It can be seen from Table 2 that standard deviation of the flashover voltage distribution is higher for switching than in the case of the lightning impulses. The impulse chopping always occurred at the front for the switching impulses and at the tail for the lightning impulses.

5.3. Tortuosity

The angles describing tortuosity depend on the length of the computational segment. Various segment lengths have been used in the research carried out so far. In [11], the segment length was 0.42 cm, which was approximately 0.84% relative to the discharge channel length (the spark gap length was 50 cm therein). In [13], the relative segment length was approximately 0.5% of the discharge channel length. In [12], the distance between the electrodes was 8 m and the length of the computational segment was 0.02 m, which stated for approximately 0.25% of the discharge channel relative length. In this paper, the results for the relative segment length of 0.5% are reported.
Figure 7 shows the values of the angles αi, θi, and φi as a function of the position of the computational segment along the discharge channel. As the trajectory of each discharge is different, therefore, in order to show in one figure the angles for all discharges generated in a given configuration of the measurement system, the length of the discharge channel was presented in relative units. As the beginning of the discharge channel (0% of the spark channel length) the segment of the channel at the high-voltage electrode was assumed. The values of the angles αi, θi, and φi shown in Figure 7 were determined assuming that the length of the computational segment was 0.50% of the discharge channel length, which in this configuration of the measuring system (lightning impulse with positive polarity, sphere-sphere electrode system, 5.5 m distance between electrodes) allowed for approximately N = 200 segments for each of the recorded discharge (the total number of the recorded discharges for each configuration was 45). Figure 7 also shows the mean values of the angles αmean, θmean and |φ|mean, describing the tortuosity of the discharge trajectory.
The values of the angles αi and θi, are higher both at the beginning and at the end of the discharge channel, which can be interpreted as an abrupt change in the direction of the discharge channel development. The occurrence of such large deviations within the electrode zones can also be attributed to imperfection of the image processing algorithm used, which recognizes the discharge channel based on the criterion of pixel brightness, and thus may misinterpret reflections on the surface of the shiny metal electrodes as a fragment of the discharge channel. Moreover, due to the size of the spherical electrodes used (500 mm for the high voltage electrode and 250 mm for the grounded electrode), there could also be incidences in which the electrode covers the initial fragment of the discharge channel in front of one of the cameras, which may also contribute to deformation of the extreme fragments of the discharge channel. Therefore, in order to calculate the mean values of the angles describing the tortuosity of the discharge channel for a given electrode system and for the given test voltage, the outliers were eliminated as marked by red circles in Figure 7. Then, the so-called robust iterative algorithm was used for determining the mean and standard deviation of the remaining data [20].
For a given configuration of the measurement system, the set of angles describing the tortuosity can be expressed in a form of a vector: x(1), x(2), …, x(p). The initial values of the mean xmean and the standard deviation σx can be determined as:
x m e a n = m e d i a n   o f   x i
σ x = 1.483 · m e d i a n   o f   | x i x m e a n | ,
where i = 1, 2, …, p. For each value of x, the xi* was calculated according to:
x i * = { x m e a n δ           w h e n           x i < x * δ   x m e a n + δ           w h e n           x i > x * + δ x i                                             o t h e r w i s e ,
where δ = 1.5∙σx. The updated values of the xmean and the standard deviation σx are then determined:
x m e a n = 1 p i = 1 p x i * ,
σ x = 1.134   i = 1 p ( x i * x m e a n ) 2 / ( p 1 ) .
The calculations are performed iteratively until the differences between the xmean and the σx values obtained in successive iterations are smaller than the third significant digit. In the case of the angle φ, ranging from −180° to 180°, the |φ|mean was determined for the absolute values |φ|.
Figure 8 shows an example of the distributions of individual angles for one of the configurations of the measurement system (lightning impulse with positive polarity in sphere-sphere electrode system with 5.5 m distance between the electrodes). For a given electrode system and a given test voltage, the angle αmean is smaller and shows less dispersion than the angle θmean, which is relevant for the results shown in Table 3 for all impulse types and system configurations and is also in agreement with the observations presented in [12] where a less disperse distribution for α than θ was reported.
Table 3 shows the measurement results for all types of impulse voltages (switching/lightning: SI/LI, positive/negative: +/−) and electrode systems (sphere-sphere/sphere-plane: S-S/S-P) for relative segment length of 50%. For the angles α and θ, the variations in the mean values between individual electrode configurations are not significant and are within the standard deviation. However, it can be observed that: (1) the sparks initiated by the positive impulse voltages are more tortuous than those initiated by the impulse voltages with negative polarity, (2) the sparks initiated by the switching impulses are more tortuous than the sparks initiated by the lightning impulses, (3) the sparks in the sphere-plane electrode configuration are more tortuous than the sparks in the sphere-sphere electrode configuration.
The tortuosity angles α and θ for positive switching impulse (SI+) and sphere-plane electrode system (S-P) were reported in [12,13], as follows: α = (6.3 ± 5.8)°, θ = (20.9 ± 20.9)° [12]; α = (13.3 ± 9.9)°, θ = (23.9 ± 19)° [13]. Based on Table 3, the following data for equivalent measurement conditions (namely: switching impulse with positive polarity in sphere-plane electrode system) are reported in the present paper: α = (17.4 ± 9.9)°, θ = (22.6 ± 14.1)° (for 3.3 m discharge channel length); α = (16.7 ± 9.5)°, θ = (22.5 ± 14.5)° (for 5.5 m discharge channel length). These results show, that for the angle α, the differences between the results reported in this paper and [13] are small and fall within the standard deviation. However, when comparing the results reported in this paper to the results reported in [12], the differences are much greater, exceeding 60%. For the angle θ, the differences between all results do not exceed 10%. Table 4 summarizes the comparison of the tortuosity angles reported in the present paper to the results reported previously in papers [11,12,13].

6. Summary and Conclusions

Development of transmission grids requires estimations of lightning performance of transmission overhead lines to determine the effectiveness of lightning protection for a given line design. The shielding failures are reported as the main cause of the trip-outs of the ultra-high voltage (UHV) lines and contribute significantly to the trip-outs of high voltage lines. The statistical models are being developed to extend the conventional deterministic models, to embrace the randomness of the lightning strokes propagation in space and hence to reproduce the statistical distribution of the striking points to the line.
This paper reports on measurement results of long spark discharges recorded at high-voltage laboratory for several laboratory arrangements. Switching and lightning impulses (SI and LI) with negative and positive polarities (+ and −) were used with the peak voltage values ranging from 1200 kV to 3364 kV to initiate long spark discharges in sphere-sphere (S-S) and sphere-plane (S-P) electrode systems. The electrodes were arranged at a distance 3.3 m from each other for positive and negative polarities and at a distance of 5.5 m for positive polarity of voltage impulses. For each of the 12 test configurations (electrode system, impulse type, polarity, distance) the number of 45 discharges were recorded, summing up to 540 recorded discharges in total. The measurements were conducted at High Voltage Laboratory of the Institute of Power Engineering in Warsaw, Poland. The laboratory hall allowed large distances between gap and surrounding equipment and the laboratory walls to avoid distortion of the electric field distribution in the tested spark gap by the measuring equipment and the structural elements of the laboratory hall.
The recordings were evaluated with three-dimensional approach. The tortuosity was described by statistical distributions of a set of three angles: α—the angle between consecutive segments of the discharge channel, θ—the angle between the projection of the discharge channel segment onto the axis parallel to the direction of the electrode system, and φ —the angle between the projection of the discharge channel segment onto the reference plane perpendicular to the direction of the electrode system. It can be seen from the results reported that the long spark channel tortuosity depends on the impulse voltage type (lightning or switching impulse, positive or negative polarity) that was employed to initiate the electric discharge. It also depends on the configuration of the electrode system (sphere-sphere or sphere-plane).
The parameters of the discharge channel trajectory are reported in a form of numerical quantities allowing the description of the trajectory in space in a form that can be subject to analysis in a process of studying and modeling the propagating progress of the long electrical discharges. The results here reported can thus serve as reference measurement data to evaluate the accuracy of simulation models incorporating statistical nature of the lightning strokes.

Author Contributions

Conceptualization, M.M. and M.S.; Data curation, M.M.; Funding acquisition, M.M.; Investigation, M.M. and M.S.; Methodology, M.M. and M.S.; Software, M.M.; Validation, M.M. and M.S.; Writing—original draft, M.M. and M.S.; Writing—review & editing, M.M. and M.S. All authors have read and agreed to the published version of the manuscript.

Funding

This research received no external funding.

Conflicts of Interest

The authors declare no conflict of interest.

References

  1. Evaluation of Lightning Shielding Analysis Methods for EHV and UHV DC and AC Transmission-Lines; CIGRE Technical Brochure TB 704; CIGRE: Paris, France, 2017.
  2. IEC Std. 60071-1:2019: Insulation Co-ordination—Part 1: Definitions, Principles and Rules, ed. 9.0; IEC: Geneva, Switzerland, 2019.
  3. He, J.L.; Wang, X.; Yu, Z.; Zeng, R. Statistical Analysis on Lightning Performance of Transmission Lines in Several Regions of China. IEEE Trans. Power Deliv. 2014, 30, 1543–1551. [Google Scholar] [CrossRef]
  4. Eriksson, A.J. An improved electrogeometric model for transmission line shielding analysis. IEEE Trans. Power Deliv. 1987, 2, 871–886. [Google Scholar] [CrossRef]
  5. Rizk, F.A.M. Modeling of transmission line exposure to direct lightning strikes. IEEE Trans. PWRD 1990, 5, 1983–1997. [Google Scholar]
  6. Dellera, L.; Garbagnati, L. Lightning stroke simulation by means of the leader progression model part II: Exposure and shieding failure evaluation of overhead lines with assessment of application graphs. IEEE Trans. Power Deliv. 1990, 5, 1983–1990. [Google Scholar]
  7. Dong, L.; He, J.; Zeng, R. A statistical view for fractal simulation of lightning. In Proceedings of the Asia-Pacific International Symposium on Electromagnetic Compatibility, Beijing, China, 12–16 April 2010; pp. 1227–1230. [Google Scholar]
  8. Les Renardierès Group. Research on Long Air Gap Discharges at Les Renardières: 1973 results. Electra 1974, 35, 49–156. [Google Scholar]
  9. Les Renardières Group. Positive discharges in long air gaps at Les Renardieres: 1975 results and conclusions. Electra 1977, 53, 31–153. [Google Scholar]
  10. Les Renardières Group. Double impulse tests of long airgaps. Part 1: Engineering problems and physical processes: The basis of recent tests. IEE Proc. Phys. Sci. Meas. Instrum. Manag. Educ. Rev. 1986, 133, 395–409. [Google Scholar]
  11. Amarasinghe, D.; Sonnadara, U.; Berg, M.; Cooray, V. Channel tortuosity of long laboratory sparks. Electrostatics 2007, 65, 521–526. [Google Scholar] [CrossRef]
  12. Diaz, O.; Hettiarachchi, P.; Rahman, M.; Cooray, V.; Vayanganie, S.P.A. Experimental study of leader tortuosity and velocity in long rod-plane air discharges. IEEE Trans. Dielectr. Electr. Insul. 2016, 23, 806–812. [Google Scholar] [CrossRef]
  13. Gu, S.; Xiang, N.; Chen, J.; Chen, W.; Xie, S.; He, J. 3D Channel tortuosity of long air gap discharge. In Proceedings of the 7th Asia-Pacific International Conference on Lightning (APL), Chengdu, China, 1–4 November 2011; pp. 784–787. [Google Scholar]
  14. Amarasinghe, D.; Sonnadara, U.; Berg, M.; Cooray, V. Fractal dimension of long electrical discharges. J. Electrost. 2015, 73, 33–37. [Google Scholar] [CrossRef]
  15. Perera, C.; Fernando, M.; Liyanage, P.; Cooray, V.; Rahman, M. Analysis of Channel Tortuosity using 8 m Long Laboratory Sparks. In Proceedings of the 2018 34th International Conference on Lightning Protection (ICLP), Rzeszow, Poland, 2–7 September 2018; pp. 1–6. [Google Scholar] [CrossRef]
  16. IEC Std. 60060-1:2010. High-Voltage Test Techniques—Part 1: General Definitions and Test Requirements, ed. 3.0; IEC: Geneva, Switzerland, 2010.
  17. IEC Std. 60383-2:1993. Insulators for Overhead Lines with a Nominal Voltage above 1000 V—Part 2: Insulator Strings and Insulator Sets for A.C. Systems—Definitions, Test Methods and Acceptance Criteria, ed. 1.0; IEC: Geneva, Switzerland, 1993.
  18. Joint Committee for Guides in Metrology (JCGM). JCGM 100:2008 Evaluation of Measurement Data—Guide to the Expression of Uncertainty in Measurement; IEC: Geneva Switzerland, 2008. [Google Scholar]
  19. IEC Std. 60060-2:2010. High-Voltage Test Techniques—Part 2: Measuring Systems; IEC: Geneva, Switzerland, 2010.
  20. ISO 13528:2015. Statistical Methods for Use in Proficiency Testing by Interlaboratory Comparison; ISO: Geneva, Switzerland, 2015.
Figure 1. Tortuosity angles of discharge channel: αi, θi, and φi.
Energies 14 07409 g001
Figure 2. Measurement test set-up: 25-stage Marx impulse voltage generator (375 kJ, 25 steps), Capacitive Impulse Voltage Divider CRS (4500 kV, ratio 3150), Dr Strauss TR-AS 200-14 4-channel digital voltage recorder (2 kV, 14 bit), 200/50 MS/s samplings for lightning/switching impulse voltage respectively.
Energies 14 07409 g002
Figure 3. Examples of impulse volatge curves recorded during testing: impulse chopping typically occurred at the front of the switching impulse and at the tail of the lightning impulse.
Energies 14 07409 g003
Figure 4. Test field with measuring system arranged at High Voltage Laboratory of Institute of Power Engineering in Warsaw, Poland, allowing that the distribution of the electric field in the tested spark gap was not distorted by the measuring equipment and the structural elements of the laboratory hall.
Energies 14 07409 g004
Figure 5. Spark gaps: (a) sphere-sphere (500 mm copper ball at high voltage, 250 mm copper ball grounded); (b) shere-plane (500 mm copper ball at high voltage, steel sheets measuring 17 m by 11 m grounded). The high-voltage electrode hungs on the transportation crane via an insulating string made of composite long rod insulators, the plane electrode is connected to the laboratory grounding system via a copper tape, the 250 mm grounded ball is mounted on the top of the steel pipe with a diameter of 30 mm.
Energies 14 07409 g005
Figure 6. Spark channel reconstruction: (a) photographs and trajectories; (b) reconstructed spark channel.
Energies 14 07409 g006
Figure 7. Distribution of angles αi, θi, and φi along the discharge channel for lightning impulse. with positive polarity, sphere-sphere electrode system, 5.5 m distance between electrodes; computational segment adopted: 0.50% of the discharge channel length.
Energies 14 07409 g007
Figure 8. Distribution of tortuosity angles αi, θi, φi for lightning impulse with positive polarity (LI+) for sphere-sphere electrode system (S-S); spark gap 5.5 m, segment length 0.5% of channel length, distributions for population of 45 discharges.
Energies 14 07409 g008
Table 1. Atmospheric conditions for high voltage tests: d—distance between electrodes, t—temperature, R—relative humidity, p—atmospheric pressure, Kt—atmospheric correction factor.
Impulse 1Electrodes 2 d
[m]
t
[°C]
R
[%]
p
[hPa]
Kt
[–]
SI (+)S—P3.38.4849990.993
SI (−)S—P3.37.27810001.001
LI (+) S—P3.37.2869990.985
LI (−)S—P3.37.2869991.022
SI (+)S—S3.39.1819990.989
SI (−)S—S3.37.27810001.006
LI (+) S—S3.37.27010130.993
LI (−)S—S3.37.27010131.026
SI (+)S—P5.57.67810020.996
LI (+) S—P5.56.88310030.986
SI (+)S—S5.57.87510020.992
LI (+) S—S5.58.0889990.988
1 SI/LI—switching/lightning impulse, +/−—positive/negative polarity; 2 S—sphere electrode, P—plane electrode.
Table 2. Test voltage parameters for each test configuration: d—distance between electrodes, U50—50% flashover voltage, s—mean square deviation of the flashover voltage, UmeanU—average value/standard deviation of the flashover voltage distribution, TCmeanTc—average value/standard deviation of the time-to-chopping.
Impulse 1Electrodes 2 d
[m]
U50
[kV]
s
[kV]
Umean
[kV]
σU
[kV]
TCmean
[μs]
σTc
[μs]
SI (+)S—P3.3114045120012.1178.115.2
SI (−)S—P3.32277992161147.3108.925.7
LI (+) S—P3.3187020200213.812.01.8
LI (−)S—P3.3269941285718.46.40.7
SI (+)S—S3.3136266142325.3166.622.8
SI (−)S—S3.323591202295146.4124.739.2
LI (+) S—S3.3206316210113.713.33.2
LI (−)S—S3.3250753254716.99.51.2
SI (+)S—P5.514465215987.4222.411.1
LI (+) S—P5.530324031818.519.36.0
SI (+)S—S5.5177579193516.5226.127.9
LI (+) S—S5.5316728336417.814.53.6
1 SI/LI—switching/lightning impulse, +/−—positive/negative polarity; 2 S—sphere electrode, P—plane electrode.
Table 3. Measurement results: tortuosity angles α, θ, φ mean values and standard deviations (σ); d—distance between electrodes.
Impulse 1Electrodes 2d
[m]
αmean
[°]
σα
[°]
θmean
[°]
σθ
[°]
|φ|mean
[°]
σ|φ|
[°]
SI (+)S—P3.317.49.922.614.176.961.1
SI (−)S—P3.314.48.325.215.879.359.9
LI (+) S—P3.314.28.116.910.471.160.5
LI (−)S—P3.312.06.915.48.871.461.3
SI (+)S—S3.315.48.925.915.374.460.6
SI (−)S—S3.313.37.622.313.573.859.9
LI (+) S—S3.313.07.416.79.468.761.0
LI (−)S—S3.312.47.314.88.664.858.6
SI (+)S—P5.516.79.522.514.577.860.9
LI (+) S—P5.512.67.315.99.377.561.2
SI (+)S—S5.515.18.729.317.483.660.6
LI (+) S—S5.511.56.515.89.171.860.6
1 SI/LI—switching/lightning impulse, +/−—positive/negative polarity; 2 S—sphere electrode, P—plane electrode.
Table 4. Comparison of measurement results for tortuosity angles α, θ, φ; d—distance between electrodes.
ImpulseParameterPresent PaperRef. [11]Ref. [12]Ref. [13]
d3.3 m5.5 m0.5 m7–8 m3 m
ElectrodesS-P 1S-P 1B-P 2B-P 2B-P 2
SI (+)α17.4° ± 9.9°16.7° ± 9.5°11.8° ± 1.4°6.3° ± 5.8°13.3° ± 9.9°
θ22.6° ± 14.1°22.5° ± 14.5°-20.9° ± 20.9°23.9° ± 19°
φ76.9° ± 61.1°77.8° ± 60.9°---
SI(−), LI(+), LI(−)α, θ, φsee Table 3see Table 3---
1 S-P—Sphere-Plane, 2 S-B—Sphere-Blade.
Publisher’s Note: MDPI stays neutral with regard to jurisdictional claims in published maps and institutional affiliations.

