Article

Numerical Investigation on the Flame Structure and CO/NO Formations of the Laminar Premixed Biogas–Hydrogen Impinging Flame in the Wall Vicinity

Mechanical and Electrical Engineering College, Hainan University, Haikou 570228, China
*
Author to whom correspondence should be addressed.
Energies 2021, 14(21), 7308; https://doi.org/10.3390/en14217308
Submission received: 26 September 2021 / Revised: 23 October 2021 / Accepted: 29 October 2021 / Published: 4 November 2021
(This article belongs to the Section I2: Energy and Combustion Science)

Abstract

:
The near-wall flame structure and pollutant emissions of the laminar premixed biogas-hydrogen impinging flame were simulated with a detailed chemical mechanism. The spatial distributions of the temperature, critical species, and pollutant emissions near the wall of the laminar premixed biogas–hydrogen impinging flame were obtained and investigated quantitatively. The results show that the cold wall can influence the premixed combustion process in the flame front, which is close to the wall but does not touch the wall, and results in the obviously declined concentrations of OH, H, and O radicals in the premixed combustion zone. After flame quenching, a high CO concentration can be observed near the wall at equivalence ratios (φ) of both 0.8 and 1.2. Compared with that at φ = 1.0, more unburned fuel is allowed to pass through the quenching zone and generate CO after flame quenching near the wall thanks to the suppressed fuel consumption rate near the wall and the excess fuel in the unburned gases at φ = 0.8 and 1.2, respectively. By isolating the formation routes of NO production, it is found that the fast-rising trend of NO concentration near the wall in the post flame region at φ = 0.8 is attributed to the NO transportation from the NNH route primarily, while the prompt NO production accounts for more than 90% of NO generation in the wall vicinity at φ = 1.2. It is thus known that, thanks to the effectively increased surface-to-volume ratio, the premixed combustion process in the downsized chamber will be affected more easily by the amplified cooling effects of the cold wall, which will contribute to the declined combustion efficiency, increased CO emission, and improved prompt NO production.

1. Introduction

In the real combustion facilities, the combustion process occurs in the closed chamber typically where the walls exert direct influences on the flames through the fluid dynamics, thermochemical properties. Flame-wall interaction (FWI) is thus considered to be quite significant to the near-wall combustion process which can affect the flame stability, combustion efficiency and pollutant formations effectively [1,2]. Furthermore, with a recent trend of utilizing higher power density and downsizing design of combustor, the FWI is considered to be increasingly pivotal to obtain the stable and efficient combustion in the real combustors [3,4,5]. Hence, there exists a need to make more efforts on the investigation on the FWI and near-wall combustion properties of laminar/turbulent flames.
During FWI, flow fields, chemical reactions and wall are interacted, which exert sophisticated coupling effects on the local thermochemical states, chemical reactions, wall heat flux, pollutant formations, etc. With these coupling effects, the flame quenching will happen near the walls of combustion chamber due to the heat loss to the wall, and then influence the fuel consumption rate and emissions. Few of works have been conducted to explore the near-wall quenching mechanism, while the quenching Peclet number is determined under different conditions because the quenching distance is considered as a quite pivotal quantity to characterize the FWI phenomenon [6,7,8]. Besides, many researchers studied the FWI effects on the impingement heat transfer mechanism in order to obtain the highly efficient heating in the domestic and industrial applications when utilizing the flame impingement [9,10,11,12,13]. With the complicated coupling effects during FWI, pollutant formations can be also affected considerably by the near-wall environment which has the large temperature gradient, variable reaction progress, flow boundary layer, considerably increased heat loss, etc. With the downsizing trend of combustor and the stricter emission regulations, it is thus quite necessary to identify the pollutant formations in the near wall region, which can provide the useful knowledge and guidelines for the combustor design in the future. However, quite few works are conducted to analyze pollutant formations near the wall [2].
In the past decades, studies have been conducted to investigate the FWI effects on the pollutant emissions (CO and NOx) of the impinging flames experimentally. While previous works have provided quite a bit of information on the formation mechanism in the near wall region because the overall emissions are measured, instead, more studies are needed to use the measured local data and/or numerical results near the wall to investigate the FWI effects. Thanks to the complex combustion process in the near-wall region, the direct measurement and numerical simulations of the near-wall pollutant formations need to be conducted in order to obtain a clearer understanding of the pollutant production in the near-wall region. Singh et al. [14] measured the CO distributions, flame temperature, and heat fluxes of an impinging flame simultaneously using the LIF and CARS techniques, and the measured data were suggested to be used to validate the numerical simulations. Mann et al. [15] investigated the CO distribution of the stagnation-stabilized methane flame under the HOQ condition experimentally and found that the enthalpy loss to the wall suppressed CO oxidation and led to a high CO concentration in the near-wall region. Jainski et al. [16] studied the side-wall quenching (SWQ) of methane flame experimentally and reported that the FWI effects on the CO distribution is determined by the characteristic time scales of heat transfer, CO oxidation and CO production. Ganter et al. [17] suggested that the high CO concentration near the wall in the V-shape methane flame is attributed to the transport of CO produced at the larger wall distances. Rivera et al. [4] studied the relative contribution of near-wall flame dynamic to the CO emission in the forced laminar premixed flame experimentally. Kosaka et al. [8] measured the CO concentrations near the wall in the methane flame experimentally and reported that CO formation and oxidation are both shifted to the lower temperature in the near wall region. Jiang et al. [18] suggested that the near-wall CO under the head-on quenching condition may be modeled by the integrated diffusion term owing to the dominance of diffusion on the CO concentration near the wall. Wei et al. [19,20,21,22] performed some studies to analyze the CO/NOx formations in the laminar premixed biogas-hydrogen impinging flame and suggested that heat loss can suppress the CO production in the impinging flame while the prompt NO emission can be improved in the near wall region. The improved prompt NO production and suppressed thermal NO near the wall were also reported by Wehrfritz and his co-workers [23]. From the above review, it is known that the formations of CO and NOx suffer the complex influences under various conditions. Furthermore, the near-wall combustion is generally studied under the ideal head-on quenching or side-wall quenching condition in the previous studies, more works need to be performed by utilizing the real flame, such as impinging Bunsen flame, which can provide more useful insights for the combustion process in the wall vicinity of the real combustors. Furthermore, stoichiometric condition is adopted generally in the previous studies to analyze the near wall combustion, however fuel-lean and fuel-rich conditions should be also considered and investigated owing to their different combustion processes. Overall, the near-wall flame structures and CO/NOx formations in the wall vicinity at fuel-lean and fuel-rich conditions need to be investigated more thoroughly with the experimental and/or numerical methods. Additionally, considering the difficulty of experimental measurements on the near-wall combustion process, there exists a need to conduct the highly-resolved numerical simulation using the detailed chemical mechanism. This can make for the establishment of a comprehensive understanding on the FWI on the near-wall flame structure and pollutant formations, which can provide more useful information for the near-wall combustion modeling.
Biogas is seen as a promising renewable fuel which can be obtained by the wastes from the domestic sewage, agriculture and landfills. It is general that CH4 and CO2 are the major parts of biogas, and the CO2 proportion can be changed from 20–60% typically [24,25,26]. Whereas, the fuel properties of biogas are relatively poor than that of methane owing to the large amount of CO2 content, which results in its poor combustion stability, lower laminar flame speed, narrow flammability limits, etc. and then restricts its applications considerably [27]. Hydrogen is another clean fuel with the promising prospect. Thanks to the high diffusivity and reactivity, it is more suitable to utilize the hydrogen as an addition to other fuels in the combustion fields. It is confirmed that the hydrogen addition is competent to improve the fuel characteristics by numerous studies [28,29,30,31,32]. Hence, the hydrogen addition should be also effective to improve the biogas combustion and promote its practical utilizations, which can make the biogas-hydrogen blend to be one of promising renewable and sustainable fuels in the fields of energy and combustion. With this consideration, the biogas-hydrogen blend is utilized in this work.
The objective of this study is to investigate the flame structure in the near-wall vicinity and analyze the distributions and formations of CO and NO in the near-wall region of the laminar premixed biogas-hydrogen impinging flame at different equivalence ratios using the detailed chemistry simulations. This work is expected to improve the understandings the near-wall combustion characteristics of the laminar premixed biogas-hydrogen impinging flame and gain the knowledge of fuel characteristics of the biogas-hydrogen blends.

2. Numerical Methods

To calculate the near-wall combustion process in the laminar premixed impinging biogas–hydrogen flames, STAR-CD software was adopted to perform the simulation in this study. In order to obtain a similar condition of side-wall quenching, the laminar premixed impinging flame was stabilized at the wall-to-nozzle distance of 10 mm and Re = 1000 by using a nozzle with an inner diameter of 9 mm. The wall temperature was set to 313 K, which is consistent with the previous experimental study. The biogas, which consists of 25% CO2 and 75% CH4, was used as a fuel, while 10% H2 was added in the biogas fuel to improve its combustion stability near the wall. In addition, a 2D computational domain was adopted in the simulation considering that the flame used in this work was an axi-symmetric flame, as shown in Figure 1. To eliminate the boundary condition effects on the near wall combustion simulation, the axial size and radial size of the domain were set to 10 mm and 100 mm, respectively. The grids in the flame region and the near-wall zone were refined to 0.05 × 0.05 mm in order to guarantee the accuracy in the combustion zone and the boundary layer. In addition, the grid was increased to 1 × 1 mm gradually outside these regions. To describe the chemical reactions of the biogas–hydrogen–air combustion, a combined chemical mechanism composed of the skeleton methane mechanism [33] and the NO mechanism of the San Diego mechanism [34] was used in this study, which can ensure the simulation accuracy with an acceptable computation cost. Additionally, as NO can be formed via four major routes in the biogas–hydrogen–air flame, the method to isolate NO formation routes [35] was also adopted in the study for the sake of obtaining a clearer understanding on the NO formation in the wall vicinity. The accuracy of this computational model has been validated by the experimental data and more information on this simulation model has been described in the previous works [19,22].
To investigate the near-wall combustion process, the quenching point needs to be determined firstly. The method used in [17] was adopted in this work. With the OH radical distribution in the near-wall region, the OH concentration gradients along the z-direction could be obtained at different x-positions, as shown in Figure 2a. The z-position of the maximum gradient of the OH mass fraction can be determined at a constant x-position. The positions of the maximum gradient of the OH concentration are thus indicated by a white solid line, as illustrated in Figure 2a. Additionally, based on the maximum value along the white line, the gradients along this white solid line can be normalized and the quenching point can be determined by the location with the normalized value of 0.5, as shown in Figure 2b, while the quenching distance can be determined by the distance between the quenching point and the wall along the z-direction as shown in Figure 2a. The absolute x-position of the quenching point was defined as xOH, as shown in Figure 2b. For a better illustration and discussion, the x-position relative to the quenching point (xQ = xxOH) was defined and adopted for the following result discussions, as shown in Figure 2a.

3. Results and Discussions

3.1. Near-Wall Flame Structure of the Laminar Premixed Biogas–Hydrogen Impinging Flame

The temperature profiles at different xQ in the wall vicinity of the biogas–hydrogen impinging flames at φ = 0.8 and 1.2 are each compared in Figure 3. It can be seen that the temperature varied drastically within the near-wall region of Δz ≤ 0.5 mm, and it remained at a relatively stable level in the post flame region (Δz ≥ 1.0 mm). When xQ = −0.05, 0.45, and 0.95 mm, the temperature decreased more rapidly towards the cold wall, which resulted in a steep increase of the temperature gradient. Furthermore, it is noted that the flame at φ = 1.2 had the almost same temperature in the post flame region at different xQ, while the temperatures at φ = 0.8 had the same peak value at different xQ as Δz ≈ 2.25 mm, but they had the different dropping trends at these x-positions as Δz ≥ 2.25 mm. With the increased xQ, the cold wall and ambient air could exert increased cooling effects on the flame front and the burned gases due to the decreased heat generation and the reduced distance between the flame front and the cold wall. Thanks to the absence of diffusion combustion, the flame at the fuel-lean condition could thus hardly maintain the high temperature of the burned gases and resulted in a faster dropping trend of temperature in the burned gases with the increased xQ. In contrast, with the increased xQ, the flame in the fuel-rich condition could compensate for the increased cooling effects on the burned gases by its comparatively intensive diffusion combustion, which could provide extra heat to maintain the temperature of the burned gases and resulted in an almost unchanged temperature in the post flame region. At xQ = −0.55 and −1.05 mm, the high temperature showed the fast dropping trend firstly across the flame front, and then its dropping rate decreased owing to the layer of unburned gas mixture located close to the wall, as shown in Figure 3. Additionally, it is noted that the peak flame temperature at different xQ were almost the same. Further considering the different dropping trends at various xQ, the highest value of the heat transfer rate of the imping flame was thus generally obtained near the quenching point, while the lower heat fluxes at other locations resulted from the unburned gases layer before quenching and insufficient fuel oxidization after quenching.
It is known that OH, H, and O radicals are the critical active radicals that play a dominated role in the combustion processes of methane and hydrogen fuels, thus the investigation on the spatial distributions of these radicals can improve the understanding on the near wall flame structure of biogas–hydrogen impinging flames. As shown in Figure 4, almost no OH, H, and O radicals were observed in the region of Δz ≤ 0.25 mm, which indicates that the strong cooling effects of the cold plate suppressed the chemical reactions considerably by decreasing the gas temperature.s At φ = 0.8, it is noted that the maximum concentrations of OH, H, and O radicals along the different xQ decreased steadily from xQ = −1.05 mm to 0.95 mm. Specifically, the premixed combustion zone could be still affected effectively by the cold wall, even though the flame had not touched the impingement plate, which could be confirmed by the evident dropping trends of the OH, H, and O concentrations from xQ = −1.05 mm to −0.05 mm, as shown in Figure 4. This implies that although no flame quenching in the central zone of the downsized combustion chamber existed, the premixed combustion process in the chamber could also be influenced considerably owing to the effectively increased surface-to-volume ratio, amplifying the cooling effects of the cold chamber wall on the combustion process. Furthermore, the further decreased peak concentrations of the OH, H and O radicals after flame quenching were caused primarily by the insufficient fuel oxidization owing to the lean condition, continous consumption of these radicals in the gases, and the transport effects on these species. Furthermore, thanks to the complete premixed combustion process, excess air in the unburned gases, and ambient air entrainment at φ = 0.8, the OH, H, and O radicals can be consumed efficiently in the burned gases, while their concentrations declined obviously far away from the cold wall, as shown in Figure 4. In contrast, as shown in Figure 4, the variations of the OH, H, and O concentrations in the premixed combustion zone at φ = 1.2 had the similar dropping trends to that at φ = 0.8 as xQ increased, which further confirmed the cooling effects of the wall on the chemical reactions in the flame front close to the wall. However, it is noted that the concentrations of OH and O radicals showed apparently rising trends with the increased Δz, while the dropping rate of the H concentration became much lower than that at φ = 0.8, as in shown in Figure 4. This was ascribed to the excess fuel oxidized in the diffusion combustion zone and the ambient air entrainment providing more available oxidizor. Furthermore, the low concentrations of the OH, H, and O radicals between the premixed combustion zone and diffusion zone were mainly caused by insufficient oxygen in the unburned gases and the quite moderate ambient air entrainment there. Overall, it is concluded that the cold wall could not only affect the chemical reactions effectively at the quenching point and after the flame quenching, but also exerted a strong influence on the premixed combustion process in the flame front, which was close to the wall but had not touched the wall. This indicates that the premixed combustion process in the downsized chamber would be suppressed more easily by the amplified cooling effects of cold wall, owing to its effectively increased surface-to-volume ratio, which could contribute to the decreased combustion efficiency and increased pollutant emissions.

3.2. Near-Wall Spatial Profiles of CO in the Laminar Premixed Biogas–Hydrogen Impinging Flame

Figure 5 gives the spatial profiles of CO at different xQ in the biogas–hydrogen flames at φ = 0.8 and 1.2. As xQ < 0, the flame at either φ = 0.8 or φ = 1.2 was disturbed slightly by the wall. CO thus had a comparatively low concentration in the layer of unburned gases close to the wall, as shown in Figure 5. When passing through the flame front, CO started to be produced in the premixed combustion zone and the CO mass fraction increased drastically. Further away, CO was oxidized in the burned gases and its concentration decreased steadily. The OH radical profiles illustrated in Figure 4a can be used to analyze the CO oxidation process in the post flame region. It is seen that the variation of CO concentration in the post flame region was dependent on the concentration of the OH radical. Compared with φ = 1.2, CO was oxidized in the post flame region more effectively at φ = 0.8 owing to the abundant OH radical, as shown in Figure 4a. Hence, the flame at φ = 0.8 had an efficient CO oxidation process for the burned gases and a considerably lower CO concentration than for the flame of φ = 1.2 at the location far away from the wall. At φ = 1.2, the CO concentration showed a fast dropping trend near the flame front, firstly thanks to the high temperature and peak concentration of OH radical there, as shown in Figure 4a. Further downstream, the CO concentration remained at a comparatively stable level in the diffusion combustion zone (1.1 mm < Δz < 2.5 mm) at φ = 1.2 because of the reduced available OH radical (shown Figure 4a) and the competition with other species for the OH radical. In the diffusion combustion zone (Δz > 2.5 mm), the ambient air provided more oxidizer to produce an OH radical and resulted in an increased concentration of the OH radical (as shown in Figure 4a). This again accelerated CO oxidation and led to a further decrease of CO concentration in this region (as shown in Figure 5).
Furthermore, at xQ = 0.45 and 0.95 mm, the highest CO concentration occured in the wall vicinity at either the fuel-lean or fuel-rich conditions, while the CO concentration had a similar variation in the larger Δz as that of xQ < 0. Near the wall, the CO production was insignificant for the high concentration of CO in the wall vicinity of the flame at φ = 1.0 because the fast and efficient consumption of fuel and the low temperature near the wall can suppress the CO production in the burned gases (at xQ = 0.45 and 0.95 mm) considerably. Furthermore, due to the relatively longer time scale of CO oxidation, CO could be transported to the wall vicinity from the post flame oxidation region, which gave rise to a higher CO concentration in the region close to the wall [36]. As HCO is a pivotal intermediate and indicator for the CO production of methane premixed combustion, the considerably low HCO concentration near the wall (as shown in Figure 6) indicates the absence of CO production near the wall in the post flame region and further confirms the insignificant contribution of CO production on CO accumulation in the wall vicinity at φ = 1.0. Furthermore, for the flame at φ = 0.8 and 1.2, unburned fuel was more likely to escape into the post-flame region through the quenching zone thanks to the relatively slower fuel consumption and abundant unburned fuel, respectively. The escaped fuel then gave rise to CO production near the wall in the post flame region. As shown in Figure 6, the HCO concentration near the wall at xQ = 0.45 or 0.95 mm had a comparable value to that in the premixed combustion zone, which then contributed to the CO production and gave rise to the high CO concentration in the wall vicinity. Thus, the significance of CO production for a high CO concentration near the wall cannot be neglected after flame quenching at φ = 0.8 and 1.2. Furthermore, CO tranportation from further locations to the near-wall region in the flame at φ = 0.8 and 1.2 existed, which also played an important role in CO accumulation in the wall vicinity at xQ = 0.45 and 0.95 mm (as shown in Figure 5).

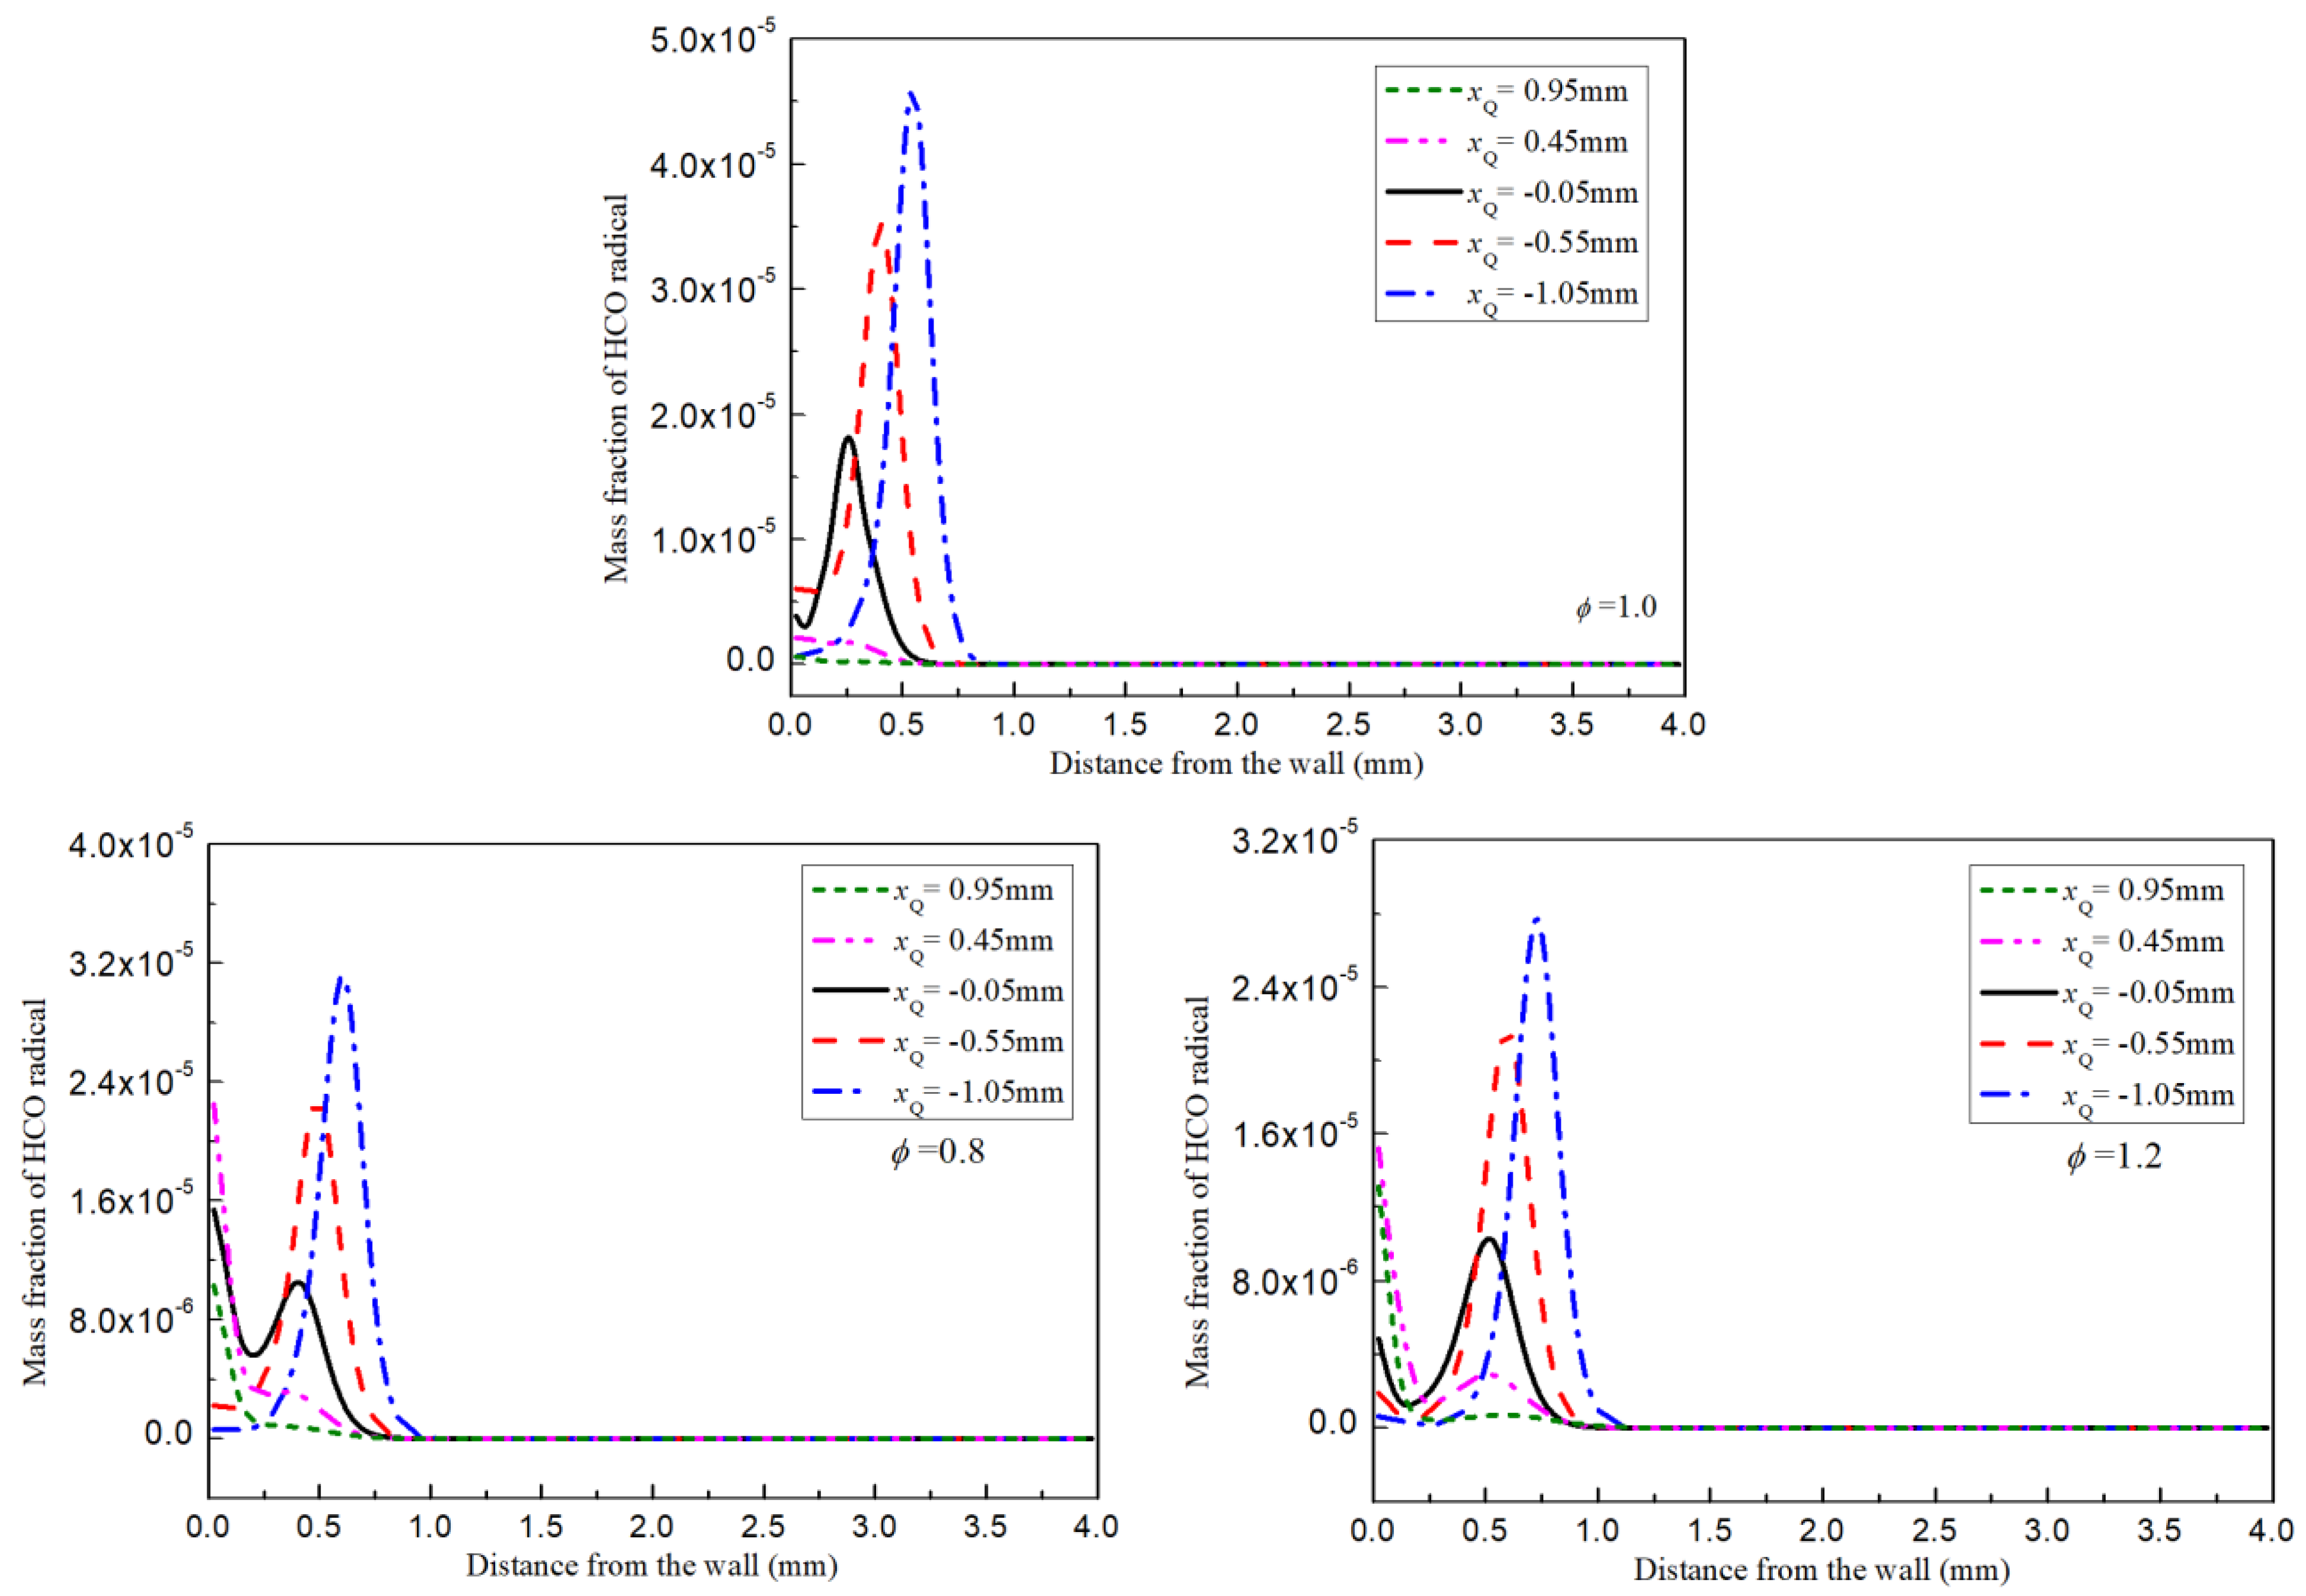
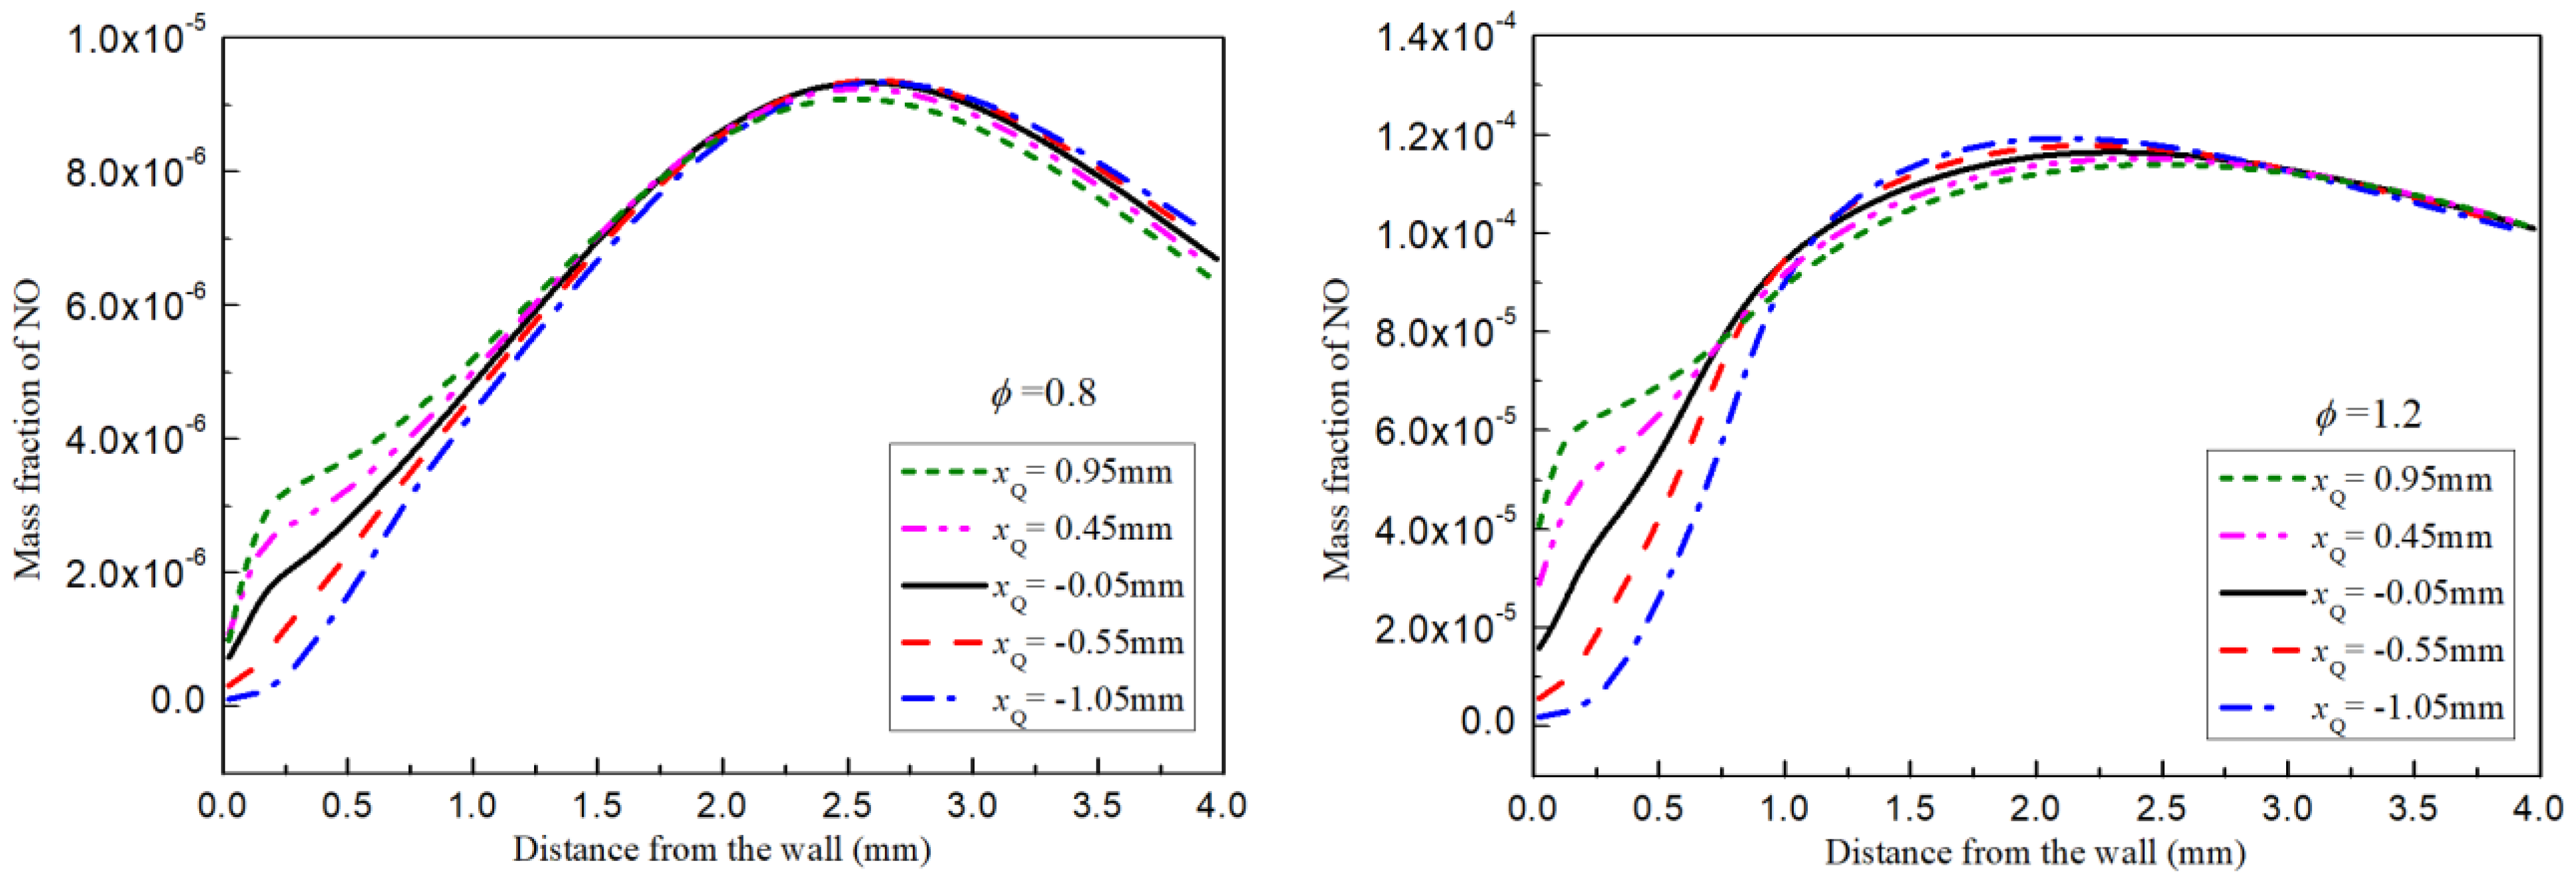
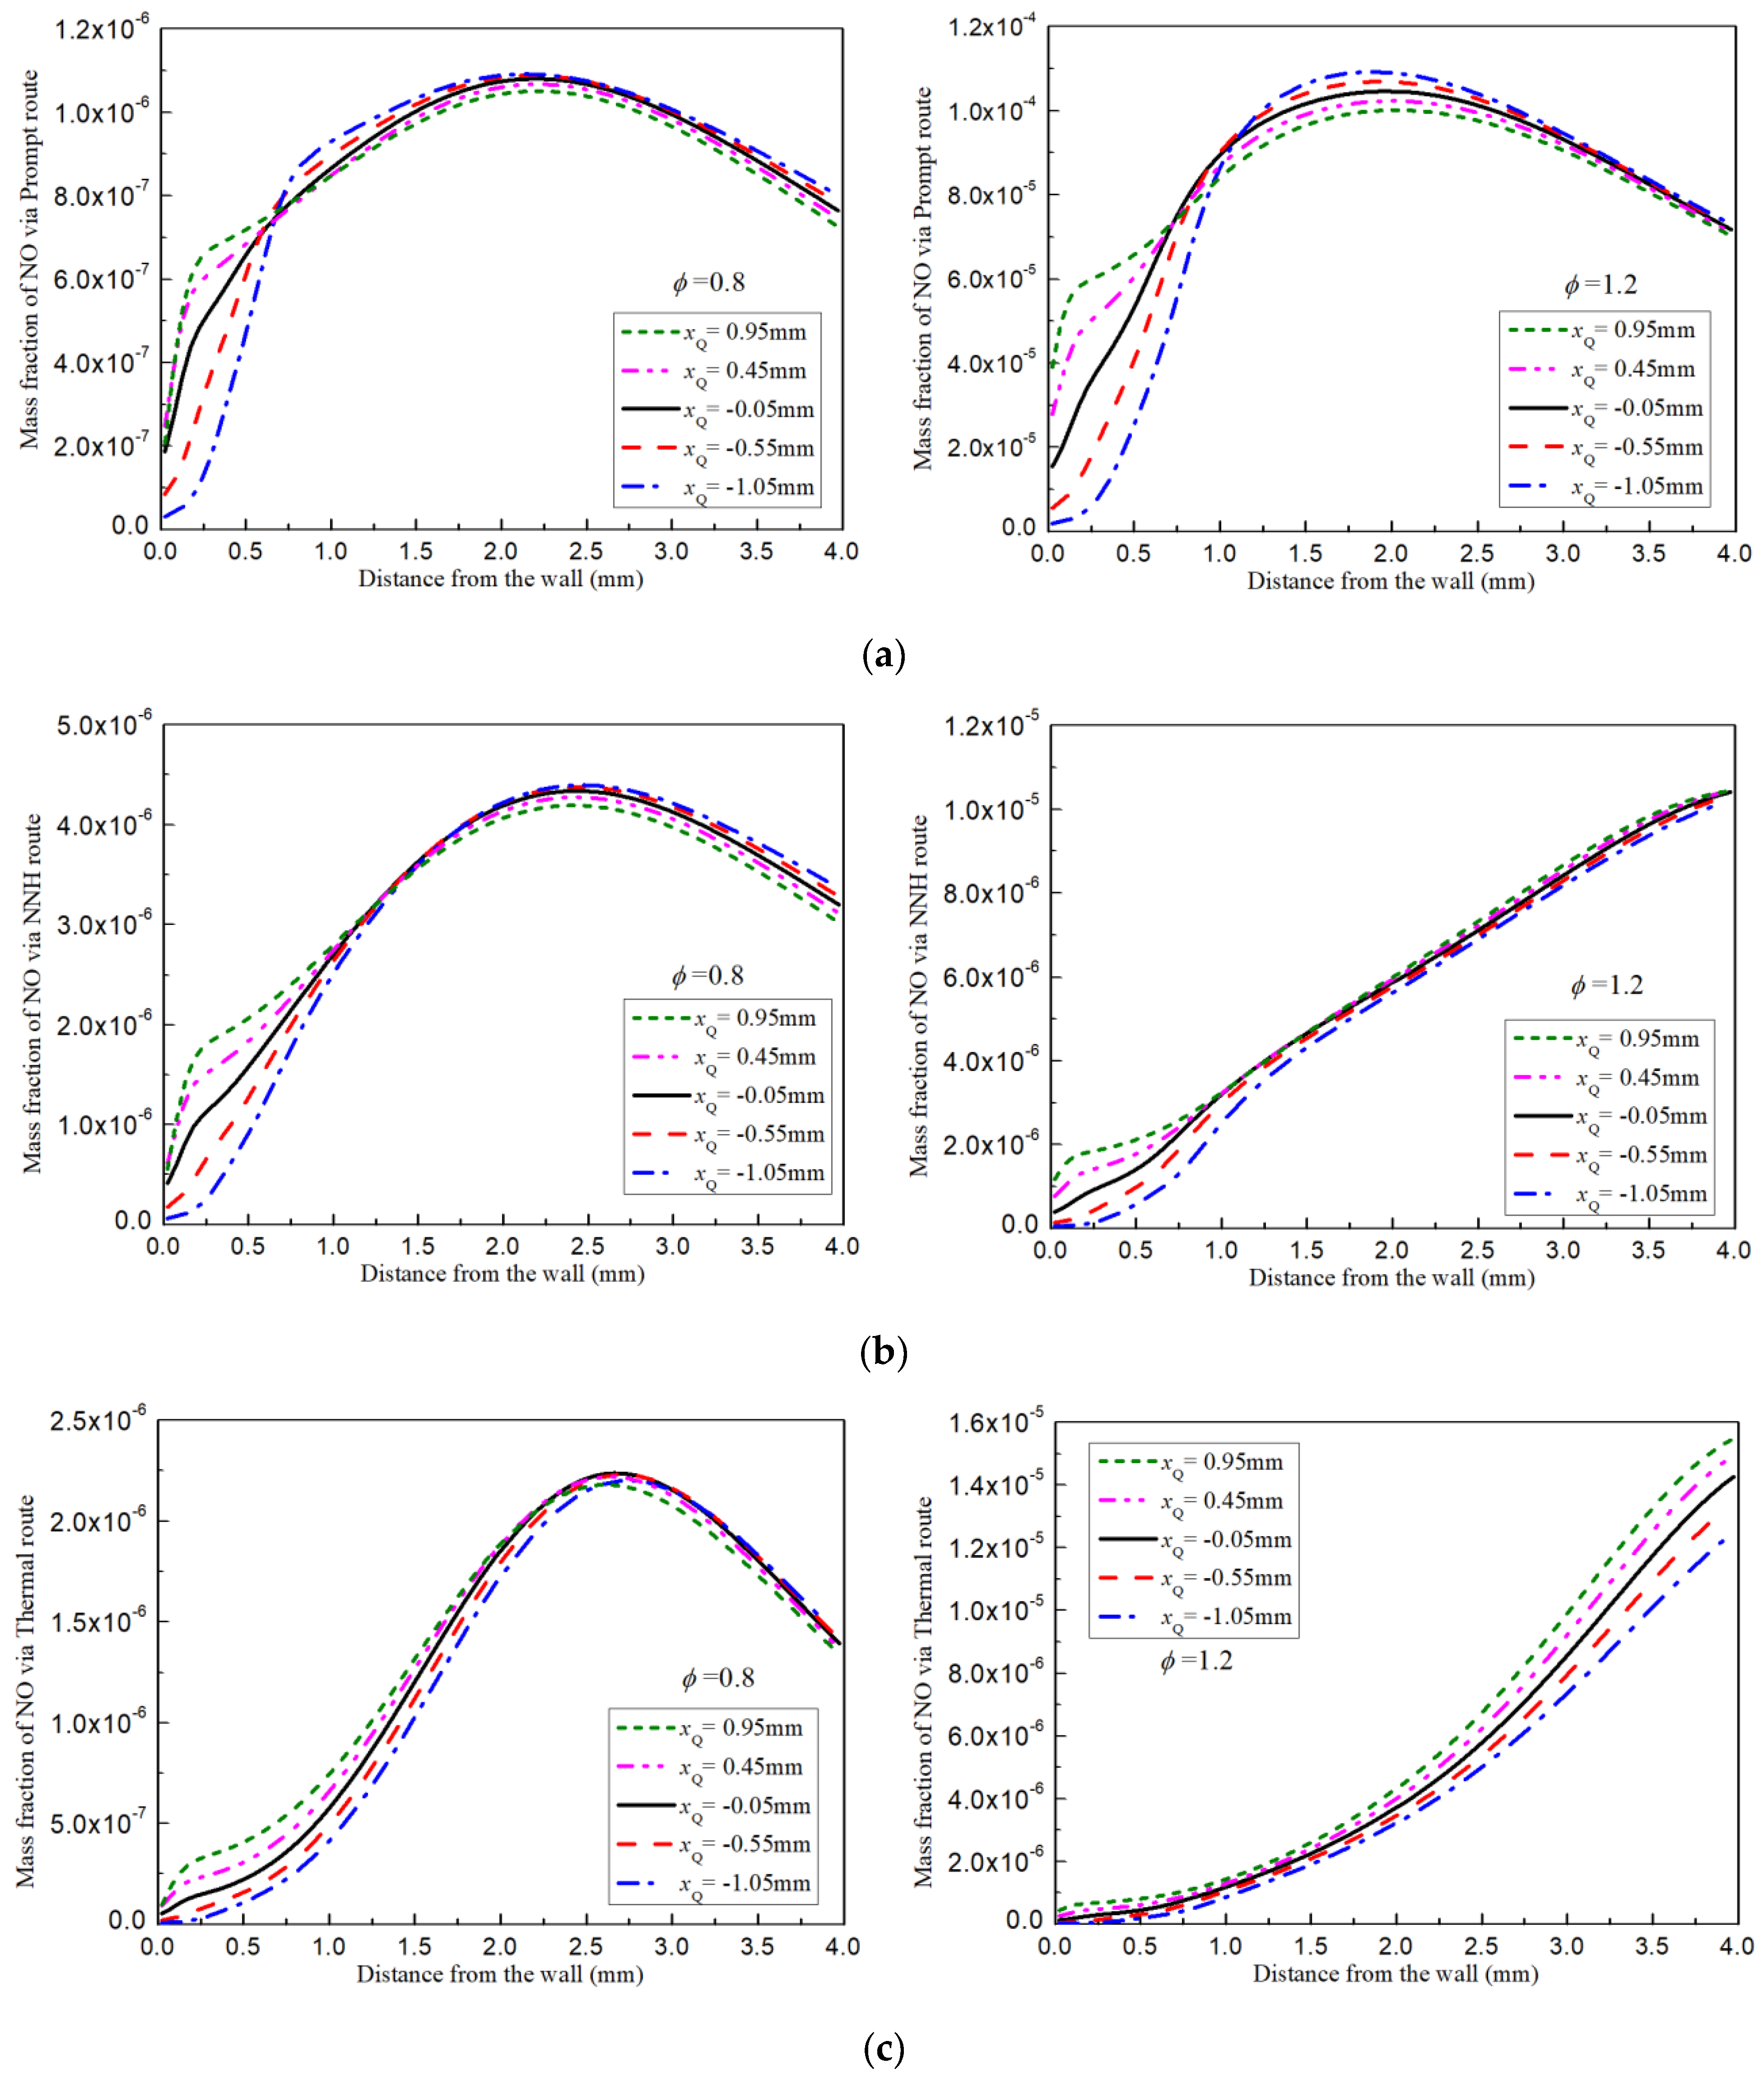
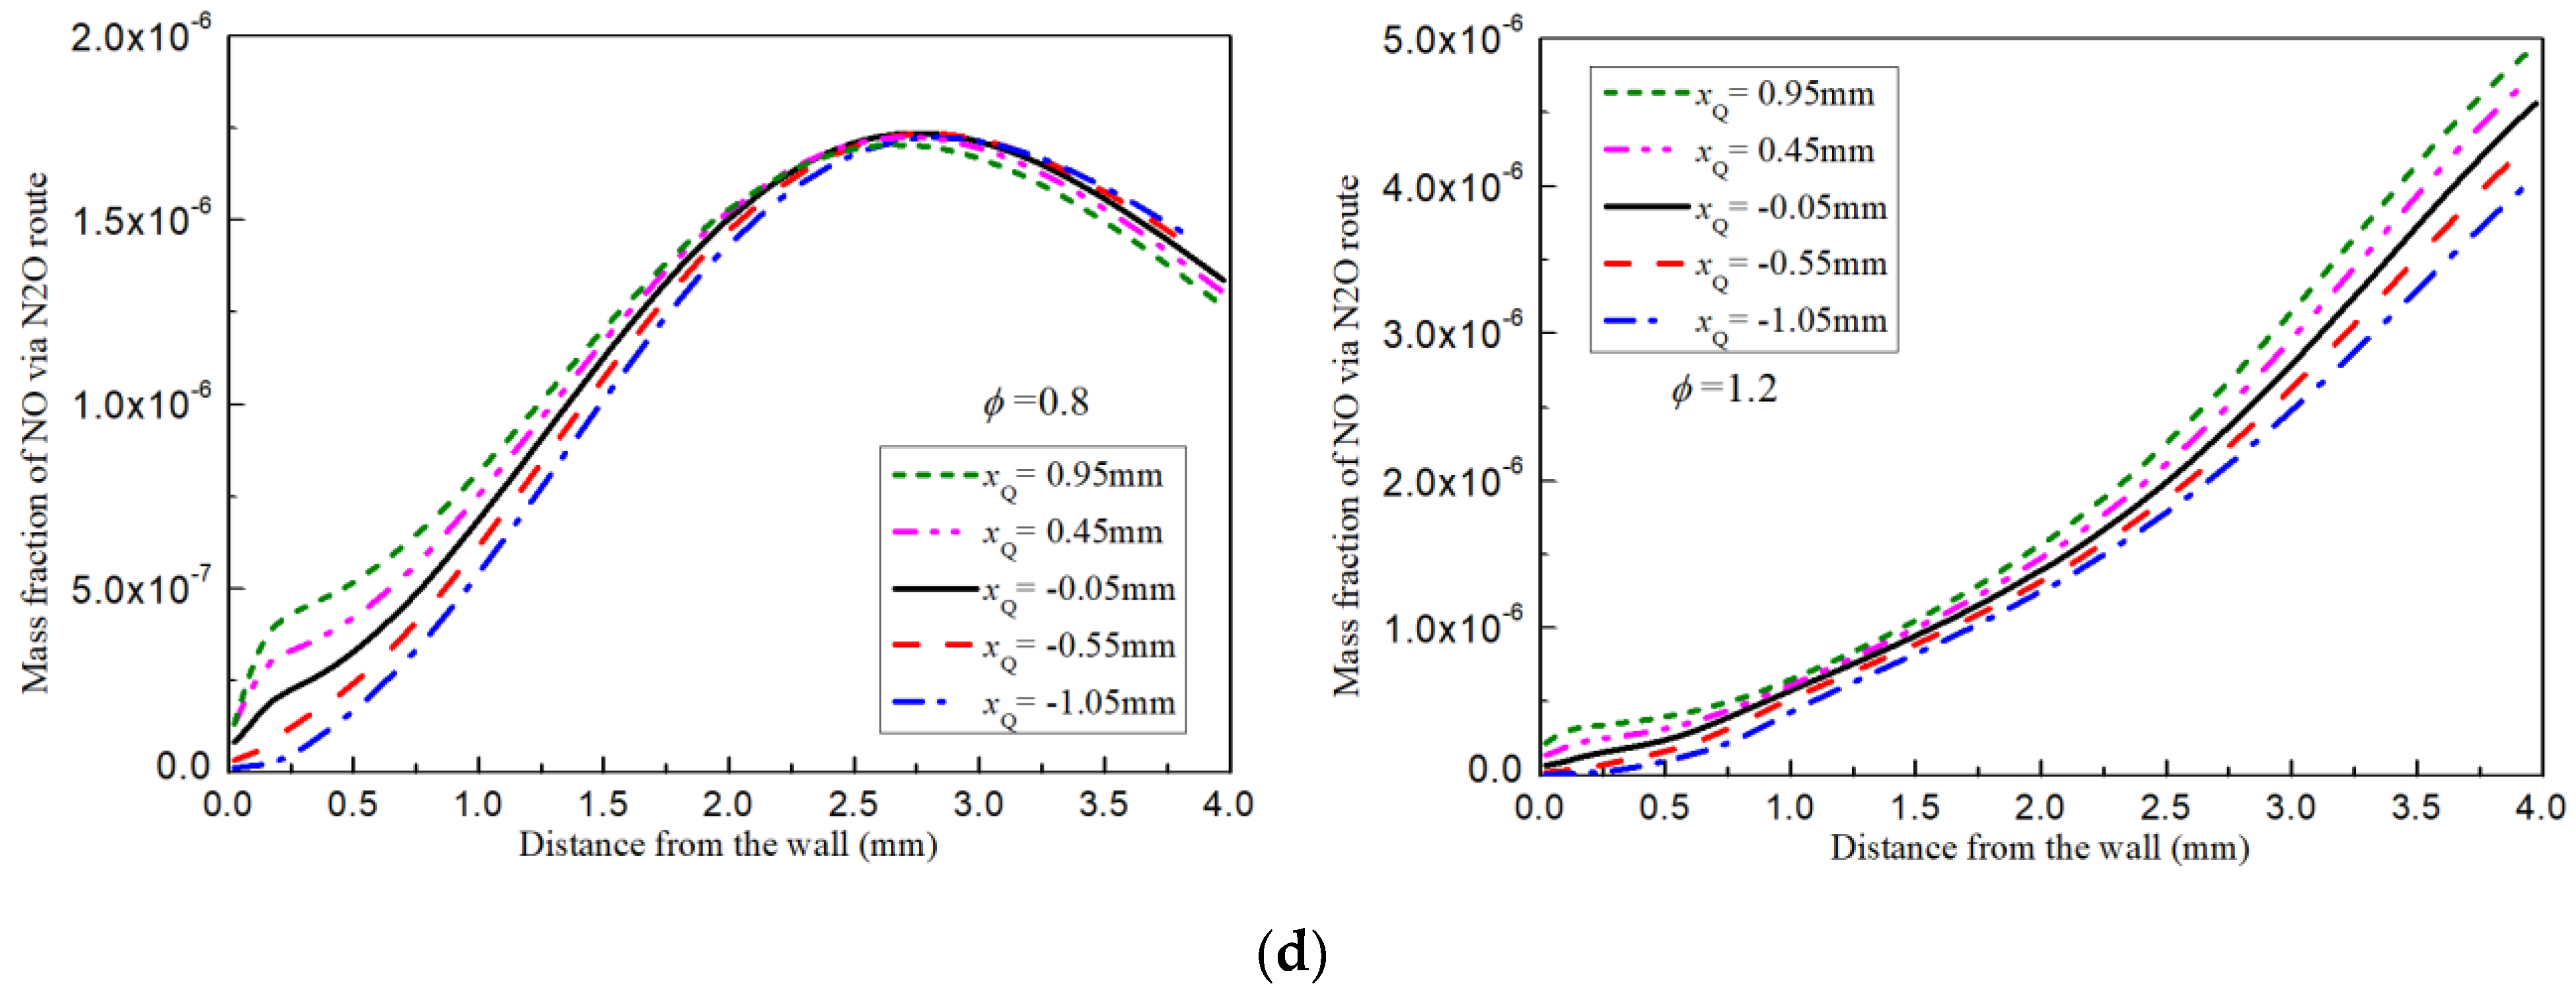
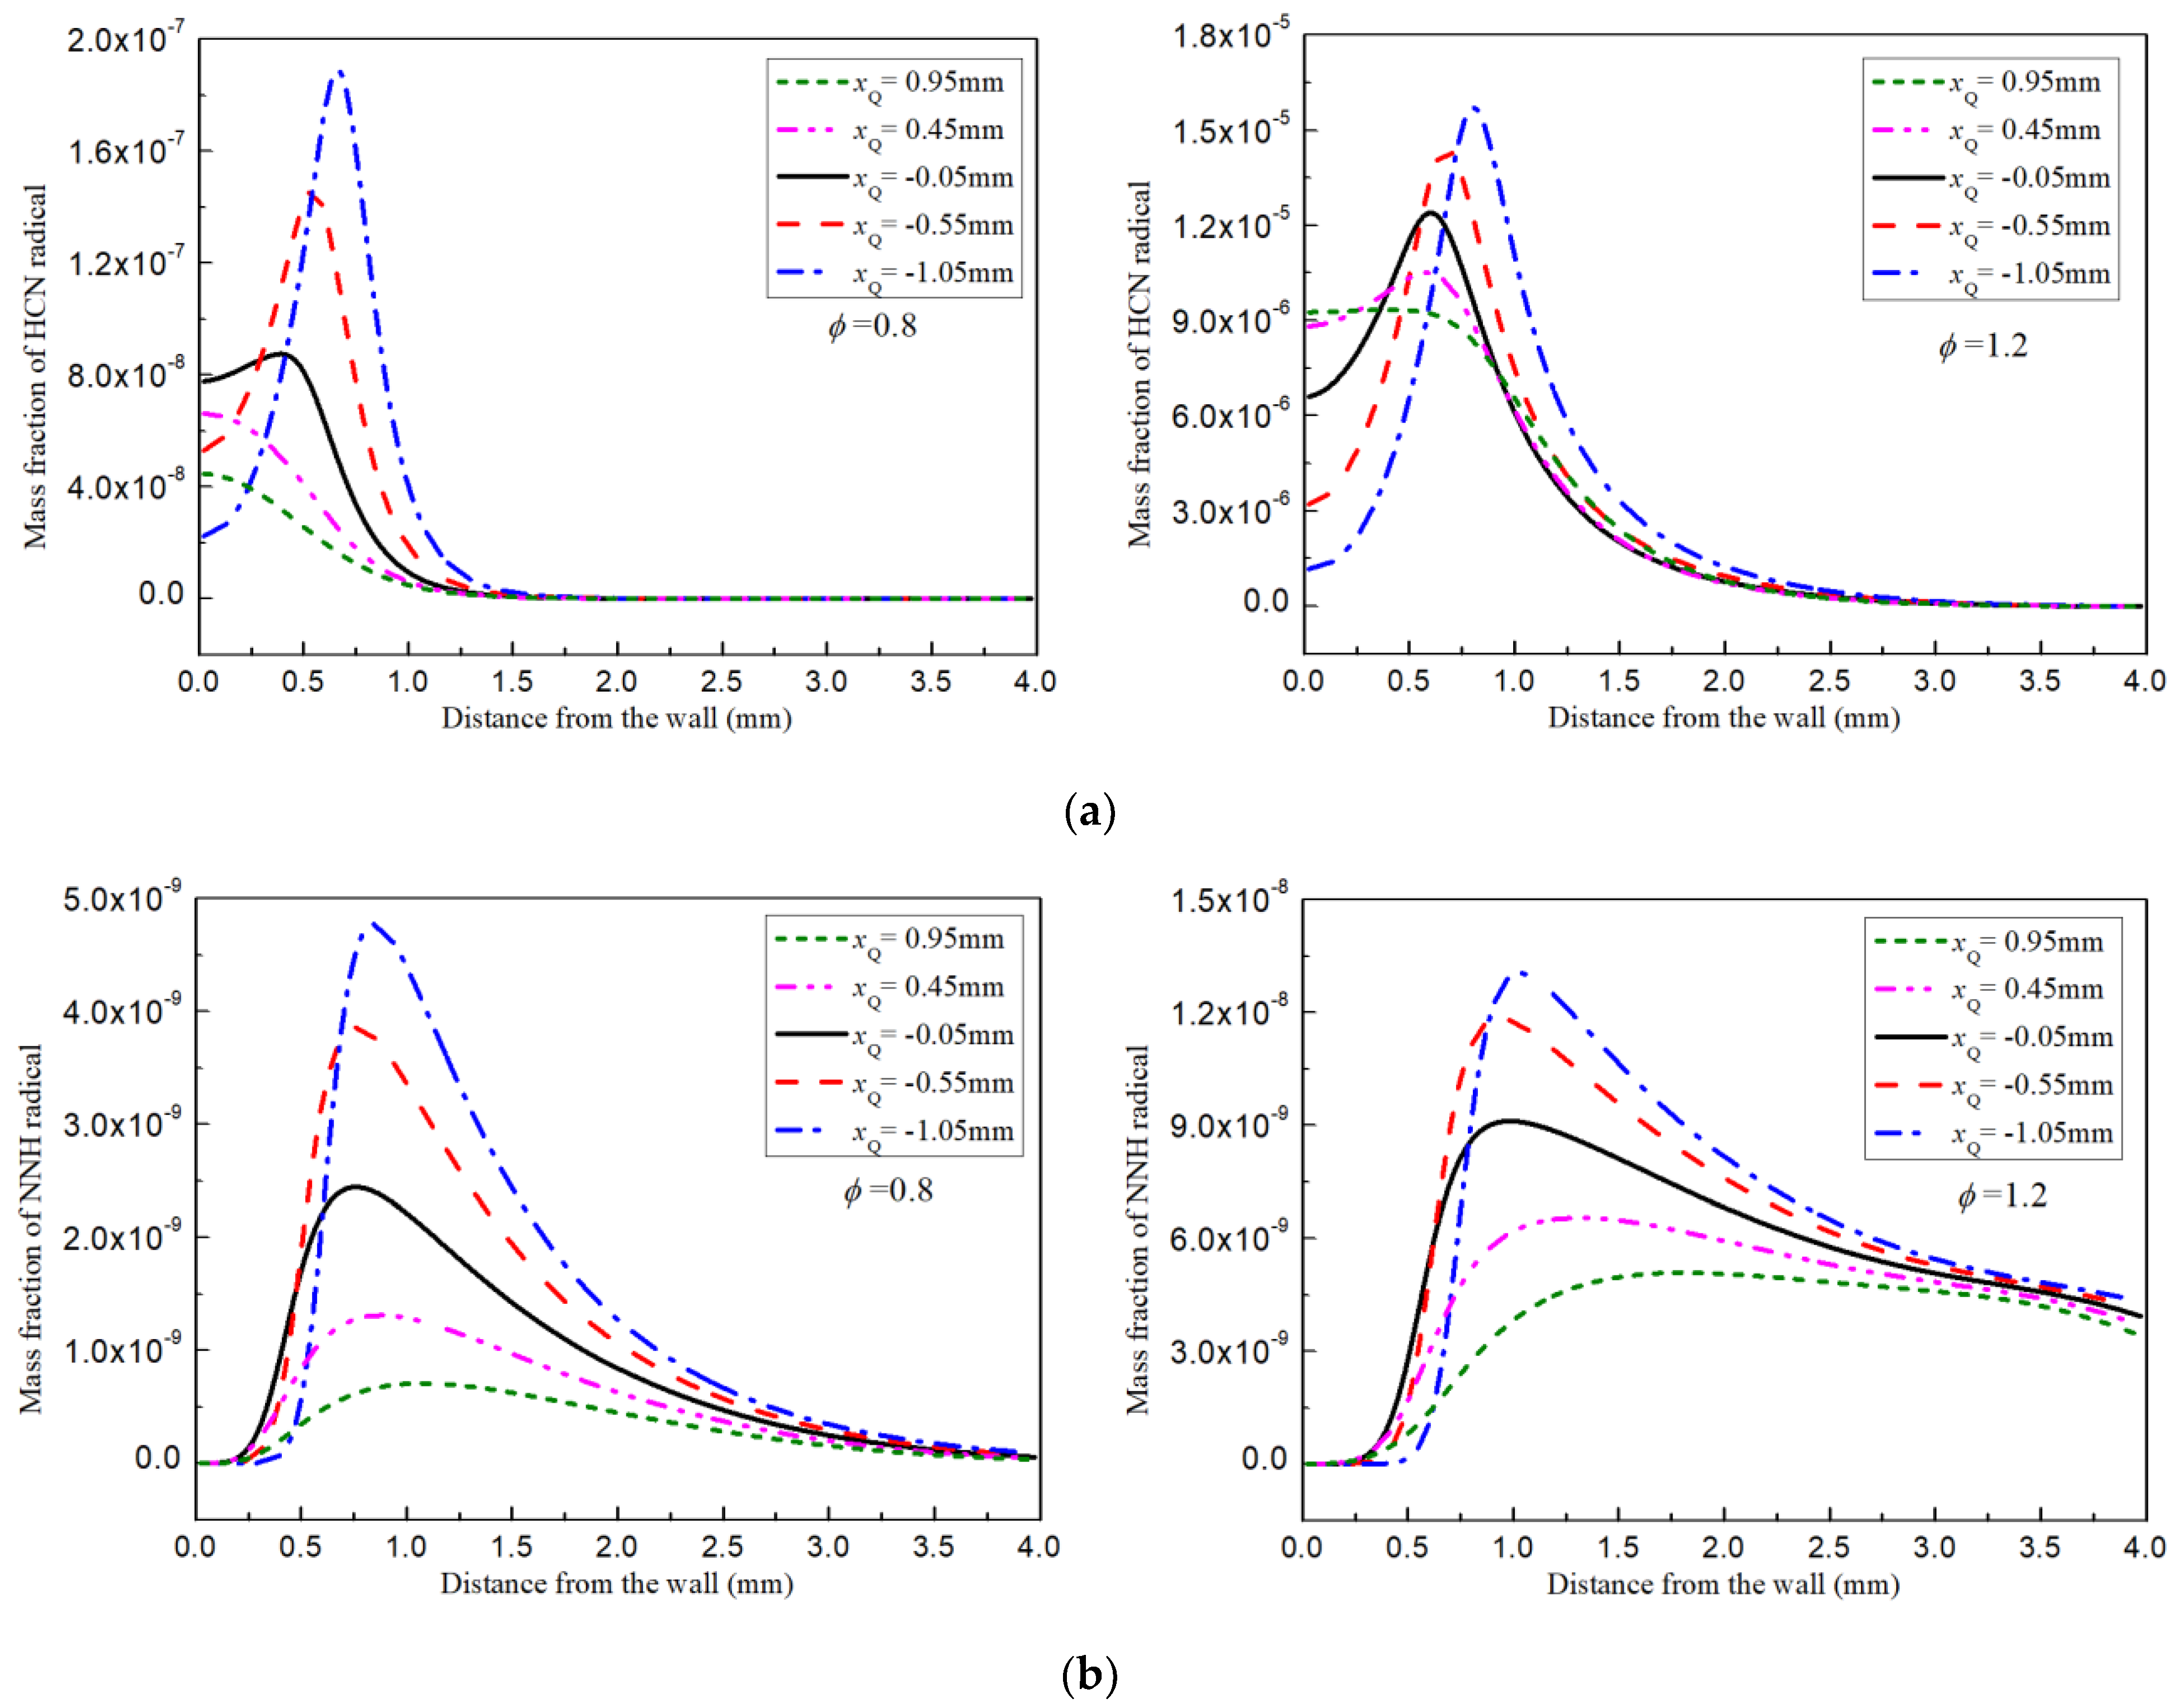
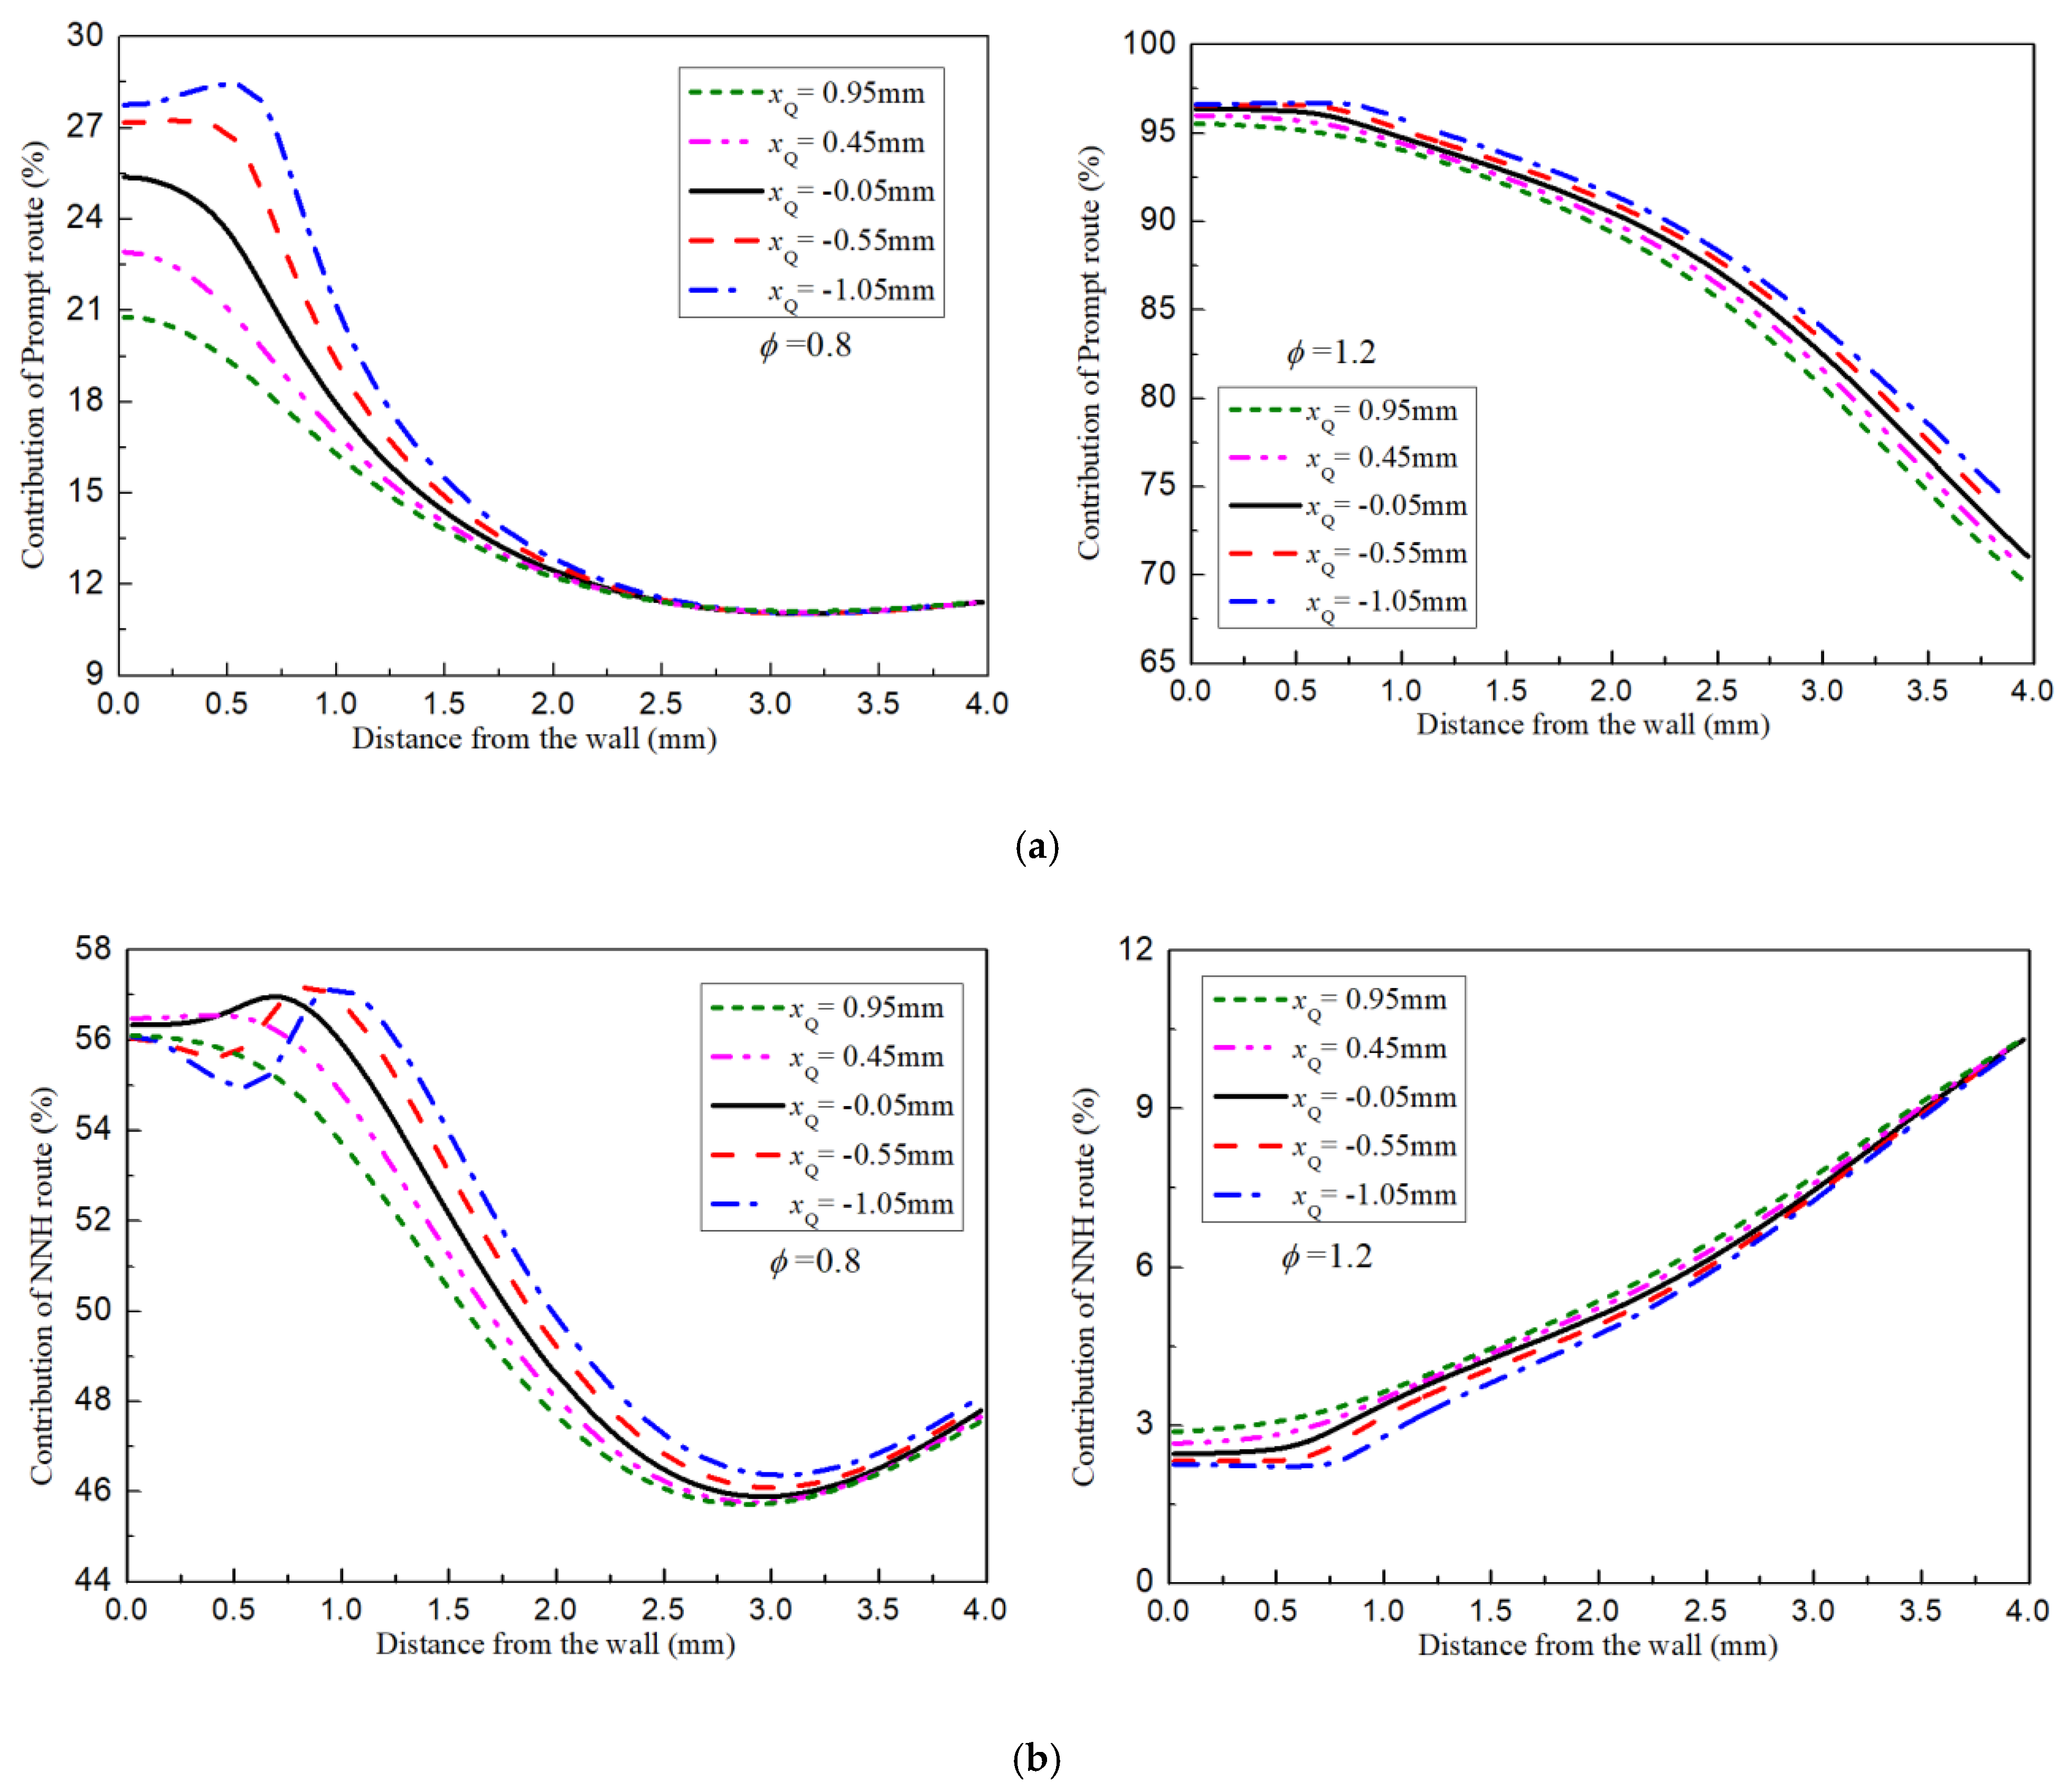
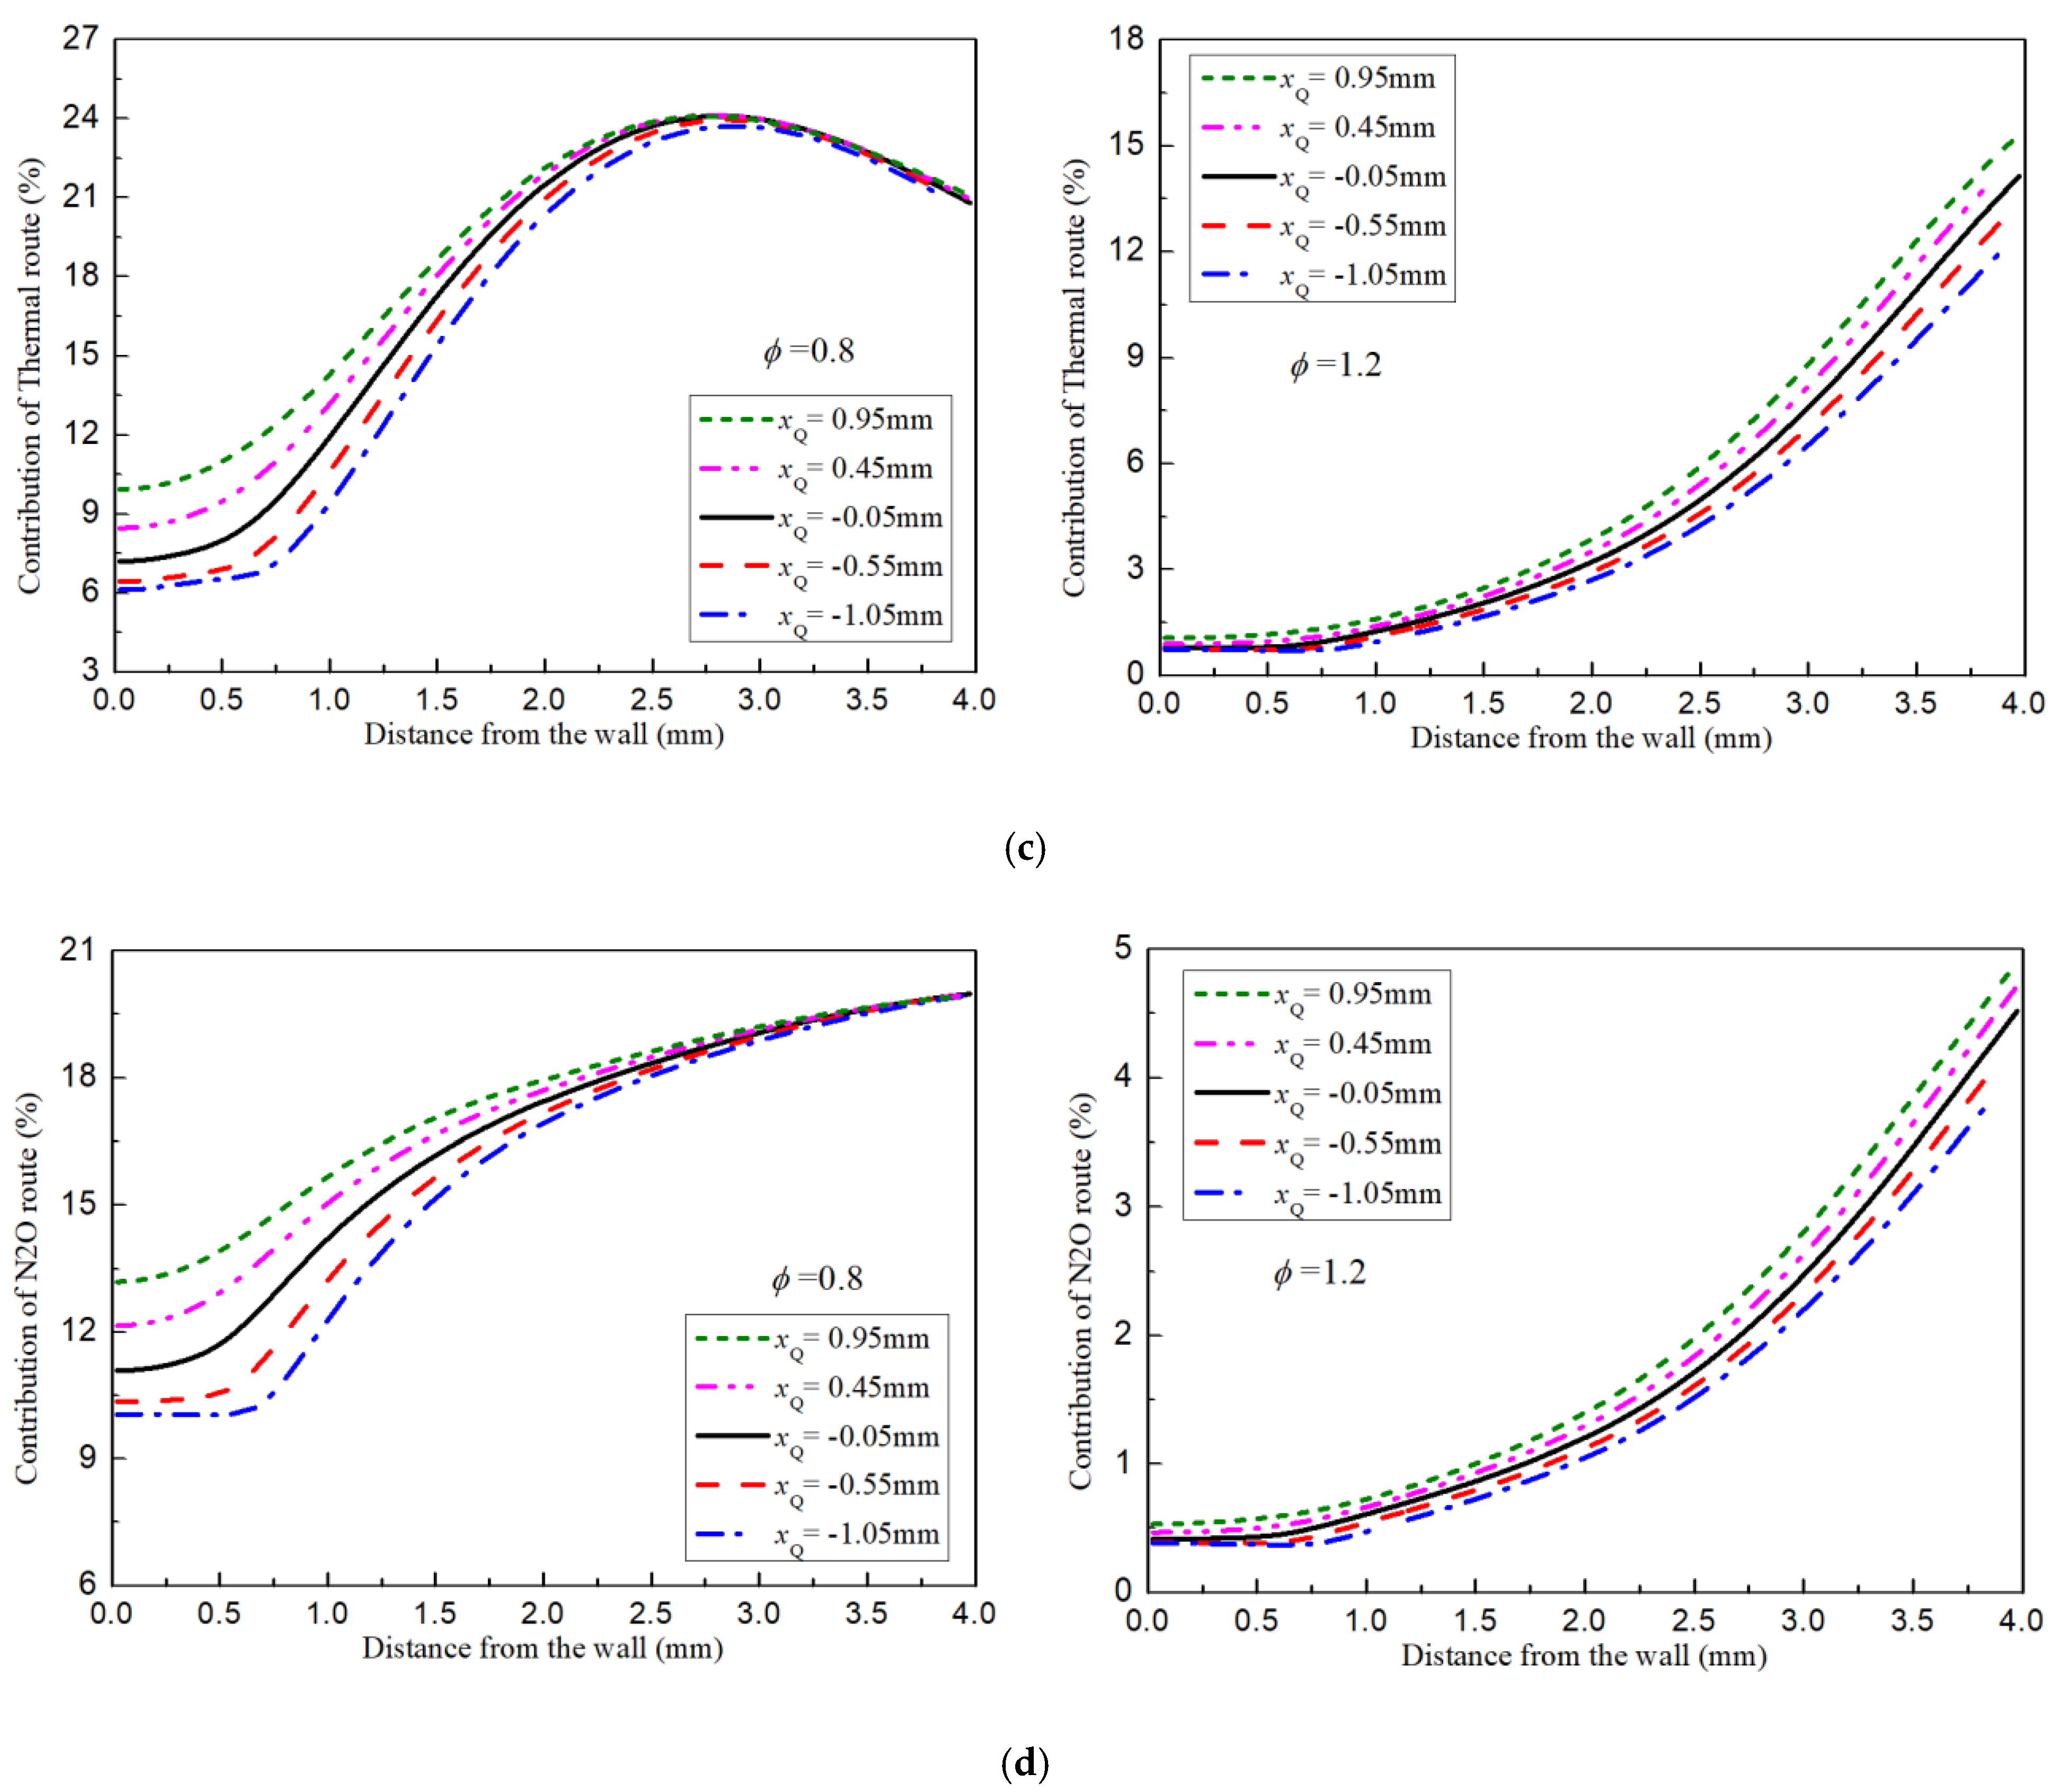
3.3. Near-Wall Spatial Profiles of NO in the Laminar Premixed Biogas–Hydrogen Impinging Flame

The spatial distributions of NO at different xQ in the biogas–hydrogen flame are compared in Figure 7. At different xQ, generally, the NO concentration increased gradually with the increased wall distance and reached its maximum value at around Δz = 2.5 mm and 2 mm in the flame at φ = 0.8 and 1.2, respectively. Further away from the wall, the NO concentration was decreased more effectively at φ = 0.8 than that at φ = 1.2, which could be as a result of the excess air and ambient air that reduced the burned gases temperature of the impinging flame more effectively at φ = 0.8, and then suppressed the NO production considerably and decreased its concentration. In addition, it is noted that the NO concentration in the flame at φ = 1.2 was much higher than that at φ = 0.8. This is attributed to the more heat released near the wall, which resulted in a high temperature and then accelerated NO production. Although the NO concentrations at different xQ had similar values at locations far away from the wall (as shown in Figure 7), it is noted that they had a large difference in the near-wall region (Δz < 0.5 mm) at either φ = 0.8 or φ = 1.2. In the wall vicinity, NO could hardly be produced as xQ < −0.05 mm due to the existence of the unburned gases layer. Near the quenching point (xQ = 0), the NO concentration showed an obvious rising trend in the region of Δz < 0.25 mm. In contrast, the increasing rate ofthe NO concentration was further elevated in the post flame region (xQ = 0.45 and 0.95 mm), as illustrated in Figure 7.
In order to clarify the reasons causing this difference, the NO amounts produced by different major routes and the contributions of different routes on NO production at various xQ are discussed here. As shown in Figure 8, it is seen that, at φ = 0.8, the NO mass fraction of the NNH route had a much higher value than that of the other three routes, and its value increased rapidly in the post flame region as Δz < 0.25 mm, which indicates that the NNH route played a dominated role in NO accumulation near the wall at φ = 0.8, as shown in Figure 7. Furthermore, although the prompt NO had the lowest value at locations far away from the wall compared with that of the other routes, it was produced quite effectively in the wall vicinity thanks to the heat loss to the wall, which allowed for more available fuel to participate in the prompt NO production process, which resulted in a higher concentration of prompt NO than that of the thermal route and because of the N2O route in the wall vicinity (Δz < 0.25 mm), as shown in Figure 8. This also contributed to the NO accumulation near the wall as xQ > 0 mm in the biogas–hydrogen flame at the fuel-lean condition. In addition, it is noted that N2O route and thermal route proceeded primarily far away from the wall rather than near the wall, owing to the restraint of the residence time and gas temperatures. At φ = 1.2, it is clear that the fast rising trend of the NO concentration near the wall was predominated by the prompt NO, whose value was two or three orders of magnitude higher than that of other routes (as illustrated in Figure 8). Furthermore, it is seen that NO production via the NNH route, N2O route, and thermal route were improved considerably with the increased Δz thanks to the abundant fuel, more ambient air mixing, and increased gases temperature. To further clarify the reasons for the high concentrations of prompt NO and NNH NO, the near-wall distributions of the HCN and NNH radicals produced via the prompt route and NNH route at different xQ are compared in Figure 9. It is seen that, at either φ = 0.8 or φ = 1.2, the concentration of NNH radical remained at zero within the region of Δz < 0.25 mm, while the HCN radical had a high concentration in the wall vicinity compared with that in the further zone away from the wall when xQ ≥ −0.05 mm. This means that the accumulation of prompt NO near the wall could be attributed to its effective production process in the wall vicinity, while the high concentration of NO via NNH route near the wall might have resulted from the transportation of NO from the location far away from the wall.
Figure 10 compares the contribution variations of different routes at various xQ in the flame. It is seen that the prompt route and NNH intermediate route accounted for more than 80% of NO production in the wall vicinity (Δz < 0.5 mm) at φ = 0.8, while almost all of the NO near the wall was generated via a prompt route at φ = 1.2. As Δz increased, the significance of the prompt route decreased drastically while other routes were increasingly significant in the NO production in the post flame region for the fuel-lean condition. In contrast, although the NO productions via other routes were accelerated quite effectively in the post flame region at φ = 1.2, as shown in Figure 10, the prompt NO still accounted for around 70% of the NO production in the zone further away from the wall due to its efficient production in the wall vicinity. Hence, it is known that NO productions via the prompt route and NNH route are the primary contributors on the high NO concentration near the wall at the fuel-lean condition, while the prompt NO predominates the rapid accumulation of NO in the wall vicinity at the fuel-rich condition. In addition, it is known that, although the contribution of the prompt route can be decreased gradually far away from the wall, the significance of the prompt route for the NO emission cannot be neglected in the micro-combustors in which the combustion process suffers from the drastically strong FWI effects in the whole chamber.

4. Conclusions

The near-wall flame structure and pollutant emissions of the laminar premixed biogas–hydrogen impinging flame were simulated with a detailed chemical mechanism. The spatial distributions of the temperature, critical species, and pollutant emissions near the wall of the laminar premixed biogas–hydrogen impinging flame were obtained and investigated quantitatively. The obtained results are summarized as follows.
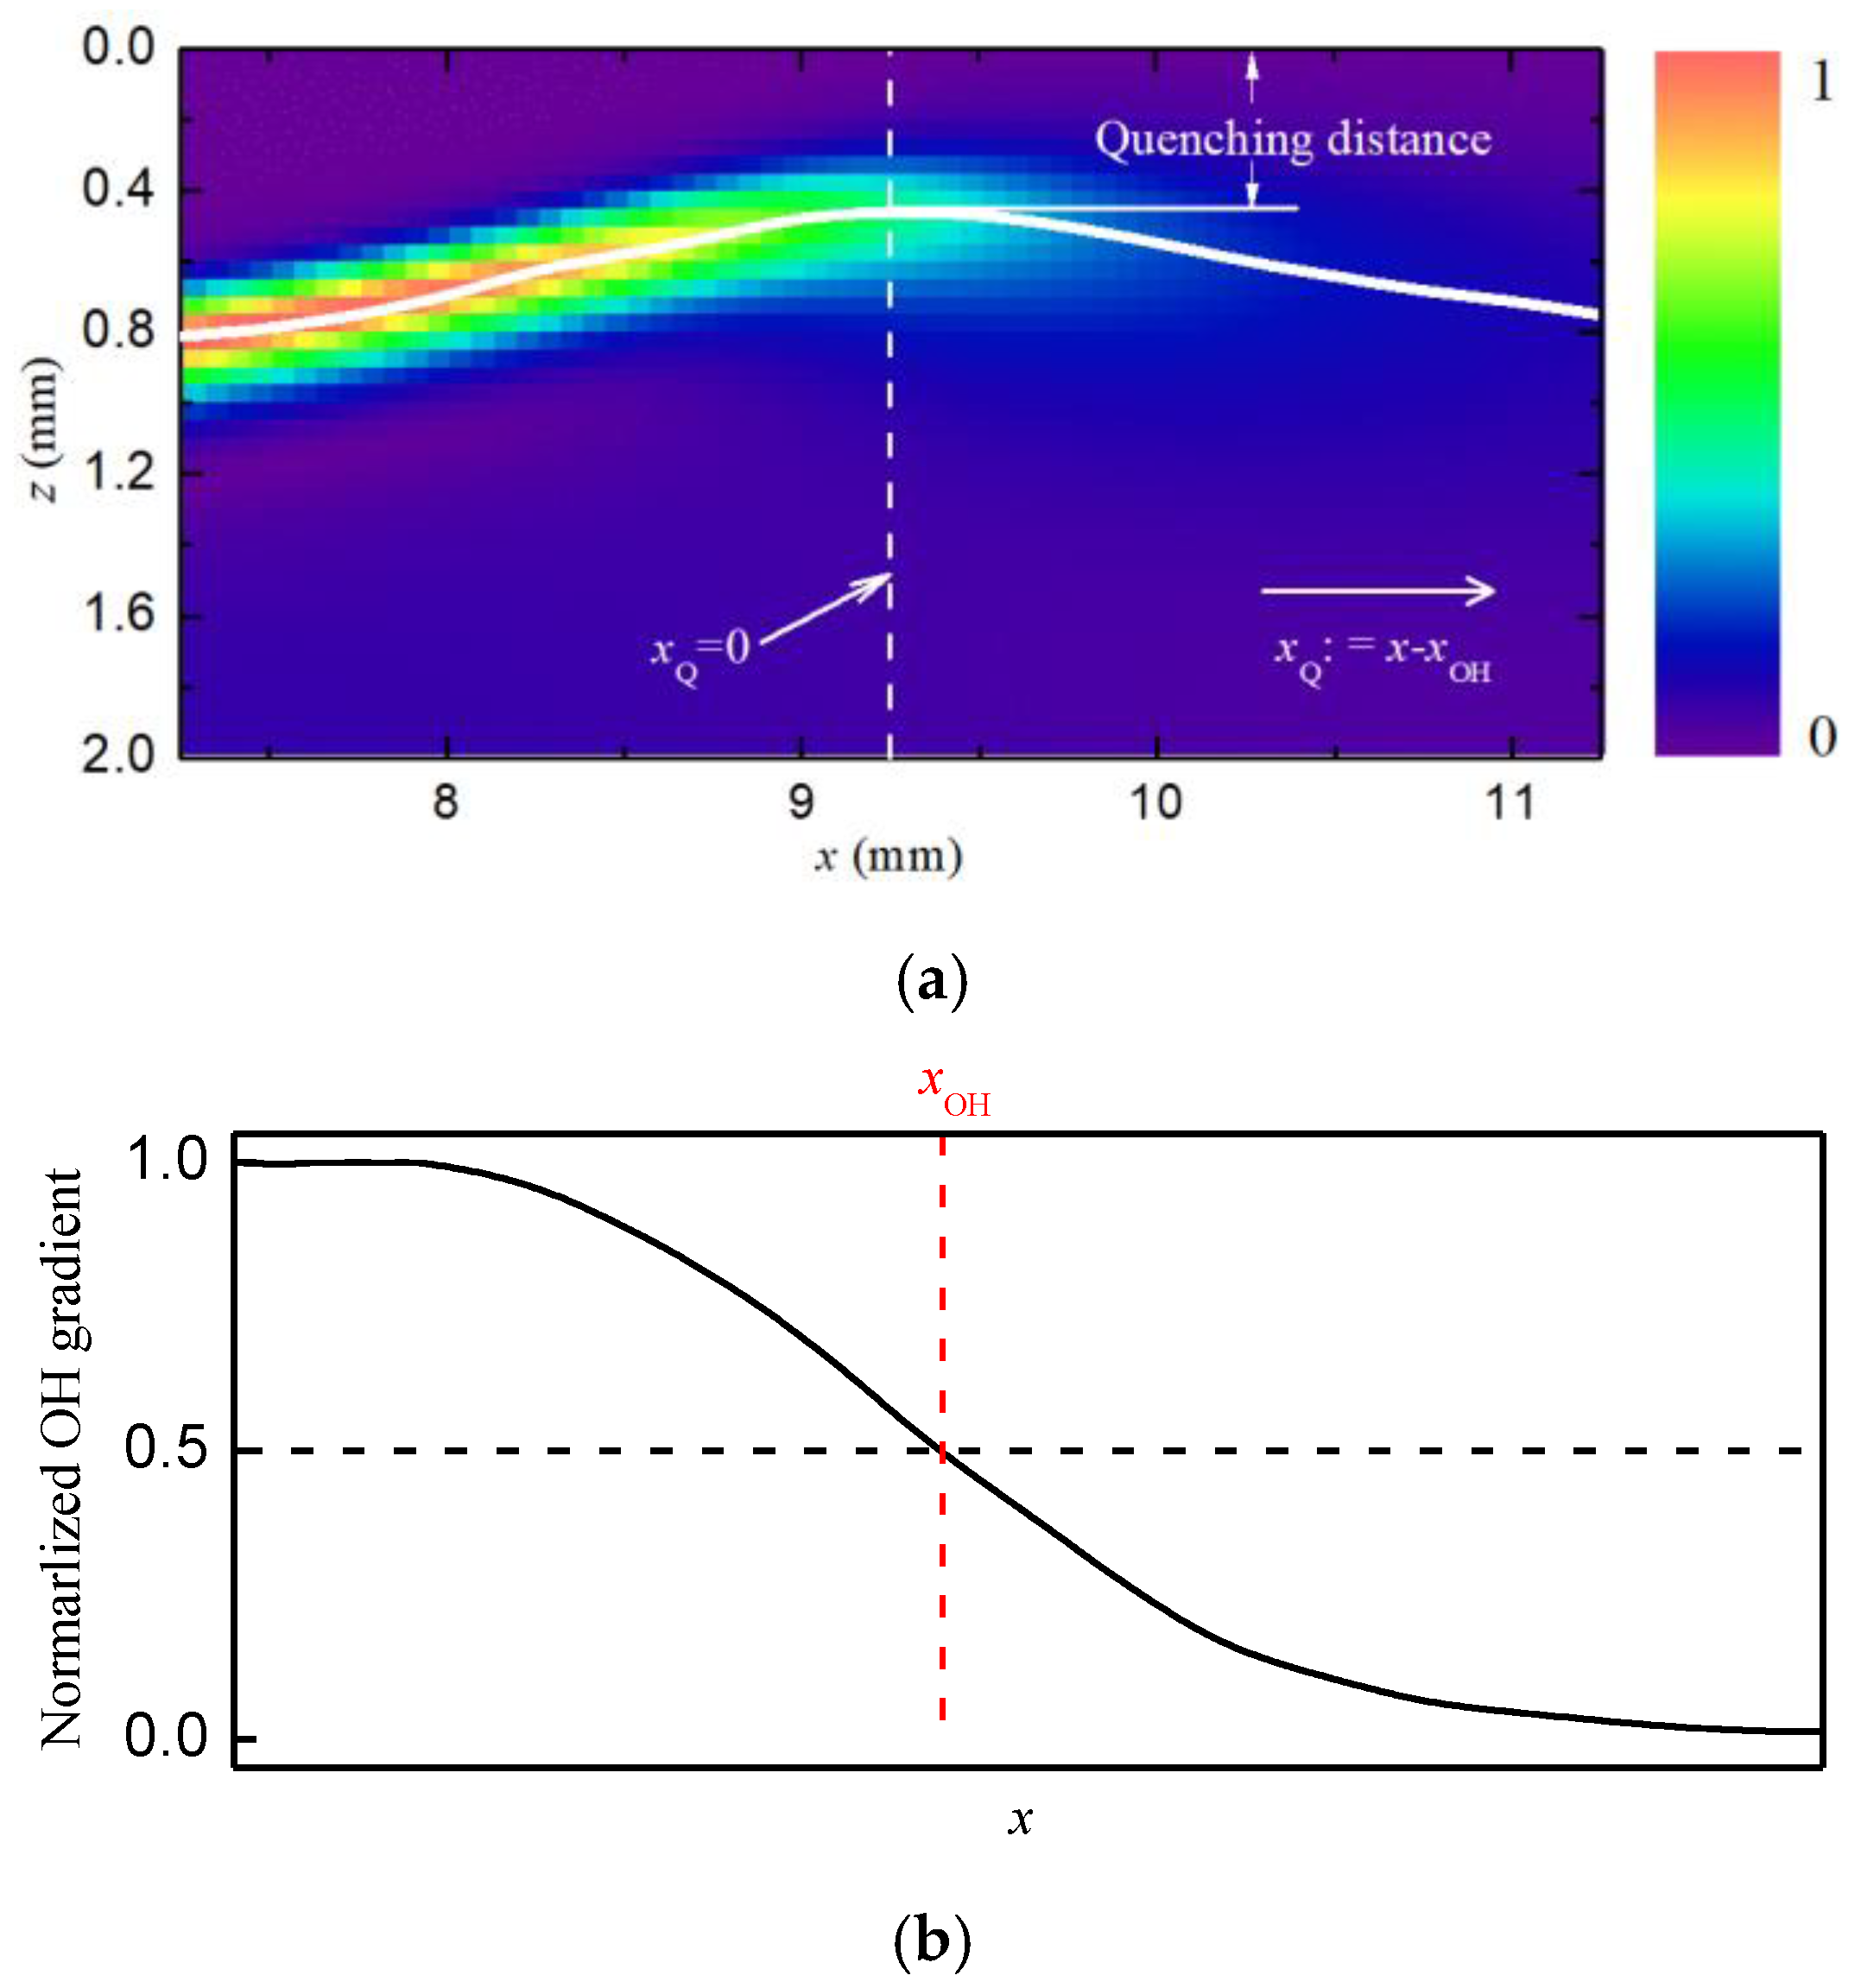
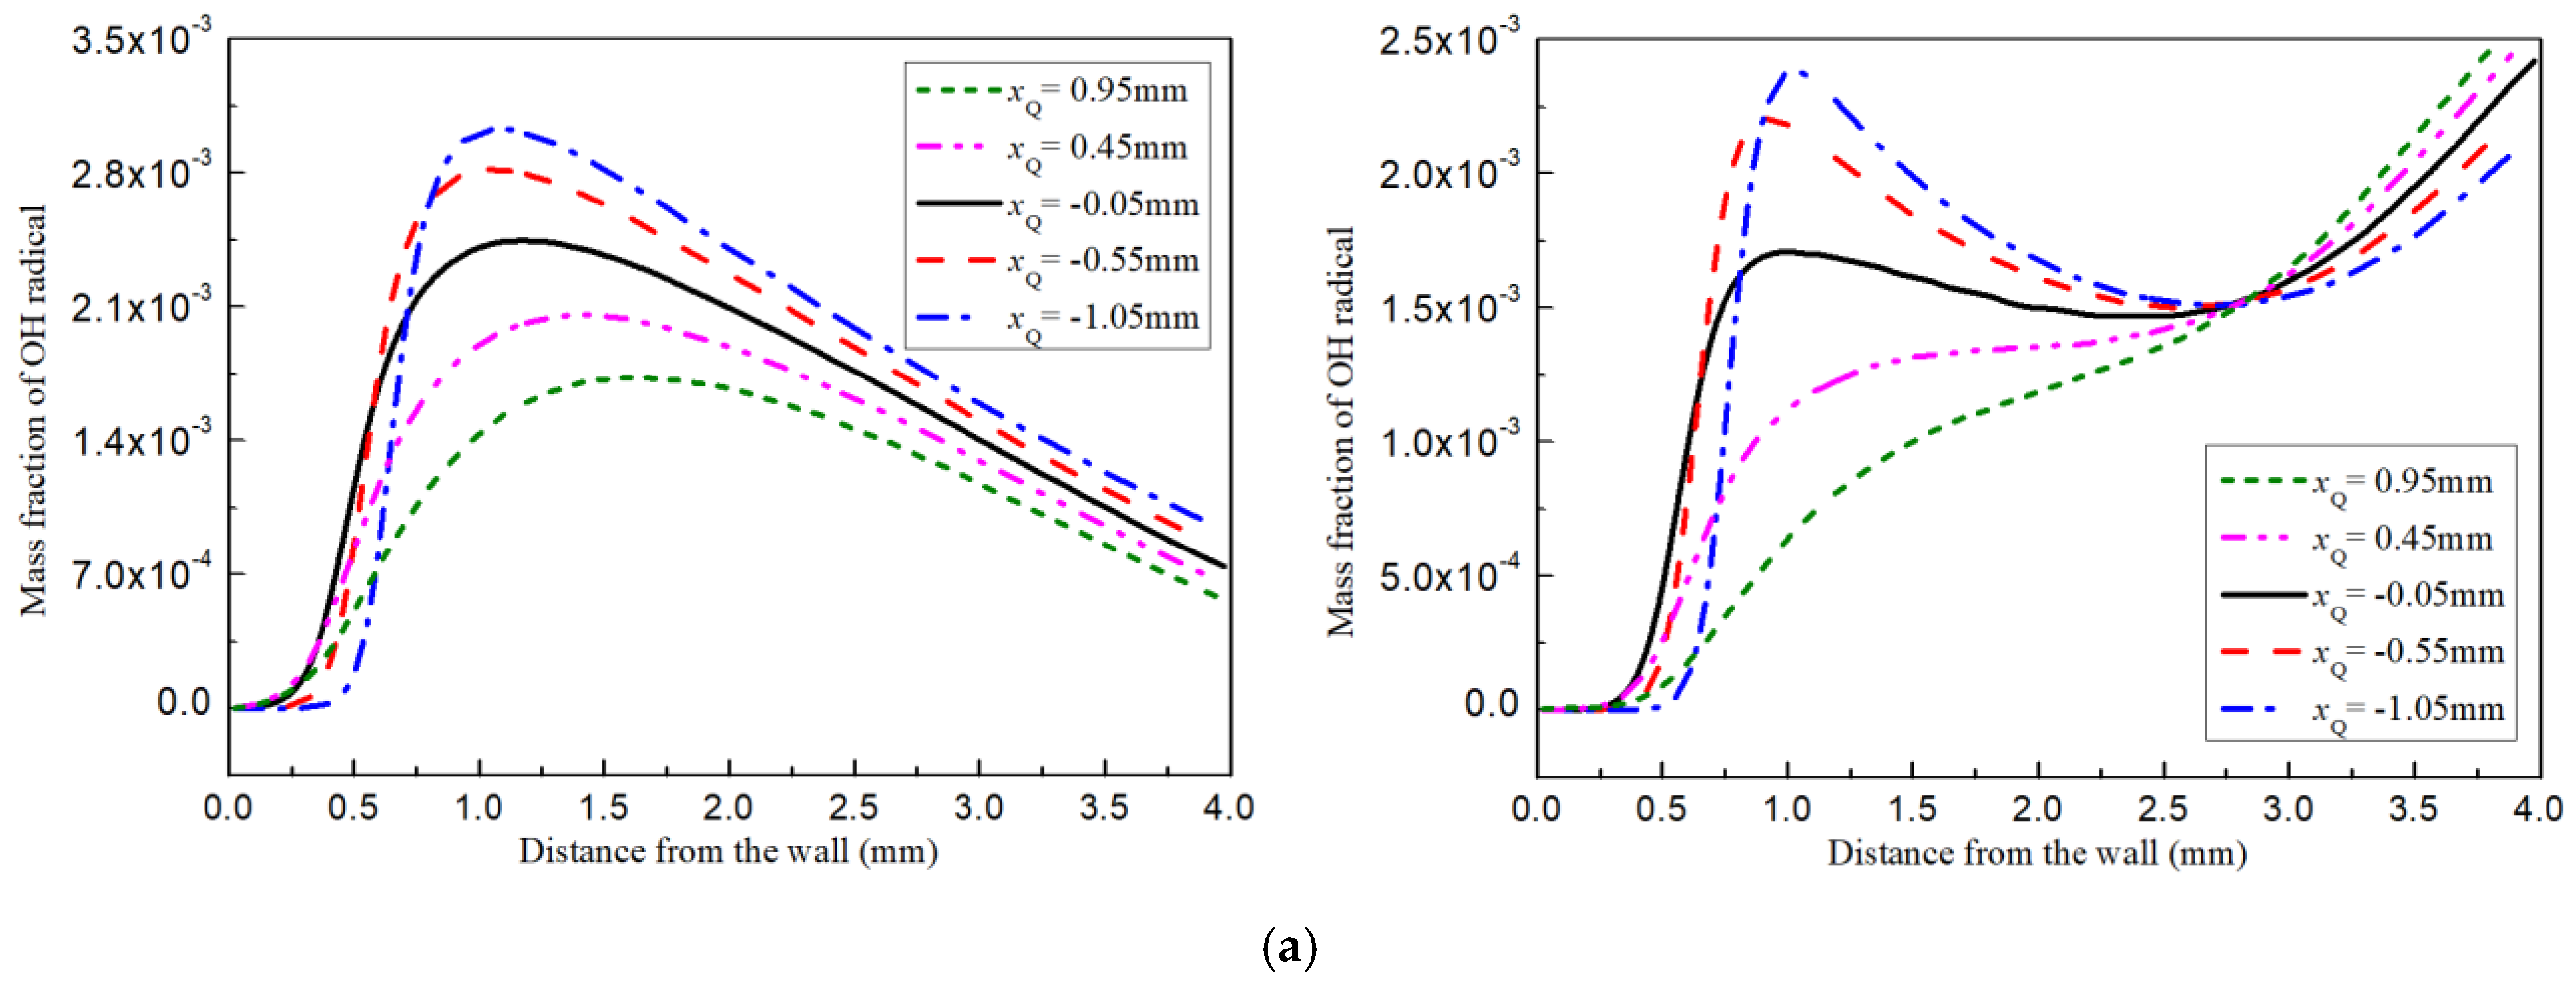
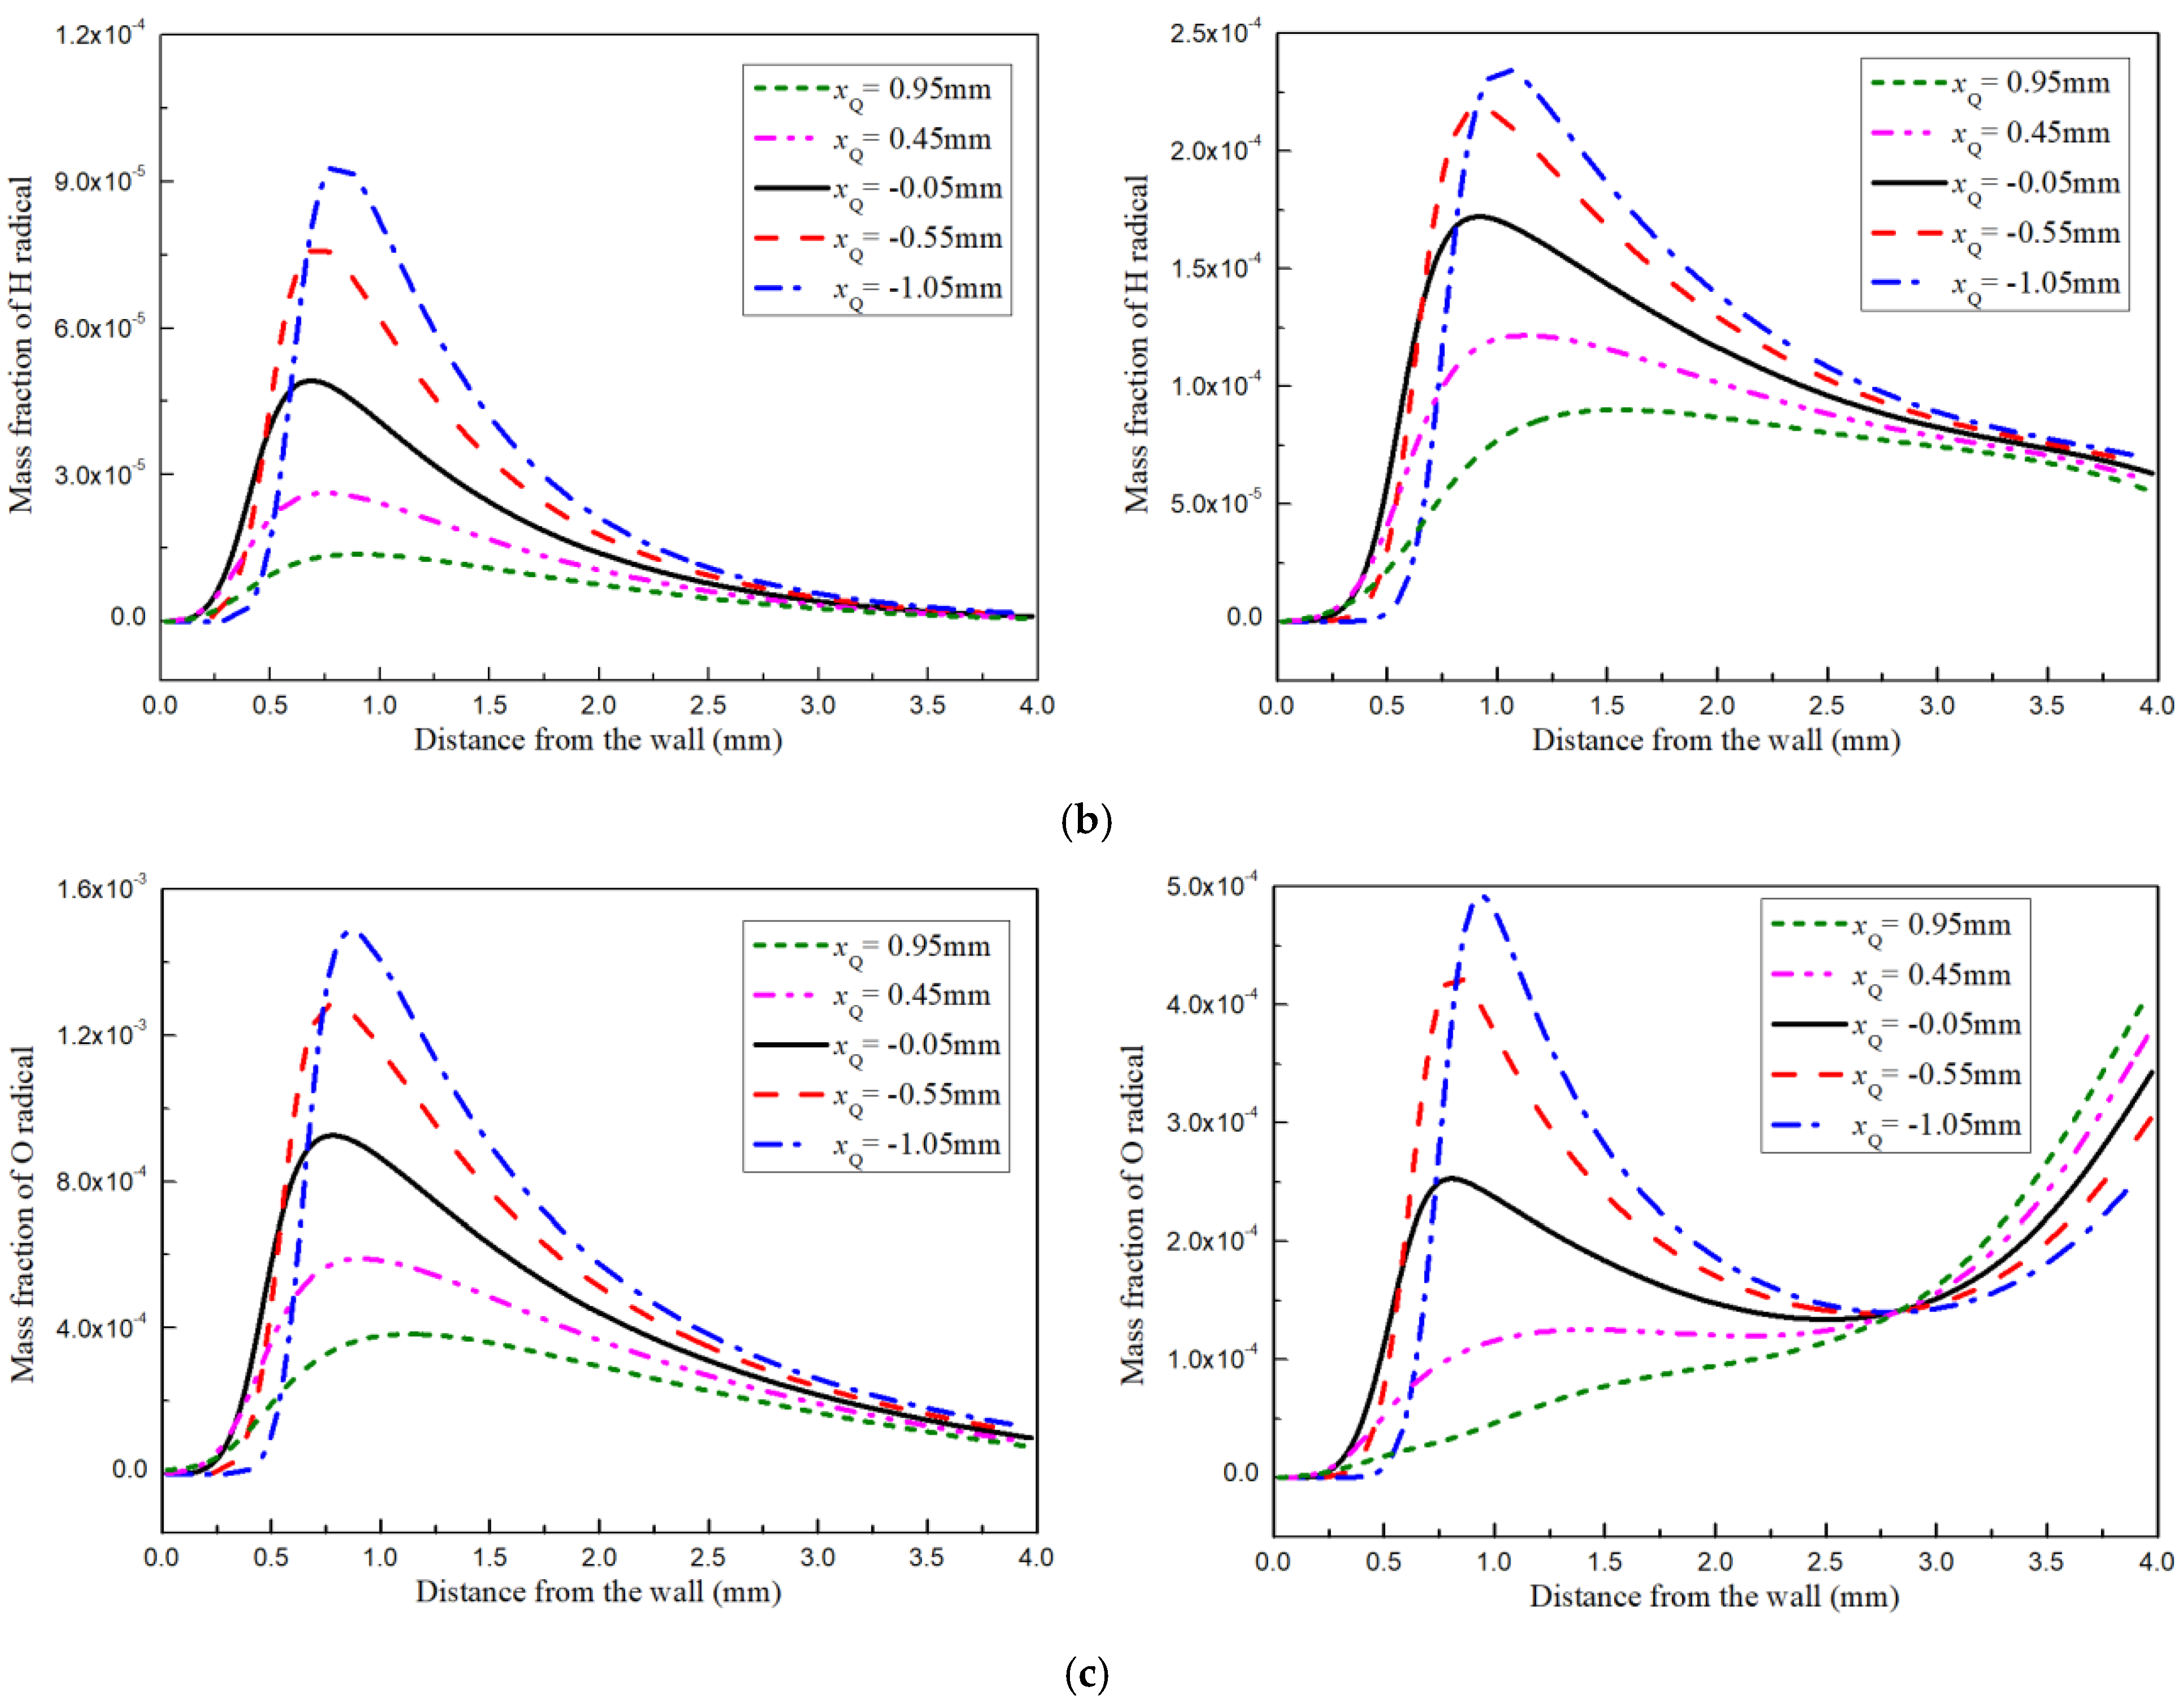
  • The temperature and OH, H, and O radicals can be affected considerably by the cold wall, which results in a large temperature gradient and quite low concentrations of OH, H, and O radicals in the wall vicinity. It should be noted that the cold wall can also influence the premixed combustion process in the flame front, which is close to the wall but does not touch the wall, and results in decreased concentrations of OH, H, and O radicals before flame quenching occurs. This means that, thanks to the effectively increased surface-to-volume ratio, the premixed combustion process in the downsized chamber will be suppressed more easily by the amplified cooling effects of the cold wall, which might contribute to the decreased combustion efficiency and increased pollutant emissions.
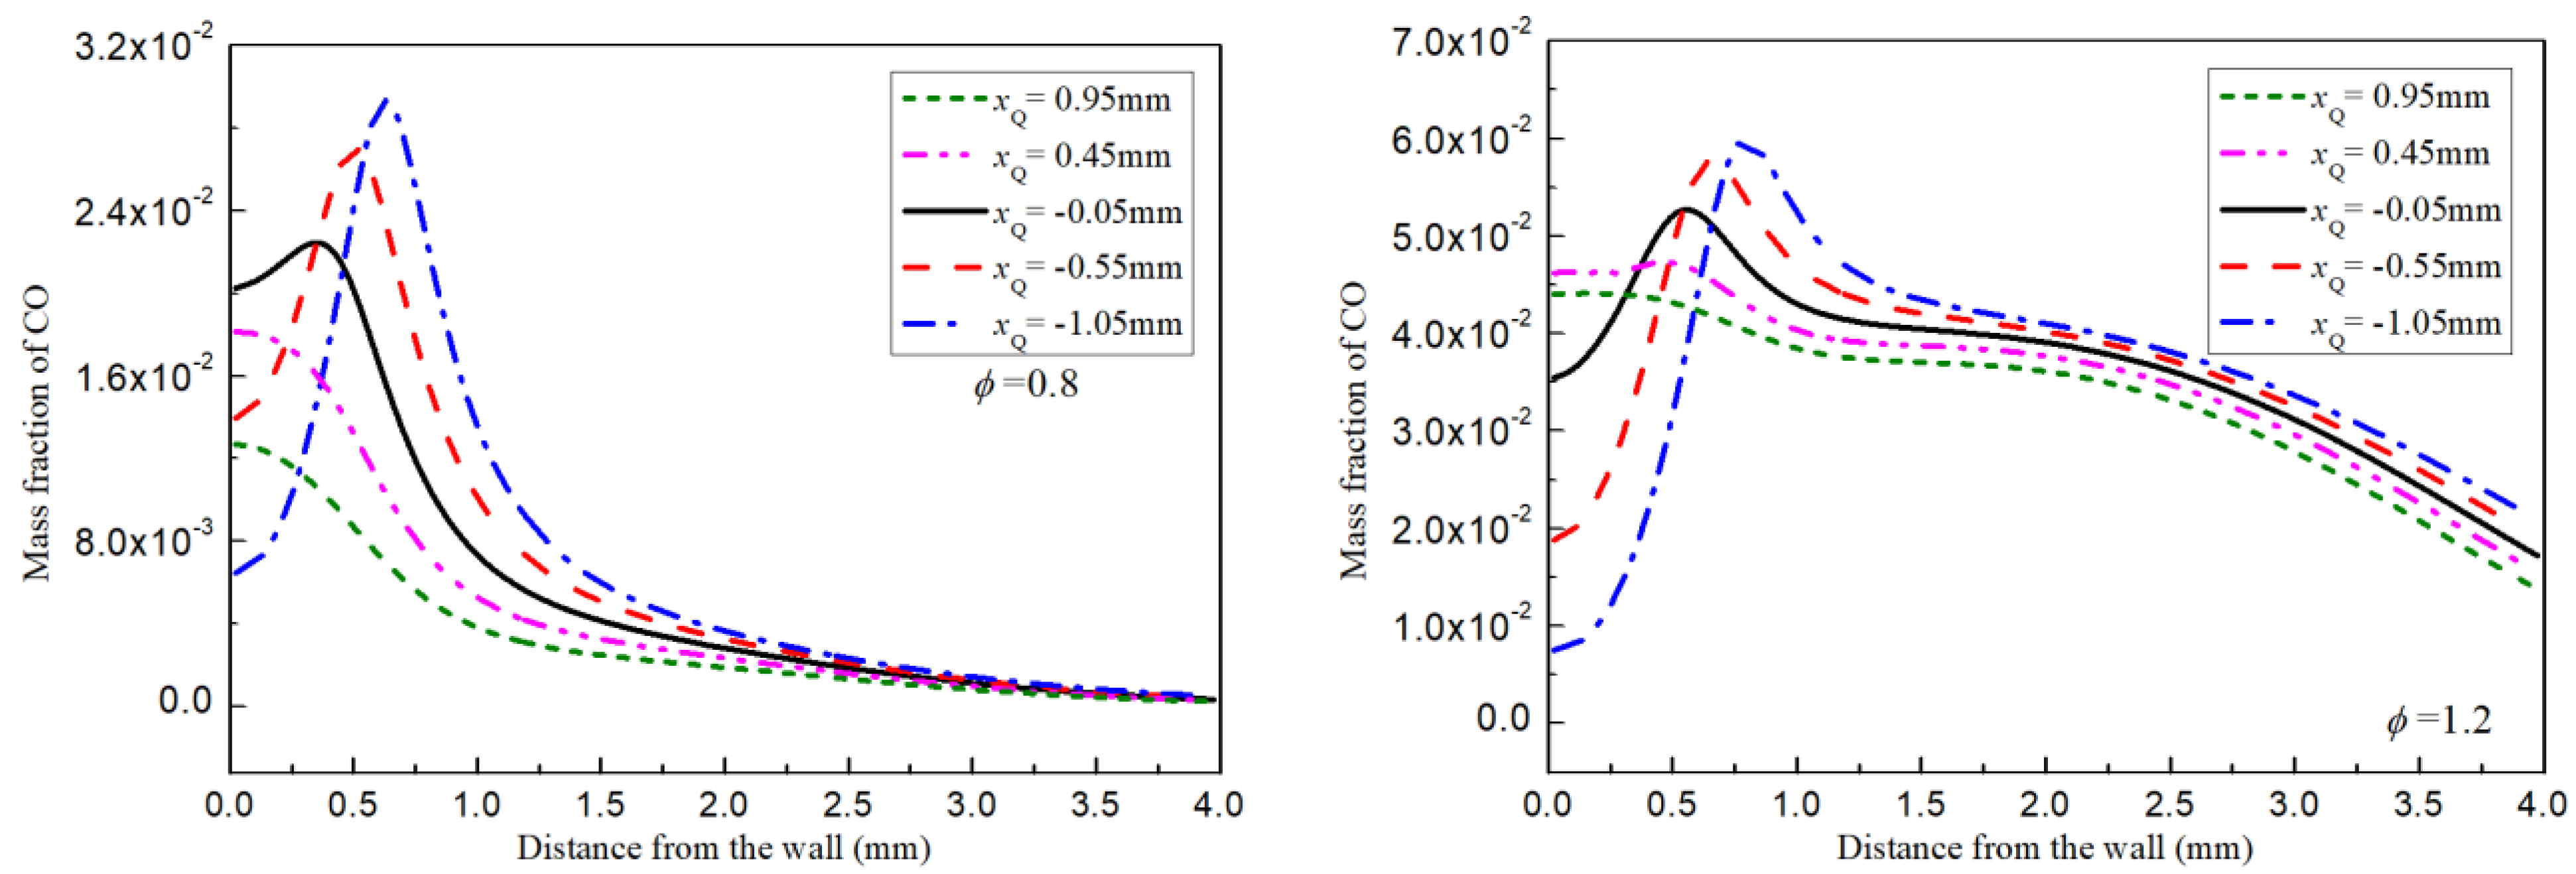
  • After the flame quenching, the high CO concentration can be observed near the wall at both φ = 0.8 and 1.2. Compared with that at φ = 1.0, more unburned fuel is allowed to pass through the quenching zone and to generate CO after flame quenching near the wall at φ = 0.8 and 1.2 thanks to the suppressed fuel consumption rate and excess fuel in the unburned gases. Thus, the high concentration of CO near the wall in either the fuel-lean or fuel-rich condition is ascribed to the combined effects of CO production and transportation. By isolating the formation routes of NO production, it is found that the fast-rising trend of NO concentration near the wall in the post flame region at φ = 0.8 is attributed to the NO transportation from the NNH route primarily, while the high NO concentration at φ = 1.2 is resulted from the prompt NO production, which accounts for more than 90% of NO generation in the wall vicinity. It is thus known that the incomplete combustion and NO via the prompt and NNH routes might be improved in the downsized combustor due to the amplified cooling effects of the cold wall.

Author Contributions

Conceptualization, Z.W.; Software, L.W.; Supervision, H.Z.; Validation, H.L.; Visualization, L.W. and H.L.; Writing—original draft, Z.W.; Writing—review & editing, Z.L. and H.Z. All authors have read and agreed to the published version of the manuscript.

Funding

Hainan Provincial Natural Science Foundation of China (520QN227, 519MS023, and 520RC534).

Institutional Review Board Statement

Not applicable.

Informed Consent Statement

Not applicable.

Acknowledgments

The authors are thankful for the full financial support from the Hainan Provincial Natural Science Foundation of China (520QN227, 519MS023, and 520RC534).

Conflicts of Interest

The authors declare no conflict of interest.

References

  1. Alkidas, A. Combustion-chamber crevices: The major source of engine-out hydrocarbon emissions under fully warmed conditions. Prog. Energy Combust. Sci. 1999, 25, 253–273. [Google Scholar] [CrossRef]
  2. Dreizler, A.; Böhm, B. Advanced laser diagnostics for an improved understanding of premixed flame-wall interactions. Proc. Combust. Inst. 2015, 35, 37–64. [Google Scholar] [CrossRef]
  3. Wang, Y.; Trouvé, A. Direct numerical simulation of nonpremixed flame–wall interactions. Combust. Flame 2006, 144, 461–475. [Google Scholar] [CrossRef]
  4. Rivera, J.E.; Gordon, R.L.; Talei, M. Flame-wall interaction of a forced laminar premixed propane flame: Flame dynamics and exhaust CO emissions. Proc. Combust. Inst. 2019, 37, 5385–5392. [Google Scholar] [CrossRef]
  5. Tang, A.; Deng, J.; Cai, T.; Xu, Y.; Pan, J. Combustion characteristics of premixed propane/hydrogen/air in the micro-planar combustor with different channel-heights. Appl. Energy 2017, 203, 635–642. [Google Scholar] [CrossRef]
  6. Häber, T.; Suntz, R. Effect of different wall materials and thermal-barrier coatings on the flame-wall interaction of laminar premixed methane and propane flames. Int. J. Heat Fluid Flow 2018, 69, 95–105. [Google Scholar] [CrossRef]
  7. Poinsot, T.J.; Haworth, D.C.; Bruneaux, G. Direct simulation and modeling of flame-wall interaction for premixed turbulent combustion. Combust. Flame 1993, 95, 118–132. [Google Scholar] [CrossRef]
  8. Kosaka, H.; Zentgraf, F.; Scholtissek, A.; Bischoff, L.; Häber, T.; Suntz, R.; Albert, B.; Hasse, C.; Dreizler, A. Wall heat fluxes and CO formation/oxidation during laminar and turbulent side-wall quenching of methane and DME flames. Int. J. Heat Fluid Flow 2018, 70, 181–192. [Google Scholar] [CrossRef]
  9. Wei, Z.L.; Leung, C.W.; Cheung, C.S.; Huang, Z.H. Effects of H2 and CO2 addition on the heat transfer characteristics of laminar premixed biogas–hydrogen Bunsen flame. Int. J. Heat Mass Transf. 2016, 98, 359–366. [Google Scholar] [CrossRef]
  10. Zhen, H.S.; Leung, C.W.; Cheung, C.S.; Huang, Z.H. Combustion characteristic and heating performance of stoichiometric biogas–hydrogen–air flame. Int. J. Heat Mass Transf. 2016, 92, 807–814. [Google Scholar] [CrossRef]
  11. Yousefi-Asli, V.; Houshfar, E.; Beygi-Khosroshahi, F.; Ashjaee, M. Experimental investigation on temperature field and heat transfer distribution of a slot burner methane/air flame impinging on a curved surface. Appl. Therm. Eng. 2018, 129, 761–771. [Google Scholar] [CrossRef]
  12. Kiani, M.; Houshfar, E.; Ashjaee, M. Experimental investigations on the flame structure and temperature field of landfill gas in impinging slot burners. Energy 2019, 170, 507–520. [Google Scholar] [CrossRef]
  13. Raj, V.C.; Kuntikana, P.; Sreedhara, S.; Prabhu, S.V. Separation of heat transfer components from impinging methane diffusion flames. Int. J. Heat Mass Transf. 2018, 126, 123–138. [Google Scholar] [CrossRef]
  14. Singh, A.; Mann, M.; Kissel, T.; Brübach, J.; Dreizler, A. Simultaneous measurements of temperature and CO concentration in stagnation stabilized flames. Flow Turbul. Combust. 2013, 90, 723–739. [Google Scholar] [CrossRef]
  15. Mann, M.; Jainski, C.; Euler, M.; Böhm, B.; Dreizler, A. Transient flame–wall interactions: Experimental analysis using spectroscopic temperature and CO concentration measurements. Combust. Flame 2014, 161, 2371–2386. [Google Scholar] [CrossRef]
  16. Jainski, C.; Rißmann, M.; Böhm, B.; Janicka, J.; Dreizler, A. Sidewall quenching of atmospheric laminar premixed flames studied by laser-based diagnostics. Combust. Flame 2017, 183, 271–282. [Google Scholar] [CrossRef]
  17. Ganter, S.; Heinrich, A.; Meier, T.; Kuenne, G.; Jainski, C.; Rißmann, M.C.; Dreizler, A.; Janicka, J. Numerical analysis of laminar methane–air side-wall-quenching. Combust. Flame 2017, 186, 299–310. [Google Scholar] [CrossRef]
  18. Jiang, B.; Gordon, R.L.; Talei, M. Head-on quenching of laminar premixed methane flames diluted with hot combustion products. Proc. Combust. Inst. 2019, 37, 5095–5103. [Google Scholar] [CrossRef]
  19. Wei, Z.; Zhen, H.; Leung, C.; Cheung, C.; Huang, Z. Effects of H2 addition on the formation and emissions of CO/NO2/NOx in the laminar premixed biogas-hydrogen flame undergoing the flame-wall interaction. Fuel 2020, 259, 116257. [Google Scholar] [CrossRef]
  20. Wei, Z.; Zhen, H.; Leung, C.; Cheung, C.; Huang, Z. Effects of unburned gases velocity on the CO/NO2/NOx formations and overall emissions of laminar premixed biogas-hydrogen impinging flame. Energy 2020, 196, 117146. [Google Scholar] [CrossRef]
  21. Wei, Z.; Zhen, H.; Leung, C.; Cheung, C.; Huang, Z. Formations and emissions of CO/NO2/NOx in the laminar premixed biogas-hydrogen flame undergoing the flame-wall interaction: Effects of the variable CO2 proportion. Fuel 2020, 276, 118096. [Google Scholar] [CrossRef]
  22. Wei, Z.L.; Zhen, H.S.; Leung, C.W.; Cheung, C.S.; Huang, Z.H. Experimental and numerical study on the emission characteristics of laminar premixed biogas-hydrogen impinging flame. Fuel 2017, 195, 1–11. [Google Scholar] [CrossRef]
  23. Wehrfritz, A.; Wang, H.; Hawkes, E.R.; Gao, Y.; Lu, T. Wall-impinging laminar premixed n-dodecane flames under autoignitive conditions. Proc. Combust. Inst. 2019, 37, 1647–1654. [Google Scholar] [CrossRef]
  24. Divya, D.; Gopinath, L.R.; Merlin Christy, P. A review on current aspects and diverse prospects for enhancing biogas production in sustainable means. Renew. Sustain. Energy Rev. 2015, 42, 690–699. [Google Scholar] [CrossRef]
  25. Lim, C.; Kim, D.; Song, C.; Kim, J.; Han, J.; Cha, J.-S. Performance and emission characteristics of a vehicle fueled with enriched biogas and natural gases. Appl. Energy 2015, 139, 17–29. [Google Scholar] [CrossRef]
  26. Hakawati, R.; Smyth, B.M.; McCullough, G.; De Rosa, F.; Rooney, D. What is the most energy efficient route for biogas utilization: Heat, electricity or transport? Appl. Energy 2017, 206, 1076–1087. [Google Scholar] [CrossRef] [Green Version]
  27. Habib, R.; Yadollahi, B.; Saeed, A.; Doranehgard, M.H.; Li, L.K.B.; Karimi, N. Unsteady ultra-lean combustion of methane and biogas in a porous burner—An experimental study. Appl. Therm. Eng. 2021, 182, 116099. [Google Scholar] [CrossRef]
  28. Bauer, C.; Forest, T. Effect of hydrogen addition on the performance of methane-fueled vehicles. Part I: Effect on SI engine performance. Int. J. Hydrogen Energy 2001, 26, 55–70. [Google Scholar] [CrossRef]
  29. Du, Y.; Yu, X.; Wang, J.; Wu, H.; Dong, W.; Gu, J. Research on combustion and emission characteristics of a lean burn gasoline engine with hydrogen direct-injection. Int. J. Hydrogen Energy 2016, 41, 3240–3248. [Google Scholar] [CrossRef]
  30. Wu, L.; Kobayashi, N.; Li, Z.; Huang, H. Experimental study on the effects of hydrogen addition on the emission and heat transfer characteristics of laminar methane diffusion flames with oxygen-enriched air. Int. J. Hydrogen Energy 2016, 41, 2023–2036. [Google Scholar] [CrossRef]
  31. Wang, J.; Li, Y.; Xia, H.; Ju, R.; Zhang, M.; Mu, H.; Huang, Z. Effect of hydrogen enrichment and electric field on lean CH4/air flame propagation at elevated pressure. Int. J. Hydrogen Energy 2019, 44, 15962–15972. [Google Scholar] [CrossRef]
  32. Guo, S.; Wang, J.; Zhang, W.; Zhang, M.; Huang, Z. Effect of hydrogen enrichment on swirl/bluff-body lean premixed flame stabilization. Int. J. Hydrogen Energy 2020, 45, 10906–10919. [Google Scholar] [CrossRef]
  33. Peters, N.; Rogg, B. Reduced Kinetic Mechanisms for Applications in Combustion Systems; Springer: Berlin/Heidelberg, Germany, 1993. [Google Scholar]
  34. UCSD. San Diego Mechanism. Chemical-Kinetic Mechanisms for Combustion, ApplicationsSan Diego Mechanism Web Page, Mechanical and Aerospace Engineering (Combustion Research), University of California at San Diego. Available online: http://combustion.ucsd.edu (accessed on 1 September 2021).
  35. Guo, H.; Smallwood, G.; Liu, F.; Ju, Y.; Gulder, O. The effect of hydrogen addition on flammability limit and NOx emission in ultra-lean counterflow CH4/air premixed flames. Proc. Combust. Inst. 2005, 30, 303–311. [Google Scholar] [CrossRef] [Green Version]
  36. Palulli, R.; Talei, M.; Gordon, R.L. Unsteady flame–wall interaction: Impact on CO emission and wall heat flux. Combust. Flame 2019, 207, 406–416. [Google Scholar] [CrossRef]
Figure 1. The computational domain and boundary conditions of the numerical model.
Energies 14 07308 g001
Figure 2. The quenching location determination in the flame at φ = 0.8. (a) The z-direction gradient of the OH mass fraction and the locations of maximum values at different x (white line) values. (b) The determination of xOH.
Energies 14 07308 g002
Figure 3. Temperature profiles in the near-wall region of the biogas–hydrogen impinging flame at φ = 0.8 (left) and 1.2 (right).
Energies 14 07308 g003
Figure 4. Distributions of critical radicals in the near-wall region of biogas–hydrogen impinging flame at at φ = 0.8 (left) and 1.2 (right): (a) OH radical, (b) H radical, and (c) O radical.
Energies 14 07308 g004aEnergies 14 07308 g004b
Figure 5. CO distributions in the near-wall region of the biogas–hydrogen impinging flames at φ = 0.8 and 1.2.
Energies 14 07308 g005
Figure 6. Distributions of HCO radicals in the wall vicinity of biogas–hydrogen impinging flames at φ = 0.8 and 1.2.
Energies 14 07308 g006
Figure 7. NO distributions in the near-wall region of the biogas–hydrogen impinging flames at φ = 0.8 and 1.2.
Energies 14 07308 g007
Figure 8. NO mass fractions of different routes of the biogas–hydrogen impinging flames at φ = 0.8 and 1.2. (a) NO amount produced via the prompt route. (b) NO amount produced via the NNH intermediate route. (c) NO amount produced via the thermal route. (d) NO amount produced via the N2O intermediate route.
Energies 14 07308 g008aEnergies 14 07308 g008b
Figure 9. Distributions of the HCN and NNH radicals produced by the prompt and NNH routes in the near-wall region of the biogas–hydrogen impinging flames at φ = 0.8 and 1.2: (a) HCN radical distributions and (b) NNH radical distributions.
Energies 14 07308 g009
Figure 10. Contributions of different routes on the NO production in the near-wall region of the biogas–hydrogen impinging flames at φ = 0.8 and 1.2. (a) Contribution of the prompt route. (b) Contribution of the NNH intermediate route. (c) Contribution of the thermal route. (d) Contribution of the N2O intermediate route.
Energies 14 07308 g010aEnergies 14 07308 g010b
Publisher’s Note: MDPI stays neutral with regard to jurisdictional claims in published maps and institutional affiliations.

